Scotland County, MO Map & Demographics
Scotland County Map
Scotland County Overview
$27,808
PER CAPITA INCOME
$67,835
AVG FAMILY INCOME
$58,656
AVG HOUSEHOLD INCOME
38.9%
WAGE / INCOME GAP [ % ]
61.1¢/ $1
WAGE / INCOME GAP [ $ ]
$5,899
FAMILY INCOME DEFICIT
0.46
INEQUALITY / GINI INDEX
4,720
TOTAL POPULATION
2,304
MALE POPULATION
2,416
FEMALE POPULATION
95.36
MALES / 100 FEMALES
104.86
FEMALES / 100 MALES
36.0
MEDIAN AGE
3.9
AVG FAMILY SIZE
3.0
AVG HOUSEHOLD SIZE
1,957
LABOR FORCE [ PEOPLE ]
56.9%
PERCENT IN LABOR FORCE
1.2%
UNEMPLOYMENT RATE
Scotland County Area Codes
Income in Scotland County
Income Overview in Scotland County
Per Capita Income in Scotland County is $27,808, while median incomes of families and households are $67,835 and $58,656 respectively.
| Characteristic | Number | Measure |
| Per Capita Income | 4,720 | $27,808 |
| Median Family Income | 1,005 | $67,835 |
| Mean Family Income | 1,005 | $94,045 |
| Median Household Income | 1,527 | $58,656 |
| Mean Household Income | 1,527 | $77,522 |
| Income Deficit | 1,005 | $5,899 |
| Wage / Income Gap (%) | 4,720 | 38.91% |
| Wage / Income Gap ($) | 4,720 | 61.09¢ per $1 |
| Gini / Inequality Index | 4,720 | 0.46 |
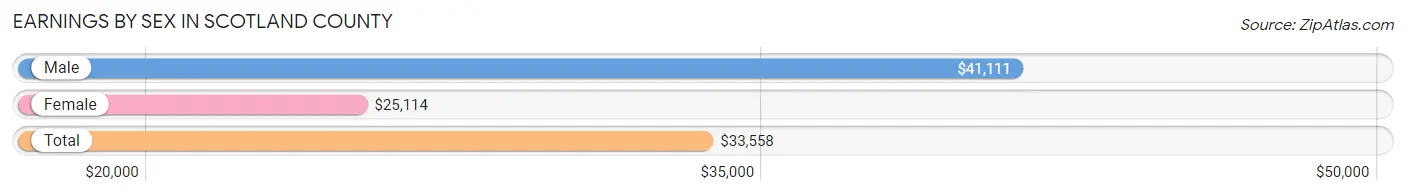
Earnings by Sex in Scotland County
Average Earnings in Scotland County are $33,558, $41,111 for men and $25,114 for women, a difference of 38.9%.
| Sex | Number | Average Earnings |
| Male | 1,210 (56.3%) | $41,111 |
| Female | 940 (43.7%) | $25,114 |
| Total | 2,150 (100.0%) | $33,558 |
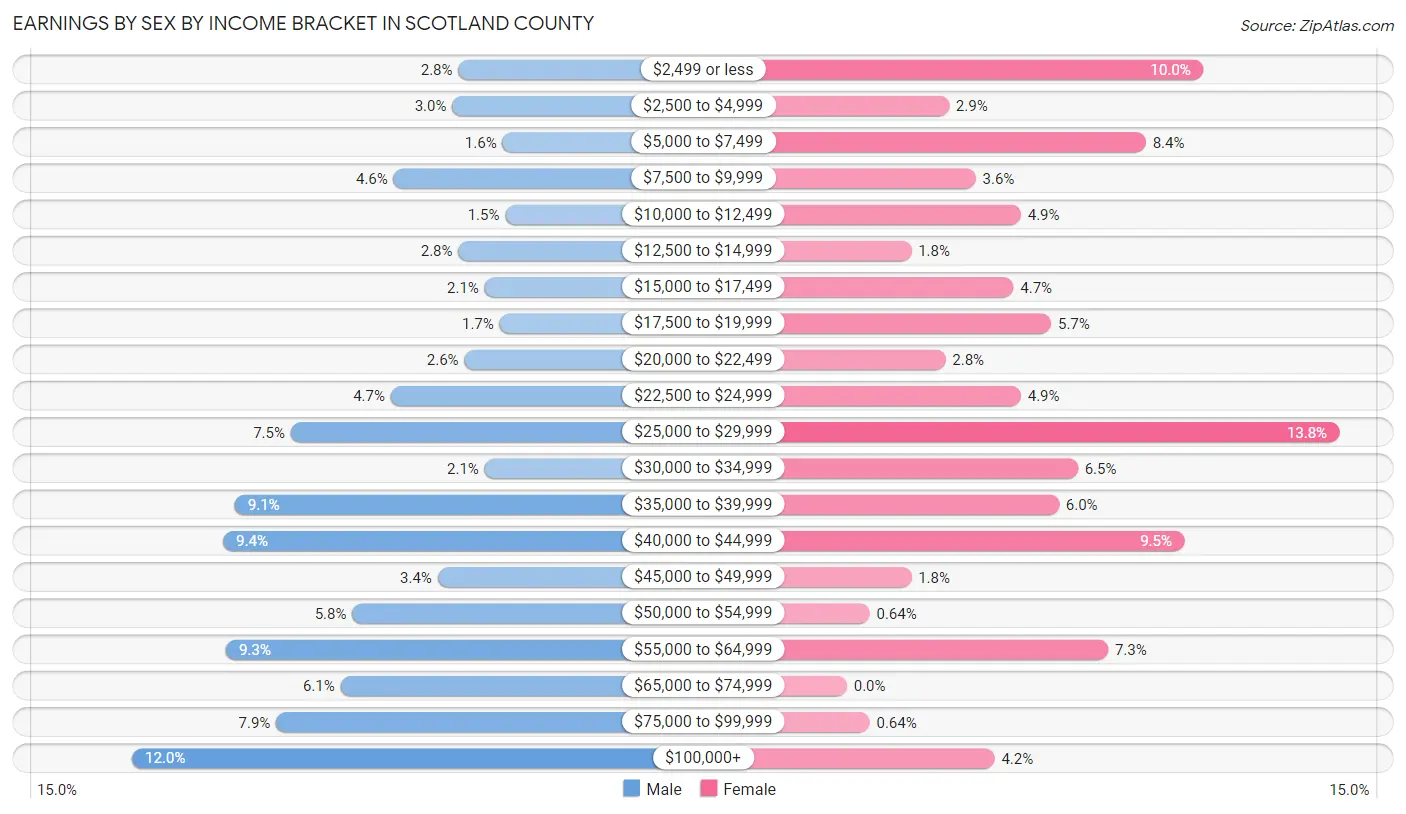
Earnings by Sex by Income Bracket in Scotland County
The most common earnings brackets in Scotland County are $100,000+ for men (145 | 12.0%) and $25,000 to $29,999 for women (130 | 13.8%).
| Income | Male | Female |
| $2,499 or less | 34 (2.8%) | 94 (10.0%) |
| $2,500 to $4,999 | 36 (3.0%) | 27 (2.9%) |
| $5,000 to $7,499 | 19 (1.6%) | 79 (8.4%) |
| $7,500 to $9,999 | 56 (4.6%) | 34 (3.6%) |
| $10,000 to $12,499 | 18 (1.5%) | 46 (4.9%) |
| $12,500 to $14,999 | 34 (2.8%) | 17 (1.8%) |
| $15,000 to $17,499 | 25 (2.1%) | 44 (4.7%) |
| $17,500 to $19,999 | 20 (1.7%) | 54 (5.7%) |
| $20,000 to $22,499 | 32 (2.6%) | 26 (2.8%) |
| $22,500 to $24,999 | 57 (4.7%) | 46 (4.9%) |
| $25,000 to $29,999 | 91 (7.5%) | 130 (13.8%) |
| $30,000 to $34,999 | 25 (2.1%) | 61 (6.5%) |
| $35,000 to $39,999 | 110 (9.1%) | 56 (6.0%) |
| $40,000 to $44,999 | 114 (9.4%) | 89 (9.5%) |
| $45,000 to $49,999 | 41 (3.4%) | 17 (1.8%) |
| $50,000 to $54,999 | 70 (5.8%) | 6 (0.6%) |
| $55,000 to $64,999 | 113 (9.3%) | 69 (7.3%) |
| $65,000 to $74,999 | 74 (6.1%) | 0 (0.0%) |
| $75,000 to $99,999 | 96 (7.9%) | 6 (0.6%) |
| $100,000+ | 145 (12.0%) | 39 (4.2%) |
| Total | 1,210 (100.0%) | 940 (100.0%) |
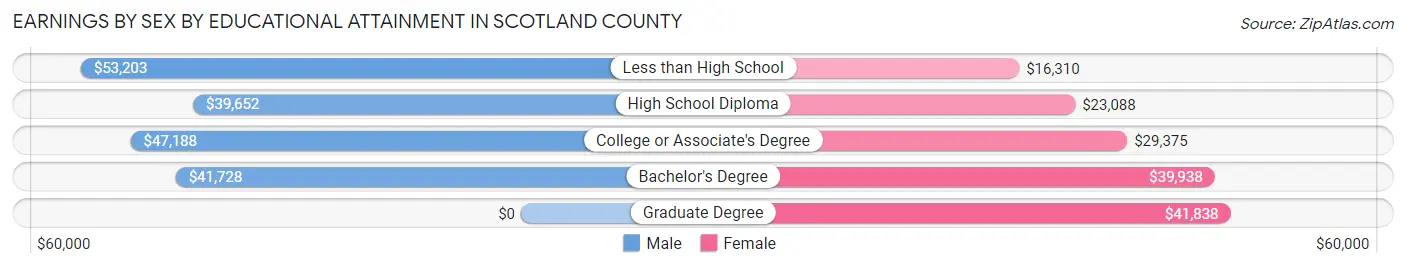
Earnings by Sex by Educational Attainment in Scotland County
Average earnings in Scotland County are $42,437 for men and $28,145 for women, a difference of 33.7%. Men with an educational attainment of less than high school enjoy the highest average annual earnings of $53,203, while those with high school diploma education earn the least with $39,652. Women with an educational attainment of graduate degree earn the most with the average annual earnings of $41,838, while those with less than high school education have the smallest earnings of $16,310.
| Educational Attainment | Male Income | Female Income |
| Less than High School | $53,203 | $16,310 |
| High School Diploma | $39,652 | $23,088 |
| College or Associate's Degree | $47,188 | $29,375 |
| Bachelor's Degree | $41,728 | $39,938 |
| Graduate Degree | - | - |
| Total | $42,437 | $28,145 |
Family Income in Scotland County
Family Income Brackets in Scotland County
According to the Scotland County family income data, there are 261 families falling into the $50,000 to $74,999 income range, which is the most common income bracket and makes up 26.0% of all families. Conversely, the less than $10,000 income bracket is the least frequent group with only 7 families (0.7%) belonging to this category.
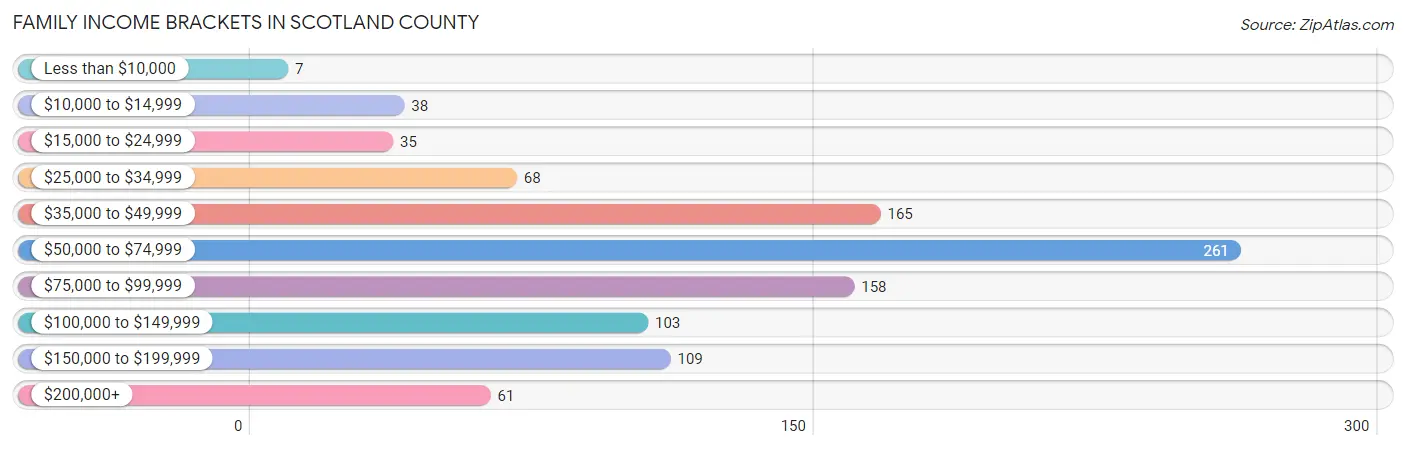
| Income Bracket | # Families | % Families |
| Less than $10,000 | 7 | 0.7% |
| $10,000 to $14,999 | 38 | 3.8% |
| $15,000 to $24,999 | 35 | 3.5% |
| $25,000 to $34,999 | 68 | 6.8% |
| $35,000 to $49,999 | 165 | 16.4% |
| $50,000 to $74,999 | 261 | 26.0% |
| $75,000 to $99,999 | 158 | 15.7% |
| $100,000 to $149,999 | 103 | 10.2% |
| $150,000 to $199,999 | 109 | 10.8% |
| $200,000+ | 61 | 6.1% |
Family Income by Famaliy Size in Scotland County
4-person families (122 | 12.1%) account for the highest median family income in Scotland County with $108,636 per family, while 2-person families (526 | 52.3%) have the highest median income of $31,304 per family member.
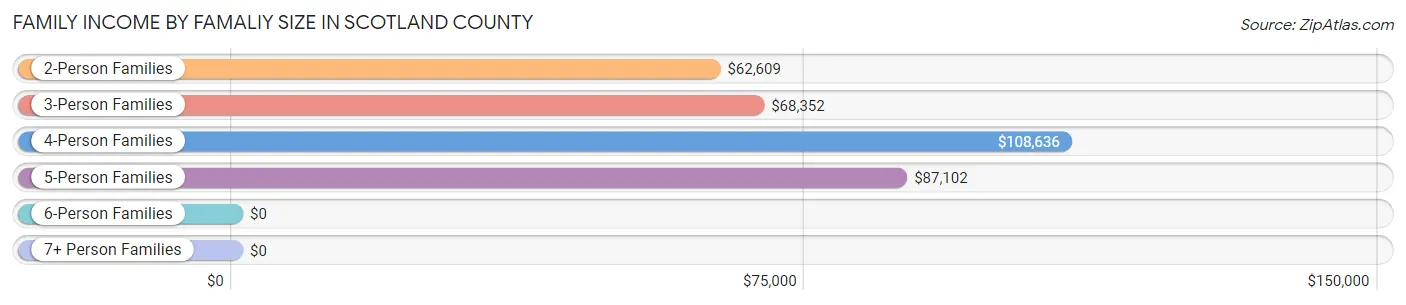
| Income Bracket | # Families | Median Income |
| 2-Person Families | 526 (52.3%) | $62,609 |
| 3-Person Families | 183 (18.2%) | $68,352 |
| 4-Person Families | 122 (12.1%) | $108,636 |
| 5-Person Families | 93 (9.2%) | $87,102 |
| 6-Person Families | 18 (1.8%) | $0 |
| 7+ Person Families | 63 (6.3%) | $0 |
| Total | 1,005 (100.0%) | $67,835 |
Family Income by Number of Earners in Scotland County
The median family income in Scotland County is $67,835, with families comprising 3+ earners (123) having the highest median family income of $157,708, while families with no earners (142) have the lowest median family income of $57,727, accounting for 12.2% and 14.1% of families, respectively.
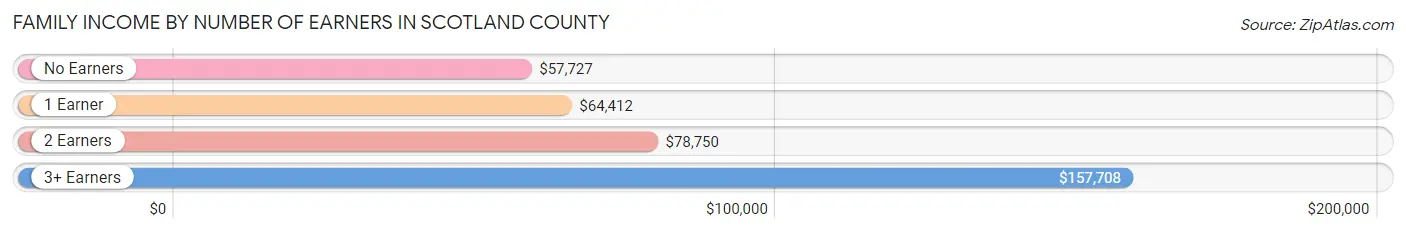
| Number of Earners | # Families | Median Income |
| No Earners | 142 (14.1%) | $57,727 |
| 1 Earner | 408 (40.6%) | $64,412 |
| 2 Earners | 332 (33.0%) | $78,750 |
| 3+ Earners | 123 (12.2%) | $157,708 |
| Total | 1,005 (100.0%) | $67,835 |
Household Income in Scotland County
Household Income Brackets in Scotland County
With 331 households falling in the category, the $50,000 to $74,999 income range is the most frequent in Scotland County, accounting for 21.7% of all households. In contrast, only 50 households (3.3%) fall into the less than $10,000 income bracket, making it the least populous group.
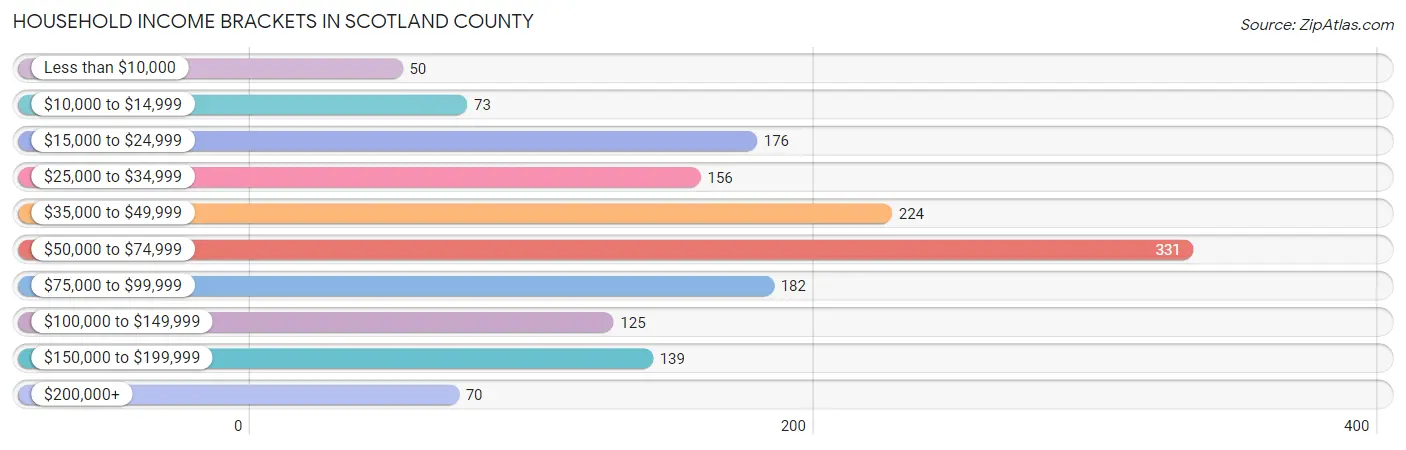
| Income Bracket | # Households | % Households |
| Less than $10,000 | 50 | 3.3% |
| $10,000 to $14,999 | 73 | 4.8% |
| $15,000 to $24,999 | 176 | 11.5% |
| $25,000 to $34,999 | 156 | 10.2% |
| $35,000 to $49,999 | 224 | 14.7% |
| $50,000 to $74,999 | 331 | 21.7% |
| $75,000 to $99,999 | 182 | 11.9% |
| $100,000 to $149,999 | 125 | 8.2% |
| $150,000 to $199,999 | 139 | 9.1% |
| $200,000+ | 70 | 4.6% |
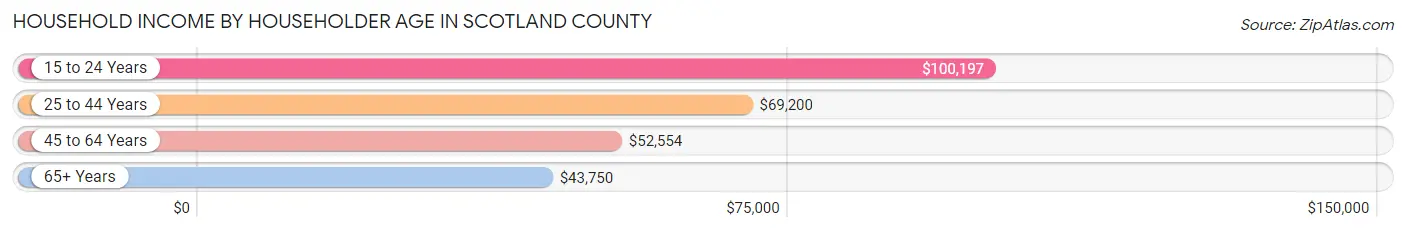
Household Income by Householder Age in Scotland County
The median household income in Scotland County is $58,656, with the highest median household income of $100,197 found in the 15 to 24 years age bracket for the primary householder. A total of 35 households (2.3%) fall into this category. Meanwhile, the 65+ years age bracket for the primary householder has the lowest median household income of $43,750, with 465 households (30.4%) in this group.
| Income Bracket | # Households | Median Income |
| 15 to 24 Years | 35 (2.3%) | $100,197 |
| 25 to 44 Years | 460 (30.1%) | $69,200 |
| 45 to 64 Years | 567 (37.1%) | $52,554 |
| 65+ Years | 465 (30.4%) | $43,750 |
| Total | 1,527 (100.0%) | $58,656 |
Poverty in Scotland County
Income Below Poverty by Sex and Age in Scotland County
With 8.0% poverty level for males and 6.9% for females among the residents of Scotland County, 15 year old males and 18 to 24 year old females are the most vulnerable to poverty, with 22 males (31.9%) and 39 females (19.6%) in their respective age groups living below the poverty level.
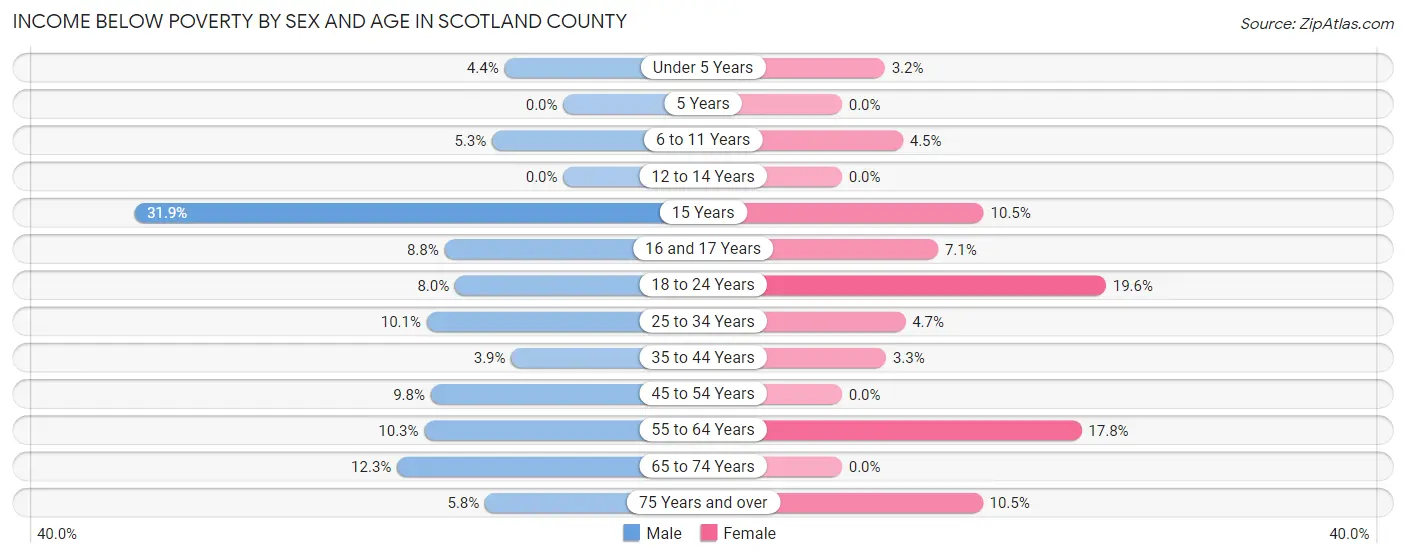
| Age Bracket | Male | Female |
| Under 5 Years | 8 (4.4%) | 6 (3.2%) |
| 5 Years | 0 (0.0%) | 0 (0.0%) |
| 6 to 11 Years | 12 (5.3%) | 11 (4.5%) |
| 12 to 14 Years | 0 (0.0%) | 0 (0.0%) |
| 15 Years | 22 (31.9%) | 2 (10.5%) |
| 16 and 17 Years | 3 (8.8%) | 6 (7.1%) |
| 18 to 24 Years | 16 (8.0%) | 39 (19.6%) |
| 25 to 34 Years | 28 (10.1%) | 12 (4.7%) |
| 35 to 44 Years | 14 (3.9%) | 9 (3.3%) |
| 45 to 54 Years | 12 (9.8%) | 0 (0.0%) |
| 55 to 64 Years | 29 (10.3%) | 53 (17.8%) |
| 65 to 74 Years | 29 (12.3%) | 0 (0.0%) |
| 75 Years and over | 9 (5.8%) | 23 (10.4%) |
| Total | 182 (8.0%) | 161 (6.9%) |
Income Above Poverty by Sex and Age in Scotland County
According to the poverty statistics in Scotland County, males aged 5 years and females aged 5 years are the age groups that are most secure financially, with 100.0% of males and 100.0% of females in these age groups living above the poverty line.
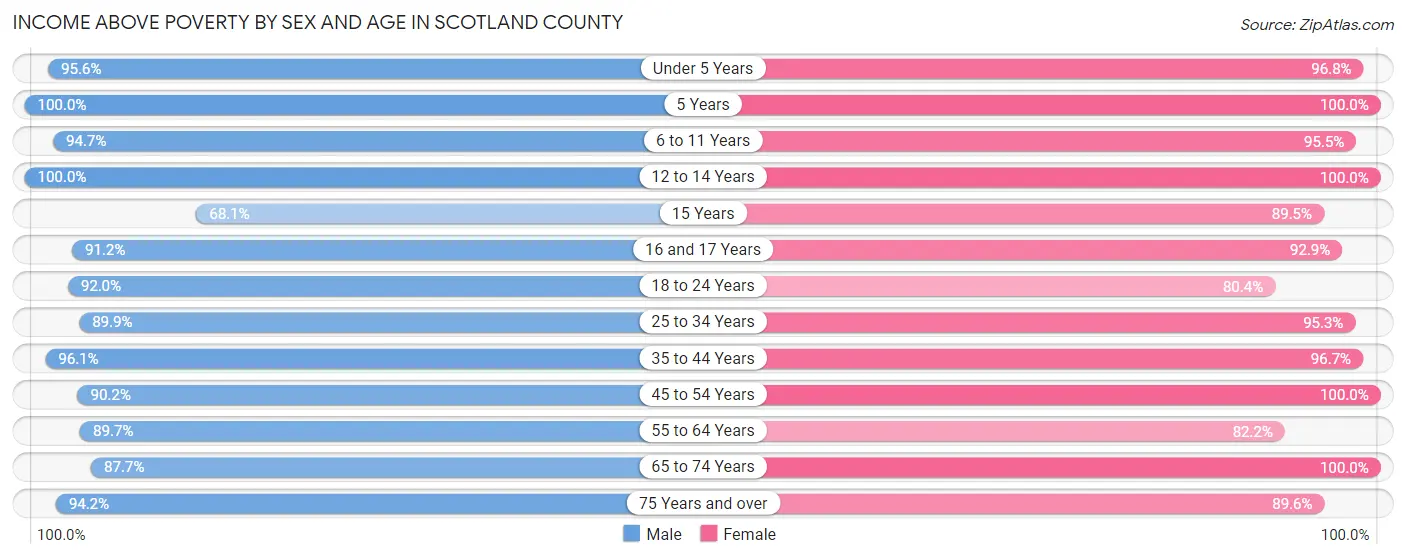
| Age Bracket | Male | Female |
| Under 5 Years | 175 (95.6%) | 182 (96.8%) |
| 5 Years | 13 (100.0%) | 87 (100.0%) |
| 6 to 11 Years | 215 (94.7%) | 232 (95.5%) |
| 12 to 14 Years | 111 (100.0%) | 80 (100.0%) |
| 15 Years | 47 (68.1%) | 17 (89.5%) |
| 16 and 17 Years | 31 (91.2%) | 78 (92.9%) |
| 18 to 24 Years | 183 (92.0%) | 160 (80.4%) |
| 25 to 34 Years | 248 (89.9%) | 243 (95.3%) |
| 35 to 44 Years | 349 (96.1%) | 265 (96.7%) |
| 45 to 54 Years | 110 (90.2%) | 176 (100.0%) |
| 55 to 64 Years | 252 (89.7%) | 245 (82.2%) |
| 65 to 74 Years | 206 (87.7%) | 218 (100.0%) |
| 75 Years and over | 146 (94.2%) | 197 (89.5%) |
| Total | 2,086 (92.0%) | 2,180 (93.1%) |
Income Below Poverty Among Married-Couple Families in Scotland County
The poverty statistics for married-couple families in Scotland County show that 3.6% or 30 of the total 833 families live below the poverty line. Families with 3 or 4 children have the highest poverty rate of 6.4%, comprising of 4 families. On the other hand, families with 5 or more children have the lowest poverty rate of 0.0%, which includes 0 families.
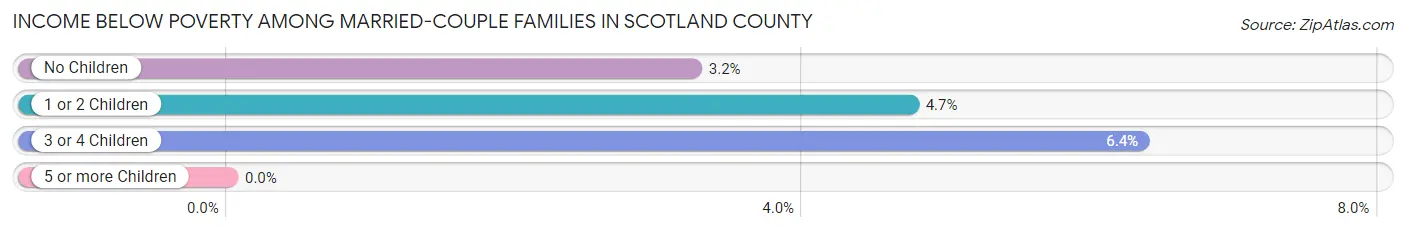
| Children | Above Poverty | Below Poverty |
| No Children | 480 (96.8%) | 16 (3.2%) |
| 1 or 2 Children | 201 (95.3%) | 10 (4.7%) |
| 3 or 4 Children | 59 (93.6%) | 4 (6.4%) |
| 5 or more Children | 63 (100.0%) | 0 (0.0%) |
| Total | 803 (96.4%) | 30 (3.6%) |
Income Below Poverty Among Single-Parent Households in Scotland County
According to the poverty data in Scotland County, 56.5% or 35 single-father households and 11.8% or 13 single-mother households are living below the poverty line. Among single-father households, those with no children have the highest poverty rate, with 22 households (100.0%) experiencing poverty. Likewise, among single-mother households, those with 1 or 2 children have the highest poverty rate, with 10 households (19.2%) falling below the poverty line.
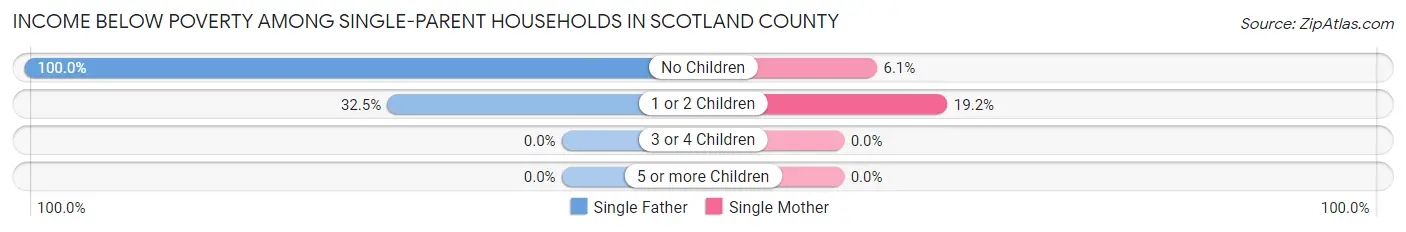
| Children | Single Father | Single Mother |
| No Children | 22 (100.0%) | 3 (6.1%) |
| 1 or 2 Children | 13 (32.5%) | 10 (19.2%) |
| 3 or 4 Children | 0 (0.0%) | 0 (0.0%) |
| 5 or more Children | 0 (0.0%) | 0 (0.0%) |
| Total | 35 (56.5%) | 13 (11.8%) |
Income Below Poverty Among Married-Couple vs Single-Parent Households in Scotland County
The poverty data for Scotland County shows that 30 of the married-couple family households (3.6%) and 48 of the single-parent households (27.9%) are living below the poverty level. Within the married-couple family households, those with 3 or 4 children have the highest poverty rate, with 4 households (6.4%) falling below the poverty line. Among the single-parent households, those with no children have the highest poverty rate, with 25 household (35.2%) living below poverty.
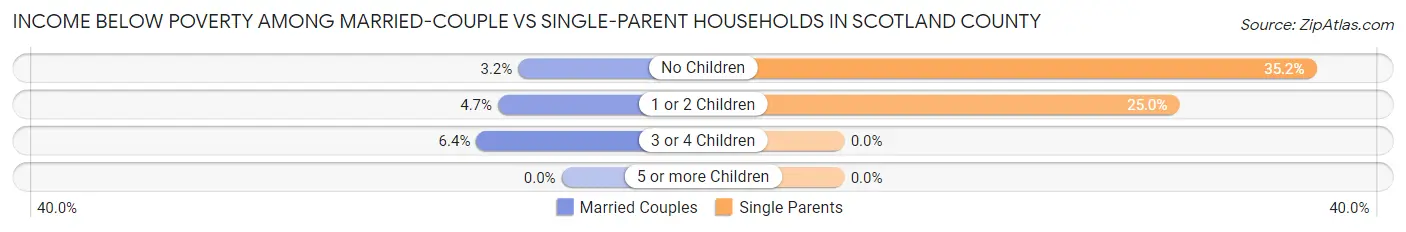
| Children | Married-Couple Families | Single-Parent Households |
| No Children | 16 (3.2%) | 25 (35.2%) |
| 1 or 2 Children | 10 (4.7%) | 23 (25.0%) |
| 3 or 4 Children | 4 (6.4%) | 0 (0.0%) |
| 5 or more Children | 0 (0.0%) | 0 (0.0%) |
| Total | 30 (3.6%) | 48 (27.9%) |
Race in Scotland County
The most populous races in Scotland County are White / Caucasian (4,574 | 96.9%), Two or more Races (117 | 2.5%), and Hawaiian / Pacific (18 | 0.4%).
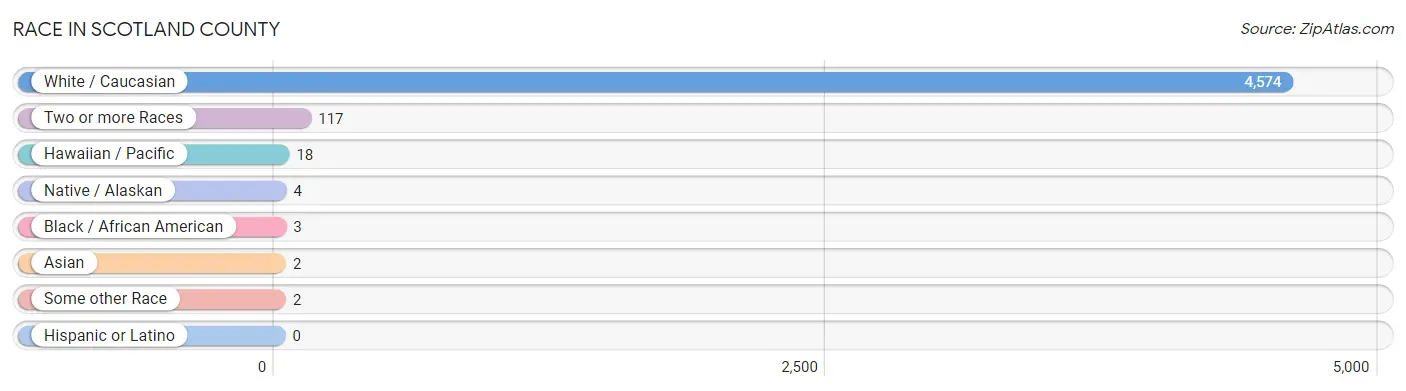
| Race | # Population | % Population |
| Asian | 2 | 0.0% |
| Black / African American | 3 | 0.1% |
| Hawaiian / Pacific | 18 | 0.4% |
| Hispanic or Latino | 0 | 0.0% |
| Native / Alaskan | 4 | 0.1% |
| White / Caucasian | 4,574 | 96.9% |
| Two or more Races | 117 | 2.5% |
| Some other Race | 2 | 0.0% |
| Total | 4,720 | 100.0% |
Ancestry in Scotland County
The most populous ancestries reported in Scotland County are German (1,027 | 21.8%), American (466 | 9.9%), English (448 | 9.5%), Irish (261 | 5.5%), and Swiss (199 | 4.2%), together accounting for 50.9% of all Scotland County residents.
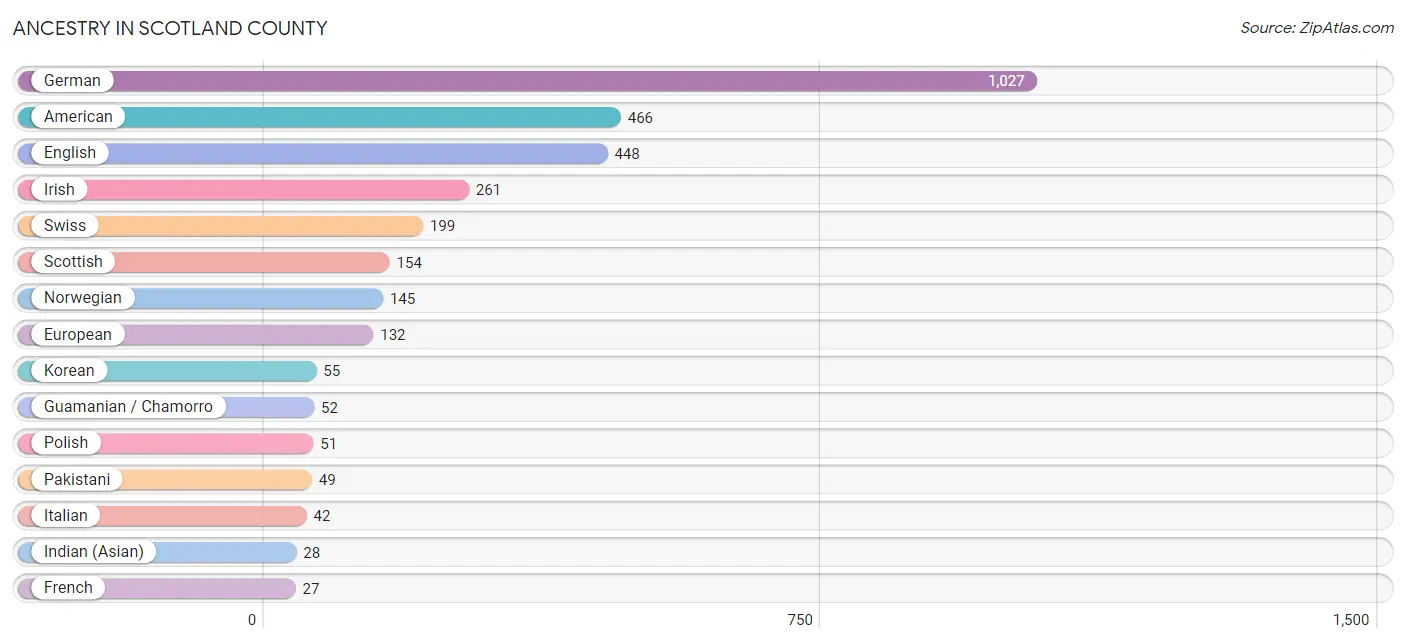
| Ancestry | # Population | % Population |
| American | 466 | 9.9% |
| British | 16 | 0.3% |
| Cherokee | 12 | 0.3% |
| Creek | 2 | 0.0% |
| Danish | 3 | 0.1% |
| Dutch | 16 | 0.3% |
| Eastern European | 14 | 0.3% |
| English | 448 | 9.5% |
| European | 132 | 2.8% |
| French | 27 | 0.6% |
| German | 1,027 | 21.8% |
| Guamanian / Chamorro | 52 | 1.1% |
| Hungarian | 3 | 0.1% |
| Indian (Asian) | 28 | 0.6% |
| Irish | 261 | 5.5% |
| Italian | 42 | 0.9% |
| Korean | 55 | 1.2% |
| Norwegian | 145 | 3.1% |
| Pakistani | 49 | 1.0% |
| Polish | 51 | 1.1% |
| Portuguese | 3 | 0.1% |
| Russian | 8 | 0.2% |
| Scandinavian | 10 | 0.2% |
| Scotch-Irish | 17 | 0.4% |
| Scottish | 154 | 3.3% |
| Swiss | 199 | 4.2% |
| Welsh | 24 | 0.5% | View All 27 Rows |
Immigrants in Scotland County
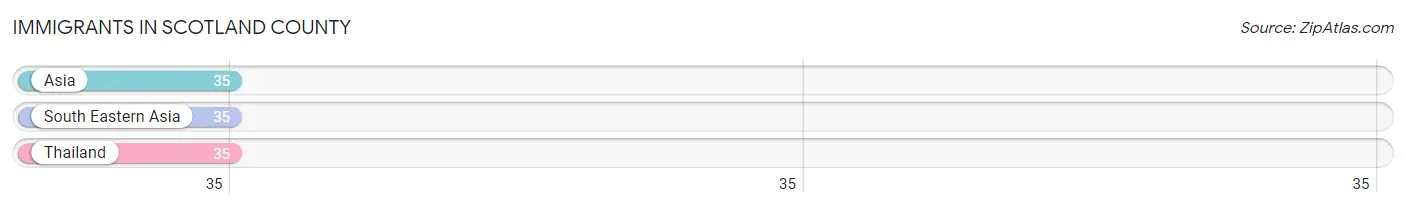
The most numerous immigrant groups reported in Scotland County came from Asia (35 | 0.7%), South Eastern Asia (35 | 0.7%), and Thailand (35 | 0.7%), together accounting for 2.2% of all Scotland County residents.
| Immigration Origin | # Population | % Population |
| Asia | 35 | 0.7% |
| South Eastern Asia | 35 | 0.7% |
| Thailand | 35 | 0.7% | View All 3 Rows |
Sex and Age in Scotland County
Sex and Age in Scotland County
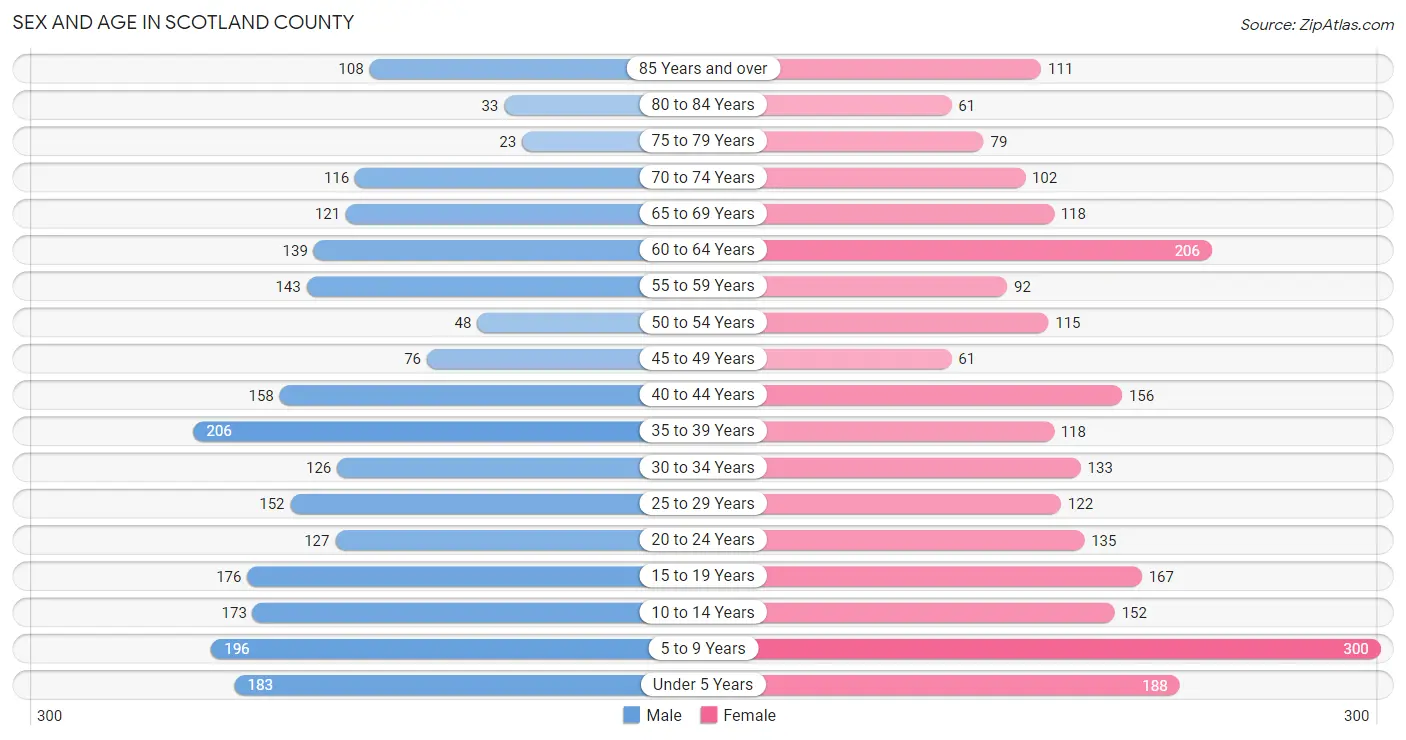
The most populous age groups in Scotland County are 35 to 39 Years (206 | 8.9%) for men and 5 to 9 Years (300 | 12.4%) for women.
| Age Bracket | Male | Female |
| Under 5 Years | 183 (7.9%) | 188 (7.8%) |
| 5 to 9 Years | 196 (8.5%) | 300 (12.4%) |
| 10 to 14 Years | 173 (7.5%) | 152 (6.3%) |
| 15 to 19 Years | 176 (7.6%) | 167 (6.9%) |
| 20 to 24 Years | 127 (5.5%) | 135 (5.6%) |
| 25 to 29 Years | 152 (6.6%) | 122 (5.1%) |
| 30 to 34 Years | 126 (5.5%) | 133 (5.5%) |
| 35 to 39 Years | 206 (8.9%) | 118 (4.9%) |
| 40 to 44 Years | 158 (6.9%) | 156 (6.5%) |
| 45 to 49 Years | 76 (3.3%) | 61 (2.5%) |
| 50 to 54 Years | 48 (2.1%) | 115 (4.8%) |
| 55 to 59 Years | 143 (6.2%) | 92 (3.8%) |
| 60 to 64 Years | 139 (6.0%) | 206 (8.5%) |
| 65 to 69 Years | 121 (5.2%) | 118 (4.9%) |
| 70 to 74 Years | 116 (5.0%) | 102 (4.2%) |
| 75 to 79 Years | 23 (1.0%) | 79 (3.3%) |
| 80 to 84 Years | 33 (1.4%) | 61 (2.5%) |
| 85 Years and over | 108 (4.7%) | 111 (4.6%) |
| Total | 2,304 (100.0%) | 2,416 (100.0%) |
Families and Households in Scotland County
Median Family Size in Scotland County
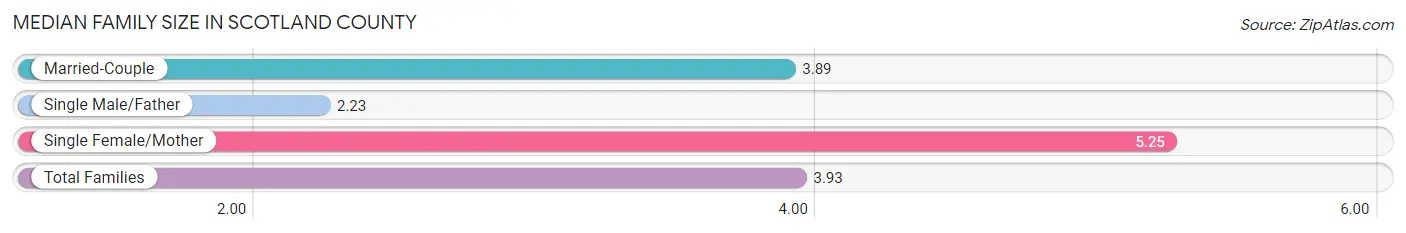
The median family size in Scotland County is 3.93 persons per family, with single female/mother families (110 | 11.0%) accounting for the largest median family size of 5.25 persons per family. On the other hand, single male/father families (62 | 6.2%) represent the smallest median family size with 2.23 persons per family.
| Family Type | # Families | Family Size |
| Married-Couple | 833 (82.9%) | 3.89 |
| Single Male/Father | 62 (6.2%) | 2.23 |
| Single Female/Mother | 110 (11.0%) | 5.25 |
| Total Families | 1,005 (100.0%) | 3.93 |
Median Household Size in Scotland County
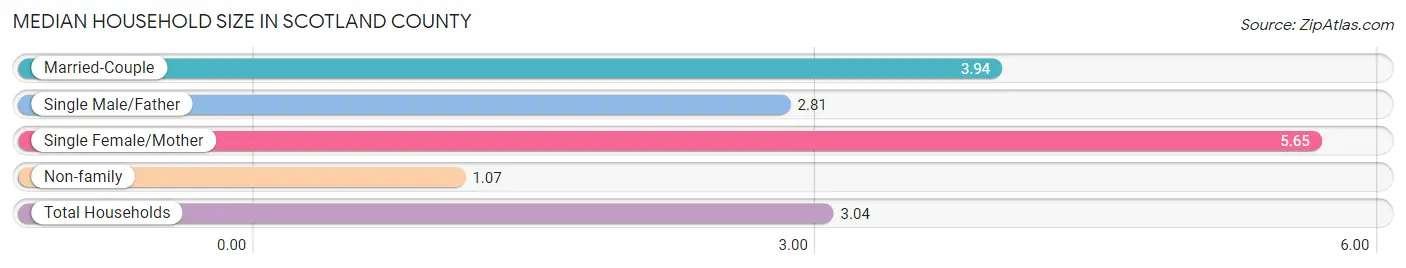
The median household size in Scotland County is 3.04 persons per household, with single female/mother households (110 | 7.2%) accounting for the largest median household size of 5.65 persons per household. non-family households (522 | 34.2%) represent the smallest median household size with 1.07 persons per household.
| Household Type | # Households | Household Size |
| Married-Couple | 833 (54.5%) | 3.94 |
| Single Male/Father | 62 (4.1%) | 2.81 |
| Single Female/Mother | 110 (7.2%) | 5.65 |
| Non-family | 522 (34.2%) | 1.07 |
| Total Households | 1,527 (100.0%) | 3.04 |
Household Size by Marriage Status in Scotland County
Out of a total of 1,527 households in Scotland County, 1,005 (65.8%) are family households, while 522 (34.2%) are nonfamily households. The most numerous type of family households are 2-person households, comprising 500, and the most common type of nonfamily households are 1-person households, comprising 487.
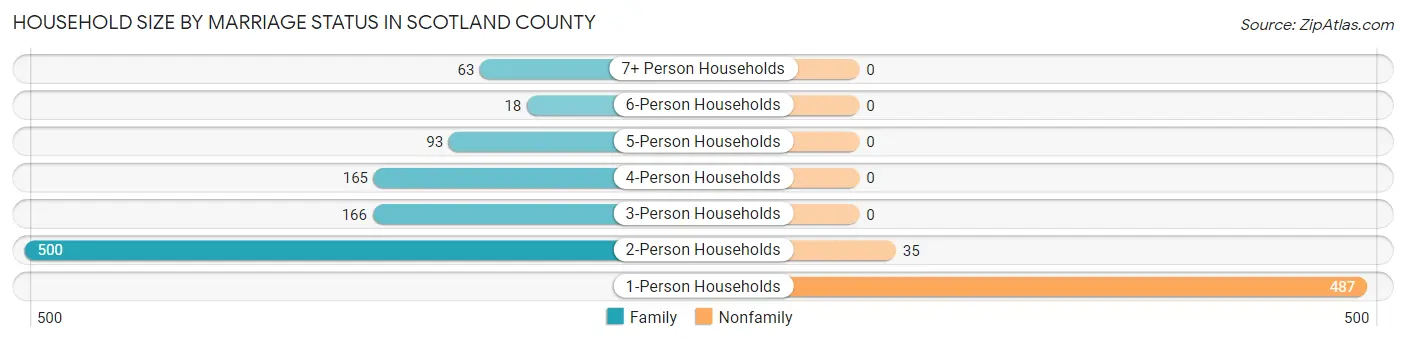
| Household Size | Family Households | Nonfamily Households |
| 1-Person Households | - | 487 (31.9%) |
| 2-Person Households | 500 (32.7%) | 35 (2.3%) |
| 3-Person Households | 166 (10.9%) | 0 (0.0%) |
| 4-Person Households | 165 (10.8%) | 0 (0.0%) |
| 5-Person Households | 93 (6.1%) | 0 (0.0%) |
| 6-Person Households | 18 (1.2%) | 0 (0.0%) |
| 7+ Person Households | 63 (4.1%) | 0 (0.0%) |
| Total | 1,005 (65.8%) | 522 (34.2%) |
Female Fertility in Scotland County
Fertility by Age in Scotland County
Average fertility rate in Scotland County is 62.0 births per 1,000 women. Women in the age bracket of 20 to 34 years have the highest fertility rate with 79.0 births per 1,000 women. Women in the age bracket of 20 to 34 years acount for 54.4% of all women with births.
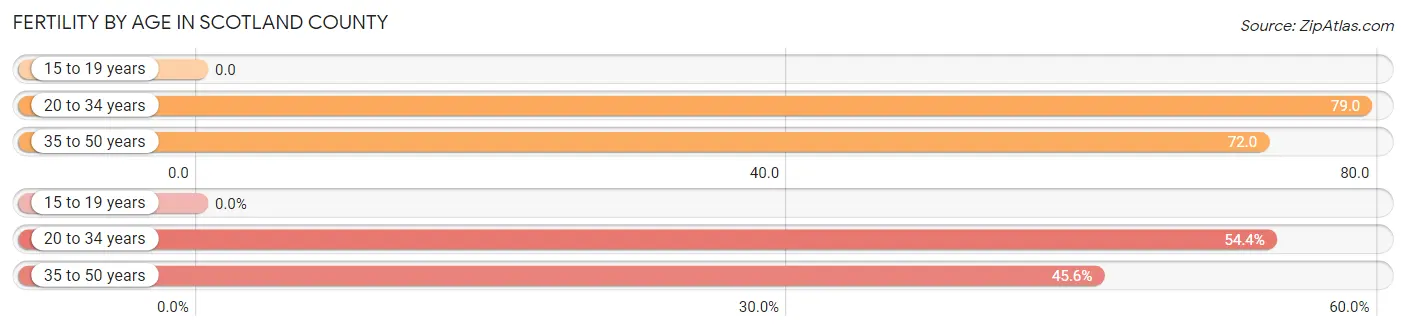
| Age Bracket | Women with Births | Births / 1,000 Women |
| 15 to 19 years | 0 (0.0%) | 0.0 |
| 20 to 34 years | 31 (54.4%) | 79.0 |
| 35 to 50 years | 26 (45.6%) | 72.0 |
| Total | 57 (100.0%) | 62.0 |
Fertility by Age by Marriage Status in Scotland County
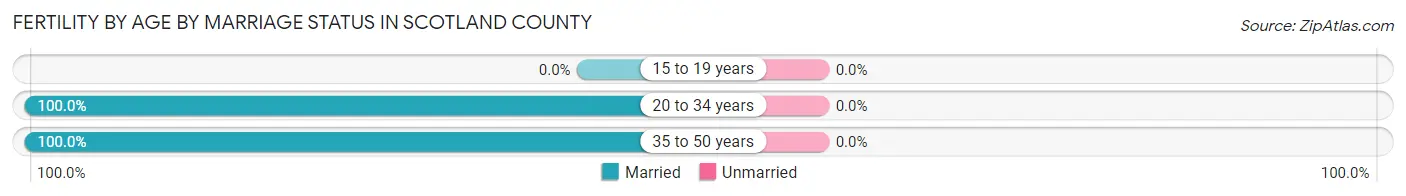
| Age Bracket | Married | Unmarried |
| 15 to 19 years | 0 (0.0%) | 0 (0.0%) |
| 20 to 34 years | 31 (100.0%) | 0 (0.0%) |
| 35 to 50 years | 26 (100.0%) | 0 (0.0%) |
| Total | 57 (100.0%) | 0 (0.0%) |
Fertility by Education in Scotland County
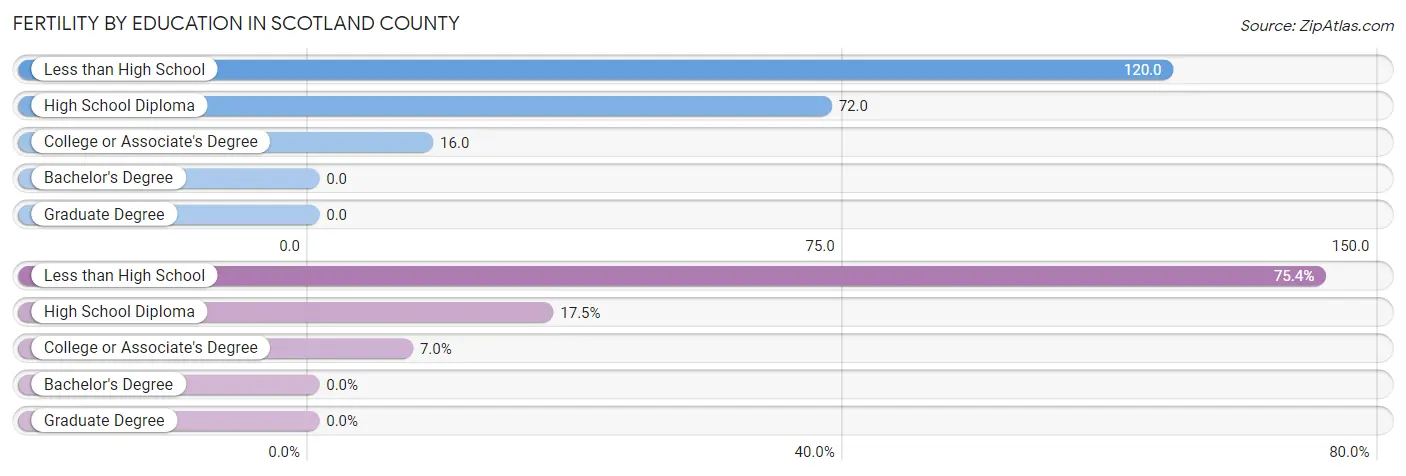
| Educational Attainment | Women with Births | Births / 1,000 Women |
| Less than High School | 43 (75.4%) | 120.0 |
| High School Diploma | 10 (17.5%) | 72.0 |
| College or Associate's Degree | 4 (7.0%) | 16.0 |
| Bachelor's Degree | 0 (0.0%) | 0.0 |
| Graduate Degree | 0 (0.0%) | 0.0 |
| Total | 57 (100.0%) | 62.0 |
Fertility by Education by Marriage Status in Scotland County
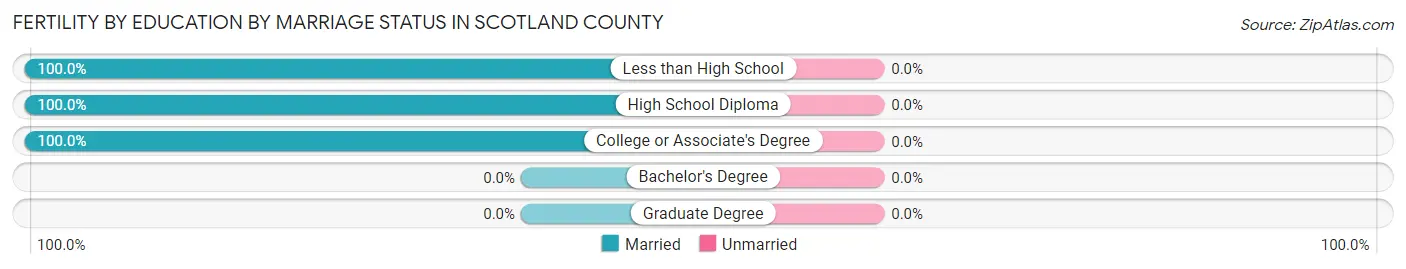
| Educational Attainment | Married | Unmarried |
| Less than High School | 43 (100.0%) | 0 (0.0%) |
| High School Diploma | 10 (100.0%) | 0 (0.0%) |
| College or Associate's Degree | 4 (100.0%) | 0 (0.0%) |
| Bachelor's Degree | 0 (0.0%) | 0 (0.0%) |
| Graduate Degree | 0 (0.0%) | 0 (0.0%) |
| Total | 57 (100.0%) | 0 (0.0%) |
Employment Characteristics in Scotland County
Employment by Class of Employer in Scotland County
Among the 1,923 employed individuals in Scotland County, private company employees (1,038 | 54.0%), self-employed (not incorporated) (301 | 15.7%), and not-for-profit organizations (179 | 9.3%) make up the most common classes of employment.
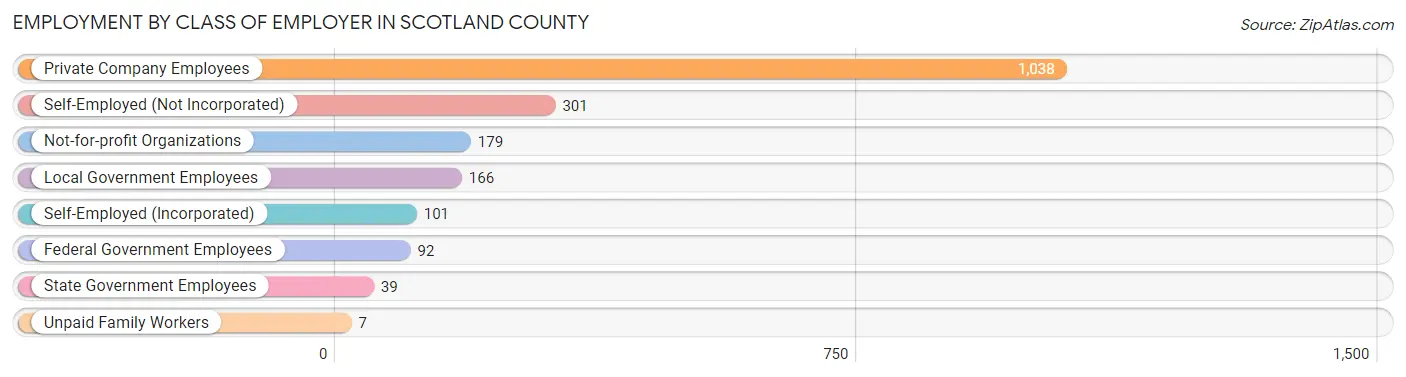
| Employer Class | # Employees | % Employees |
| Private Company Employees | 1,038 | 54.0% |
| Self-Employed (Incorporated) | 101 | 5.2% |
| Self-Employed (Not Incorporated) | 301 | 15.7% |
| Not-for-profit Organizations | 179 | 9.3% |
| Local Government Employees | 166 | 8.6% |
| State Government Employees | 39 | 2.0% |
| Federal Government Employees | 92 | 4.8% |
| Unpaid Family Workers | 7 | 0.4% |
| Total | 1,923 | 100.0% |
Employment Status by Age in Scotland County
According to the labor force statistics for Scotland County, out of the total population over 16 years of age (3,440), 56.9% or 1,957 individuals are in the labor force, with 1.2% or 23 of them unemployed. The age group with the highest labor force participation rate is 20 to 24 years, with 87.4% or 229 individuals in the labor force. Within the labor force, the 20 to 24 years age range has the highest percentage of unemployed individuals, with 10.0% or 23 of them being unemployed.
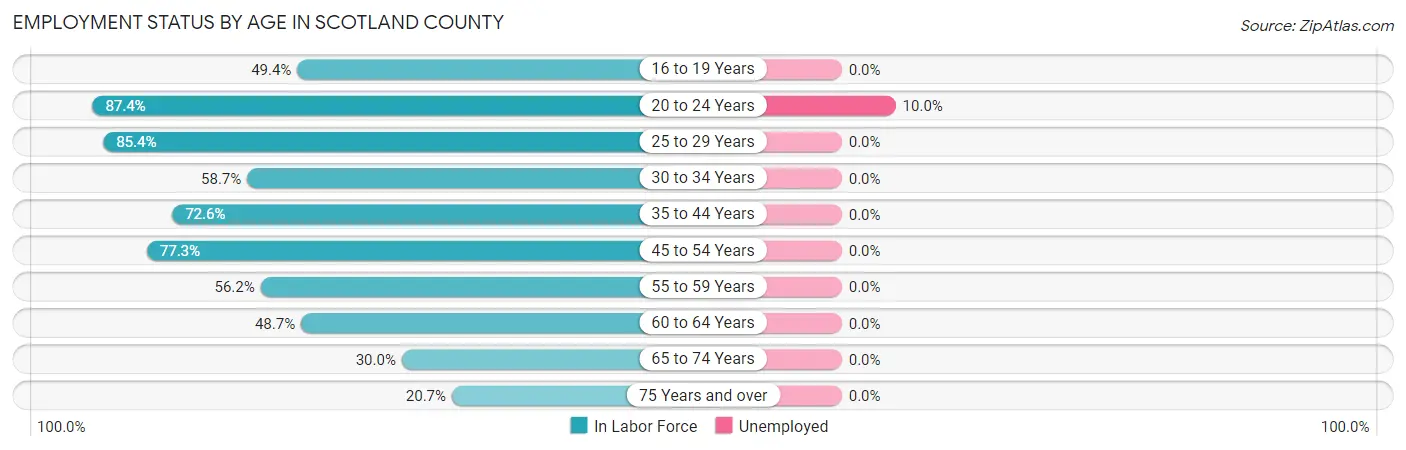
| Age Bracket | In Labor Force | Unemployed |
| 16 to 19 Years | 126 (49.4%) | 0 (0.0%) |
| 20 to 24 Years | 229 (87.4%) | 23 (10.0%) |
| 25 to 29 Years | 234 (85.4%) | 0 (0.0%) |
| 30 to 34 Years | 152 (58.7%) | 0 (0.0%) |
| 35 to 44 Years | 463 (72.6%) | 0 (0.0%) |
| 45 to 54 Years | 232 (77.3%) | 0 (0.0%) |
| 55 to 59 Years | 132 (56.2%) | 0 (0.0%) |
| 60 to 64 Years | 168 (48.7%) | 0 (0.0%) |
| 65 to 74 Years | 137 (30.0%) | 0 (0.0%) |
| 75 Years and over | 86 (20.7%) | 0 (0.0%) |
| Total | 1,957 (56.9%) | 23 (1.2%) |
Employment Status by Educational Attainment in Scotland County
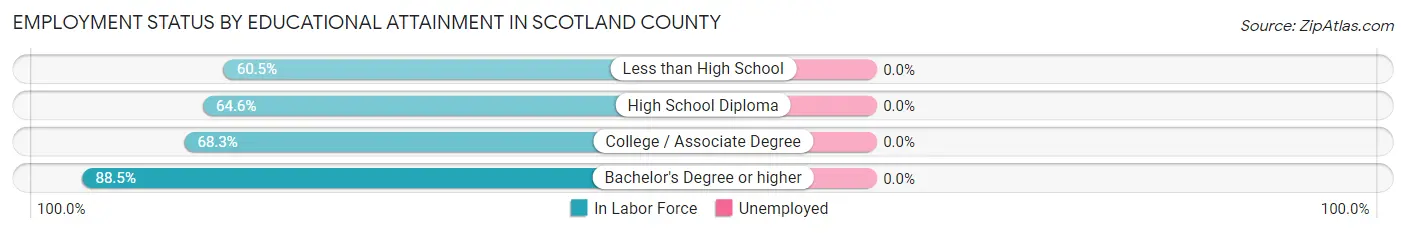
| Educational Attainment | In Labor Force | Unemployed |
| Less than High School | 270 (60.5%) | 0 (0.0%) |
| High School Diploma | 504 (64.6%) | 0 (0.0%) |
| College / Associate Degree | 415 (68.3%) | 0 (0.0%) |
| Bachelor's Degree or higher | 192 (88.5%) | 0 (0.0%) |
| Total | 1,380 (67.3%) | 0 (0.0%) |
Employment Occupations by Sex in Scotland County
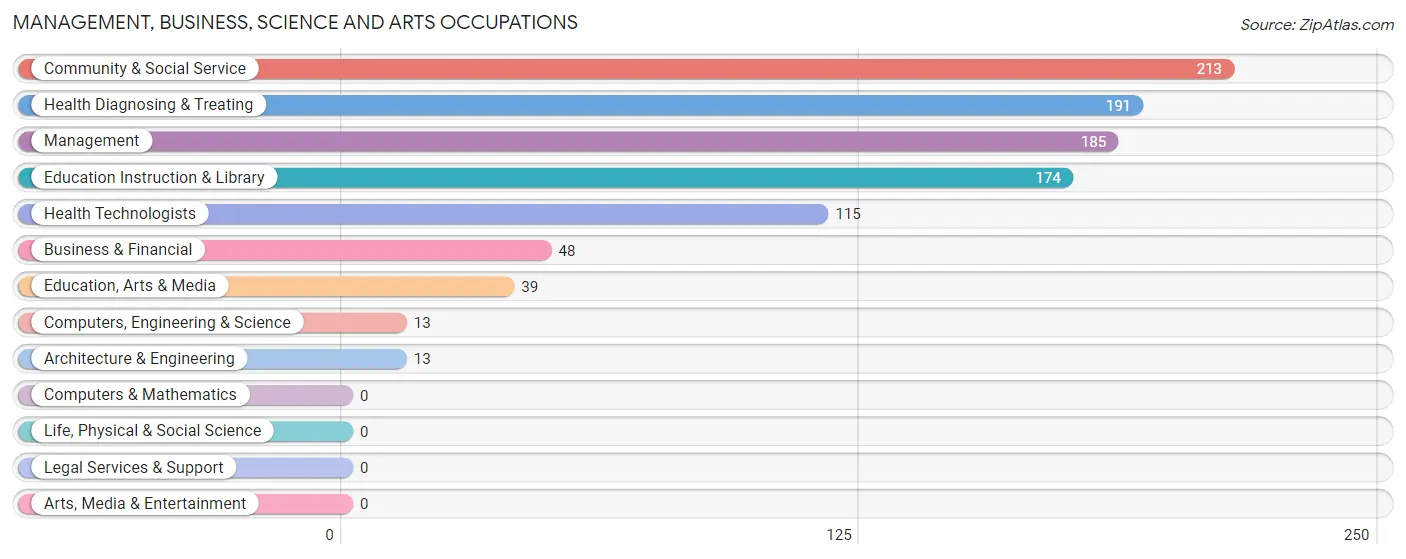
Management, Business, Science and Arts Occupations
The most common Management, Business, Science and Arts occupations in Scotland County are Community & Social Service (213 | 11.0%), Health Diagnosing & Treating (191 | 9.9%), Management (185 | 9.6%), Education Instruction & Library (174 | 9.0%), and Health Technologists (115 | 5.9%).
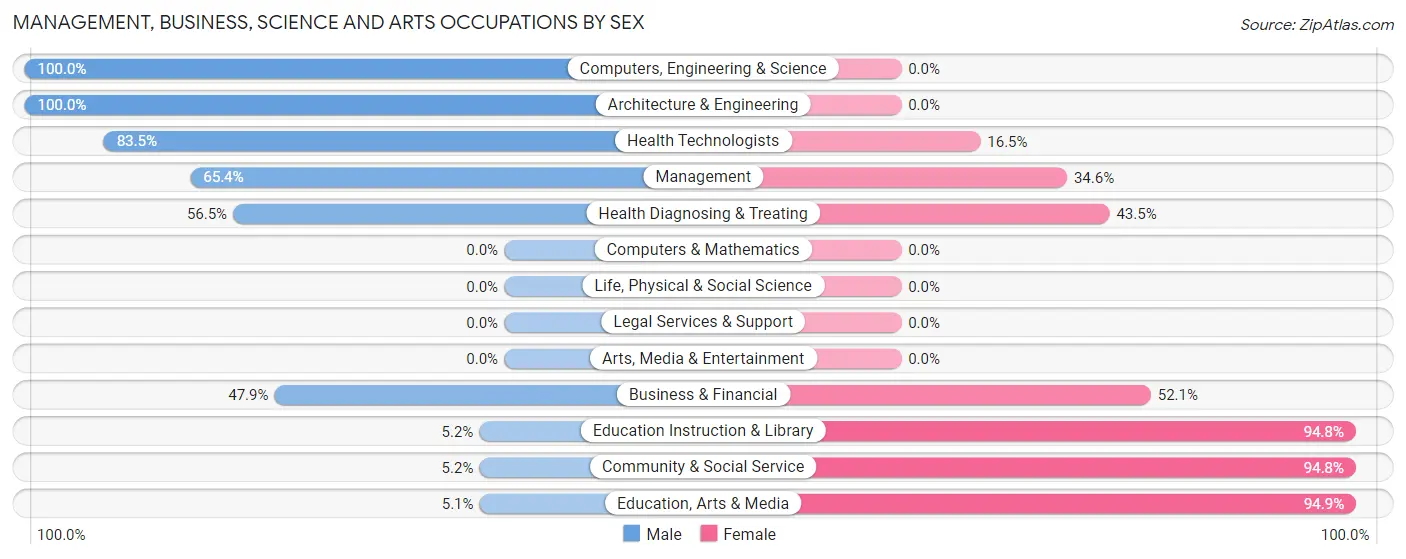
Management, Business, Science and Arts Occupations by Sex
Within the Management, Business, Science and Arts occupations in Scotland County, the most male-oriented occupations are Computers, Engineering & Science (100.0%), Architecture & Engineering (100.0%), and Health Technologists (83.5%), while the most female-oriented occupations are Education, Arts & Media (94.9%), Community & Social Service (94.8%), and Education Instruction & Library (94.8%).
| Occupation | Male | Female |
| Management | 121 (65.4%) | 64 (34.6%) |
| Business & Financial | 23 (47.9%) | 25 (52.1%) |
| Computers, Engineering & Science | 13 (100.0%) | 0 (0.0%) |
| Computers & Mathematics | 0 (0.0%) | 0 (0.0%) |
| Architecture & Engineering | 13 (100.0%) | 0 (0.0%) |
| Life, Physical & Social Science | 0 (0.0%) | 0 (0.0%) |
| Community & Social Service | 11 (5.2%) | 202 (94.8%) |
| Education, Arts & Media | 2 (5.1%) | 37 (94.9%) |
| Legal Services & Support | 0 (0.0%) | 0 (0.0%) |
| Education Instruction & Library | 9 (5.2%) | 165 (94.8%) |
| Arts, Media & Entertainment | 0 (0.0%) | 0 (0.0%) |
| Health Diagnosing & Treating | 108 (56.5%) | 83 (43.5%) |
| Health Technologists | 96 (83.5%) | 19 (16.5%) |
| Total (Category) | 276 (42.5%) | 374 (57.5%) |
| Total (Overall) | 1,105 (57.1%) | 831 (42.9%) |
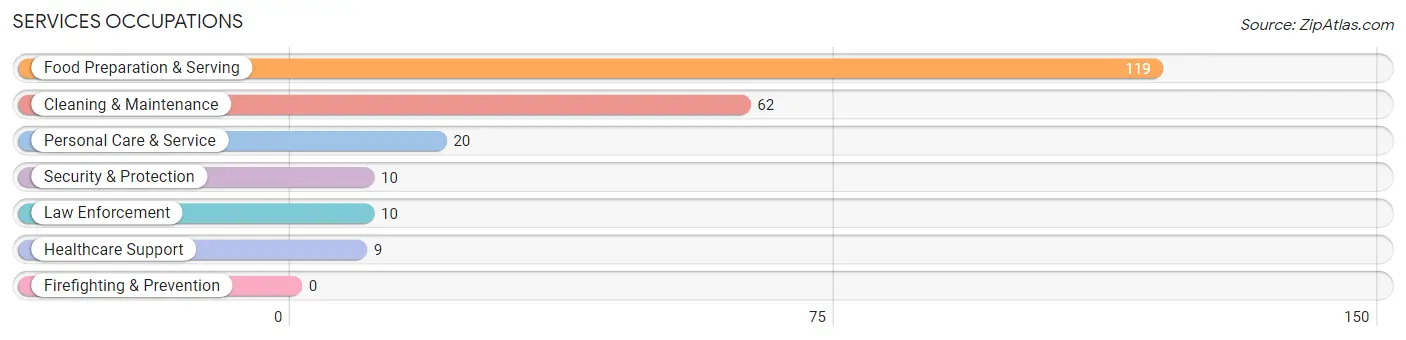
Services Occupations
The most common Services occupations in Scotland County are Food Preparation & Serving (119 | 6.1%), Cleaning & Maintenance (62 | 3.2%), Personal Care & Service (20 | 1.0%), Security & Protection (10 | 0.5%), and Law Enforcement (10 | 0.5%).
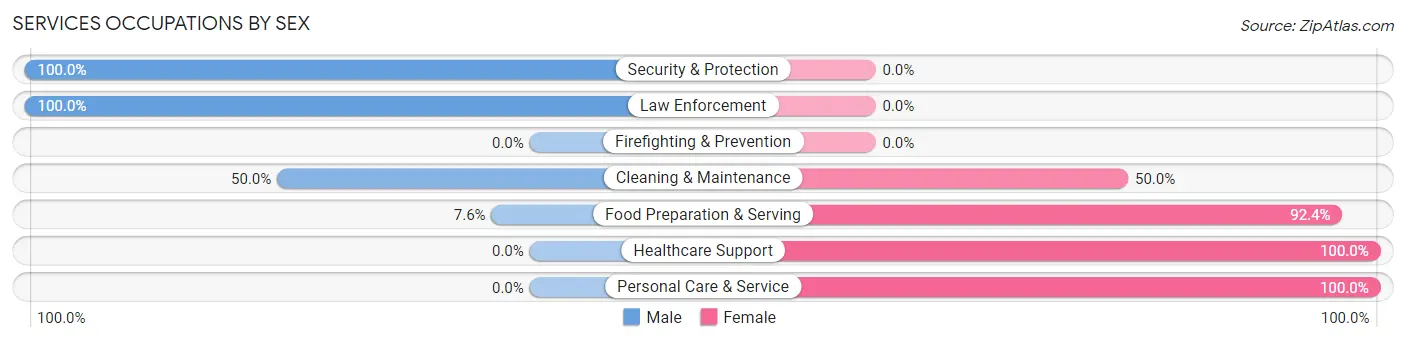
Services Occupations by Sex
Within the Services occupations in Scotland County, the most male-oriented occupations are Security & Protection (100.0%), Law Enforcement (100.0%), and Cleaning & Maintenance (50.0%), while the most female-oriented occupations are Healthcare Support (100.0%), Personal Care & Service (100.0%), and Food Preparation & Serving (92.4%).
| Occupation | Male | Female |
| Healthcare Support | 0 (0.0%) | 9 (100.0%) |
| Security & Protection | 10 (100.0%) | 0 (0.0%) |
| Firefighting & Prevention | 0 (0.0%) | 0 (0.0%) |
| Law Enforcement | 10 (100.0%) | 0 (0.0%) |
| Food Preparation & Serving | 9 (7.6%) | 110 (92.4%) |
| Cleaning & Maintenance | 31 (50.0%) | 31 (50.0%) |
| Personal Care & Service | 0 (0.0%) | 20 (100.0%) |
| Total (Category) | 50 (22.7%) | 170 (77.3%) |
| Total (Overall) | 1,105 (57.1%) | 831 (42.9%) |
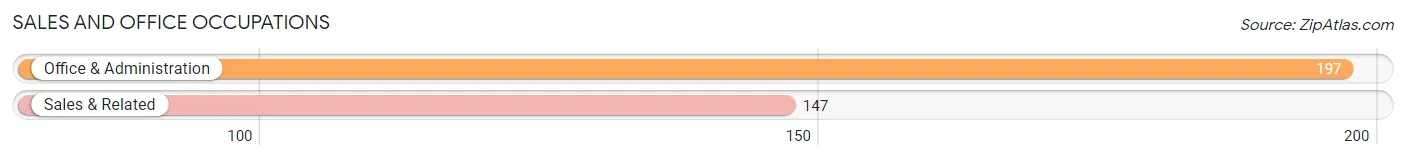
Sales and Office Occupations
The most common Sales and Office occupations in Scotland County are Office & Administration (197 | 10.2%), and Sales & Related (147 | 7.6%).
Sales and Office Occupations by Sex
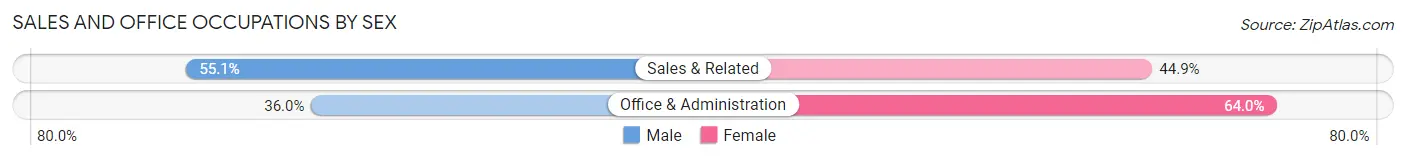
| Occupation | Male | Female |
| Sales & Related | 81 (55.1%) | 66 (44.9%) |
| Office & Administration | 71 (36.0%) | 126 (64.0%) |
| Total (Category) | 152 (44.2%) | 192 (55.8%) |
| Total (Overall) | 1,105 (57.1%) | 831 (42.9%) |
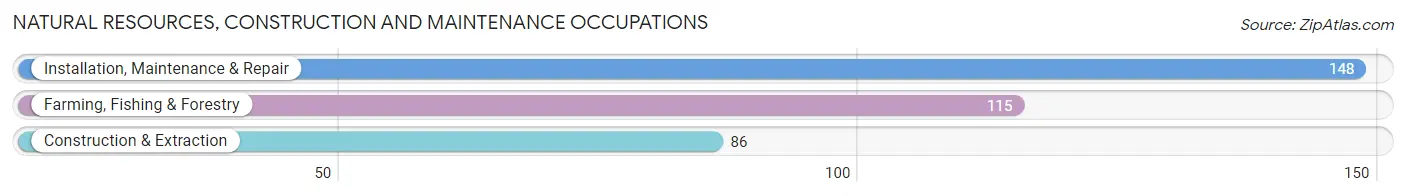
Natural Resources, Construction and Maintenance Occupations
The most common Natural Resources, Construction and Maintenance occupations in Scotland County are Installation, Maintenance & Repair (148 | 7.6%), Farming, Fishing & Forestry (115 | 5.9%), and Construction & Extraction (86 | 4.4%).
Natural Resources, Construction and Maintenance Occupations by Sex
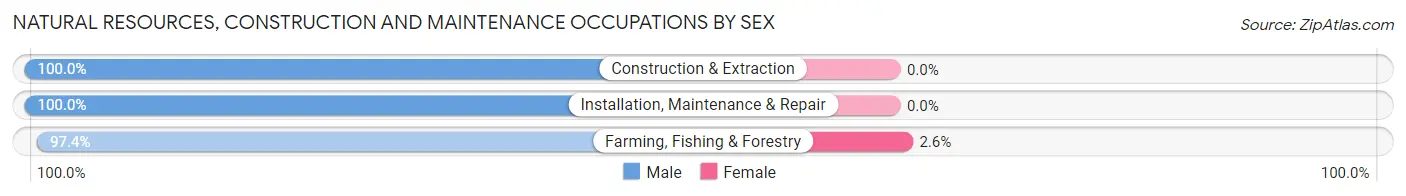
| Occupation | Male | Female |
| Farming, Fishing & Forestry | 112 (97.4%) | 3 (2.6%) |
| Construction & Extraction | 86 (100.0%) | 0 (0.0%) |
| Installation, Maintenance & Repair | 148 (100.0%) | 0 (0.0%) |
| Total (Category) | 346 (99.1%) | 3 (0.9%) |
| Total (Overall) | 1,105 (57.1%) | 831 (42.9%) |
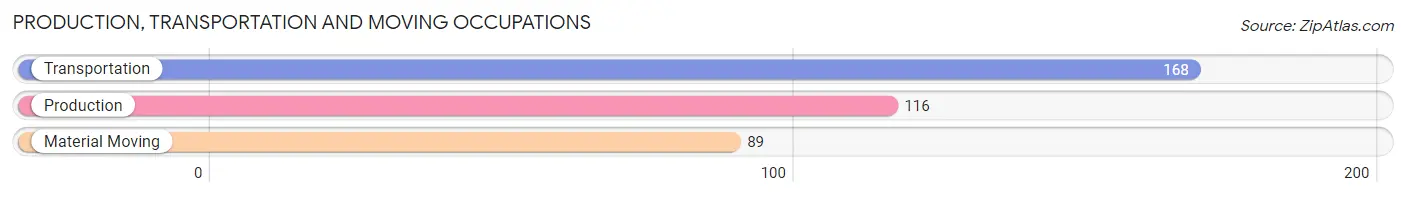
Production, Transportation and Moving Occupations
The most common Production, Transportation and Moving occupations in Scotland County are Transportation (168 | 8.7%), Production (116 | 6.0%), and Material Moving (89 | 4.6%).
Production, Transportation and Moving Occupations by Sex
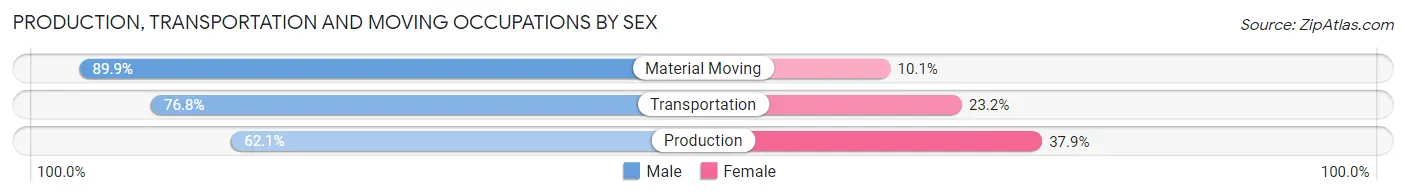
| Occupation | Male | Female |
| Production | 72 (62.1%) | 44 (37.9%) |
| Transportation | 129 (76.8%) | 39 (23.2%) |
| Material Moving | 80 (89.9%) | 9 (10.1%) |
| Total (Category) | 281 (75.3%) | 92 (24.7%) |
| Total (Overall) | 1,105 (57.1%) | 831 (42.9%) |
Employment Industries by Sex in Scotland County
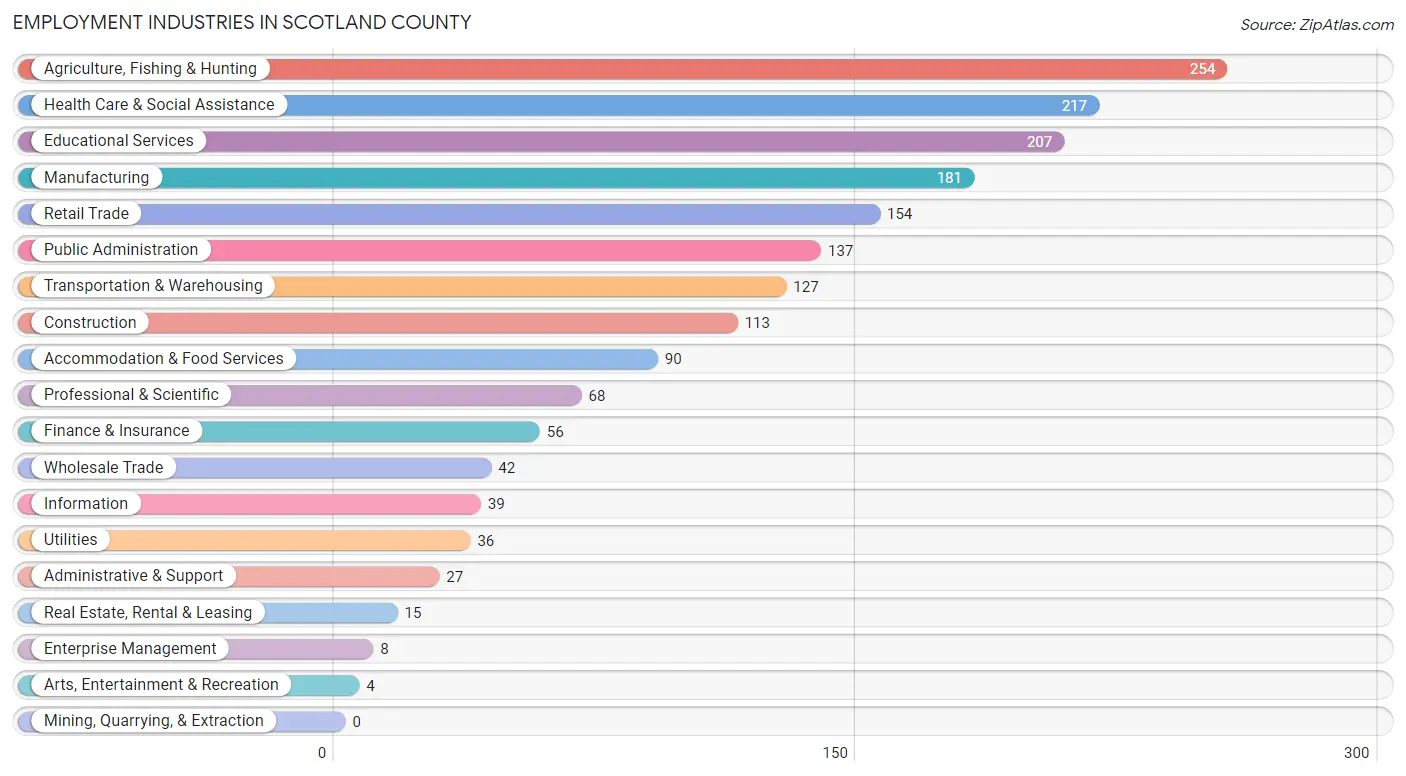
Employment Industries in Scotland County
The major employment industries in Scotland County include Agriculture, Fishing & Hunting (254 | 13.1%), Health Care & Social Assistance (217 | 11.2%), Educational Services (207 | 10.7%), Manufacturing (181 | 9.3%), and Retail Trade (154 | 8.0%).
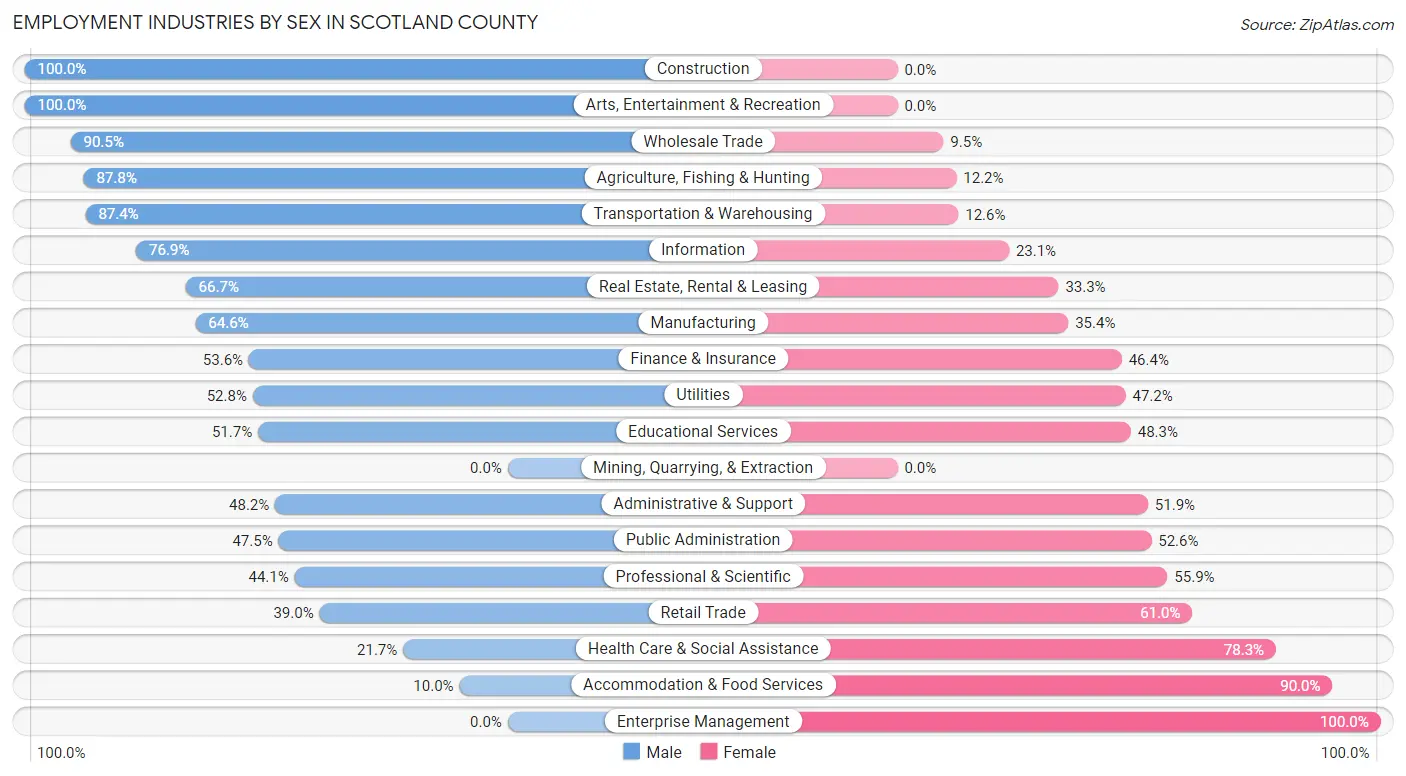
Employment Industries by Sex in Scotland County
The Scotland County industries that see more men than women are Construction (100.0%), Arts, Entertainment & Recreation (100.0%), and Wholesale Trade (90.5%), whereas the industries that tend to have a higher number of women are Enterprise Management (100.0%), Accommodation & Food Services (90.0%), and Health Care & Social Assistance (78.3%).
| Industry | Male | Female |
| Agriculture, Fishing & Hunting | 223 (87.8%) | 31 (12.2%) |
| Mining, Quarrying, & Extraction | 0 (0.0%) | 0 (0.0%) |
| Construction | 113 (100.0%) | 0 (0.0%) |
| Manufacturing | 117 (64.6%) | 64 (35.4%) |
| Wholesale Trade | 38 (90.5%) | 4 (9.5%) |
| Retail Trade | 60 (39.0%) | 94 (61.0%) |
| Transportation & Warehousing | 111 (87.4%) | 16 (12.6%) |
| Utilities | 19 (52.8%) | 17 (47.2%) |
| Information | 30 (76.9%) | 9 (23.1%) |
| Finance & Insurance | 30 (53.6%) | 26 (46.4%) |
| Real Estate, Rental & Leasing | 10 (66.7%) | 5 (33.3%) |
| Professional & Scientific | 30 (44.1%) | 38 (55.9%) |
| Enterprise Management | 0 (0.0%) | 8 (100.0%) |
| Administrative & Support | 13 (48.1%) | 14 (51.8%) |
| Educational Services | 107 (51.7%) | 100 (48.3%) |
| Health Care & Social Assistance | 47 (21.7%) | 170 (78.3%) |
| Arts, Entertainment & Recreation | 4 (100.0%) | 0 (0.0%) |
| Accommodation & Food Services | 9 (10.0%) | 81 (90.0%) |
| Public Administration | 65 (47.4%) | 72 (52.5%) |
| Total | 1,105 (57.1%) | 831 (42.9%) |
Education in Scotland County
School Enrollment in Scotland County
The most common levels of schooling among the 951 students in Scotland County are elementary school (341 | 35.9%), middle school (237 | 24.9%), and high school (221 | 23.2%).
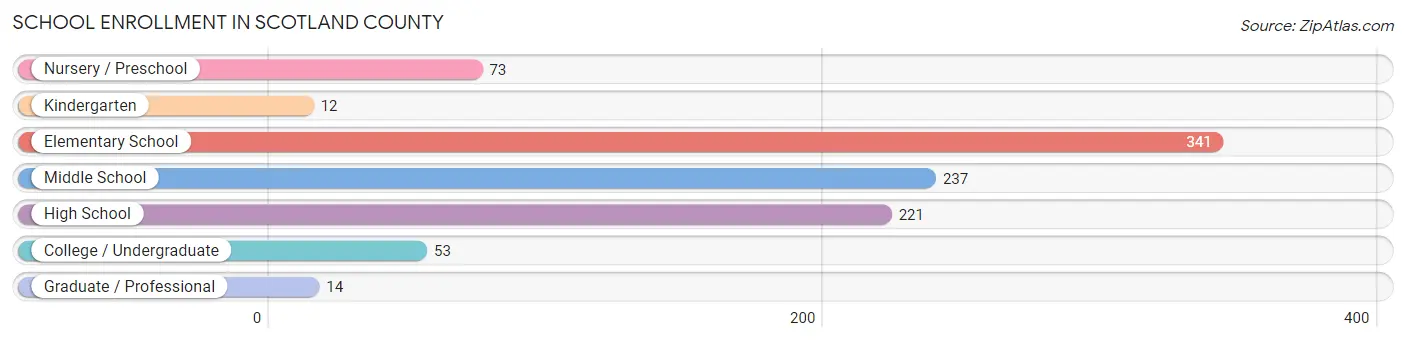
| School Level | # Students | % Students |
| Nursery / Preschool | 73 | 7.7% |
| Kindergarten | 12 | 1.3% |
| Elementary School | 341 | 35.9% |
| Middle School | 237 | 24.9% |
| High School | 221 | 23.2% |
| College / Undergraduate | 53 | 5.6% |
| Graduate / Professional | 14 | 1.5% |
| Total | 951 | 100.0% |
School Enrollment by Age by Funding Source in Scotland County
Out of a total of 951 students who are enrolled in schools in Scotland County, 332 (34.9%) attend a private institution, while the remaining 619 (65.1%) are enrolled in public schools. The age group of 10 to 14 year olds has the highest likelihood of being enrolled in private schools, with 146 (48.7% in the age bracket) enrolled. Conversely, the age group of 3 to 4 year olds has the lowest likelihood of being enrolled in a private school, with 37 (100.0% in the age bracket) attending a public institution.
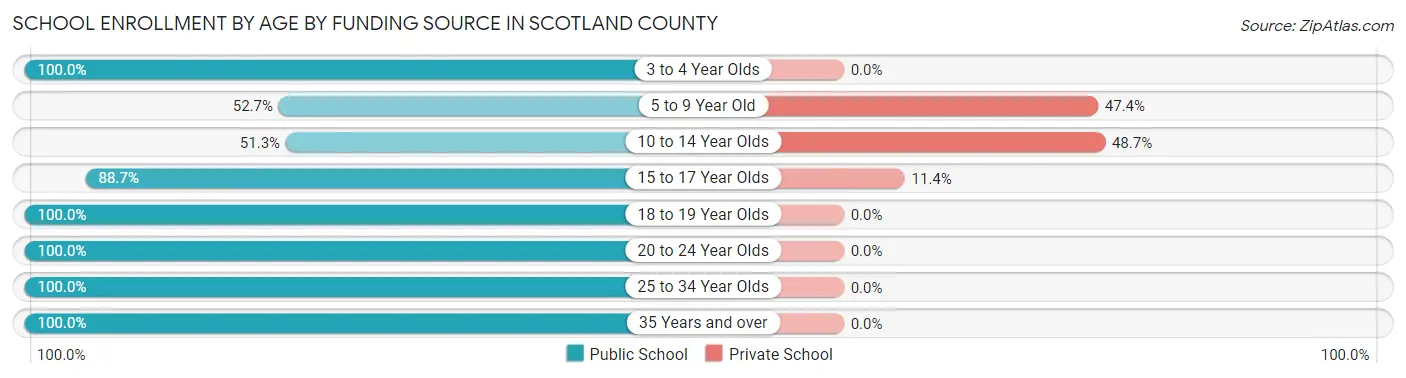
| Age Bracket | Public School | Private School |
| 3 to 4 Year Olds | 37 (100.0%) | 0 (0.0%) |
| 5 to 9 Year Old | 189 (52.6%) | 170 (47.3%) |
| 10 to 14 Year Olds | 154 (51.3%) | 146 (48.7%) |
| 15 to 17 Year Olds | 125 (88.6%) | 16 (11.4%) |
| 18 to 19 Year Olds | 78 (100.0%) | 0 (0.0%) |
| 20 to 24 Year Olds | 14 (100.0%) | 0 (0.0%) |
| 25 to 34 Year Olds | 5 (100.0%) | 0 (0.0%) |
| 35 Years and over | 17 (100.0%) | 0 (0.0%) |
| Total | 619 (65.1%) | 332 (34.9%) |
Educational Attainment by Field of Study in Scotland County
Education (124 | 28.2%), bio, nature & agricultural (90 | 20.4%), psychology (89 | 20.2%), business (67 | 15.2%), and science & technology (42 | 9.6%) are the most common fields of study among 440 individuals in Scotland County who have obtained a bachelor's degree or higher.
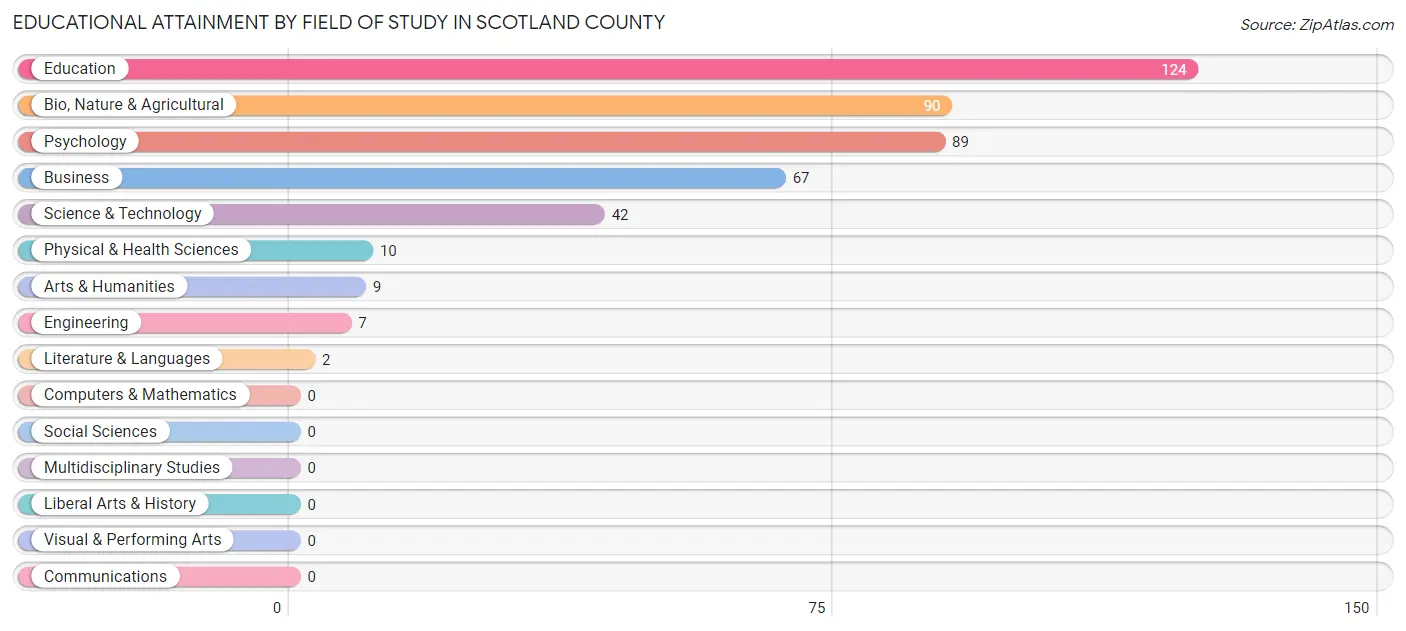
| Field of Study | # Graduates | % Graduates |
| Computers & Mathematics | 0 | 0.0% |
| Bio, Nature & Agricultural | 90 | 20.4% |
| Physical & Health Sciences | 10 | 2.3% |
| Psychology | 89 | 20.2% |
| Social Sciences | 0 | 0.0% |
| Engineering | 7 | 1.6% |
| Multidisciplinary Studies | 0 | 0.0% |
| Science & Technology | 42 | 9.6% |
| Business | 67 | 15.2% |
| Education | 124 | 28.2% |
| Literature & Languages | 2 | 0.4% |
| Liberal Arts & History | 0 | 0.0% |
| Visual & Performing Arts | 0 | 0.0% |
| Communications | 0 | 0.0% |
| Arts & Humanities | 9 | 2.1% |
| Total | 440 | 100.0% |
Transportation & Commute in Scotland County
Vehicle Availability by Sex in Scotland County
The most prevalent vehicle ownership categories in Scotland County are males with 5 or more vehicles (309, accounting for 28.3%) and females with 5 or more vehicles (108, making up 37.2%).
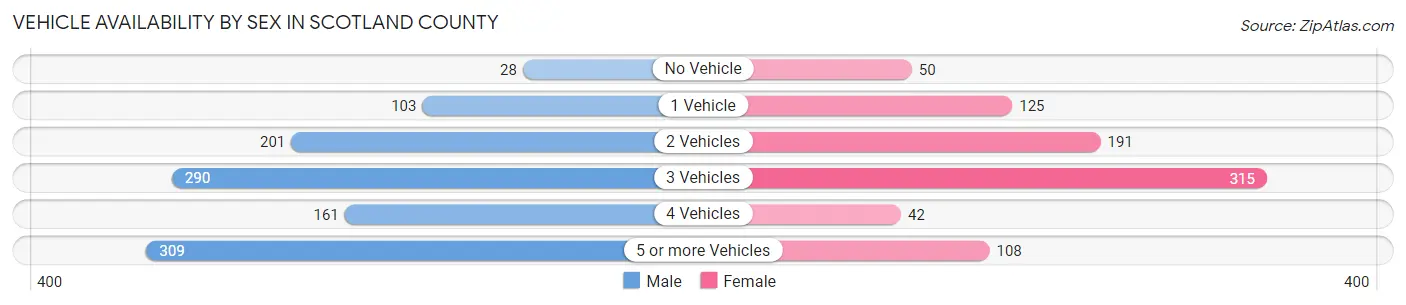
| Vehicles Available | Male | Female |
| No Vehicle | 28 (2.6%) | 50 (6.0%) |
| 1 Vehicle | 103 (9.4%) | 125 (15.0%) |
| 2 Vehicles | 201 (18.4%) | 191 (23.0%) |
| 3 Vehicles | 290 (26.6%) | 315 (37.9%) |
| 4 Vehicles | 161 (14.7%) | 42 (5.1%) |
| 5 or more Vehicles | 309 (28.3%) | 108 (13.0%) |
| Total | 1,092 (100.0%) | 831 (100.0%) |
Commute Time in Scotland County
The most frequently occuring commute durations in Scotland County are 5 to 9 minutes (552 commuters, 31.3%), 10 to 14 minutes (293 commuters, 16.6%), and 15 to 19 minutes (194 commuters, 11.0%).
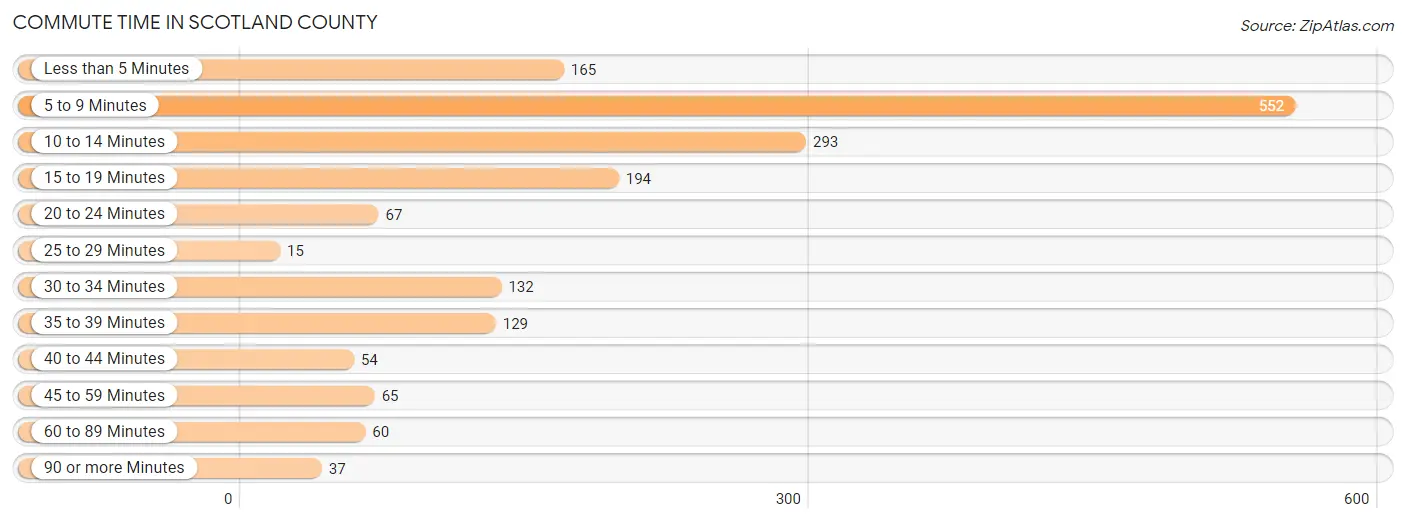
| Commute Time | # Commuters | % Commuters |
| Less than 5 Minutes | 165 | 9.4% |
| 5 to 9 Minutes | 552 | 31.3% |
| 10 to 14 Minutes | 293 | 16.6% |
| 15 to 19 Minutes | 194 | 11.0% |
| 20 to 24 Minutes | 67 | 3.8% |
| 25 to 29 Minutes | 15 | 0.9% |
| 30 to 34 Minutes | 132 | 7.5% |
| 35 to 39 Minutes | 129 | 7.3% |
| 40 to 44 Minutes | 54 | 3.1% |
| 45 to 59 Minutes | 65 | 3.7% |
| 60 to 89 Minutes | 60 | 3.4% |
| 90 or more Minutes | 37 | 2.1% |
Commute Time by Sex in Scotland County
The most common commute times in Scotland County are 10 to 14 minutes (230 commuters, 23.4%) for males and 5 to 9 minutes (375 commuters, 48.0%) for females.
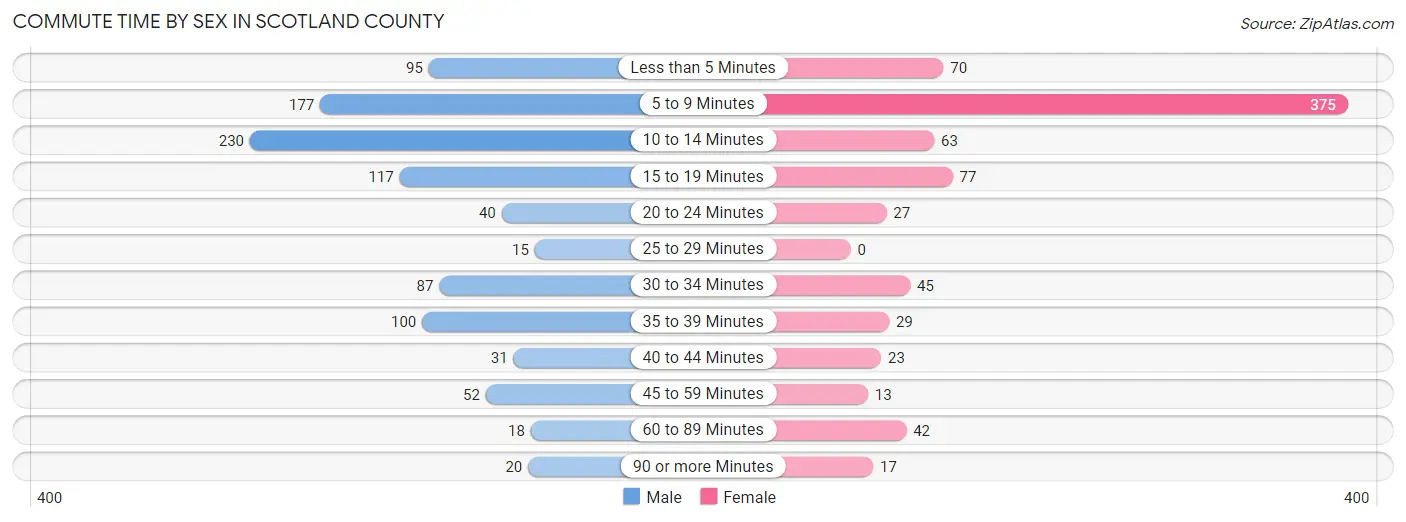
| Commute Time | Male | Female |
| Less than 5 Minutes | 95 (9.7%) | 70 (9.0%) |
| 5 to 9 Minutes | 177 (18.0%) | 375 (48.0%) |
| 10 to 14 Minutes | 230 (23.4%) | 63 (8.1%) |
| 15 to 19 Minutes | 117 (11.9%) | 77 (9.9%) |
| 20 to 24 Minutes | 40 (4.1%) | 27 (3.5%) |
| 25 to 29 Minutes | 15 (1.5%) | 0 (0.0%) |
| 30 to 34 Minutes | 87 (8.9%) | 45 (5.8%) |
| 35 to 39 Minutes | 100 (10.2%) | 29 (3.7%) |
| 40 to 44 Minutes | 31 (3.2%) | 23 (2.9%) |
| 45 to 59 Minutes | 52 (5.3%) | 13 (1.7%) |
| 60 to 89 Minutes | 18 (1.8%) | 42 (5.4%) |
| 90 or more Minutes | 20 (2.0%) | 17 (2.2%) |
Time of Departure to Work by Sex in Scotland County
The most frequent times of departure to work in Scotland County are 7:30 AM to 7:59 AM (220, 22.4%) for males and 7:30 AM to 7:59 AM (272, 34.8%) for females.
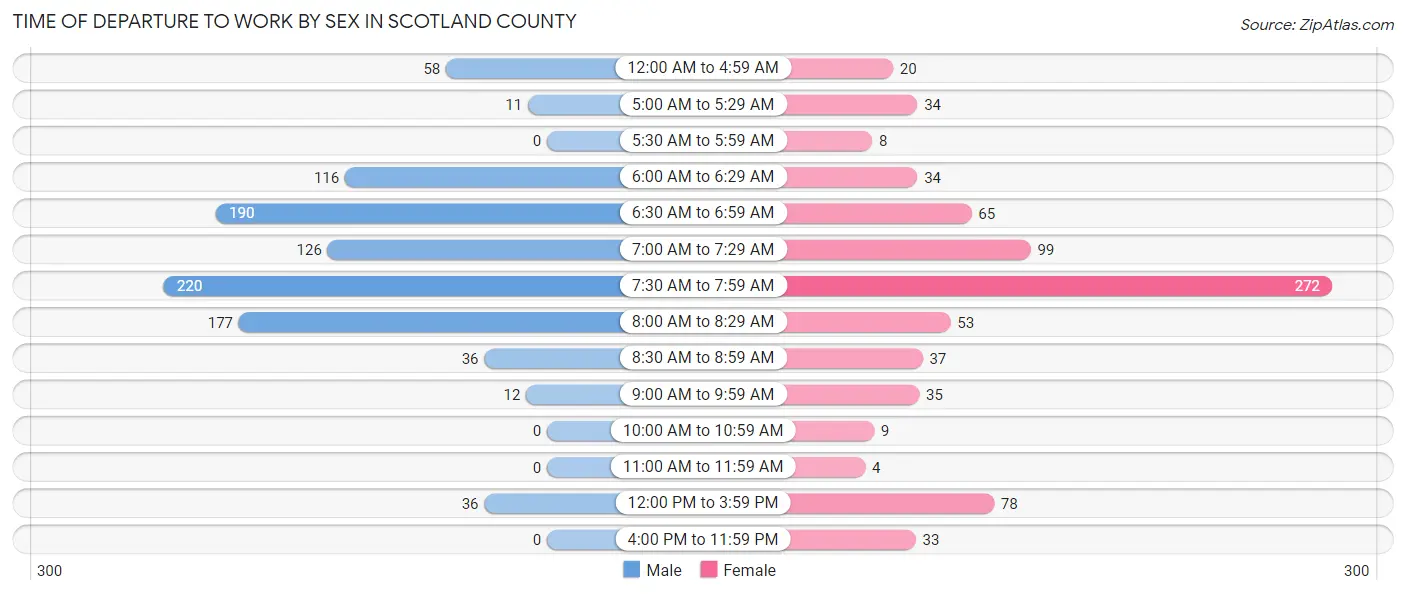
| Time of Departure | Male | Female |
| 12:00 AM to 4:59 AM | 58 (5.9%) | 20 (2.6%) |
| 5:00 AM to 5:29 AM | 11 (1.1%) | 34 (4.3%) |
| 5:30 AM to 5:59 AM | 0 (0.0%) | 8 (1.0%) |
| 6:00 AM to 6:29 AM | 116 (11.8%) | 34 (4.3%) |
| 6:30 AM to 6:59 AM | 190 (19.4%) | 65 (8.3%) |
| 7:00 AM to 7:29 AM | 126 (12.8%) | 99 (12.7%) |
| 7:30 AM to 7:59 AM | 220 (22.4%) | 272 (34.8%) |
| 8:00 AM to 8:29 AM | 177 (18.0%) | 53 (6.8%) |
| 8:30 AM to 8:59 AM | 36 (3.7%) | 37 (4.7%) |
| 9:00 AM to 9:59 AM | 12 (1.2%) | 35 (4.5%) |
| 10:00 AM to 10:59 AM | 0 (0.0%) | 9 (1.1%) |
| 11:00 AM to 11:59 AM | 0 (0.0%) | 4 (0.5%) |
| 12:00 PM to 3:59 PM | 36 (3.7%) | 78 (10.0%) |
| 4:00 PM to 11:59 PM | 0 (0.0%) | 33 (4.2%) |
| Total | 982 (100.0%) | 781 (100.0%) |
Housing Occupancy in Scotland County
Occupancy by Ownership in Scotland County
Of the total 1,527 dwellings in Scotland County, owner-occupied units account for 1,224 (80.2%), while renter-occupied units make up 303 (19.8%).
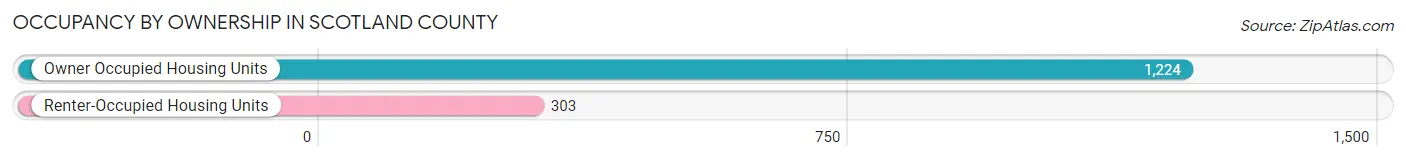
| Occupancy | # Housing Units | % Housing Units |
| Owner Occupied Housing Units | 1,224 | 80.2% |
| Renter-Occupied Housing Units | 303 | 19.8% |
| Total Occupied Housing Units | 1,527 | 100.0% |
Occupancy by Household Size in Scotland County
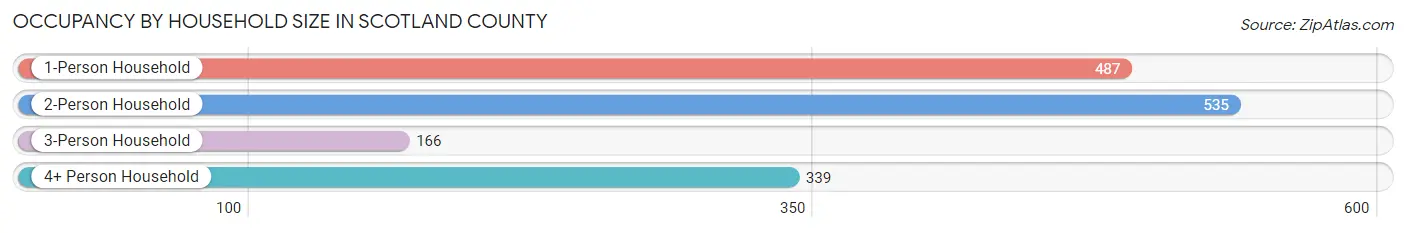
| Household Size | # Housing Units | % Housing Units |
| 1-Person Household | 487 | 31.9% |
| 2-Person Household | 535 | 35.0% |
| 3-Person Household | 166 | 10.9% |
| 4+ Person Household | 339 | 22.2% |
| Total Housing Units | 1,527 | 100.0% |
Occupancy by Ownership by Household Size in Scotland County
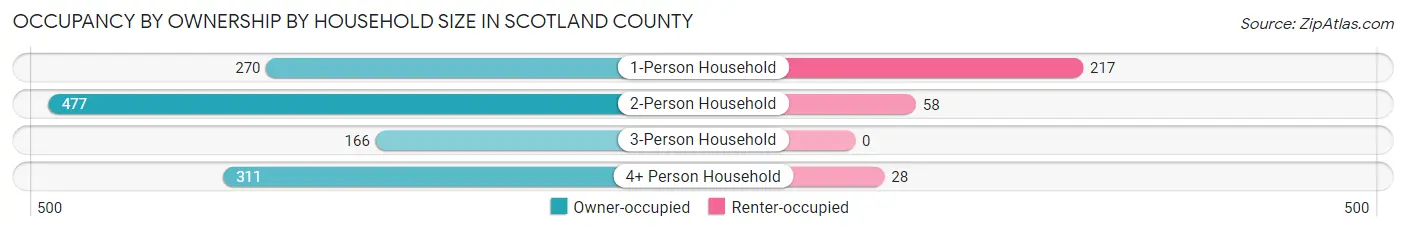
| Household Size | Owner-occupied | Renter-occupied |
| 1-Person Household | 270 (55.4%) | 217 (44.6%) |
| 2-Person Household | 477 (89.2%) | 58 (10.8%) |
| 3-Person Household | 166 (100.0%) | 0 (0.0%) |
| 4+ Person Household | 311 (91.7%) | 28 (8.3%) |
| Total Housing Units | 1,224 (80.2%) | 303 (19.8%) |
Occupancy by Educational Attainment in Scotland County
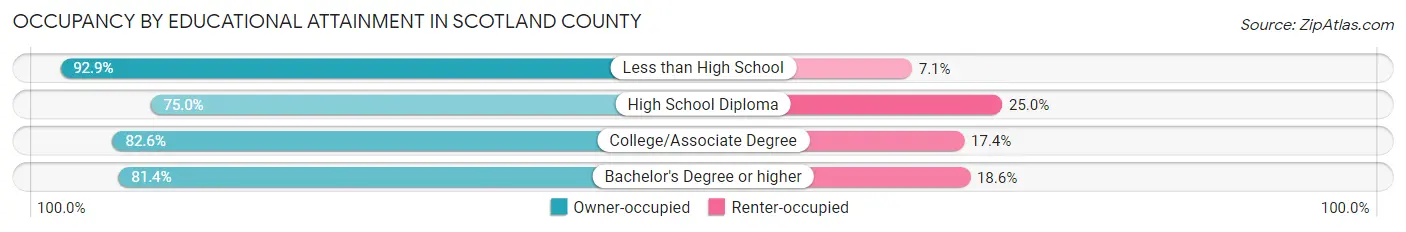
| Household Size | Owner-occupied | Renter-occupied |
| Less than High School | 158 (92.9%) | 12 (7.1%) |
| High School Diploma | 514 (75.0%) | 171 (25.0%) |
| College/Associate Degree | 355 (82.6%) | 75 (17.4%) |
| Bachelor's Degree or higher | 197 (81.4%) | 45 (18.6%) |
Occupancy by Age of Householder in Scotland County
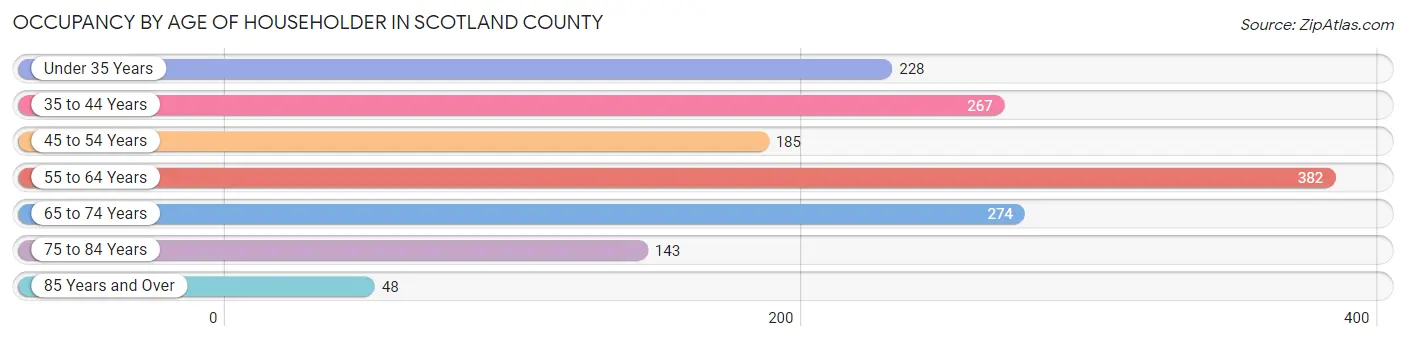
| Age Bracket | # Households | % Households |
| Under 35 Years | 228 | 14.9% |
| 35 to 44 Years | 267 | 17.5% |
| 45 to 54 Years | 185 | 12.1% |
| 55 to 64 Years | 382 | 25.0% |
| 65 to 74 Years | 274 | 17.9% |
| 75 to 84 Years | 143 | 9.4% |
| 85 Years and Over | 48 | 3.1% |
| Total | 1,527 | 100.0% |
Housing Finances in Scotland County
Median Income by Occupancy in Scotland County
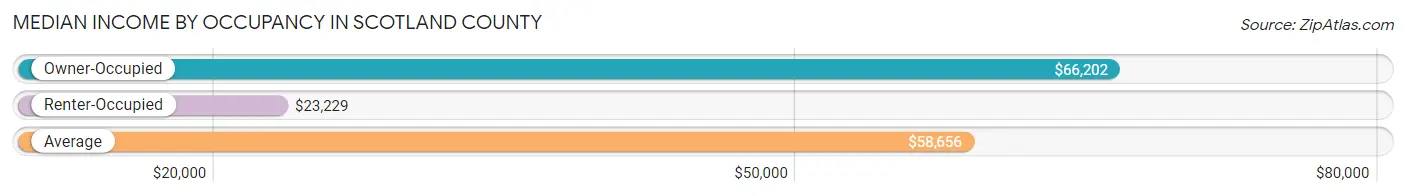
| Occupancy Type | # Households | Median Income |
| Owner-Occupied | 1,224 (80.2%) | $66,202 |
| Renter-Occupied | 303 (19.8%) | $23,229 |
| Average | 1,527 (100.0%) | $58,656 |
Occupancy by Householder Income Bracket in Scotland County
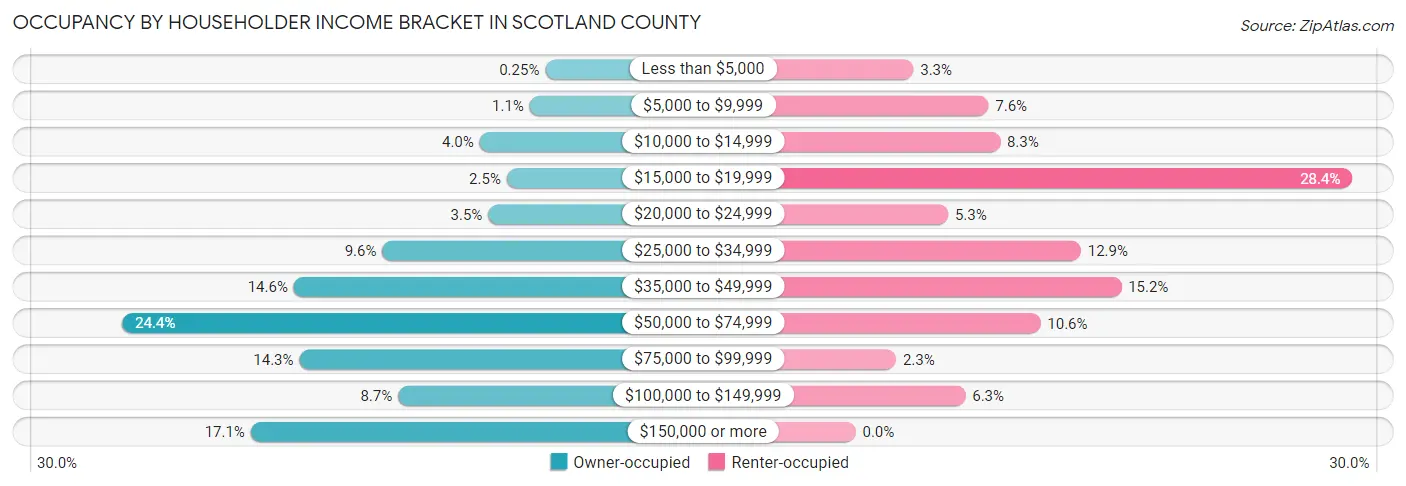
| Income Bracket | Owner-occupied | Renter-occupied |
| Less than $5,000 | 3 (0.3%) | 10 (3.3%) |
| $5,000 to $9,999 | 14 (1.1%) | 23 (7.6%) |
| $10,000 to $14,999 | 49 (4.0%) | 25 (8.3%) |
| $15,000 to $19,999 | 30 (2.5%) | 86 (28.4%) |
| $20,000 to $24,999 | 43 (3.5%) | 16 (5.3%) |
| $25,000 to $34,999 | 117 (9.6%) | 39 (12.9%) |
| $35,000 to $49,999 | 179 (14.6%) | 46 (15.2%) |
| $50,000 to $74,999 | 299 (24.4%) | 32 (10.6%) |
| $75,000 to $99,999 | 175 (14.3%) | 7 (2.3%) |
| $100,000 to $149,999 | 106 (8.7%) | 19 (6.3%) |
| $150,000 or more | 209 (17.1%) | 0 (0.0%) |
| Total | 1,224 (100.0%) | 303 (100.0%) |
Monthly Housing Cost Tiers in Scotland County
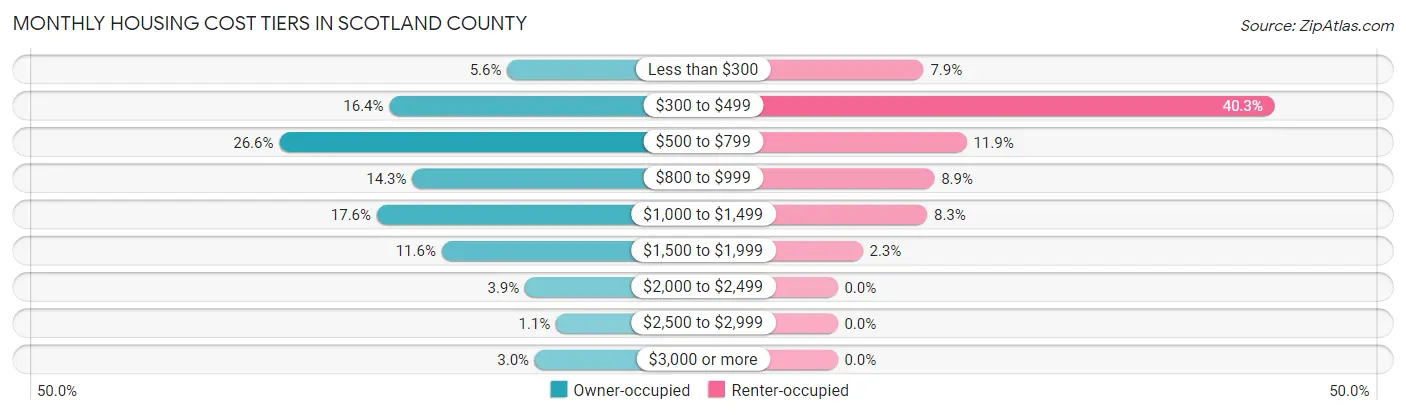
| Monthly Cost | Owner-occupied | Renter-occupied |
| Less than $300 | 68 (5.6%) | 24 (7.9%) |
| $300 to $499 | 201 (16.4%) | 122 (40.3%) |
| $500 to $799 | 325 (26.6%) | 36 (11.9%) |
| $800 to $999 | 175 (14.3%) | 27 (8.9%) |
| $1,000 to $1,499 | 215 (17.6%) | 25 (8.3%) |
| $1,500 to $1,999 | 142 (11.6%) | 7 (2.3%) |
| $2,000 to $2,499 | 48 (3.9%) | 0 (0.0%) |
| $2,500 to $2,999 | 13 (1.1%) | 0 (0.0%) |
| $3,000 or more | 37 (3.0%) | 0 (0.0%) |
| Total | 1,224 (100.0%) | 303 (100.0%) |
Physical Housing Characteristics in Scotland County
Housing Structures in Scotland County
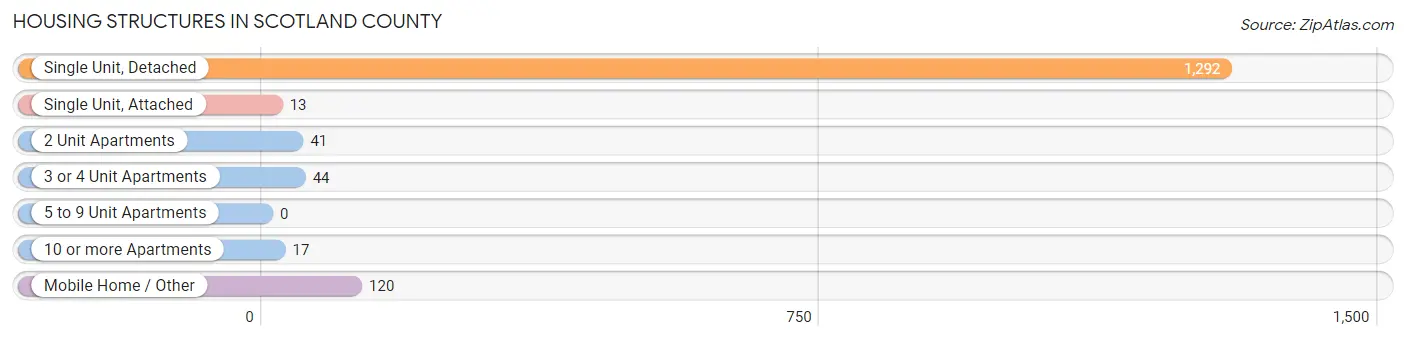
| Structure Type | # Housing Units | % Housing Units |
| Single Unit, Detached | 1,292 | 84.6% |
| Single Unit, Attached | 13 | 0.9% |
| 2 Unit Apartments | 41 | 2.7% |
| 3 or 4 Unit Apartments | 44 | 2.9% |
| 5 to 9 Unit Apartments | 0 | 0.0% |
| 10 or more Apartments | 17 | 1.1% |
| Mobile Home / Other | 120 | 7.9% |
| Total | 1,527 | 100.0% |
Housing Structures by Occupancy in Scotland County
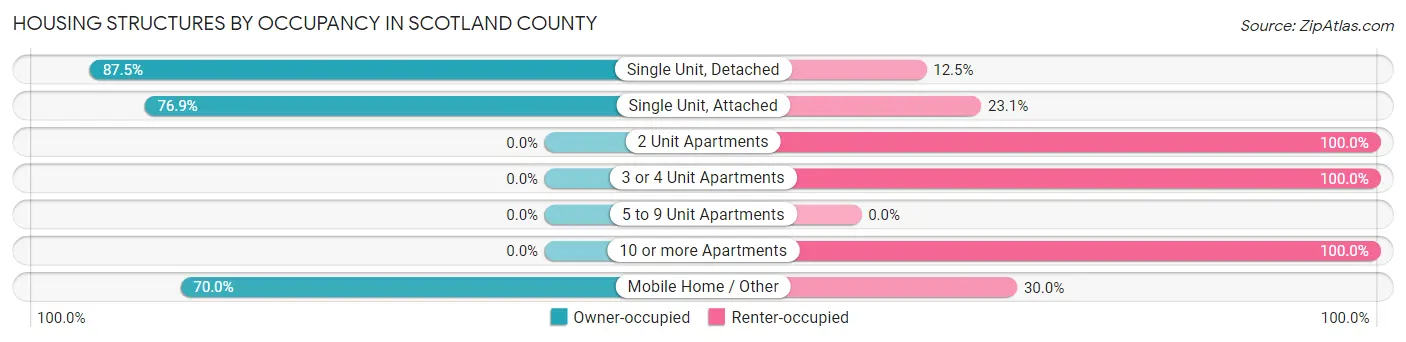
| Structure Type | Owner-occupied | Renter-occupied |
| Single Unit, Detached | 1,130 (87.5%) | 162 (12.5%) |
| Single Unit, Attached | 10 (76.9%) | 3 (23.1%) |
| 2 Unit Apartments | 0 (0.0%) | 41 (100.0%) |
| 3 or 4 Unit Apartments | 0 (0.0%) | 44 (100.0%) |
| 5 to 9 Unit Apartments | 0 (0.0%) | 0 (0.0%) |
| 10 or more Apartments | 0 (0.0%) | 17 (100.0%) |
| Mobile Home / Other | 84 (70.0%) | 36 (30.0%) |
| Total | 1,224 (80.2%) | 303 (19.8%) |
Housing Structures by Number of Rooms in Scotland County
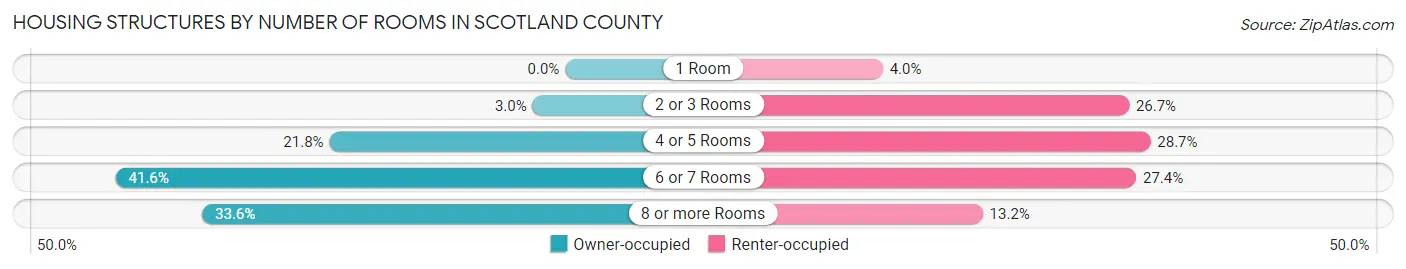
| Number of Rooms | Owner-occupied | Renter-occupied |
| 1 Room | 0 (0.0%) | 12 (4.0%) |
| 2 or 3 Rooms | 37 (3.0%) | 81 (26.7%) |
| 4 or 5 Rooms | 267 (21.8%) | 87 (28.7%) |
| 6 or 7 Rooms | 509 (41.6%) | 83 (27.4%) |
| 8 or more Rooms | 411 (33.6%) | 40 (13.2%) |
| Total | 1,224 (100.0%) | 303 (100.0%) |
Housing Structure by Heating Type in Scotland County
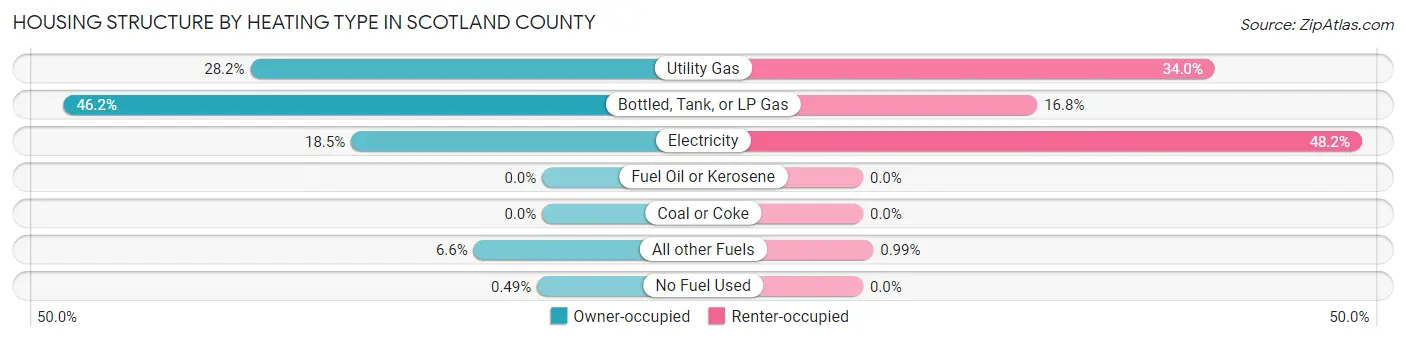
| Heating Type | Owner-occupied | Renter-occupied |
| Utility Gas | 345 (28.2%) | 103 (34.0%) |
| Bottled, Tank, or LP Gas | 566 (46.2%) | 51 (16.8%) |
| Electricity | 226 (18.5%) | 146 (48.2%) |
| Fuel Oil or Kerosene | 0 (0.0%) | 0 (0.0%) |
| Coal or Coke | 0 (0.0%) | 0 (0.0%) |
| All other Fuels | 81 (6.6%) | 3 (1.0%) |
| No Fuel Used | 6 (0.5%) | 0 (0.0%) |
| Total | 1,224 (100.0%) | 303 (100.0%) |
Household Vehicle Usage in Scotland County
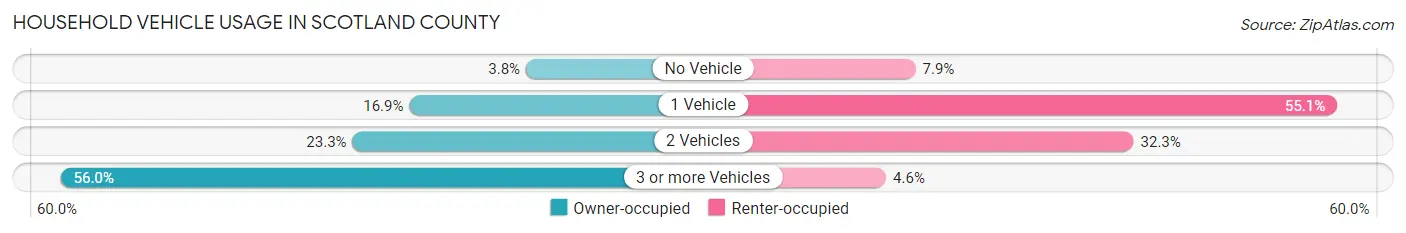
| Vehicles per Household | Owner-occupied | Renter-occupied |
| No Vehicle | 47 (3.8%) | 24 (7.9%) |
| 1 Vehicle | 207 (16.9%) | 167 (55.1%) |
| 2 Vehicles | 285 (23.3%) | 98 (32.3%) |
| 3 or more Vehicles | 685 (56.0%) | 14 (4.6%) |
| Total | 1,224 (100.0%) | 303 (100.0%) |
Real Estate & Mortgages in Scotland County
Real Estate and Mortgage Overview in Scotland County
| Characteristic | Without Mortgage | With Mortgage |
| Housing Units | 605 | 619 |
| Median Property Value | $132,200 | $140,700 |
| Median Household Income | $58,295 | $157 |
| Monthly Housing Costs | $555 | $37 |
| Real Estate Taxes | $1,209 | $5 |
Property Value by Mortgage Status in Scotland County
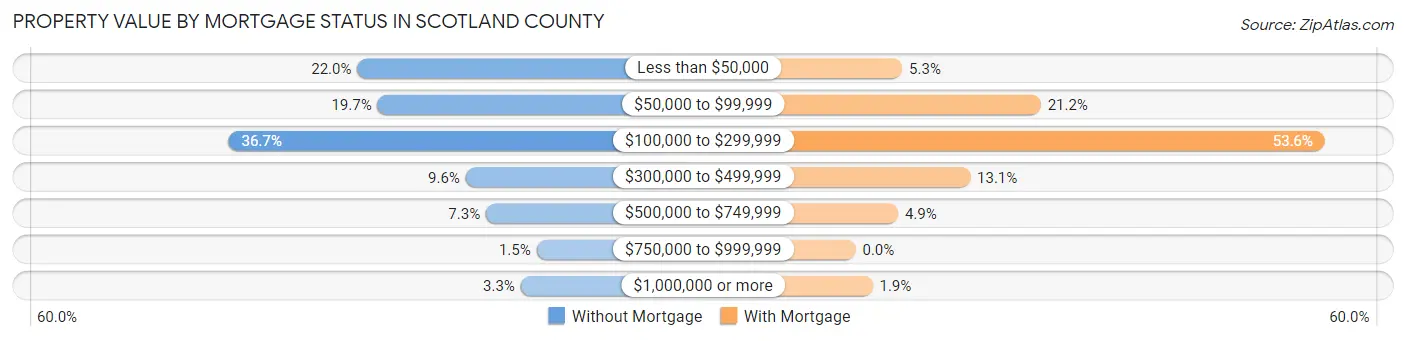
| Property Value | Without Mortgage | With Mortgage |
| Less than $50,000 | 133 (22.0%) | 33 (5.3%) |
| $50,000 to $99,999 | 119 (19.7%) | 131 (21.2%) |
| $100,000 to $299,999 | 222 (36.7%) | 332 (53.6%) |
| $300,000 to $499,999 | 58 (9.6%) | 81 (13.1%) |
| $500,000 to $749,999 | 44 (7.3%) | 30 (4.9%) |
| $750,000 to $999,999 | 9 (1.5%) | 0 (0.0%) |
| $1,000,000 or more | 20 (3.3%) | 12 (1.9%) |
| Total | 605 (100.0%) | 619 (100.0%) |
Household Income by Mortgage Status in Scotland County
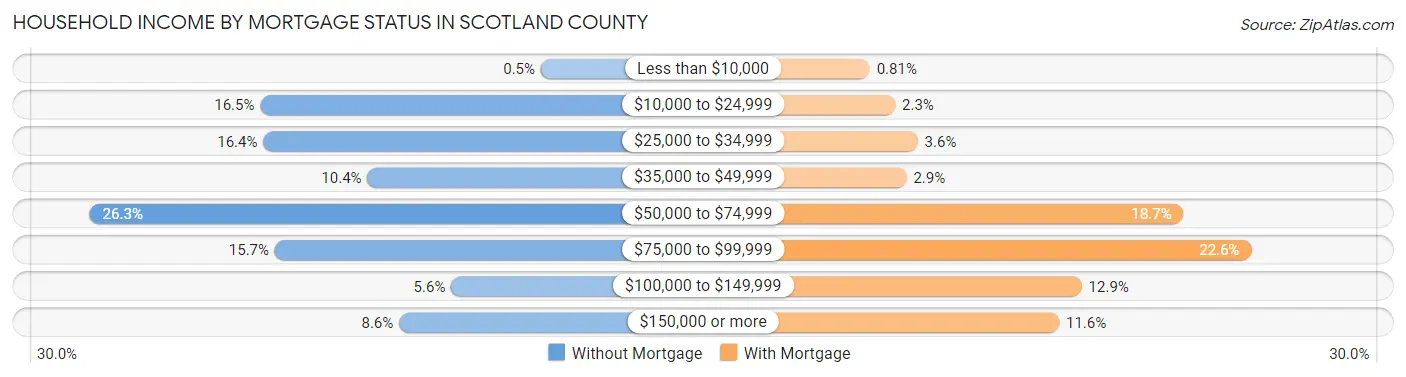
| Household Income | Without Mortgage | With Mortgage |
| Less than $10,000 | 3 (0.5%) | 5 (0.8%) |
| $10,000 to $24,999 | 100 (16.5%) | 14 (2.3%) |
| $25,000 to $34,999 | 99 (16.4%) | 22 (3.5%) |
| $35,000 to $49,999 | 63 (10.4%) | 18 (2.9%) |
| $50,000 to $74,999 | 159 (26.3%) | 116 (18.7%) |
| $75,000 to $99,999 | 95 (15.7%) | 140 (22.6%) |
| $100,000 to $149,999 | 34 (5.6%) | 80 (12.9%) |
| $150,000 or more | 52 (8.6%) | 72 (11.6%) |
| Total | 605 (100.0%) | 619 (100.0%) |
Property Value to Household Income Ratio in Scotland County
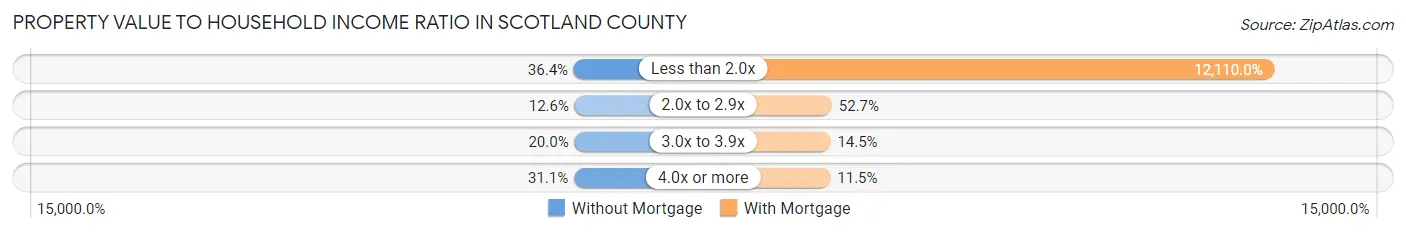
| Value-to-Income Ratio | Without Mortgage | With Mortgage |
| Less than 2.0x | 220 (36.4%) | 74,961 (12,110.0%) |
| 2.0x to 2.9x | 76 (12.6%) | 326 (52.7%) |
| 3.0x to 3.9x | 121 (20.0%) | 90 (14.5%) |
| 4.0x or more | 188 (31.1%) | 71 (11.5%) |
| Total | 605 (100.0%) | 619 (100.0%) |
Real Estate Taxes by Mortgage Status in Scotland County
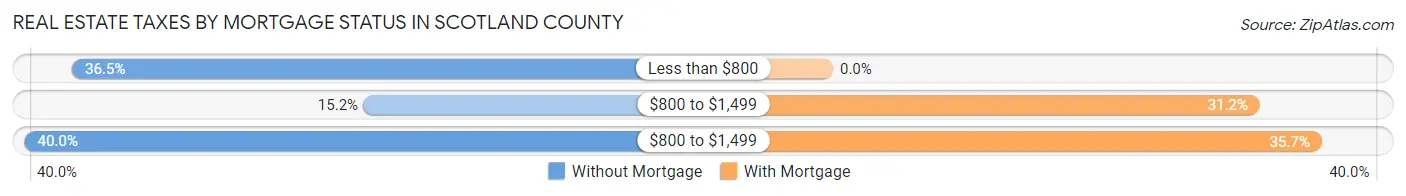
| Property Taxes | Without Mortgage | With Mortgage |
| Less than $800 | 221 (36.5%) | 0 (0.0%) |
| $800 to $1,499 | 92 (15.2%) | 193 (31.2%) |
| $800 to $1,499 | 242 (40.0%) | 221 (35.7%) |
| Total | 605 (100.0%) | 619 (100.0%) |
Health & Disability in Scotland County
Health Insurance Coverage by Age in Scotland County
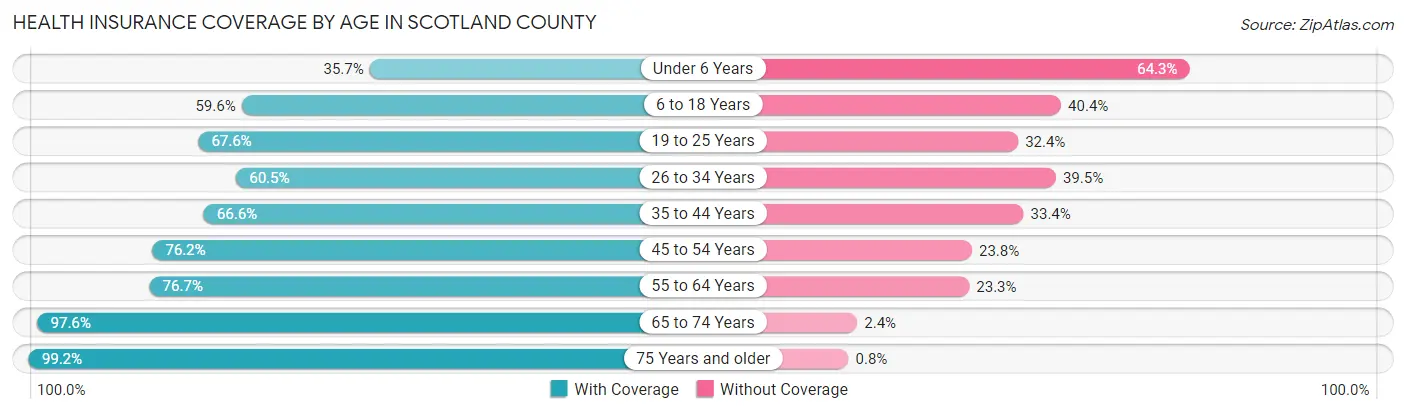
| Age Bracket | With Coverage | Without Coverage |
| Under 6 Years | 168 (35.7%) | 303 (64.3%) |
| 6 to 18 Years | 589 (59.6%) | 400 (40.4%) |
| 19 to 25 Years | 248 (67.6%) | 119 (32.4%) |
| 26 to 34 Years | 302 (60.5%) | 197 (39.5%) |
| 35 to 44 Years | 424 (66.6%) | 213 (33.4%) |
| 45 to 54 Years | 227 (76.2%) | 71 (23.8%) |
| 55 to 64 Years | 444 (76.7%) | 135 (23.3%) |
| 65 to 74 Years | 442 (97.6%) | 11 (2.4%) |
| 75 Years and older | 372 (99.2%) | 3 (0.8%) |
| Total | 3,216 (68.9%) | 1,452 (31.1%) |
Health Insurance Coverage by Citizenship Status in Scotland County
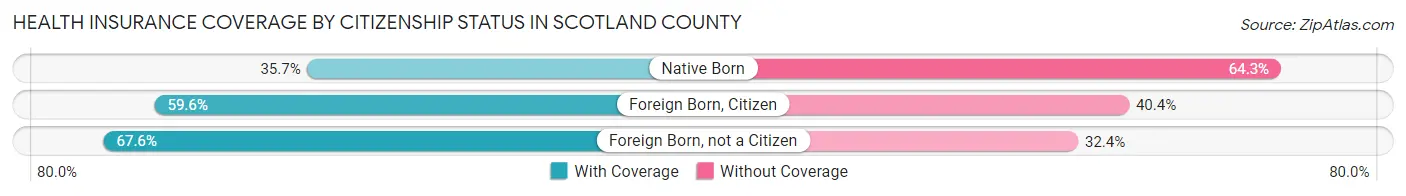
| Citizenship Status | With Coverage | Without Coverage |
| Native Born | 168 (35.7%) | 303 (64.3%) |
| Foreign Born, Citizen | 589 (59.6%) | 400 (40.4%) |
| Foreign Born, not a Citizen | 248 (67.6%) | 119 (32.4%) |
Health Insurance Coverage by Household Income in Scotland County
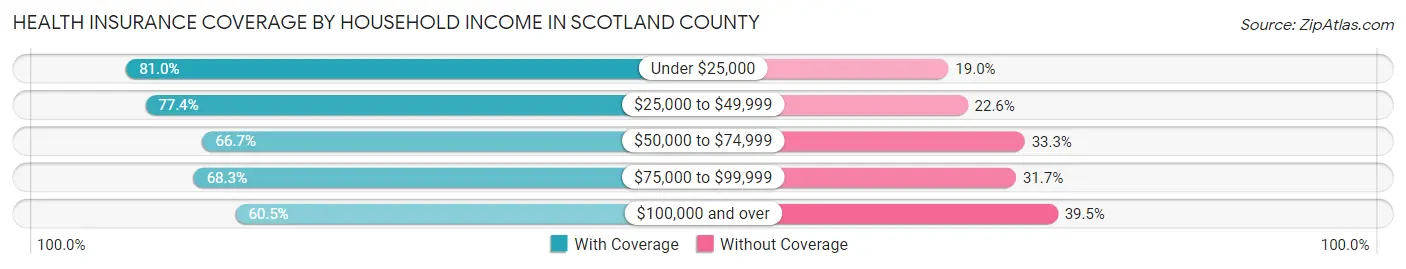
| Household Income | With Coverage | Without Coverage |
| Under $25,000 | 336 (81.0%) | 79 (19.0%) |
| $25,000 to $49,999 | 807 (77.4%) | 236 (22.6%) |
| $50,000 to $74,999 | 742 (66.7%) | 371 (33.3%) |
| $75,000 to $99,999 | 461 (68.3%) | 214 (31.7%) |
| $100,000 and over | 845 (60.5%) | 552 (39.5%) |
Public vs Private Health Insurance Coverage by Age in Scotland County
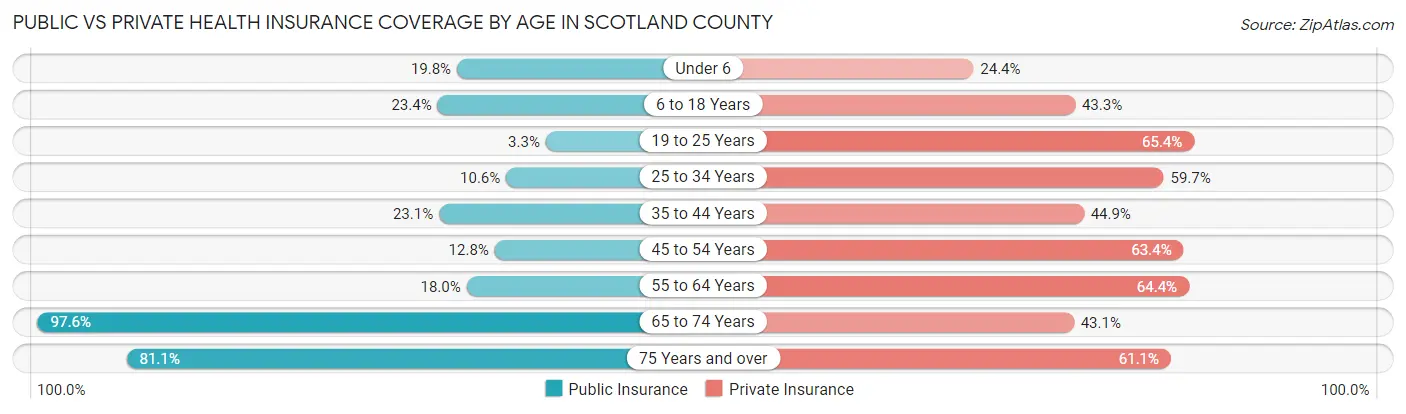
| Age Bracket | Public Insurance | Private Insurance |
| Under 6 | 93 (19.8%) | 115 (24.4%) |
| 6 to 18 Years | 231 (23.4%) | 428 (43.3%) |
| 19 to 25 Years | 12 (3.3%) | 240 (65.4%) |
| 25 to 34 Years | 53 (10.6%) | 298 (59.7%) |
| 35 to 44 Years | 147 (23.1%) | 286 (44.9%) |
| 45 to 54 Years | 38 (12.8%) | 189 (63.4%) |
| 55 to 64 Years | 104 (18.0%) | 373 (64.4%) |
| 65 to 74 Years | 442 (97.6%) | 195 (43.0%) |
| 75 Years and over | 304 (81.1%) | 229 (61.1%) |
| Total | 1,424 (30.5%) | 2,353 (50.4%) |
Disability Status by Sex by Age in Scotland County
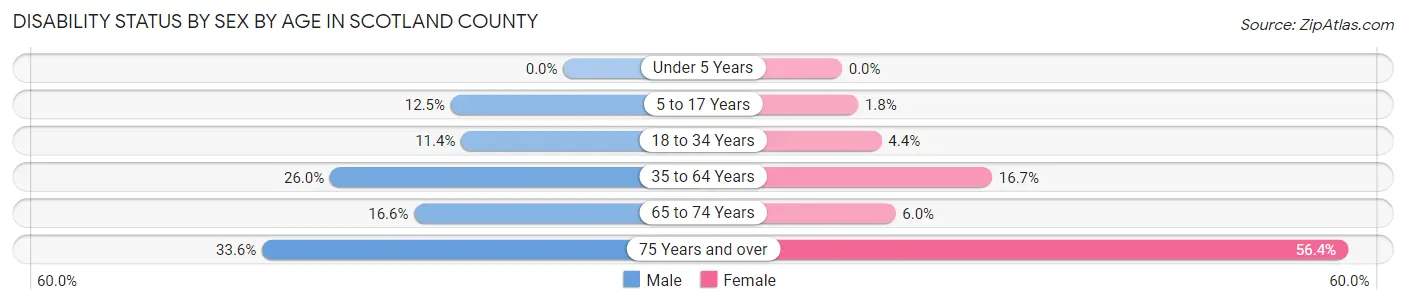
| Age Bracket | Male | Female |
| Under 5 Years | 0 (0.0%) | 0 (0.0%) |
| 5 to 17 Years | 59 (12.5%) | 10 (1.8%) |
| 18 to 34 Years | 54 (11.4%) | 20 (4.4%) |
| 35 to 64 Years | 199 (26.0%) | 125 (16.7%) |
| 65 to 74 Years | 39 (16.6%) | 13 (6.0%) |
| 75 Years and over | 52 (33.6%) | 124 (56.4%) |
Disability Class by Sex by Age in Scotland County
Disability Class: Hearing Difficulty
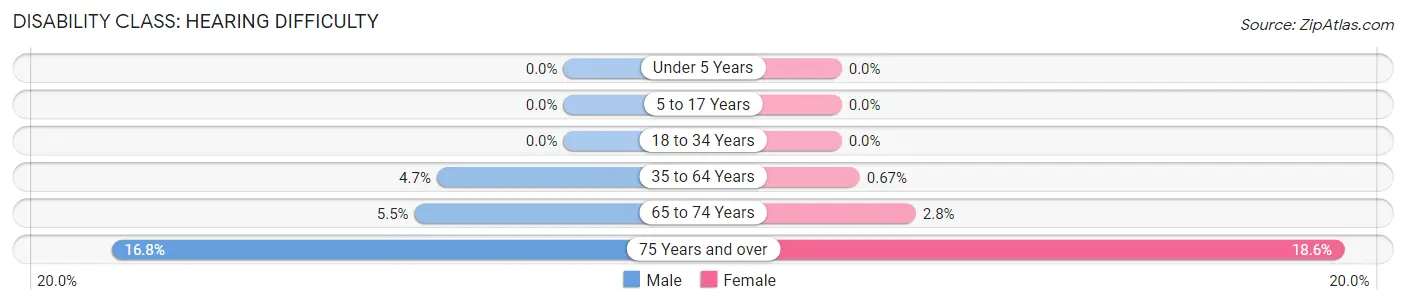
| Age Bracket | Male | Female |
| Under 5 Years | 0 (0.0%) | 0 (0.0%) |
| 5 to 17 Years | 0 (0.0%) | 0 (0.0%) |
| 18 to 34 Years | 0 (0.0%) | 0 (0.0%) |
| 35 to 64 Years | 36 (4.7%) | 5 (0.7%) |
| 65 to 74 Years | 13 (5.5%) | 6 (2.8%) |
| 75 Years and over | 26 (16.8%) | 41 (18.6%) |
Disability Class: Vision Difficulty
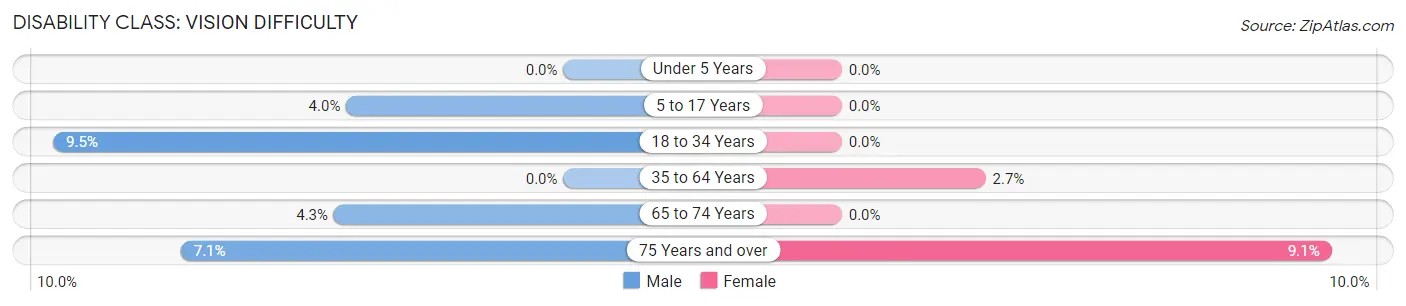
| Age Bracket | Male | Female |
| Under 5 Years | 0 (0.0%) | 0 (0.0%) |
| 5 to 17 Years | 19 (4.0%) | 0 (0.0%) |
| 18 to 34 Years | 45 (9.5%) | 0 (0.0%) |
| 35 to 64 Years | 0 (0.0%) | 20 (2.7%) |
| 65 to 74 Years | 10 (4.3%) | 0 (0.0%) |
| 75 Years and over | 11 (7.1%) | 20 (9.1%) |
Disability Class: Cognitive Difficulty
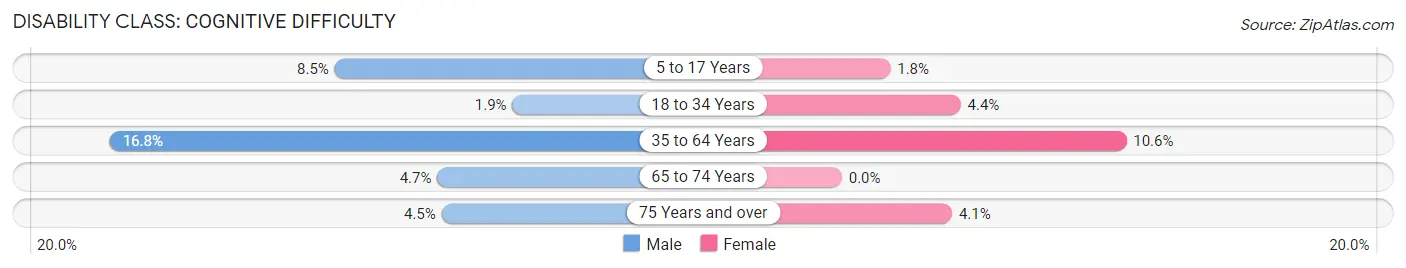
| Age Bracket | Male | Female |
| 5 to 17 Years | 40 (8.5%) | 10 (1.8%) |
| 18 to 34 Years | 9 (1.9%) | 20 (4.4%) |
| 35 to 64 Years | 129 (16.8%) | 79 (10.6%) |
| 65 to 74 Years | 11 (4.7%) | 0 (0.0%) |
| 75 Years and over | 7 (4.5%) | 9 (4.1%) |
Disability Class: Ambulatory Difficulty
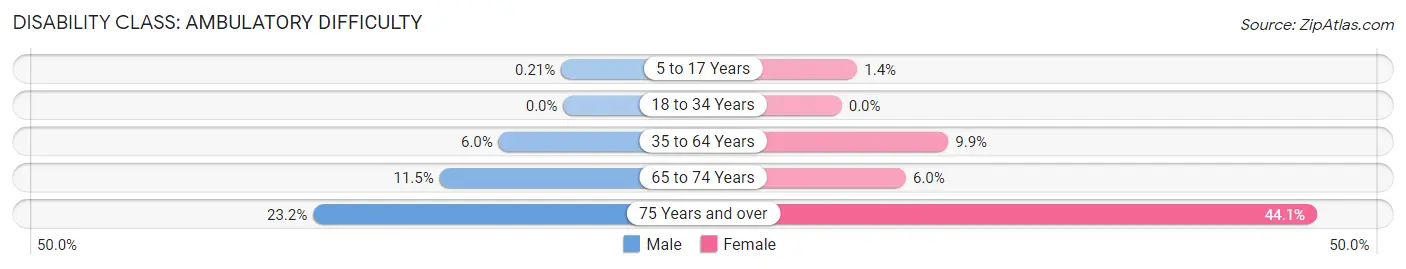
| Age Bracket | Male | Female |
| 5 to 17 Years | 1 (0.2%) | 8 (1.4%) |
| 18 to 34 Years | 0 (0.0%) | 0 (0.0%) |
| 35 to 64 Years | 46 (6.0%) | 74 (9.9%) |
| 65 to 74 Years | 27 (11.5%) | 13 (6.0%) |
| 75 Years and over | 36 (23.2%) | 97 (44.1%) |
Disability Class: Self-Care Difficulty
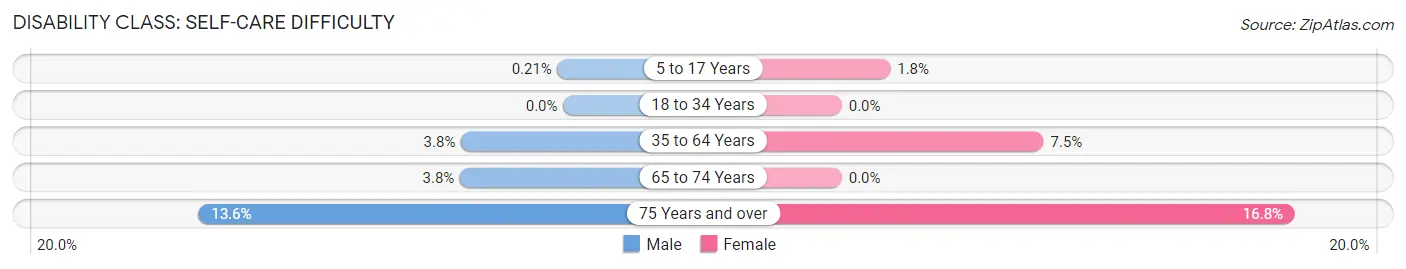
| Age Bracket | Male | Female |
| 5 to 17 Years | 1 (0.2%) | 10 (1.8%) |
| 18 to 34 Years | 0 (0.0%) | 0 (0.0%) |
| 35 to 64 Years | 29 (3.8%) | 56 (7.5%) |
| 65 to 74 Years | 9 (3.8%) | 0 (0.0%) |
| 75 Years and over | 21 (13.6%) | 37 (16.8%) |
Technology Access in Scotland County
Computing Device Access in Scotland County
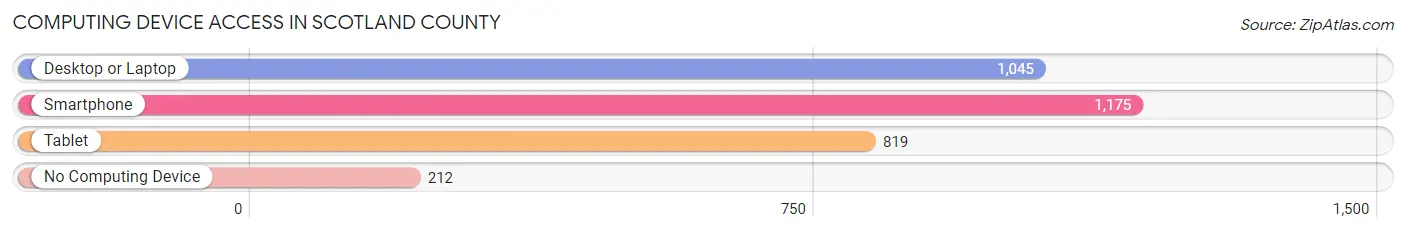
| Device Type | # Households | % Households |
| Desktop or Laptop | 1,045 | 68.4% |
| Smartphone | 1,175 | 76.9% |
| Tablet | 819 | 53.6% |
| No Computing Device | 212 | 13.9% |
| Total | 1,527 | 100.0% |
Internet Access in Scotland County
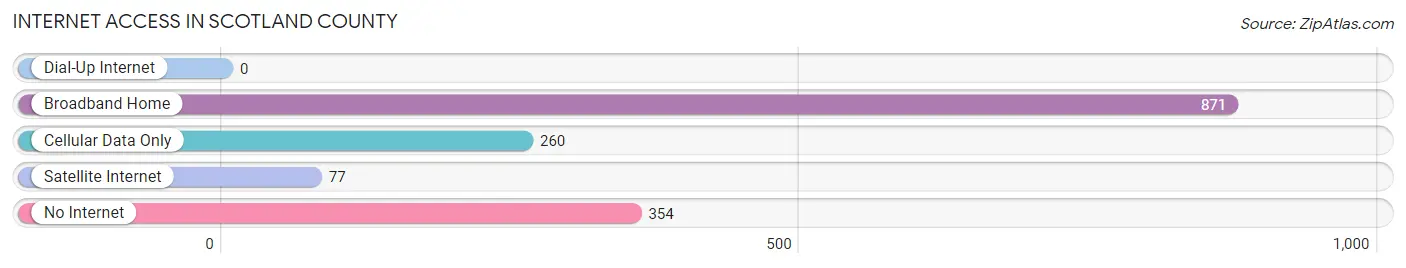
| Internet Type | # Households | % Households |
| Dial-Up Internet | 0 | 0.0% |
| Broadband Home | 871 | 57.0% |
| Cellular Data Only | 260 | 17.0% |
| Satellite Internet | 77 | 5.0% |
| No Internet | 354 | 23.2% |
| Total | 1,527 | 100.0% |
Scotland County Summary
History
Scotland County, Missouri is located in the northeast corner of the state and is bordered by Iowa and Illinois. The county was established in 1841 and was named after Scotland, a country in the United Kingdom. The county seat is Memphis, which was founded in 1841 and is the oldest town in the county.
The first settlers in Scotland County were mostly from Kentucky, Tennessee, and Virginia. They were attracted to the area by the fertile soil and abundant timber. The first industry in the county was lumbering, which was followed by farming. The county was also home to several small businesses, including a grist mill, a saw mill, and a blacksmith shop.
The county was an important stop on the Underground Railroad, which was used by escaped slaves to reach freedom in the northern states. The county was also home to several Civil War battles, including the Battle of Scotland County in 1862.
Geography
Scotland County is located in the northeast corner of Missouri and is bordered by Iowa and Illinois. The county covers an area of 576 square miles and is mostly rural. The terrain is mostly flat with some rolling hills. The highest point in the county is located in the northwest corner and is 890 feet above sea level.
The county is drained by the Fabius River, which flows through the center of the county. The county is also home to several small lakes, including Lake Scotland and Lake Shelby.
Economy
The economy of Scotland County is largely based on agriculture. The county is home to several large farms, which produce corn, soybeans, wheat, and hay. The county is also home to several small businesses, including a lumber mill, a grain elevator, and a feed mill.
The county is also home to several manufacturing companies, including a furniture factory, a plastics factory, and a metal fabrication plant. The county is also home to several small retail businesses, including grocery stores, hardware stores, and clothing stores.
Demographics
As of the 2010 census, Scotland County had a population of 4,845. The population was spread out with a median age of 41.7 years. The racial makeup of the county was 97.3% White, 0.7% African American, 0.2% Native American, 0.2% Asian, 0.1% Pacific Islander, 0.3% from other races, and 1.3% from two or more races.
The median household income in Scotland County was $37,917 and the median family income was $45,938. The per capita income was $18,945. About 11.2% of the population was below the poverty line.
Conclusion
Scotland County, Missouri is a rural county located in the northeast corner of the state. The county was established in 1841 and was named after Scotland, a country in the United Kingdom. The county is largely agricultural, with the main crops being corn, soybeans, wheat, and hay. The county is also home to several small businesses, including a lumber mill, a grain elevator, and a feed mill. The population of Scotland County was 4,845 as of the 2010 census. The median household income was $37,917 and the median family income was $45,938.
Common Questions
What is Per Capita Income in Scotland County?
Per Capita income in Scotland County is $27,808.
What is the Median Family Income in Scotland County?
Median Family Income in Scotland County is $67,835.
What is the Median Household income in Scotland County?
Median Household Income in Scotland County is $58,656.
What is Income or Wage Gap in Scotland County?
Income or Wage Gap in Scotland County is 38.9%.
Women in Scotland County earn 61.1 cents for every dollar earned by a man.
What is Family Income Deficit in Scotland County?
Family Income Deficit in Scotland County is $5,899.
Families that are below poverty line in Scotland County earn $5,899 less on average than the poverty threshold level.
What is Inequality or Gini Index in Scotland County?
Inequality or Gini Index in Scotland County is 0.46.
What is the Total Population of Scotland County?
Total Population of Scotland County is 4,720.
What is the Total Male Population of Scotland County?
Total Male Population of Scotland County is 2,304.
What is the Total Female Population of Scotland County?
Total Female Population of Scotland County is 2,416.
What is the Ratio of Males per 100 Females in Scotland County?
There are 95.36 Males per 100 Females in Scotland County.
What is the Ratio of Females per 100 Males in Scotland County?
There are 104.86 Females per 100 Males in Scotland County.
What is the Median Population Age in Scotland County?
Median Population Age in Scotland County is 36.0 Years.
What is the Average Family Size in Scotland County
Average Family Size in Scotland County is 3.9 People.
What is the Average Household Size in Scotland County
Average Household Size in Scotland County is 3.0 People.
How Large is the Labor Force in Scotland County?
There are 1,957 People in the Labor Forcein in Scotland County.
What is the Percentage of People in the Labor Force in Scotland County?
56.9% of People are in the Labor Force in Scotland County.
What is the Unemployment Rate in Scotland County?
Unemployment Rate in Scotland County is 1.2%.