Schuyler County, MO Map & Demographics
Schuyler County Map
Schuyler County Overview
$22,625
PER CAPITA INCOME
$61,167
AVG FAMILY INCOME
$53,728
AVG HOUSEHOLD INCOME
31.0%
WAGE / INCOME GAP [ % ]
69.0¢/ $1
WAGE / INCOME GAP [ $ ]
$5,058
FAMILY INCOME DEFICIT
0.38
INEQUALITY / GINI INDEX
4,066
TOTAL POPULATION
2,011
MALE POPULATION
2,055
FEMALE POPULATION
97.86
MALES / 100 FEMALES
102.19
FEMALES / 100 MALES
39.4
MEDIAN AGE
4.3
AVG FAMILY SIZE
3.2
AVG HOUSEHOLD SIZE
1,644
LABOR FORCE [ PEOPLE ]
52.7%
PERCENT IN LABOR FORCE
2.3%
UNEMPLOYMENT RATE
Schuyler County Area Codes
Income in Schuyler County
Income Overview in Schuyler County
Per Capita Income in Schuyler County is $22,625, while median incomes of families and households are $61,167 and $53,728 respectively.
| Characteristic | Number | Measure |
| Per Capita Income | 4,066 | $22,625 |
| Median Family Income | 800 | $61,167 |
| Mean Family Income | 800 | $75,315 |
| Median Household Income | 1,264 | $53,728 |
| Mean Household Income | 1,264 | $61,438 |
| Income Deficit | 800 | $5,058 |
| Wage / Income Gap (%) | 4,066 | 31.01% |
| Wage / Income Gap ($) | 4,066 | 68.99¢ per $1 |
| Gini / Inequality Index | 4,066 | 0.38 |
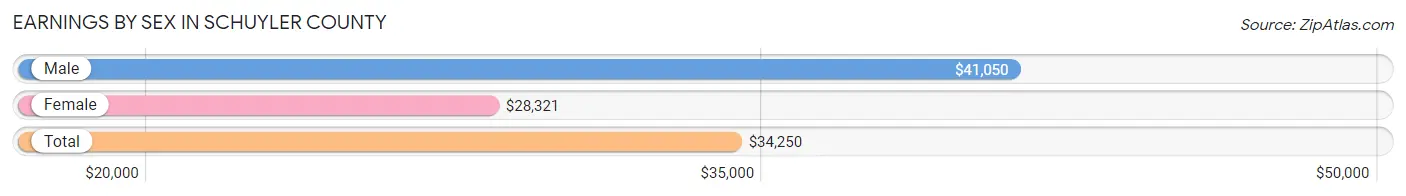
Earnings by Sex in Schuyler County
Average Earnings in Schuyler County are $34,250, $41,050 for men and $28,321 for women, a difference of 31.0%.
| Sex | Number | Average Earnings |
| Male | 869 (49.8%) | $41,050 |
| Female | 876 (50.2%) | $28,321 |
| Total | 1,745 (100.0%) | $34,250 |
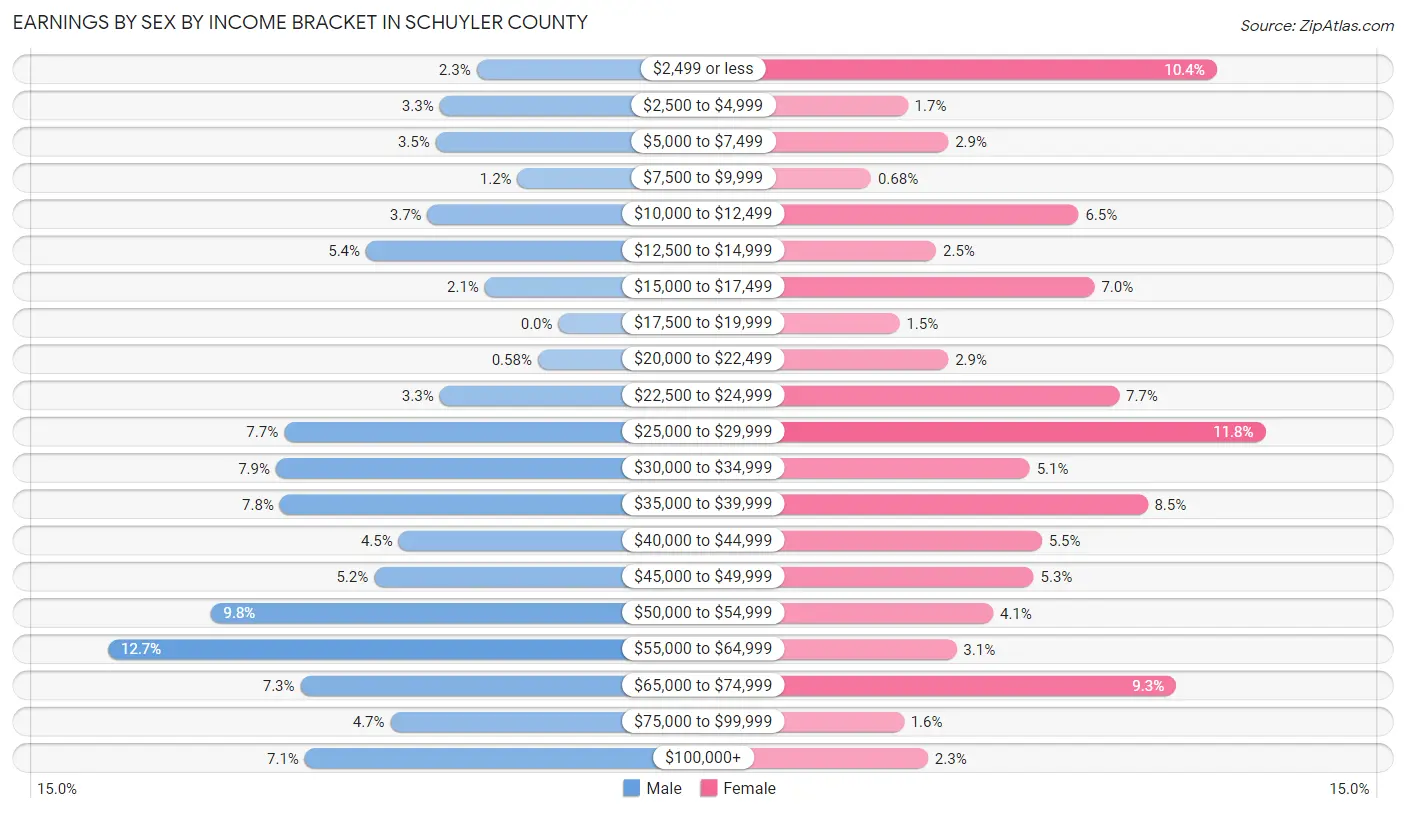
Earnings by Sex by Income Bracket in Schuyler County
The most common earnings brackets in Schuyler County are $55,000 to $64,999 for men (110 | 12.7%) and $25,000 to $29,999 for women (103 | 11.8%).
| Income | Male | Female |
| $2,499 or less | 20 (2.3%) | 91 (10.4%) |
| $2,500 to $4,999 | 29 (3.3%) | 15 (1.7%) |
| $5,000 to $7,499 | 30 (3.5%) | 25 (2.9%) |
| $7,500 to $9,999 | 10 (1.1%) | 6 (0.7%) |
| $10,000 to $12,499 | 32 (3.7%) | 57 (6.5%) |
| $12,500 to $14,999 | 47 (5.4%) | 22 (2.5%) |
| $15,000 to $17,499 | 18 (2.1%) | 61 (7.0%) |
| $17,500 to $19,999 | 0 (0.0%) | 13 (1.5%) |
| $20,000 to $22,499 | 5 (0.6%) | 25 (2.9%) |
| $22,500 to $24,999 | 29 (3.3%) | 67 (7.6%) |
| $25,000 to $29,999 | 67 (7.7%) | 103 (11.8%) |
| $30,000 to $34,999 | 69 (7.9%) | 45 (5.1%) |
| $35,000 to $39,999 | 68 (7.8%) | 74 (8.5%) |
| $40,000 to $44,999 | 39 (4.5%) | 48 (5.5%) |
| $45,000 to $49,999 | 45 (5.2%) | 46 (5.2%) |
| $50,000 to $54,999 | 85 (9.8%) | 36 (4.1%) |
| $55,000 to $64,999 | 110 (12.7%) | 27 (3.1%) |
| $65,000 to $74,999 | 63 (7.2%) | 81 (9.2%) |
| $75,000 to $99,999 | 41 (4.7%) | 14 (1.6%) |
| $100,000+ | 62 (7.1%) | 20 (2.3%) |
| Total | 869 (100.0%) | 876 (100.0%) |
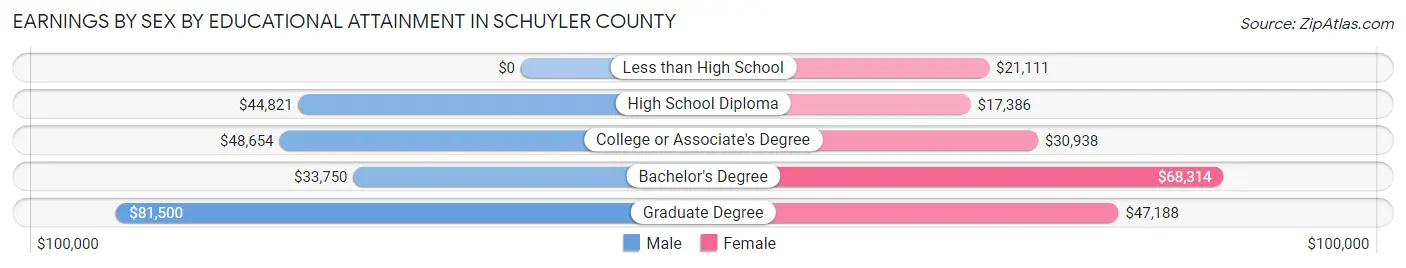
Earnings by Sex by Educational Attainment in Schuyler County
Average earnings in Schuyler County are $46,324 for men and $28,875 for women, a difference of 37.7%. Men with an educational attainment of graduate degree enjoy the highest average annual earnings of $81,500, while those with bachelor's degree education earn the least with $33,750. Women with an educational attainment of bachelor's degree earn the most with the average annual earnings of $68,314, while those with high school diploma education have the smallest earnings of $17,386.
| Educational Attainment | Male Income | Female Income |
| Less than High School | - | - |
| High School Diploma | $44,821 | $17,386 |
| College or Associate's Degree | $48,654 | $30,938 |
| Bachelor's Degree | $33,750 | $68,314 |
| Graduate Degree | $81,500 | $47,188 |
| Total | $46,324 | $28,875 |
Family Income in Schuyler County
Family Income Brackets in Schuyler County
According to the Schuyler County family income data, there are 248 families falling into the $50,000 to $74,999 income range, which is the most common income bracket and makes up 31.0% of all families. Conversely, the less than $10,000 income bracket is the least frequent group with only 4 families (0.5%) belonging to this category.
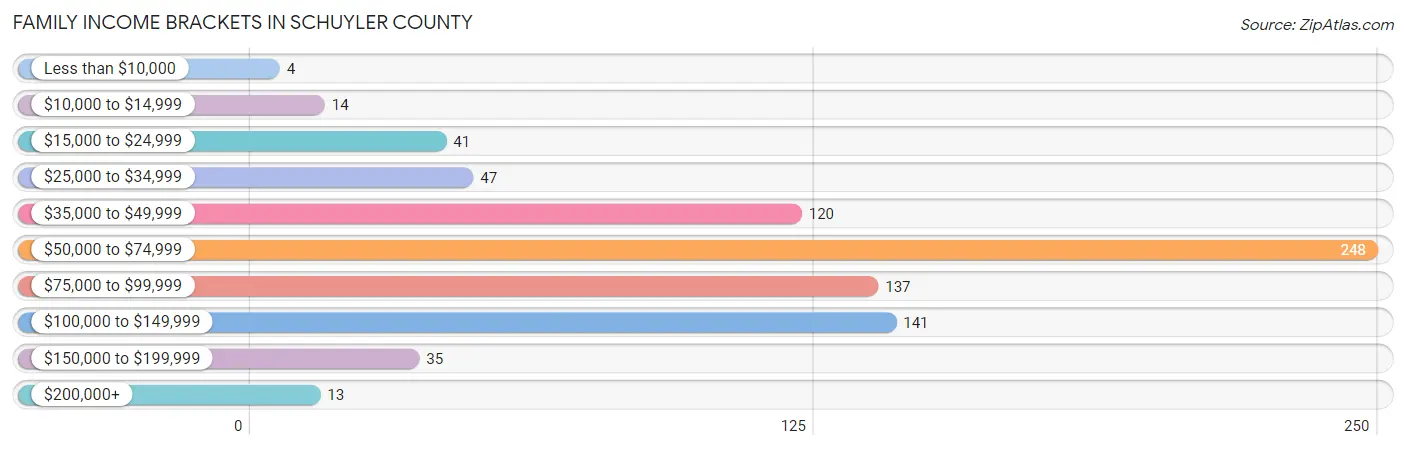
| Income Bracket | # Families | % Families |
| Less than $10,000 | 4 | 0.5% |
| $10,000 to $14,999 | 14 | 1.8% |
| $15,000 to $24,999 | 41 | 5.1% |
| $25,000 to $34,999 | 47 | 5.9% |
| $35,000 to $49,999 | 120 | 15.0% |
| $50,000 to $74,999 | 248 | 31.0% |
| $75,000 to $99,999 | 137 | 17.1% |
| $100,000 to $149,999 | 141 | 17.6% |
| $150,000 to $199,999 | 35 | 4.4% |
| $200,000+ | 13 | 1.6% |
Family Income by Famaliy Size in Schuyler County
6-person families (33 | 4.1%) account for the highest median family income in Schuyler County with $105,536 per family, while 2-person families (448 | 56.0%) have the highest median income of $27,314 per family member.
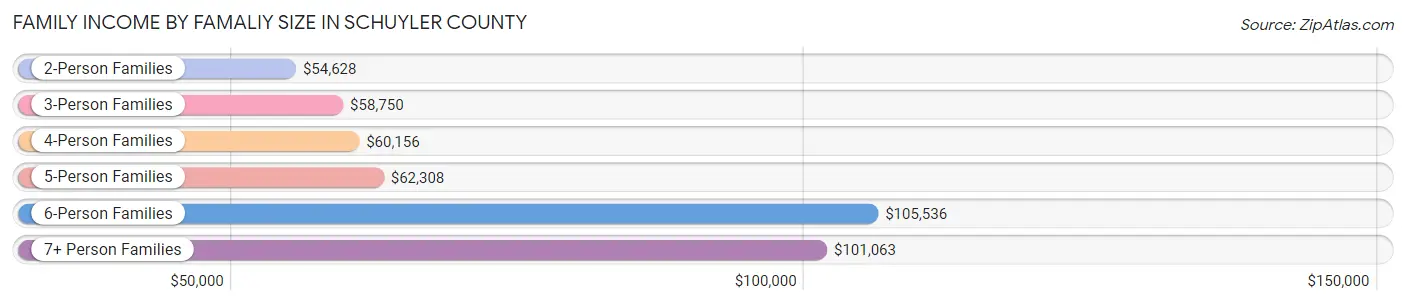
| Income Bracket | # Families | Median Income |
| 2-Person Families | 448 (56.0%) | $54,628 |
| 3-Person Families | 127 (15.9%) | $58,750 |
| 4-Person Families | 91 (11.4%) | $60,156 |
| 5-Person Families | 74 (9.2%) | $62,308 |
| 6-Person Families | 33 (4.1%) | $105,536 |
| 7+ Person Families | 27 (3.4%) | $101,063 |
| Total | 800 (100.0%) | $61,167 |
Family Income by Number of Earners in Schuyler County
The median family income in Schuyler County is $61,167, with families comprising 3+ earners (32) having the highest median family income of $126,667, while families with no earners (139) have the lowest median family income of $41,250, accounting for 4.0% and 17.4% of families, respectively.
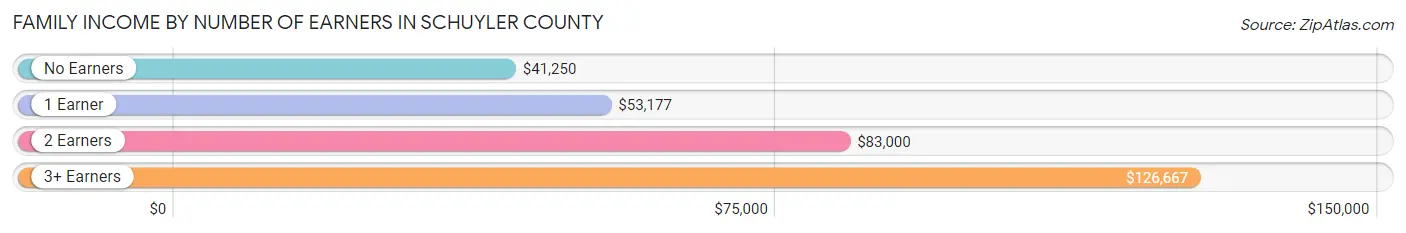
| Number of Earners | # Families | Median Income |
| No Earners | 139 (17.4%) | $41,250 |
| 1 Earner | 249 (31.1%) | $53,177 |
| 2 Earners | 380 (47.5%) | $83,000 |
| 3+ Earners | 32 (4.0%) | $126,667 |
| Total | 800 (100.0%) | $61,167 |
Household Income in Schuyler County
Household Income Brackets in Schuyler County
With 324 households falling in the category, the $50,000 to $74,999 income range is the most frequent in Schuyler County, accounting for 25.6% of all households. In contrast, only 13 households (1.0%) fall into the $200,000+ income bracket, making it the least populous group.
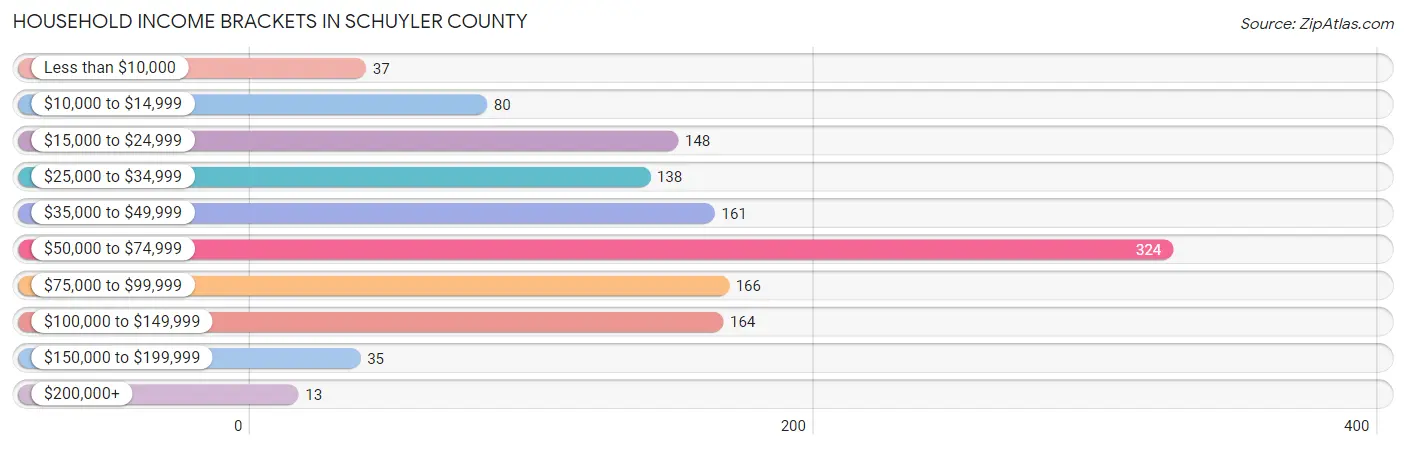
| Income Bracket | # Households | % Households |
| Less than $10,000 | 37 | 2.9% |
| $10,000 to $14,999 | 80 | 6.3% |
| $15,000 to $24,999 | 148 | 11.7% |
| $25,000 to $34,999 | 138 | 10.9% |
| $35,000 to $49,999 | 161 | 12.7% |
| $50,000 to $74,999 | 324 | 25.6% |
| $75,000 to $99,999 | 166 | 13.1% |
| $100,000 to $149,999 | 164 | 13.0% |
| $150,000 to $199,999 | 35 | 2.8% |
| $200,000+ | 13 | 1.0% |
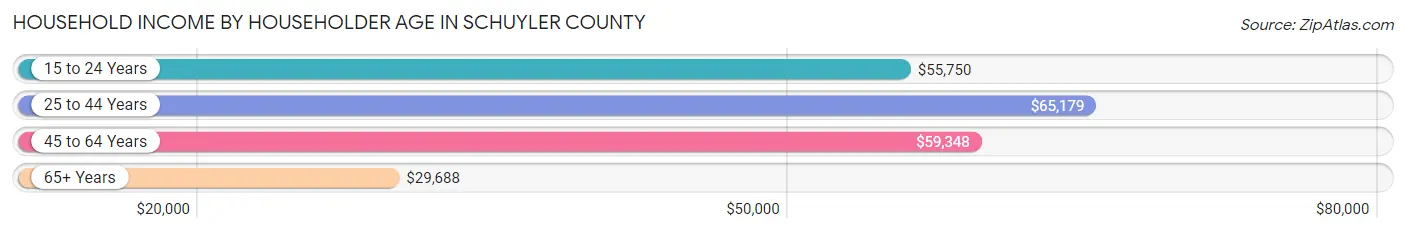
Household Income by Householder Age in Schuyler County
The median household income in Schuyler County is $53,728, with the highest median household income of $65,179 found in the 25 to 44 years age bracket for the primary householder. A total of 305 households (24.1%) fall into this category. Meanwhile, the 65+ years age bracket for the primary householder has the lowest median household income of $29,688, with 420 households (33.2%) in this group.
| Income Bracket | # Households | Median Income |
| 15 to 24 Years | 25 (2.0%) | $55,750 |
| 25 to 44 Years | 305 (24.1%) | $65,179 |
| 45 to 64 Years | 514 (40.7%) | $59,348 |
| 65+ Years | 420 (33.2%) | $29,688 |
| Total | 1,264 (100.0%) | $53,728 |
Poverty in Schuyler County
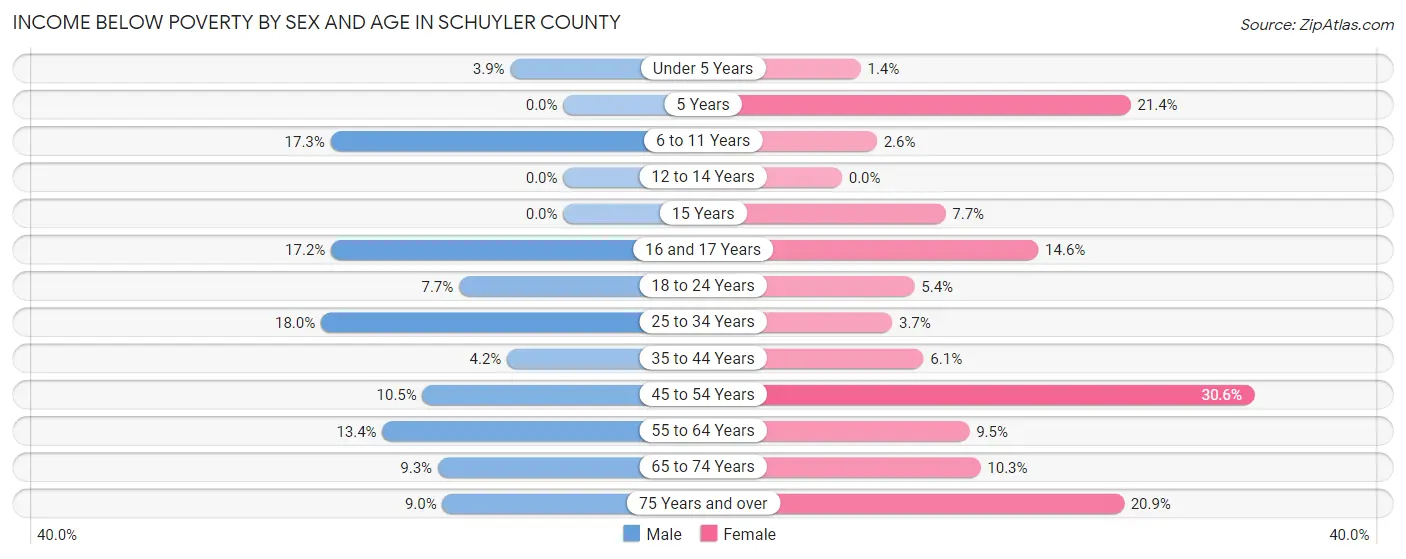
Income Below Poverty by Sex and Age in Schuyler County
With 10.2% poverty level for males and 10.3% for females among the residents of Schuyler County, 25 to 34 year old males and 45 to 54 year old females are the most vulnerable to poverty, with 43 males (18.0%) and 67 females (30.6%) in their respective age groups living below the poverty level.
| Age Bracket | Male | Female |
| Under 5 Years | 7 (3.9%) | 2 (1.4%) |
| 5 Years | 0 (0.0%) | 3 (21.4%) |
| 6 to 11 Years | 28 (17.3%) | 6 (2.6%) |
| 12 to 14 Years | 0 (0.0%) | 0 (0.0%) |
| 15 Years | 0 (0.0%) | 2 (7.7%) |
| 16 and 17 Years | 10 (17.2%) | 7 (14.6%) |
| 18 to 24 Years | 13 (7.7%) | 9 (5.4%) |
| 25 to 34 Years | 43 (18.0%) | 9 (3.7%) |
| 35 to 44 Years | 8 (4.2%) | 12 (6.1%) |
| 45 to 54 Years | 23 (10.4%) | 67 (30.6%) |
| 55 to 64 Years | 38 (13.4%) | 28 (9.5%) |
| 65 to 74 Years | 19 (9.3%) | 21 (10.3%) |
| 75 Years and over | 14 (9.0%) | 45 (20.9%) |
| Total | 203 (10.2%) | 211 (10.3%) |
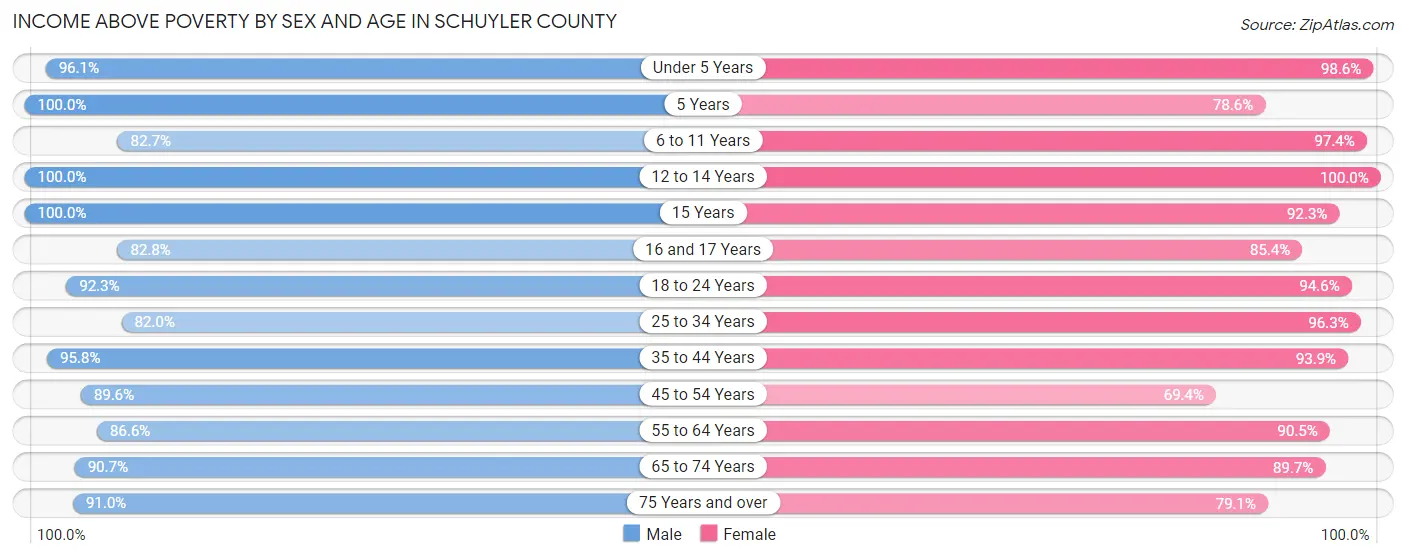
Income Above Poverty by Sex and Age in Schuyler County
According to the poverty statistics in Schuyler County, males aged 5 years and females aged 12 to 14 years are the age groups that are most secure financially, with 100.0% of males and 100.0% of females in these age groups living above the poverty line.
| Age Bracket | Male | Female |
| Under 5 Years | 171 (96.1%) | 142 (98.6%) |
| 5 Years | 61 (100.0%) | 11 (78.6%) |
| 6 to 11 Years | 134 (82.7%) | 226 (97.4%) |
| 12 to 14 Years | 55 (100.0%) | 51 (100.0%) |
| 15 Years | 24 (100.0%) | 24 (92.3%) |
| 16 and 17 Years | 48 (82.8%) | 41 (85.4%) |
| 18 to 24 Years | 155 (92.3%) | 158 (94.6%) |
| 25 to 34 Years | 196 (82.0%) | 232 (96.3%) |
| 35 to 44 Years | 184 (95.8%) | 186 (93.9%) |
| 45 to 54 Years | 197 (89.5%) | 152 (69.4%) |
| 55 to 64 Years | 245 (86.6%) | 268 (90.5%) |
| 65 to 74 Years | 185 (90.7%) | 183 (89.7%) |
| 75 Years and over | 142 (91.0%) | 170 (79.1%) |
| Total | 1,797 (89.8%) | 1,844 (89.7%) |
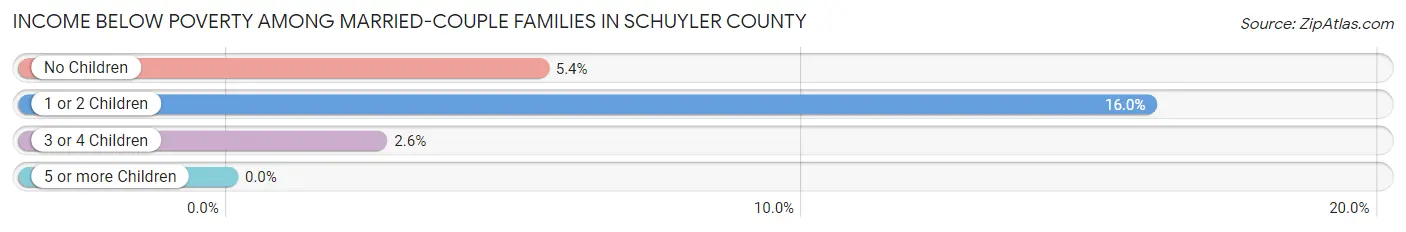
Income Below Poverty Among Married-Couple Families in Schuyler County
The poverty statistics for married-couple families in Schuyler County show that 7.2% or 50 of the total 698 families live below the poverty line. Families with 1 or 2 children have the highest poverty rate of 16.0%, comprising of 24 families. On the other hand, families with 5 or more children have the lowest poverty rate of 0.0%, which includes 0 families.
| Children | Above Poverty | Below Poverty |
| No Children | 420 (94.6%) | 24 (5.4%) |
| 1 or 2 Children | 126 (84.0%) | 24 (16.0%) |
| 3 or 4 Children | 75 (97.4%) | 2 (2.6%) |
| 5 or more Children | 27 (100.0%) | 0 (0.0%) |
| Total | 648 (92.8%) | 50 (7.2%) |
Income Below Poverty Among Single-Parent Households in Schuyler County
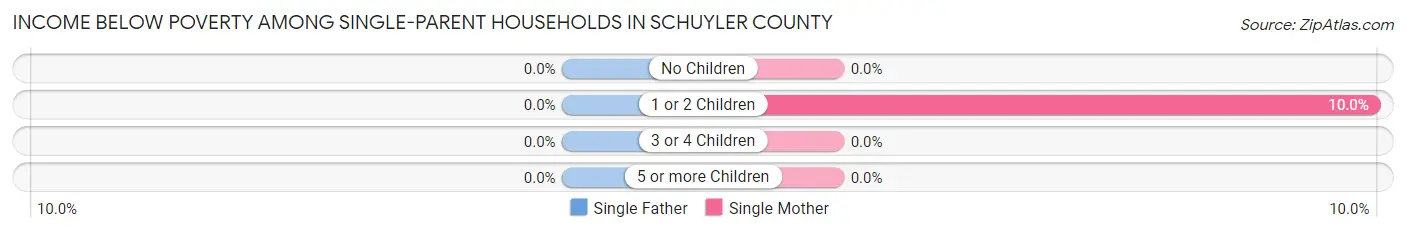
| Children | Single Father | Single Mother |
| No Children | 0 (0.0%) | 0 (0.0%) |
| 1 or 2 Children | 0 (0.0%) | 3 (10.0%) |
| 3 or 4 Children | 0 (0.0%) | 0 (0.0%) |
| 5 or more Children | 0 (0.0%) | 0 (0.0%) |
| Total | 0 (0.0%) | 3 (5.4%) |
Income Below Poverty Among Married-Couple vs Single-Parent Households in Schuyler County
The poverty data for Schuyler County shows that 50 of the married-couple family households (7.2%) and 3 of the single-parent households (2.9%) are living below the poverty level. Within the married-couple family households, those with 1 or 2 children have the highest poverty rate, with 24 households (16.0%) falling below the poverty line. Among the single-parent households, those with 1 or 2 children have the highest poverty rate, with 3 household (4.0%) living below poverty.
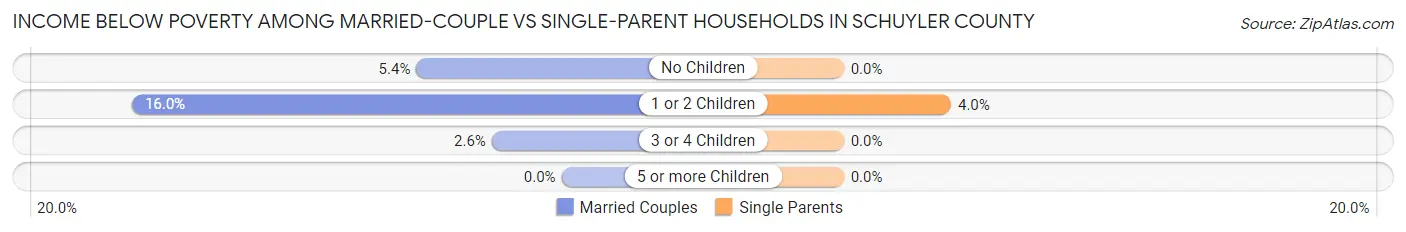
| Children | Married-Couple Families | Single-Parent Households |
| No Children | 24 (5.4%) | 0 (0.0%) |
| 1 or 2 Children | 24 (16.0%) | 3 (4.0%) |
| 3 or 4 Children | 2 (2.6%) | 0 (0.0%) |
| 5 or more Children | 0 (0.0%) | 0 (0.0%) |
| Total | 50 (7.2%) | 3 (2.9%) |
Race in Schuyler County
The most populous races in Schuyler County are White / Caucasian (3,879 | 95.4%), Two or more Races (113 | 2.8%), and Hispanic or Latino (52 | 1.3%).
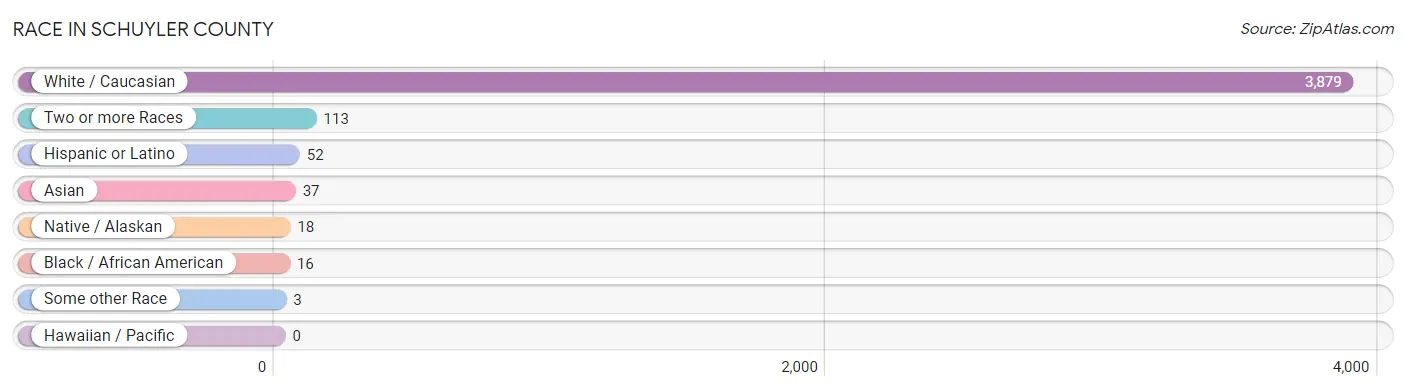
| Race | # Population | % Population |
| Asian | 37 | 0.9% |
| Black / African American | 16 | 0.4% |
| Hawaiian / Pacific | 0 | 0.0% |
| Hispanic or Latino | 52 | 1.3% |
| Native / Alaskan | 18 | 0.4% |
| White / Caucasian | 3,879 | 95.4% |
| Two or more Races | 113 | 2.8% |
| Some other Race | 3 | 0.1% |
| Total | 4,066 | 100.0% |
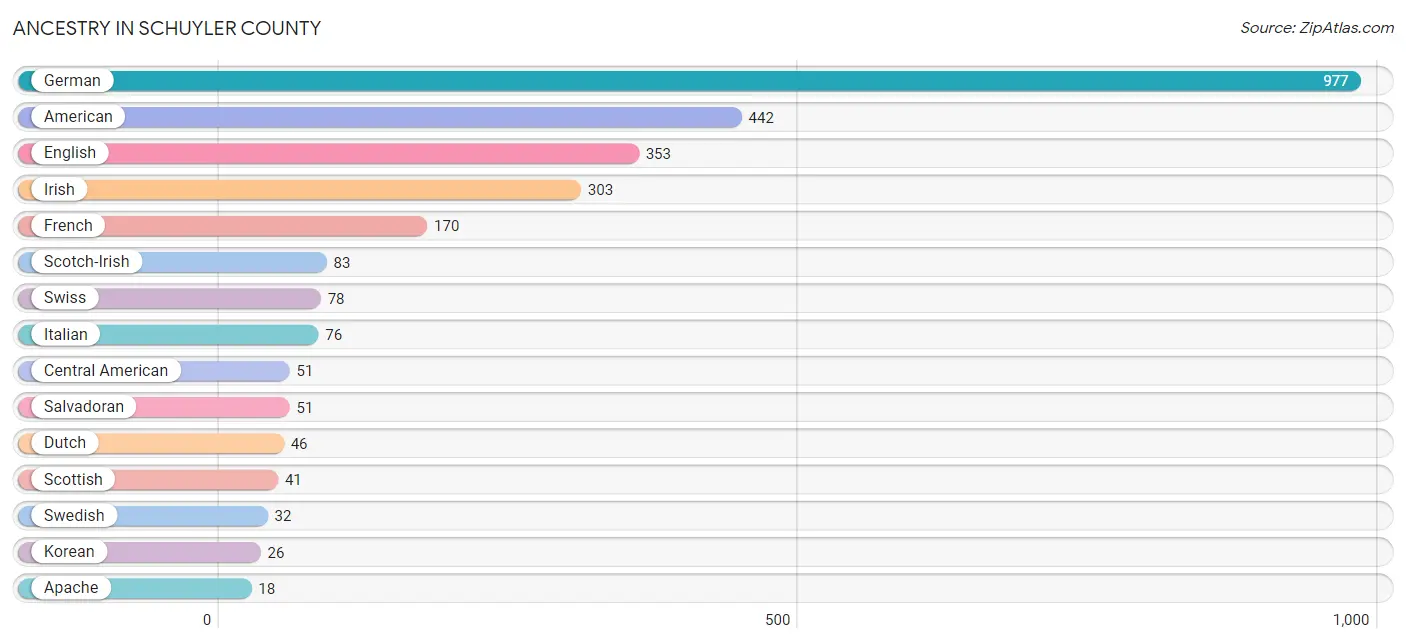
Ancestry in Schuyler County
The most populous ancestries reported in Schuyler County are German (977 | 24.0%), American (442 | 10.9%), English (353 | 8.7%), Irish (303 | 7.4%), and French (170 | 4.2%), together accounting for 55.2% of all Schuyler County residents.
| Ancestry | # Population | % Population |
| African | 1 | 0.0% |
| American | 442 | 10.9% |
| Apache | 18 | 0.4% |
| British | 14 | 0.3% |
| Canadian | 2 | 0.1% |
| Central American | 51 | 1.3% |
| Cherokee | 6 | 0.2% |
| Creek | 3 | 0.1% |
| Croatian | 1 | 0.0% |
| Czech | 3 | 0.1% |
| Danish | 4 | 0.1% |
| Dutch | 46 | 1.1% |
| Eastern European | 3 | 0.1% |
| English | 353 | 8.7% |
| European | 15 | 0.4% |
| French | 170 | 4.2% |
| French Canadian | 1 | 0.0% |
| German | 977 | 24.0% |
| Hungarian | 6 | 0.2% |
| Indian (Asian) | 1 | 0.0% |
| Irish | 303 | 7.4% |
| Iroquois | 6 | 0.2% |
| Italian | 76 | 1.9% |
| Korean | 26 | 0.6% |
| Mexican | 1 | 0.0% |
| Native Hawaiian | 1 | 0.0% |
| Norwegian | 13 | 0.3% |
| Polish | 7 | 0.2% |
| Salvadoran | 51 | 1.3% |
| Scandinavian | 4 | 0.1% |
| Scotch-Irish | 83 | 2.0% |
| Scottish | 41 | 1.0% |
| Seminole | 6 | 0.2% |
| Sioux | 6 | 0.2% |
| Sri Lankan | 11 | 0.3% |
| Subsaharan African | 5 | 0.1% |
| Swedish | 32 | 0.8% |
| Swiss | 78 | 1.9% |
| Welsh | 6 | 0.2% | View All 39 Rows |
Immigrants in Schuyler County
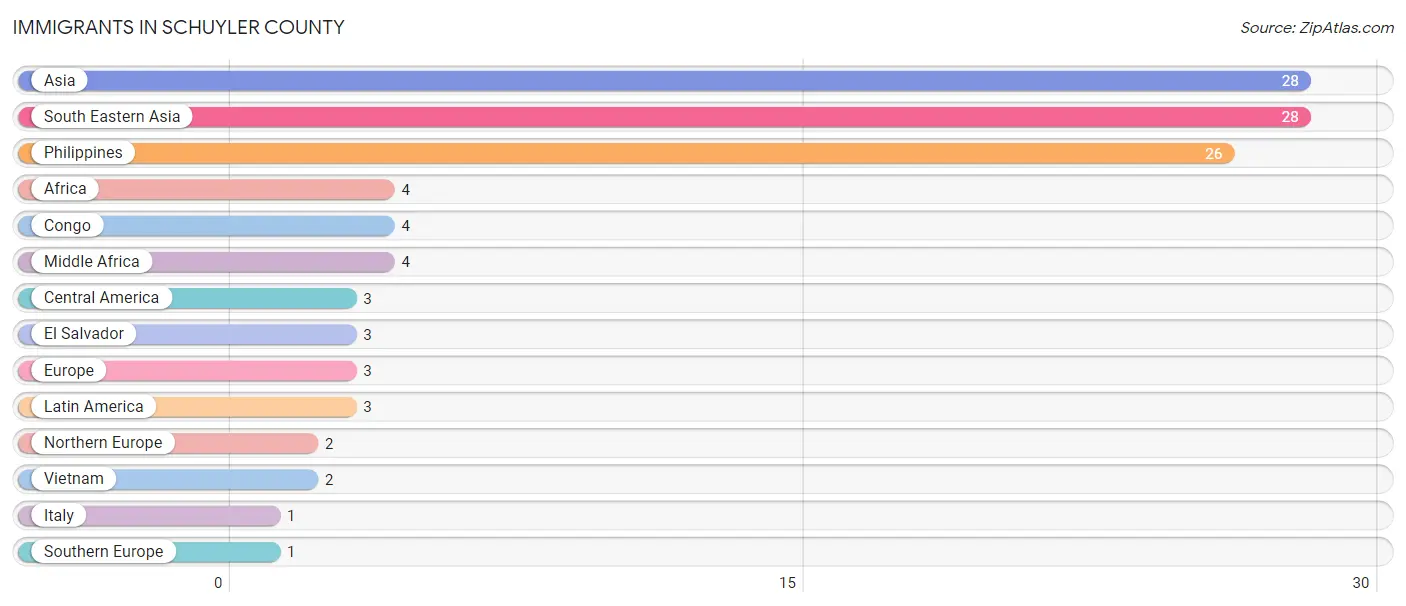
The most numerous immigrant groups reported in Schuyler County came from Asia (28 | 0.7%), South Eastern Asia (28 | 0.7%), Philippines (26 | 0.6%), Africa (4 | 0.1%), and Congo (4 | 0.1%), together accounting for 2.2% of all Schuyler County residents.
| Immigration Origin | # Population | % Population |
| Africa | 4 | 0.1% |
| Asia | 28 | 0.7% |
| Central America | 3 | 0.1% |
| Congo | 4 | 0.1% |
| El Salvador | 3 | 0.1% |
| Europe | 3 | 0.1% |
| Italy | 1 | 0.0% |
| Latin America | 3 | 0.1% |
| Middle Africa | 4 | 0.1% |
| Northern Europe | 2 | 0.1% |
| Philippines | 26 | 0.6% |
| South Eastern Asia | 28 | 0.7% |
| Southern Europe | 1 | 0.0% |
| Vietnam | 2 | 0.1% | View All 14 Rows |
Sex and Age in Schuyler County
Sex and Age in Schuyler County
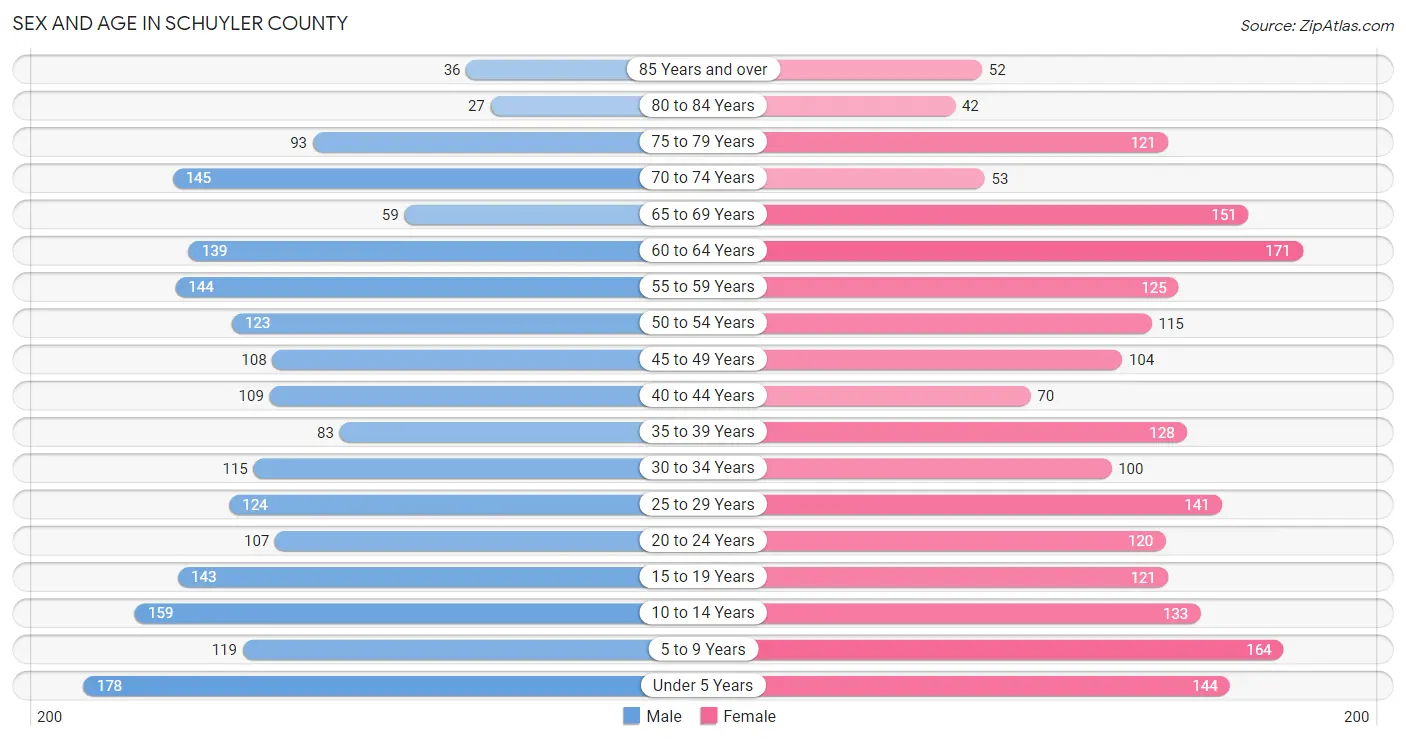
The most populous age groups in Schuyler County are Under 5 Years (178 | 8.8%) for men and 60 to 64 Years (171 | 8.3%) for women.
| Age Bracket | Male | Female |
| Under 5 Years | 178 (8.8%) | 144 (7.0%) |
| 5 to 9 Years | 119 (5.9%) | 164 (8.0%) |
| 10 to 14 Years | 159 (7.9%) | 133 (6.5%) |
| 15 to 19 Years | 143 (7.1%) | 121 (5.9%) |
| 20 to 24 Years | 107 (5.3%) | 120 (5.8%) |
| 25 to 29 Years | 124 (6.2%) | 141 (6.9%) |
| 30 to 34 Years | 115 (5.7%) | 100 (4.9%) |
| 35 to 39 Years | 83 (4.1%) | 128 (6.2%) |
| 40 to 44 Years | 109 (5.4%) | 70 (3.4%) |
| 45 to 49 Years | 108 (5.4%) | 104 (5.1%) |
| 50 to 54 Years | 123 (6.1%) | 115 (5.6%) |
| 55 to 59 Years | 144 (7.2%) | 125 (6.1%) |
| 60 to 64 Years | 139 (6.9%) | 171 (8.3%) |
| 65 to 69 Years | 59 (2.9%) | 151 (7.3%) |
| 70 to 74 Years | 145 (7.2%) | 53 (2.6%) |
| 75 to 79 Years | 93 (4.6%) | 121 (5.9%) |
| 80 to 84 Years | 27 (1.3%) | 42 (2.0%) |
| 85 Years and over | 36 (1.8%) | 52 (2.5%) |
| Total | 2,011 (100.0%) | 2,055 (100.0%) |
Families and Households in Schuyler County
Median Family Size in Schuyler County
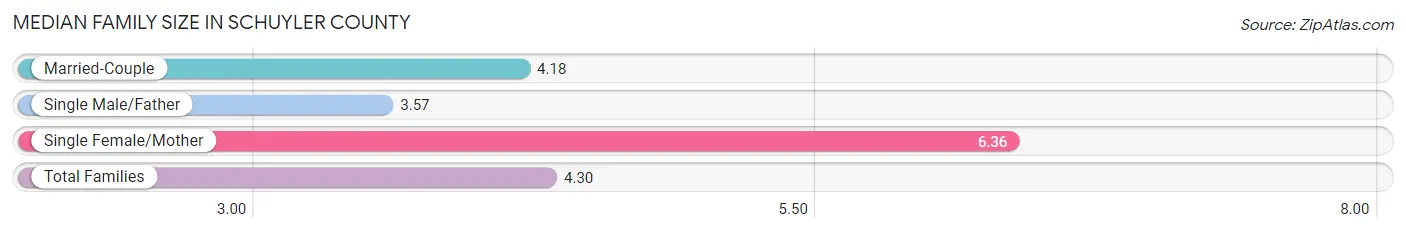
The median family size in Schuyler County is 4.30 persons per family, with single female/mother families (56 | 7.0%) accounting for the largest median family size of 6.36 persons per family. On the other hand, single male/father families (46 | 5.8%) represent the smallest median family size with 3.57 persons per family.
| Family Type | # Families | Family Size |
| Married-Couple | 698 (87.3%) | 4.18 |
| Single Male/Father | 46 (5.8%) | 3.57 |
| Single Female/Mother | 56 (7.0%) | 6.36 |
| Total Families | 800 (100.0%) | 4.30 |
Median Household Size in Schuyler County
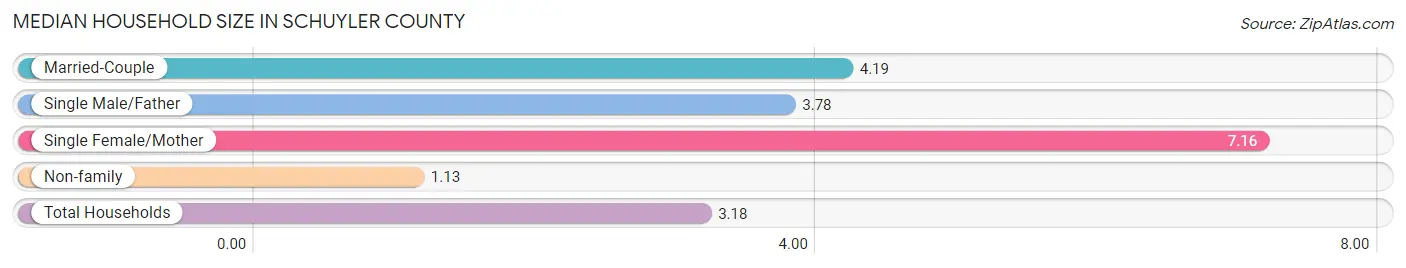
The median household size in Schuyler County is 3.18 persons per household, with single female/mother households (56 | 4.4%) accounting for the largest median household size of 7.16 persons per household. non-family households (464 | 36.7%) represent the smallest median household size with 1.13 persons per household.
| Household Type | # Households | Household Size |
| Married-Couple | 698 (55.2%) | 4.19 |
| Single Male/Father | 46 (3.6%) | 3.78 |
| Single Female/Mother | 56 (4.4%) | 7.16 |
| Non-family | 464 (36.7%) | 1.13 |
| Total Households | 1,264 (100.0%) | 3.18 |
Household Size by Marriage Status in Schuyler County
Out of a total of 1,264 households in Schuyler County, 800 (63.3%) are family households, while 464 (36.7%) are nonfamily households. The most numerous type of family households are 2-person households, comprising 433, and the most common type of nonfamily households are 1-person households, comprising 421.
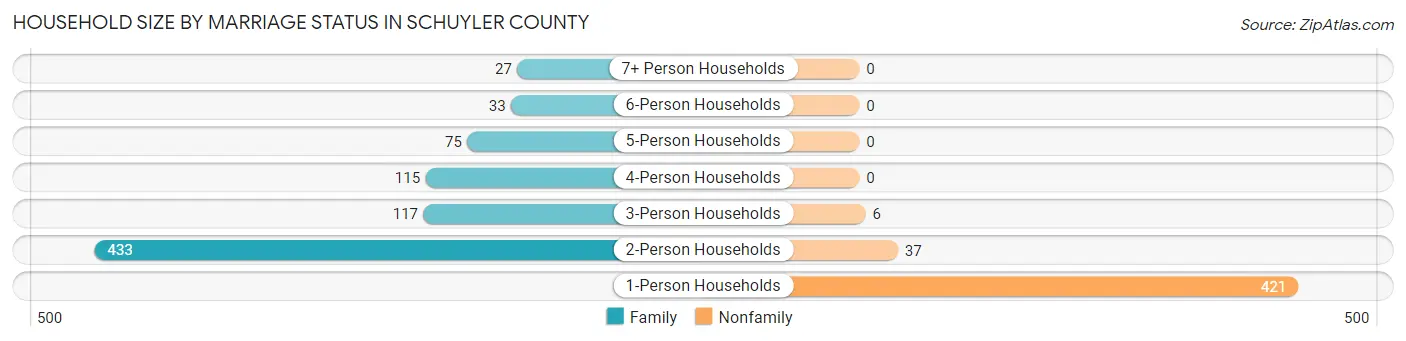
| Household Size | Family Households | Nonfamily Households |
| 1-Person Households | - | 421 (33.3%) |
| 2-Person Households | 433 (34.3%) | 37 (2.9%) |
| 3-Person Households | 117 (9.3%) | 6 (0.5%) |
| 4-Person Households | 115 (9.1%) | 0 (0.0%) |
| 5-Person Households | 75 (5.9%) | 0 (0.0%) |
| 6-Person Households | 33 (2.6%) | 0 (0.0%) |
| 7+ Person Households | 27 (2.1%) | 0 (0.0%) |
| Total | 800 (63.3%) | 464 (36.7%) |
Female Fertility in Schuyler County
Fertility by Age in Schuyler County
Average fertility rate in Schuyler County is 35.0 births per 1,000 women. Women in the age bracket of 20 to 34 years have the highest fertility rate with 72.0 births per 1,000 women. Women in the age bracket of 20 to 34 years acount for 89.7% of all women with births.
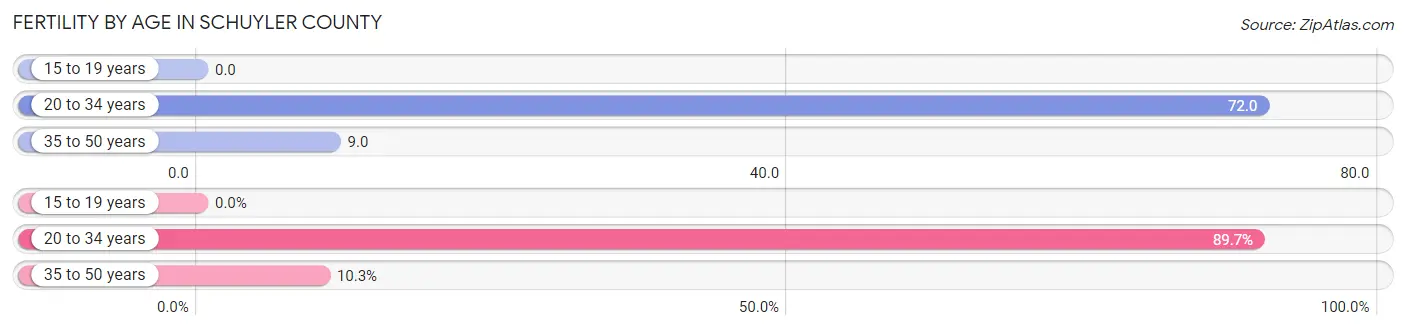
| Age Bracket | Women with Births | Births / 1,000 Women |
| 15 to 19 years | 0 (0.0%) | 0.0 |
| 20 to 34 years | 26 (89.7%) | 72.0 |
| 35 to 50 years | 3 (10.3%) | 9.0 |
| Total | 29 (100.0%) | 35.0 |
Fertility by Age by Marriage Status in Schuyler County
93.1% of women with births (29) in Schuyler County are married. The highest percentage of unmarried women with births falls into 20 to 34 years age bracket with 7.7% of them unmarried at the time of birth, while the lowest percentage of unmarried women with births belong to 35 to 50 years age bracket with 0.0% of them unmarried.
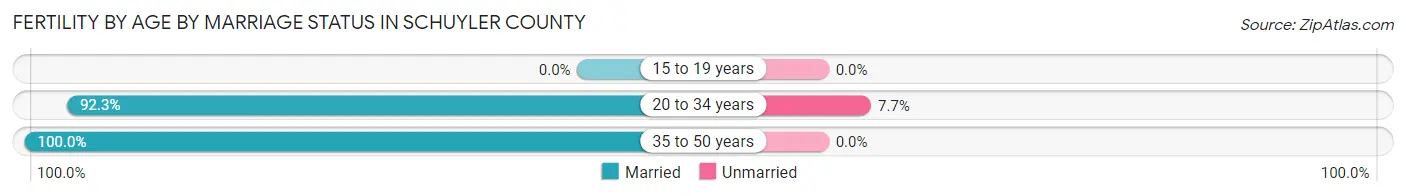
| Age Bracket | Married | Unmarried |
| 15 to 19 years | 0 (0.0%) | 0 (0.0%) |
| 20 to 34 years | 24 (92.3%) | 2 (7.7%) |
| 35 to 50 years | 3 (100.0%) | 0 (0.0%) |
| Total | 27 (93.1%) | 2 (6.9%) |
Fertility by Education in Schuyler County
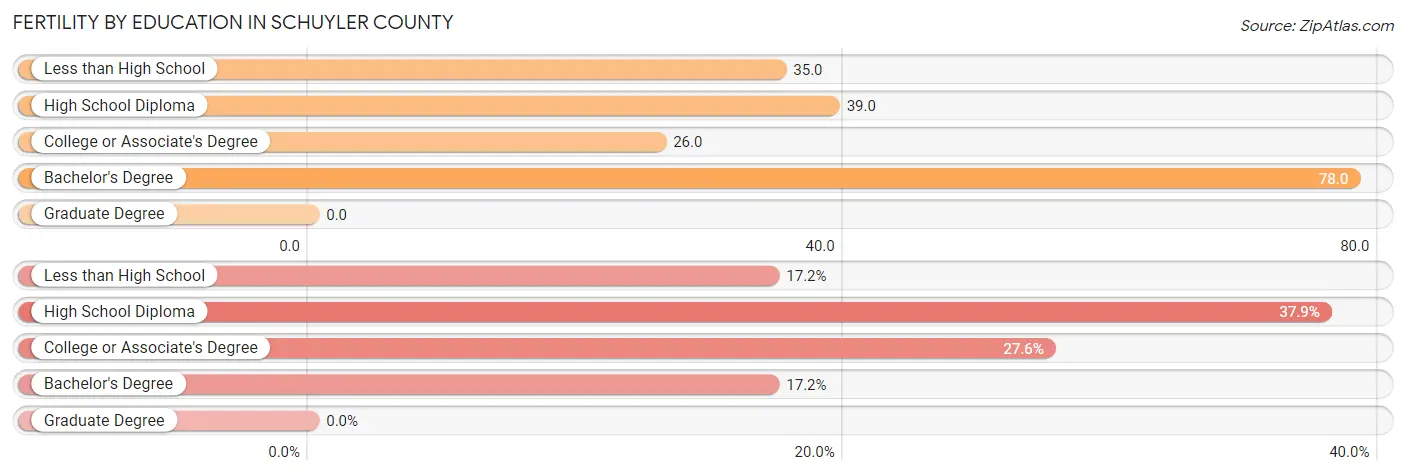
| Educational Attainment | Women with Births | Births / 1,000 Women |
| Less than High School | 5 (17.2%) | 35.0 |
| High School Diploma | 11 (37.9%) | 39.0 |
| College or Associate's Degree | 8 (27.6%) | 26.0 |
| Bachelor's Degree | 5 (17.2%) | 78.0 |
| Graduate Degree | 0 (0.0%) | 0.0 |
| Total | 29 (100.0%) | 35.0 |
Fertility by Education by Marriage Status in Schuyler County
6.9% of women with births in Schuyler County are unmarried. Women with the educational attainment of less than high school are most likely to be married with 100.0% of them married at childbirth, while women with the educational attainment of college or associate's degree are least likely to be married with 25.0% of them unmarried at childbirth.
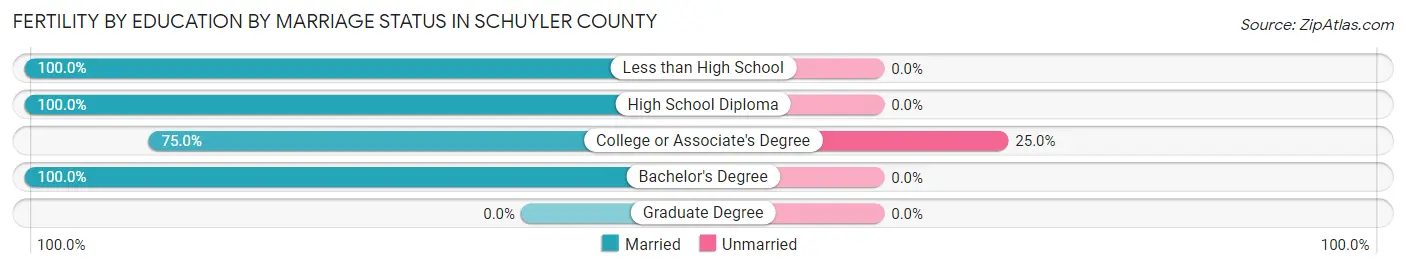
| Educational Attainment | Married | Unmarried |
| Less than High School | 5 (100.0%) | 0 (0.0%) |
| High School Diploma | 11 (100.0%) | 0 (0.0%) |
| College or Associate's Degree | 6 (75.0%) | 2 (25.0%) |
| Bachelor's Degree | 5 (100.0%) | 0 (0.0%) |
| Graduate Degree | 0 (0.0%) | 0 (0.0%) |
| Total | 27 (93.1%) | 2 (6.9%) |
Employment Characteristics in Schuyler County
Employment by Class of Employer in Schuyler County
Among the 1,591 employed individuals in Schuyler County, private company employees (935 | 58.8%), local government employees (168 | 10.6%), and not-for-profit organizations (161 | 10.1%) make up the most common classes of employment.
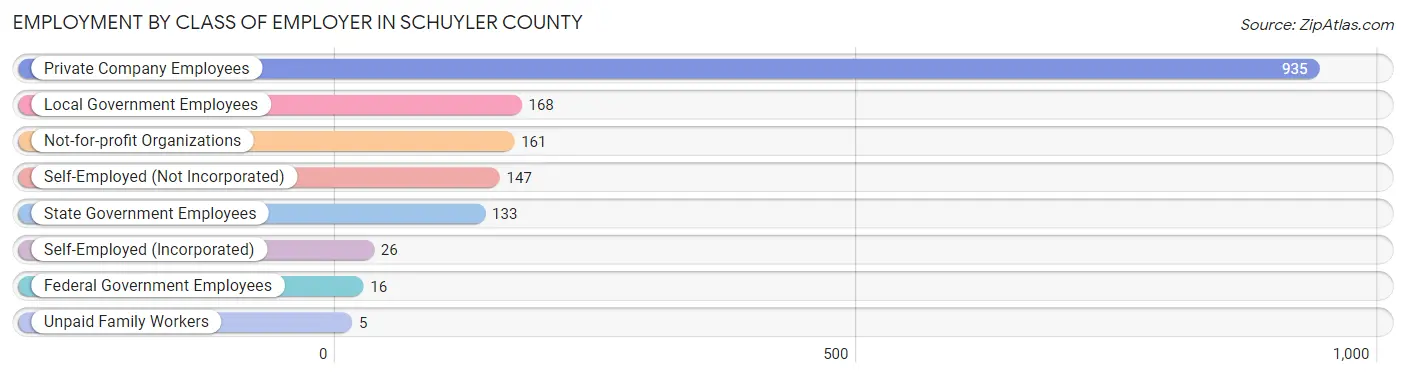
| Employer Class | # Employees | % Employees |
| Private Company Employees | 935 | 58.8% |
| Self-Employed (Incorporated) | 26 | 1.6% |
| Self-Employed (Not Incorporated) | 147 | 9.2% |
| Not-for-profit Organizations | 161 | 10.1% |
| Local Government Employees | 168 | 10.6% |
| State Government Employees | 133 | 8.4% |
| Federal Government Employees | 16 | 1.0% |
| Unpaid Family Workers | 5 | 0.3% |
| Total | 1,591 | 100.0% |
Employment Status by Age in Schuyler County
According to the labor force statistics for Schuyler County, out of the total population over 16 years of age (3,119), 52.7% or 1,644 individuals are in the labor force, with 2.3% or 38 of them unemployed. The age group with the highest labor force participation rate is 25 to 29 years, with 84.9% or 225 individuals in the labor force. Within the labor force, the 16 to 19 years age range has the highest percentage of unemployed individuals, with 24.2% or 22 of them being unemployed.
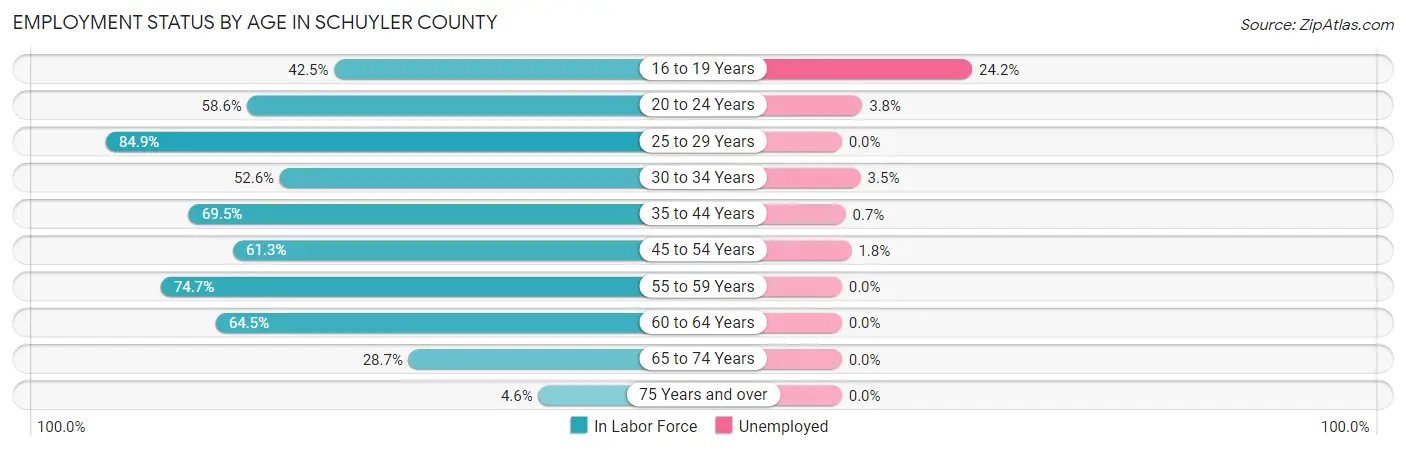
| Age Bracket | In Labor Force | Unemployed |
| 16 to 19 Years | 91 (42.5%) | 22 (24.2%) |
| 20 to 24 Years | 133 (58.6%) | 5 (3.8%) |
| 25 to 29 Years | 225 (84.9%) | 0 (0.0%) |
| 30 to 34 Years | 113 (52.6%) | 4 (3.5%) |
| 35 to 44 Years | 271 (69.5%) | 2 (0.7%) |
| 45 to 54 Years | 276 (61.3%) | 5 (1.8%) |
| 55 to 59 Years | 201 (74.7%) | 0 (0.0%) |
| 60 to 64 Years | 200 (64.5%) | 0 (0.0%) |
| 65 to 74 Years | 117 (28.7%) | 0 (0.0%) |
| 75 Years and over | 17 (4.6%) | 0 (0.0%) |
| Total | 1,644 (52.7%) | 38 (2.3%) |
Employment Status by Educational Attainment in Schuyler County
According to labor force statistics for Schuyler County, 67.7% of individuals (1,286) out of the total population between 25 and 64 years of age (1,899) are in the labor force, with 0.9% or 12 of them being unemployed. The group with the highest labor force participation rate are those with the educational attainment of bachelor's degree or higher, with 83.3% or 210 individuals in the labor force. Within the labor force, individuals with less than high school education have the highest percentage of unemployment, with 12.5% or 5 of them being unemployed.
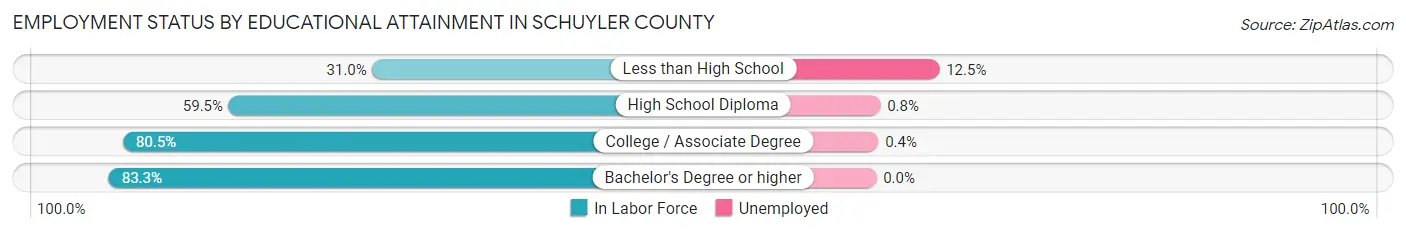
| Educational Attainment | In Labor Force | Unemployed |
| Less than High School | 40 (31.0%) | 16 (12.5%) |
| High School Diploma | 527 (59.5%) | 7 (0.8%) |
| College / Associate Degree | 509 (80.5%) | 3 (0.4%) |
| Bachelor's Degree or higher | 210 (83.3%) | 0 (0.0%) |
| Total | 1,286 (67.7%) | 17 (0.9%) |
Employment Occupations by Sex in Schuyler County
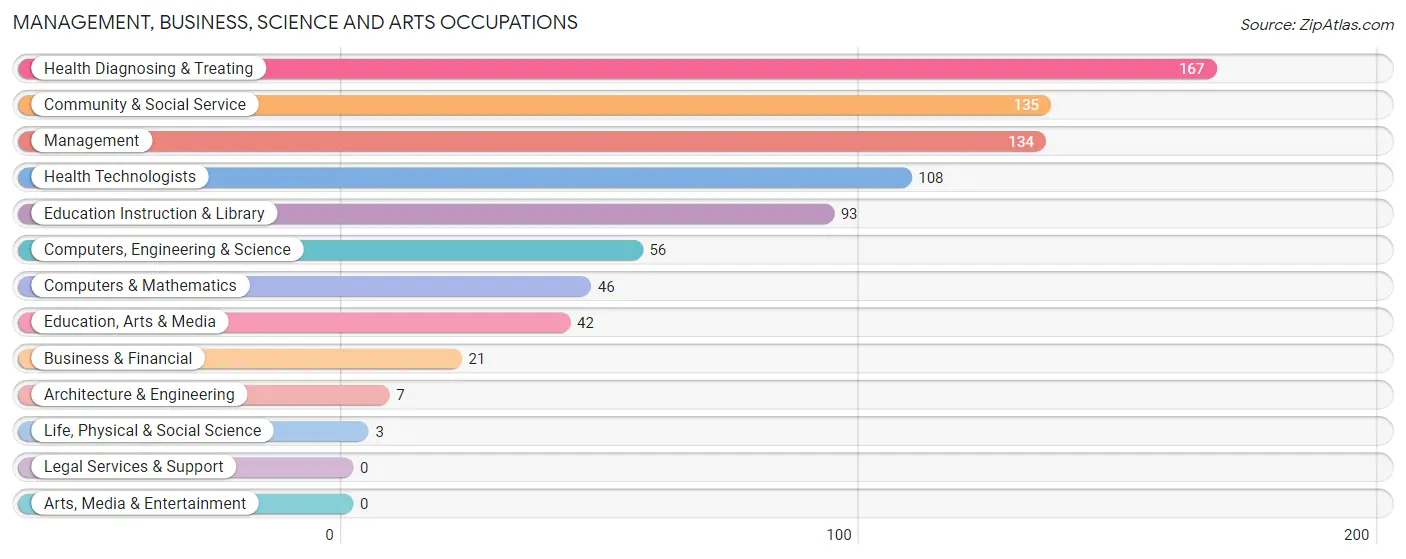
Management, Business, Science and Arts Occupations
The most common Management, Business, Science and Arts occupations in Schuyler County are Health Diagnosing & Treating (167 | 10.4%), Community & Social Service (135 | 8.4%), Management (134 | 8.3%), Health Technologists (108 | 6.7%), and Education Instruction & Library (93 | 5.8%).
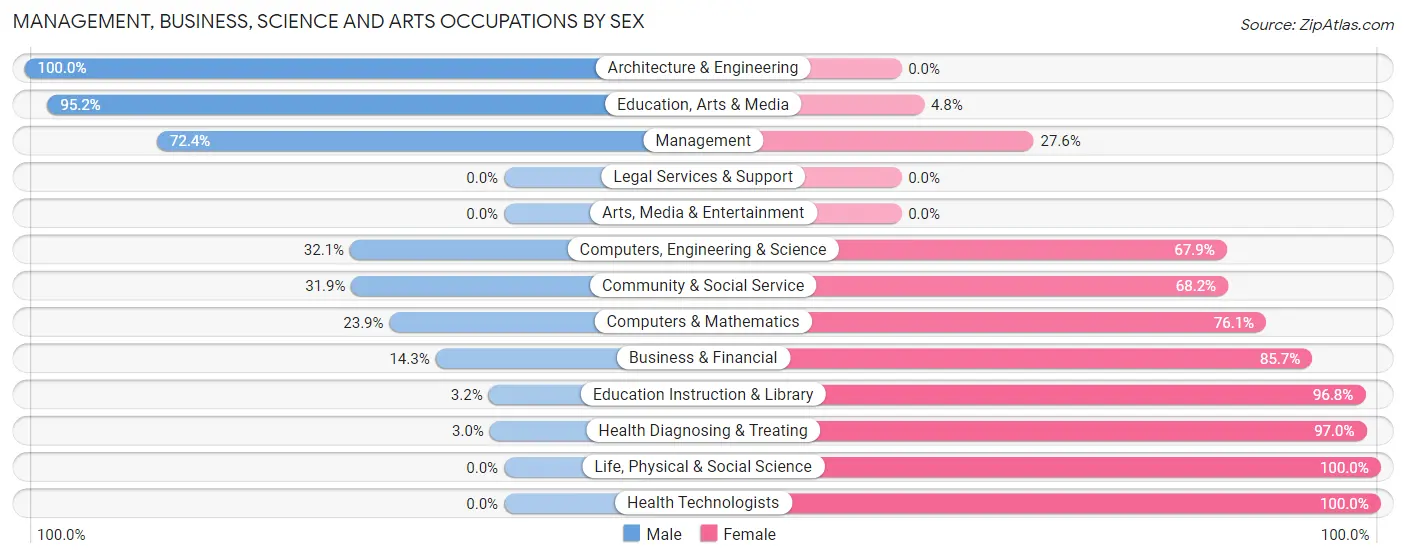
Management, Business, Science and Arts Occupations by Sex
Within the Management, Business, Science and Arts occupations in Schuyler County, the most male-oriented occupations are Architecture & Engineering (100.0%), Education, Arts & Media (95.2%), and Management (72.4%), while the most female-oriented occupations are Life, Physical & Social Science (100.0%), Health Technologists (100.0%), and Health Diagnosing & Treating (97.0%).
| Occupation | Male | Female |
| Management | 97 (72.4%) | 37 (27.6%) |
| Business & Financial | 3 (14.3%) | 18 (85.7%) |
| Computers, Engineering & Science | 18 (32.1%) | 38 (67.9%) |
| Computers & Mathematics | 11 (23.9%) | 35 (76.1%) |
| Architecture & Engineering | 7 (100.0%) | 0 (0.0%) |
| Life, Physical & Social Science | 0 (0.0%) | 3 (100.0%) |
| Community & Social Service | 43 (31.9%) | 92 (68.1%) |
| Education, Arts & Media | 40 (95.2%) | 2 (4.8%) |
| Legal Services & Support | 0 (0.0%) | 0 (0.0%) |
| Education Instruction & Library | 3 (3.2%) | 90 (96.8%) |
| Arts, Media & Entertainment | 0 (0.0%) | 0 (0.0%) |
| Health Diagnosing & Treating | 5 (3.0%) | 162 (97.0%) |
| Health Technologists | 0 (0.0%) | 108 (100.0%) |
| Total (Category) | 166 (32.4%) | 347 (67.6%) |
| Total (Overall) | 784 (48.8%) | 822 (51.2%) |
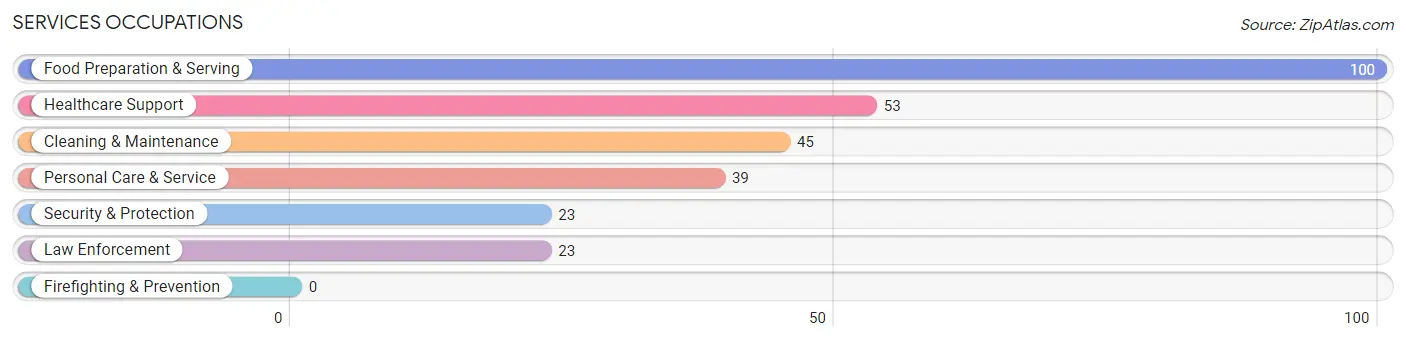
Services Occupations
The most common Services occupations in Schuyler County are Food Preparation & Serving (100 | 6.2%), Healthcare Support (53 | 3.3%), Cleaning & Maintenance (45 | 2.8%), Personal Care & Service (39 | 2.4%), and Security & Protection (23 | 1.4%).
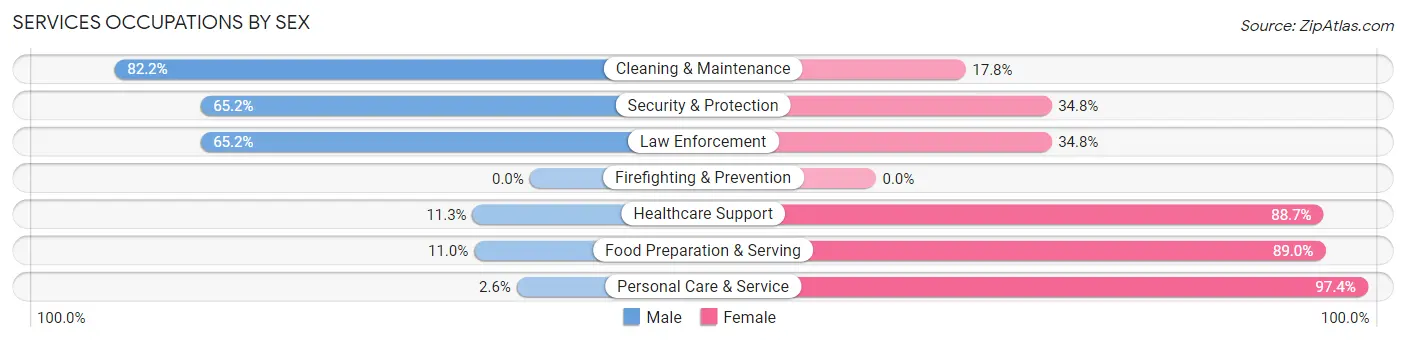
Services Occupations by Sex
Within the Services occupations in Schuyler County, the most male-oriented occupations are Cleaning & Maintenance (82.2%), Security & Protection (65.2%), and Law Enforcement (65.2%), while the most female-oriented occupations are Personal Care & Service (97.4%), Food Preparation & Serving (89.0%), and Healthcare Support (88.7%).
| Occupation | Male | Female |
| Healthcare Support | 6 (11.3%) | 47 (88.7%) |
| Security & Protection | 15 (65.2%) | 8 (34.8%) |
| Firefighting & Prevention | 0 (0.0%) | 0 (0.0%) |
| Law Enforcement | 15 (65.2%) | 8 (34.8%) |
| Food Preparation & Serving | 11 (11.0%) | 89 (89.0%) |
| Cleaning & Maintenance | 37 (82.2%) | 8 (17.8%) |
| Personal Care & Service | 1 (2.6%) | 38 (97.4%) |
| Total (Category) | 70 (26.9%) | 190 (73.1%) |
| Total (Overall) | 784 (48.8%) | 822 (51.2%) |
Sales and Office Occupations
The most common Sales and Office occupations in Schuyler County are Office & Administration (145 | 9.0%), and Sales & Related (91 | 5.7%).
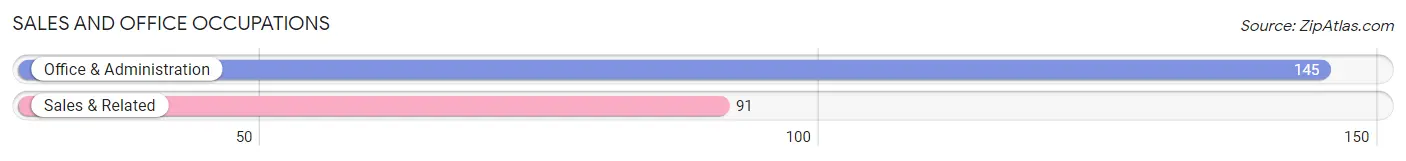
Sales and Office Occupations by Sex
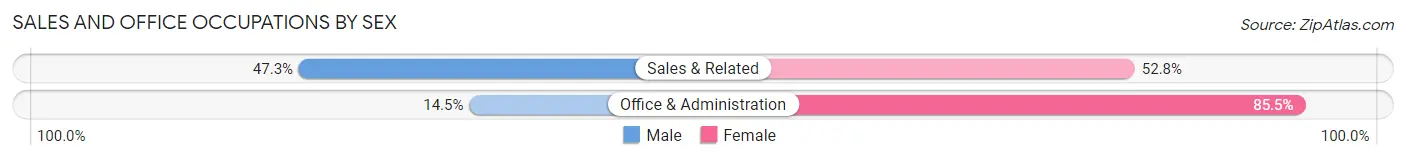
| Occupation | Male | Female |
| Sales & Related | 43 (47.2%) | 48 (52.7%) |
| Office & Administration | 21 (14.5%) | 124 (85.5%) |
| Total (Category) | 64 (27.1%) | 172 (72.9%) |
| Total (Overall) | 784 (48.8%) | 822 (51.2%) |
Natural Resources, Construction and Maintenance Occupations
The most common Natural Resources, Construction and Maintenance occupations in Schuyler County are Installation, Maintenance & Repair (99 | 6.2%), Construction & Extraction (82 | 5.1%), and Farming, Fishing & Forestry (69 | 4.3%).
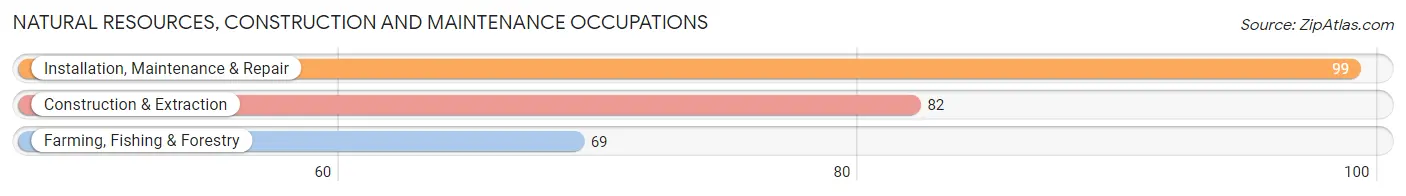
Natural Resources, Construction and Maintenance Occupations by Sex
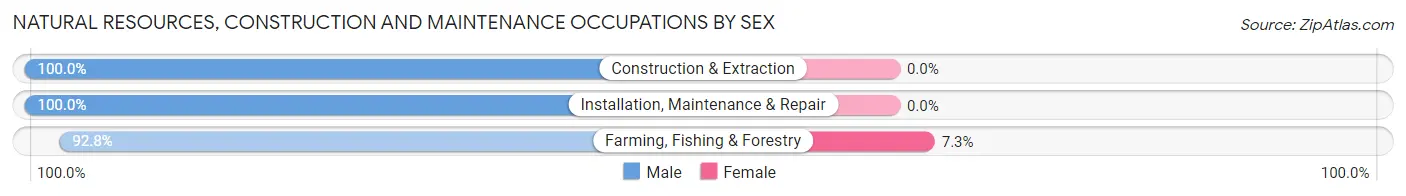
| Occupation | Male | Female |
| Farming, Fishing & Forestry | 64 (92.7%) | 5 (7.2%) |
| Construction & Extraction | 82 (100.0%) | 0 (0.0%) |
| Installation, Maintenance & Repair | 99 (100.0%) | 0 (0.0%) |
| Total (Category) | 245 (98.0%) | 5 (2.0%) |
| Total (Overall) | 784 (48.8%) | 822 (51.2%) |
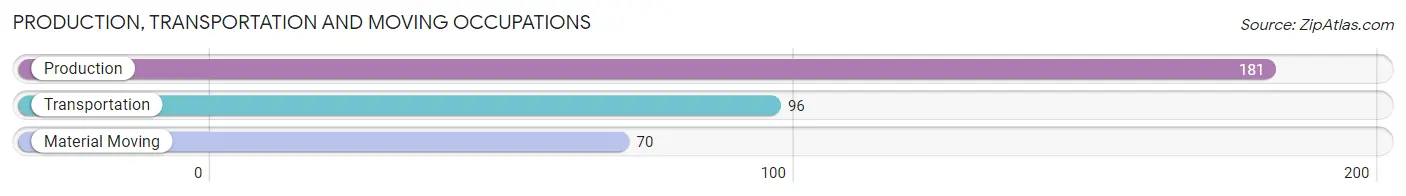
Production, Transportation and Moving Occupations
The most common Production, Transportation and Moving occupations in Schuyler County are Production (181 | 11.3%), Transportation (96 | 6.0%), and Material Moving (70 | 4.4%).
Production, Transportation and Moving Occupations by Sex
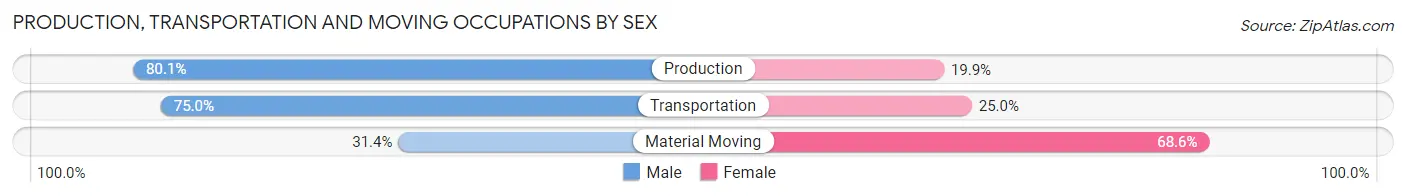
| Occupation | Male | Female |
| Production | 145 (80.1%) | 36 (19.9%) |
| Transportation | 72 (75.0%) | 24 (25.0%) |
| Material Moving | 22 (31.4%) | 48 (68.6%) |
| Total (Category) | 239 (68.9%) | 108 (31.1%) |
| Total (Overall) | 784 (48.8%) | 822 (51.2%) |
Employment Industries by Sex in Schuyler County
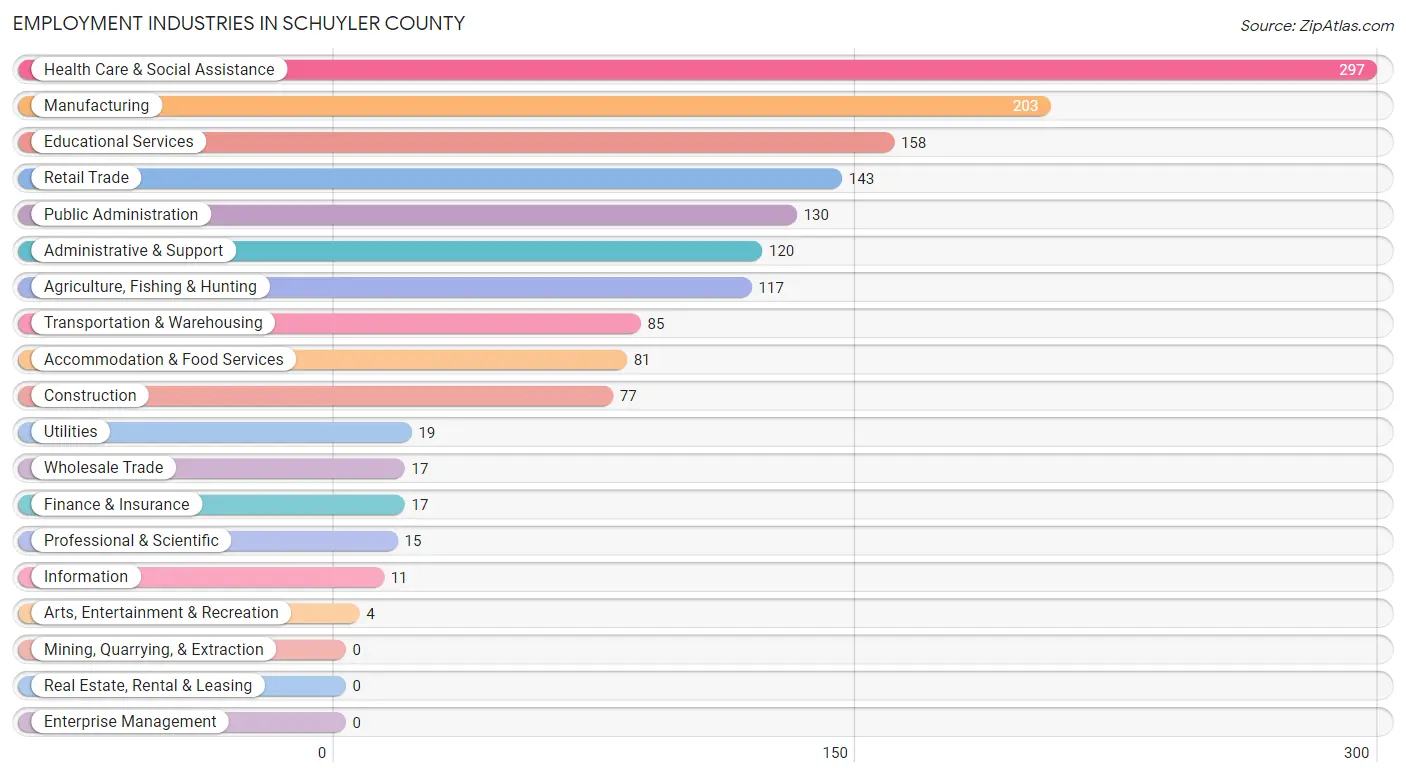
Employment Industries in Schuyler County
The major employment industries in Schuyler County include Health Care & Social Assistance (297 | 18.5%), Manufacturing (203 | 12.6%), Educational Services (158 | 9.8%), Retail Trade (143 | 8.9%), and Public Administration (130 | 8.1%).
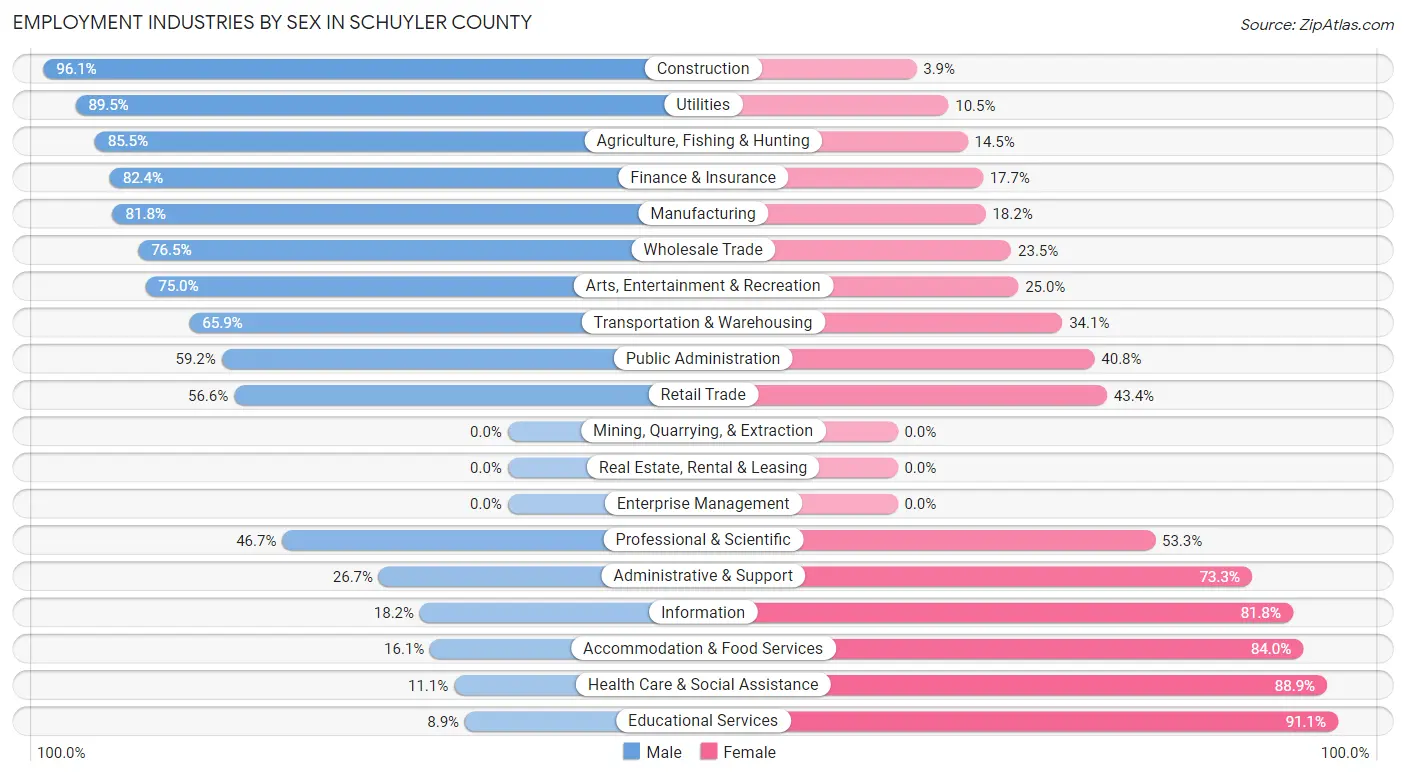
Employment Industries by Sex in Schuyler County
The Schuyler County industries that see more men than women are Construction (96.1%), Utilities (89.5%), and Agriculture, Fishing & Hunting (85.5%), whereas the industries that tend to have a higher number of women are Educational Services (91.1%), Health Care & Social Assistance (88.9%), and Accommodation & Food Services (84.0%).
| Industry | Male | Female |
| Agriculture, Fishing & Hunting | 100 (85.5%) | 17 (14.5%) |
| Mining, Quarrying, & Extraction | 0 (0.0%) | 0 (0.0%) |
| Construction | 74 (96.1%) | 3 (3.9%) |
| Manufacturing | 166 (81.8%) | 37 (18.2%) |
| Wholesale Trade | 13 (76.5%) | 4 (23.5%) |
| Retail Trade | 81 (56.6%) | 62 (43.4%) |
| Transportation & Warehousing | 56 (65.9%) | 29 (34.1%) |
| Utilities | 17 (89.5%) | 2 (10.5%) |
| Information | 2 (18.2%) | 9 (81.8%) |
| Finance & Insurance | 14 (82.4%) | 3 (17.6%) |
| Real Estate, Rental & Leasing | 0 (0.0%) | 0 (0.0%) |
| Professional & Scientific | 7 (46.7%) | 8 (53.3%) |
| Enterprise Management | 0 (0.0%) | 0 (0.0%) |
| Administrative & Support | 32 (26.7%) | 88 (73.3%) |
| Educational Services | 14 (8.9%) | 144 (91.1%) |
| Health Care & Social Assistance | 33 (11.1%) | 264 (88.9%) |
| Arts, Entertainment & Recreation | 3 (75.0%) | 1 (25.0%) |
| Accommodation & Food Services | 13 (16.1%) | 68 (84.0%) |
| Public Administration | 77 (59.2%) | 53 (40.8%) |
| Total | 784 (48.8%) | 822 (51.2%) |
Education in Schuyler County
School Enrollment in Schuyler County
The most common levels of schooling among the 750 students in Schuyler County are elementary school (250 | 33.3%), high school (175 | 23.3%), and middle school (169 | 22.5%).
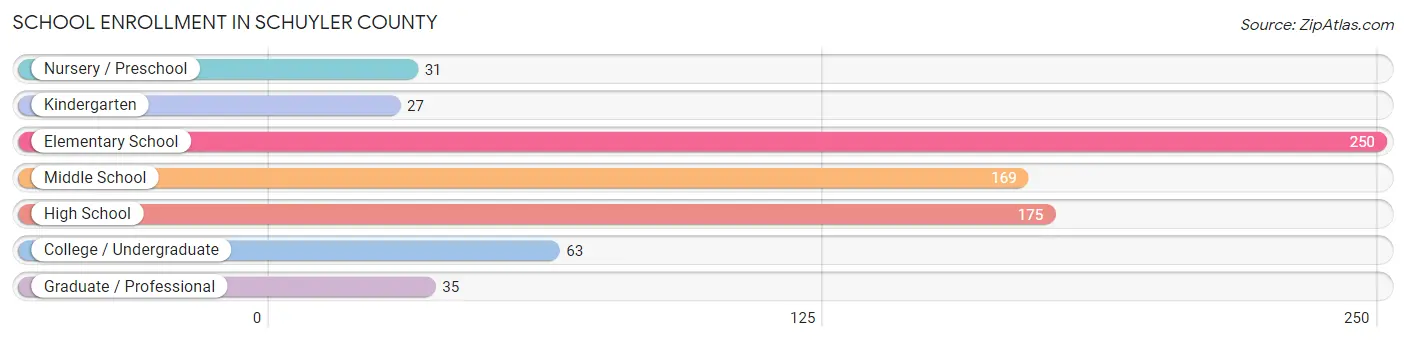
| School Level | # Students | % Students |
| Nursery / Preschool | 31 | 4.1% |
| Kindergarten | 27 | 3.6% |
| Elementary School | 250 | 33.3% |
| Middle School | 169 | 22.5% |
| High School | 175 | 23.3% |
| College / Undergraduate | 63 | 8.4% |
| Graduate / Professional | 35 | 4.7% |
| Total | 750 | 100.0% |
School Enrollment by Age by Funding Source in Schuyler County
Out of a total of 750 students who are enrolled in schools in Schuyler County, 176 (23.5%) attend a private institution, while the remaining 574 (76.5%) are enrolled in public schools. The age group of 20 to 24 year olds has the highest likelihood of being enrolled in private schools, with 23 (53.5% in the age bracket) enrolled. Conversely, the age group of 35 years and over has the lowest likelihood of being enrolled in a private school, with 6 (100.0% in the age bracket) attending a public institution.
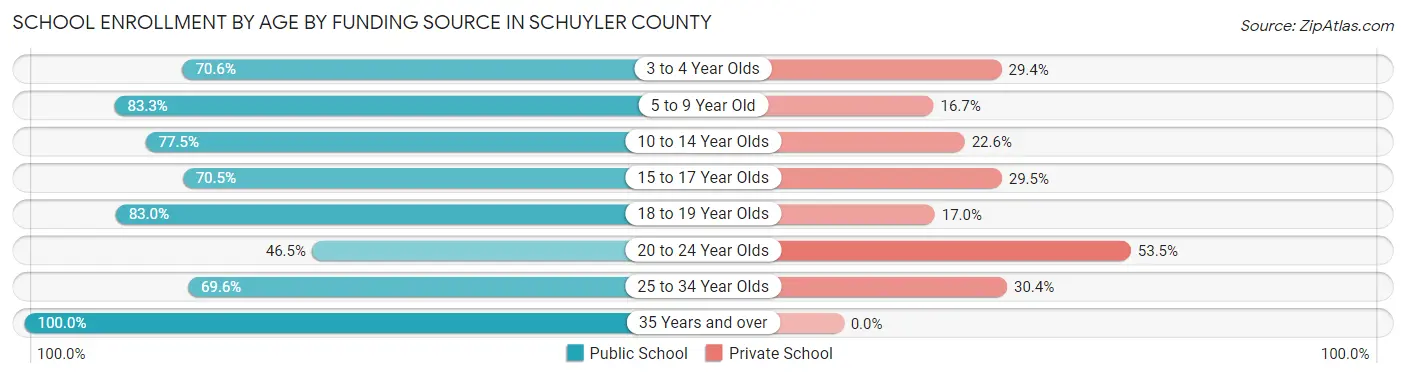
| Age Bracket | Public School | Private School |
| 3 to 4 Year Olds | 12 (70.6%) | 5 (29.4%) |
| 5 to 9 Year Old | 184 (83.3%) | 37 (16.7%) |
| 10 to 14 Year Olds | 213 (77.4%) | 62 (22.6%) |
| 15 to 17 Year Olds | 79 (70.5%) | 33 (29.5%) |
| 18 to 19 Year Olds | 44 (83.0%) | 9 (17.0%) |
| 20 to 24 Year Olds | 20 (46.5%) | 23 (53.5%) |
| 25 to 34 Year Olds | 16 (69.6%) | 7 (30.4%) |
| 35 Years and over | 6 (100.0%) | 0 (0.0%) |
| Total | 574 (76.5%) | 176 (23.5%) |
Educational Attainment by Field of Study in Schuyler County
Education (100 | 28.3%), business (48 | 13.6%), engineering (42 | 11.9%), arts & humanities (42 | 11.9%), and science & technology (40 | 11.3%) are the most common fields of study among 353 individuals in Schuyler County who have obtained a bachelor's degree or higher.
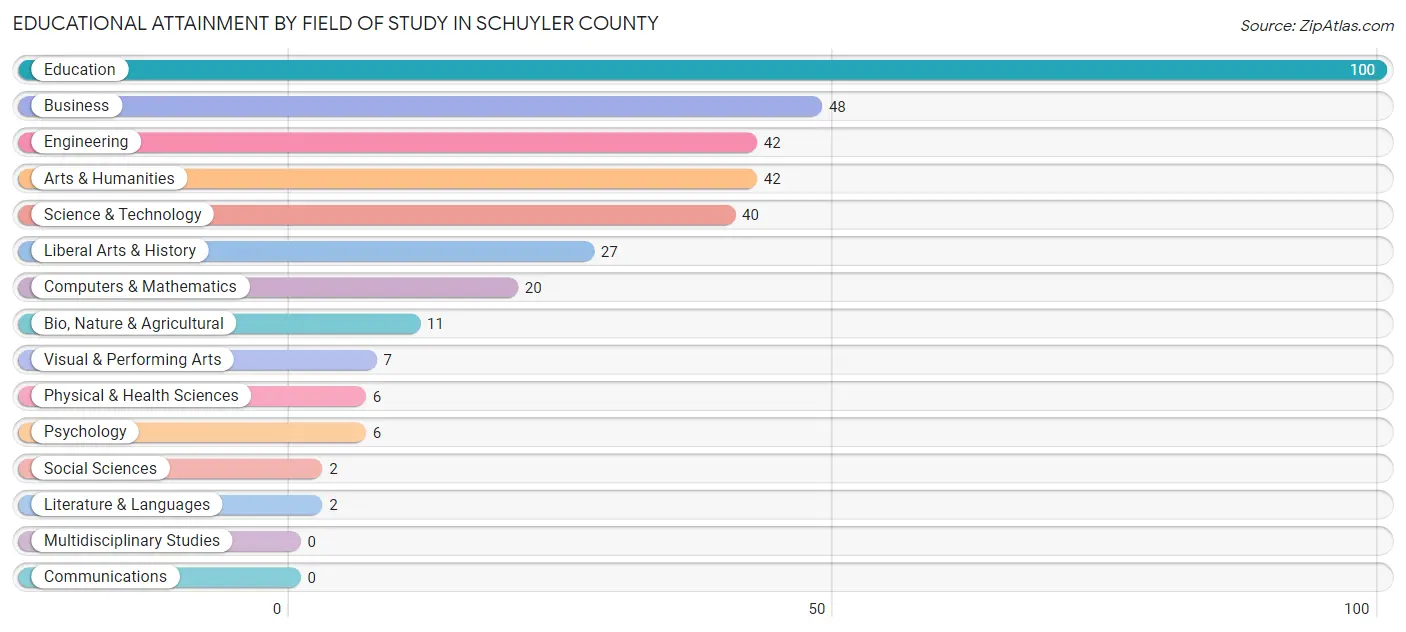
| Field of Study | # Graduates | % Graduates |
| Computers & Mathematics | 20 | 5.7% |
| Bio, Nature & Agricultural | 11 | 3.1% |
| Physical & Health Sciences | 6 | 1.7% |
| Psychology | 6 | 1.7% |
| Social Sciences | 2 | 0.6% |
| Engineering | 42 | 11.9% |
| Multidisciplinary Studies | 0 | 0.0% |
| Science & Technology | 40 | 11.3% |
| Business | 48 | 13.6% |
| Education | 100 | 28.3% |
| Literature & Languages | 2 | 0.6% |
| Liberal Arts & History | 27 | 7.6% |
| Visual & Performing Arts | 7 | 2.0% |
| Communications | 0 | 0.0% |
| Arts & Humanities | 42 | 11.9% |
| Total | 353 | 100.0% |
Transportation & Commute in Schuyler County
Vehicle Availability by Sex in Schuyler County
The most prevalent vehicle ownership categories in Schuyler County are males with 2 vehicles (293, accounting for 38.1%) and females with 2 vehicles (344, making up 35.6%).
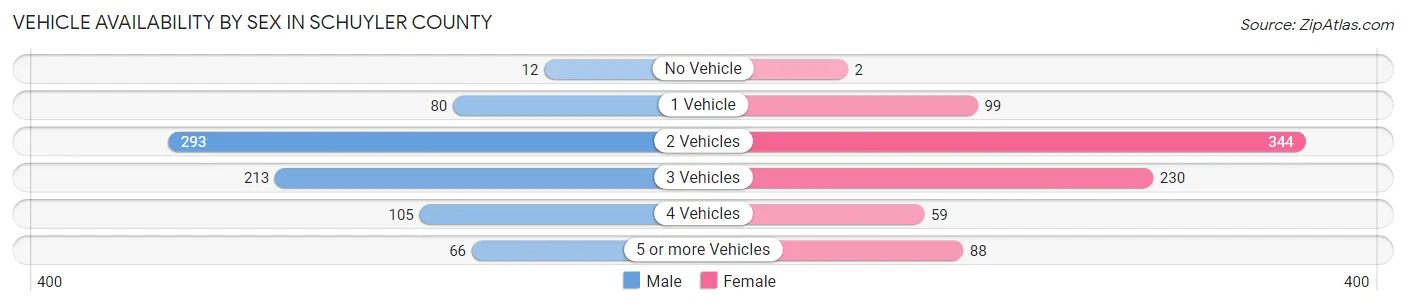
| Vehicles Available | Male | Female |
| No Vehicle | 12 (1.6%) | 2 (0.2%) |
| 1 Vehicle | 80 (10.4%) | 99 (12.0%) |
| 2 Vehicles | 293 (38.1%) | 344 (41.8%) |
| 3 Vehicles | 213 (27.7%) | 230 (28.0%) |
| 4 Vehicles | 105 (13.7%) | 59 (7.2%) |
| 5 or more Vehicles | 66 (8.6%) | 88 (10.7%) |
| Total | 769 (100.0%) | 822 (100.0%) |
Commute Time in Schuyler County
The most frequently occuring commute durations in Schuyler County are 30 to 34 minutes (280 commuters, 18.8%), 10 to 14 minutes (207 commuters, 13.9%), and 15 to 19 minutes (186 commuters, 12.5%).
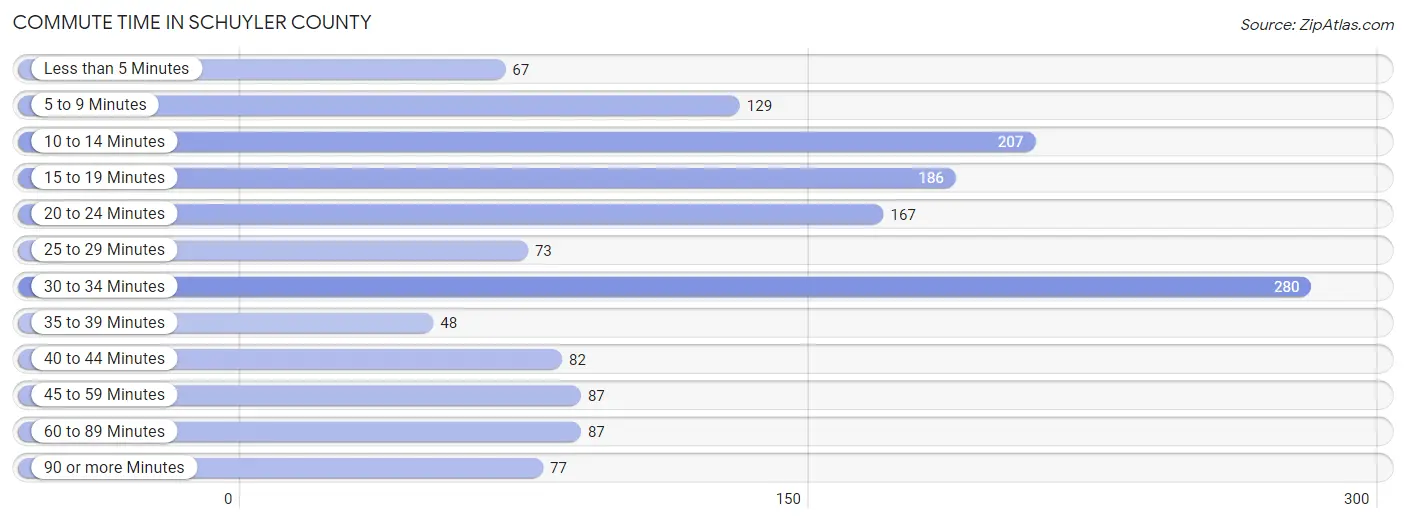
| Commute Time | # Commuters | % Commuters |
| Less than 5 Minutes | 67 | 4.5% |
| 5 to 9 Minutes | 129 | 8.7% |
| 10 to 14 Minutes | 207 | 13.9% |
| 15 to 19 Minutes | 186 | 12.5% |
| 20 to 24 Minutes | 167 | 11.2% |
| 25 to 29 Minutes | 73 | 4.9% |
| 30 to 34 Minutes | 280 | 18.8% |
| 35 to 39 Minutes | 48 | 3.2% |
| 40 to 44 Minutes | 82 | 5.5% |
| 45 to 59 Minutes | 87 | 5.8% |
| 60 to 89 Minutes | 87 | 5.8% |
| 90 or more Minutes | 77 | 5.2% |
Commute Time by Sex in Schuyler County
The most common commute times in Schuyler County are 15 to 19 minutes (109 commuters, 14.6%) for males and 30 to 34 minutes (177 commuters, 23.8%) for females.
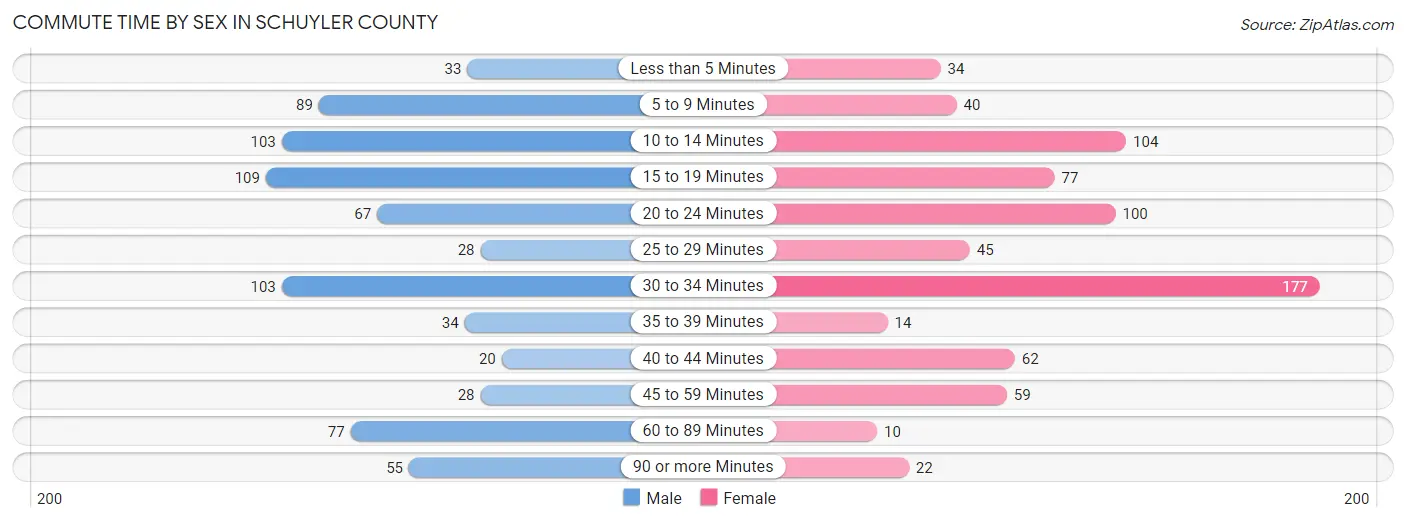
| Commute Time | Male | Female |
| Less than 5 Minutes | 33 (4.4%) | 34 (4.6%) |
| 5 to 9 Minutes | 89 (11.9%) | 40 (5.4%) |
| 10 to 14 Minutes | 103 (13.8%) | 104 (14.0%) |
| 15 to 19 Minutes | 109 (14.6%) | 77 (10.3%) |
| 20 to 24 Minutes | 67 (9.0%) | 100 (13.4%) |
| 25 to 29 Minutes | 28 (3.7%) | 45 (6.0%) |
| 30 to 34 Minutes | 103 (13.8%) | 177 (23.8%) |
| 35 to 39 Minutes | 34 (4.6%) | 14 (1.9%) |
| 40 to 44 Minutes | 20 (2.7%) | 62 (8.3%) |
| 45 to 59 Minutes | 28 (3.7%) | 59 (7.9%) |
| 60 to 89 Minutes | 77 (10.3%) | 10 (1.3%) |
| 90 or more Minutes | 55 (7.4%) | 22 (3.0%) |
Time of Departure to Work by Sex in Schuyler County
The most frequent times of departure to work in Schuyler County are 7:00 AM to 7:29 AM (185, 24.8%) for males and 7:30 AM to 7:59 AM (187, 25.1%) for females.
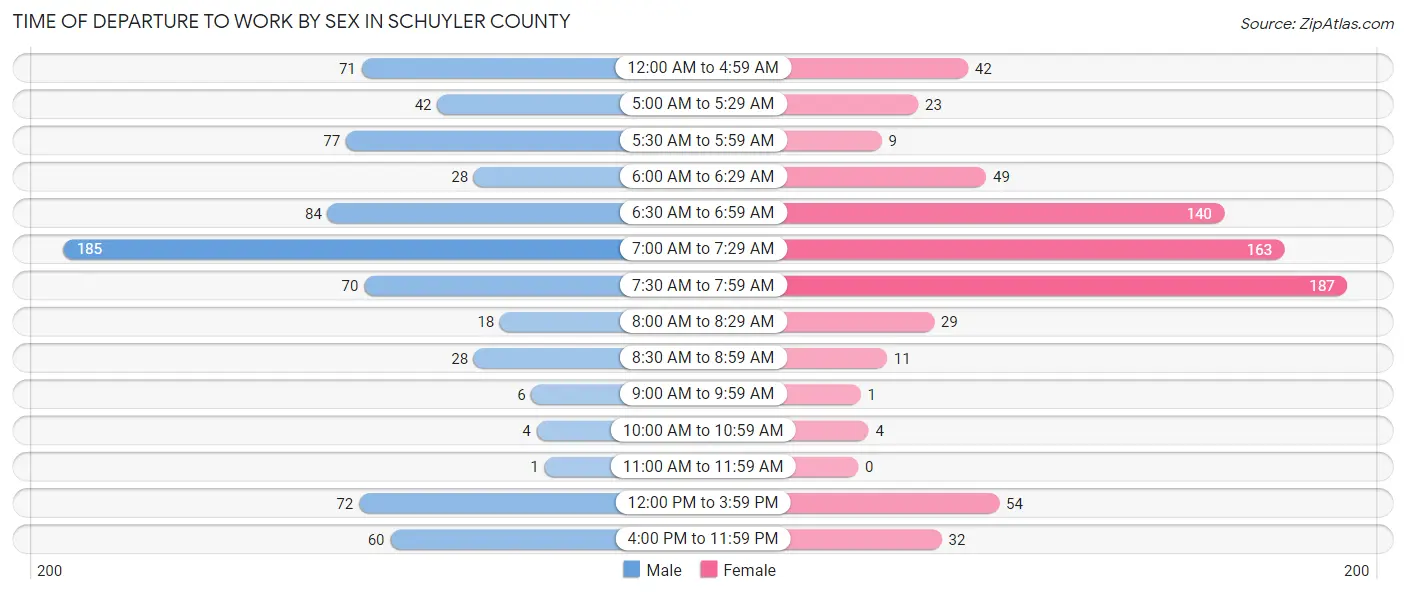
| Time of Departure | Male | Female |
| 12:00 AM to 4:59 AM | 71 (9.5%) | 42 (5.7%) |
| 5:00 AM to 5:29 AM | 42 (5.6%) | 23 (3.1%) |
| 5:30 AM to 5:59 AM | 77 (10.3%) | 9 (1.2%) |
| 6:00 AM to 6:29 AM | 28 (3.7%) | 49 (6.6%) |
| 6:30 AM to 6:59 AM | 84 (11.3%) | 140 (18.8%) |
| 7:00 AM to 7:29 AM | 185 (24.8%) | 163 (21.9%) |
| 7:30 AM to 7:59 AM | 70 (9.4%) | 187 (25.1%) |
| 8:00 AM to 8:29 AM | 18 (2.4%) | 29 (3.9%) |
| 8:30 AM to 8:59 AM | 28 (3.7%) | 11 (1.5%) |
| 9:00 AM to 9:59 AM | 6 (0.8%) | 1 (0.1%) |
| 10:00 AM to 10:59 AM | 4 (0.5%) | 4 (0.5%) |
| 11:00 AM to 11:59 AM | 1 (0.1%) | 0 (0.0%) |
| 12:00 PM to 3:59 PM | 72 (9.7%) | 54 (7.3%) |
| 4:00 PM to 11:59 PM | 60 (8.0%) | 32 (4.3%) |
| Total | 746 (100.0%) | 744 (100.0%) |
Housing Occupancy in Schuyler County
Occupancy by Ownership in Schuyler County
Of the total 1,264 dwellings in Schuyler County, owner-occupied units account for 937 (74.1%), while renter-occupied units make up 327 (25.9%).
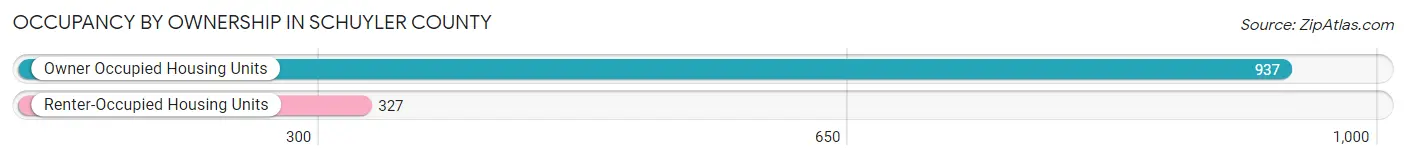
| Occupancy | # Housing Units | % Housing Units |
| Owner Occupied Housing Units | 937 | 74.1% |
| Renter-Occupied Housing Units | 327 | 25.9% |
| Total Occupied Housing Units | 1,264 | 100.0% |
Occupancy by Household Size in Schuyler County
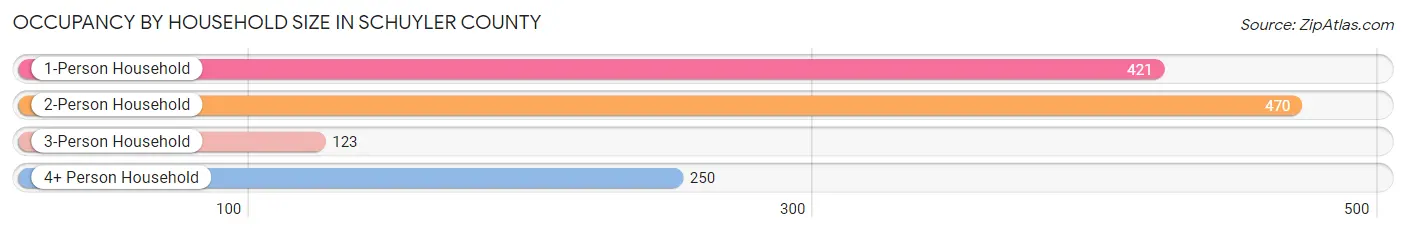
| Household Size | # Housing Units | % Housing Units |
| 1-Person Household | 421 | 33.3% |
| 2-Person Household | 470 | 37.2% |
| 3-Person Household | 123 | 9.7% |
| 4+ Person Household | 250 | 19.8% |
| Total Housing Units | 1,264 | 100.0% |
Occupancy by Ownership by Household Size in Schuyler County
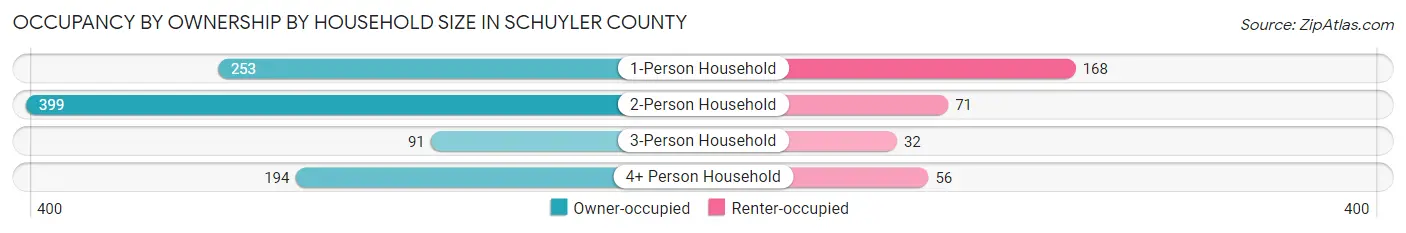
| Household Size | Owner-occupied | Renter-occupied |
| 1-Person Household | 253 (60.1%) | 168 (39.9%) |
| 2-Person Household | 399 (84.9%) | 71 (15.1%) |
| 3-Person Household | 91 (74.0%) | 32 (26.0%) |
| 4+ Person Household | 194 (77.6%) | 56 (22.4%) |
| Total Housing Units | 937 (74.1%) | 327 (25.9%) |
Occupancy by Educational Attainment in Schuyler County
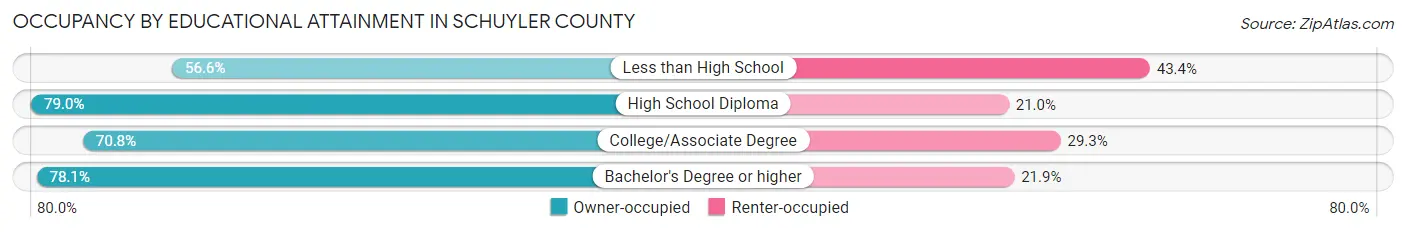
| Household Size | Owner-occupied | Renter-occupied |
| Less than High School | 60 (56.6%) | 46 (43.4%) |
| High School Diploma | 458 (79.0%) | 122 (21.0%) |
| College/Associate Degree | 312 (70.8%) | 129 (29.2%) |
| Bachelor's Degree or higher | 107 (78.1%) | 30 (21.9%) |
Occupancy by Age of Householder in Schuyler County
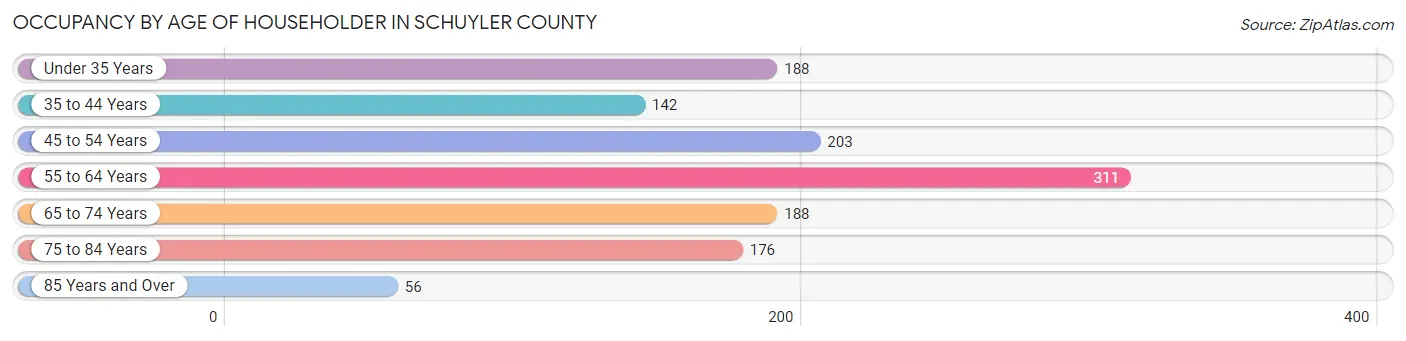
| Age Bracket | # Households | % Households |
| Under 35 Years | 188 | 14.9% |
| 35 to 44 Years | 142 | 11.2% |
| 45 to 54 Years | 203 | 16.1% |
| 55 to 64 Years | 311 | 24.6% |
| 65 to 74 Years | 188 | 14.9% |
| 75 to 84 Years | 176 | 13.9% |
| 85 Years and Over | 56 | 4.4% |
| Total | 1,264 | 100.0% |
Housing Finances in Schuyler County
Median Income by Occupancy in Schuyler County
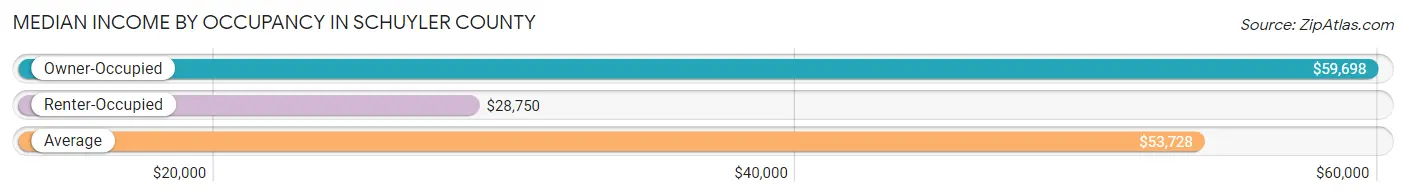
| Occupancy Type | # Households | Median Income |
| Owner-Occupied | 937 (74.1%) | $59,698 |
| Renter-Occupied | 327 (25.9%) | $28,750 |
| Average | 1,264 (100.0%) | $53,728 |
Occupancy by Householder Income Bracket in Schuyler County
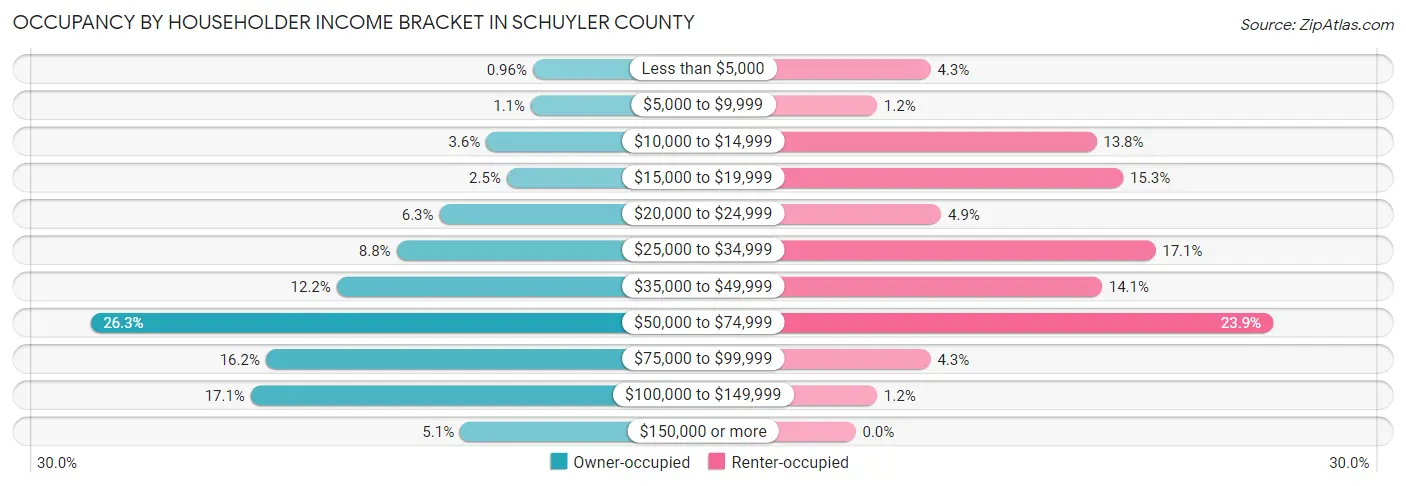
| Income Bracket | Owner-occupied | Renter-occupied |
| Less than $5,000 | 9 (1.0%) | 14 (4.3%) |
| $5,000 to $9,999 | 10 (1.1%) | 4 (1.2%) |
| $10,000 to $14,999 | 34 (3.6%) | 45 (13.8%) |
| $15,000 to $19,999 | 23 (2.5%) | 50 (15.3%) |
| $20,000 to $24,999 | 59 (6.3%) | 16 (4.9%) |
| $25,000 to $34,999 | 82 (8.7%) | 56 (17.1%) |
| $35,000 to $49,999 | 114 (12.2%) | 46 (14.1%) |
| $50,000 to $74,999 | 246 (26.3%) | 78 (23.8%) |
| $75,000 to $99,999 | 152 (16.2%) | 14 (4.3%) |
| $100,000 to $149,999 | 160 (17.1%) | 4 (1.2%) |
| $150,000 or more | 48 (5.1%) | 0 (0.0%) |
| Total | 937 (100.0%) | 327 (100.0%) |
Monthly Housing Cost Tiers in Schuyler County
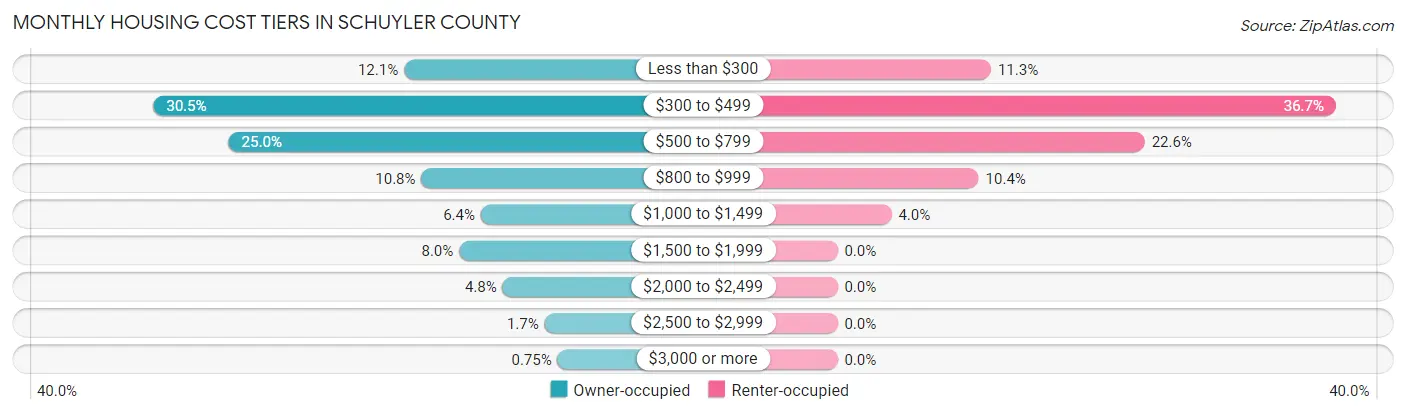
| Monthly Cost | Owner-occupied | Renter-occupied |
| Less than $300 | 113 (12.1%) | 37 (11.3%) |
| $300 to $499 | 286 (30.5%) | 120 (36.7%) |
| $500 to $799 | 234 (25.0%) | 74 (22.6%) |
| $800 to $999 | 101 (10.8%) | 34 (10.4%) |
| $1,000 to $1,499 | 60 (6.4%) | 13 (4.0%) |
| $1,500 to $1,999 | 75 (8.0%) | 0 (0.0%) |
| $2,000 to $2,499 | 45 (4.8%) | 0 (0.0%) |
| $2,500 to $2,999 | 16 (1.7%) | 0 (0.0%) |
| $3,000 or more | 7 (0.7%) | 0 (0.0%) |
| Total | 937 (100.0%) | 327 (100.0%) |
Physical Housing Characteristics in Schuyler County
Housing Structures in Schuyler County
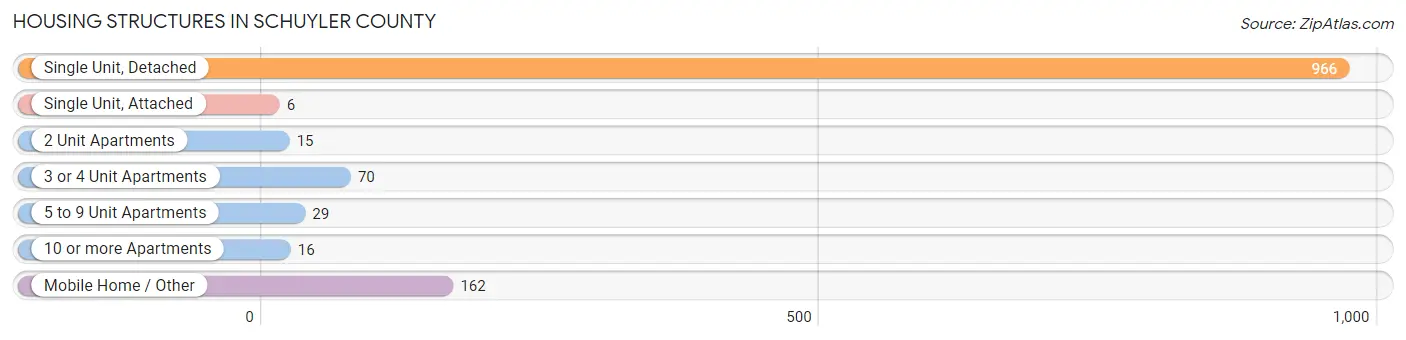
| Structure Type | # Housing Units | % Housing Units |
| Single Unit, Detached | 966 | 76.4% |
| Single Unit, Attached | 6 | 0.5% |
| 2 Unit Apartments | 15 | 1.2% |
| 3 or 4 Unit Apartments | 70 | 5.5% |
| 5 to 9 Unit Apartments | 29 | 2.3% |
| 10 or more Apartments | 16 | 1.3% |
| Mobile Home / Other | 162 | 12.8% |
| Total | 1,264 | 100.0% |
Housing Structures by Occupancy in Schuyler County
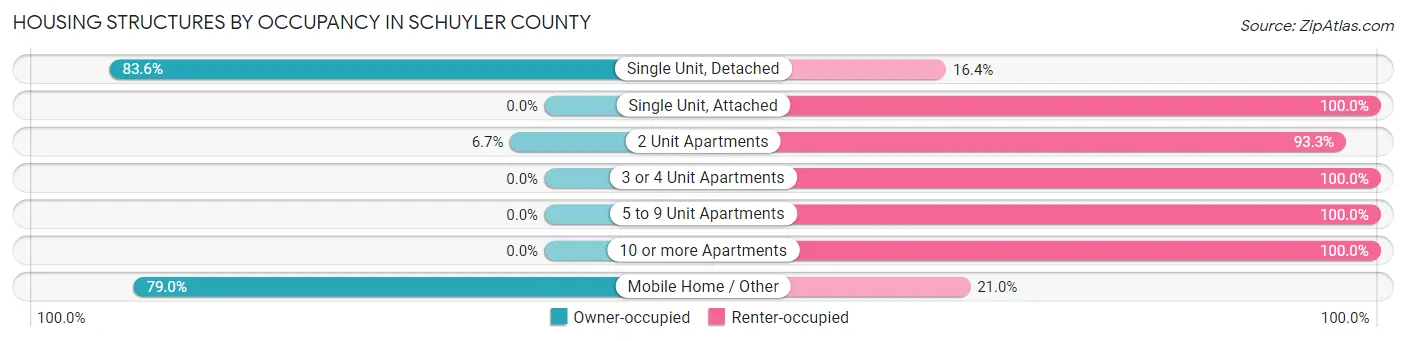
| Structure Type | Owner-occupied | Renter-occupied |
| Single Unit, Detached | 808 (83.6%) | 158 (16.4%) |
| Single Unit, Attached | 0 (0.0%) | 6 (100.0%) |
| 2 Unit Apartments | 1 (6.7%) | 14 (93.3%) |
| 3 or 4 Unit Apartments | 0 (0.0%) | 70 (100.0%) |
| 5 to 9 Unit Apartments | 0 (0.0%) | 29 (100.0%) |
| 10 or more Apartments | 0 (0.0%) | 16 (100.0%) |
| Mobile Home / Other | 128 (79.0%) | 34 (21.0%) |
| Total | 937 (74.1%) | 327 (25.9%) |
Housing Structures by Number of Rooms in Schuyler County
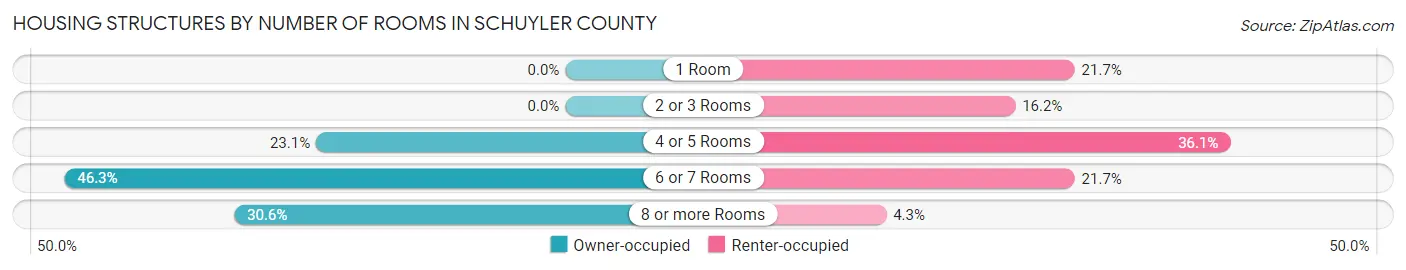
| Number of Rooms | Owner-occupied | Renter-occupied |
| 1 Room | 0 (0.0%) | 71 (21.7%) |
| 2 or 3 Rooms | 0 (0.0%) | 53 (16.2%) |
| 4 or 5 Rooms | 216 (23.1%) | 118 (36.1%) |
| 6 or 7 Rooms | 434 (46.3%) | 71 (21.7%) |
| 8 or more Rooms | 287 (30.6%) | 14 (4.3%) |
| Total | 937 (100.0%) | 327 (100.0%) |
Housing Structure by Heating Type in Schuyler County
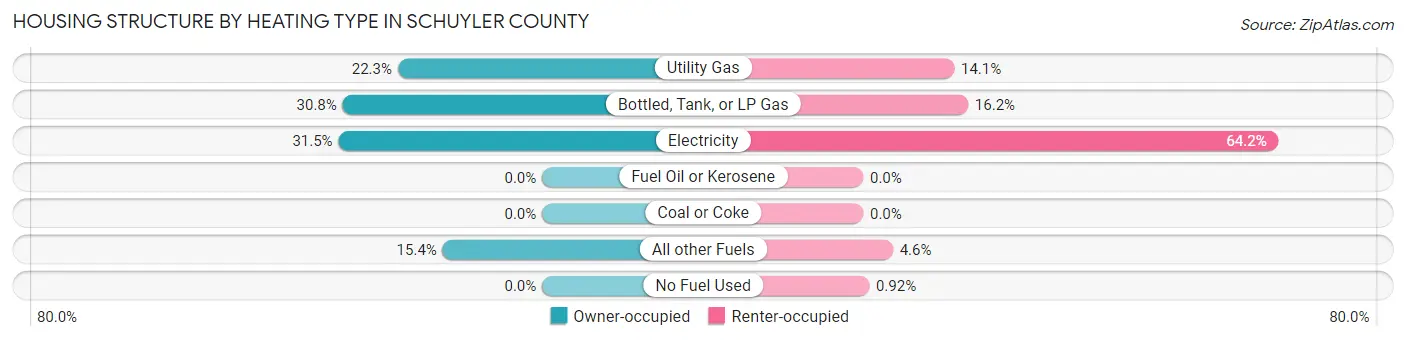
| Heating Type | Owner-occupied | Renter-occupied |
| Utility Gas | 209 (22.3%) | 46 (14.1%) |
| Bottled, Tank, or LP Gas | 289 (30.8%) | 53 (16.2%) |
| Electricity | 295 (31.5%) | 210 (64.2%) |
| Fuel Oil or Kerosene | 0 (0.0%) | 0 (0.0%) |
| Coal or Coke | 0 (0.0%) | 0 (0.0%) |
| All other Fuels | 144 (15.4%) | 15 (4.6%) |
| No Fuel Used | 0 (0.0%) | 3 (0.9%) |
| Total | 937 (100.0%) | 327 (100.0%) |
Household Vehicle Usage in Schuyler County
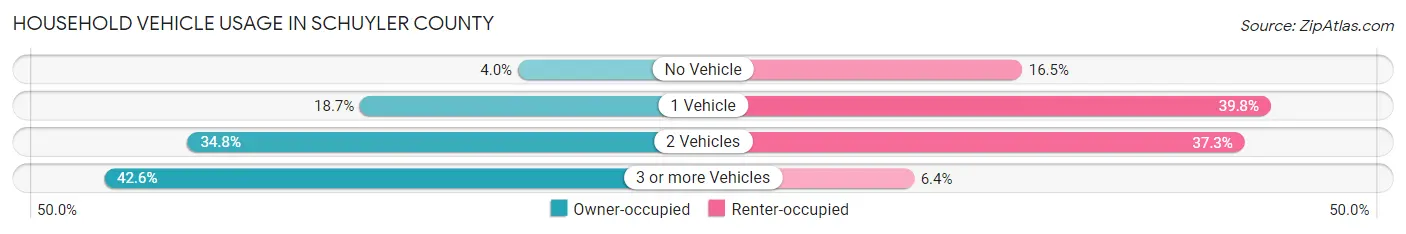
| Vehicles per Household | Owner-occupied | Renter-occupied |
| No Vehicle | 37 (4.0%) | 54 (16.5%) |
| 1 Vehicle | 175 (18.7%) | 130 (39.8%) |
| 2 Vehicles | 326 (34.8%) | 122 (37.3%) |
| 3 or more Vehicles | 399 (42.6%) | 21 (6.4%) |
| Total | 937 (100.0%) | 327 (100.0%) |
Real Estate & Mortgages in Schuyler County
Real Estate and Mortgage Overview in Schuyler County
| Characteristic | Without Mortgage | With Mortgage |
| Housing Units | 569 | 368 |
| Median Property Value | $94,200 | $122,400 |
| Median Household Income | $50,804 | $38 |
| Monthly Housing Costs | $416 | $0 |
| Real Estate Taxes | $819 | $27 |
Property Value by Mortgage Status in Schuyler County
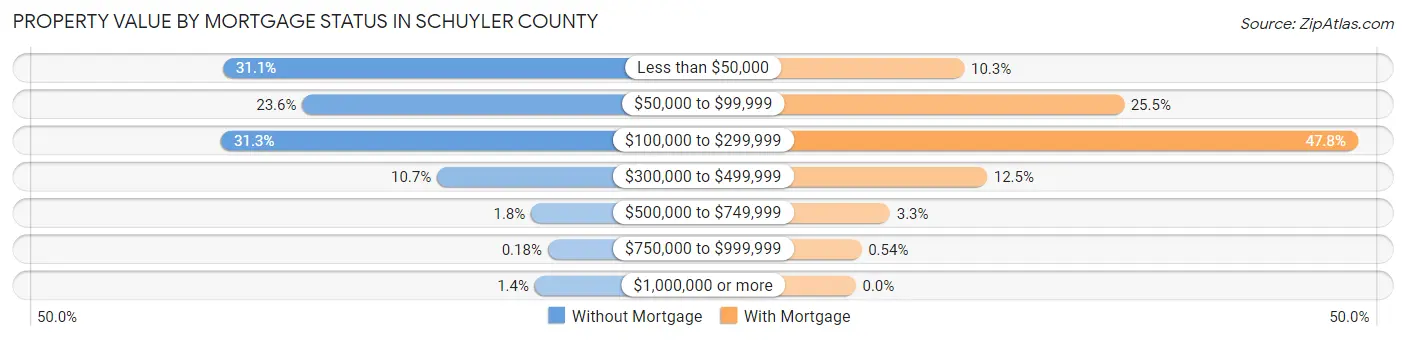
| Property Value | Without Mortgage | With Mortgage |
| Less than $50,000 | 177 (31.1%) | 38 (10.3%) |
| $50,000 to $99,999 | 134 (23.5%) | 94 (25.5%) |
| $100,000 to $299,999 | 178 (31.3%) | 176 (47.8%) |
| $300,000 to $499,999 | 61 (10.7%) | 46 (12.5%) |
| $500,000 to $749,999 | 10 (1.8%) | 12 (3.3%) |
| $750,000 to $999,999 | 1 (0.2%) | 2 (0.5%) |
| $1,000,000 or more | 8 (1.4%) | 0 (0.0%) |
| Total | 569 (100.0%) | 368 (100.0%) |
Household Income by Mortgage Status in Schuyler County
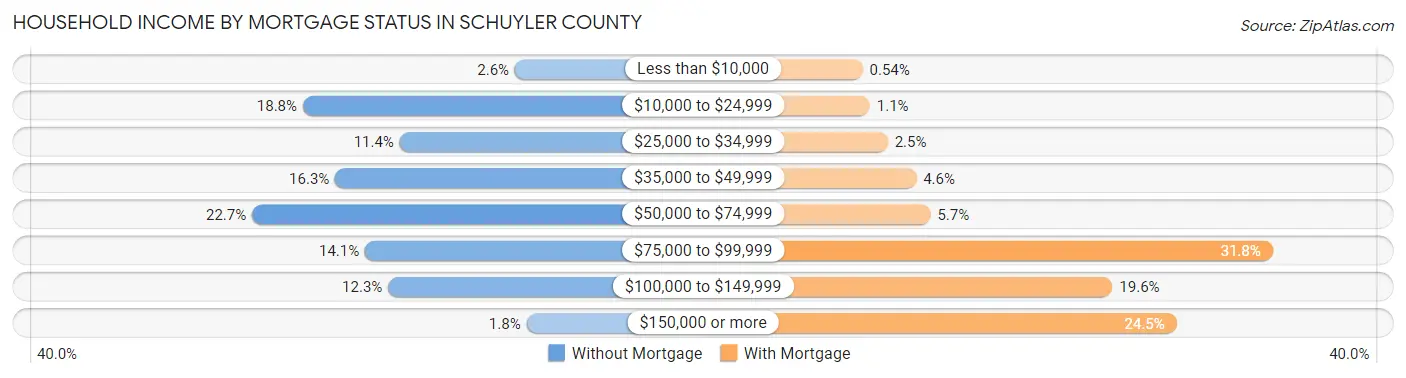
| Household Income | Without Mortgage | With Mortgage |
| Less than $10,000 | 15 (2.6%) | 2 (0.5%) |
| $10,000 to $24,999 | 107 (18.8%) | 4 (1.1%) |
| $25,000 to $34,999 | 65 (11.4%) | 9 (2.5%) |
| $35,000 to $49,999 | 93 (16.3%) | 17 (4.6%) |
| $50,000 to $74,999 | 129 (22.7%) | 21 (5.7%) |
| $75,000 to $99,999 | 80 (14.1%) | 117 (31.8%) |
| $100,000 to $149,999 | 70 (12.3%) | 72 (19.6%) |
| $150,000 or more | 10 (1.8%) | 90 (24.5%) |
| Total | 569 (100.0%) | 368 (100.0%) |
Property Value to Household Income Ratio in Schuyler County
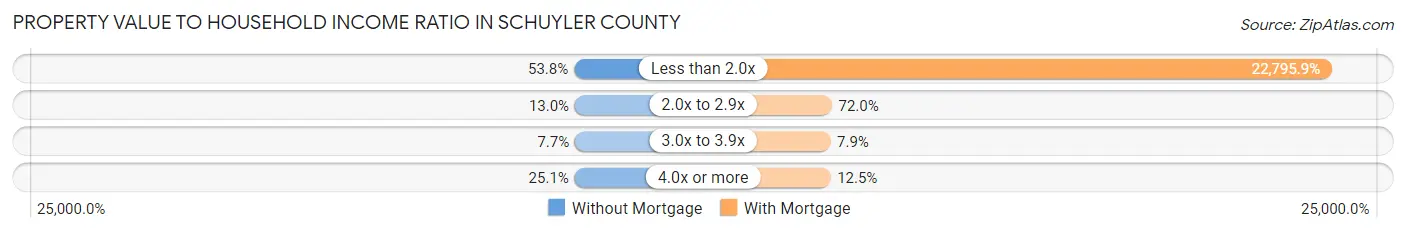
| Value-to-Income Ratio | Without Mortgage | With Mortgage |
| Less than 2.0x | 306 (53.8%) | 83,889 (22,795.9%) |
| 2.0x to 2.9x | 74 (13.0%) | 265 (72.0%) |
| 3.0x to 3.9x | 44 (7.7%) | 29 (7.9%) |
| 4.0x or more | 143 (25.1%) | 46 (12.5%) |
| Total | 569 (100.0%) | 368 (100.0%) |
Real Estate Taxes by Mortgage Status in Schuyler County
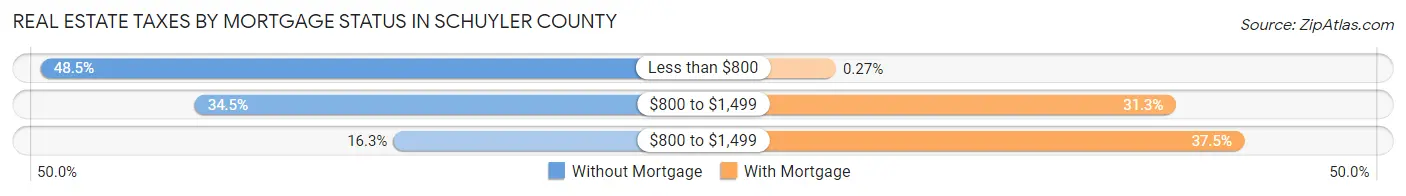
| Property Taxes | Without Mortgage | With Mortgage |
| Less than $800 | 276 (48.5%) | 1 (0.3%) |
| $800 to $1,499 | 196 (34.4%) | 115 (31.2%) |
| $800 to $1,499 | 93 (16.3%) | 138 (37.5%) |
| Total | 569 (100.0%) | 368 (100.0%) |
Health & Disability in Schuyler County
Health Insurance Coverage by Age in Schuyler County
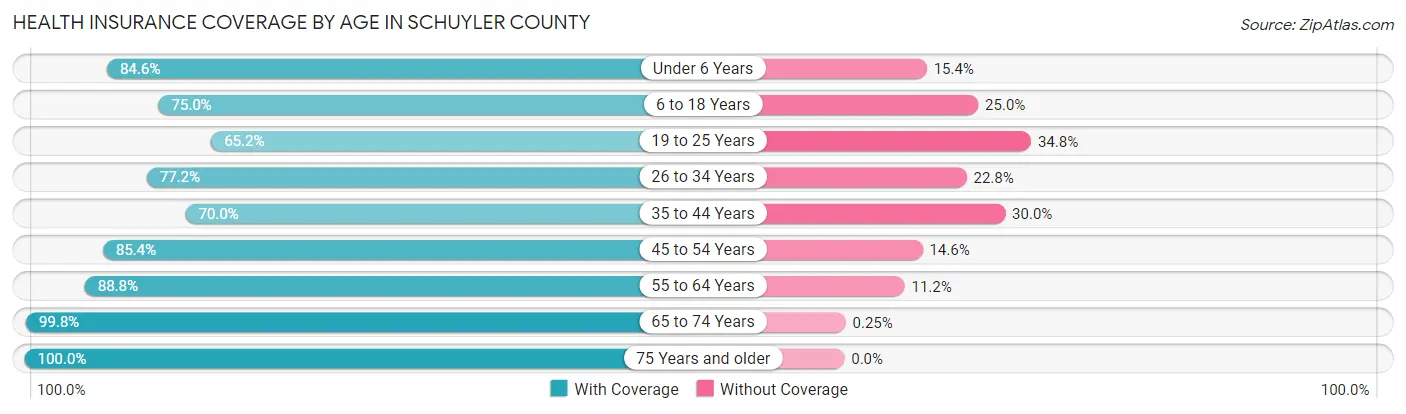
| Age Bracket | With Coverage | Without Coverage |
| Under 6 Years | 336 (84.6%) | 61 (15.4%) |
| 6 to 18 Years | 517 (75.0%) | 172 (25.0%) |
| 19 to 25 Years | 221 (65.2%) | 118 (34.8%) |
| 26 to 34 Years | 342 (77.2%) | 101 (22.8%) |
| 35 to 44 Years | 273 (70.0%) | 117 (30.0%) |
| 45 to 54 Years | 375 (85.4%) | 64 (14.6%) |
| 55 to 64 Years | 514 (88.8%) | 65 (11.2%) |
| 65 to 74 Years | 407 (99.8%) | 1 (0.3%) |
| 75 Years and older | 371 (100.0%) | 0 (0.0%) |
| Total | 3,356 (82.8%) | 699 (17.2%) |
Health Insurance Coverage by Citizenship Status in Schuyler County
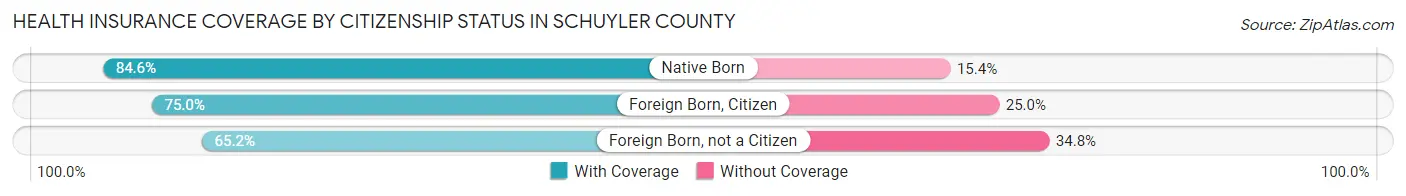
| Citizenship Status | With Coverage | Without Coverage |
| Native Born | 336 (84.6%) | 61 (15.4%) |
| Foreign Born, Citizen | 517 (75.0%) | 172 (25.0%) |
| Foreign Born, not a Citizen | 221 (65.2%) | 118 (34.8%) |
Health Insurance Coverage by Household Income in Schuyler County
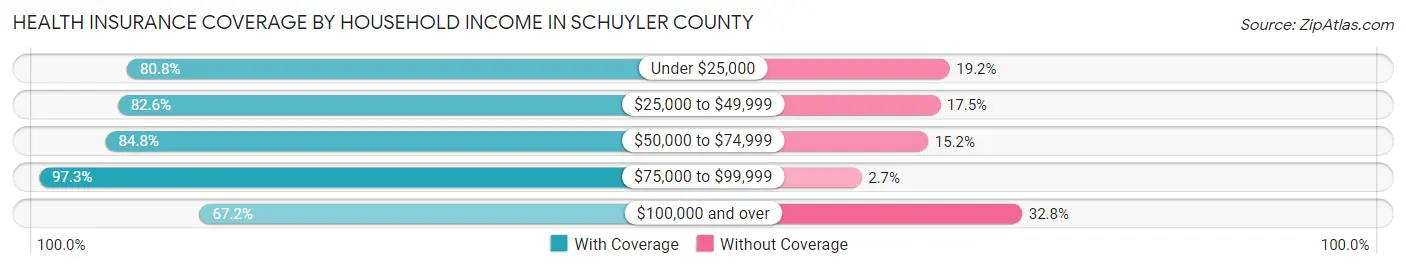
| Household Income | With Coverage | Without Coverage |
| Under $25,000 | 332 (80.8%) | 79 (19.2%) |
| $25,000 to $49,999 | 634 (82.6%) | 134 (17.4%) |
| $50,000 to $74,999 | 1,022 (84.8%) | 183 (15.2%) |
| $75,000 to $99,999 | 755 (97.3%) | 21 (2.7%) |
| $100,000 and over | 578 (67.2%) | 282 (32.8%) |
Public vs Private Health Insurance Coverage by Age in Schuyler County
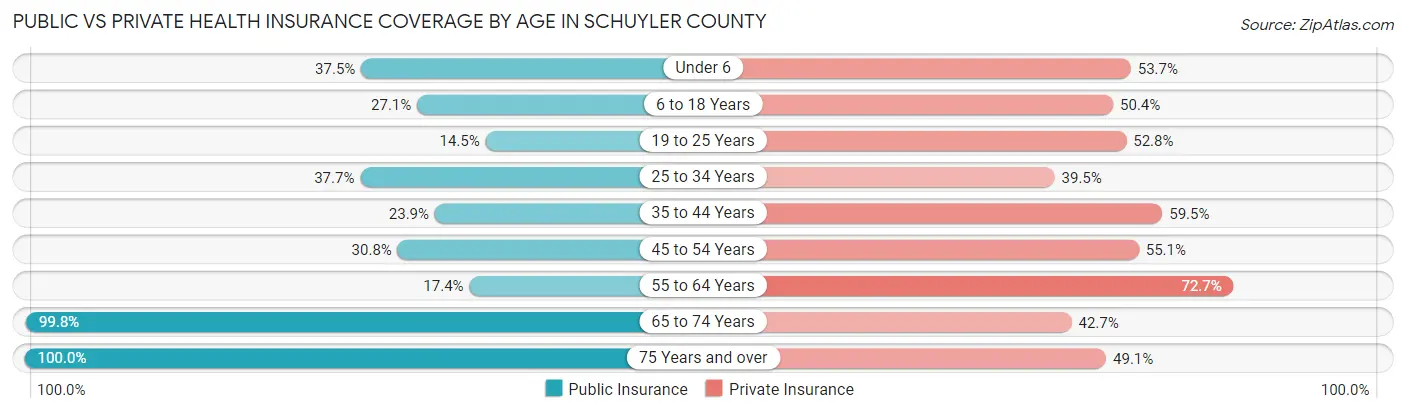
| Age Bracket | Public Insurance | Private Insurance |
| Under 6 | 149 (37.5%) | 213 (53.6%) |
| 6 to 18 Years | 187 (27.1%) | 347 (50.4%) |
| 19 to 25 Years | 49 (14.4%) | 179 (52.8%) |
| 25 to 34 Years | 167 (37.7%) | 175 (39.5%) |
| 35 to 44 Years | 93 (23.8%) | 232 (59.5%) |
| 45 to 54 Years | 135 (30.7%) | 242 (55.1%) |
| 55 to 64 Years | 101 (17.4%) | 421 (72.7%) |
| 65 to 74 Years | 407 (99.8%) | 174 (42.6%) |
| 75 Years and over | 371 (100.0%) | 182 (49.1%) |
| Total | 1,659 (40.9%) | 2,165 (53.4%) |
Disability Status by Sex by Age in Schuyler County
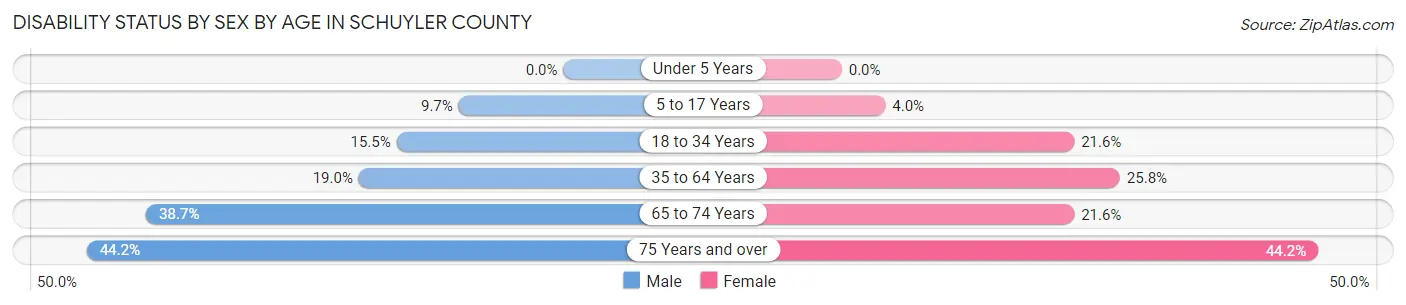
| Age Bracket | Male | Female |
| Under 5 Years | 0 (0.0%) | 0 (0.0%) |
| 5 to 17 Years | 35 (9.7%) | 15 (4.0%) |
| 18 to 34 Years | 63 (15.5%) | 88 (21.6%) |
| 35 to 64 Years | 132 (19.0%) | 184 (25.8%) |
| 65 to 74 Years | 79 (38.7%) | 44 (21.6%) |
| 75 Years and over | 69 (44.2%) | 95 (44.2%) |
Disability Class by Sex by Age in Schuyler County
Disability Class: Hearing Difficulty
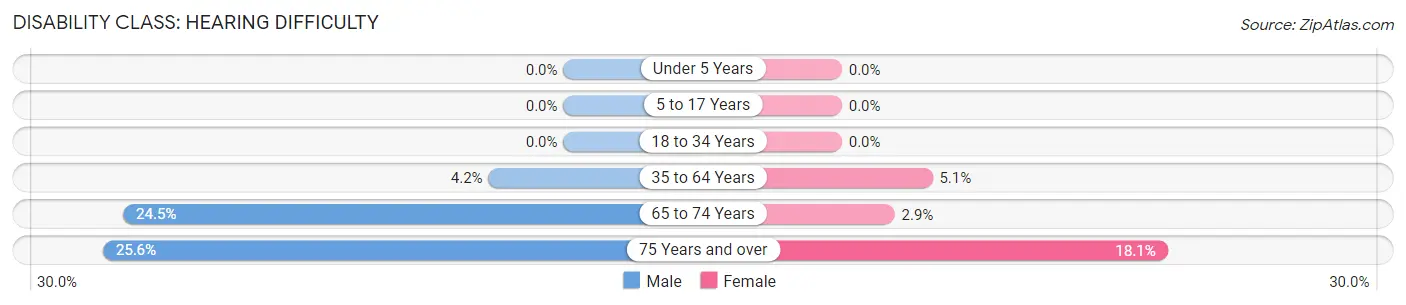
| Age Bracket | Male | Female |
| Under 5 Years | 0 (0.0%) | 0 (0.0%) |
| 5 to 17 Years | 0 (0.0%) | 0 (0.0%) |
| 18 to 34 Years | 0 (0.0%) | 0 (0.0%) |
| 35 to 64 Years | 29 (4.2%) | 36 (5.1%) |
| 65 to 74 Years | 50 (24.5%) | 6 (2.9%) |
| 75 Years and over | 40 (25.6%) | 39 (18.1%) |
Disability Class: Vision Difficulty
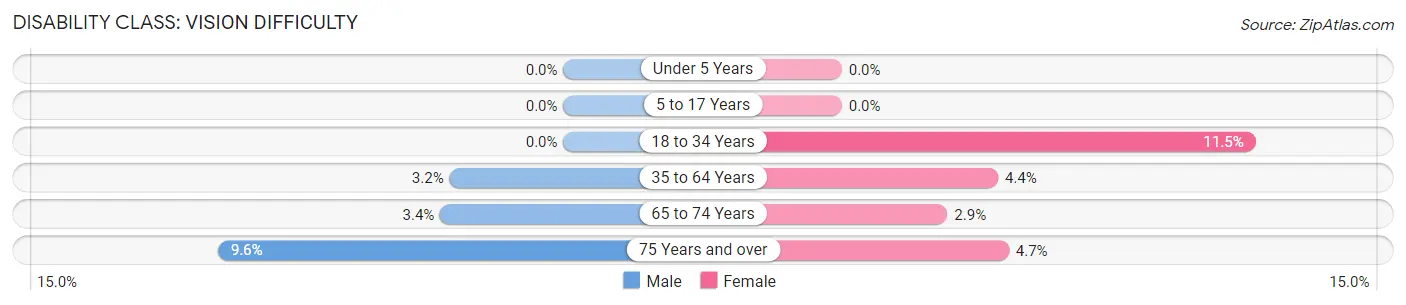
| Age Bracket | Male | Female |
| Under 5 Years | 0 (0.0%) | 0 (0.0%) |
| 5 to 17 Years | 0 (0.0%) | 0 (0.0%) |
| 18 to 34 Years | 0 (0.0%) | 47 (11.5%) |
| 35 to 64 Years | 22 (3.2%) | 31 (4.3%) |
| 65 to 74 Years | 7 (3.4%) | 6 (2.9%) |
| 75 Years and over | 15 (9.6%) | 10 (4.6%) |
Disability Class: Cognitive Difficulty
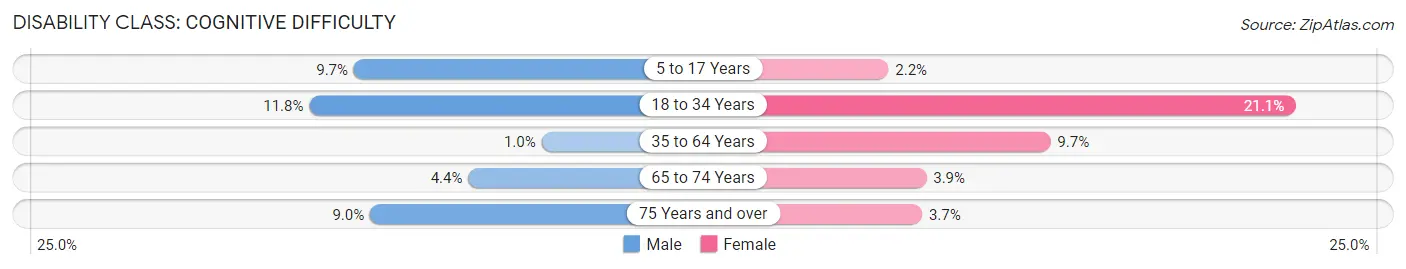
| Age Bracket | Male | Female |
| 5 to 17 Years | 35 (9.7%) | 8 (2.2%) |
| 18 to 34 Years | 48 (11.8%) | 86 (21.1%) |
| 35 to 64 Years | 7 (1.0%) | 69 (9.7%) |
| 65 to 74 Years | 9 (4.4%) | 8 (3.9%) |
| 75 Years and over | 14 (9.0%) | 8 (3.7%) |
Disability Class: Ambulatory Difficulty
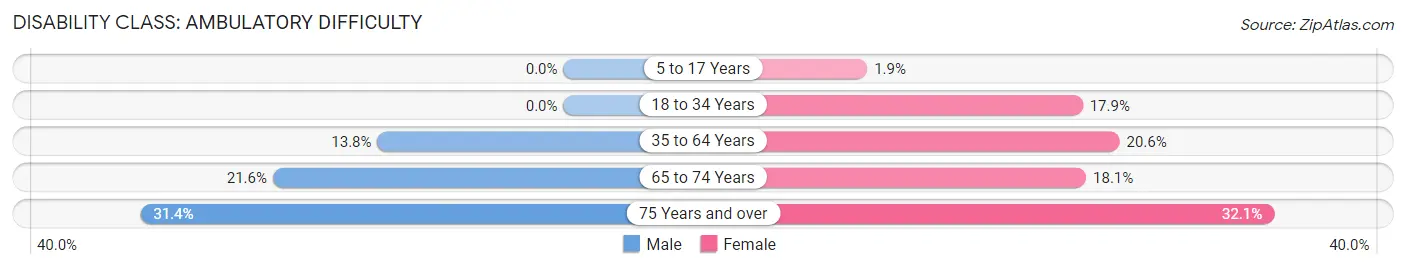
| Age Bracket | Male | Female |
| 5 to 17 Years | 0 (0.0%) | 7 (1.9%) |
| 18 to 34 Years | 0 (0.0%) | 73 (17.9%) |
| 35 to 64 Years | 96 (13.8%) | 147 (20.6%) |
| 65 to 74 Years | 44 (21.6%) | 37 (18.1%) |
| 75 Years and over | 49 (31.4%) | 69 (32.1%) |
Disability Class: Self-Care Difficulty
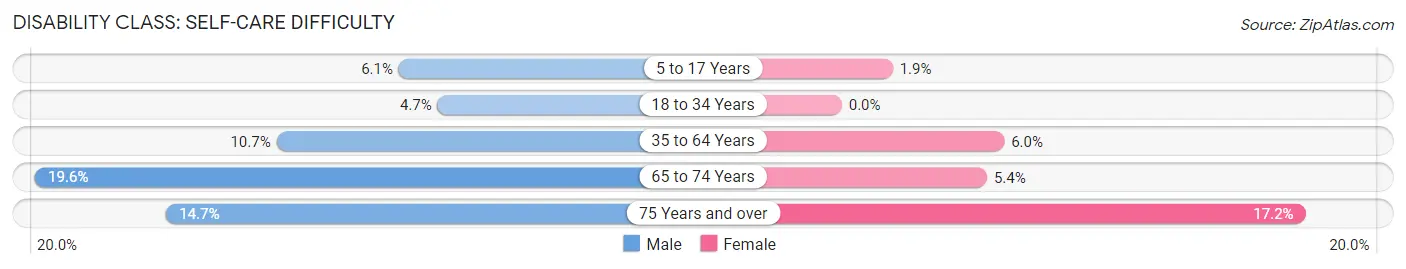
| Age Bracket | Male | Female |
| 5 to 17 Years | 22 (6.1%) | 7 (1.9%) |
| 18 to 34 Years | 19 (4.7%) | 0 (0.0%) |
| 35 to 64 Years | 74 (10.6%) | 43 (6.0%) |
| 65 to 74 Years | 40 (19.6%) | 11 (5.4%) |
| 75 Years and over | 23 (14.7%) | 37 (17.2%) |
Technology Access in Schuyler County
Computing Device Access in Schuyler County
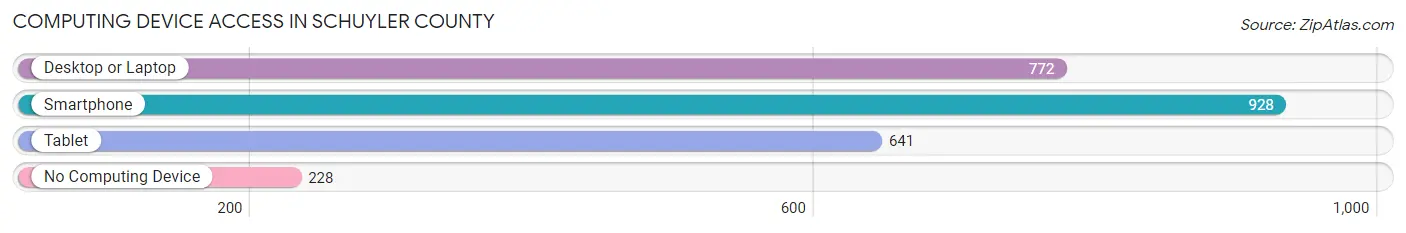
| Device Type | # Households | % Households |
| Desktop or Laptop | 772 | 61.1% |
| Smartphone | 928 | 73.4% |
| Tablet | 641 | 50.7% |
| No Computing Device | 228 | 18.0% |
| Total | 1,264 | 100.0% |
Internet Access in Schuyler County
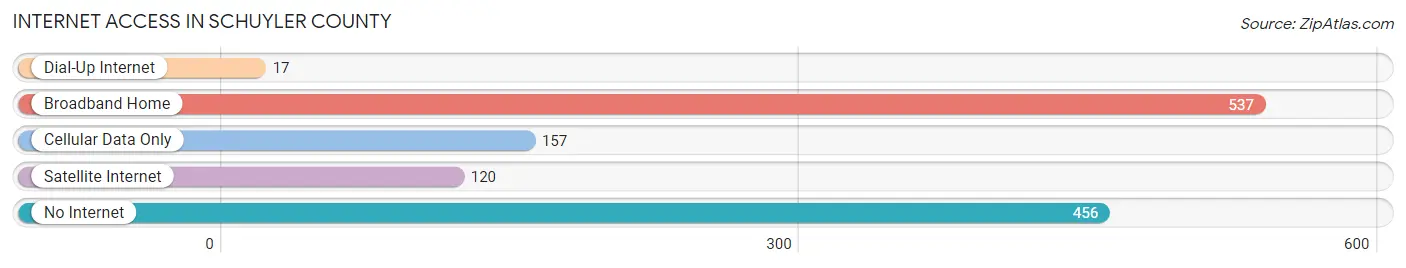
| Internet Type | # Households | % Households |
| Dial-Up Internet | 17 | 1.3% |
| Broadband Home | 537 | 42.5% |
| Cellular Data Only | 157 | 12.4% |
| Satellite Internet | 120 | 9.5% |
| No Internet | 456 | 36.1% |
| Total | 1,264 | 100.0% |
Schuyler County Summary
Schuyler County is located in the northeastern corner of Missouri, and is bordered by Adair, Scotland, Clark, Knox, and Lewis counties. The county seat is Lancaster, and the county was named after Philip Schuyler, a Revolutionary War general. The county has a total area of 517 square miles, and a population of 4,431 as of the 2010 census.
Geography
Schuyler County is located in the Ozark Plateau region of Missouri, and is characterized by rolling hills and valleys. The county is drained by the Fabius River, which flows through the center of the county. The highest point in the county is located in the northwest corner, at an elevation of 1,068 feet. The county is mostly rural, with the majority of the land being used for agricultural purposes.
History
Schuyler County was formed in 1845 from parts of Adair and Scotland counties. The county was named after Philip Schuyler, a Revolutionary War general. The county seat was established in Lancaster in 1845, and the county courthouse was built in 1848.
The county was largely agricultural in the 19th century, with the majority of the population living in small farming communities. The county was also home to several small coal mines, which provided employment for many of the county's residents.
Economy
Agriculture is the main economic activity in Schuyler County. The county is home to several large farms, and the majority of the land is used for agricultural purposes. The county is also home to several small businesses, including a few restaurants, convenience stores, and gas stations.
Demographics
As of the 2010 census, Schuyler County had a population of 4,431. The racial makeup of the county was 97.3% White, 0.7% African American, 0.2% Native American, 0.2% Asian, 0.1% Pacific Islander, 0.3% from other races, and 1.3% from two or more races. Hispanic or Latino of any race were 1.2% of the population.
The median income for a household in the county was $35,938, and the median income for a family was $41,964. The per capita income for the county was $17,845. About 13.2% of families and 16.2% of the population were below the poverty line, including 22.2% of those under age 18 and 11.2% of those age 65 or over.
Conclusion
Schuyler County is a rural county located in the northeastern corner of Missouri. The county is characterized by rolling hills and valleys, and is mostly used for agricultural purposes. The county has a population of 4,431, and the majority of the population is white. The economy of the county is largely based on agriculture, and the county is also home to several small businesses.
Common Questions
What is Per Capita Income in Schuyler County?
Per Capita income in Schuyler County is $22,625.
What is the Median Family Income in Schuyler County?
Median Family Income in Schuyler County is $61,167.
What is the Median Household income in Schuyler County?
Median Household Income in Schuyler County is $53,728.
What is Income or Wage Gap in Schuyler County?
Income or Wage Gap in Schuyler County is 31.0%.
Women in Schuyler County earn 69.0 cents for every dollar earned by a man.
What is Family Income Deficit in Schuyler County?
Family Income Deficit in Schuyler County is $5,058.
Families that are below poverty line in Schuyler County earn $5,058 less on average than the poverty threshold level.
What is Inequality or Gini Index in Schuyler County?
Inequality or Gini Index in Schuyler County is 0.38.
What is the Total Population of Schuyler County?
Total Population of Schuyler County is 4,066.
What is the Total Male Population of Schuyler County?
Total Male Population of Schuyler County is 2,011.
What is the Total Female Population of Schuyler County?
Total Female Population of Schuyler County is 2,055.
What is the Ratio of Males per 100 Females in Schuyler County?
There are 97.86 Males per 100 Females in Schuyler County.
What is the Ratio of Females per 100 Males in Schuyler County?
There are 102.19 Females per 100 Males in Schuyler County.
What is the Median Population Age in Schuyler County?
Median Population Age in Schuyler County is 39.4 Years.
What is the Average Family Size in Schuyler County
Average Family Size in Schuyler County is 4.3 People.
What is the Average Household Size in Schuyler County
Average Household Size in Schuyler County is 3.2 People.
How Large is the Labor Force in Schuyler County?
There are 1,644 People in the Labor Forcein in Schuyler County.
What is the Percentage of People in the Labor Force in Schuyler County?
52.7% of People are in the Labor Force in Schuyler County.
What is the Unemployment Rate in Schuyler County?
Unemployment Rate in Schuyler County is 2.3%.