Saline County, MO Map & Demographics
Saline County Map
Saline County Overview
$26,704
PER CAPITA INCOME
$76,335
AVG FAMILY INCOME
$55,396
AVG HOUSEHOLD INCOME
18.9%
WAGE / INCOME GAP [ % ]
81.1¢/ $1
WAGE / INCOME GAP [ $ ]
$9,651
FAMILY INCOME DEFICIT
0.44
INEQUALITY / GINI INDEX
23,219
TOTAL POPULATION
11,642
MALE POPULATION
11,577
FEMALE POPULATION
100.56
MALES / 100 FEMALES
99.44
FEMALES / 100 MALES
35.5
MEDIAN AGE
3.6
AVG FAMILY SIZE
2.8
AVG HOUSEHOLD SIZE
10,763
LABOR FORCE [ PEOPLE ]
57.6%
PERCENT IN LABOR FORCE
2.7%
UNEMPLOYMENT RATE
Saline County Area Codes
Income in Saline County
Income Overview in Saline County
Per Capita Income in Saline County is $26,704, while median incomes of families and households are $76,335 and $55,396 respectively.
| Characteristic | Number | Measure |
| Per Capita Income | 23,219 | $26,704 |
| Median Family Income | 4,827 | $76,335 |
| Mean Family Income | 4,827 | $89,544 |
| Median Household Income | 7,808 | $55,396 |
| Mean Household Income | 7,808 | $72,741 |
| Income Deficit | 4,827 | $9,651 |
| Wage / Income Gap (%) | 23,219 | 18.91% |
| Wage / Income Gap ($) | 23,219 | 81.09¢ per $1 |
| Gini / Inequality Index | 23,219 | 0.44 |
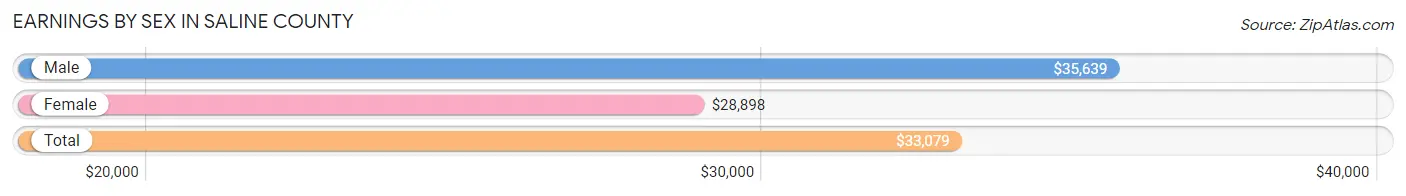
Earnings by Sex in Saline County
Average Earnings in Saline County are $33,079, $35,639 for men and $28,898 for women, a difference of 18.9%.
| Sex | Number | Average Earnings |
| Male | 6,236 (54.0%) | $35,639 |
| Female | 5,304 (46.0%) | $28,898 |
| Total | 11,540 (100.0%) | $33,079 |
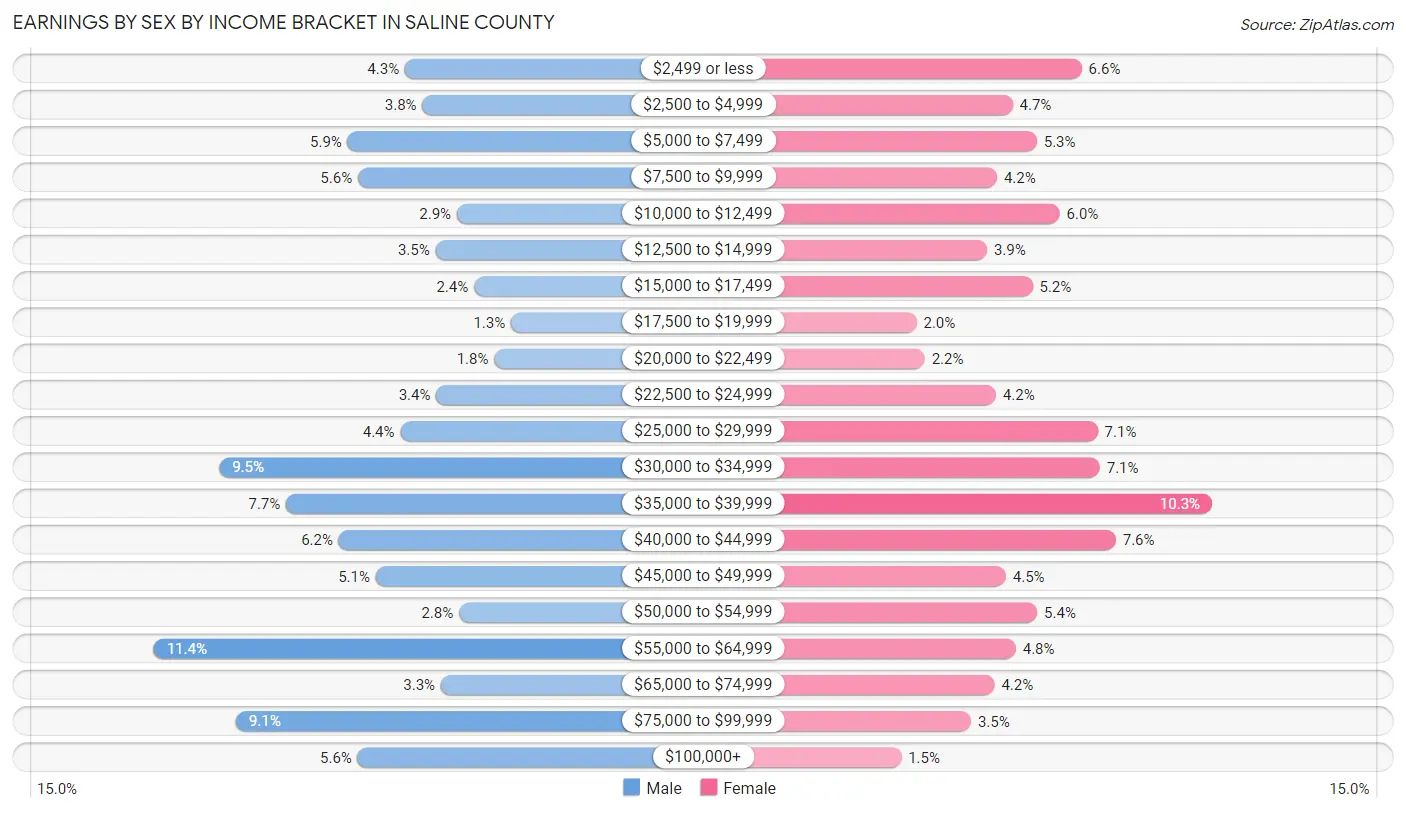
Earnings by Sex by Income Bracket in Saline County
The most common earnings brackets in Saline County are $55,000 to $64,999 for men (709 | 11.4%) and $35,000 to $39,999 for women (544 | 10.3%).
| Income | Male | Female |
| $2,499 or less | 269 (4.3%) | 350 (6.6%) |
| $2,500 to $4,999 | 238 (3.8%) | 247 (4.7%) |
| $5,000 to $7,499 | 369 (5.9%) | 283 (5.3%) |
| $7,500 to $9,999 | 351 (5.6%) | 224 (4.2%) |
| $10,000 to $12,499 | 178 (2.9%) | 317 (6.0%) |
| $12,500 to $14,999 | 215 (3.5%) | 209 (3.9%) |
| $15,000 to $17,499 | 148 (2.4%) | 277 (5.2%) |
| $17,500 to $19,999 | 83 (1.3%) | 104 (2.0%) |
| $20,000 to $22,499 | 112 (1.8%) | 116 (2.2%) |
| $22,500 to $24,999 | 214 (3.4%) | 222 (4.2%) |
| $25,000 to $29,999 | 277 (4.4%) | 374 (7.0%) |
| $30,000 to $34,999 | 594 (9.5%) | 377 (7.1%) |
| $35,000 to $39,999 | 477 (7.6%) | 544 (10.3%) |
| $40,000 to $44,999 | 385 (6.2%) | 401 (7.6%) |
| $45,000 to $49,999 | 320 (5.1%) | 237 (4.5%) |
| $50,000 to $54,999 | 174 (2.8%) | 284 (5.3%) |
| $55,000 to $64,999 | 709 (11.4%) | 252 (4.8%) |
| $65,000 to $74,999 | 206 (3.3%) | 220 (4.2%) |
| $75,000 to $99,999 | 565 (9.1%) | 185 (3.5%) |
| $100,000+ | 352 (5.6%) | 81 (1.5%) |
| Total | 6,236 (100.0%) | 5,304 (100.0%) |
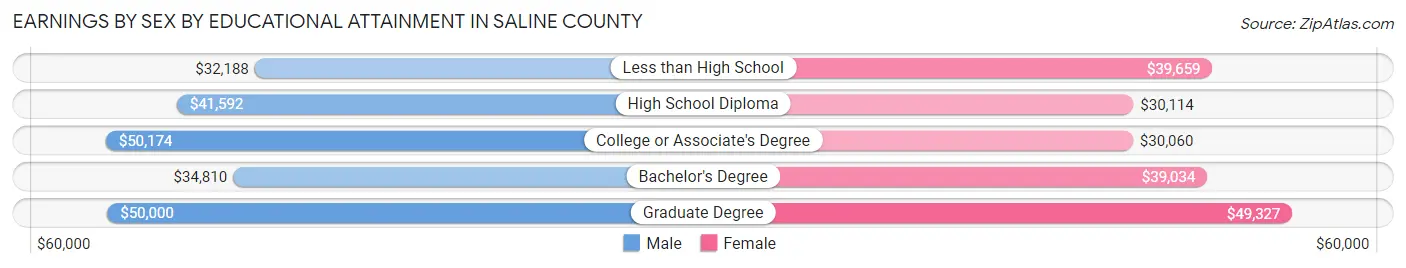
Earnings by Sex by Educational Attainment in Saline County
Average earnings in Saline County are $40,956 for men and $35,557 for women, a difference of 13.2%. Men with an educational attainment of college or associate's degree enjoy the highest average annual earnings of $50,174, while those with less than high school education earn the least with $32,188. Women with an educational attainment of graduate degree earn the most with the average annual earnings of $49,327, while those with college or associate's degree education have the smallest earnings of $30,060.
| Educational Attainment | Male Income | Female Income |
| Less than High School | $32,188 | $39,659 |
| High School Diploma | $41,592 | $30,114 |
| College or Associate's Degree | $50,174 | $30,060 |
| Bachelor's Degree | $34,810 | $39,034 |
| Graduate Degree | $50,000 | $49,327 |
| Total | $40,956 | $35,557 |
Family Income in Saline County
Family Income Brackets in Saline County
According to the Saline County family income data, there are 999 families falling into the $75,000 to $99,999 income range, which is the most common income bracket and makes up 20.7% of all families. Conversely, the less than $10,000 income bracket is the least frequent group with only 72 families (1.5%) belonging to this category.
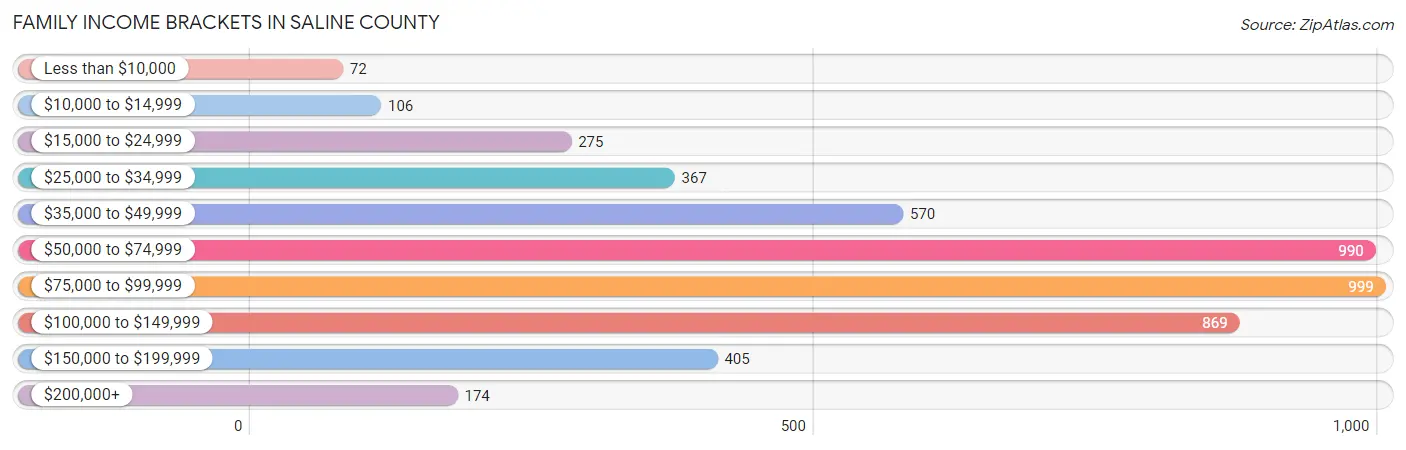
| Income Bracket | # Families | % Families |
| Less than $10,000 | 72 | 1.5% |
| $10,000 to $14,999 | 106 | 2.2% |
| $15,000 to $24,999 | 275 | 5.7% |
| $25,000 to $34,999 | 367 | 7.6% |
| $35,000 to $49,999 | 570 | 11.8% |
| $50,000 to $74,999 | 990 | 20.5% |
| $75,000 to $99,999 | 999 | 20.7% |
| $100,000 to $149,999 | 869 | 18.0% |
| $150,000 to $199,999 | 405 | 8.4% |
| $200,000+ | 174 | 3.6% |
Family Income by Famaliy Size in Saline County
5-person families (302 | 6.3%) account for the highest median family income in Saline County with $99,167 per family, while 2-person families (2,529 | 52.4%) have the highest median income of $34,564 per family member.
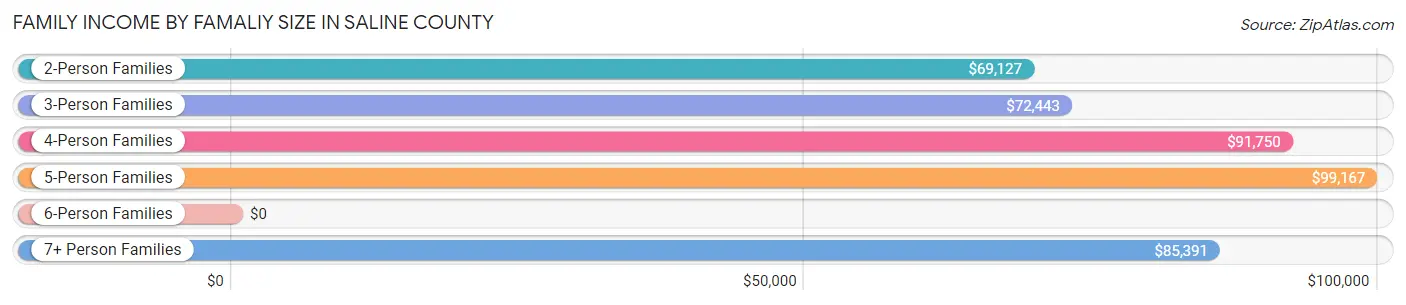
| Income Bracket | # Families | Median Income |
| 2-Person Families | 2,529 (52.4%) | $69,127 |
| 3-Person Families | 1,139 (23.6%) | $72,443 |
| 4-Person Families | 719 (14.9%) | $91,750 |
| 5-Person Families | 302 (6.3%) | $99,167 |
| 6-Person Families | 103 (2.1%) | $0 |
| 7+ Person Families | 35 (0.7%) | $85,391 |
| Total | 4,827 (100.0%) | $76,335 |
Family Income by Number of Earners in Saline County
The median family income in Saline County is $76,335, with families comprising 3+ earners (514) having the highest median family income of $100,750, while families with no earners (658) have the lowest median family income of $40,125, accounting for 10.6% and 13.6% of families, respectively.
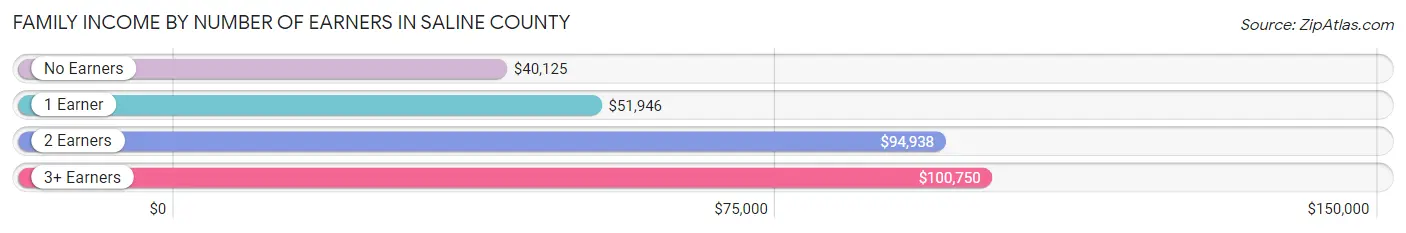
| Number of Earners | # Families | Median Income |
| No Earners | 658 (13.6%) | $40,125 |
| 1 Earner | 1,627 (33.7%) | $51,946 |
| 2 Earners | 2,028 (42.0%) | $94,938 |
| 3+ Earners | 514 (10.6%) | $100,750 |
| Total | 4,827 (100.0%) | $76,335 |
Household Income in Saline County
Household Income Brackets in Saline County
With 1,413 households falling in the category, the $50,000 to $74,999 income range is the most frequent in Saline County, accounting for 18.1% of all households. In contrast, only 219 households (2.8%) fall into the $200,000+ income bracket, making it the least populous group.
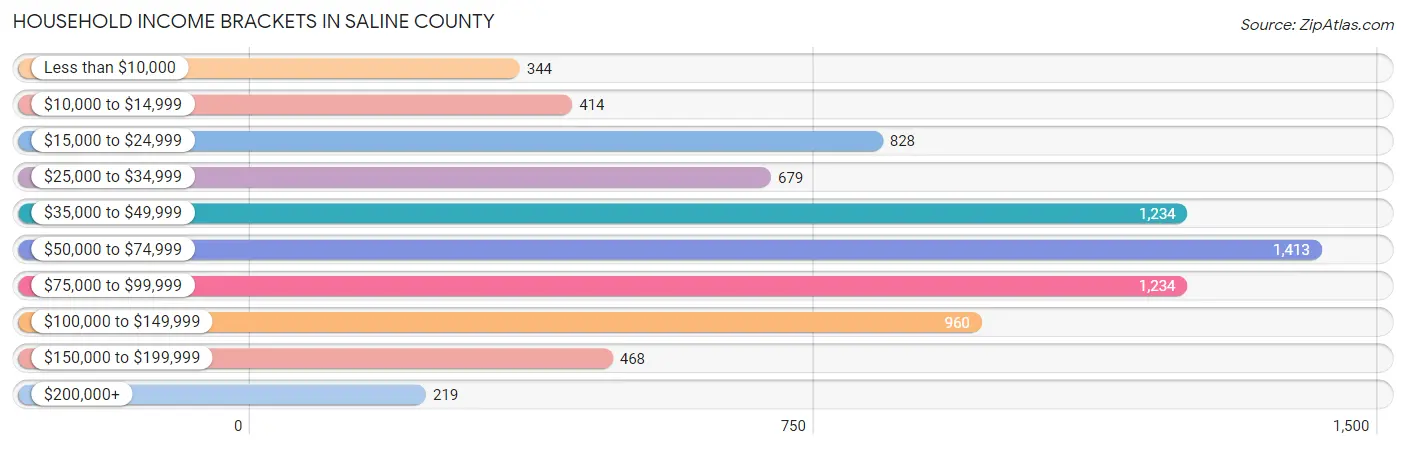
| Income Bracket | # Households | % Households |
| Less than $10,000 | 344 | 4.4% |
| $10,000 to $14,999 | 414 | 5.3% |
| $15,000 to $24,999 | 828 | 10.6% |
| $25,000 to $34,999 | 679 | 8.7% |
| $35,000 to $49,999 | 1,234 | 15.8% |
| $50,000 to $74,999 | 1,413 | 18.1% |
| $75,000 to $99,999 | 1,234 | 15.8% |
| $100,000 to $149,999 | 960 | 12.3% |
| $150,000 to $199,999 | 468 | 6.0% |
| $200,000+ | 219 | 2.8% |
Household Income by Householder Age in Saline County
The median household income in Saline County is $55,396, with the highest median household income of $72,391 found in the 25 to 44 years age bracket for the primary householder. A total of 2,242 households (28.7%) fall into this category. Meanwhile, the 65+ years age bracket for the primary householder has the lowest median household income of $40,531, with 2,572 households (32.9%) in this group.
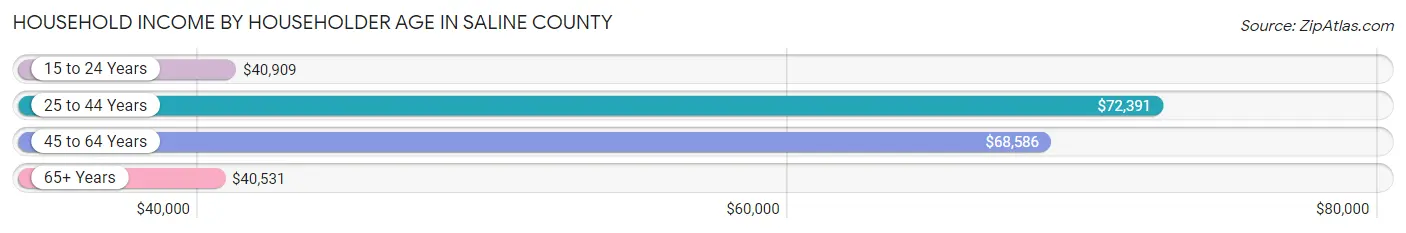
| Income Bracket | # Households | Median Income |
| 15 to 24 Years | 316 (4.1%) | $40,909 |
| 25 to 44 Years | 2,242 (28.7%) | $72,391 |
| 45 to 64 Years | 2,678 (34.3%) | $68,586 |
| 65+ Years | 2,572 (32.9%) | $40,531 |
| Total | 7,808 (100.0%) | $55,396 |
Poverty in Saline County
Income Below Poverty by Sex and Age in Saline County
With 11.4% poverty level for males and 14.6% for females among the residents of Saline County, 5 year old males and 18 to 24 year old females are the most vulnerable to poverty, with 27 males (29.3%) and 241 females (25.6%) in their respective age groups living below the poverty level.
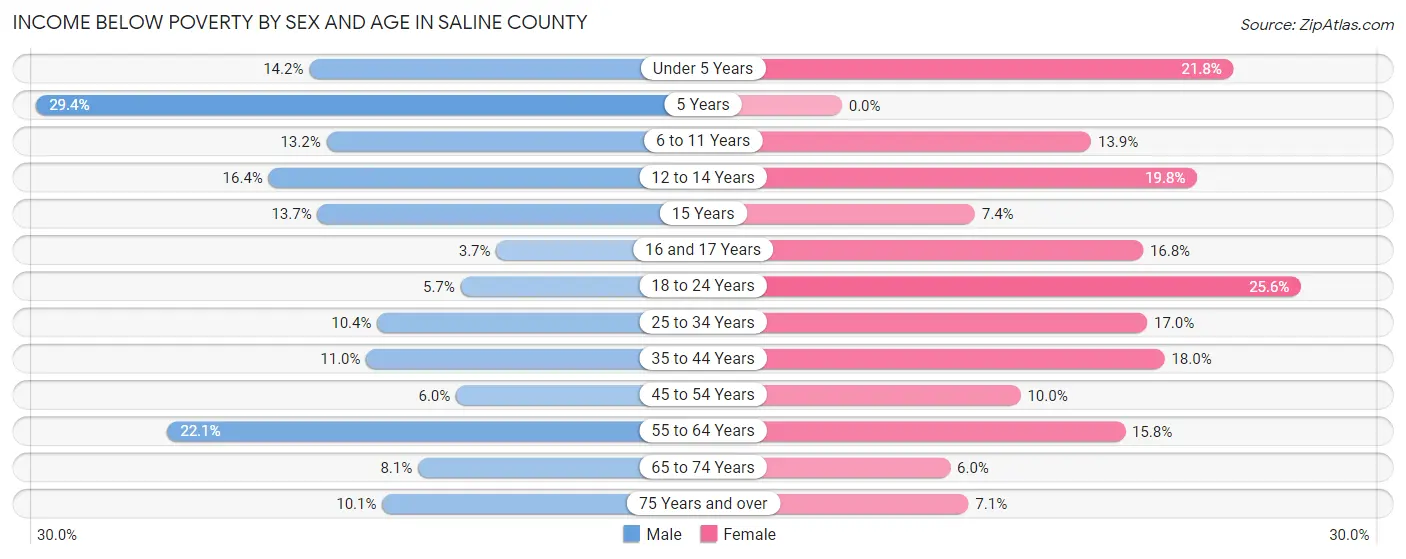
| Age Bracket | Male | Female |
| Under 5 Years | 102 (14.1%) | 108 (21.8%) |
| 5 Years | 27 (29.3%) | 0 (0.0%) |
| 6 to 11 Years | 103 (13.2%) | 117 (13.9%) |
| 12 to 14 Years | 65 (16.4%) | 111 (19.8%) |
| 15 Years | 23 (13.7%) | 8 (7.4%) |
| 16 and 17 Years | 9 (3.7%) | 55 (16.8%) |
| 18 to 24 Years | 79 (5.7%) | 241 (25.6%) |
| 25 to 34 Years | 167 (10.4%) | 222 (17.0%) |
| 35 to 44 Years | 136 (11.0%) | 220 (18.0%) |
| 45 to 54 Years | 67 (6.0%) | 117 (10.0%) |
| 55 to 64 Years | 316 (22.1%) | 235 (15.8%) |
| 65 to 74 Years | 91 (8.1%) | 66 (6.0%) |
| 75 Years and over | 66 (10.1%) | 70 (7.0%) |
| Total | 1,251 (11.4%) | 1,570 (14.6%) |
Income Above Poverty by Sex and Age in Saline County
According to the poverty statistics in Saline County, males aged 16 and 17 years and females aged 5 years are the age groups that are most secure financially, with 96.3% of males and 100.0% of females in these age groups living above the poverty line.
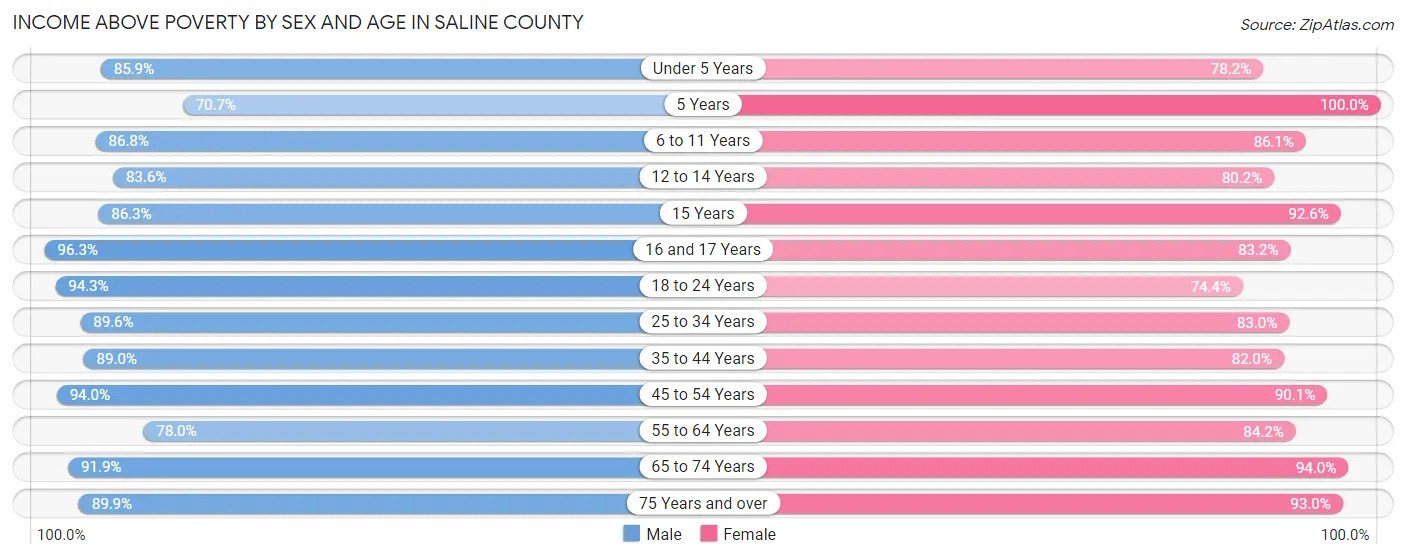
| Age Bracket | Male | Female |
| Under 5 Years | 619 (85.9%) | 387 (78.2%) |
| 5 Years | 65 (70.7%) | 187 (100.0%) |
| 6 to 11 Years | 678 (86.8%) | 726 (86.1%) |
| 12 to 14 Years | 331 (83.6%) | 450 (80.2%) |
| 15 Years | 145 (86.3%) | 100 (92.6%) |
| 16 and 17 Years | 232 (96.3%) | 273 (83.2%) |
| 18 to 24 Years | 1,303 (94.3%) | 701 (74.4%) |
| 25 to 34 Years | 1,445 (89.6%) | 1,084 (83.0%) |
| 35 to 44 Years | 1,104 (89.0%) | 1,004 (82.0%) |
| 45 to 54 Years | 1,055 (94.0%) | 1,059 (90.0%) |
| 55 to 64 Years | 1,117 (77.9%) | 1,255 (84.2%) |
| 65 to 74 Years | 1,034 (91.9%) | 1,028 (94.0%) |
| 75 Years and over | 589 (89.9%) | 923 (92.9%) |
| Total | 9,717 (88.6%) | 9,177 (85.4%) |
Income Below Poverty Among Married-Couple Families in Saline County
The poverty statistics for married-couple families in Saline County show that 4.6% or 175 of the total 3,785 families live below the poverty line. Families with 3 or 4 children have the highest poverty rate of 11.1%, comprising of 24 families. On the other hand, families with 5 or more children have the lowest poverty rate of 0.0%, which includes 0 families.
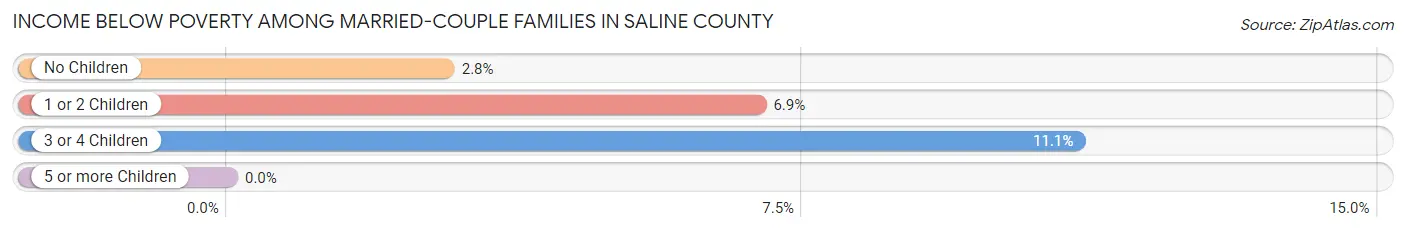
| Children | Above Poverty | Below Poverty |
| No Children | 2,265 (97.2%) | 66 (2.8%) |
| 1 or 2 Children | 1,147 (93.1%) | 85 (6.9%) |
| 3 or 4 Children | 193 (88.9%) | 24 (11.1%) |
| 5 or more Children | 5 (100.0%) | 0 (0.0%) |
| Total | 3,610 (95.4%) | 175 (4.6%) |
Income Below Poverty Among Single-Parent Households in Saline County
According to the poverty data in Saline County, 17.6% or 66 single-father households and 24.7% or 165 single-mother households are living below the poverty line. Among single-father households, those with 3 or 4 children have the highest poverty rate, with 30 households (88.2%) experiencing poverty. Likewise, among single-mother households, those with 3 or 4 children have the highest poverty rate, with 9 households (90.0%) falling below the poverty line.
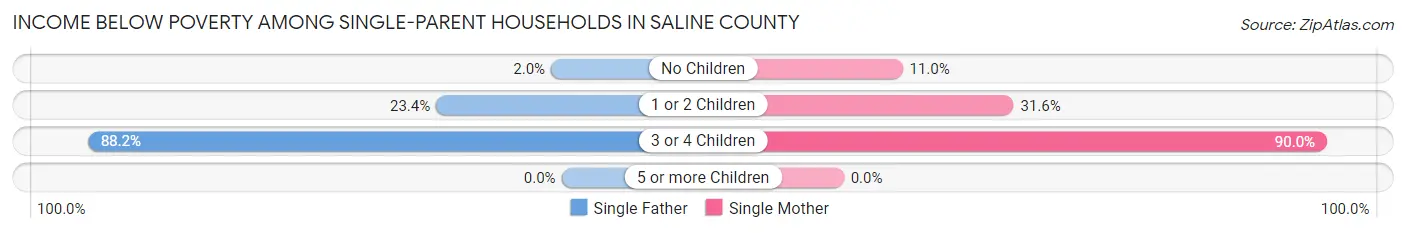
| Children | Single Father | Single Mother |
| No Children | 4 (2.0%) | 25 (11.0%) |
| 1 or 2 Children | 32 (23.4%) | 131 (31.6%) |
| 3 or 4 Children | 30 (88.2%) | 9 (90.0%) |
| 5 or more Children | 0 (0.0%) | 0 (0.0%) |
| Total | 66 (17.6%) | 165 (24.7%) |
Income Below Poverty Among Married-Couple vs Single-Parent Households in Saline County
The poverty data for Saline County shows that 175 of the married-couple family households (4.6%) and 231 of the single-parent households (22.2%) are living below the poverty level. Within the married-couple family households, those with 3 or 4 children have the highest poverty rate, with 24 households (11.1%) falling below the poverty line. Among the single-parent households, those with 3 or 4 children have the highest poverty rate, with 39 household (88.6%) living below poverty.
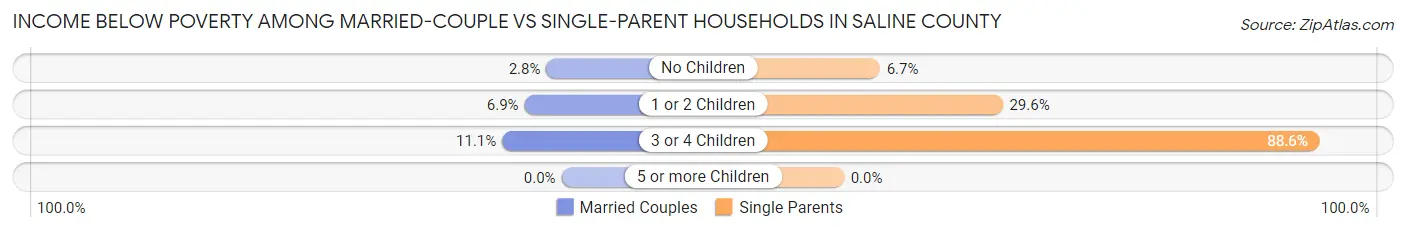
| Children | Married-Couple Families | Single-Parent Households |
| No Children | 66 (2.8%) | 29 (6.7%) |
| 1 or 2 Children | 85 (6.9%) | 163 (29.6%) |
| 3 or 4 Children | 24 (11.1%) | 39 (88.6%) |
| 5 or more Children | 0 (0.0%) | 0 (0.0%) |
| Total | 175 (4.6%) | 231 (22.2%) |
Race in Saline County
The most populous races in Saline County are White / Caucasian (18,852 | 81.2%), Hispanic or Latino (2,577 | 11.1%), and Two or more Races (1,501 | 6.5%).
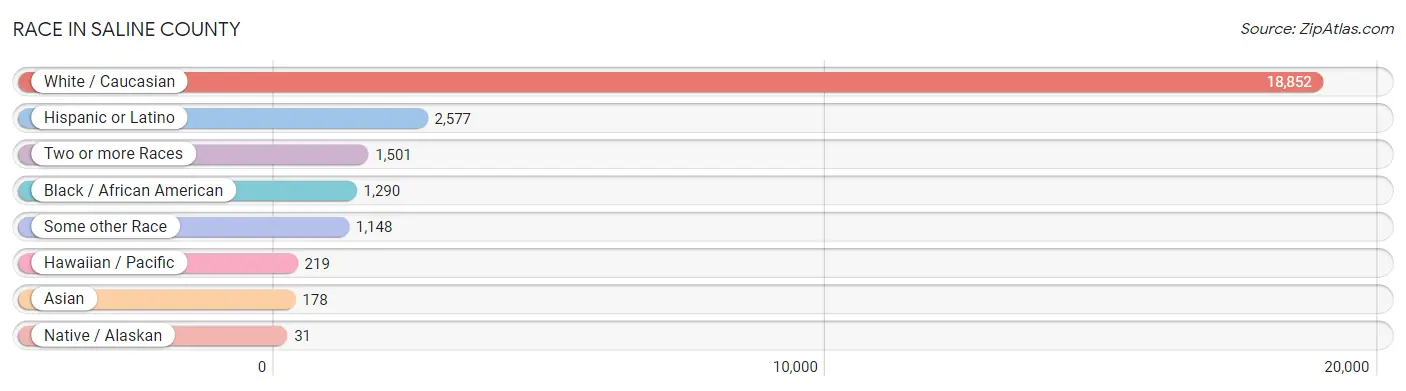
| Race | # Population | % Population |
| Asian | 178 | 0.8% |
| Black / African American | 1,290 | 5.6% |
| Hawaiian / Pacific | 219 | 0.9% |
| Hispanic or Latino | 2,577 | 11.1% |
| Native / Alaskan | 31 | 0.1% |
| White / Caucasian | 18,852 | 81.2% |
| Two or more Races | 1,501 | 6.5% |
| Some other Race | 1,148 | 4.9% |
| Total | 23,219 | 100.0% |
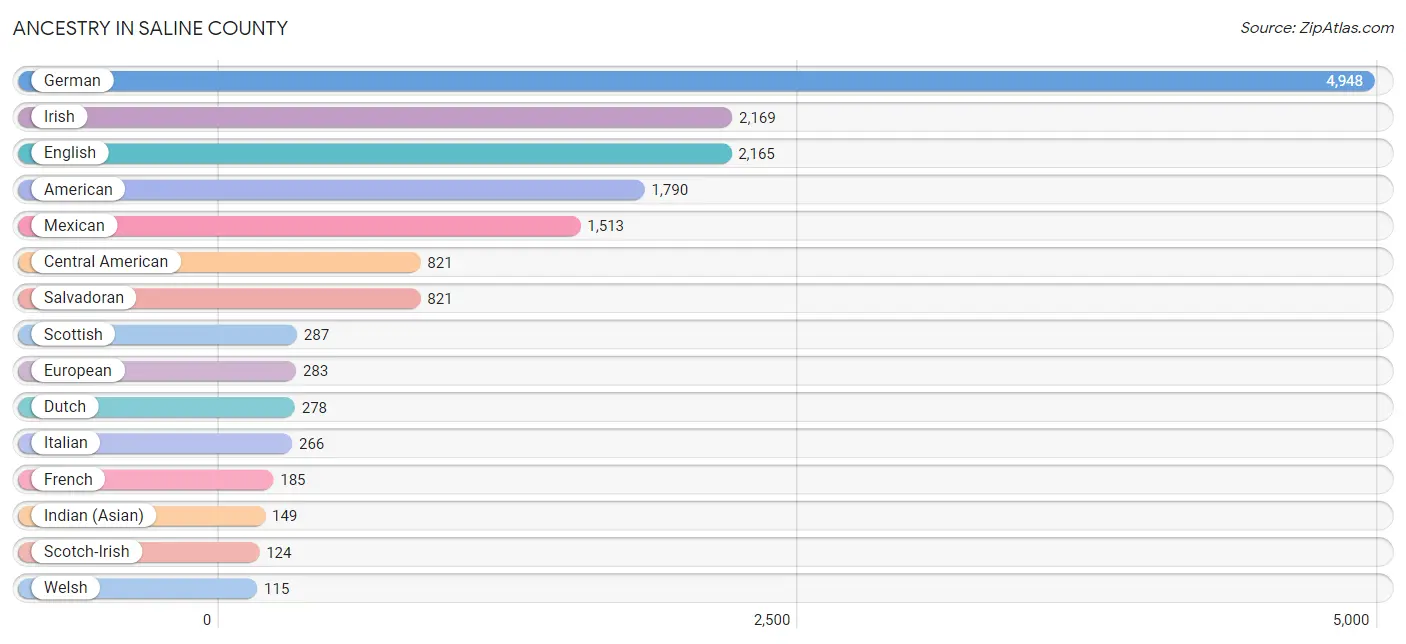
Ancestry in Saline County
The most populous ancestries reported in Saline County are German (4,948 | 21.3%), Irish (2,169 | 9.3%), English (2,165 | 9.3%), American (1,790 | 7.7%), and Mexican (1,513 | 6.5%), together accounting for 54.2% of all Saline County residents.
| Ancestry | # Population | % Population |
| African | 10 | 0.0% |
| American | 1,790 | 7.7% |
| Apache | 11 | 0.1% |
| Argentinean | 1 | 0.0% |
| Australian | 5 | 0.0% |
| Austrian | 5 | 0.0% |
| Bhutanese | 50 | 0.2% |
| Blackfeet | 35 | 0.2% |
| Brazilian | 16 | 0.1% |
| British | 85 | 0.4% |
| Burmese | 2 | 0.0% |
| Canadian | 3 | 0.0% |
| Central American | 821 | 3.5% |
| Cherokee | 53 | 0.2% |
| Colombian | 3 | 0.0% |
| Cuban | 4 | 0.0% |
| Czech | 4 | 0.0% |
| Danish | 43 | 0.2% |
| Dutch | 278 | 1.2% |
| Dutch West Indian | 5 | 0.0% |
| Eastern European | 6 | 0.0% |
| English | 2,165 | 9.3% |
| European | 283 | 1.2% |
| Fijian | 50 | 0.2% |
| Finnish | 25 | 0.1% |
| French | 185 | 0.8% |
| French Canadian | 20 | 0.1% |
| German | 4,948 | 21.3% |
| Greek | 20 | 0.1% |
| Hungarian | 22 | 0.1% |
| Indian (Asian) | 149 | 0.6% |
| Irish | 2,169 | 9.3% |
| Iroquois | 4 | 0.0% |
| Italian | 266 | 1.1% |
| Jamaican | 14 | 0.1% |
| Japanese | 3 | 0.0% |
| Korean | 9 | 0.0% |
| Marshallese | 41 | 0.2% |
| Mexican | 1,513 | 6.5% |
| Mexican American Indian | 15 | 0.1% |
| Native Hawaiian | 25 | 0.1% |
| Northern European | 25 | 0.1% |
| Norwegian | 63 | 0.3% |
| Polish | 50 | 0.2% |
| Portuguese | 2 | 0.0% |
| Potawatomi | 3 | 0.0% |
| Puerto Rican | 17 | 0.1% |
| Russian | 9 | 0.0% |
| Salvadoran | 821 | 3.5% |
| Samoan | 19 | 0.1% |
| Scandinavian | 19 | 0.1% |
| Scotch-Irish | 124 | 0.5% |
| Scottish | 287 | 1.2% |
| Sioux | 2 | 0.0% |
| South American | 4 | 0.0% |
| Spaniard | 31 | 0.1% |
| Spanish | 105 | 0.4% |
| Sri Lankan | 59 | 0.3% |
| Subsaharan African | 20 | 0.1% |
| Swedish | 107 | 0.5% |
| Swiss | 31 | 0.1% |
| Thai | 11 | 0.1% |
| Ukrainian | 3 | 0.0% |
| Welsh | 115 | 0.5% |
| Yup'ik | 8 | 0.0% | View All 65 Rows |
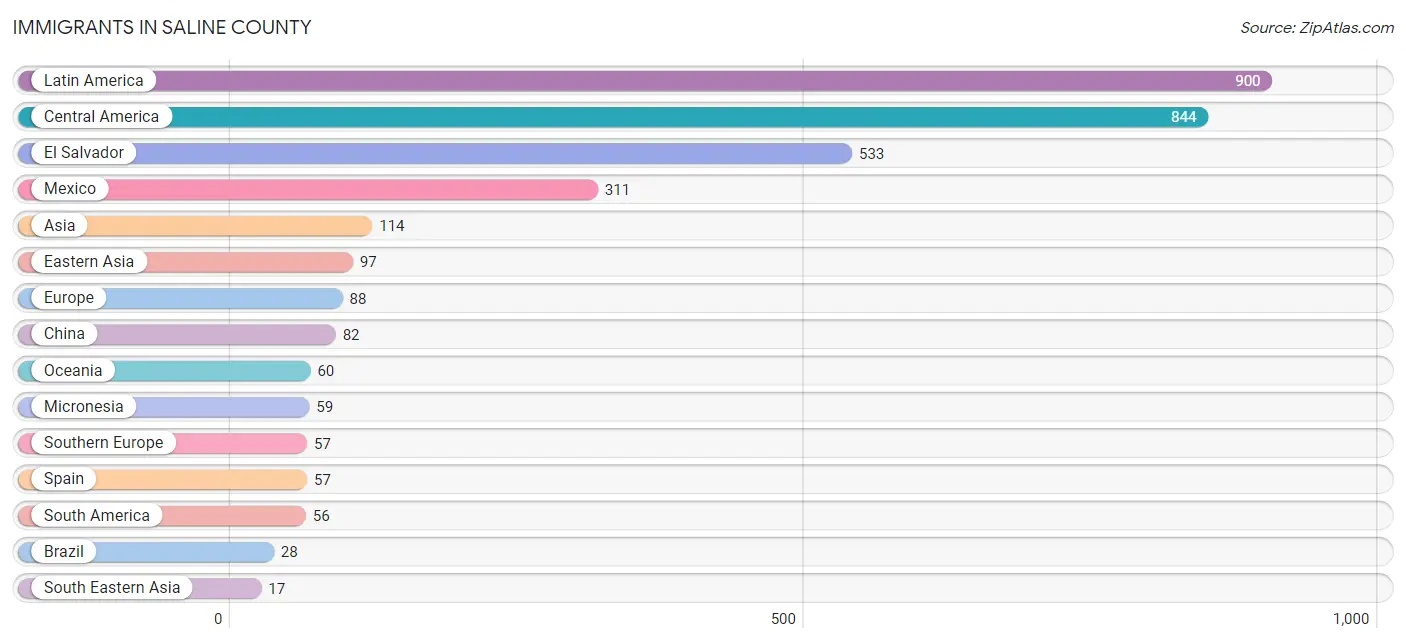
Immigrants in Saline County
The most numerous immigrant groups reported in Saline County came from Latin America (900 | 3.9%), Central America (844 | 3.6%), El Salvador (533 | 2.3%), Mexico (311 | 1.3%), and Asia (114 | 0.5%), together accounting for 11.6% of all Saline County residents.
| Immigration Origin | # Population | % Population |
| Africa | 6 | 0.0% |
| Argentina | 16 | 0.1% |
| Asia | 114 | 0.5% |
| Australia | 1 | 0.0% |
| Brazil | 28 | 0.1% |
| Cambodia | 3 | 0.0% |
| Central America | 844 | 3.6% |
| China | 82 | 0.4% |
| Colombia | 12 | 0.1% |
| Eastern Asia | 97 | 0.4% |
| Eastern Europe | 3 | 0.0% |
| El Salvador | 533 | 2.3% |
| England | 15 | 0.1% |
| Europe | 88 | 0.4% |
| Germany | 9 | 0.0% |
| Japan | 13 | 0.1% |
| Korea | 2 | 0.0% |
| Latin America | 900 | 3.9% |
| Mexico | 311 | 1.3% |
| Micronesia | 59 | 0.3% |
| Netherlands | 3 | 0.0% |
| Northern Europe | 16 | 0.1% |
| Oceania | 60 | 0.3% |
| Philippines | 1 | 0.0% |
| Russia | 3 | 0.0% |
| Scotland | 1 | 0.0% |
| South Africa | 6 | 0.0% |
| South America | 56 | 0.2% |
| South Eastern Asia | 17 | 0.1% |
| Southern Europe | 57 | 0.3% |
| Spain | 57 | 0.3% |
| Thailand | 6 | 0.0% |
| Vietnam | 7 | 0.0% |
| Western Europe | 12 | 0.1% | View All 34 Rows |
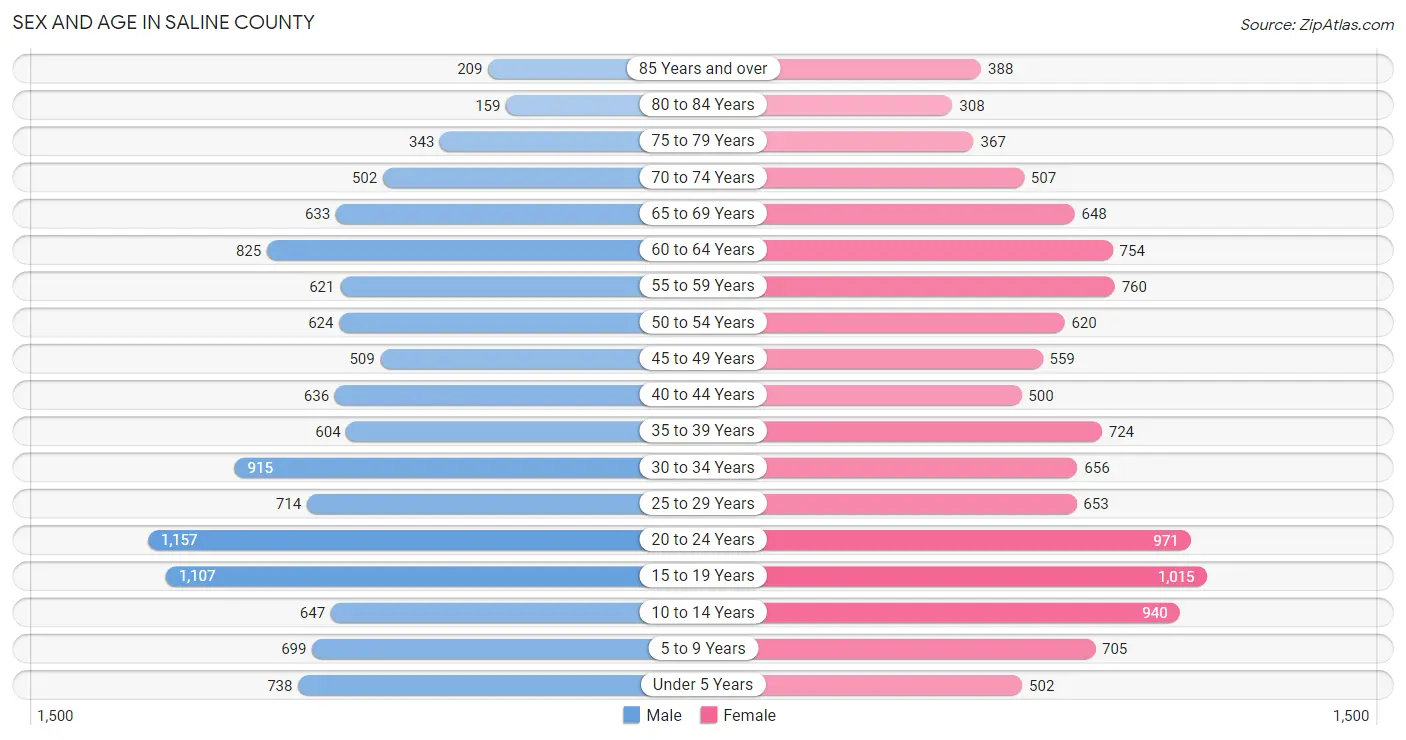
Sex and Age in Saline County
Sex and Age in Saline County
The most populous age groups in Saline County are 20 to 24 Years (1,157 | 9.9%) for men and 15 to 19 Years (1,015 | 8.8%) for women.
| Age Bracket | Male | Female |
| Under 5 Years | 738 (6.3%) | 502 (4.3%) |
| 5 to 9 Years | 699 (6.0%) | 705 (6.1%) |
| 10 to 14 Years | 647 (5.6%) | 940 (8.1%) |
| 15 to 19 Years | 1,107 (9.5%) | 1,015 (8.8%) |
| 20 to 24 Years | 1,157 (9.9%) | 971 (8.4%) |
| 25 to 29 Years | 714 (6.1%) | 653 (5.6%) |
| 30 to 34 Years | 915 (7.9%) | 656 (5.7%) |
| 35 to 39 Years | 604 (5.2%) | 724 (6.2%) |
| 40 to 44 Years | 636 (5.5%) | 500 (4.3%) |
| 45 to 49 Years | 509 (4.4%) | 559 (4.8%) |
| 50 to 54 Years | 624 (5.4%) | 620 (5.4%) |
| 55 to 59 Years | 621 (5.3%) | 760 (6.6%) |
| 60 to 64 Years | 825 (7.1%) | 754 (6.5%) |
| 65 to 69 Years | 633 (5.4%) | 648 (5.6%) |
| 70 to 74 Years | 502 (4.3%) | 507 (4.4%) |
| 75 to 79 Years | 343 (2.9%) | 367 (3.2%) |
| 80 to 84 Years | 159 (1.4%) | 308 (2.7%) |
| 85 Years and over | 209 (1.8%) | 388 (3.4%) |
| Total | 11,642 (100.0%) | 11,577 (100.0%) |
Families and Households in Saline County
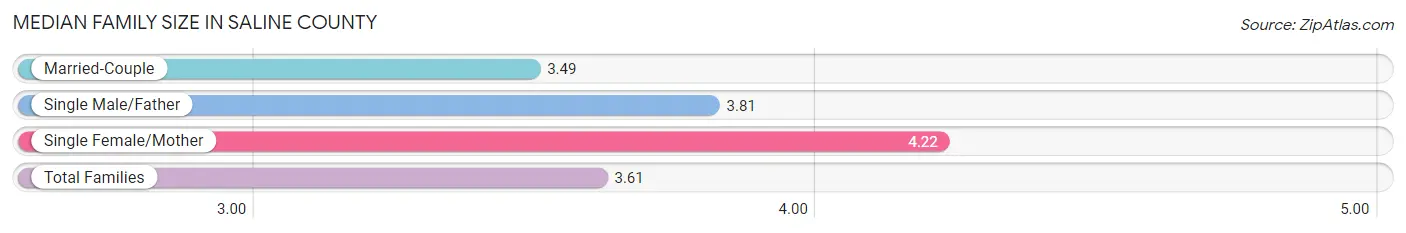
Median Family Size in Saline County
The median family size in Saline County is 3.61 persons per family, with single female/mother families (667 | 13.8%) accounting for the largest median family size of 4.22 persons per family. On the other hand, married-couple families (3,785 | 78.4%) represent the smallest median family size with 3.49 persons per family.
| Family Type | # Families | Family Size |
| Married-Couple | 3,785 (78.4%) | 3.49 |
| Single Male/Father | 375 (7.8%) | 3.81 |
| Single Female/Mother | 667 (13.8%) | 4.22 |
| Total Families | 4,827 (100.0%) | 3.61 |
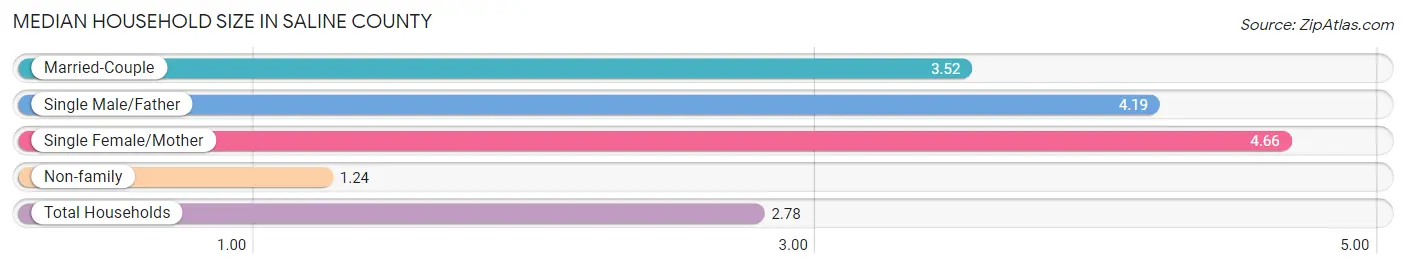
Median Household Size in Saline County
The median household size in Saline County is 2.78 persons per household, with single female/mother households (667 | 8.5%) accounting for the largest median household size of 4.66 persons per household. non-family households (2,981 | 38.2%) represent the smallest median household size with 1.24 persons per household.
| Household Type | # Households | Household Size |
| Married-Couple | 3,785 (48.5%) | 3.52 |
| Single Male/Father | 375 (4.8%) | 4.19 |
| Single Female/Mother | 667 (8.5%) | 4.66 |
| Non-family | 2,981 (38.2%) | 1.24 |
| Total Households | 7,808 (100.0%) | 2.78 |
Household Size by Marriage Status in Saline County
Out of a total of 7,808 households in Saline County, 4,827 (61.8%) are family households, while 2,981 (38.2%) are nonfamily households. The most numerous type of family households are 2-person households, comprising 2,406, and the most common type of nonfamily households are 1-person households, comprising 2,593.
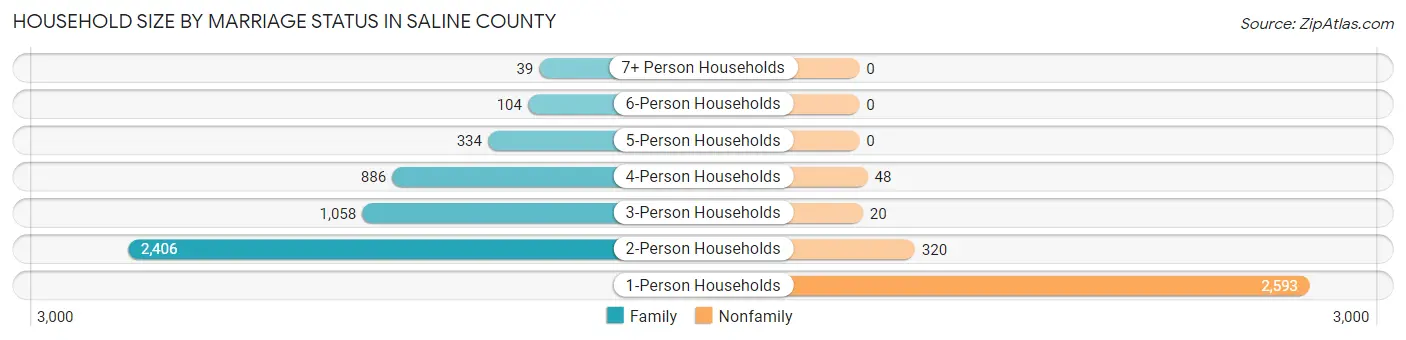
| Household Size | Family Households | Nonfamily Households |
| 1-Person Households | - | 2,593 (33.2%) |
| 2-Person Households | 2,406 (30.8%) | 320 (4.1%) |
| 3-Person Households | 1,058 (13.6%) | 20 (0.3%) |
| 4-Person Households | 886 (11.4%) | 48 (0.6%) |
| 5-Person Households | 334 (4.3%) | 0 (0.0%) |
| 6-Person Households | 104 (1.3%) | 0 (0.0%) |
| 7+ Person Households | 39 (0.5%) | 0 (0.0%) |
| Total | 4,827 (61.8%) | 2,981 (38.2%) |
Female Fertility in Saline County
Fertility by Age in Saline County
Average fertility rate in Saline County is 45.0 births per 1,000 women. Women in the age bracket of 20 to 34 years have the highest fertility rate with 90.0 births per 1,000 women. Women in the age bracket of 20 to 34 years acount for 88.4% of all women with births.
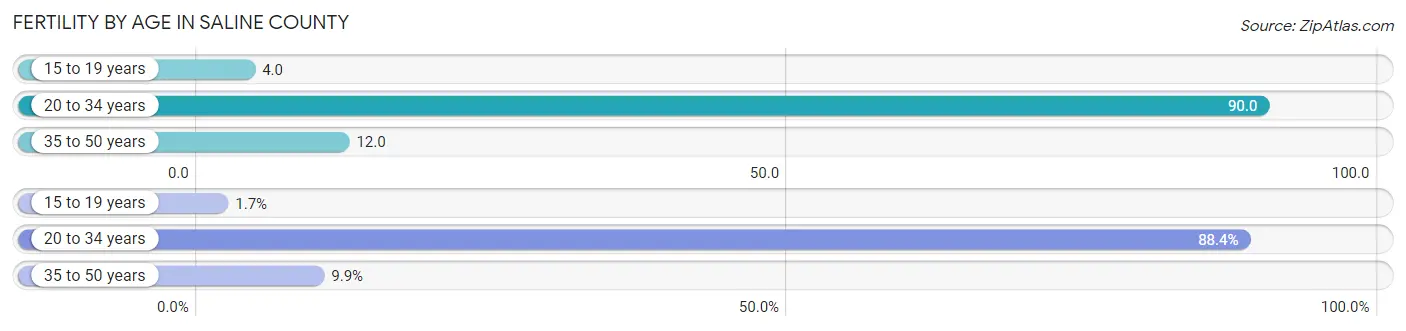
| Age Bracket | Women with Births | Births / 1,000 Women |
| 15 to 19 years | 4 (1.7%) | 4.0 |
| 20 to 34 years | 206 (88.4%) | 90.0 |
| 35 to 50 years | 23 (9.9%) | 12.0 |
| Total | 233 (100.0%) | 45.0 |
Fertility by Age by Marriage Status in Saline County
24.9% of women with births (233) in Saline County are married. The highest percentage of unmarried women with births falls into 15 to 19 years age bracket with 100.0% of them unmarried at the time of birth, while the lowest percentage of unmarried women with births belong to 20 to 34 years age bracket with 71.8% of them unmarried.
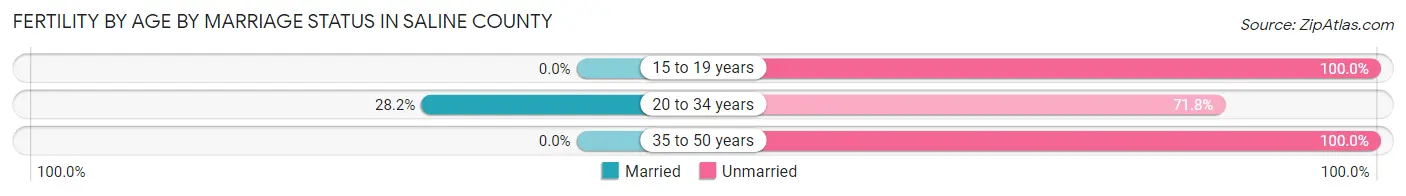
| Age Bracket | Married | Unmarried |
| 15 to 19 years | 0 (0.0%) | 4 (100.0%) |
| 20 to 34 years | 58 (28.2%) | 148 (71.8%) |
| 35 to 50 years | 0 (0.0%) | 23 (100.0%) |
| Total | 58 (24.9%) | 175 (75.1%) |
Fertility by Education in Saline County
Average fertility rate in Saline County is 45.0 births per 1,000 women. Women with the education attainment of graduate degree have the highest fertility rate of 91.0 births per 1,000 women, while women with the education attainment of college or associate's degree have the lowest fertility at 27.0 births per 1,000 women. Women with the education attainment of high school diploma represent 29.6% of all women with births.
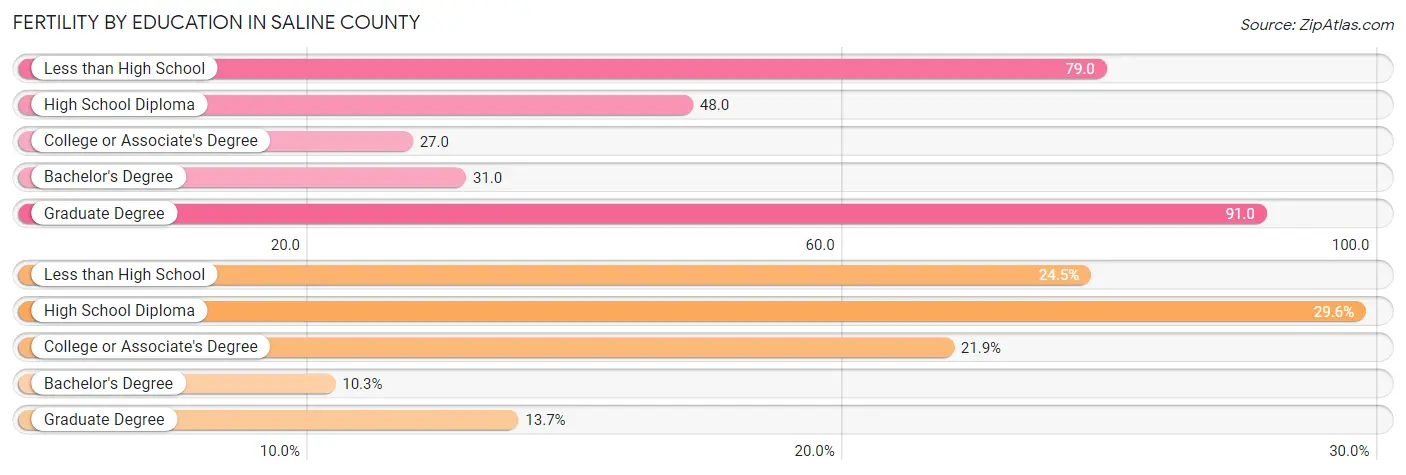
| Educational Attainment | Women with Births | Births / 1,000 Women |
| Less than High School | 57 (24.5%) | 79.0 |
| High School Diploma | 69 (29.6%) | 48.0 |
| College or Associate's Degree | 51 (21.9%) | 27.0 |
| Bachelor's Degree | 24 (10.3%) | 31.0 |
| Graduate Degree | 32 (13.7%) | 91.0 |
| Total | 233 (100.0%) | 45.0 |
Fertility by Education by Marriage Status in Saline County
75.1% of women with births in Saline County are unmarried. Women with the educational attainment of bachelor's degree are most likely to be married with 83.3% of them married at childbirth, while women with the educational attainment of less than high school are least likely to be married with 100.0% of them unmarried at childbirth.
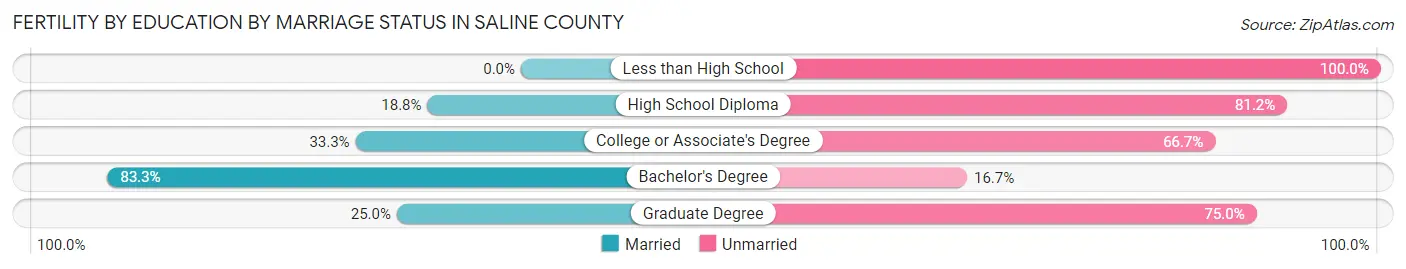
| Educational Attainment | Married | Unmarried |
| Less than High School | 0 (0.0%) | 57 (100.0%) |
| High School Diploma | 13 (18.8%) | 56 (81.2%) |
| College or Associate's Degree | 17 (33.3%) | 34 (66.7%) |
| Bachelor's Degree | 20 (83.3%) | 4 (16.7%) |
| Graduate Degree | 8 (25.0%) | 24 (75.0%) |
| Total | 58 (24.9%) | 175 (75.1%) |
Employment Characteristics in Saline County
Employment by Class of Employer in Saline County
Among the 10,279 employed individuals in Saline County, private company employees (6,283 | 61.1%), not-for-profit organizations (996 | 9.7%), and local government employees (905 | 8.8%) make up the most common classes of employment.
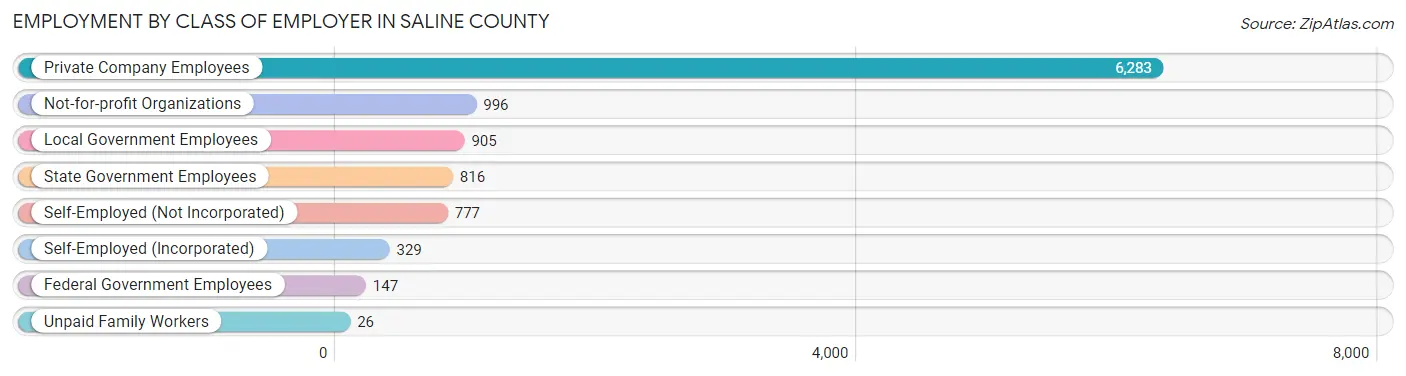
| Employer Class | # Employees | % Employees |
| Private Company Employees | 6,283 | 61.1% |
| Self-Employed (Incorporated) | 329 | 3.2% |
| Self-Employed (Not Incorporated) | 777 | 7.6% |
| Not-for-profit Organizations | 996 | 9.7% |
| Local Government Employees | 905 | 8.8% |
| State Government Employees | 816 | 7.9% |
| Federal Government Employees | 147 | 1.4% |
| Unpaid Family Workers | 26 | 0.3% |
| Total | 10,279 | 100.0% |
Employment Status by Age in Saline County
According to the labor force statistics for Saline County, out of the total population over 16 years of age (18,685), 57.6% or 10,763 individuals are in the labor force, with 2.7% or 291 of them unemployed. The age group with the highest labor force participation rate is 30 to 34 years, with 86.6% or 1,360 individuals in the labor force. Within the labor force, the 45 to 54 years age range has the highest percentage of unemployed individuals, with 5.6% or 103 of them being unemployed.
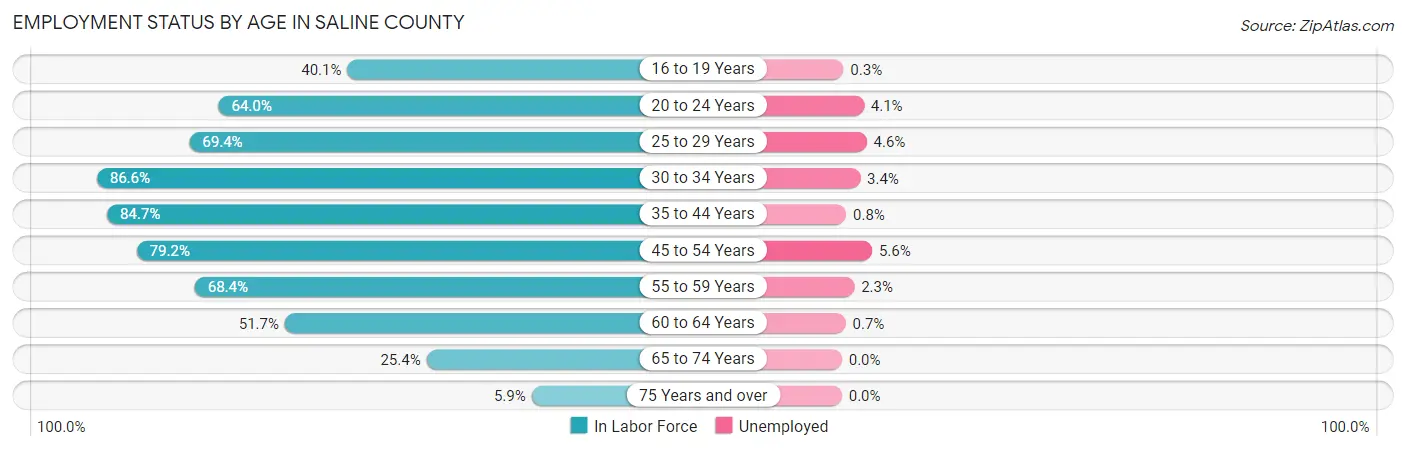
| Age Bracket | In Labor Force | Unemployed |
| 16 to 19 Years | 729 (40.1%) | 2 (0.3%) |
| 20 to 24 Years | 1,362 (64.0%) | 56 (4.1%) |
| 25 to 29 Years | 949 (69.4%) | 44 (4.6%) |
| 30 to 34 Years | 1,360 (86.6%) | 46 (3.4%) |
| 35 to 44 Years | 2,087 (84.7%) | 17 (0.8%) |
| 45 to 54 Years | 1,831 (79.2%) | 103 (5.6%) |
| 55 to 59 Years | 945 (68.4%) | 22 (2.3%) |
| 60 to 64 Years | 816 (51.7%) | 6 (0.7%) |
| 65 to 74 Years | 582 (25.4%) | 0 (0.0%) |
| 75 Years and over | 105 (5.9%) | 0 (0.0%) |
| Total | 10,763 (57.6%) | 291 (2.7%) |
Employment Status by Educational Attainment in Saline County
According to labor force statistics for Saline County, 74.8% of individuals (7,984) out of the total population between 25 and 64 years of age (10,674) are in the labor force, with 3.0% or 240 of them being unemployed. The group with the highest labor force participation rate are those with the educational attainment of bachelor's degree or higher, with 90.0% or 2,400 individuals in the labor force. Within the labor force, individuals with less than high school education have the highest percentage of unemployment, with 13.0% or 102 of them being unemployed.
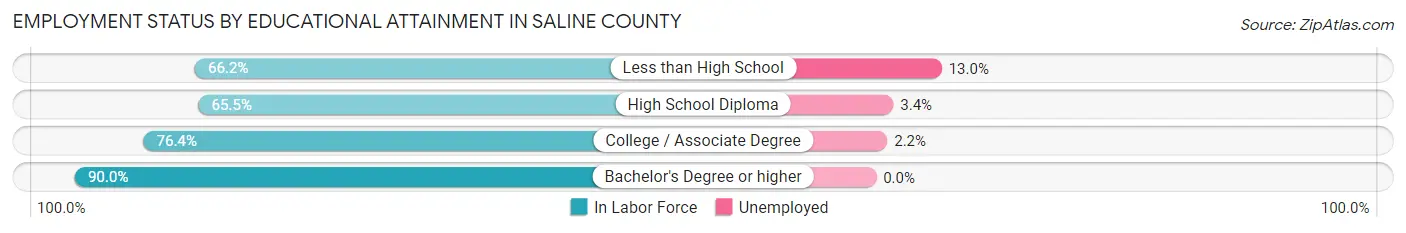
| Educational Attainment | In Labor Force | Unemployed |
| Less than High School | 782 (66.2%) | 154 (13.0%) |
| High School Diploma | 2,458 (65.5%) | 128 (3.4%) |
| College / Associate Degree | 2,347 (76.4%) | 68 (2.2%) |
| Bachelor's Degree or higher | 2,400 (90.0%) | 0 (0.0%) |
| Total | 7,984 (74.8%) | 320 (3.0%) |
Employment Occupations by Sex in Saline County
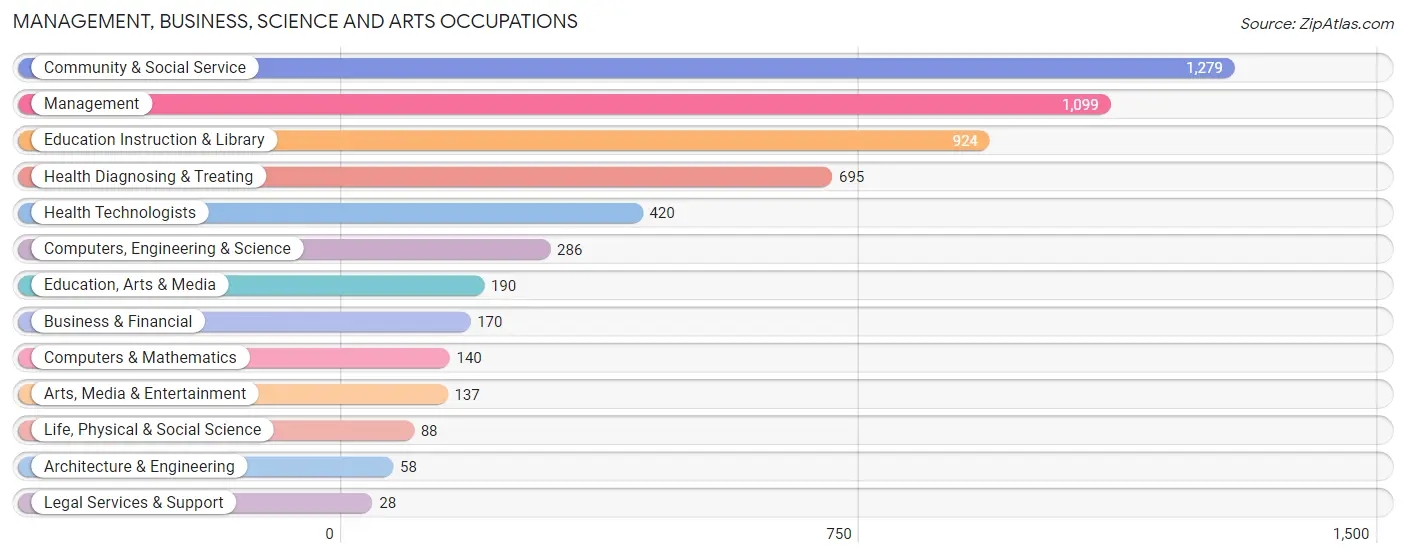
Management, Business, Science and Arts Occupations
The most common Management, Business, Science and Arts occupations in Saline County are Community & Social Service (1,279 | 12.2%), Management (1,099 | 10.5%), Education Instruction & Library (924 | 8.8%), Health Diagnosing & Treating (695 | 6.6%), and Health Technologists (420 | 4.0%).
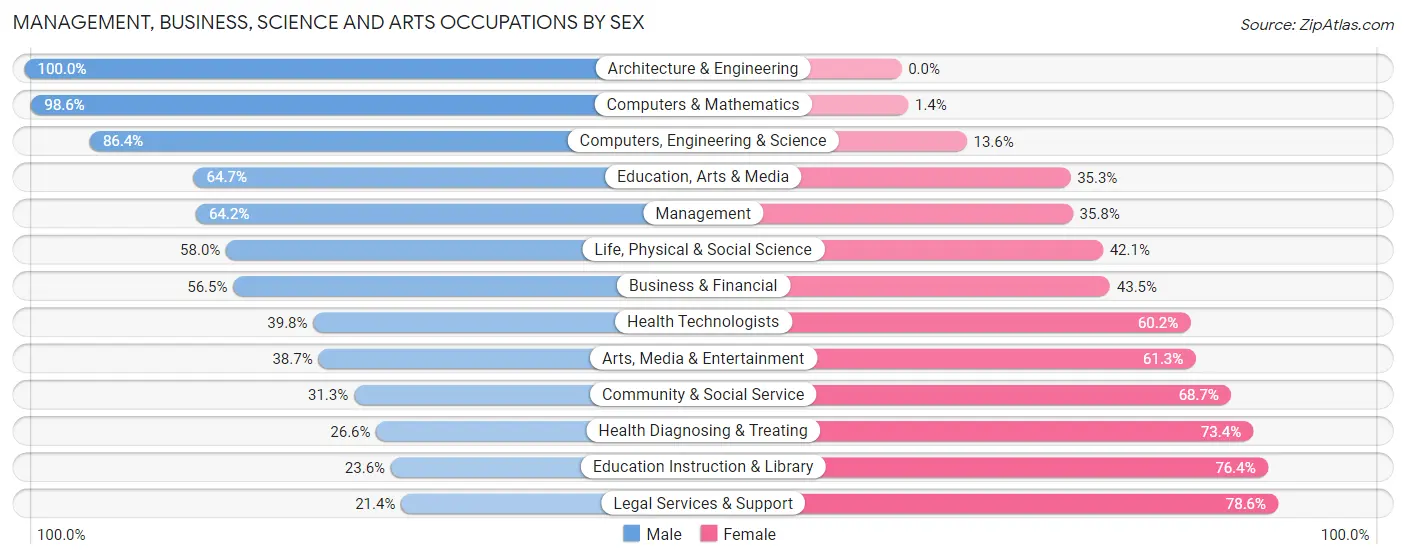
Management, Business, Science and Arts Occupations by Sex
Within the Management, Business, Science and Arts occupations in Saline County, the most male-oriented occupations are Architecture & Engineering (100.0%), Computers & Mathematics (98.6%), and Computers, Engineering & Science (86.4%), while the most female-oriented occupations are Legal Services & Support (78.6%), Education Instruction & Library (76.4%), and Health Diagnosing & Treating (73.4%).
| Occupation | Male | Female |
| Management | 706 (64.2%) | 393 (35.8%) |
| Business & Financial | 96 (56.5%) | 74 (43.5%) |
| Computers, Engineering & Science | 247 (86.4%) | 39 (13.6%) |
| Computers & Mathematics | 138 (98.6%) | 2 (1.4%) |
| Architecture & Engineering | 58 (100.0%) | 0 (0.0%) |
| Life, Physical & Social Science | 51 (58.0%) | 37 (42.0%) |
| Community & Social Service | 400 (31.3%) | 879 (68.7%) |
| Education, Arts & Media | 123 (64.7%) | 67 (35.3%) |
| Legal Services & Support | 6 (21.4%) | 22 (78.6%) |
| Education Instruction & Library | 218 (23.6%) | 706 (76.4%) |
| Arts, Media & Entertainment | 53 (38.7%) | 84 (61.3%) |
| Health Diagnosing & Treating | 185 (26.6%) | 510 (73.4%) |
| Health Technologists | 167 (39.8%) | 253 (60.2%) |
| Total (Category) | 1,634 (46.3%) | 1,895 (53.7%) |
| Total (Overall) | 5,552 (53.0%) | 4,915 (47.0%) |
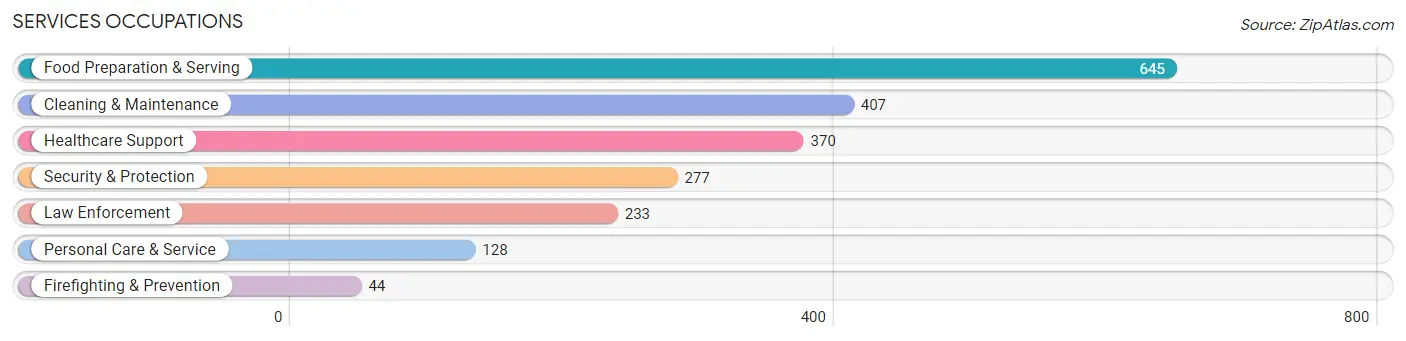
Services Occupations
The most common Services occupations in Saline County are Food Preparation & Serving (645 | 6.2%), Cleaning & Maintenance (407 | 3.9%), Healthcare Support (370 | 3.5%), Security & Protection (277 | 2.6%), and Law Enforcement (233 | 2.2%).
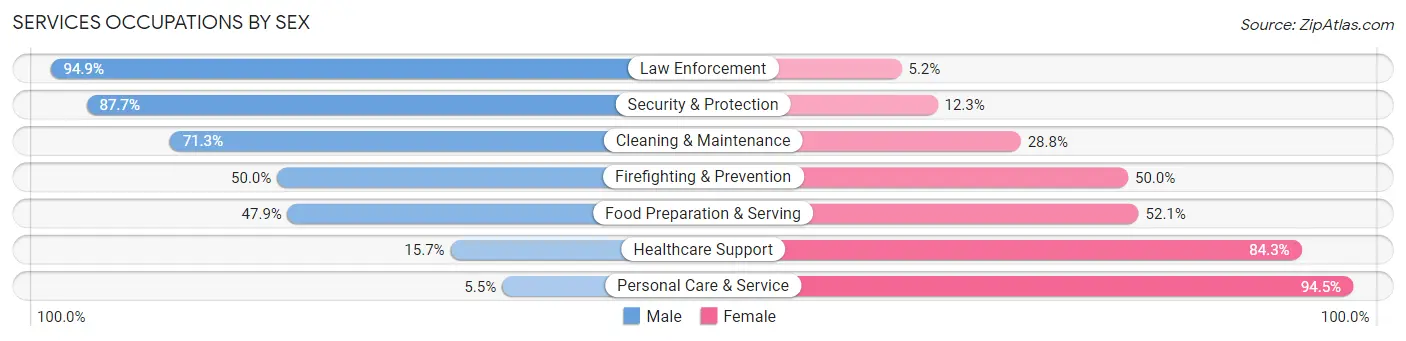
Services Occupations by Sex
Within the Services occupations in Saline County, the most male-oriented occupations are Law Enforcement (94.9%), Security & Protection (87.7%), and Cleaning & Maintenance (71.3%), while the most female-oriented occupations are Personal Care & Service (94.5%), Healthcare Support (84.3%), and Food Preparation & Serving (52.1%).
| Occupation | Male | Female |
| Healthcare Support | 58 (15.7%) | 312 (84.3%) |
| Security & Protection | 243 (87.7%) | 34 (12.3%) |
| Firefighting & Prevention | 22 (50.0%) | 22 (50.0%) |
| Law Enforcement | 221 (94.9%) | 12 (5.1%) |
| Food Preparation & Serving | 309 (47.9%) | 336 (52.1%) |
| Cleaning & Maintenance | 290 (71.3%) | 117 (28.7%) |
| Personal Care & Service | 7 (5.5%) | 121 (94.5%) |
| Total (Category) | 907 (49.6%) | 920 (50.4%) |
| Total (Overall) | 5,552 (53.0%) | 4,915 (47.0%) |
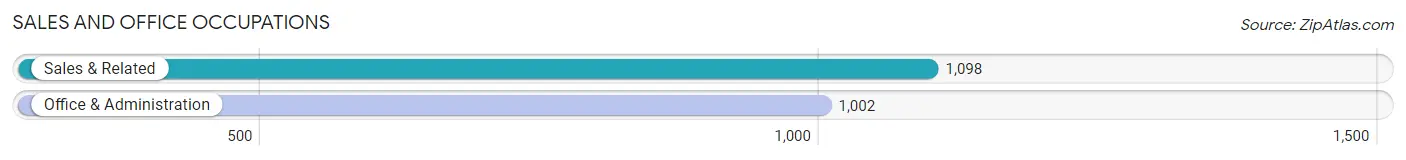
Sales and Office Occupations
The most common Sales and Office occupations in Saline County are Sales & Related (1,098 | 10.5%), and Office & Administration (1,002 | 9.6%).
Sales and Office Occupations by Sex
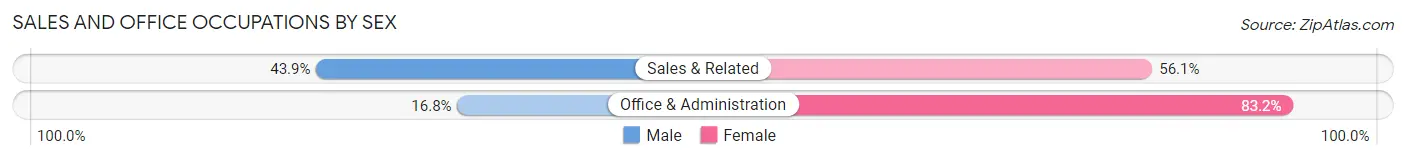
| Occupation | Male | Female |
| Sales & Related | 482 (43.9%) | 616 (56.1%) |
| Office & Administration | 168 (16.8%) | 834 (83.2%) |
| Total (Category) | 650 (30.9%) | 1,450 (69.1%) |
| Total (Overall) | 5,552 (53.0%) | 4,915 (47.0%) |
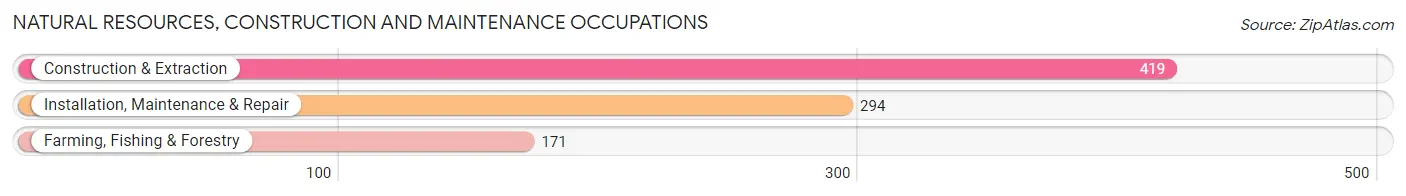
Natural Resources, Construction and Maintenance Occupations
The most common Natural Resources, Construction and Maintenance occupations in Saline County are Construction & Extraction (419 | 4.0%), Installation, Maintenance & Repair (294 | 2.8%), and Farming, Fishing & Forestry (171 | 1.6%).
Natural Resources, Construction and Maintenance Occupations by Sex
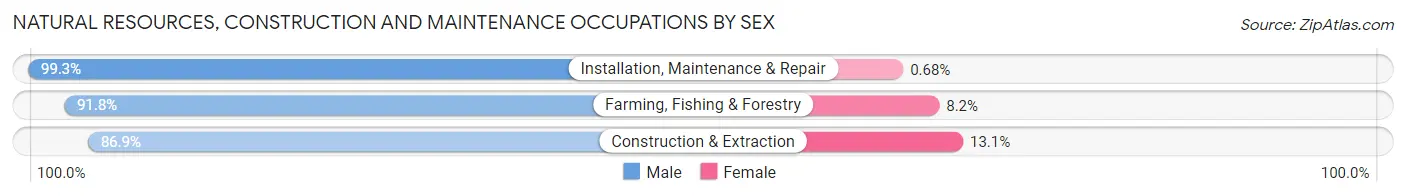
| Occupation | Male | Female |
| Farming, Fishing & Forestry | 157 (91.8%) | 14 (8.2%) |
| Construction & Extraction | 364 (86.9%) | 55 (13.1%) |
| Installation, Maintenance & Repair | 292 (99.3%) | 2 (0.7%) |
| Total (Category) | 813 (92.0%) | 71 (8.0%) |
| Total (Overall) | 5,552 (53.0%) | 4,915 (47.0%) |
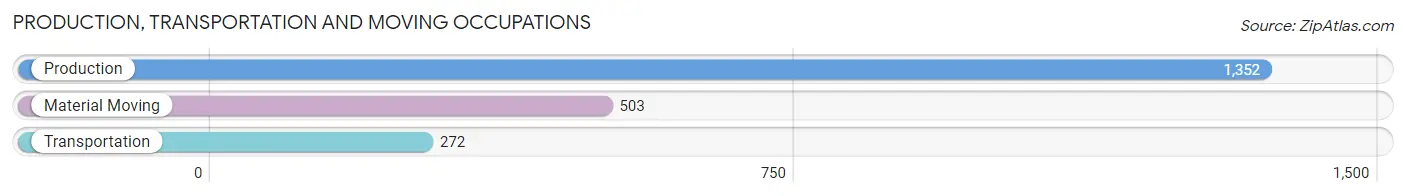
Production, Transportation and Moving Occupations
The most common Production, Transportation and Moving occupations in Saline County are Production (1,352 | 12.9%), Material Moving (503 | 4.8%), and Transportation (272 | 2.6%).
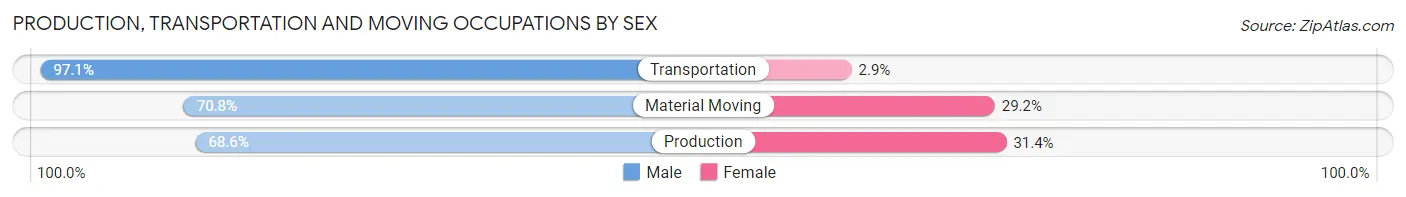
Production, Transportation and Moving Occupations by Sex
| Occupation | Male | Female |
| Production | 928 (68.6%) | 424 (31.4%) |
| Transportation | 264 (97.1%) | 8 (2.9%) |
| Material Moving | 356 (70.8%) | 147 (29.2%) |
| Total (Category) | 1,548 (72.8%) | 579 (27.2%) |
| Total (Overall) | 5,552 (53.0%) | 4,915 (47.0%) |
Employment Industries by Sex in Saline County
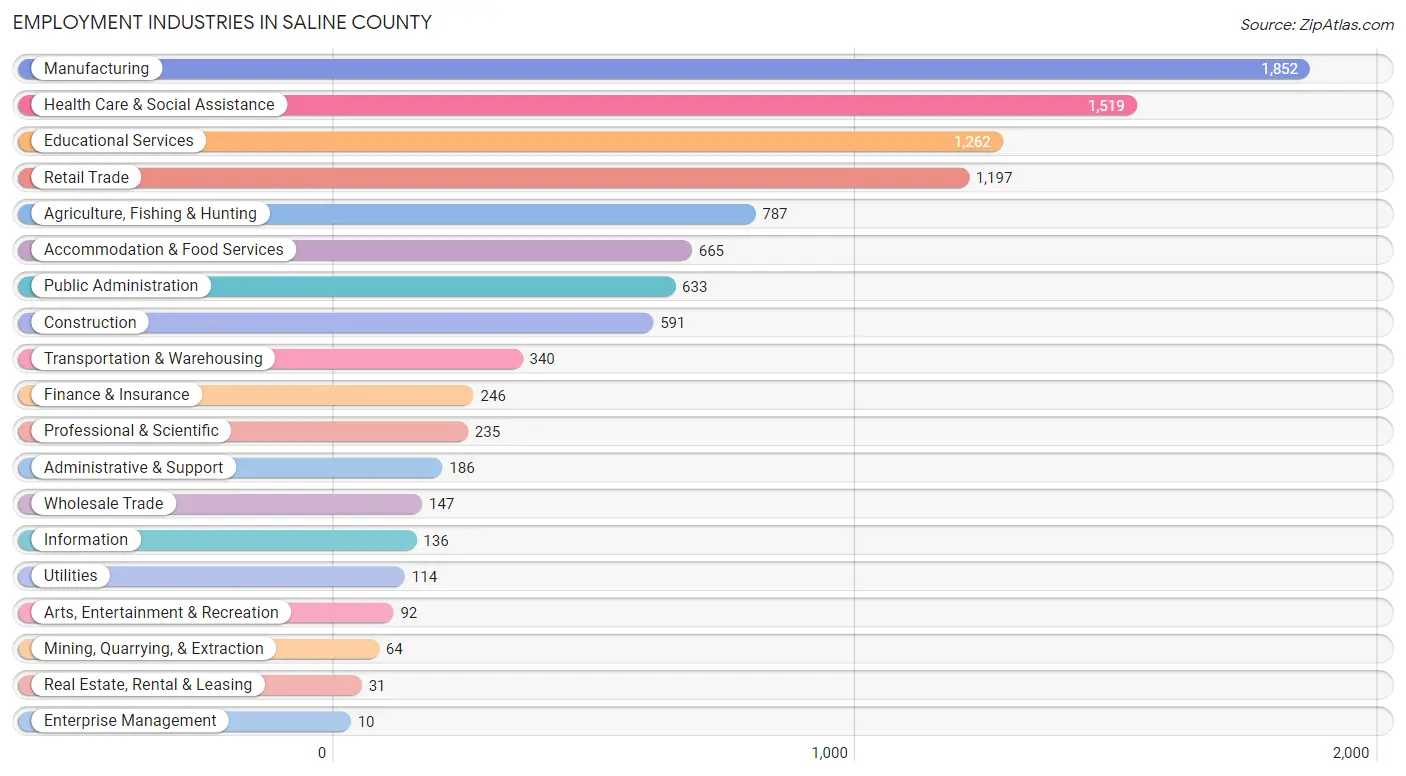
Employment Industries in Saline County
The major employment industries in Saline County include Manufacturing (1,852 | 17.7%), Health Care & Social Assistance (1,519 | 14.5%), Educational Services (1,262 | 12.1%), Retail Trade (1,197 | 11.4%), and Agriculture, Fishing & Hunting (787 | 7.5%).
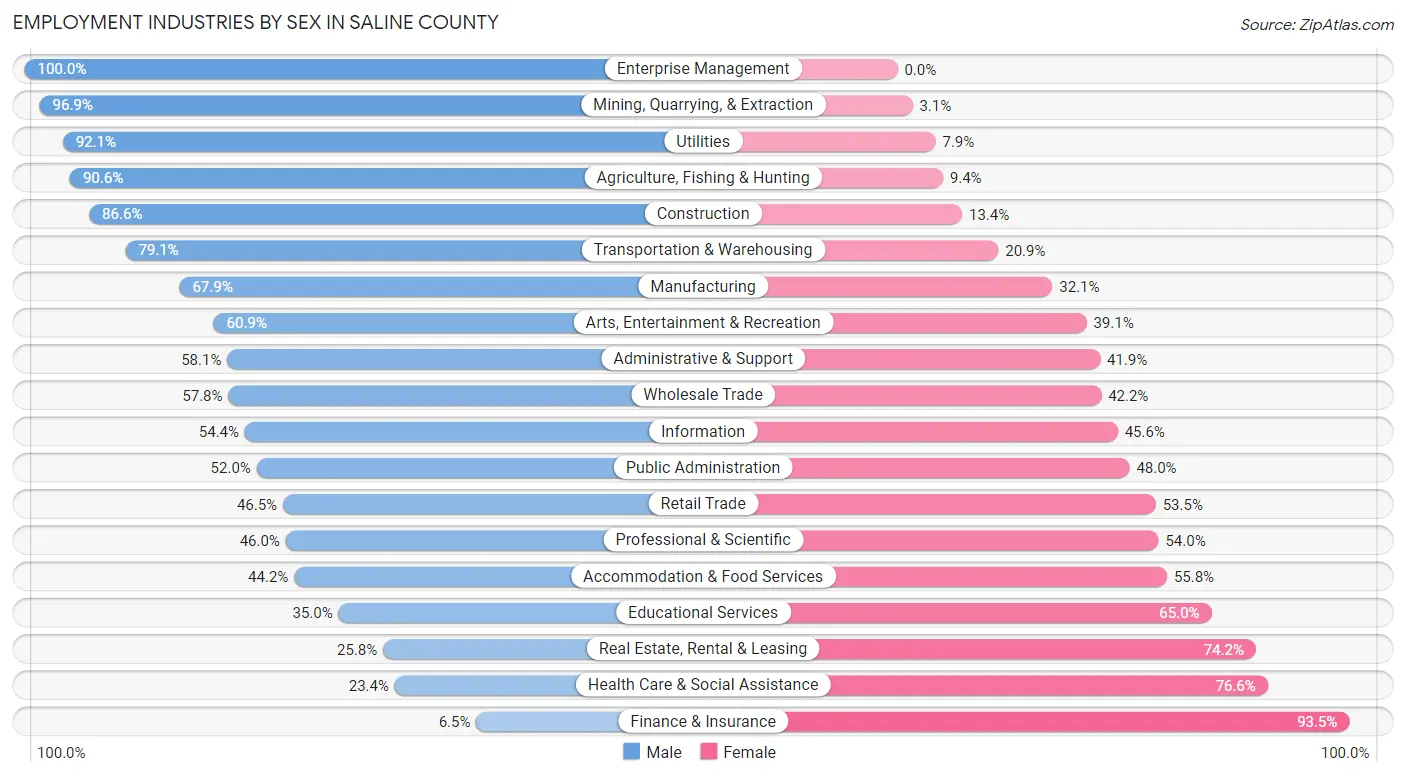
Employment Industries by Sex in Saline County
The Saline County industries that see more men than women are Enterprise Management (100.0%), Mining, Quarrying, & Extraction (96.9%), and Utilities (92.1%), whereas the industries that tend to have a higher number of women are Finance & Insurance (93.5%), Health Care & Social Assistance (76.6%), and Real Estate, Rental & Leasing (74.2%).
| Industry | Male | Female |
| Agriculture, Fishing & Hunting | 713 (90.6%) | 74 (9.4%) |
| Mining, Quarrying, & Extraction | 62 (96.9%) | 2 (3.1%) |
| Construction | 512 (86.6%) | 79 (13.4%) |
| Manufacturing | 1,258 (67.9%) | 594 (32.1%) |
| Wholesale Trade | 85 (57.8%) | 62 (42.2%) |
| Retail Trade | 557 (46.5%) | 640 (53.5%) |
| Transportation & Warehousing | 269 (79.1%) | 71 (20.9%) |
| Utilities | 105 (92.1%) | 9 (7.9%) |
| Information | 74 (54.4%) | 62 (45.6%) |
| Finance & Insurance | 16 (6.5%) | 230 (93.5%) |
| Real Estate, Rental & Leasing | 8 (25.8%) | 23 (74.2%) |
| Professional & Scientific | 108 (46.0%) | 127 (54.0%) |
| Enterprise Management | 10 (100.0%) | 0 (0.0%) |
| Administrative & Support | 108 (58.1%) | 78 (41.9%) |
| Educational Services | 442 (35.0%) | 820 (65.0%) |
| Health Care & Social Assistance | 355 (23.4%) | 1,164 (76.6%) |
| Arts, Entertainment & Recreation | 56 (60.9%) | 36 (39.1%) |
| Accommodation & Food Services | 294 (44.2%) | 371 (55.8%) |
| Public Administration | 329 (52.0%) | 304 (48.0%) |
| Total | 5,552 (53.0%) | 4,915 (47.0%) |
Education in Saline County
School Enrollment in Saline County
The most common levels of schooling among the 6,616 students in Saline County are college / undergraduate (2,323 | 35.1%), middle school (1,206 | 18.2%), and high school (1,036 | 15.7%).
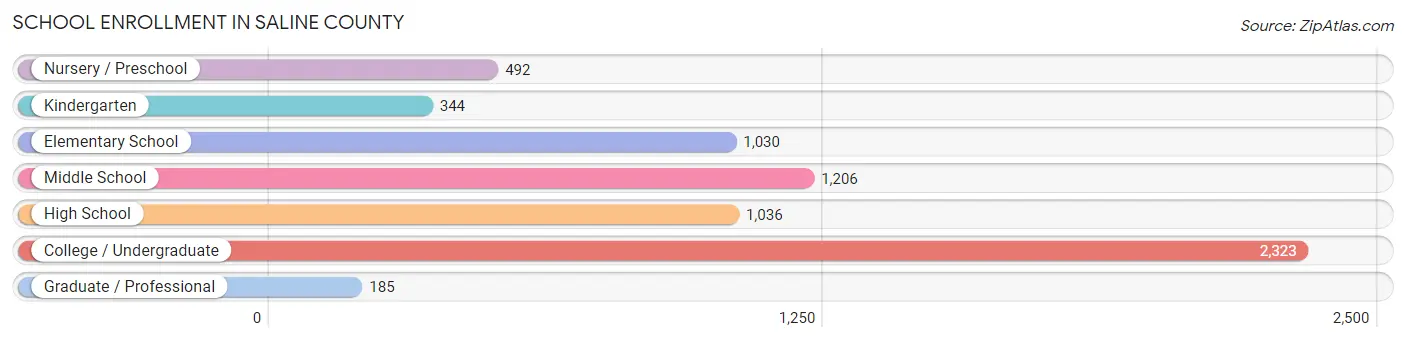
| School Level | # Students | % Students |
| Nursery / Preschool | 492 | 7.4% |
| Kindergarten | 344 | 5.2% |
| Elementary School | 1,030 | 15.6% |
| Middle School | 1,206 | 18.2% |
| High School | 1,036 | 15.7% |
| College / Undergraduate | 2,323 | 35.1% |
| Graduate / Professional | 185 | 2.8% |
| Total | 6,616 | 100.0% |
School Enrollment by Age by Funding Source in Saline County
Out of a total of 6,616 students who are enrolled in schools in Saline County, 1,608 (24.3%) attend a private institution, while the remaining 5,008 (75.7%) are enrolled in public schools. The age group of 18 to 19 year olds has the highest likelihood of being enrolled in private schools, with 555 (59.6% in the age bracket) enrolled. Conversely, the age group of 35 years and over has the lowest likelihood of being enrolled in a private school, with 88 (98.9% in the age bracket) attending a public institution.
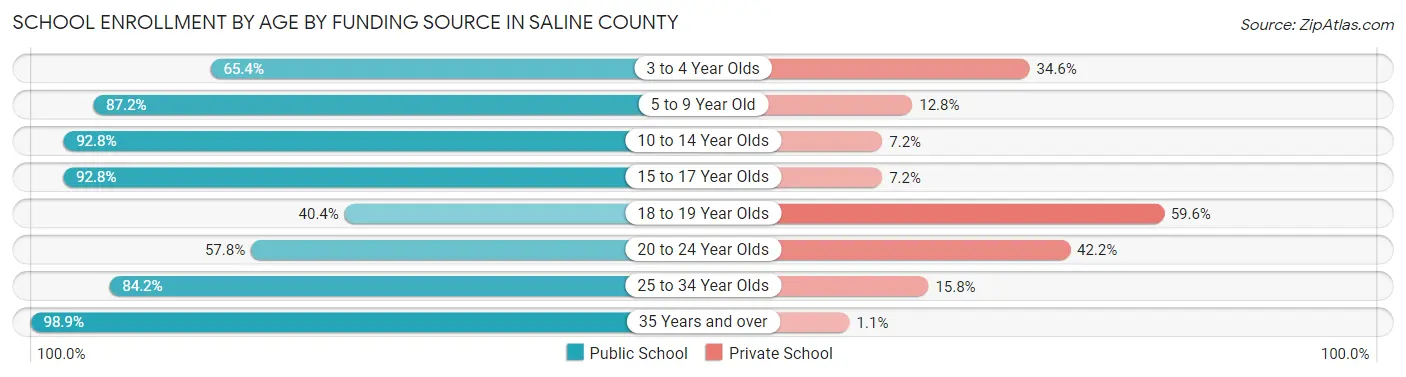
| Age Bracket | Public School | Private School |
| 3 to 4 Year Olds | 268 (65.4%) | 142 (34.6%) |
| 5 to 9 Year Old | 1,153 (87.2%) | 169 (12.8%) |
| 10 to 14 Year Olds | 1,289 (92.8%) | 100 (7.2%) |
| 15 to 17 Year Olds | 789 (92.8%) | 61 (7.2%) |
| 18 to 19 Year Olds | 376 (40.4%) | 555 (59.6%) |
| 20 to 24 Year Olds | 709 (57.8%) | 517 (42.2%) |
| 25 to 34 Year Olds | 336 (84.2%) | 63 (15.8%) |
| 35 Years and over | 88 (98.9%) | 1 (1.1%) |
| Total | 5,008 (75.7%) | 1,608 (24.3%) |
Educational Attainment by Field of Study in Saline County
Education (981 | 24.3%), business (816 | 20.2%), bio, nature & agricultural (350 | 8.7%), arts & humanities (350 | 8.7%), and science & technology (257 | 6.4%) are the most common fields of study among 4,038 individuals in Saline County who have obtained a bachelor's degree or higher.
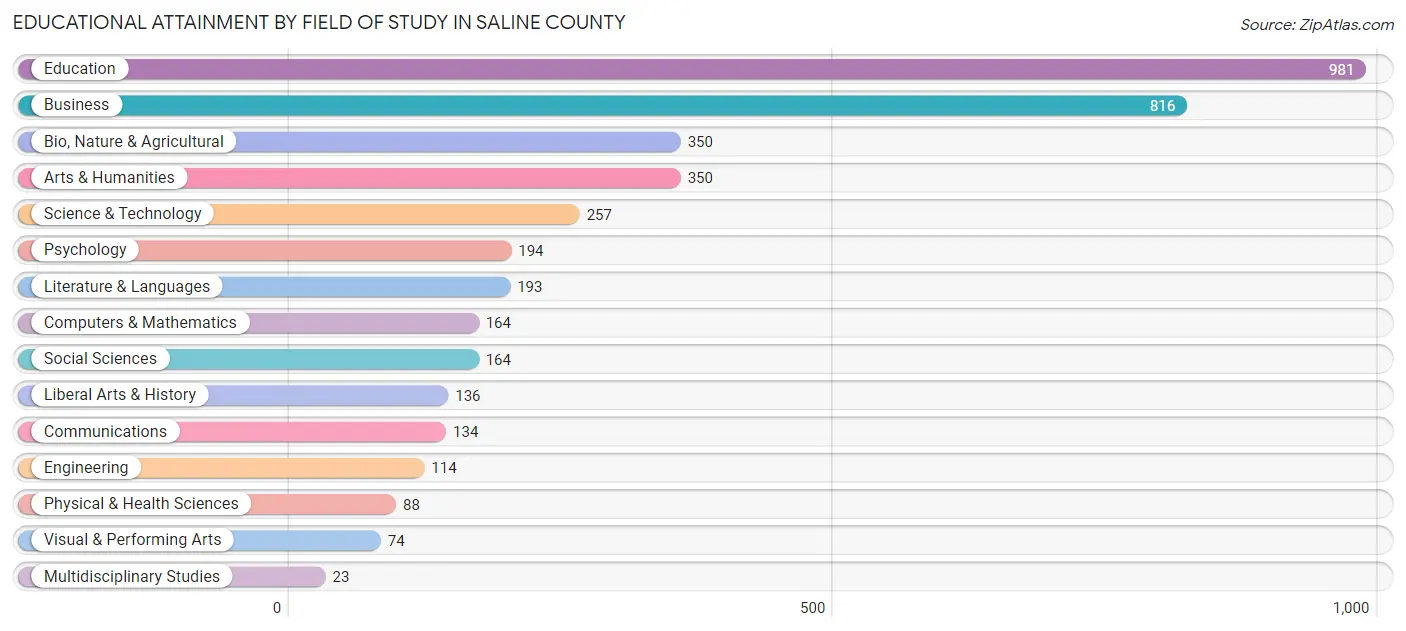
| Field of Study | # Graduates | % Graduates |
| Computers & Mathematics | 164 | 4.1% |
| Bio, Nature & Agricultural | 350 | 8.7% |
| Physical & Health Sciences | 88 | 2.2% |
| Psychology | 194 | 4.8% |
| Social Sciences | 164 | 4.1% |
| Engineering | 114 | 2.8% |
| Multidisciplinary Studies | 23 | 0.6% |
| Science & Technology | 257 | 6.4% |
| Business | 816 | 20.2% |
| Education | 981 | 24.3% |
| Literature & Languages | 193 | 4.8% |
| Liberal Arts & History | 136 | 3.4% |
| Visual & Performing Arts | 74 | 1.8% |
| Communications | 134 | 3.3% |
| Arts & Humanities | 350 | 8.7% |
| Total | 4,038 | 100.0% |
Transportation & Commute in Saline County
Vehicle Availability by Sex in Saline County
The most prevalent vehicle ownership categories in Saline County are males with 2 vehicles (2,296, accounting for 42.2%) and females with 2 vehicles (1,775, making up 49.9%).
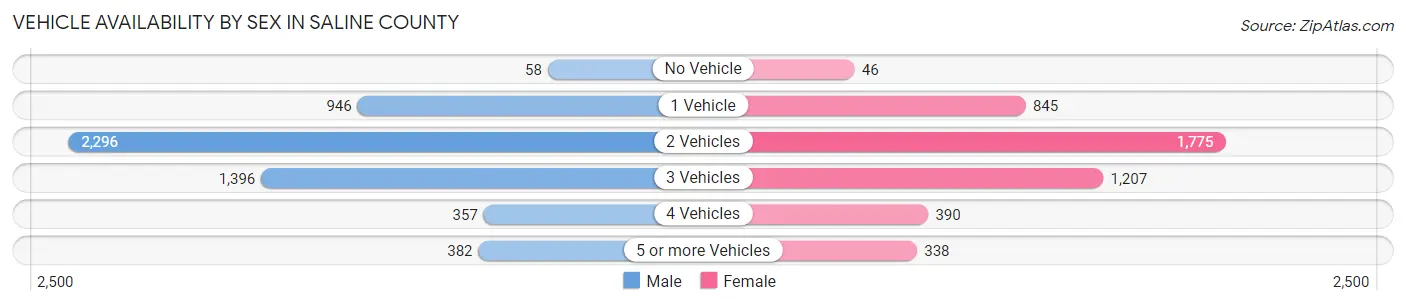
| Vehicles Available | Male | Female |
| No Vehicle | 58 (1.1%) | 46 (1.0%) |
| 1 Vehicle | 946 (17.4%) | 845 (18.4%) |
| 2 Vehicles | 2,296 (42.2%) | 1,775 (38.6%) |
| 3 Vehicles | 1,396 (25.7%) | 1,207 (26.2%) |
| 4 Vehicles | 357 (6.6%) | 390 (8.5%) |
| 5 or more Vehicles | 382 (7.0%) | 338 (7.3%) |
| Total | 5,435 (100.0%) | 4,601 (100.0%) |
Commute Time in Saline County
The most frequently occuring commute durations in Saline County are 5 to 9 minutes (2,621 commuters, 27.3%), 10 to 14 minutes (1,792 commuters, 18.7%), and less than 5 minutes (1,134 commuters, 11.8%).
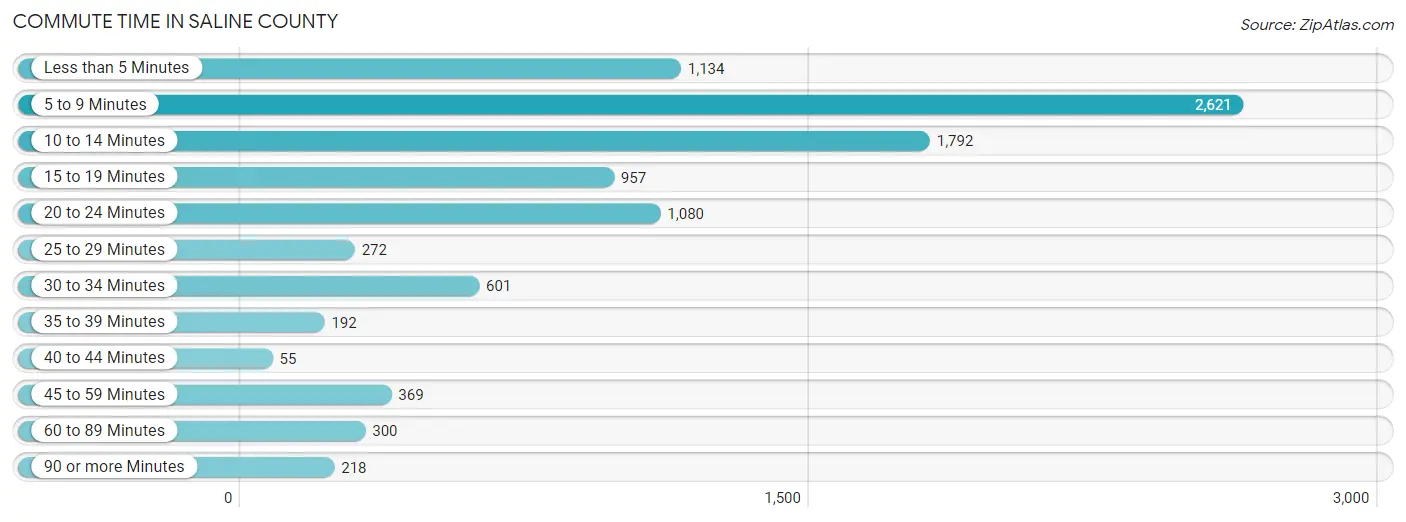
| Commute Time | # Commuters | % Commuters |
| Less than 5 Minutes | 1,134 | 11.8% |
| 5 to 9 Minutes | 2,621 | 27.3% |
| 10 to 14 Minutes | 1,792 | 18.7% |
| 15 to 19 Minutes | 957 | 10.0% |
| 20 to 24 Minutes | 1,080 | 11.3% |
| 25 to 29 Minutes | 272 | 2.8% |
| 30 to 34 Minutes | 601 | 6.3% |
| 35 to 39 Minutes | 192 | 2.0% |
| 40 to 44 Minutes | 55 | 0.6% |
| 45 to 59 Minutes | 369 | 3.8% |
| 60 to 89 Minutes | 300 | 3.1% |
| 90 or more Minutes | 218 | 2.3% |
Commute Time by Sex in Saline County
The most common commute times in Saline County are 5 to 9 minutes (1,186 commuters, 23.6%) for males and 5 to 9 minutes (1,435 commuters, 31.5%) for females.
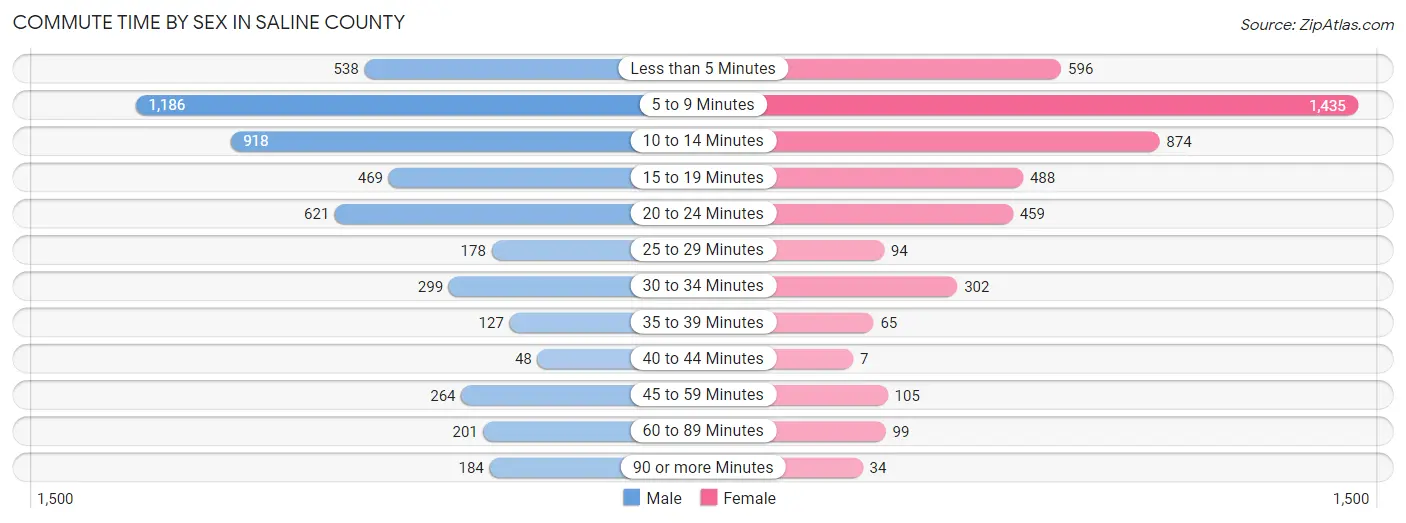
| Commute Time | Male | Female |
| Less than 5 Minutes | 538 (10.7%) | 596 (13.1%) |
| 5 to 9 Minutes | 1,186 (23.6%) | 1,435 (31.5%) |
| 10 to 14 Minutes | 918 (18.2%) | 874 (19.2%) |
| 15 to 19 Minutes | 469 (9.3%) | 488 (10.7%) |
| 20 to 24 Minutes | 621 (12.3%) | 459 (10.1%) |
| 25 to 29 Minutes | 178 (3.5%) | 94 (2.1%) |
| 30 to 34 Minutes | 299 (5.9%) | 302 (6.6%) |
| 35 to 39 Minutes | 127 (2.5%) | 65 (1.4%) |
| 40 to 44 Minutes | 48 (0.9%) | 7 (0.2%) |
| 45 to 59 Minutes | 264 (5.2%) | 105 (2.3%) |
| 60 to 89 Minutes | 201 (4.0%) | 99 (2.2%) |
| 90 or more Minutes | 184 (3.7%) | 34 (0.7%) |
Time of Departure to Work by Sex in Saline County
The most frequent times of departure to work in Saline County are 6:00 AM to 6:29 AM (830, 16.5%) for males and 7:00 AM to 7:29 AM (744, 16.3%) for females.
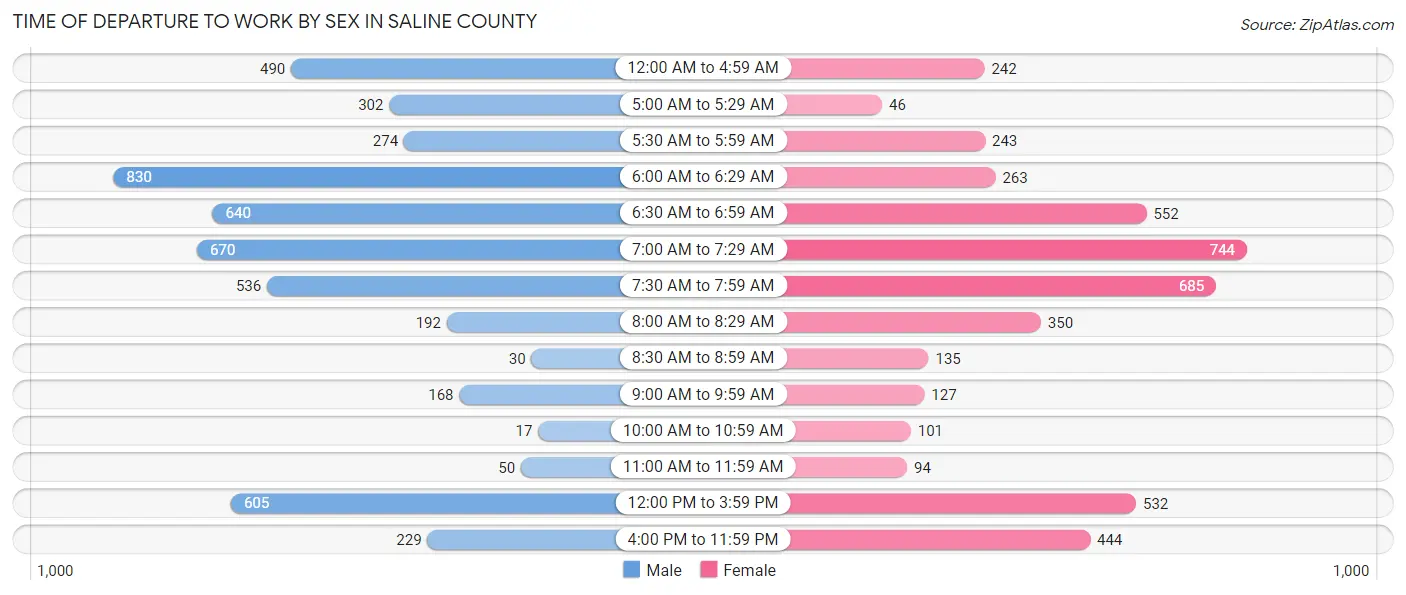
| Time of Departure | Male | Female |
| 12:00 AM to 4:59 AM | 490 (9.7%) | 242 (5.3%) |
| 5:00 AM to 5:29 AM | 302 (6.0%) | 46 (1.0%) |
| 5:30 AM to 5:59 AM | 274 (5.4%) | 243 (5.3%) |
| 6:00 AM to 6:29 AM | 830 (16.5%) | 263 (5.8%) |
| 6:30 AM to 6:59 AM | 640 (12.7%) | 552 (12.1%) |
| 7:00 AM to 7:29 AM | 670 (13.3%) | 744 (16.3%) |
| 7:30 AM to 7:59 AM | 536 (10.6%) | 685 (15.0%) |
| 8:00 AM to 8:29 AM | 192 (3.8%) | 350 (7.7%) |
| 8:30 AM to 8:59 AM | 30 (0.6%) | 135 (3.0%) |
| 9:00 AM to 9:59 AM | 168 (3.3%) | 127 (2.8%) |
| 10:00 AM to 10:59 AM | 17 (0.3%) | 101 (2.2%) |
| 11:00 AM to 11:59 AM | 50 (1.0%) | 94 (2.1%) |
| 12:00 PM to 3:59 PM | 605 (12.0%) | 532 (11.7%) |
| 4:00 PM to 11:59 PM | 229 (4.5%) | 444 (9.7%) |
| Total | 5,033 (100.0%) | 4,558 (100.0%) |
Housing Occupancy in Saline County
Occupancy by Ownership in Saline County
Of the total 7,808 dwellings in Saline County, owner-occupied units account for 5,655 (72.4%), while renter-occupied units make up 2,153 (27.6%).
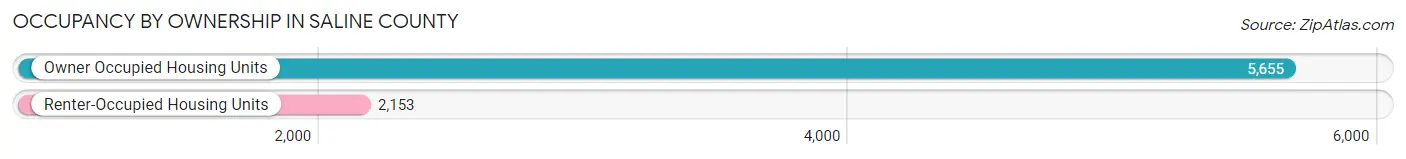
| Occupancy | # Housing Units | % Housing Units |
| Owner Occupied Housing Units | 5,655 | 72.4% |
| Renter-Occupied Housing Units | 2,153 | 27.6% |
| Total Occupied Housing Units | 7,808 | 100.0% |
Occupancy by Household Size in Saline County
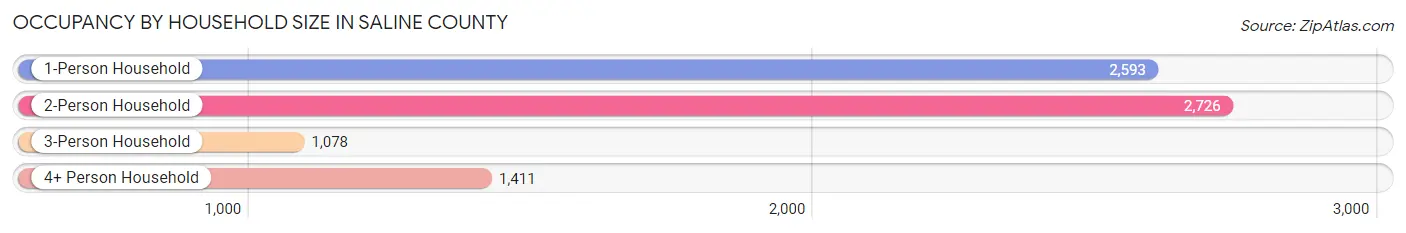
| Household Size | # Housing Units | % Housing Units |
| 1-Person Household | 2,593 | 33.2% |
| 2-Person Household | 2,726 | 34.9% |
| 3-Person Household | 1,078 | 13.8% |
| 4+ Person Household | 1,411 | 18.1% |
| Total Housing Units | 7,808 | 100.0% |
Occupancy by Ownership by Household Size in Saline County
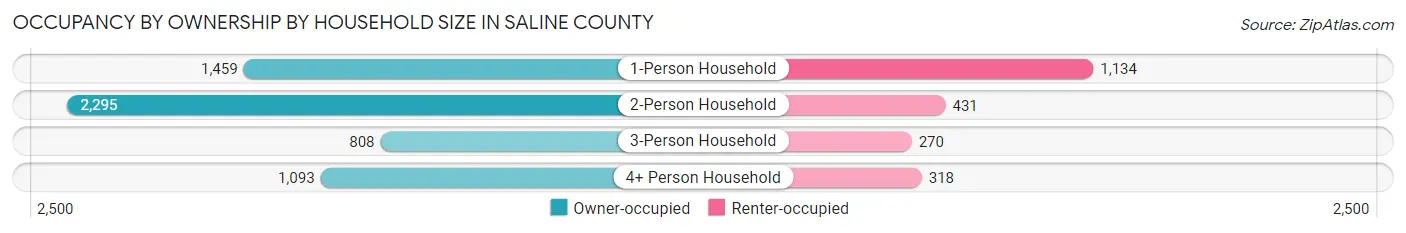
| Household Size | Owner-occupied | Renter-occupied |
| 1-Person Household | 1,459 (56.3%) | 1,134 (43.7%) |
| 2-Person Household | 2,295 (84.2%) | 431 (15.8%) |
| 3-Person Household | 808 (75.0%) | 270 (25.1%) |
| 4+ Person Household | 1,093 (77.5%) | 318 (22.5%) |
| Total Housing Units | 5,655 (72.4%) | 2,153 (27.6%) |
Occupancy by Educational Attainment in Saline County
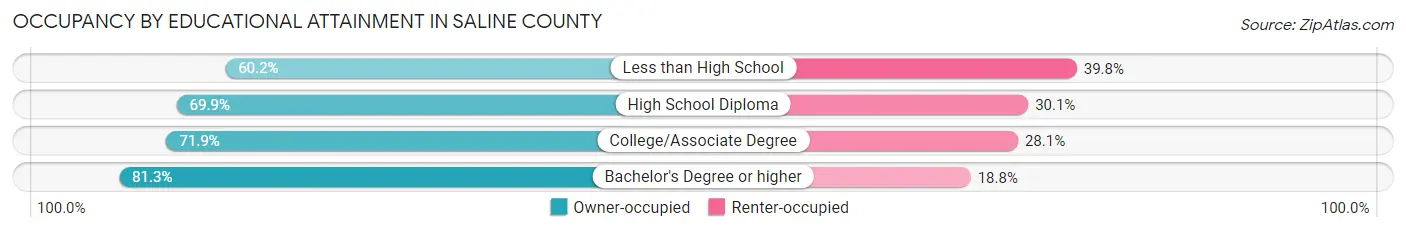
| Household Size | Owner-occupied | Renter-occupied |
| Less than High School | 430 (60.2%) | 284 (39.8%) |
| High School Diploma | 1,979 (69.9%) | 854 (30.1%) |
| College/Associate Degree | 1,656 (71.9%) | 648 (28.1%) |
| Bachelor's Degree or higher | 1,590 (81.2%) | 367 (18.8%) |
Occupancy by Age of Householder in Saline County
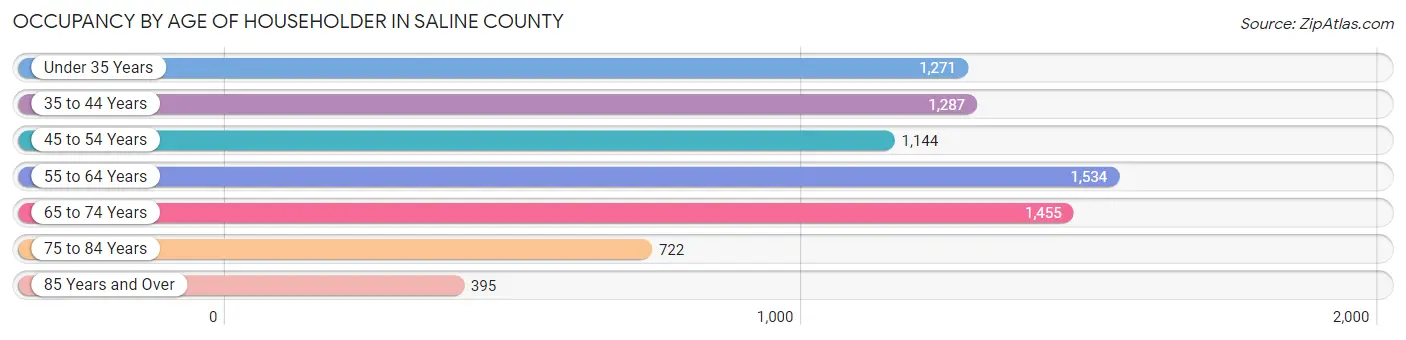
| Age Bracket | # Households | % Households |
| Under 35 Years | 1,271 | 16.3% |
| 35 to 44 Years | 1,287 | 16.5% |
| 45 to 54 Years | 1,144 | 14.6% |
| 55 to 64 Years | 1,534 | 19.7% |
| 65 to 74 Years | 1,455 | 18.6% |
| 75 to 84 Years | 722 | 9.2% |
| 85 Years and Over | 395 | 5.1% |
| Total | 7,808 | 100.0% |
Housing Finances in Saline County
Median Income by Occupancy in Saline County
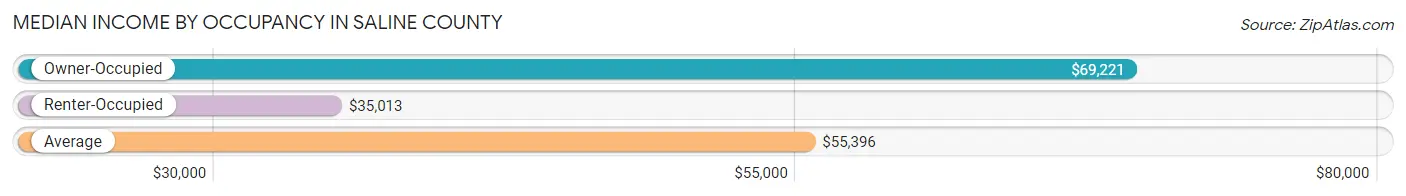
| Occupancy Type | # Households | Median Income |
| Owner-Occupied | 5,655 (72.4%) | $69,221 |
| Renter-Occupied | 2,153 (27.6%) | $35,013 |
| Average | 7,808 (100.0%) | $55,396 |
Occupancy by Householder Income Bracket in Saline County
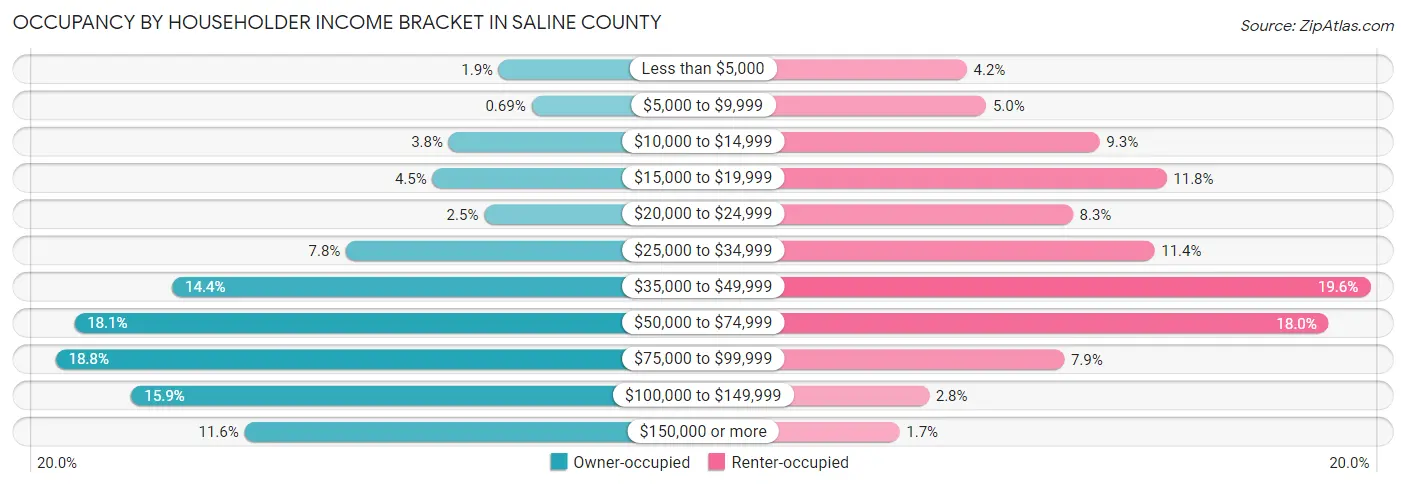
| Income Bracket | Owner-occupied | Renter-occupied |
| Less than $5,000 | 109 (1.9%) | 91 (4.2%) |
| $5,000 to $9,999 | 39 (0.7%) | 107 (5.0%) |
| $10,000 to $14,999 | 217 (3.8%) | 200 (9.3%) |
| $15,000 to $19,999 | 252 (4.5%) | 255 (11.8%) |
| $20,000 to $24,999 | 141 (2.5%) | 178 (8.3%) |
| $25,000 to $34,999 | 438 (7.7%) | 245 (11.4%) |
| $35,000 to $49,999 | 813 (14.4%) | 422 (19.6%) |
| $50,000 to $74,999 | 1,024 (18.1%) | 388 (18.0%) |
| $75,000 to $99,999 | 1,064 (18.8%) | 171 (7.9%) |
| $100,000 to $149,999 | 901 (15.9%) | 60 (2.8%) |
| $150,000 or more | 657 (11.6%) | 36 (1.7%) |
| Total | 5,655 (100.0%) | 2,153 (100.0%) |
Monthly Housing Cost Tiers in Saline County
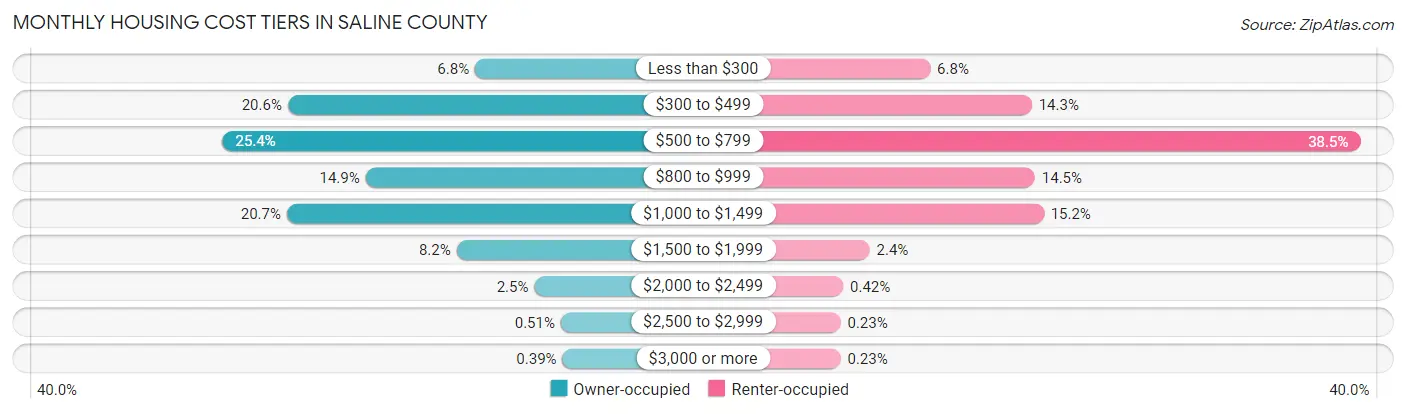
| Monthly Cost | Owner-occupied | Renter-occupied |
| Less than $300 | 386 (6.8%) | 147 (6.8%) |
| $300 to $499 | 1,166 (20.6%) | 308 (14.3%) |
| $500 to $799 | 1,438 (25.4%) | 829 (38.5%) |
| $800 to $999 | 842 (14.9%) | 313 (14.5%) |
| $1,000 to $1,499 | 1,170 (20.7%) | 327 (15.2%) |
| $1,500 to $1,999 | 463 (8.2%) | 51 (2.4%) |
| $2,000 to $2,499 | 139 (2.5%) | 9 (0.4%) |
| $2,500 to $2,999 | 29 (0.5%) | 5 (0.2%) |
| $3,000 or more | 22 (0.4%) | 5 (0.2%) |
| Total | 5,655 (100.0%) | 2,153 (100.0%) |
Physical Housing Characteristics in Saline County
Housing Structures in Saline County
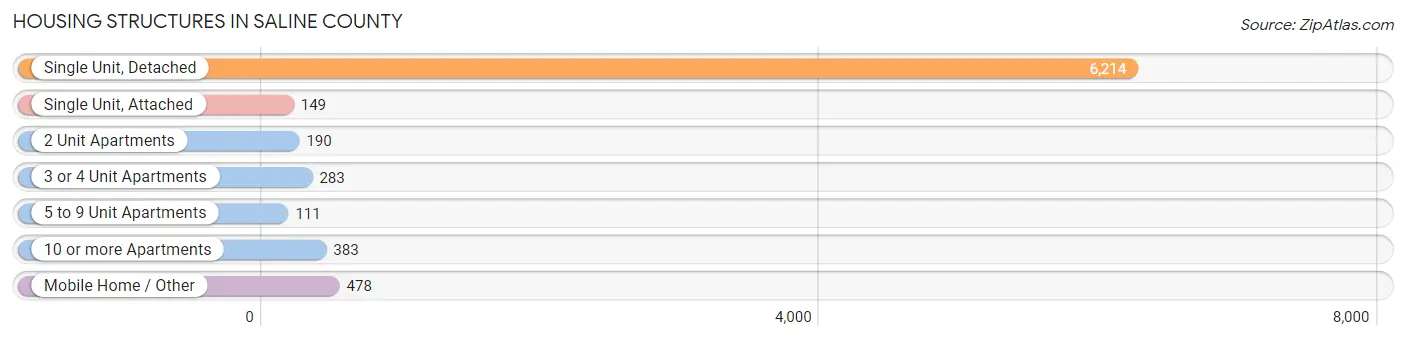
| Structure Type | # Housing Units | % Housing Units |
| Single Unit, Detached | 6,214 | 79.6% |
| Single Unit, Attached | 149 | 1.9% |
| 2 Unit Apartments | 190 | 2.4% |
| 3 or 4 Unit Apartments | 283 | 3.6% |
| 5 to 9 Unit Apartments | 111 | 1.4% |
| 10 or more Apartments | 383 | 4.9% |
| Mobile Home / Other | 478 | 6.1% |
| Total | 7,808 | 100.0% |
Housing Structures by Occupancy in Saline County
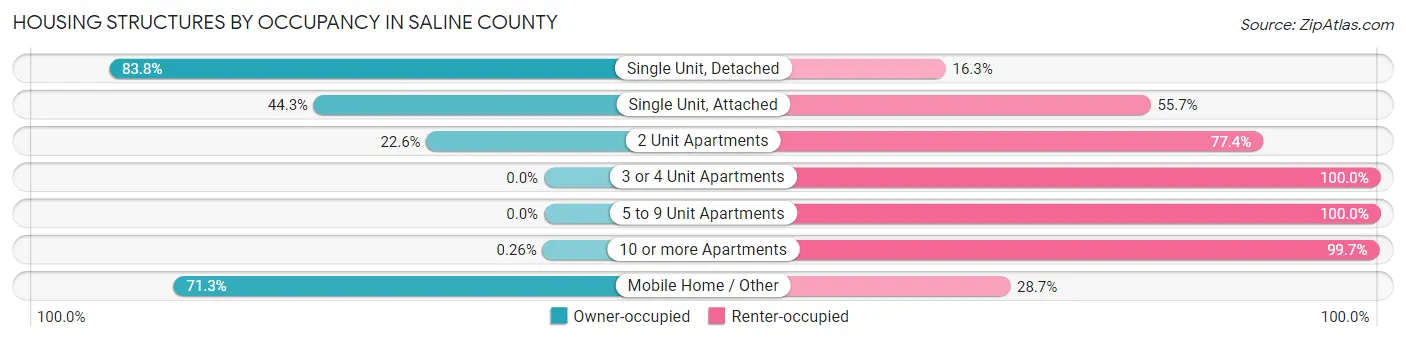
| Structure Type | Owner-occupied | Renter-occupied |
| Single Unit, Detached | 5,204 (83.8%) | 1,010 (16.3%) |
| Single Unit, Attached | 66 (44.3%) | 83 (55.7%) |
| 2 Unit Apartments | 43 (22.6%) | 147 (77.4%) |
| 3 or 4 Unit Apartments | 0 (0.0%) | 283 (100.0%) |
| 5 to 9 Unit Apartments | 0 (0.0%) | 111 (100.0%) |
| 10 or more Apartments | 1 (0.3%) | 382 (99.7%) |
| Mobile Home / Other | 341 (71.3%) | 137 (28.7%) |
| Total | 5,655 (72.4%) | 2,153 (27.6%) |
Housing Structures by Number of Rooms in Saline County
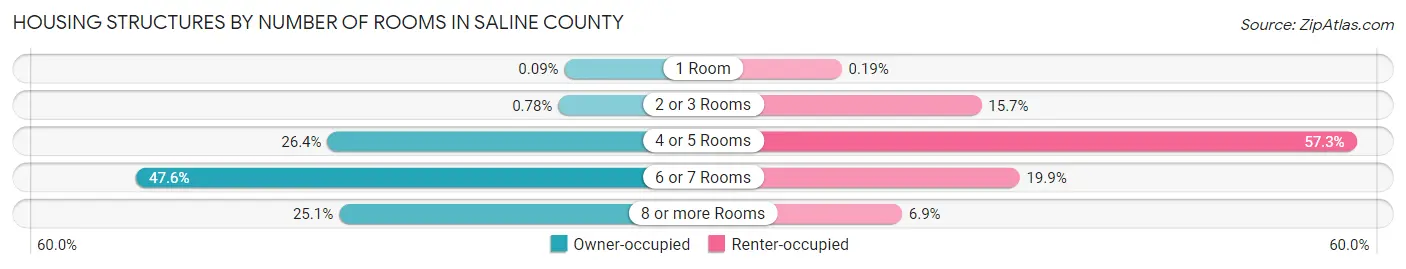
| Number of Rooms | Owner-occupied | Renter-occupied |
| 1 Room | 5 (0.1%) | 4 (0.2%) |
| 2 or 3 Rooms | 44 (0.8%) | 338 (15.7%) |
| 4 or 5 Rooms | 1,493 (26.4%) | 1,234 (57.3%) |
| 6 or 7 Rooms | 2,693 (47.6%) | 429 (19.9%) |
| 8 or more Rooms | 1,420 (25.1%) | 148 (6.9%) |
| Total | 5,655 (100.0%) | 2,153 (100.0%) |
Housing Structure by Heating Type in Saline County
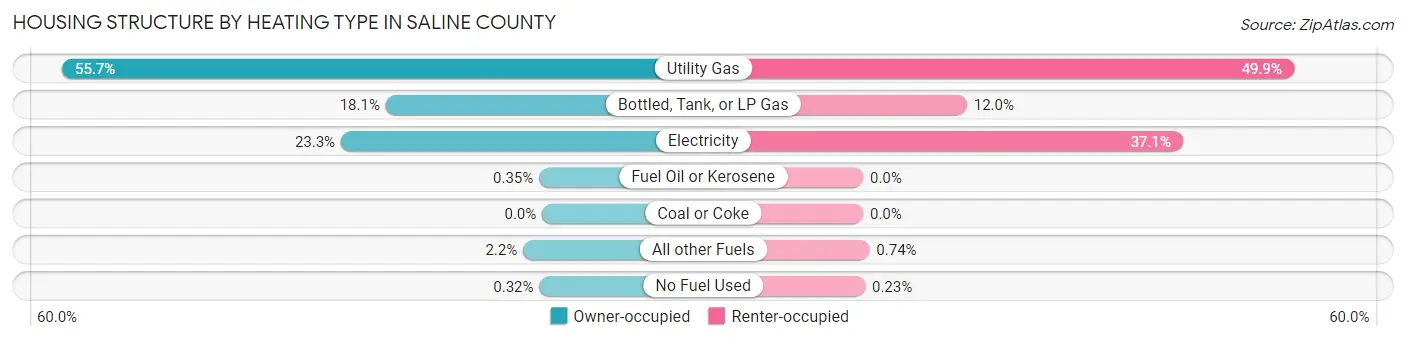
| Heating Type | Owner-occupied | Renter-occupied |
| Utility Gas | 3,148 (55.7%) | 1,075 (49.9%) |
| Bottled, Tank, or LP Gas | 1,025 (18.1%) | 259 (12.0%) |
| Electricity | 1,319 (23.3%) | 798 (37.1%) |
| Fuel Oil or Kerosene | 20 (0.4%) | 0 (0.0%) |
| Coal or Coke | 0 (0.0%) | 0 (0.0%) |
| All other Fuels | 125 (2.2%) | 16 (0.7%) |
| No Fuel Used | 18 (0.3%) | 5 (0.2%) |
| Total | 5,655 (100.0%) | 2,153 (100.0%) |
Household Vehicle Usage in Saline County
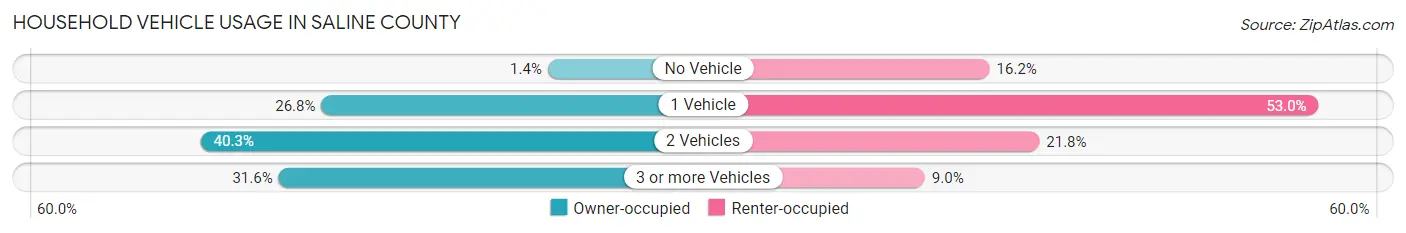
| Vehicles per Household | Owner-occupied | Renter-occupied |
| No Vehicle | 79 (1.4%) | 349 (16.2%) |
| 1 Vehicle | 1,513 (26.8%) | 1,142 (53.0%) |
| 2 Vehicles | 2,278 (40.3%) | 469 (21.8%) |
| 3 or more Vehicles | 1,785 (31.6%) | 193 (9.0%) |
| Total | 5,655 (100.0%) | 2,153 (100.0%) |
Real Estate & Mortgages in Saline County
Real Estate and Mortgage Overview in Saline County
| Characteristic | Without Mortgage | With Mortgage |
| Housing Units | 2,700 | 2,955 |
| Median Property Value | $113,700 | $144,000 |
| Median Household Income | $50,098 | $455 |
| Monthly Housing Costs | $468 | $20 |
| Real Estate Taxes | $989 | $47 |
Property Value by Mortgage Status in Saline County
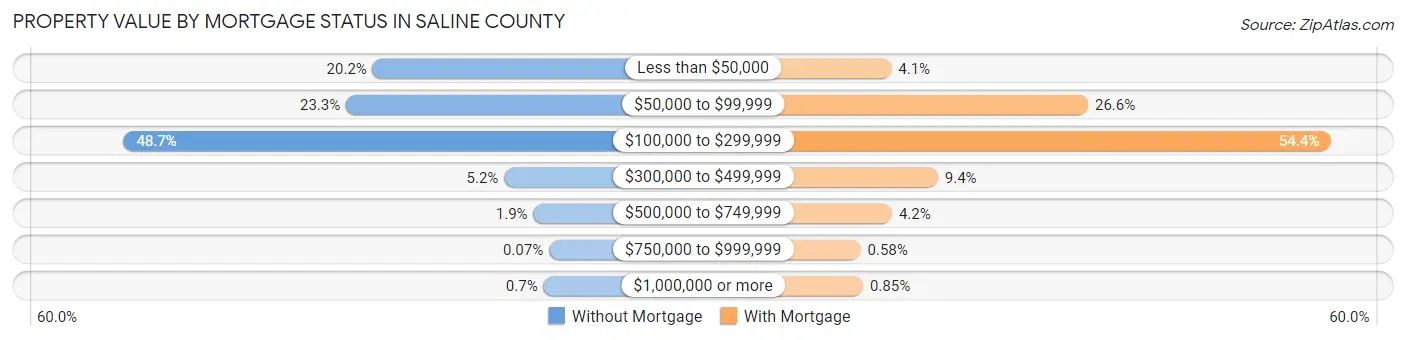
| Property Value | Without Mortgage | With Mortgage |
| Less than $50,000 | 546 (20.2%) | 121 (4.1%) |
| $50,000 to $99,999 | 628 (23.3%) | 785 (26.6%) |
| $100,000 to $299,999 | 1,315 (48.7%) | 1,606 (54.3%) |
| $300,000 to $499,999 | 140 (5.2%) | 278 (9.4%) |
| $500,000 to $749,999 | 50 (1.8%) | 123 (4.2%) |
| $750,000 to $999,999 | 2 (0.1%) | 17 (0.6%) |
| $1,000,000 or more | 19 (0.7%) | 25 (0.9%) |
| Total | 2,700 (100.0%) | 2,955 (100.0%) |
Household Income by Mortgage Status in Saline County
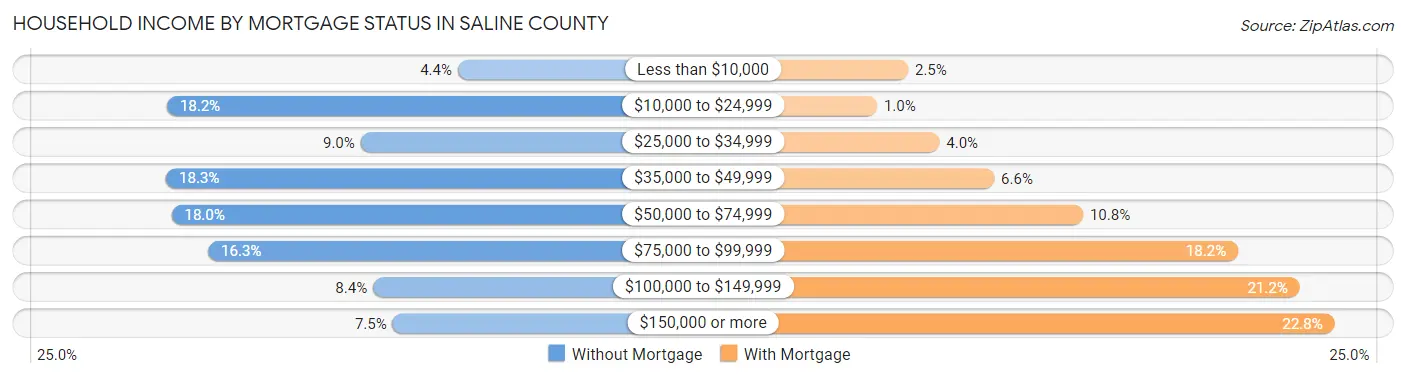
| Household Income | Without Mortgage | With Mortgage |
| Less than $10,000 | 118 (4.4%) | 74 (2.5%) |
| $10,000 to $24,999 | 492 (18.2%) | 30 (1.0%) |
| $25,000 to $34,999 | 243 (9.0%) | 118 (4.0%) |
| $35,000 to $49,999 | 493 (18.3%) | 195 (6.6%) |
| $50,000 to $74,999 | 486 (18.0%) | 320 (10.8%) |
| $75,000 to $99,999 | 439 (16.3%) | 538 (18.2%) |
| $100,000 to $149,999 | 227 (8.4%) | 625 (21.1%) |
| $150,000 or more | 202 (7.5%) | 674 (22.8%) |
| Total | 2,700 (100.0%) | 2,955 (100.0%) |
Property Value to Household Income Ratio in Saline County
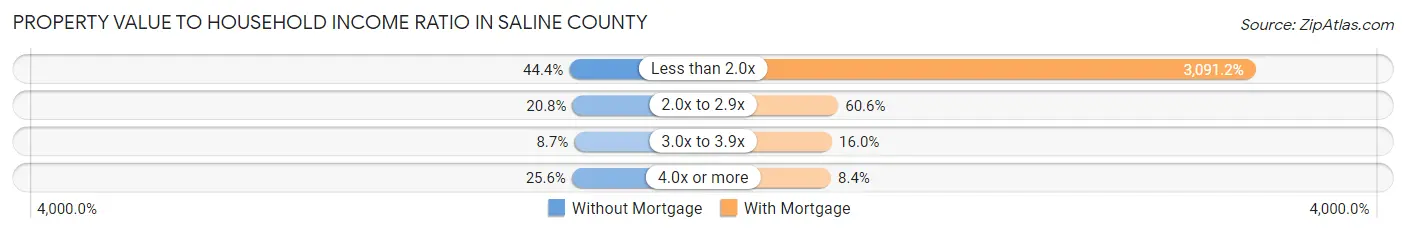
| Value-to-Income Ratio | Without Mortgage | With Mortgage |
| Less than 2.0x | 1,199 (44.4%) | 91,344 (3,091.2%) |
| 2.0x to 2.9x | 561 (20.8%) | 1,791 (60.6%) |
| 3.0x to 3.9x | 236 (8.7%) | 474 (16.0%) |
| 4.0x or more | 692 (25.6%) | 247 (8.4%) |
| Total | 2,700 (100.0%) | 2,955 (100.0%) |
Real Estate Taxes by Mortgage Status in Saline County
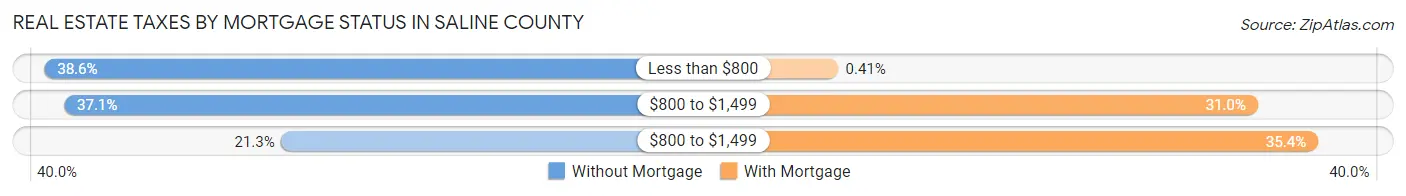
| Property Taxes | Without Mortgage | With Mortgage |
| Less than $800 | 1,041 (38.6%) | 12 (0.4%) |
| $800 to $1,499 | 1,002 (37.1%) | 917 (31.0%) |
| $800 to $1,499 | 575 (21.3%) | 1,047 (35.4%) |
| Total | 2,700 (100.0%) | 2,955 (100.0%) |
Health & Disability in Saline County
Health Insurance Coverage by Age in Saline County
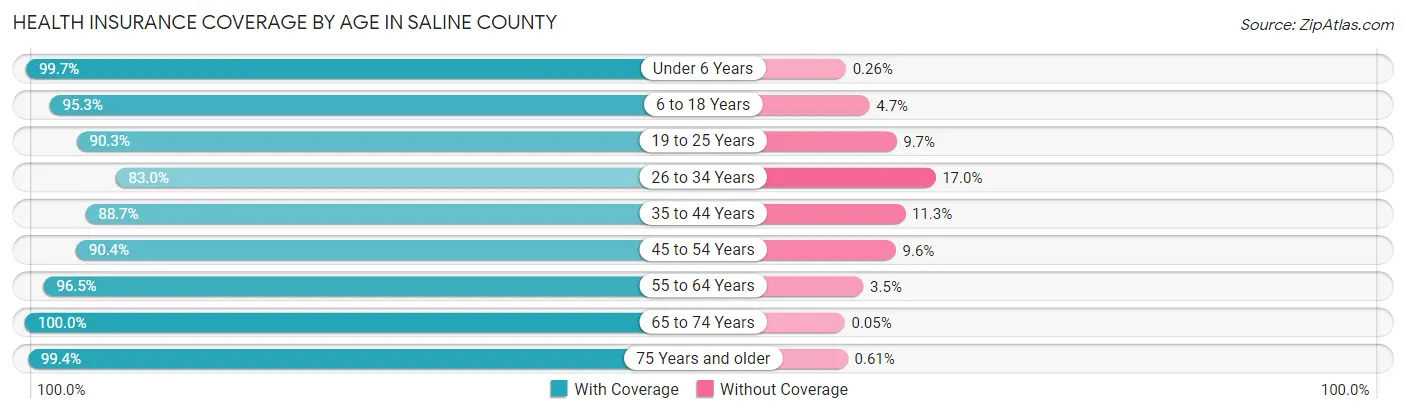
| Age Bracket | With Coverage | Without Coverage |
| Under 6 Years | 1,515 (99.7%) | 4 (0.3%) |
| 6 to 18 Years | 3,758 (95.3%) | 184 (4.7%) |
| 19 to 25 Years | 2,851 (90.3%) | 306 (9.7%) |
| 26 to 34 Years | 2,223 (83.0%) | 454 (17.0%) |
| 35 to 44 Years | 2,183 (88.7%) | 279 (11.3%) |
| 45 to 54 Years | 2,078 (90.4%) | 220 (9.6%) |
| 55 to 64 Years | 2,820 (96.5%) | 103 (3.5%) |
| 65 to 74 Years | 2,218 (100.0%) | 1 (0.1%) |
| 75 Years and older | 1,638 (99.4%) | 10 (0.6%) |
| Total | 21,284 (93.2%) | 1,561 (6.8%) |
Health Insurance Coverage by Citizenship Status in Saline County
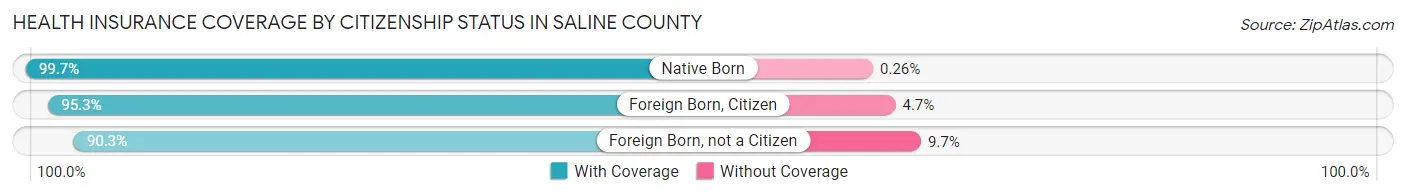
| Citizenship Status | With Coverage | Without Coverage |
| Native Born | 1,515 (99.7%) | 4 (0.3%) |
| Foreign Born, Citizen | 3,758 (95.3%) | 184 (4.7%) |
| Foreign Born, not a Citizen | 2,851 (90.3%) | 306 (9.7%) |
Health Insurance Coverage by Household Income in Saline County
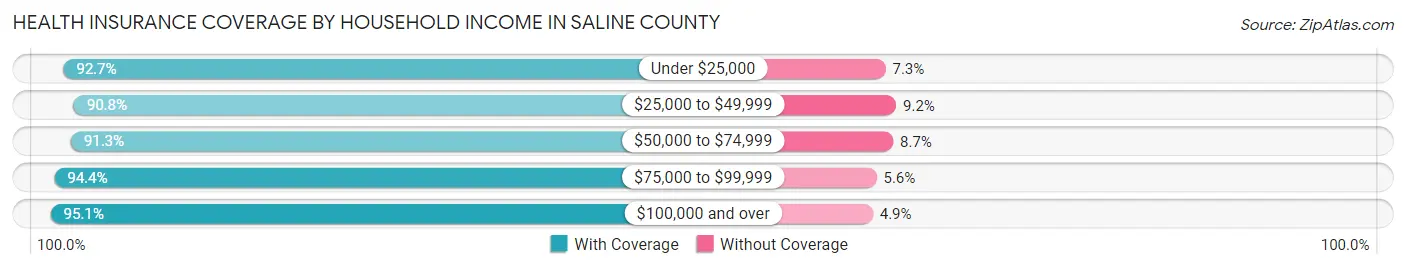
| Household Income | With Coverage | Without Coverage |
| Under $25,000 | 2,530 (92.7%) | 198 (7.3%) |
| $25,000 to $49,999 | 3,885 (90.8%) | 395 (9.2%) |
| $50,000 to $74,999 | 3,739 (91.3%) | 355 (8.7%) |
| $75,000 to $99,999 | 4,169 (94.4%) | 246 (5.6%) |
| $100,000 and over | 5,875 (95.1%) | 301 (4.9%) |
Public vs Private Health Insurance Coverage by Age in Saline County
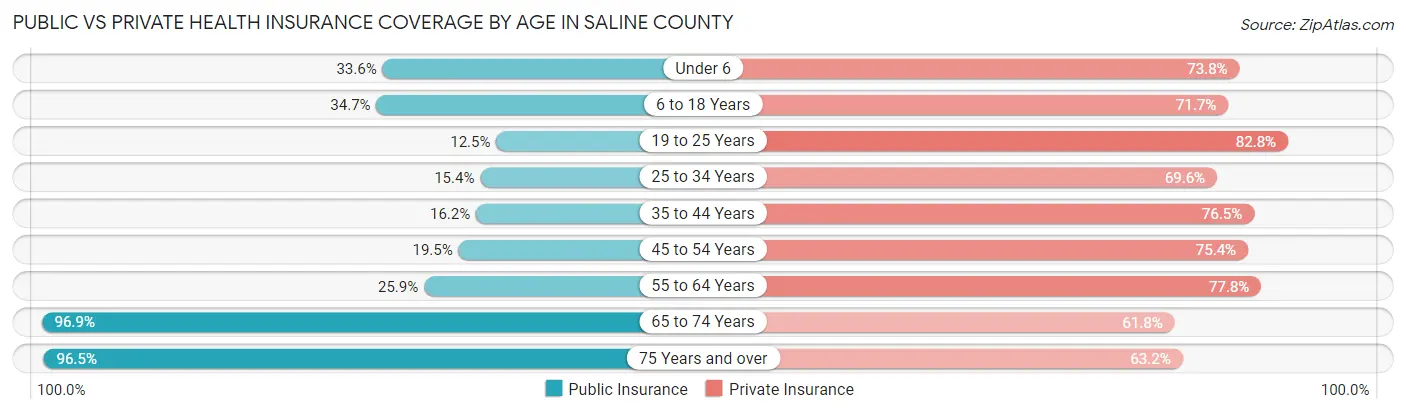
| Age Bracket | Public Insurance | Private Insurance |
| Under 6 | 510 (33.6%) | 1,121 (73.8%) |
| 6 to 18 Years | 1,368 (34.7%) | 2,827 (71.7%) |
| 19 to 25 Years | 393 (12.4%) | 2,614 (82.8%) |
| 25 to 34 Years | 413 (15.4%) | 1,864 (69.6%) |
| 35 to 44 Years | 399 (16.2%) | 1,884 (76.5%) |
| 45 to 54 Years | 447 (19.5%) | 1,732 (75.4%) |
| 55 to 64 Years | 756 (25.9%) | 2,275 (77.8%) |
| 65 to 74 Years | 2,149 (96.9%) | 1,371 (61.8%) |
| 75 Years and over | 1,590 (96.5%) | 1,042 (63.2%) |
| Total | 8,025 (35.1%) | 16,730 (73.2%) |
Disability Status by Sex by Age in Saline County
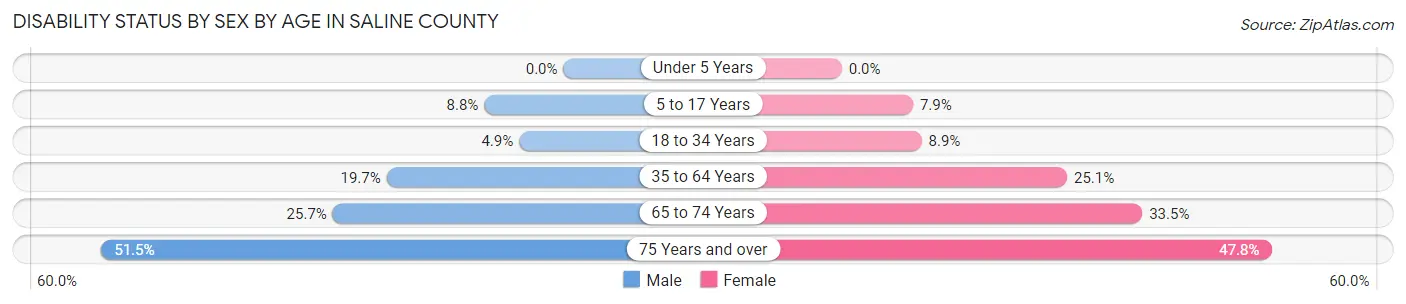
| Age Bracket | Male | Female |
| Under 5 Years | 0 (0.0%) | 0 (0.0%) |
| 5 to 17 Years | 153 (8.8%) | 165 (7.9%) |
| 18 to 34 Years | 168 (4.9%) | 252 (8.9%) |
| 35 to 64 Years | 747 (19.7%) | 976 (25.1%) |
| 65 to 74 Years | 289 (25.7%) | 366 (33.5%) |
| 75 Years and over | 337 (51.4%) | 475 (47.8%) |
Disability Class by Sex by Age in Saline County
Disability Class: Hearing Difficulty
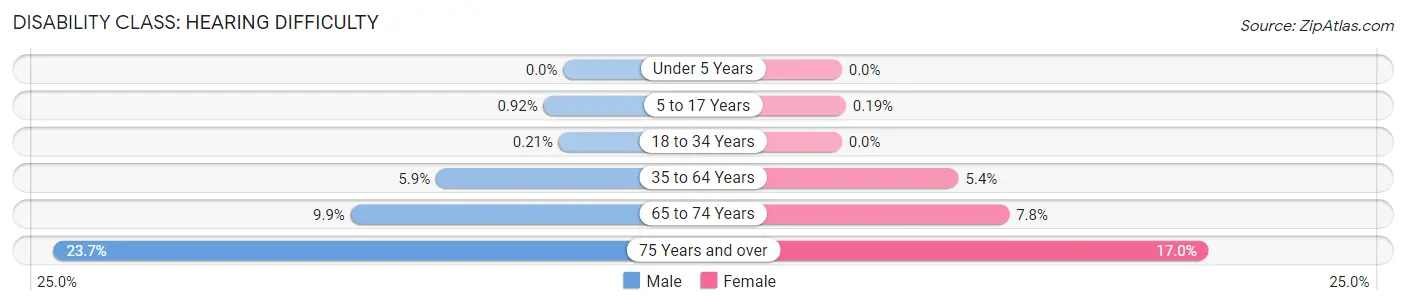
| Age Bracket | Male | Female |
| Under 5 Years | 0 (0.0%) | 0 (0.0%) |
| 5 to 17 Years | 16 (0.9%) | 4 (0.2%) |
| 18 to 34 Years | 7 (0.2%) | 0 (0.0%) |
| 35 to 64 Years | 224 (5.9%) | 211 (5.4%) |
| 65 to 74 Years | 111 (9.9%) | 85 (7.8%) |
| 75 Years and over | 155 (23.7%) | 169 (17.0%) |
Disability Class: Vision Difficulty
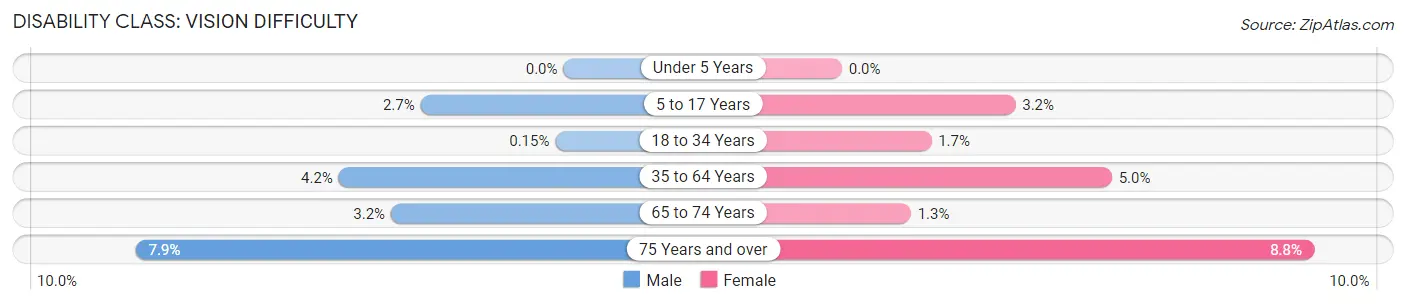
| Age Bracket | Male | Female |
| Under 5 Years | 0 (0.0%) | 0 (0.0%) |
| 5 to 17 Years | 46 (2.6%) | 67 (3.2%) |
| 18 to 34 Years | 5 (0.2%) | 47 (1.7%) |
| 35 to 64 Years | 158 (4.2%) | 195 (5.0%) |
| 65 to 74 Years | 36 (3.2%) | 14 (1.3%) |
| 75 Years and over | 52 (7.9%) | 87 (8.8%) |
Disability Class: Cognitive Difficulty
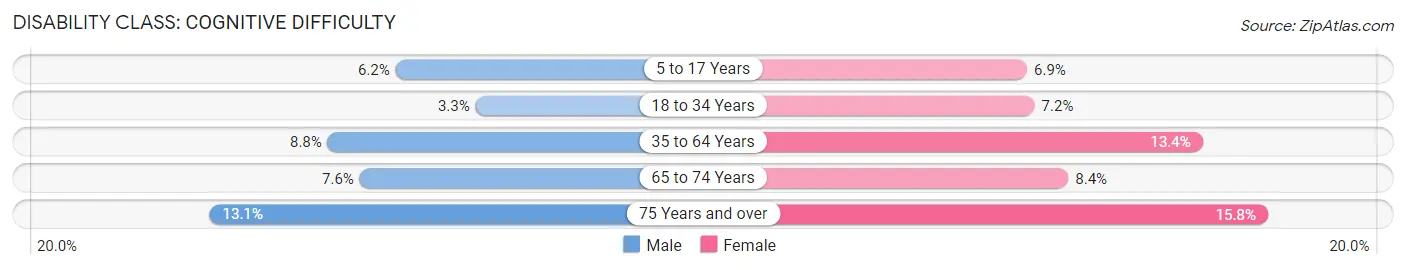
| Age Bracket | Male | Female |
| 5 to 17 Years | 108 (6.2%) | 143 (6.9%) |
| 18 to 34 Years | 111 (3.3%) | 203 (7.2%) |
| 35 to 64 Years | 332 (8.7%) | 521 (13.4%) |
| 65 to 74 Years | 85 (7.6%) | 92 (8.4%) |
| 75 Years and over | 86 (13.1%) | 157 (15.8%) |
Disability Class: Ambulatory Difficulty
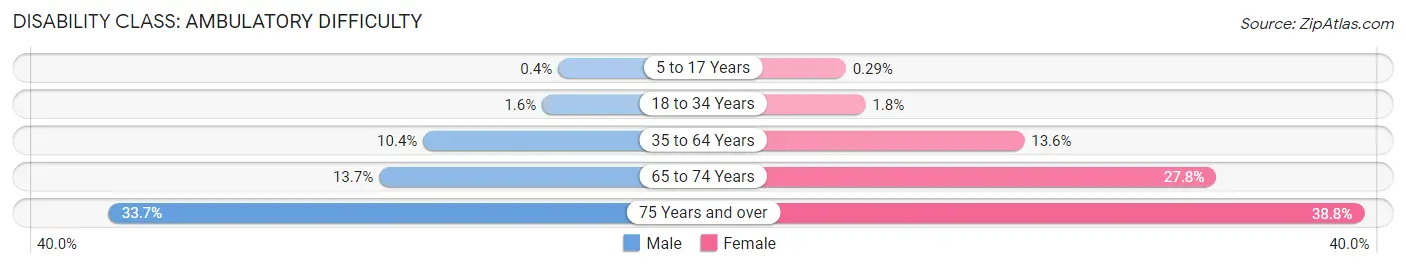
| Age Bracket | Male | Female |
| 5 to 17 Years | 7 (0.4%) | 6 (0.3%) |
| 18 to 34 Years | 54 (1.6%) | 50 (1.8%) |
| 35 to 64 Years | 395 (10.4%) | 527 (13.6%) |
| 65 to 74 Years | 154 (13.7%) | 304 (27.8%) |
| 75 Years and over | 221 (33.7%) | 385 (38.8%) |
Disability Class: Self-Care Difficulty
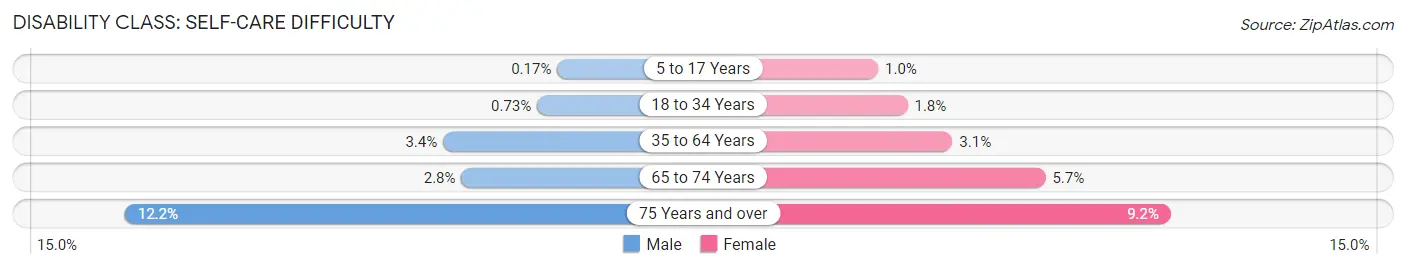
| Age Bracket | Male | Female |
| 5 to 17 Years | 3 (0.2%) | 21 (1.0%) |
| 18 to 34 Years | 25 (0.7%) | 52 (1.8%) |
| 35 to 64 Years | 127 (3.4%) | 120 (3.1%) |
| 65 to 74 Years | 32 (2.8%) | 62 (5.7%) |
| 75 Years and over | 80 (12.2%) | 91 (9.2%) |
Technology Access in Saline County
Computing Device Access in Saline County
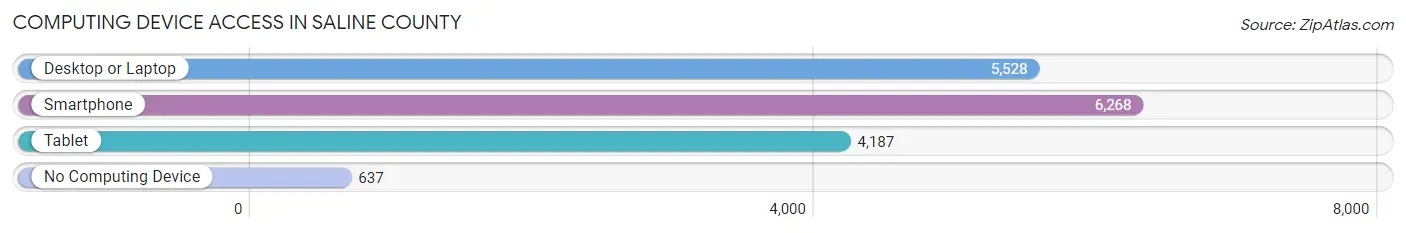
| Device Type | # Households | % Households |
| Desktop or Laptop | 5,528 | 70.8% |
| Smartphone | 6,268 | 80.3% |
| Tablet | 4,187 | 53.6% |
| No Computing Device | 637 | 8.2% |
| Total | 7,808 | 100.0% |
Internet Access in Saline County
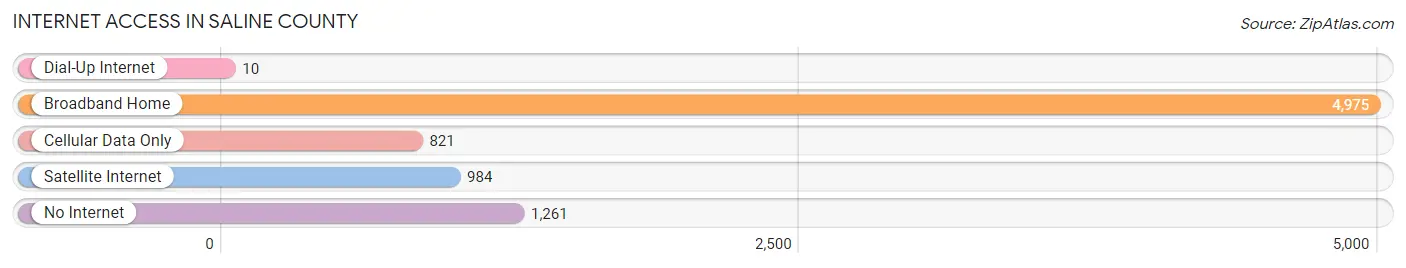
| Internet Type | # Households | % Households |
| Dial-Up Internet | 10 | 0.1% |
| Broadband Home | 4,975 | 63.7% |
| Cellular Data Only | 821 | 10.5% |
| Satellite Internet | 984 | 12.6% |
| No Internet | 1,261 | 16.2% |
| Total | 7,808 | 100.0% |
Saline County Summary
Saline County is located in the northern part of Missouri, and is bordered by Howard, Chariton, and Lafayette counties to the north, Cooper and Pettis counties to the east, and Benton and Hickory counties to the south. The county seat is Marshall, and the county has a total area of 545 square miles.
History
Saline County was established in 1820, and was named for the salt springs that were located in the area. The county was originally part of Howard County, and was later divided into its own county. The first settlers in the area were mostly from Kentucky and Tennessee, and they were attracted to the area due to the abundance of salt springs.
The county was an important part of the Santa Fe Trail, and the town of Marshall was established in 1835. The town was named after John Marshall, the fourth Chief Justice of the United States Supreme Court. The town quickly became an important trading center, and was the site of the first county courthouse.
During the Civil War, Saline County was a major battleground, and the county was the site of several battles, including the Battle of Marshall in 1862. After the war, the county experienced a period of growth and prosperity, and the town of Marshall became an important railroad hub.
Geography
Saline County is located in the northern part of Missouri, and is bordered by Howard, Chariton, and Lafayette counties to the north, Cooper and Pettis counties to the east, and Benton and Hickory counties to the south. The county has a total area of 545 square miles, and is mostly flat, with some rolling hills in the northern part of the county.
The county is drained by the Blackwater River, which flows through the county from north to south. The county is also home to several small lakes, including Lake Viking, which is located in the northern part of the county.
Economy
The economy of Saline County is largely based on agriculture, and the county is home to several large farms. The county is also home to several manufacturing companies, including a large poultry processing plant.
The county is also home to several small businesses, including restaurants, retail stores, and service providers. The county is also home to several tourist attractions, including the Marshall Historic District, which is listed on the National Register of Historic Places.
Demographics
As of the 2010 census, Saline County had a population of 19,814. The population was spread out, with 48.3% male and 51.7% female. The median age was 40.2 years, and the median household income was $45,845.
The racial makeup of the county was 95.2% White, 1.3% African American, 0.4% Native American, 0.5% Asian, 0.1% Pacific Islander, 1.2% from other races, and 1.3% from two or more races. Hispanic or Latino of any race were 3.2% of the population.
Conclusion
Saline County is a rural county located in the northern part of Missouri. The county has a long history, and was an important part of the Santa Fe Trail. The county is largely agricultural, and is home to several large farms and manufacturing companies. The county is also home to several tourist attractions, and has a population of 19,814, as of the 2010 census.
Common Questions
What is Per Capita Income in Saline County?
Per Capita income in Saline County is $26,704.
What is the Median Family Income in Saline County?
Median Family Income in Saline County is $76,335.
What is the Median Household income in Saline County?
Median Household Income in Saline County is $55,396.
What is Income or Wage Gap in Saline County?
Income or Wage Gap in Saline County is 18.9%.
Women in Saline County earn 81.1 cents for every dollar earned by a man.
What is Family Income Deficit in Saline County?
Family Income Deficit in Saline County is $9,651.
Families that are below poverty line in Saline County earn $9,651 less on average than the poverty threshold level.
What is Inequality or Gini Index in Saline County?
Inequality or Gini Index in Saline County is 0.44.
What is the Total Population of Saline County?
Total Population of Saline County is 23,219.
What is the Total Male Population of Saline County?
Total Male Population of Saline County is 11,642.
What is the Total Female Population of Saline County?
Total Female Population of Saline County is 11,577.
What is the Ratio of Males per 100 Females in Saline County?
There are 100.56 Males per 100 Females in Saline County.
What is the Ratio of Females per 100 Males in Saline County?
There are 99.44 Females per 100 Males in Saline County.
What is the Median Population Age in Saline County?
Median Population Age in Saline County is 35.5 Years.
What is the Average Family Size in Saline County
Average Family Size in Saline County is 3.6 People.
What is the Average Household Size in Saline County
Average Household Size in Saline County is 2.8 People.
How Large is the Labor Force in Saline County?
There are 10,763 People in the Labor Forcein in Saline County.
What is the Percentage of People in the Labor Force in Saline County?
57.6% of People are in the Labor Force in Saline County.
What is the Unemployment Rate in Saline County?
Unemployment Rate in Saline County is 2.7%.