Ray County, MO Map & Demographics
Ray County Map
Ray County Overview
$35,601
PER CAPITA INCOME
$82,089
AVG FAMILY INCOME
$69,779
AVG HOUSEHOLD INCOME
30.8%
WAGE / INCOME GAP [ % ]
69.2¢/ $1
WAGE / INCOME GAP [ $ ]
$10,482
FAMILY INCOME DEFICIT
0.43
INEQUALITY / GINI INDEX
23,122
TOTAL POPULATION
11,611
MALE POPULATION
11,511
FEMALE POPULATION
100.87
MALES / 100 FEMALES
99.14
FEMALES / 100 MALES
42.0
MEDIAN AGE
3.1
AVG FAMILY SIZE
2.6
AVG HOUSEHOLD SIZE
11,374
LABOR FORCE [ PEOPLE ]
61.5%
PERCENT IN LABOR FORCE
3.1%
UNEMPLOYMENT RATE
Income in Ray County
Income Overview in Ray County
Per Capita Income in Ray County is $35,601, while median incomes of families and households are $82,089 and $69,779 respectively.
| Characteristic | Number | Measure |
| Per Capita Income | 23,122 | $35,601 |
| Median Family Income | 6,192 | $82,089 |
| Mean Family Income | 6,192 | $99,725 |
| Median Household Income | 8,773 | $69,779 |
| Mean Household Income | 8,773 | $87,696 |
| Income Deficit | 6,192 | $10,482 |
| Wage / Income Gap (%) | 23,122 | 30.83% |
| Wage / Income Gap ($) | 23,122 | 69.17¢ per $1 |
| Gini / Inequality Index | 23,122 | 0.43 |
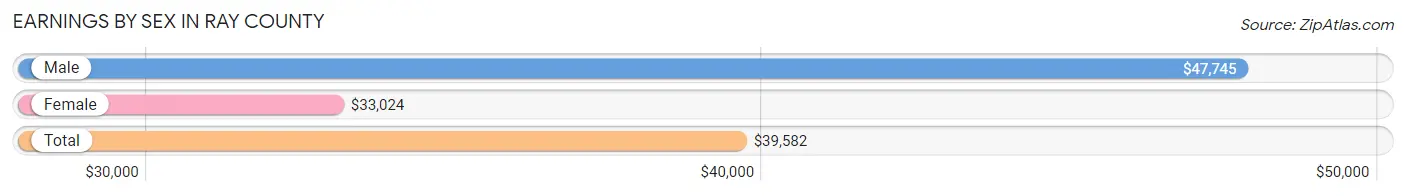
Earnings by Sex in Ray County
Average Earnings in Ray County are $39,582, $47,745 for men and $33,024 for women, a difference of 30.8%.
| Sex | Number | Average Earnings |
| Male | 6,551 (54.3%) | $47,745 |
| Female | 5,523 (45.7%) | $33,024 |
| Total | 12,074 (100.0%) | $39,582 |
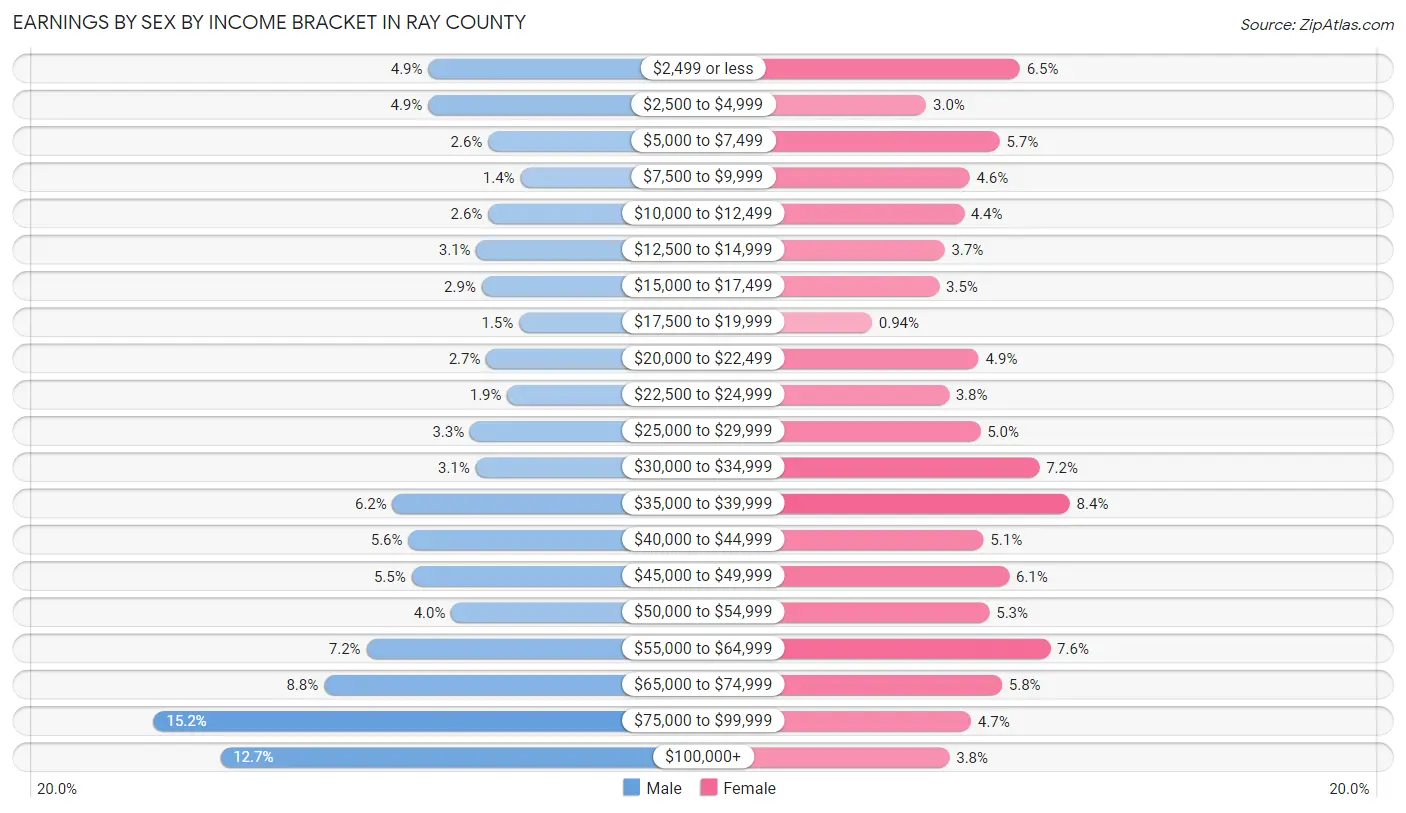
Earnings by Sex by Income Bracket in Ray County
The most common earnings brackets in Ray County are $75,000 to $99,999 for men (994 | 15.2%) and $35,000 to $39,999 for women (461 | 8.4%).
| Income | Male | Female |
| $2,499 or less | 319 (4.9%) | 358 (6.5%) |
| $2,500 to $4,999 | 320 (4.9%) | 164 (3.0%) |
| $5,000 to $7,499 | 172 (2.6%) | 316 (5.7%) |
| $7,500 to $9,999 | 93 (1.4%) | 254 (4.6%) |
| $10,000 to $12,499 | 172 (2.6%) | 242 (4.4%) |
| $12,500 to $14,999 | 201 (3.1%) | 202 (3.7%) |
| $15,000 to $17,499 | 188 (2.9%) | 191 (3.5%) |
| $17,500 to $19,999 | 96 (1.5%) | 52 (0.9%) |
| $20,000 to $22,499 | 177 (2.7%) | 273 (4.9%) |
| $22,500 to $24,999 | 125 (1.9%) | 211 (3.8%) |
| $25,000 to $29,999 | 217 (3.3%) | 276 (5.0%) |
| $30,000 to $34,999 | 203 (3.1%) | 398 (7.2%) |
| $35,000 to $39,999 | 407 (6.2%) | 461 (8.4%) |
| $40,000 to $44,999 | 368 (5.6%) | 283 (5.1%) |
| $45,000 to $49,999 | 360 (5.5%) | 336 (6.1%) |
| $50,000 to $54,999 | 263 (4.0%) | 295 (5.3%) |
| $55,000 to $64,999 | 471 (7.2%) | 421 (7.6%) |
| $65,000 to $74,999 | 575 (8.8%) | 321 (5.8%) |
| $75,000 to $99,999 | 994 (15.2%) | 257 (4.6%) |
| $100,000+ | 830 (12.7%) | 212 (3.8%) |
| Total | 6,551 (100.0%) | 5,523 (100.0%) |
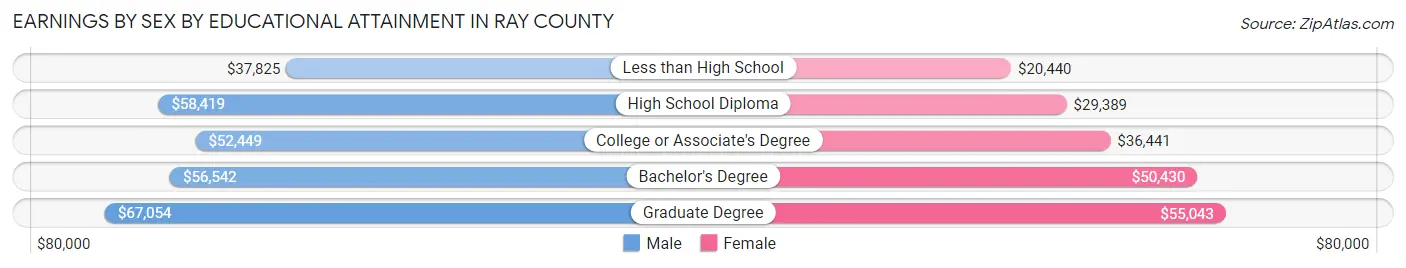
Earnings by Sex by Educational Attainment in Ray County
Average earnings in Ray County are $54,769 for men and $36,519 for women, a difference of 33.3%. Men with an educational attainment of graduate degree enjoy the highest average annual earnings of $67,054, while those with less than high school education earn the least with $37,825. Women with an educational attainment of graduate degree earn the most with the average annual earnings of $55,043, while those with less than high school education have the smallest earnings of $20,440.
| Educational Attainment | Male Income | Female Income |
| Less than High School | $37,825 | $20,440 |
| High School Diploma | $58,419 | $29,389 |
| College or Associate's Degree | $52,449 | $36,441 |
| Bachelor's Degree | $56,542 | $50,430 |
| Graduate Degree | $67,054 | $55,043 |
| Total | $54,769 | $36,519 |
Family Income in Ray County
Family Income Brackets in Ray County
According to the Ray County family income data, there are 1,288 families falling into the $75,000 to $99,999 income range, which is the most common income bracket and makes up 20.8% of all families. Conversely, the less than $10,000 income bracket is the least frequent group with only 155 families (2.5%) belonging to this category.
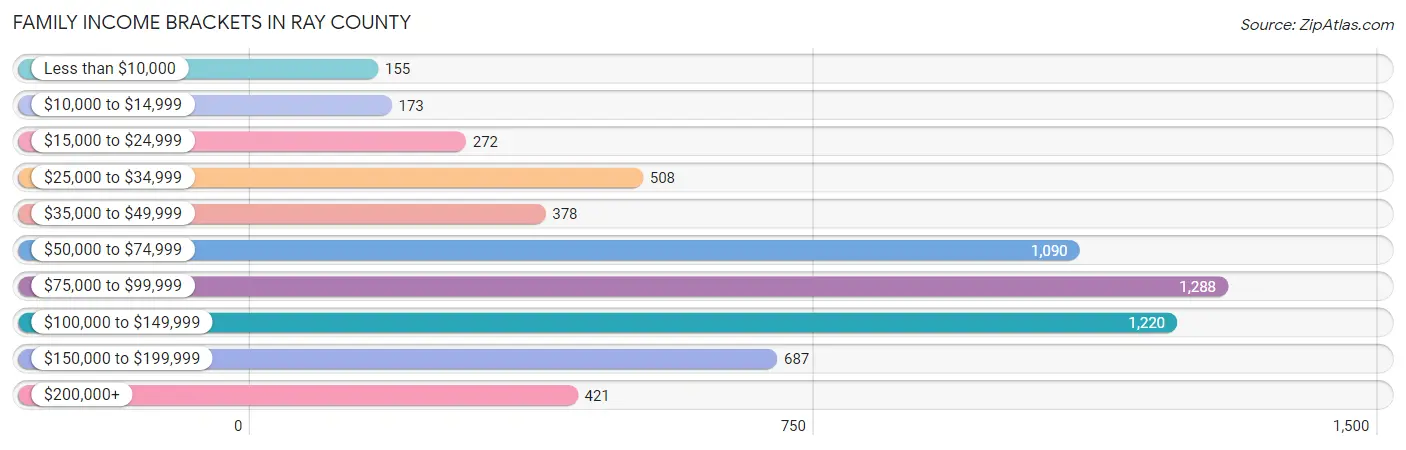
| Income Bracket | # Families | % Families |
| Less than $10,000 | 155 | 2.5% |
| $10,000 to $14,999 | 173 | 2.8% |
| $15,000 to $24,999 | 272 | 4.4% |
| $25,000 to $34,999 | 508 | 8.2% |
| $35,000 to $49,999 | 378 | 6.1% |
| $50,000 to $74,999 | 1,090 | 17.6% |
| $75,000 to $99,999 | 1,288 | 20.8% |
| $100,000 to $149,999 | 1,220 | 19.7% |
| $150,000 to $199,999 | 687 | 11.1% |
| $200,000+ | 421 | 6.8% |
Family Income by Famaliy Size in Ray County
7+ person families (84 | 1.4%) account for the highest median family income in Ray County with $157,115 per family, while 2-person families (3,370 | 54.4%) have the highest median income of $38,689 per family member.
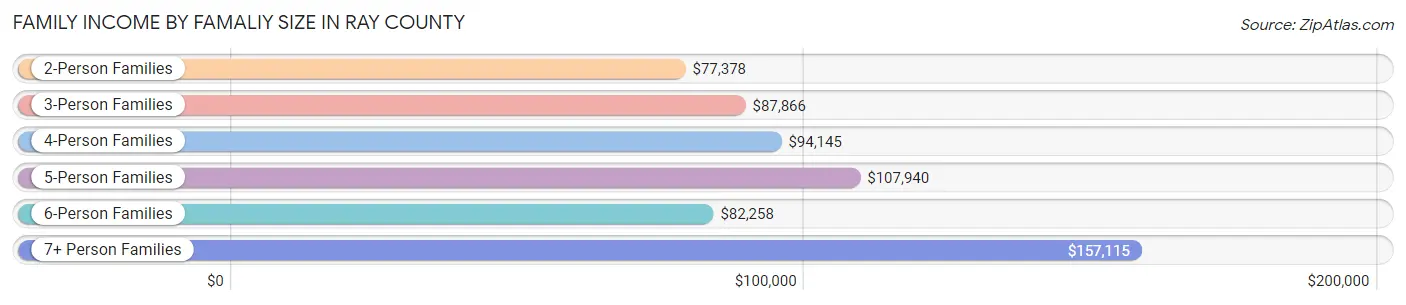
| Income Bracket | # Families | Median Income |
| 2-Person Families | 3,370 (54.4%) | $77,378 |
| 3-Person Families | 936 (15.1%) | $87,866 |
| 4-Person Families | 1,063 (17.2%) | $94,145 |
| 5-Person Families | 535 (8.6%) | $107,940 |
| 6-Person Families | 204 (3.3%) | $82,258 |
| 7+ Person Families | 84 (1.4%) | $157,115 |
| Total | 6,192 (100.0%) | $82,089 |
Family Income by Number of Earners in Ray County
The median family income in Ray County is $82,089, with families comprising 3+ earners (664) having the highest median family income of $152,569, while families with no earners (1,028) have the lowest median family income of $49,113, accounting for 10.7% and 16.6% of families, respectively.
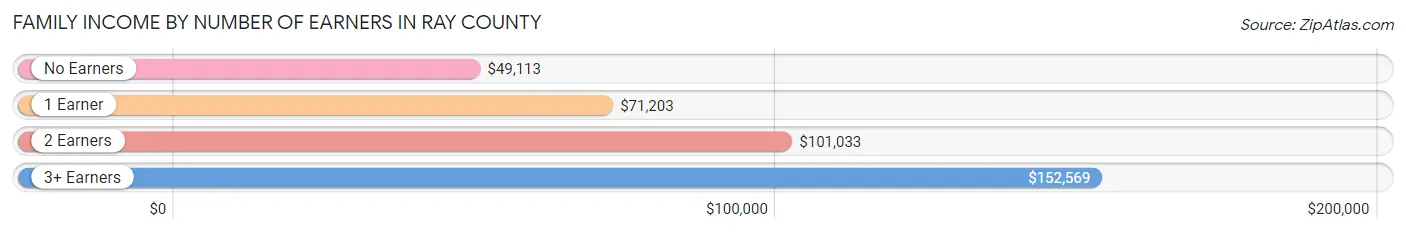
| Number of Earners | # Families | Median Income |
| No Earners | 1,028 (16.6%) | $49,113 |
| 1 Earner | 2,235 (36.1%) | $71,203 |
| 2 Earners | 2,265 (36.6%) | $101,033 |
| 3+ Earners | 664 (10.7%) | $152,569 |
| Total | 6,192 (100.0%) | $82,089 |
Household Income in Ray County
Household Income Brackets in Ray County
With 1,632 households falling in the category, the $50,000 to $74,999 income range is the most frequent in Ray County, accounting for 18.6% of all households. In contrast, only 342 households (3.9%) fall into the less than $10,000 income bracket, making it the least populous group.
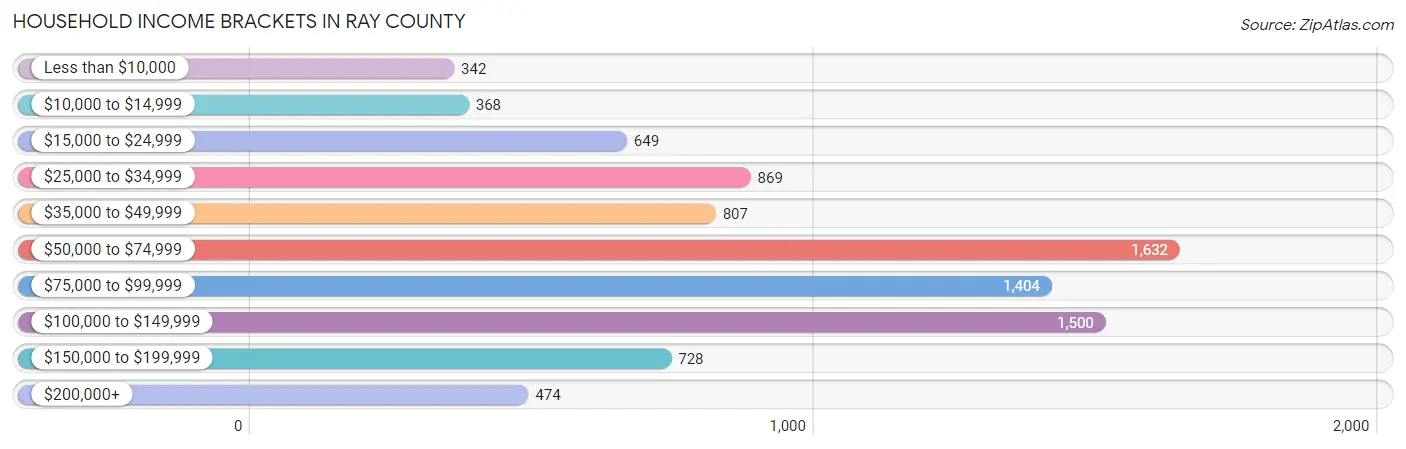
| Income Bracket | # Households | % Households |
| Less than $10,000 | 342 | 3.9% |
| $10,000 to $14,999 | 368 | 4.2% |
| $15,000 to $24,999 | 649 | 7.4% |
| $25,000 to $34,999 | 869 | 9.9% |
| $35,000 to $49,999 | 807 | 9.2% |
| $50,000 to $74,999 | 1,632 | 18.6% |
| $75,000 to $99,999 | 1,404 | 16.0% |
| $100,000 to $149,999 | 1,500 | 17.1% |
| $150,000 to $199,999 | 728 | 8.3% |
| $200,000+ | 474 | 5.4% |
Household Income by Householder Age in Ray County
The median household income in Ray County is $69,779, with the highest median household income of $80,389 found in the 45 to 64 years age bracket for the primary householder. A total of 3,395 households (38.7%) fall into this category. Meanwhile, the 15 to 24 years age bracket for the primary householder has the lowest median household income of $47,083, with 243 households (2.8%) in this group.
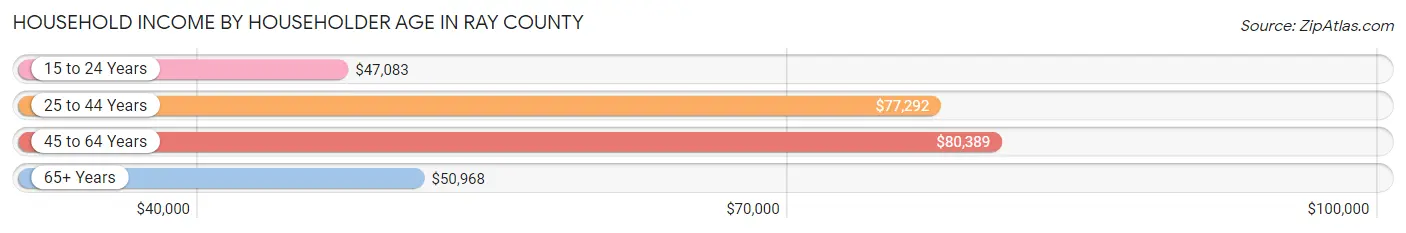
| Income Bracket | # Households | Median Income |
| 15 to 24 Years | 243 (2.8%) | $47,083 |
| 25 to 44 Years | 2,394 (27.3%) | $77,292 |
| 45 to 64 Years | 3,395 (38.7%) | $80,389 |
| 65+ Years | 2,741 (31.2%) | $50,968 |
| Total | 8,773 (100.0%) | $69,779 |
Poverty in Ray County
Income Below Poverty by Sex and Age in Ray County
With 10.1% poverty level for males and 14.3% for females among the residents of Ray County, 15 year old males and 5 year old females are the most vulnerable to poverty, with 59 males (26.9%) and 75 females (40.1%) in their respective age groups living below the poverty level.
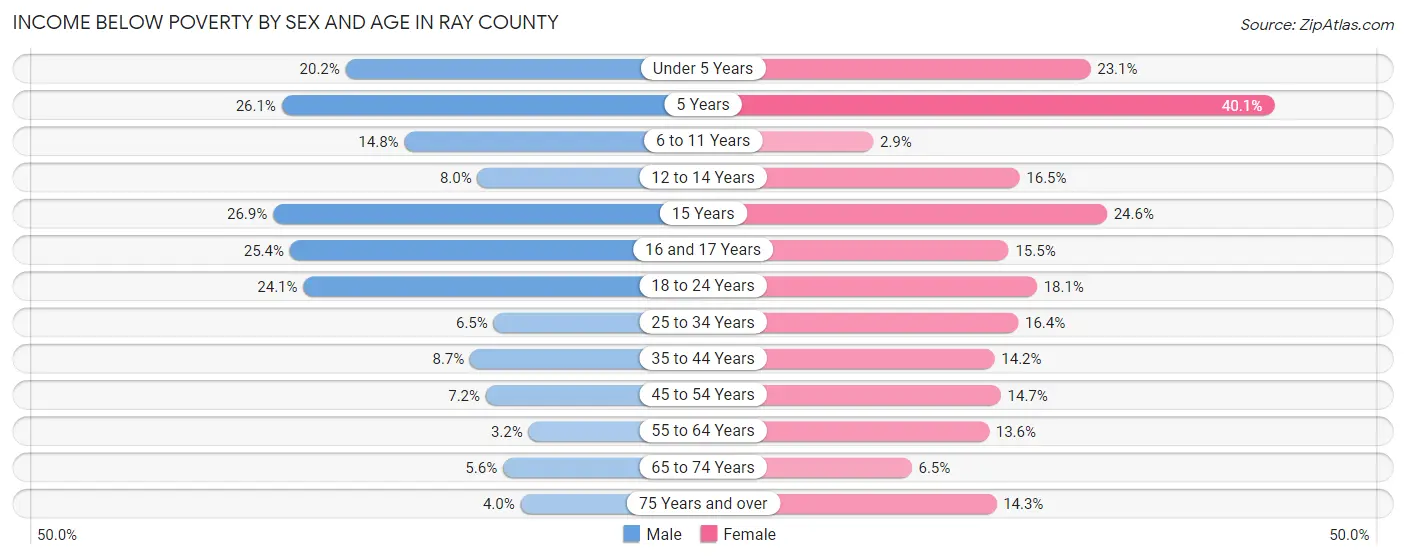
| Age Bracket | Male | Female |
| Under 5 Years | 135 (20.2%) | 140 (23.1%) |
| 5 Years | 23 (26.1%) | 75 (40.1%) |
| 6 to 11 Years | 146 (14.7%) | 21 (2.9%) |
| 12 to 14 Years | 34 (8.0%) | 89 (16.5%) |
| 15 Years | 59 (26.9%) | 30 (24.6%) |
| 16 and 17 Years | 65 (25.4%) | 54 (15.5%) |
| 18 to 24 Years | 237 (24.1%) | 146 (18.1%) |
| 25 to 34 Years | 81 (6.5%) | 211 (16.4%) |
| 35 to 44 Years | 122 (8.6%) | 194 (14.2%) |
| 45 to 54 Years | 107 (7.2%) | 213 (14.7%) |
| 55 to 64 Years | 59 (3.2%) | 231 (13.6%) |
| 65 to 74 Years | 67 (5.6%) | 82 (6.5%) |
| 75 Years and over | 28 (4.0%) | 135 (14.3%) |
| Total | 1,163 (10.1%) | 1,621 (14.3%) |
Income Above Poverty by Sex and Age in Ray County
According to the poverty statistics in Ray County, males aged 55 to 64 years and females aged 6 to 11 years are the age groups that are most secure financially, with 96.8% of males and 97.1% of females in these age groups living above the poverty line.
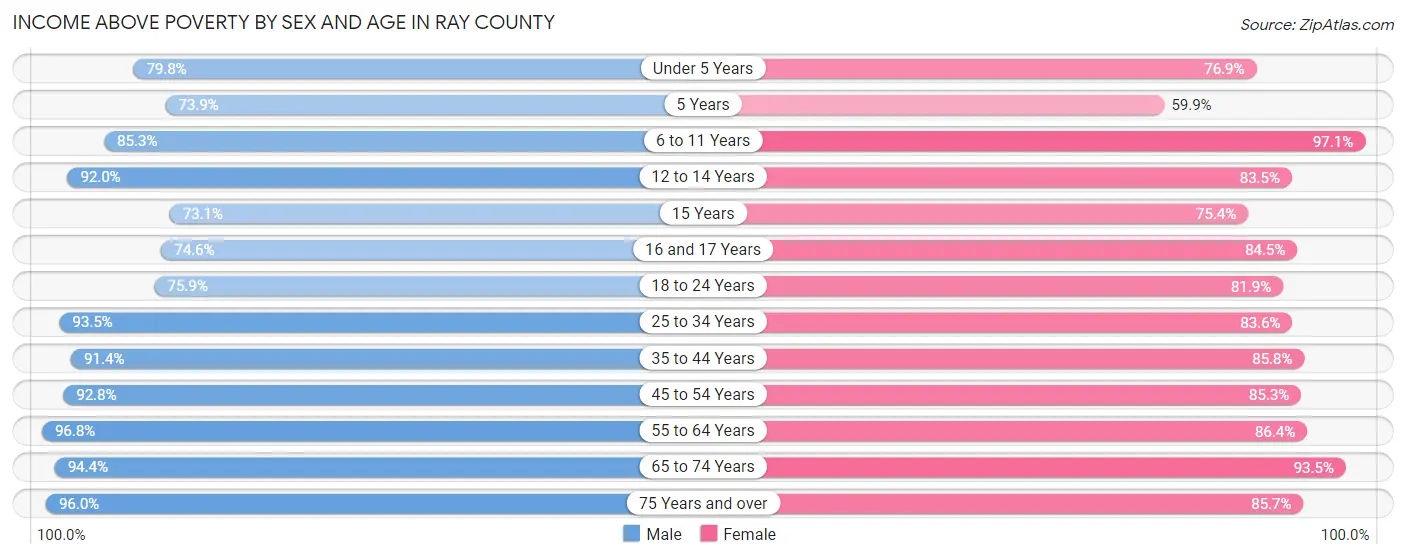
| Age Bracket | Male | Female |
| Under 5 Years | 533 (79.8%) | 467 (76.9%) |
| 5 Years | 65 (73.9%) | 112 (59.9%) |
| 6 to 11 Years | 844 (85.3%) | 703 (97.1%) |
| 12 to 14 Years | 393 (92.0%) | 451 (83.5%) |
| 15 Years | 160 (73.1%) | 92 (75.4%) |
| 16 and 17 Years | 191 (74.6%) | 295 (84.5%) |
| 18 to 24 Years | 745 (75.9%) | 661 (81.9%) |
| 25 to 34 Years | 1,170 (93.5%) | 1,079 (83.6%) |
| 35 to 44 Years | 1,288 (91.3%) | 1,176 (85.8%) |
| 45 to 54 Years | 1,381 (92.8%) | 1,232 (85.3%) |
| 55 to 64 Years | 1,769 (96.8%) | 1,462 (86.4%) |
| 65 to 74 Years | 1,129 (94.4%) | 1,186 (93.5%) |
| 75 Years and over | 678 (96.0%) | 807 (85.7%) |
| Total | 10,346 (89.9%) | 9,723 (85.7%) |
Income Below Poverty Among Married-Couple Families in Ray County
The poverty statistics for married-couple families in Ray County show that 4.2% or 199 of the total 4,792 families live below the poverty line. Families with 3 or 4 children have the highest poverty rate of 12.1%, comprising of 70 families. On the other hand, families with 5 or more children have the lowest poverty rate of 0.0%, which includes 0 families.
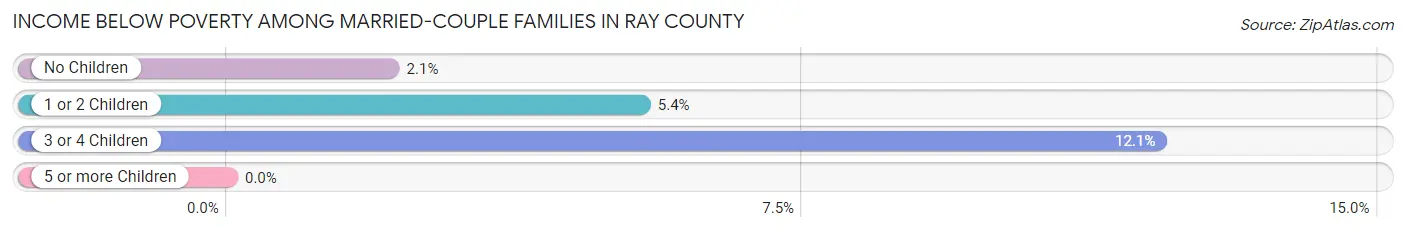
| Children | Above Poverty | Below Poverty |
| No Children | 2,881 (97.9%) | 62 (2.1%) |
| 1 or 2 Children | 1,177 (94.6%) | 67 (5.4%) |
| 3 or 4 Children | 507 (87.9%) | 70 (12.1%) |
| 5 or more Children | 28 (100.0%) | 0 (0.0%) |
| Total | 4,593 (95.9%) | 199 (4.2%) |
Income Below Poverty Among Single-Parent Households in Ray County
According to the poverty data in Ray County, 11.4% or 52 single-father households and 29.6% or 279 single-mother households are living below the poverty line. Among single-father households, those with no children have the highest poverty rate, with 34 households (14.1%) experiencing poverty. Likewise, among single-mother households, those with 3 or 4 children have the highest poverty rate, with 81 households (46.0%) falling below the poverty line.
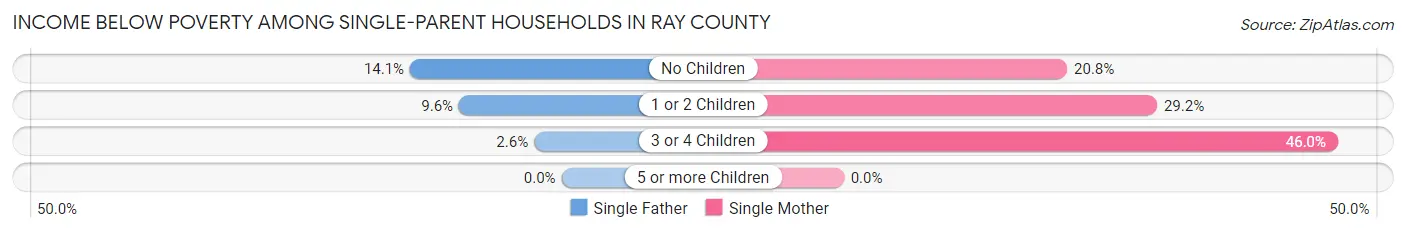
| Children | Single Father | Single Mother |
| No Children | 34 (14.1%) | 62 (20.8%) |
| 1 or 2 Children | 17 (9.6%) | 136 (29.2%) |
| 3 or 4 Children | 1 (2.6%) | 81 (46.0%) |
| 5 or more Children | 0 (0.0%) | 0 (0.0%) |
| Total | 52 (11.4%) | 279 (29.6%) |
Income Below Poverty Among Married-Couple vs Single-Parent Households in Ray County
The poverty data for Ray County shows that 199 of the married-couple family households (4.2%) and 331 of the single-parent households (23.6%) are living below the poverty level. Within the married-couple family households, those with 3 or 4 children have the highest poverty rate, with 70 households (12.1%) falling below the poverty line. Among the single-parent households, those with 3 or 4 children have the highest poverty rate, with 82 household (38.1%) living below poverty.
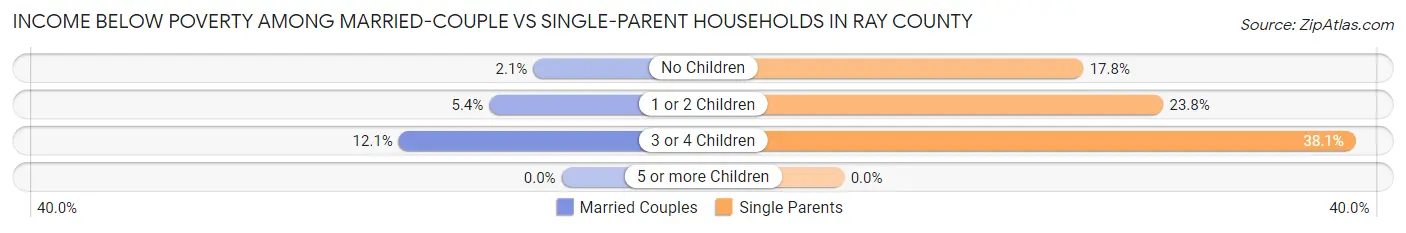
| Children | Married-Couple Families | Single-Parent Households |
| No Children | 62 (2.1%) | 96 (17.8%) |
| 1 or 2 Children | 67 (5.4%) | 153 (23.8%) |
| 3 or 4 Children | 70 (12.1%) | 82 (38.1%) |
| 5 or more Children | 0 (0.0%) | 0 (0.0%) |
| Total | 199 (4.2%) | 331 (23.6%) |
Race in Ray County
The most populous races in Ray County are White / Caucasian (21,692 | 93.8%), Two or more Races (722 | 3.1%), and Hispanic or Latino (627 | 2.7%).
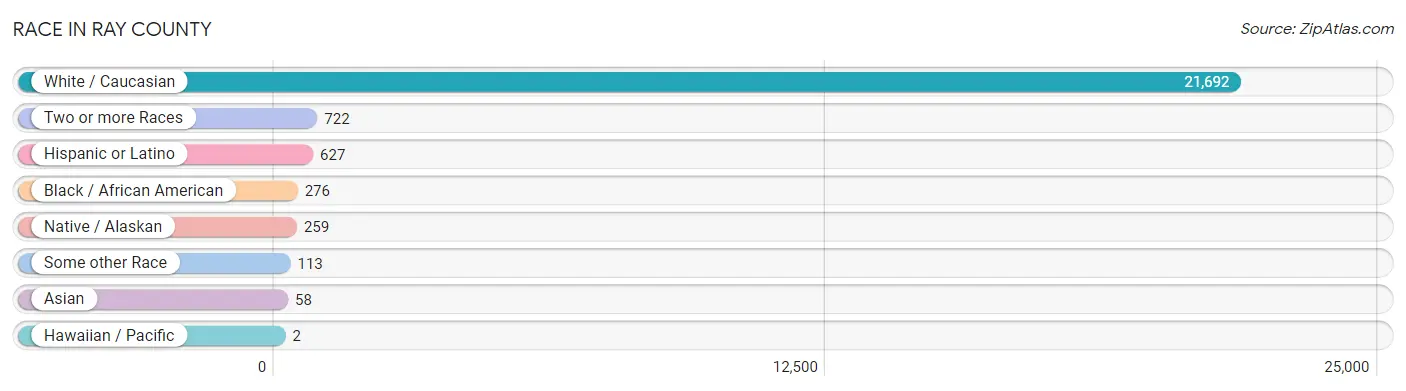
| Race | # Population | % Population |
| Asian | 58 | 0.3% |
| Black / African American | 276 | 1.2% |
| Hawaiian / Pacific | 2 | 0.0% |
| Hispanic or Latino | 627 | 2.7% |
| Native / Alaskan | 259 | 1.1% |
| White / Caucasian | 21,692 | 93.8% |
| Two or more Races | 722 | 3.1% |
| Some other Race | 113 | 0.5% |
| Total | 23,122 | 100.0% |
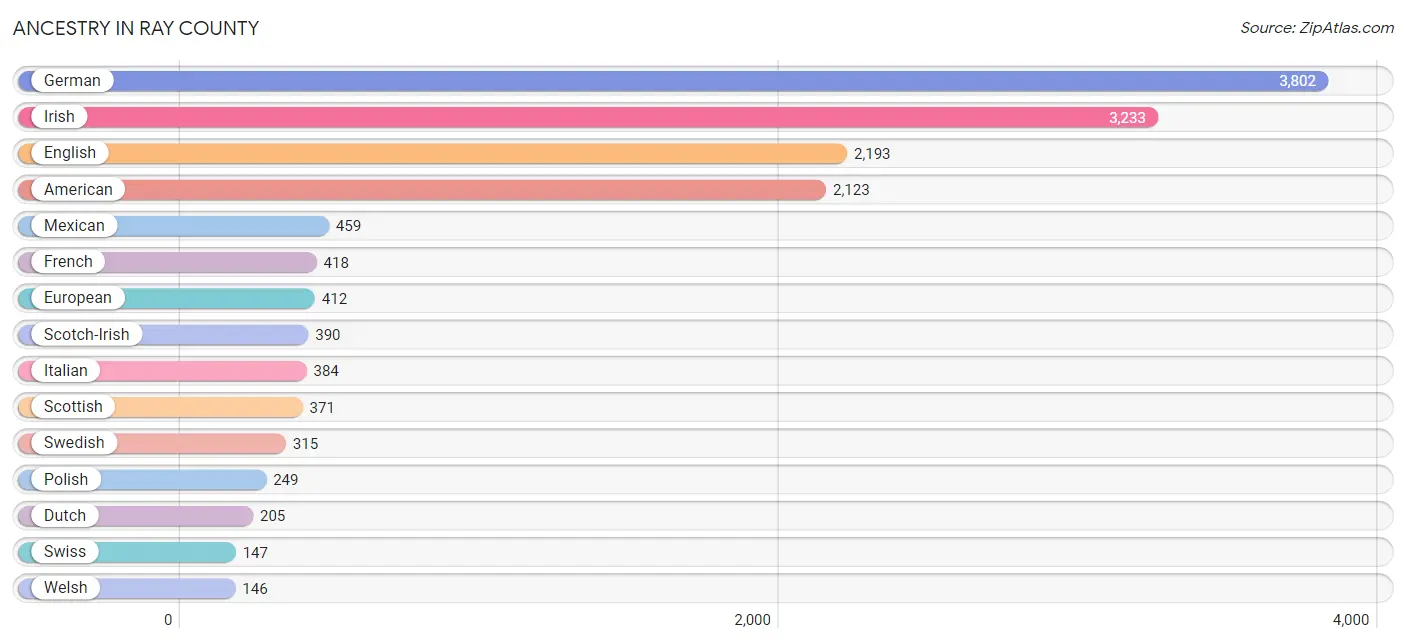
Ancestry in Ray County
The most populous ancestries reported in Ray County are German (3,802 | 16.4%), Irish (3,233 | 14.0%), English (2,193 | 9.5%), American (2,123 | 9.2%), and Mexican (459 | 2.0%), together accounting for 51.1% of all Ray County residents.
| Ancestry | # Population | % Population |
| African | 25 | 0.1% |
| American | 2,123 | 9.2% |
| Arab | 9 | 0.0% |
| Austrian | 64 | 0.3% |
| Belgian | 67 | 0.3% |
| Bhutanese | 3 | 0.0% |
| Blackfeet | 6 | 0.0% |
| British | 70 | 0.3% |
| Burmese | 94 | 0.4% |
| Central American | 10 | 0.0% |
| Central American Indian | 135 | 0.6% |
| Cherokee | 86 | 0.4% |
| Chippewa | 2 | 0.0% |
| Choctaw | 1 | 0.0% |
| Creek | 2 | 0.0% |
| Cuban | 33 | 0.1% |
| Czech | 13 | 0.1% |
| Czechoslovakian | 15 | 0.1% |
| Danish | 30 | 0.1% |
| Dutch | 205 | 0.9% |
| Eastern European | 51 | 0.2% |
| English | 2,193 | 9.5% |
| European | 412 | 1.8% |
| French | 418 | 1.8% |
| French Canadian | 9 | 0.0% |
| German | 3,802 | 16.4% |
| Guamanian / Chamorro | 3 | 0.0% |
| Hungarian | 14 | 0.1% |
| Indian (Asian) | 5 | 0.0% |
| Inupiat | 3 | 0.0% |
| Irish | 3,233 | 14.0% |
| Iroquois | 2 | 0.0% |
| Italian | 384 | 1.7% |
| Jamaican | 4 | 0.0% |
| Korean | 2 | 0.0% |
| Lebanese | 3 | 0.0% |
| Lithuanian | 16 | 0.1% |
| Luxembourger | 4 | 0.0% |
| Mexican | 459 | 2.0% |
| Native Hawaiian | 8 | 0.0% |
| Navajo | 12 | 0.1% |
| Nicaraguan | 4 | 0.0% |
| Northern European | 21 | 0.1% |
| Norwegian | 94 | 0.4% |
| Panamanian | 6 | 0.0% |
| Pennsylvania German | 69 | 0.3% |
| Polish | 249 | 1.1% |
| Potawatomi | 4 | 0.0% |
| Puerto Rican | 57 | 0.3% |
| Russian | 9 | 0.0% |
| Samoan | 10 | 0.0% |
| Scandinavian | 80 | 0.4% |
| Scotch-Irish | 390 | 1.7% |
| Scottish | 371 | 1.6% |
| Shoshone | 19 | 0.1% |
| Sioux | 37 | 0.2% |
| Spaniard | 12 | 0.1% |
| Sri Lankan | 10 | 0.0% |
| Subsaharan African | 25 | 0.1% |
| Swedish | 315 | 1.4% |
| Swiss | 147 | 0.6% |
| Thai | 17 | 0.1% |
| Ukrainian | 2 | 0.0% |
| Welsh | 146 | 0.6% |
| Yugoslavian | 25 | 0.1% | View All 65 Rows |
Immigrants in Ray County
The most numerous immigrant groups reported in Ray County came from Central America (79 | 0.3%), Latin America (79 | 0.3%), Mexico (79 | 0.3%), Europe (69 | 0.3%), and Asia (53 | 0.2%), together accounting for 1.5% of all Ray County residents.
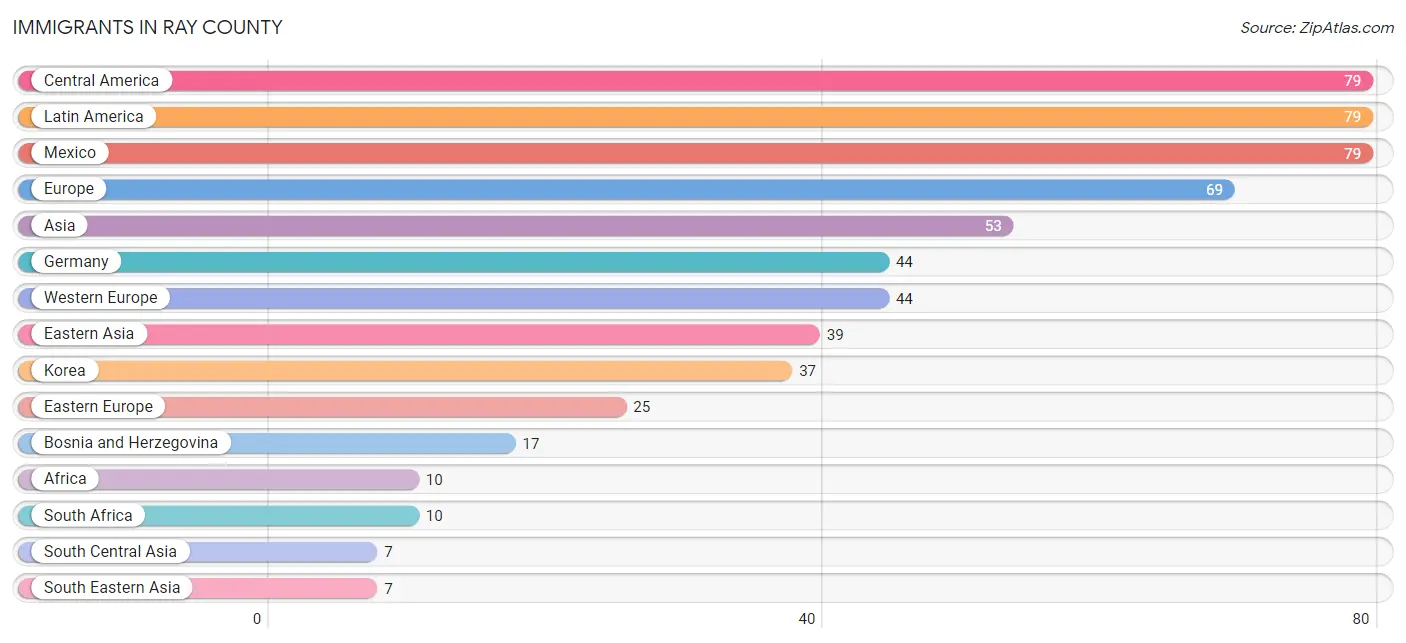
| Immigration Origin | # Population | % Population |
| Africa | 10 | 0.0% |
| Asia | 53 | 0.2% |
| Bangladesh | 4 | 0.0% |
| Bosnia and Herzegovina | 17 | 0.1% |
| Canada | 1 | 0.0% |
| Central America | 79 | 0.3% |
| China | 2 | 0.0% |
| Eastern Asia | 39 | 0.2% |
| Eastern Europe | 25 | 0.1% |
| Europe | 69 | 0.3% |
| Fiji | 2 | 0.0% |
| Germany | 44 | 0.2% |
| Hungary | 2 | 0.0% |
| India | 3 | 0.0% |
| Korea | 37 | 0.2% |
| Latin America | 79 | 0.3% |
| Mexico | 79 | 0.3% |
| Oceania | 2 | 0.0% |
| Philippines | 4 | 0.0% |
| Russia | 4 | 0.0% |
| South Africa | 10 | 0.0% |
| South Central Asia | 7 | 0.0% |
| South Eastern Asia | 7 | 0.0% |
| Thailand | 1 | 0.0% |
| Ukraine | 2 | 0.0% |
| Vietnam | 2 | 0.0% |
| Western Europe | 44 | 0.2% | View All 27 Rows |
Sex and Age in Ray County
Sex and Age in Ray County
The most populous age groups in Ray County are 60 to 64 Years (1,014 | 8.7%) for men and 10 to 14 Years (911 | 7.9%) for women.
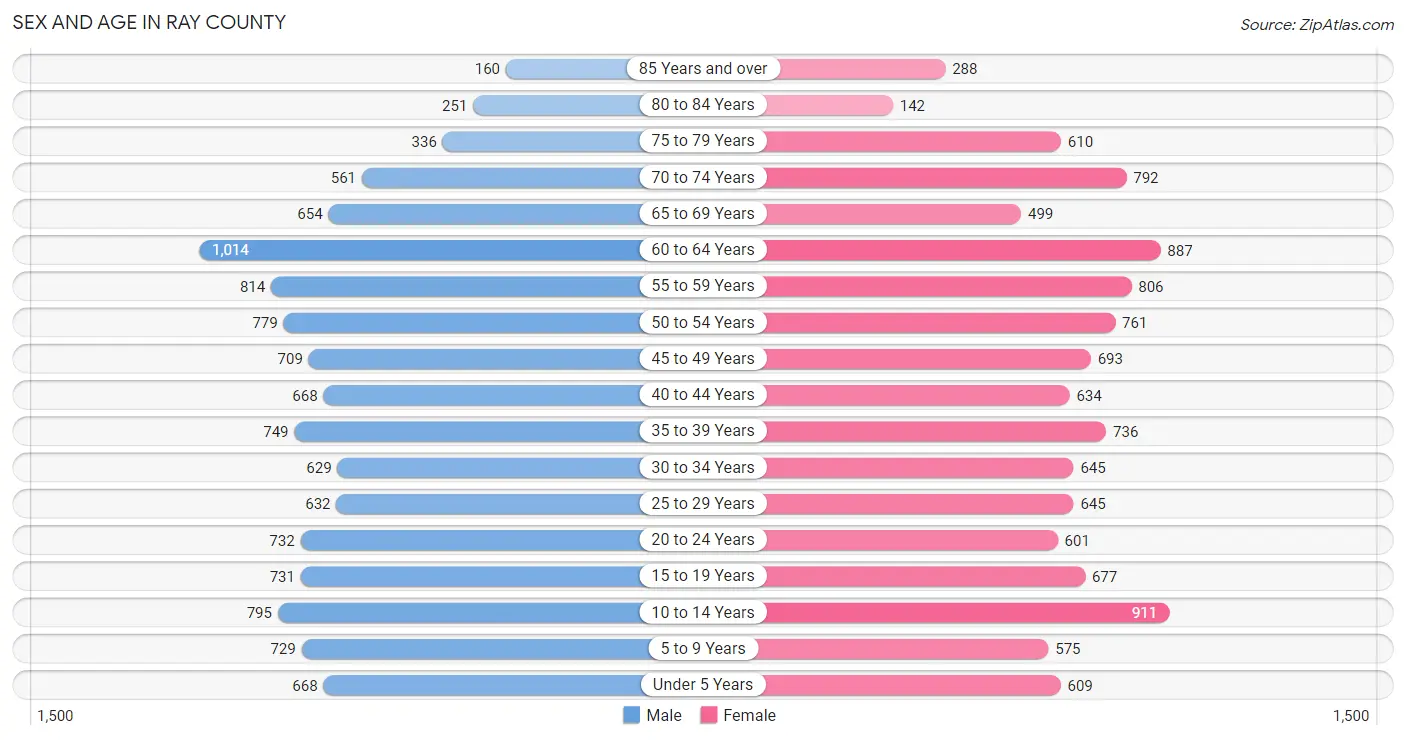
| Age Bracket | Male | Female |
| Under 5 Years | 668 (5.8%) | 609 (5.3%) |
| 5 to 9 Years | 729 (6.3%) | 575 (5.0%) |
| 10 to 14 Years | 795 (6.9%) | 911 (7.9%) |
| 15 to 19 Years | 731 (6.3%) | 677 (5.9%) |
| 20 to 24 Years | 732 (6.3%) | 601 (5.2%) |
| 25 to 29 Years | 632 (5.4%) | 645 (5.6%) |
| 30 to 34 Years | 629 (5.4%) | 645 (5.6%) |
| 35 to 39 Years | 749 (6.5%) | 736 (6.4%) |
| 40 to 44 Years | 668 (5.8%) | 634 (5.5%) |
| 45 to 49 Years | 709 (6.1%) | 693 (6.0%) |
| 50 to 54 Years | 779 (6.7%) | 761 (6.6%) |
| 55 to 59 Years | 814 (7.0%) | 806 (7.0%) |
| 60 to 64 Years | 1,014 (8.7%) | 887 (7.7%) |
| 65 to 69 Years | 654 (5.6%) | 499 (4.3%) |
| 70 to 74 Years | 561 (4.8%) | 792 (6.9%) |
| 75 to 79 Years | 336 (2.9%) | 610 (5.3%) |
| 80 to 84 Years | 251 (2.2%) | 142 (1.2%) |
| 85 Years and over | 160 (1.4%) | 288 (2.5%) |
| Total | 11,611 (100.0%) | 11,511 (100.0%) |
Families and Households in Ray County
Median Family Size in Ray County
The median family size in Ray County is 3.06 persons per family, with single female/mother families (942 | 15.2%) accounting for the largest median family size of 3.15 persons per family. On the other hand, single male/father families (458 | 7.4%) represent the smallest median family size with 2.63 persons per family.
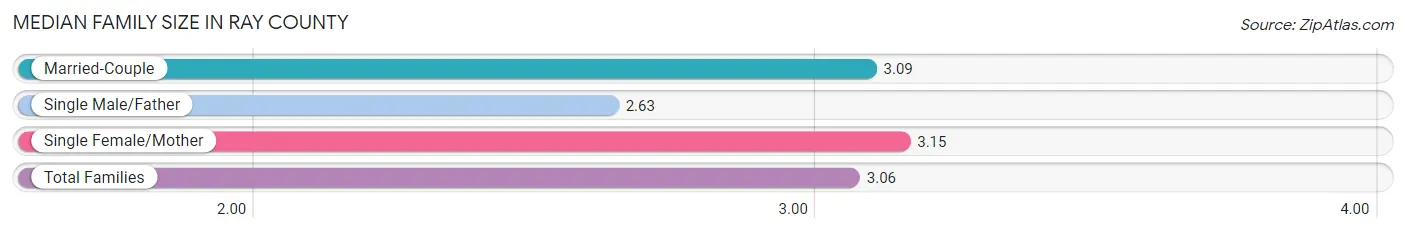
| Family Type | # Families | Family Size |
| Married-Couple | 4,792 (77.4%) | 3.09 |
| Single Male/Father | 458 (7.4%) | 2.63 |
| Single Female/Mother | 942 (15.2%) | 3.15 |
| Total Families | 6,192 (100.0%) | 3.06 |
Median Household Size in Ray County
The median household size in Ray County is 2.61 persons per household, with single female/mother households (942 | 10.7%) accounting for the largest median household size of 3.6 persons per household. non-family households (2,581 | 29.4%) represent the smallest median household size with 1.22 persons per household.
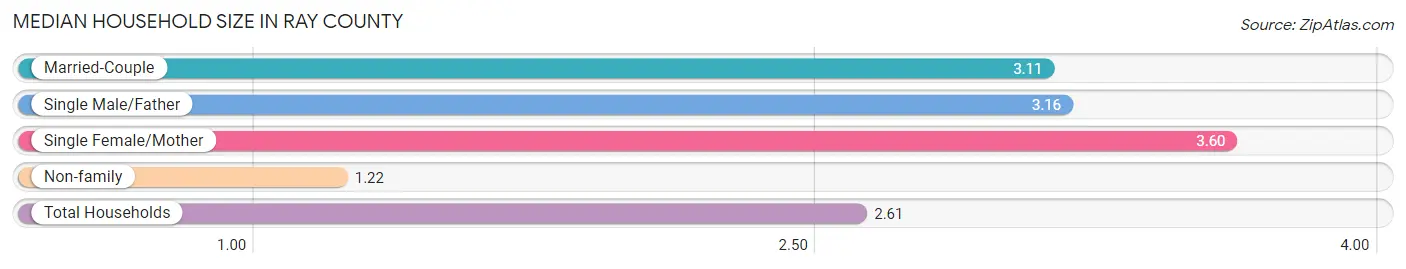
| Household Type | # Households | Household Size |
| Married-Couple | 4,792 (54.6%) | 3.11 |
| Single Male/Father | 458 (5.2%) | 3.16 |
| Single Female/Mother | 942 (10.7%) | 3.60 |
| Non-family | 2,581 (29.4%) | 1.22 |
| Total Households | 8,773 (100.0%) | 2.61 |
Household Size by Marriage Status in Ray County
Out of a total of 8,773 households in Ray County, 6,192 (70.6%) are family households, while 2,581 (29.4%) are nonfamily households. The most numerous type of family households are 2-person households, comprising 3,103, and the most common type of nonfamily households are 1-person households, comprising 2,168.
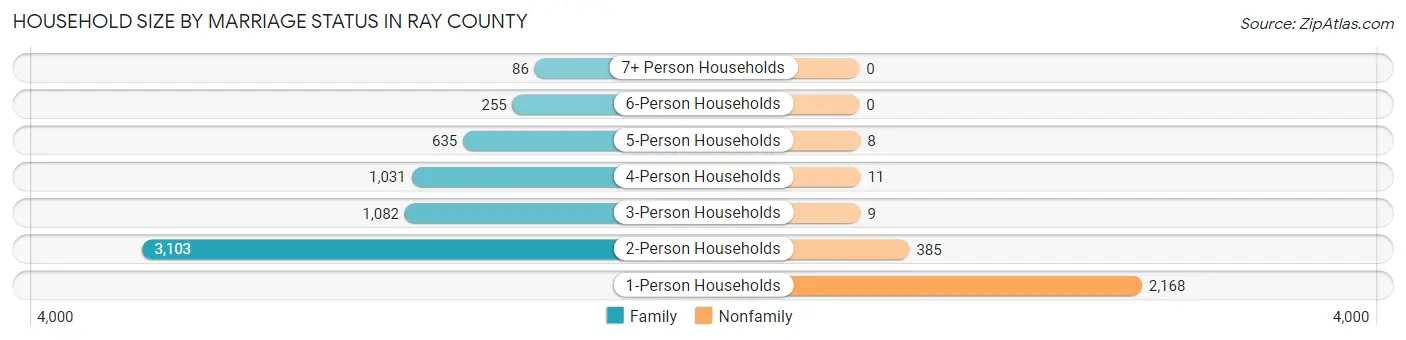
| Household Size | Family Households | Nonfamily Households |
| 1-Person Households | - | 2,168 (24.7%) |
| 2-Person Households | 3,103 (35.4%) | 385 (4.4%) |
| 3-Person Households | 1,082 (12.3%) | 9 (0.1%) |
| 4-Person Households | 1,031 (11.7%) | 11 (0.1%) |
| 5-Person Households | 635 (7.2%) | 8 (0.1%) |
| 6-Person Households | 255 (2.9%) | 0 (0.0%) |
| 7+ Person Households | 86 (1.0%) | 0 (0.0%) |
| Total | 6,192 (70.6%) | 2,581 (29.4%) |
Female Fertility in Ray County
Fertility by Age in Ray County
Average fertility rate in Ray County is 64.0 births per 1,000 women. Women in the age bracket of 20 to 34 years have the highest fertility rate with 151.0 births per 1,000 women. Women in the age bracket of 20 to 34 years acount for 94.1% of all women with births.
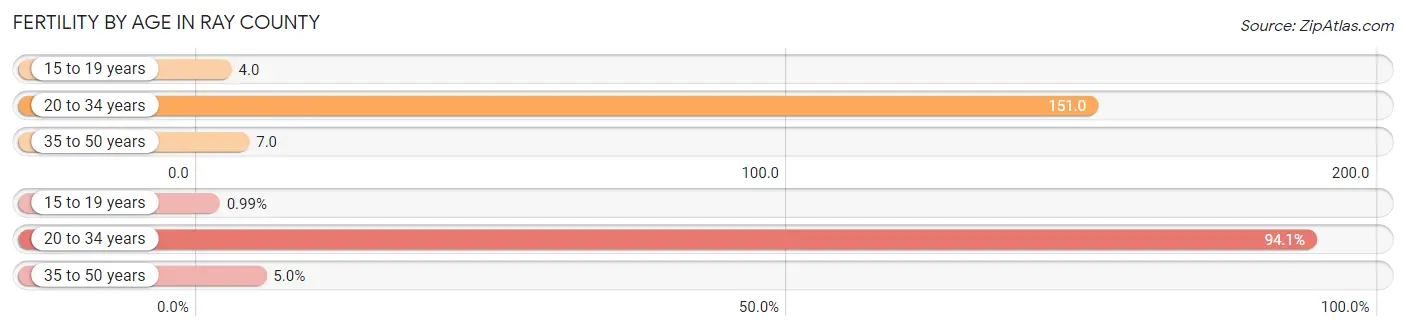
| Age Bracket | Women with Births | Births / 1,000 Women |
| 15 to 19 years | 3 (1.0%) | 4.0 |
| 20 to 34 years | 285 (94.1%) | 151.0 |
| 35 to 50 years | 15 (5.0%) | 7.0 |
| Total | 303 (100.0%) | 64.0 |
Fertility by Age by Marriage Status in Ray County
67.3% of women with births (303) in Ray County are married. The highest percentage of unmarried women with births falls into 15 to 19 years age bracket with 100.0% of them unmarried at the time of birth, while the lowest percentage of unmarried women with births belong to 20 to 34 years age bracket with 31.9% of them unmarried.
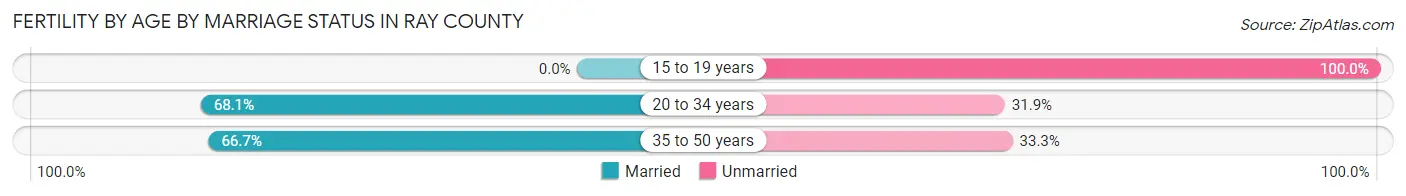
| Age Bracket | Married | Unmarried |
| 15 to 19 years | 0 (0.0%) | 3 (100.0%) |
| 20 to 34 years | 194 (68.1%) | 91 (31.9%) |
| 35 to 50 years | 10 (66.7%) | 5 (33.3%) |
| Total | 204 (67.3%) | 99 (32.7%) |
Fertility by Education in Ray County
Average fertility rate in Ray County is 64.0 births per 1,000 women. Women with the education attainment of bachelor's degree have the highest fertility rate of 127.0 births per 1,000 women, while women with the education attainment of less than high school have the lowest fertility at 24.0 births per 1,000 women. Women with the education attainment of high school diploma represent 33.7% of all women with births.
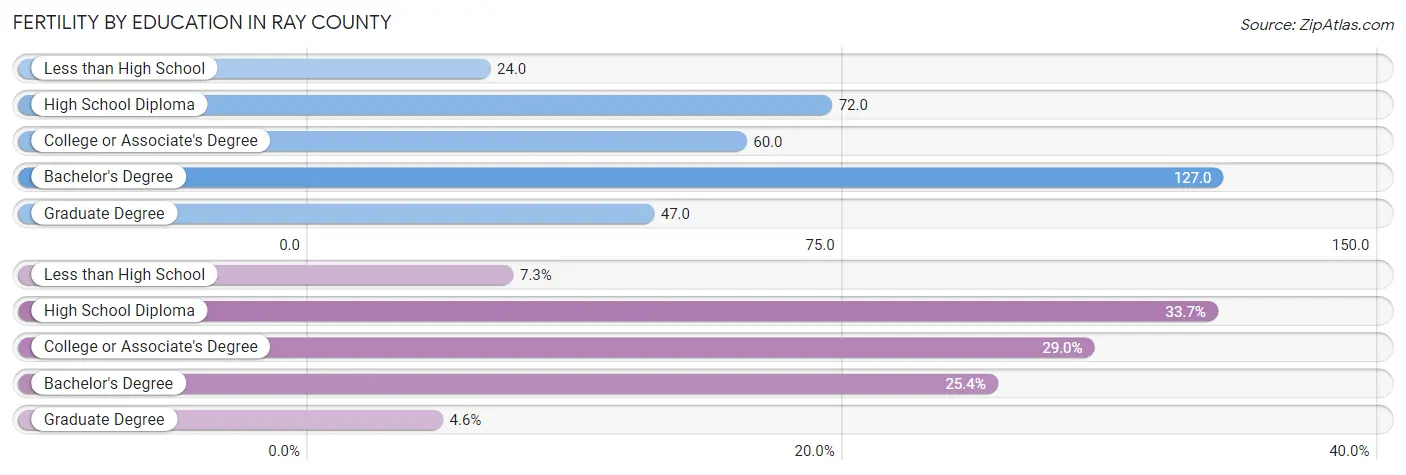
| Educational Attainment | Women with Births | Births / 1,000 Women |
| Less than High School | 22 (7.3%) | 24.0 |
| High School Diploma | 102 (33.7%) | 72.0 |
| College or Associate's Degree | 88 (29.0%) | 60.0 |
| Bachelor's Degree | 77 (25.4%) | 127.0 |
| Graduate Degree | 14 (4.6%) | 47.0 |
| Total | 303 (100.0%) | 64.0 |
Fertility by Education by Marriage Status in Ray County
32.7% of women with births in Ray County are unmarried. Women with the educational attainment of graduate degree are most likely to be married with 100.0% of them married at childbirth, while women with the educational attainment of high school diploma are least likely to be married with 62.7% of them unmarried at childbirth.
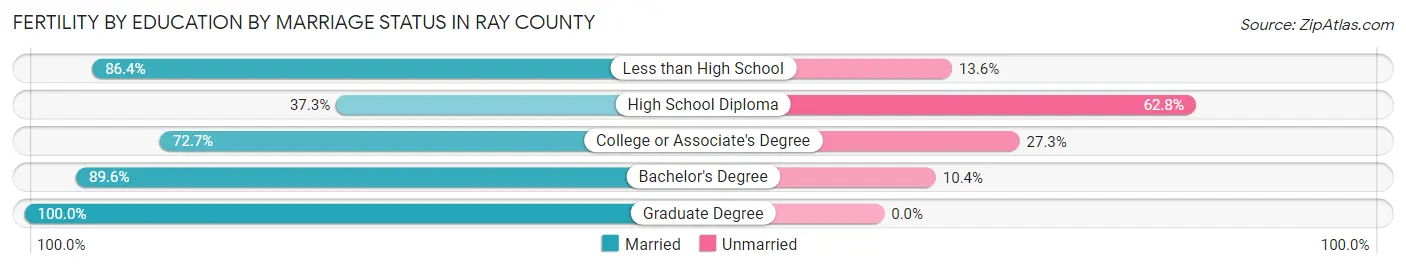
| Educational Attainment | Married | Unmarried |
| Less than High School | 19 (86.4%) | 3 (13.6%) |
| High School Diploma | 38 (37.2%) | 64 (62.7%) |
| College or Associate's Degree | 64 (72.7%) | 24 (27.3%) |
| Bachelor's Degree | 69 (89.6%) | 8 (10.4%) |
| Graduate Degree | 14 (100.0%) | 0 (0.0%) |
| Total | 204 (67.3%) | 99 (32.7%) |
Employment Characteristics in Ray County
Employment by Class of Employer in Ray County
Among the 10,894 employed individuals in Ray County, private company employees (7,417 | 68.1%), not-for-profit organizations (970 | 8.9%), and self-employed (not incorporated) (779 | 7.1%) make up the most common classes of employment.
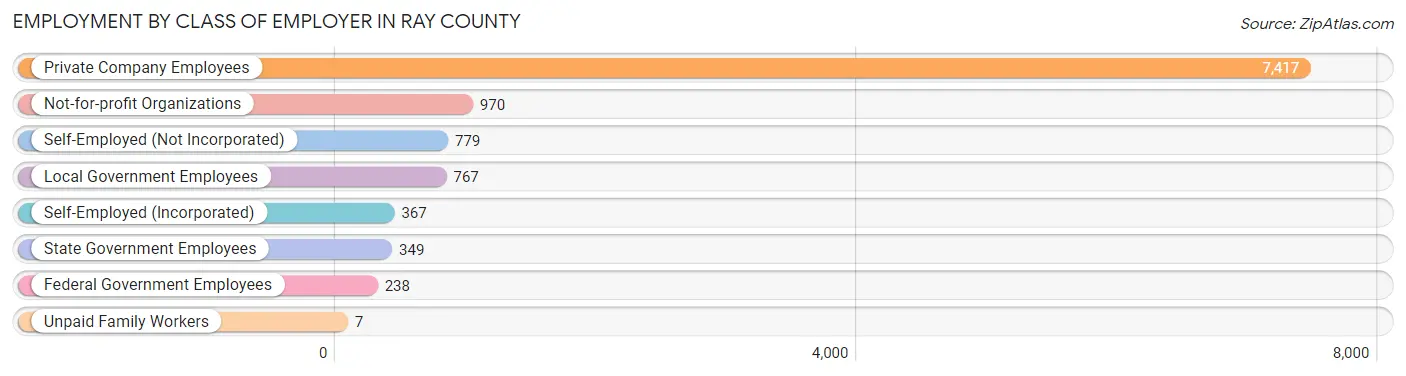
| Employer Class | # Employees | % Employees |
| Private Company Employees | 7,417 | 68.1% |
| Self-Employed (Incorporated) | 367 | 3.4% |
| Self-Employed (Not Incorporated) | 779 | 7.1% |
| Not-for-profit Organizations | 970 | 8.9% |
| Local Government Employees | 767 | 7.0% |
| State Government Employees | 349 | 3.2% |
| Federal Government Employees | 238 | 2.2% |
| Unpaid Family Workers | 7 | 0.1% |
| Total | 10,894 | 100.0% |
Employment Status by Age in Ray County
According to the labor force statistics for Ray County, out of the total population over 16 years of age (18,494), 61.5% or 11,374 individuals are in the labor force, with 3.1% or 353 of them unemployed. The age group with the highest labor force participation rate is 25 to 29 years, with 89.1% or 1,138 individuals in the labor force. Within the labor force, the 16 to 19 years age range has the highest percentage of unemployed individuals, with 6.4% or 30 of them being unemployed.
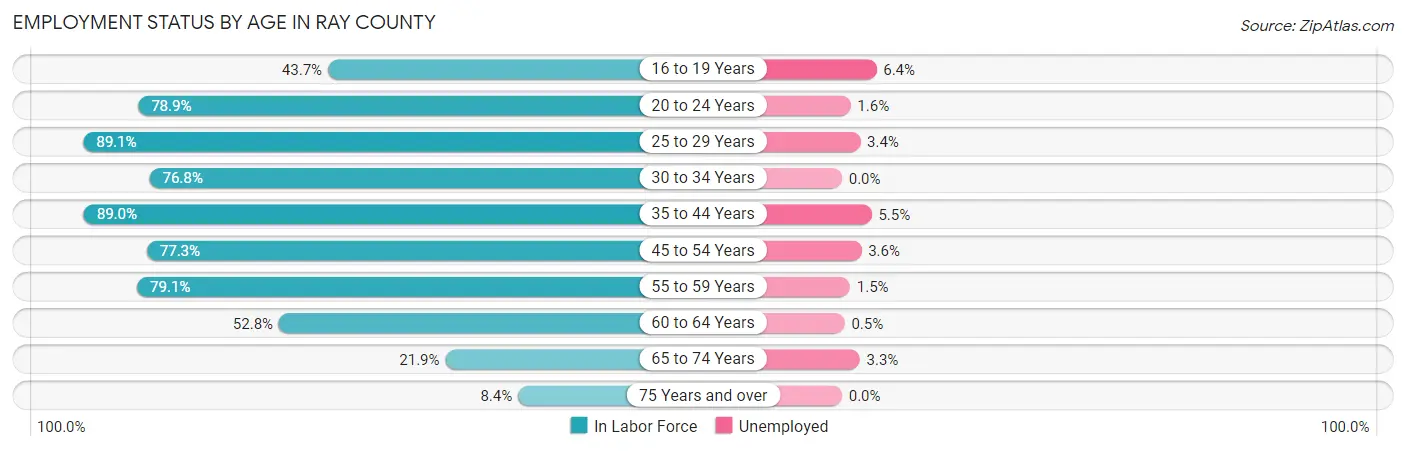
| Age Bracket | In Labor Force | Unemployed |
| 16 to 19 Years | 466 (43.7%) | 30 (6.4%) |
| 20 to 24 Years | 1,052 (78.9%) | 17 (1.6%) |
| 25 to 29 Years | 1,138 (89.1%) | 39 (3.4%) |
| 30 to 34 Years | 978 (76.8%) | 0 (0.0%) |
| 35 to 44 Years | 2,480 (89.0%) | 136 (5.5%) |
| 45 to 54 Years | 2,274 (77.3%) | 82 (3.6%) |
| 55 to 59 Years | 1,281 (79.1%) | 19 (1.5%) |
| 60 to 64 Years | 1,004 (52.8%) | 5 (0.5%) |
| 65 to 74 Years | 549 (21.9%) | 18 (3.3%) |
| 75 Years and over | 150 (8.4%) | 0 (0.0%) |
| Total | 11,374 (61.5%) | 353 (3.1%) |
Employment Status by Educational Attainment in Ray County
According to labor force statistics for Ray County, 77.6% of individuals (9,158) out of the total population between 25 and 64 years of age (11,801) are in the labor force, with 3.1% or 284 of them being unemployed. The group with the highest labor force participation rate are those with the educational attainment of bachelor's degree or higher, with 90.9% or 1,747 individuals in the labor force. Within the labor force, individuals with less than high school education have the highest percentage of unemployment, with 13.9% or 112 of them being unemployed.
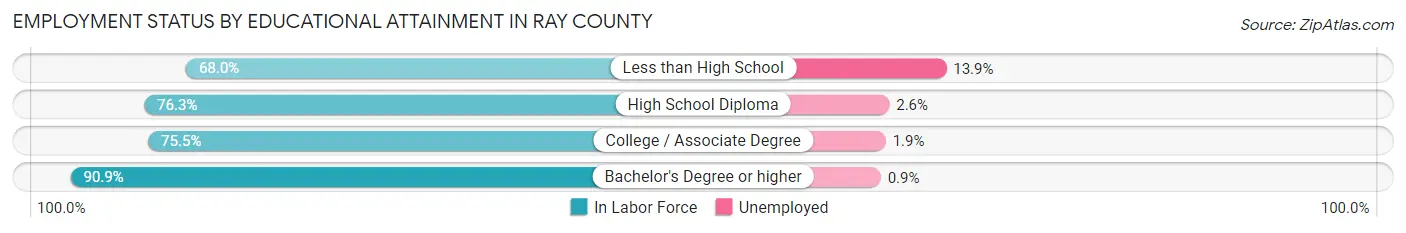
| Educational Attainment | In Labor Force | Unemployed |
| Less than High School | 804 (68.0%) | 164 (13.9%) |
| High School Diploma | 3,931 (76.3%) | 134 (2.6%) |
| College / Associate Degree | 2,676 (75.5%) | 67 (1.9%) |
| Bachelor's Degree or higher | 1,747 (90.9%) | 17 (0.9%) |
| Total | 9,158 (77.6%) | 366 (3.1%) |
Employment Occupations by Sex in Ray County
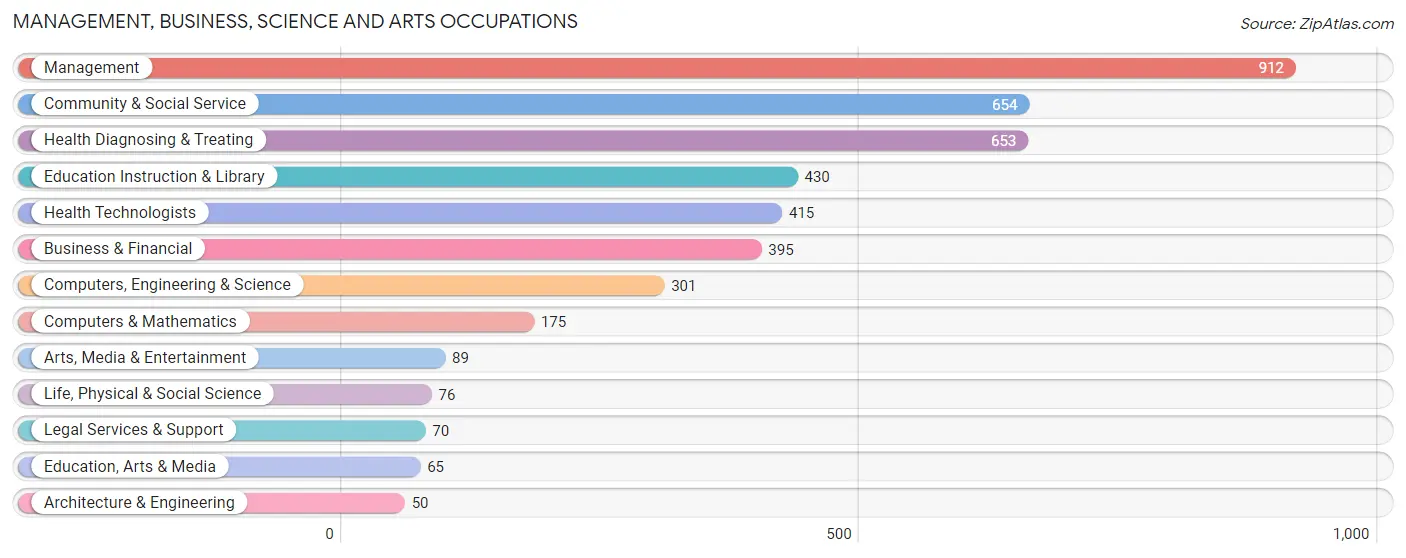
Management, Business, Science and Arts Occupations
The most common Management, Business, Science and Arts occupations in Ray County are Management (912 | 8.3%), Community & Social Service (654 | 5.9%), Health Diagnosing & Treating (653 | 5.9%), Education Instruction & Library (430 | 3.9%), and Health Technologists (415 | 3.8%).
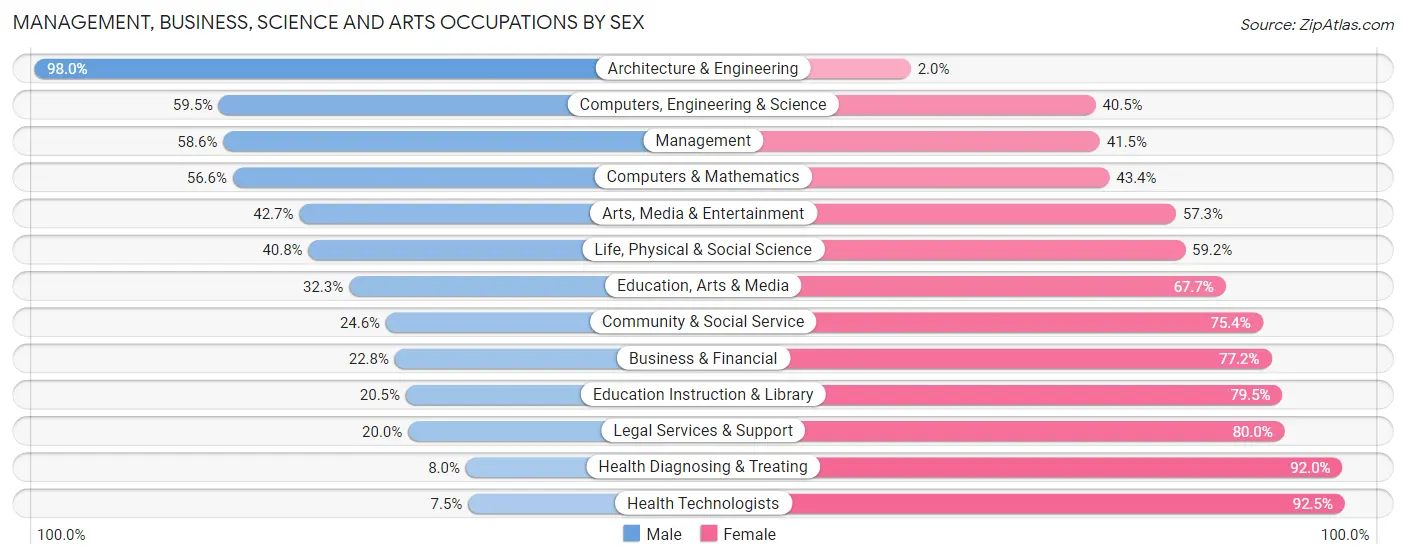
Management, Business, Science and Arts Occupations by Sex
Within the Management, Business, Science and Arts occupations in Ray County, the most male-oriented occupations are Architecture & Engineering (98.0%), Computers, Engineering & Science (59.5%), and Management (58.6%), while the most female-oriented occupations are Health Technologists (92.5%), Health Diagnosing & Treating (92.0%), and Legal Services & Support (80.0%).
| Occupation | Male | Female |
| Management | 534 (58.6%) | 378 (41.4%) |
| Business & Financial | 90 (22.8%) | 305 (77.2%) |
| Computers, Engineering & Science | 179 (59.5%) | 122 (40.5%) |
| Computers & Mathematics | 99 (56.6%) | 76 (43.4%) |
| Architecture & Engineering | 49 (98.0%) | 1 (2.0%) |
| Life, Physical & Social Science | 31 (40.8%) | 45 (59.2%) |
| Community & Social Service | 161 (24.6%) | 493 (75.4%) |
| Education, Arts & Media | 21 (32.3%) | 44 (67.7%) |
| Legal Services & Support | 14 (20.0%) | 56 (80.0%) |
| Education Instruction & Library | 88 (20.5%) | 342 (79.5%) |
| Arts, Media & Entertainment | 38 (42.7%) | 51 (57.3%) |
| Health Diagnosing & Treating | 52 (8.0%) | 601 (92.0%) |
| Health Technologists | 31 (7.5%) | 384 (92.5%) |
| Total (Category) | 1,016 (34.8%) | 1,899 (65.1%) |
| Total (Overall) | 5,907 (53.6%) | 5,119 (46.4%) |
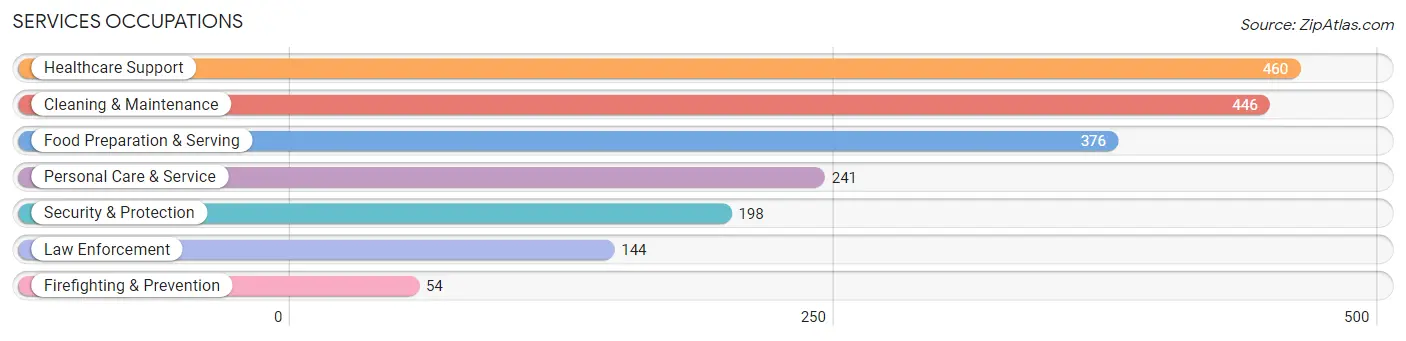
Services Occupations
The most common Services occupations in Ray County are Healthcare Support (460 | 4.2%), Cleaning & Maintenance (446 | 4.0%), Food Preparation & Serving (376 | 3.4%), Personal Care & Service (241 | 2.2%), and Security & Protection (198 | 1.8%).
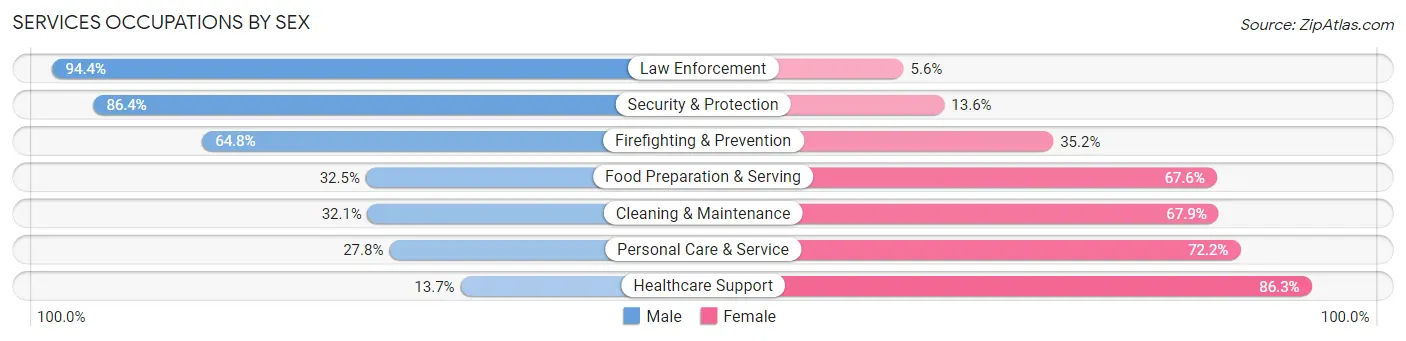
Services Occupations by Sex
Within the Services occupations in Ray County, the most male-oriented occupations are Law Enforcement (94.4%), Security & Protection (86.4%), and Firefighting & Prevention (64.8%), while the most female-oriented occupations are Healthcare Support (86.3%), Personal Care & Service (72.2%), and Cleaning & Maintenance (67.9%).
| Occupation | Male | Female |
| Healthcare Support | 63 (13.7%) | 397 (86.3%) |
| Security & Protection | 171 (86.4%) | 27 (13.6%) |
| Firefighting & Prevention | 35 (64.8%) | 19 (35.2%) |
| Law Enforcement | 136 (94.4%) | 8 (5.6%) |
| Food Preparation & Serving | 122 (32.5%) | 254 (67.5%) |
| Cleaning & Maintenance | 143 (32.1%) | 303 (67.9%) |
| Personal Care & Service | 67 (27.8%) | 174 (72.2%) |
| Total (Category) | 566 (32.9%) | 1,155 (67.1%) |
| Total (Overall) | 5,907 (53.6%) | 5,119 (46.4%) |
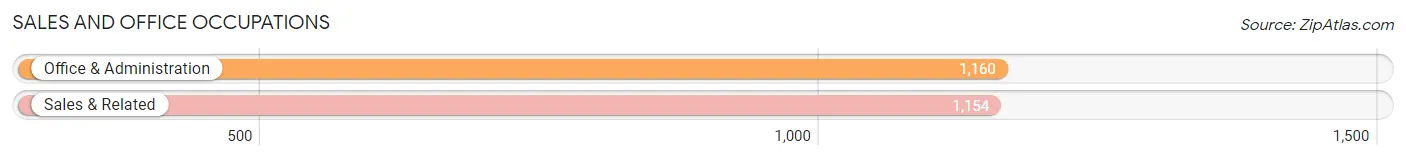
Sales and Office Occupations
The most common Sales and Office occupations in Ray County are Office & Administration (1,160 | 10.5%), and Sales & Related (1,154 | 10.5%).
Sales and Office Occupations by Sex
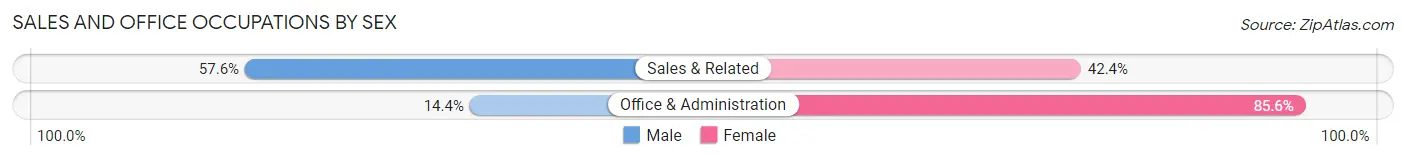
| Occupation | Male | Female |
| Sales & Related | 665 (57.6%) | 489 (42.4%) |
| Office & Administration | 167 (14.4%) | 993 (85.6%) |
| Total (Category) | 832 (36.0%) | 1,482 (64.0%) |
| Total (Overall) | 5,907 (53.6%) | 5,119 (46.4%) |
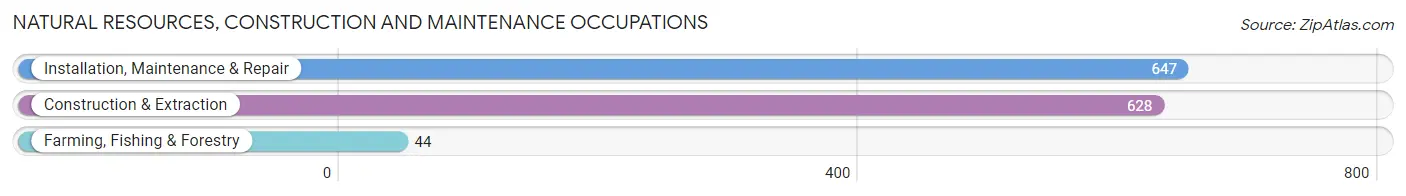
Natural Resources, Construction and Maintenance Occupations
The most common Natural Resources, Construction and Maintenance occupations in Ray County are Installation, Maintenance & Repair (647 | 5.9%), Construction & Extraction (628 | 5.7%), and Farming, Fishing & Forestry (44 | 0.4%).
Natural Resources, Construction and Maintenance Occupations by Sex
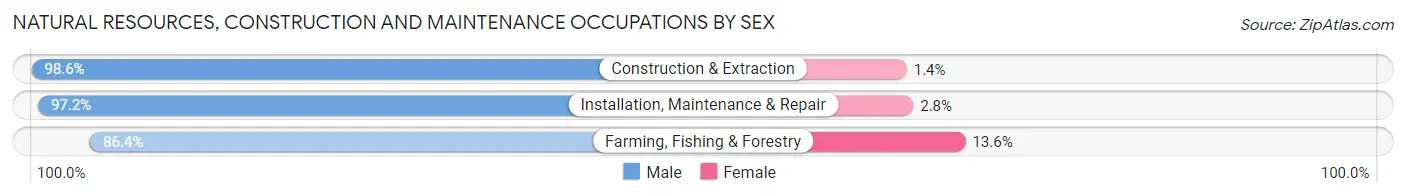
| Occupation | Male | Female |
| Farming, Fishing & Forestry | 38 (86.4%) | 6 (13.6%) |
| Construction & Extraction | 619 (98.6%) | 9 (1.4%) |
| Installation, Maintenance & Repair | 629 (97.2%) | 18 (2.8%) |
| Total (Category) | 1,286 (97.5%) | 33 (2.5%) |
| Total (Overall) | 5,907 (53.6%) | 5,119 (46.4%) |
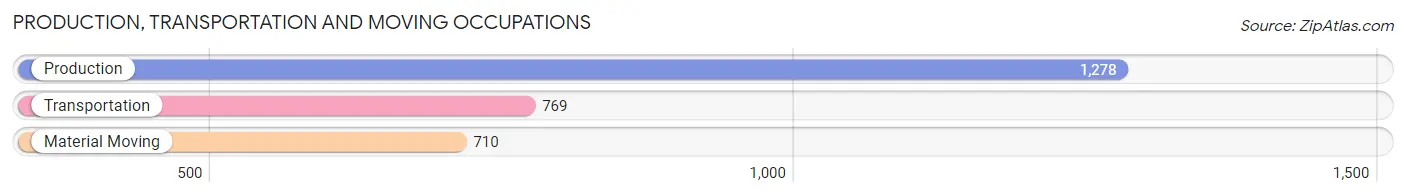
Production, Transportation and Moving Occupations
The most common Production, Transportation and Moving occupations in Ray County are Production (1,278 | 11.6%), Transportation (769 | 7.0%), and Material Moving (710 | 6.4%).
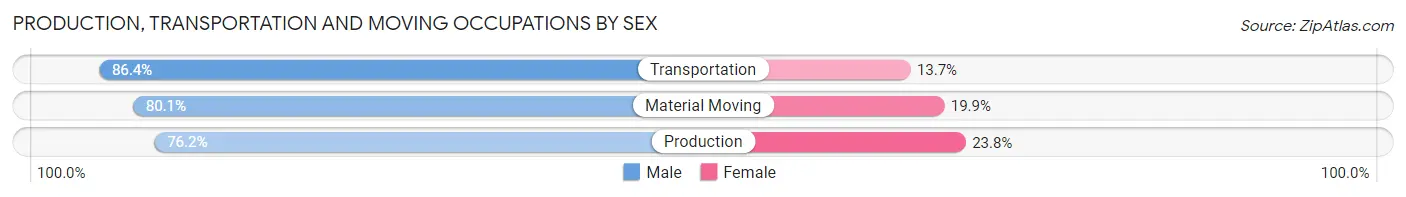
Production, Transportation and Moving Occupations by Sex
| Occupation | Male | Female |
| Production | 974 (76.2%) | 304 (23.8%) |
| Transportation | 664 (86.4%) | 105 (13.7%) |
| Material Moving | 569 (80.1%) | 141 (19.9%) |
| Total (Category) | 2,207 (80.0%) | 550 (20.0%) |
| Total (Overall) | 5,907 (53.6%) | 5,119 (46.4%) |
Employment Industries by Sex in Ray County
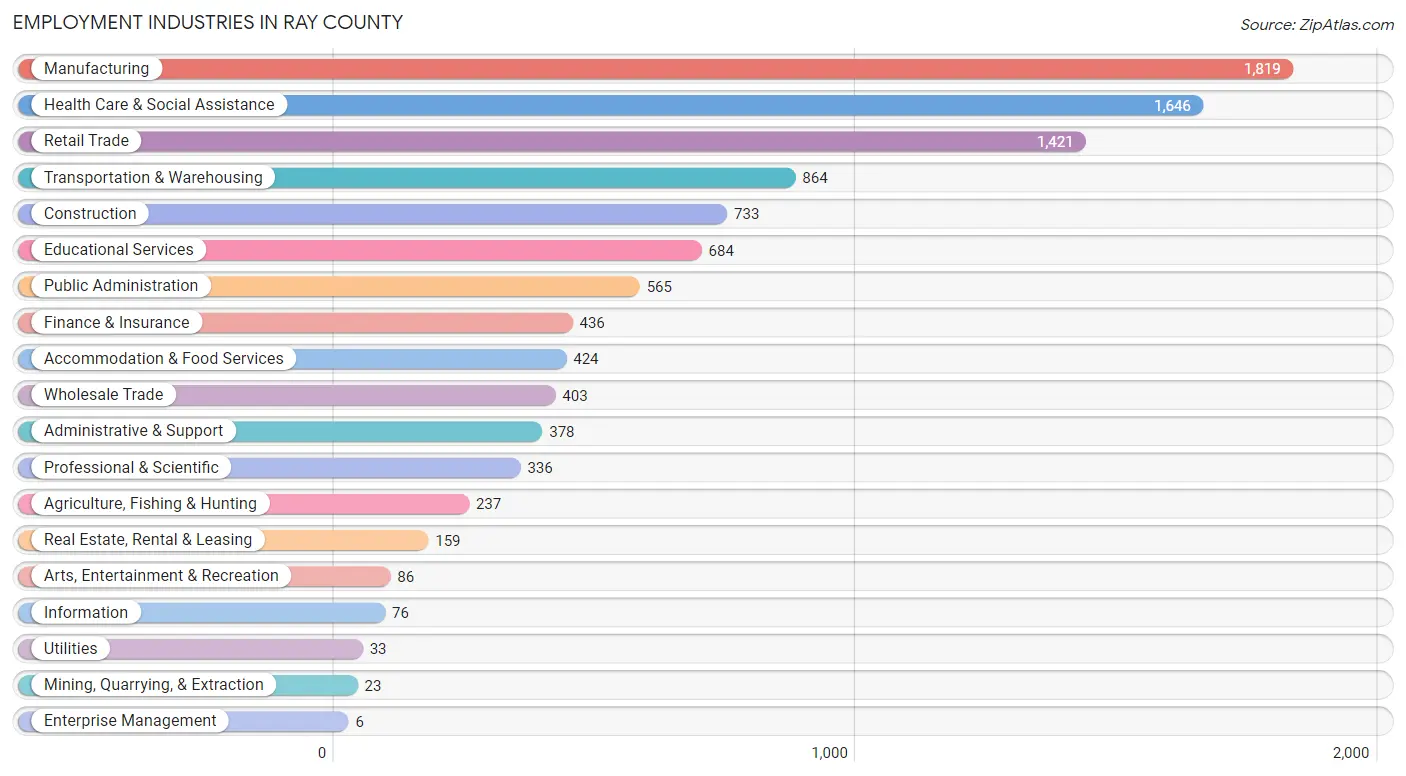
Employment Industries in Ray County
The major employment industries in Ray County include Manufacturing (1,819 | 16.5%), Health Care & Social Assistance (1,646 | 14.9%), Retail Trade (1,421 | 12.9%), Transportation & Warehousing (864 | 7.8%), and Construction (733 | 6.7%).
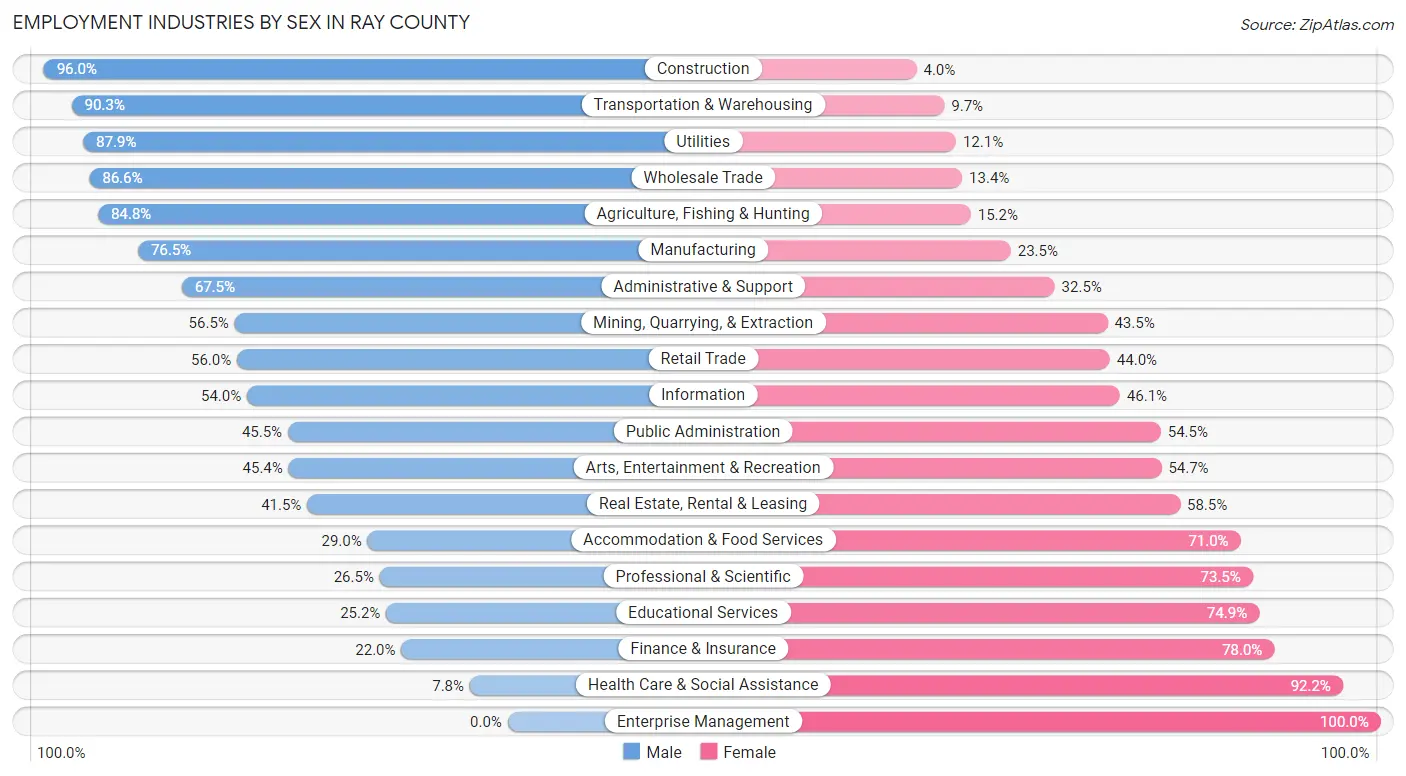
Employment Industries by Sex in Ray County
The Ray County industries that see more men than women are Construction (96.0%), Transportation & Warehousing (90.3%), and Utilities (87.9%), whereas the industries that tend to have a higher number of women are Enterprise Management (100.0%), Health Care & Social Assistance (92.2%), and Finance & Insurance (78.0%).
| Industry | Male | Female |
| Agriculture, Fishing & Hunting | 201 (84.8%) | 36 (15.2%) |
| Mining, Quarrying, & Extraction | 13 (56.5%) | 10 (43.5%) |
| Construction | 704 (96.0%) | 29 (4.0%) |
| Manufacturing | 1,392 (76.5%) | 427 (23.5%) |
| Wholesale Trade | 349 (86.6%) | 54 (13.4%) |
| Retail Trade | 796 (56.0%) | 625 (44.0%) |
| Transportation & Warehousing | 780 (90.3%) | 84 (9.7%) |
| Utilities | 29 (87.9%) | 4 (12.1%) |
| Information | 41 (53.9%) | 35 (46.1%) |
| Finance & Insurance | 96 (22.0%) | 340 (78.0%) |
| Real Estate, Rental & Leasing | 66 (41.5%) | 93 (58.5%) |
| Professional & Scientific | 89 (26.5%) | 247 (73.5%) |
| Enterprise Management | 0 (0.0%) | 6 (100.0%) |
| Administrative & Support | 255 (67.5%) | 123 (32.5%) |
| Educational Services | 172 (25.2%) | 512 (74.9%) |
| Health Care & Social Assistance | 129 (7.8%) | 1,517 (92.2%) |
| Arts, Entertainment & Recreation | 39 (45.4%) | 47 (54.6%) |
| Accommodation & Food Services | 123 (29.0%) | 301 (71.0%) |
| Public Administration | 257 (45.5%) | 308 (54.5%) |
| Total | 5,907 (53.6%) | 5,119 (46.4%) |
Education in Ray County
School Enrollment in Ray County
The most common levels of schooling among the 4,946 students in Ray County are high school (1,367 | 27.6%), middle school (1,198 | 24.2%), and elementary school (1,044 | 21.1%).
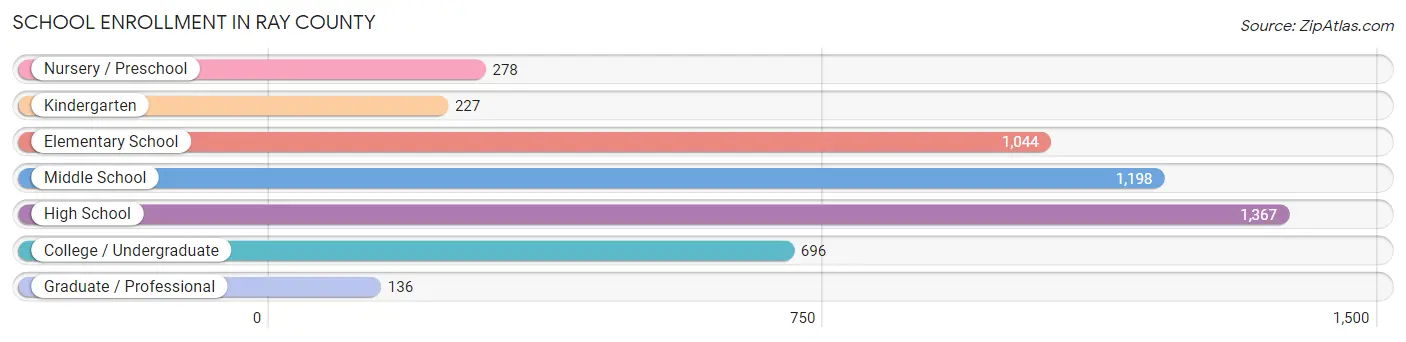
| School Level | # Students | % Students |
| Nursery / Preschool | 278 | 5.6% |
| Kindergarten | 227 | 4.6% |
| Elementary School | 1,044 | 21.1% |
| Middle School | 1,198 | 24.2% |
| High School | 1,367 | 27.6% |
| College / Undergraduate | 696 | 14.1% |
| Graduate / Professional | 136 | 2.8% |
| Total | 4,946 | 100.0% |
School Enrollment by Age by Funding Source in Ray County
Out of a total of 4,946 students who are enrolled in schools in Ray County, 618 (12.5%) attend a private institution, while the remaining 4,328 (87.5%) are enrolled in public schools. The age group of 35 years and over has the highest likelihood of being enrolled in private schools, with 78 (28.7% in the age bracket) enrolled. Conversely, the age group of 20 to 24 year olds has the lowest likelihood of being enrolled in a private school, with 384 (100.0% in the age bracket) attending a public institution.
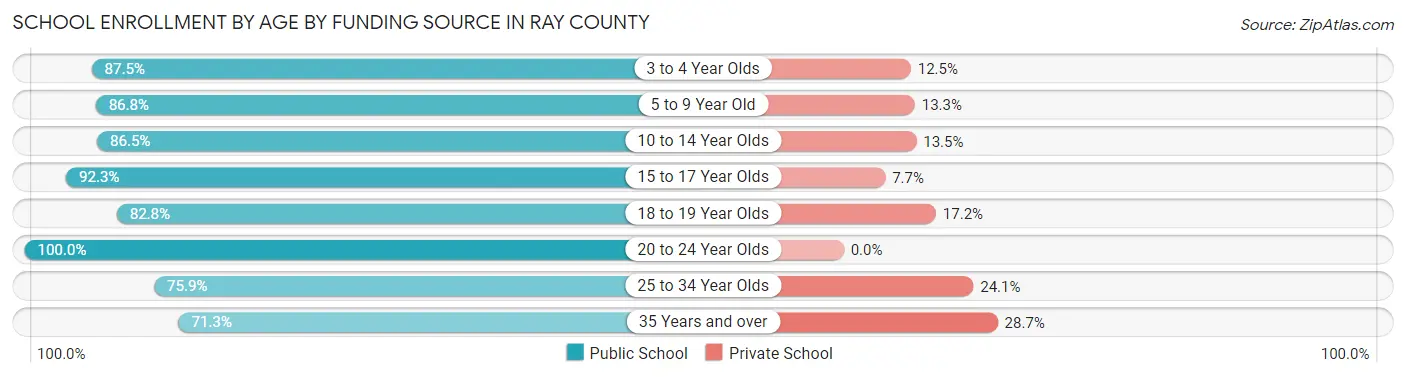
| Age Bracket | Public School | Private School |
| 3 to 4 Year Olds | 147 (87.5%) | 21 (12.5%) |
| 5 to 9 Year Old | 1,028 (86.8%) | 157 (13.3%) |
| 10 to 14 Year Olds | 1,445 (86.5%) | 226 (13.5%) |
| 15 to 17 Year Olds | 846 (92.3%) | 71 (7.7%) |
| 18 to 19 Year Olds | 217 (82.8%) | 45 (17.2%) |
| 20 to 24 Year Olds | 384 (100.0%) | 0 (0.0%) |
| 25 to 34 Year Olds | 66 (75.9%) | 21 (24.1%) |
| 35 Years and over | 194 (71.3%) | 78 (28.7%) |
| Total | 4,328 (87.5%) | 618 (12.5%) |
Educational Attainment by Field of Study in Ray County
Business (625 | 23.9%), education (615 | 23.5%), science & technology (415 | 15.9%), arts & humanities (177 | 6.8%), and bio, nature & agricultural (133 | 5.1%) are the most common fields of study among 2,614 individuals in Ray County who have obtained a bachelor's degree or higher.
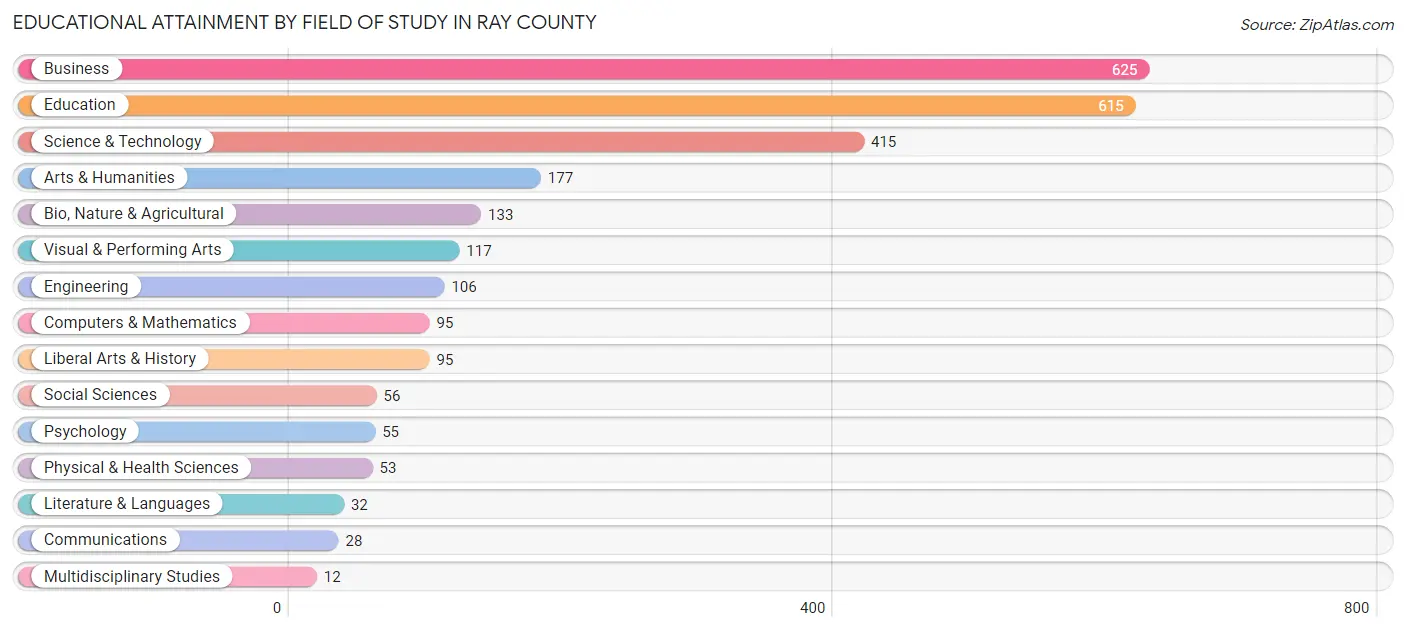
| Field of Study | # Graduates | % Graduates |
| Computers & Mathematics | 95 | 3.6% |
| Bio, Nature & Agricultural | 133 | 5.1% |
| Physical & Health Sciences | 53 | 2.0% |
| Psychology | 55 | 2.1% |
| Social Sciences | 56 | 2.1% |
| Engineering | 106 | 4.1% |
| Multidisciplinary Studies | 12 | 0.5% |
| Science & Technology | 415 | 15.9% |
| Business | 625 | 23.9% |
| Education | 615 | 23.5% |
| Literature & Languages | 32 | 1.2% |
| Liberal Arts & History | 95 | 3.6% |
| Visual & Performing Arts | 117 | 4.5% |
| Communications | 28 | 1.1% |
| Arts & Humanities | 177 | 6.8% |
| Total | 2,614 | 100.0% |
Transportation & Commute in Ray County
Vehicle Availability by Sex in Ray County
The most prevalent vehicle ownership categories in Ray County are males with 2 vehicles (2,087, accounting for 35.7%) and females with 2 vehicles (1,682, making up 41.4%).
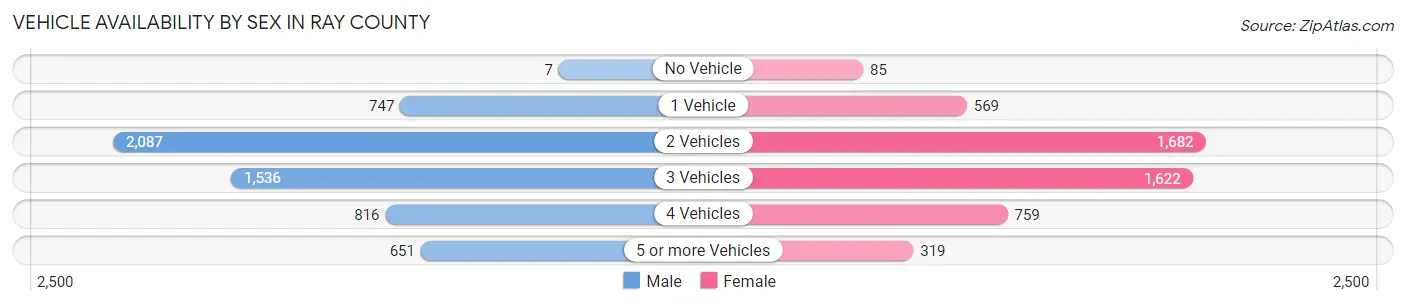
| Vehicles Available | Male | Female |
| No Vehicle | 7 (0.1%) | 85 (1.7%) |
| 1 Vehicle | 747 (12.8%) | 569 (11.3%) |
| 2 Vehicles | 2,087 (35.7%) | 1,682 (33.4%) |
| 3 Vehicles | 1,536 (26.3%) | 1,622 (32.2%) |
| 4 Vehicles | 816 (14.0%) | 759 (15.1%) |
| 5 or more Vehicles | 651 (11.1%) | 319 (6.3%) |
| Total | 5,844 (100.0%) | 5,036 (100.0%) |
Commute Time in Ray County
The most frequently occuring commute durations in Ray County are 45 to 59 minutes (1,635 commuters, 16.3%), 10 to 14 minutes (1,438 commuters, 14.4%), and 15 to 19 minutes (1,238 commuters, 12.4%).
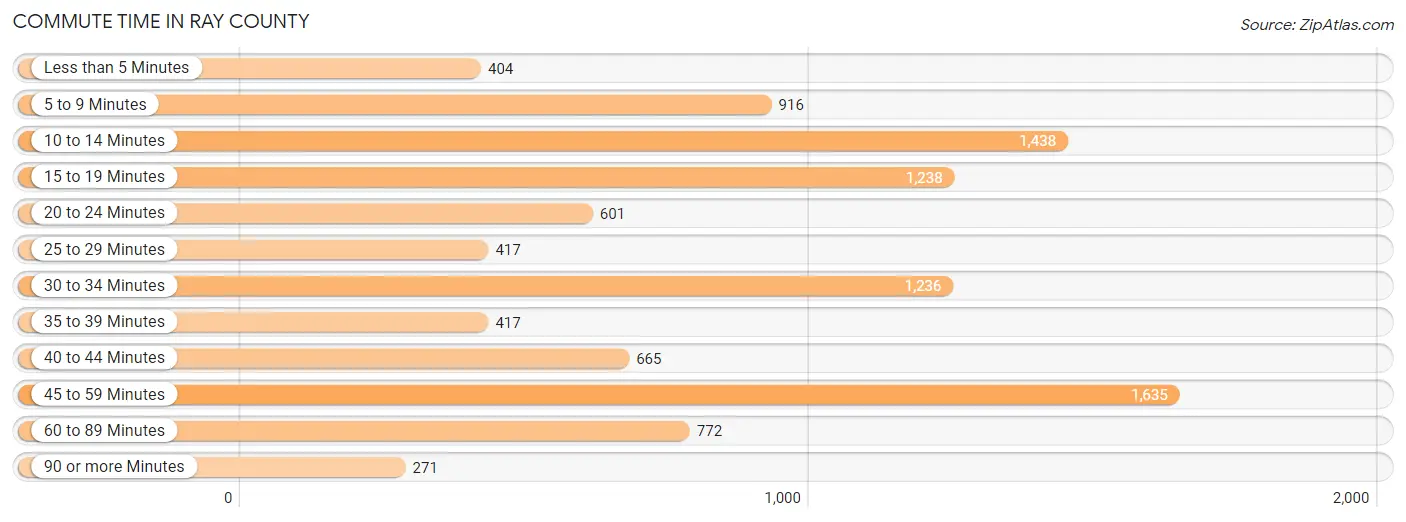
| Commute Time | # Commuters | % Commuters |
| Less than 5 Minutes | 404 | 4.0% |
| 5 to 9 Minutes | 916 | 9.1% |
| 10 to 14 Minutes | 1,438 | 14.4% |
| 15 to 19 Minutes | 1,238 | 12.4% |
| 20 to 24 Minutes | 601 | 6.0% |
| 25 to 29 Minutes | 417 | 4.2% |
| 30 to 34 Minutes | 1,236 | 12.3% |
| 35 to 39 Minutes | 417 | 4.2% |
| 40 to 44 Minutes | 665 | 6.6% |
| 45 to 59 Minutes | 1,635 | 16.3% |
| 60 to 89 Minutes | 772 | 7.7% |
| 90 or more Minutes | 271 | 2.7% |
Commute Time by Sex in Ray County
The most common commute times in Ray County are 45 to 59 minutes (993 commuters, 18.6%) for males and 10 to 14 minutes (733 commuters, 15.7%) for females.
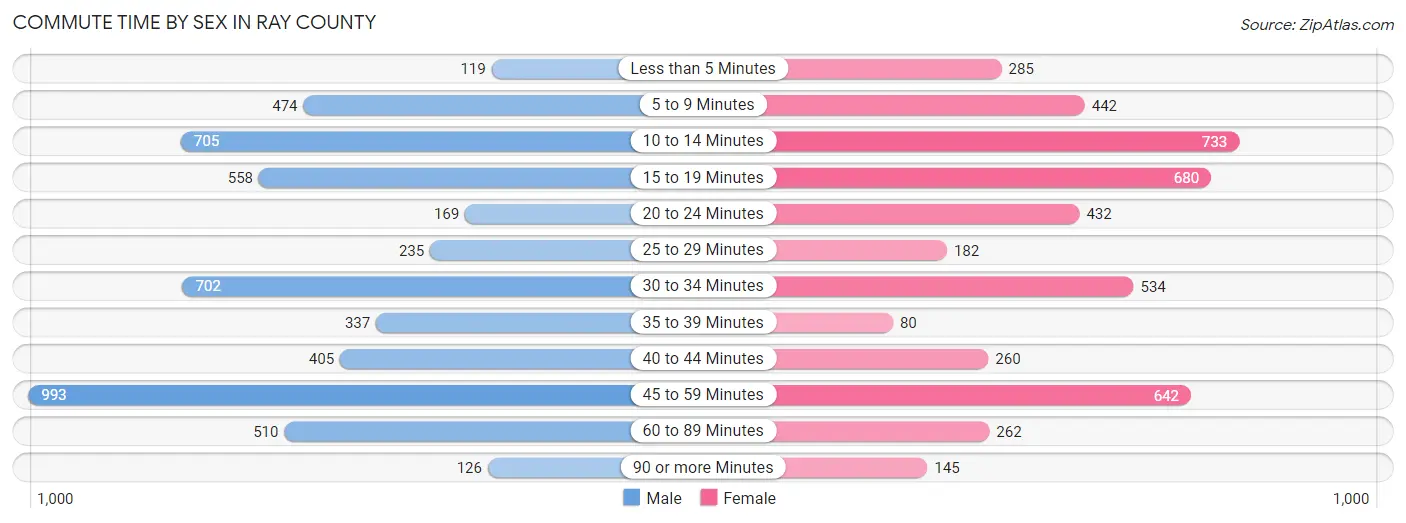
| Commute Time | Male | Female |
| Less than 5 Minutes | 119 (2.2%) | 285 (6.1%) |
| 5 to 9 Minutes | 474 (8.9%) | 442 (9.5%) |
| 10 to 14 Minutes | 705 (13.2%) | 733 (15.7%) |
| 15 to 19 Minutes | 558 (10.5%) | 680 (14.5%) |
| 20 to 24 Minutes | 169 (3.2%) | 432 (9.2%) |
| 25 to 29 Minutes | 235 (4.4%) | 182 (3.9%) |
| 30 to 34 Minutes | 702 (13.2%) | 534 (11.4%) |
| 35 to 39 Minutes | 337 (6.3%) | 80 (1.7%) |
| 40 to 44 Minutes | 405 (7.6%) | 260 (5.6%) |
| 45 to 59 Minutes | 993 (18.6%) | 642 (13.7%) |
| 60 to 89 Minutes | 510 (9.6%) | 262 (5.6%) |
| 90 or more Minutes | 126 (2.4%) | 145 (3.1%) |
Time of Departure to Work by Sex in Ray County
The most frequent times of departure to work in Ray County are 7:00 AM to 7:29 AM (854, 16.0%) for males and 7:30 AM to 7:59 AM (783, 16.7%) for females.
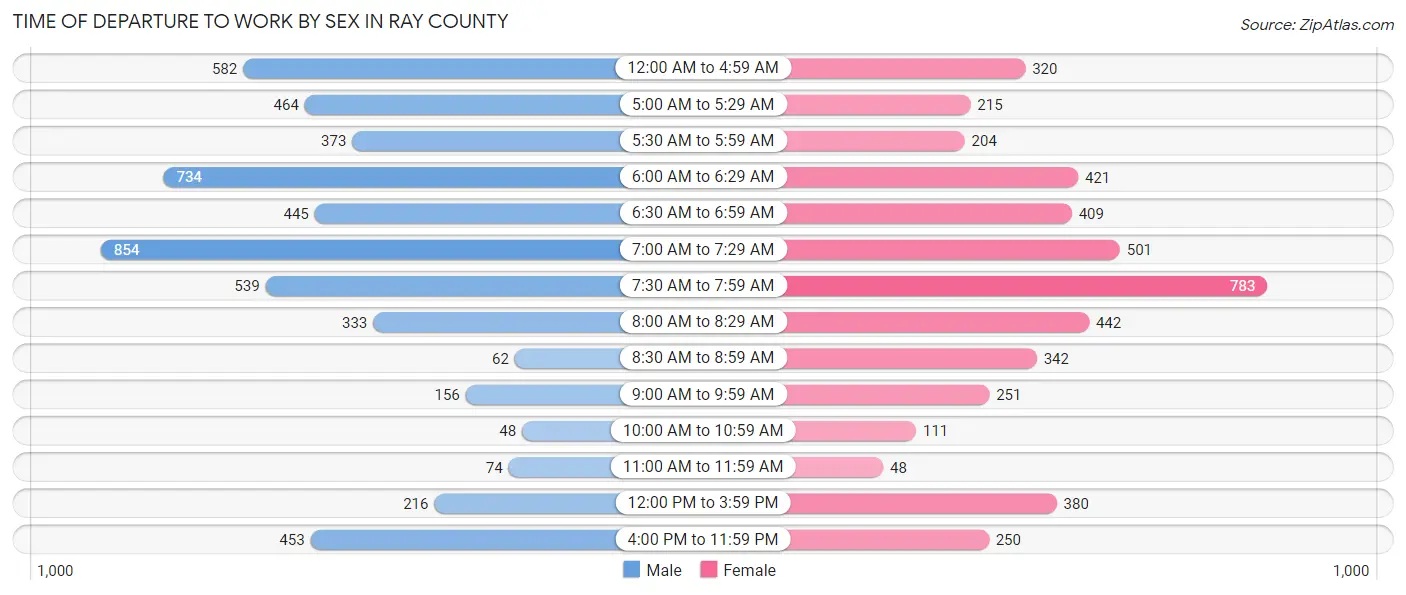
| Time of Departure | Male | Female |
| 12:00 AM to 4:59 AM | 582 (10.9%) | 320 (6.8%) |
| 5:00 AM to 5:29 AM | 464 (8.7%) | 215 (4.6%) |
| 5:30 AM to 5:59 AM | 373 (7.0%) | 204 (4.4%) |
| 6:00 AM to 6:29 AM | 734 (13.8%) | 421 (9.0%) |
| 6:30 AM to 6:59 AM | 445 (8.3%) | 409 (8.7%) |
| 7:00 AM to 7:29 AM | 854 (16.0%) | 501 (10.7%) |
| 7:30 AM to 7:59 AM | 539 (10.1%) | 783 (16.7%) |
| 8:00 AM to 8:29 AM | 333 (6.2%) | 442 (9.5%) |
| 8:30 AM to 8:59 AM | 62 (1.2%) | 342 (7.3%) |
| 9:00 AM to 9:59 AM | 156 (2.9%) | 251 (5.4%) |
| 10:00 AM to 10:59 AM | 48 (0.9%) | 111 (2.4%) |
| 11:00 AM to 11:59 AM | 74 (1.4%) | 48 (1.0%) |
| 12:00 PM to 3:59 PM | 216 (4.1%) | 380 (8.1%) |
| 4:00 PM to 11:59 PM | 453 (8.5%) | 250 (5.3%) |
| Total | 5,333 (100.0%) | 4,677 (100.0%) |
Housing Occupancy in Ray County
Occupancy by Ownership in Ray County
Of the total 8,773 dwellings in Ray County, owner-occupied units account for 6,889 (78.5%), while renter-occupied units make up 1,884 (21.5%).
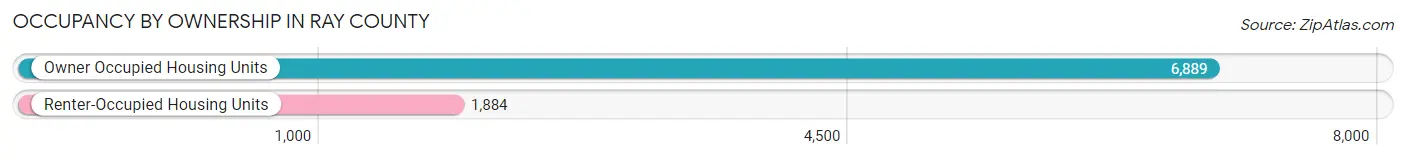
| Occupancy | # Housing Units | % Housing Units |
| Owner Occupied Housing Units | 6,889 | 78.5% |
| Renter-Occupied Housing Units | 1,884 | 21.5% |
| Total Occupied Housing Units | 8,773 | 100.0% |
Occupancy by Household Size in Ray County
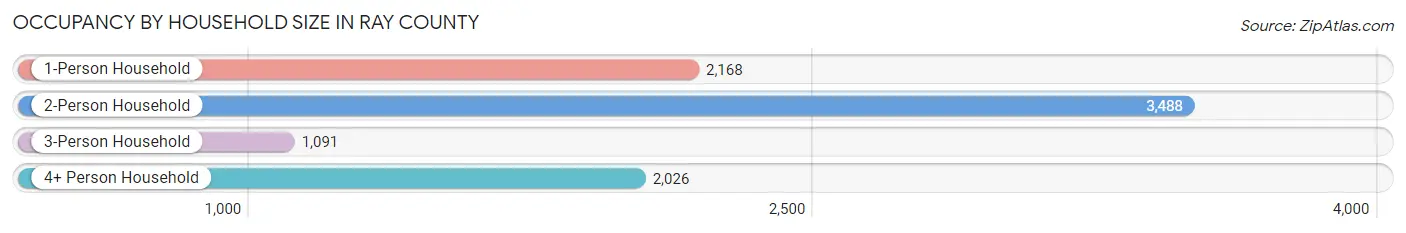
| Household Size | # Housing Units | % Housing Units |
| 1-Person Household | 2,168 | 24.7% |
| 2-Person Household | 3,488 | 39.8% |
| 3-Person Household | 1,091 | 12.4% |
| 4+ Person Household | 2,026 | 23.1% |
| Total Housing Units | 8,773 | 100.0% |
Occupancy by Ownership by Household Size in Ray County
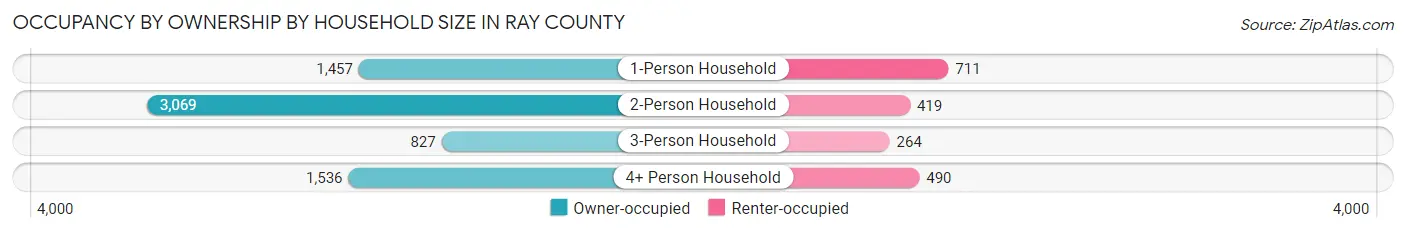
| Household Size | Owner-occupied | Renter-occupied |
| 1-Person Household | 1,457 (67.2%) | 711 (32.8%) |
| 2-Person Household | 3,069 (88.0%) | 419 (12.0%) |
| 3-Person Household | 827 (75.8%) | 264 (24.2%) |
| 4+ Person Household | 1,536 (75.8%) | 490 (24.2%) |
| Total Housing Units | 6,889 (78.5%) | 1,884 (21.5%) |
Occupancy by Educational Attainment in Ray County
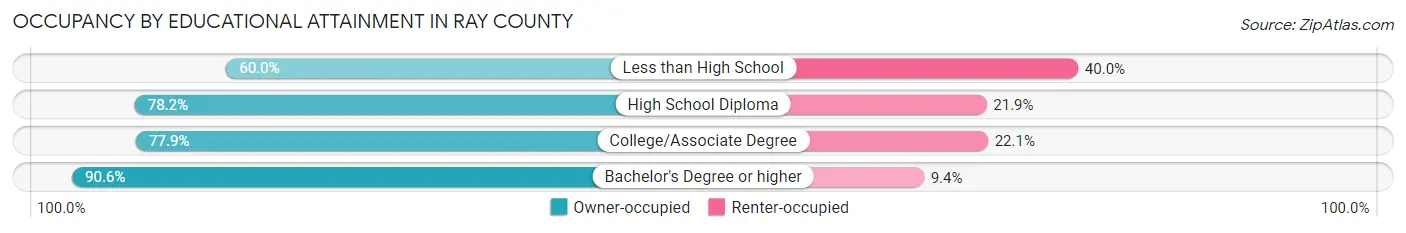
| Household Size | Owner-occupied | Renter-occupied |
| Less than High School | 432 (60.0%) | 288 (40.0%) |
| High School Diploma | 3,051 (78.1%) | 853 (21.8%) |
| College/Associate Degree | 2,158 (77.9%) | 613 (22.1%) |
| Bachelor's Degree or higher | 1,248 (90.6%) | 130 (9.4%) |
Occupancy by Age of Householder in Ray County
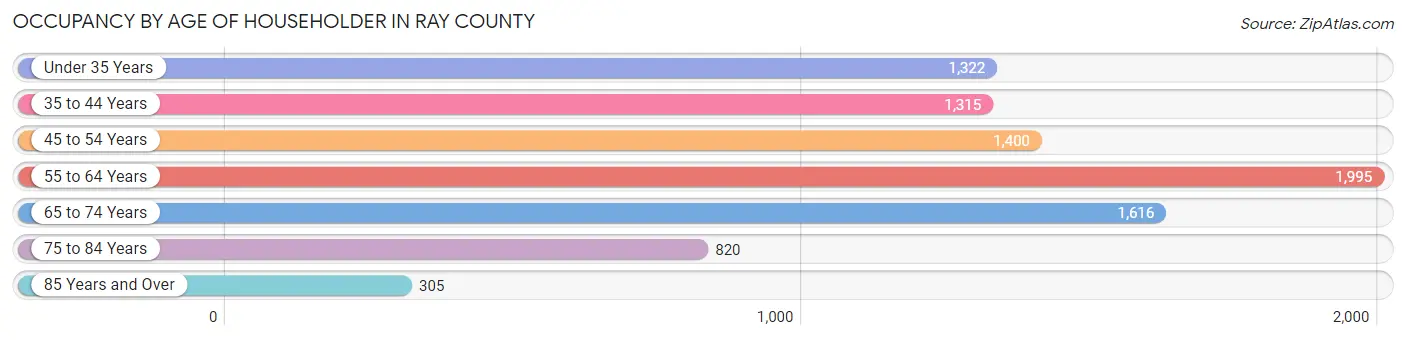
| Age Bracket | # Households | % Households |
| Under 35 Years | 1,322 | 15.1% |
| 35 to 44 Years | 1,315 | 15.0% |
| 45 to 54 Years | 1,400 | 16.0% |
| 55 to 64 Years | 1,995 | 22.7% |
| 65 to 74 Years | 1,616 | 18.4% |
| 75 to 84 Years | 820 | 9.3% |
| 85 Years and Over | 305 | 3.5% |
| Total | 8,773 | 100.0% |
Housing Finances in Ray County
Median Income by Occupancy in Ray County
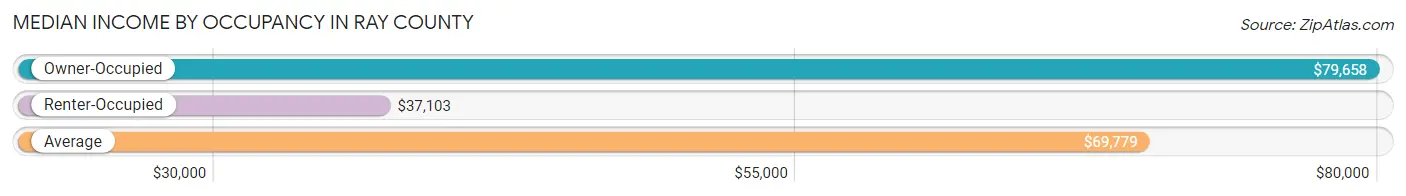
| Occupancy Type | # Households | Median Income |
| Owner-Occupied | 6,889 (78.5%) | $79,658 |
| Renter-Occupied | 1,884 (21.5%) | $37,103 |
| Average | 8,773 (100.0%) | $69,779 |
Occupancy by Householder Income Bracket in Ray County
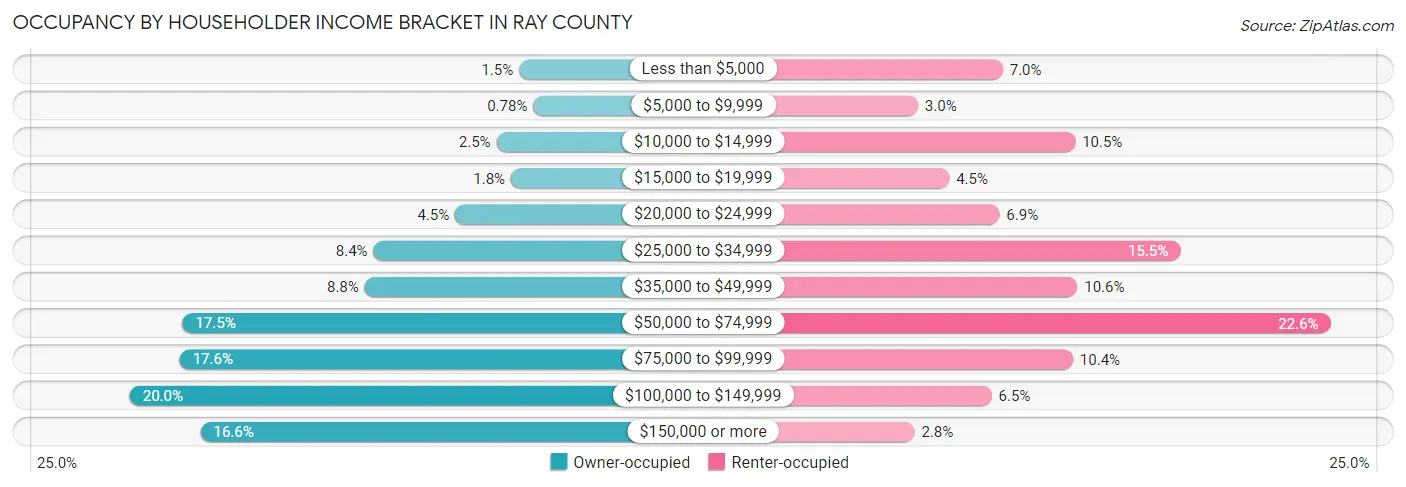
| Income Bracket | Owner-occupied | Renter-occupied |
| Less than $5,000 | 100 (1.5%) | 132 (7.0%) |
| $5,000 to $9,999 | 54 (0.8%) | 56 (3.0%) |
| $10,000 to $14,999 | 174 (2.5%) | 197 (10.5%) |
| $15,000 to $19,999 | 127 (1.8%) | 84 (4.5%) |
| $20,000 to $24,999 | 310 (4.5%) | 129 (6.9%) |
| $25,000 to $34,999 | 578 (8.4%) | 291 (15.4%) |
| $35,000 to $49,999 | 607 (8.8%) | 199 (10.6%) |
| $50,000 to $74,999 | 1,204 (17.5%) | 426 (22.6%) |
| $75,000 to $99,999 | 1,213 (17.6%) | 195 (10.3%) |
| $100,000 to $149,999 | 1,377 (20.0%) | 122 (6.5%) |
| $150,000 or more | 1,145 (16.6%) | 53 (2.8%) |
| Total | 6,889 (100.0%) | 1,884 (100.0%) |
Monthly Housing Cost Tiers in Ray County
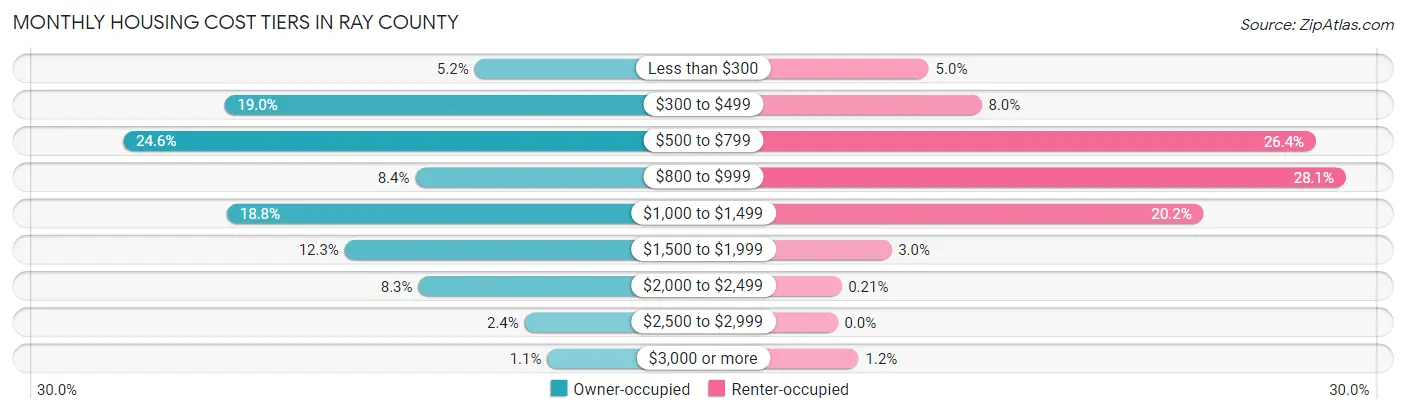
| Monthly Cost | Owner-occupied | Renter-occupied |
| Less than $300 | 355 (5.1%) | 95 (5.0%) |
| $300 to $499 | 1,306 (19.0%) | 150 (8.0%) |
| $500 to $799 | 1,692 (24.6%) | 498 (26.4%) |
| $800 to $999 | 580 (8.4%) | 529 (28.1%) |
| $1,000 to $1,499 | 1,297 (18.8%) | 381 (20.2%) |
| $1,500 to $1,999 | 849 (12.3%) | 56 (3.0%) |
| $2,000 to $2,499 | 568 (8.3%) | 4 (0.2%) |
| $2,500 to $2,999 | 164 (2.4%) | 0 (0.0%) |
| $3,000 or more | 78 (1.1%) | 22 (1.2%) |
| Total | 6,889 (100.0%) | 1,884 (100.0%) |
Physical Housing Characteristics in Ray County
Housing Structures in Ray County
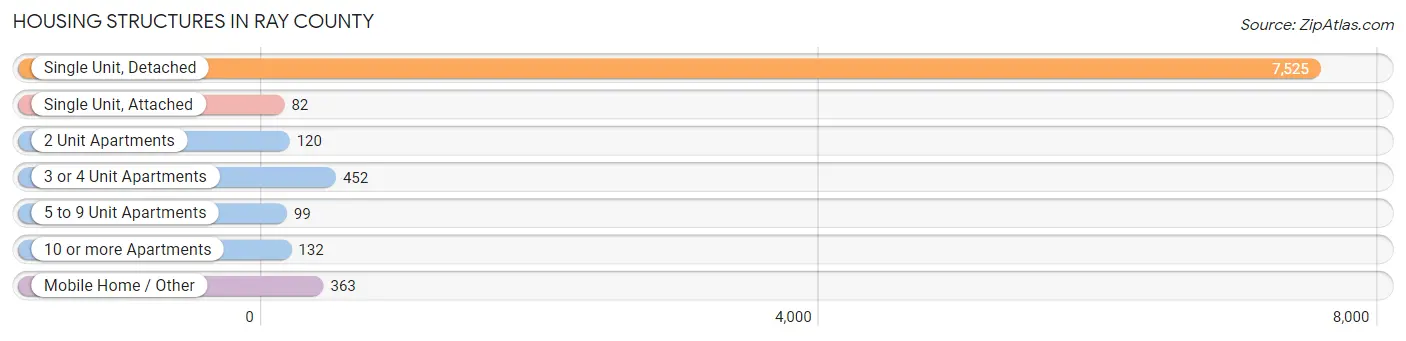
| Structure Type | # Housing Units | % Housing Units |
| Single Unit, Detached | 7,525 | 85.8% |
| Single Unit, Attached | 82 | 0.9% |
| 2 Unit Apartments | 120 | 1.4% |
| 3 or 4 Unit Apartments | 452 | 5.1% |
| 5 to 9 Unit Apartments | 99 | 1.1% |
| 10 or more Apartments | 132 | 1.5% |
| Mobile Home / Other | 363 | 4.1% |
| Total | 8,773 | 100.0% |
Housing Structures by Occupancy in Ray County
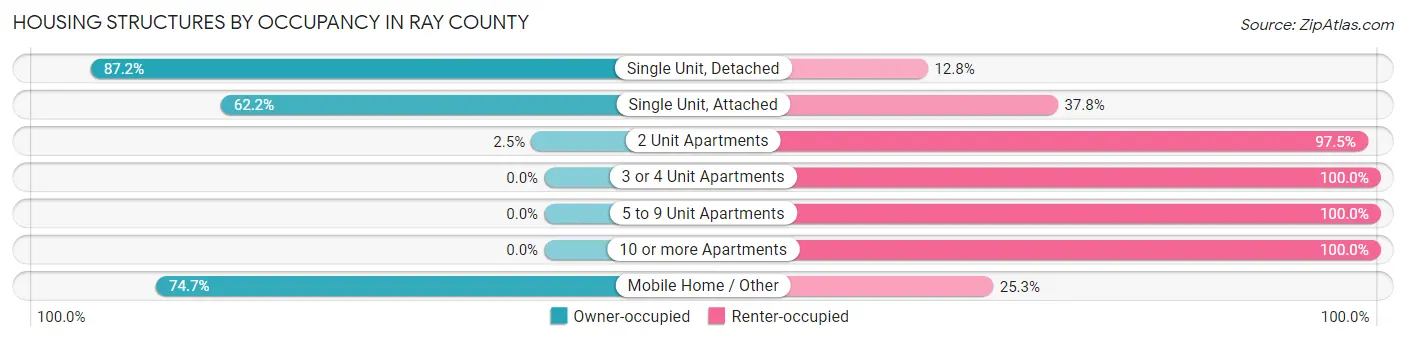
| Structure Type | Owner-occupied | Renter-occupied |
| Single Unit, Detached | 6,564 (87.2%) | 961 (12.8%) |
| Single Unit, Attached | 51 (62.2%) | 31 (37.8%) |
| 2 Unit Apartments | 3 (2.5%) | 117 (97.5%) |
| 3 or 4 Unit Apartments | 0 (0.0%) | 452 (100.0%) |
| 5 to 9 Unit Apartments | 0 (0.0%) | 99 (100.0%) |
| 10 or more Apartments | 0 (0.0%) | 132 (100.0%) |
| Mobile Home / Other | 271 (74.7%) | 92 (25.3%) |
| Total | 6,889 (78.5%) | 1,884 (21.5%) |
Housing Structures by Number of Rooms in Ray County
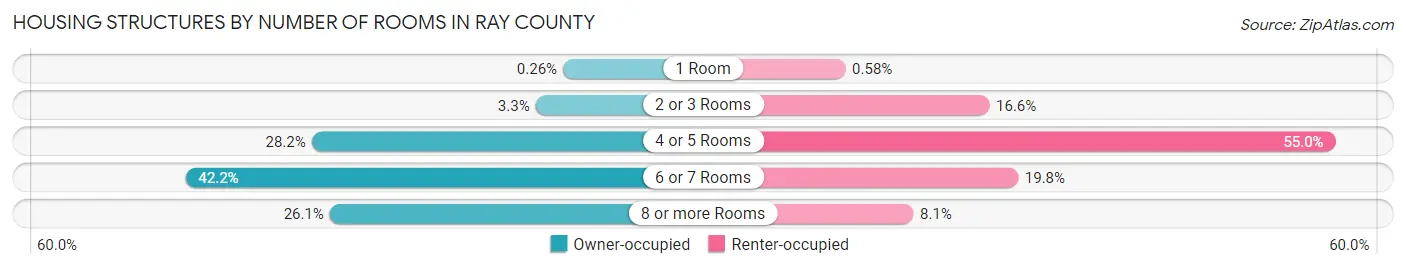
| Number of Rooms | Owner-occupied | Renter-occupied |
| 1 Room | 18 (0.3%) | 11 (0.6%) |
| 2 or 3 Rooms | 227 (3.3%) | 312 (16.6%) |
| 4 or 5 Rooms | 1,939 (28.1%) | 1,036 (55.0%) |
| 6 or 7 Rooms | 2,904 (42.1%) | 372 (19.8%) |
| 8 or more Rooms | 1,801 (26.1%) | 153 (8.1%) |
| Total | 6,889 (100.0%) | 1,884 (100.0%) |
Housing Structure by Heating Type in Ray County
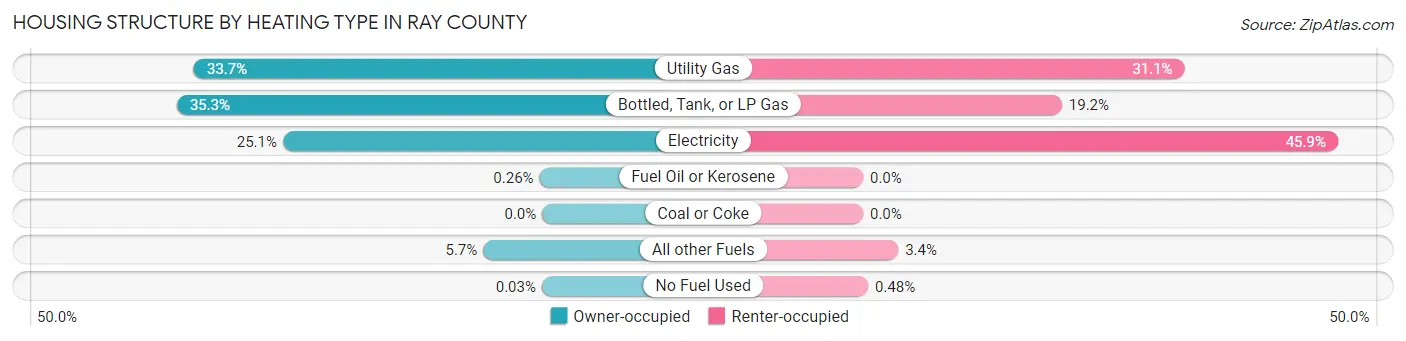
| Heating Type | Owner-occupied | Renter-occupied |
| Utility Gas | 2,318 (33.7%) | 585 (31.0%) |
| Bottled, Tank, or LP Gas | 2,432 (35.3%) | 362 (19.2%) |
| Electricity | 1,726 (25.1%) | 864 (45.9%) |
| Fuel Oil or Kerosene | 18 (0.3%) | 0 (0.0%) |
| Coal or Coke | 0 (0.0%) | 0 (0.0%) |
| All other Fuels | 393 (5.7%) | 64 (3.4%) |
| No Fuel Used | 2 (0.0%) | 9 (0.5%) |
| Total | 6,889 (100.0%) | 1,884 (100.0%) |
Household Vehicle Usage in Ray County
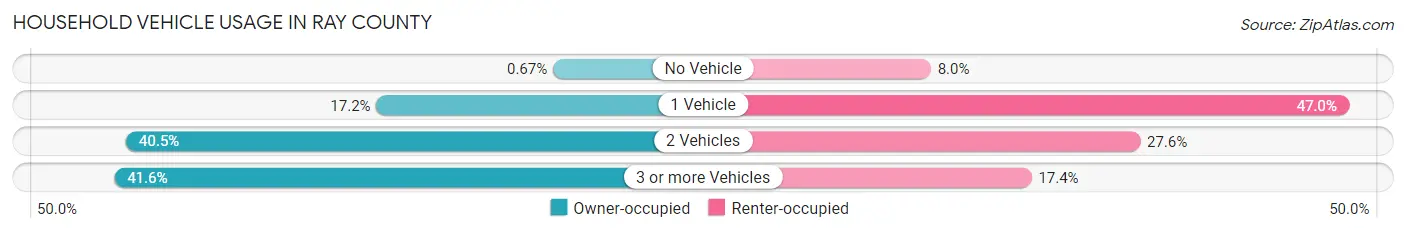
| Vehicles per Household | Owner-occupied | Renter-occupied |
| No Vehicle | 46 (0.7%) | 151 (8.0%) |
| 1 Vehicle | 1,182 (17.2%) | 886 (47.0%) |
| 2 Vehicles | 2,793 (40.5%) | 519 (27.6%) |
| 3 or more Vehicles | 2,868 (41.6%) | 328 (17.4%) |
| Total | 6,889 (100.0%) | 1,884 (100.0%) |
Real Estate & Mortgages in Ray County
Real Estate and Mortgage Overview in Ray County
| Characteristic | Without Mortgage | With Mortgage |
| Housing Units | 2,987 | 3,902 |
| Median Property Value | $141,200 | $198,100 |
| Median Household Income | $57,307 | $876 |
| Monthly Housing Costs | $479 | $61 |
| Real Estate Taxes | $1,320 | $52 |
Property Value by Mortgage Status in Ray County
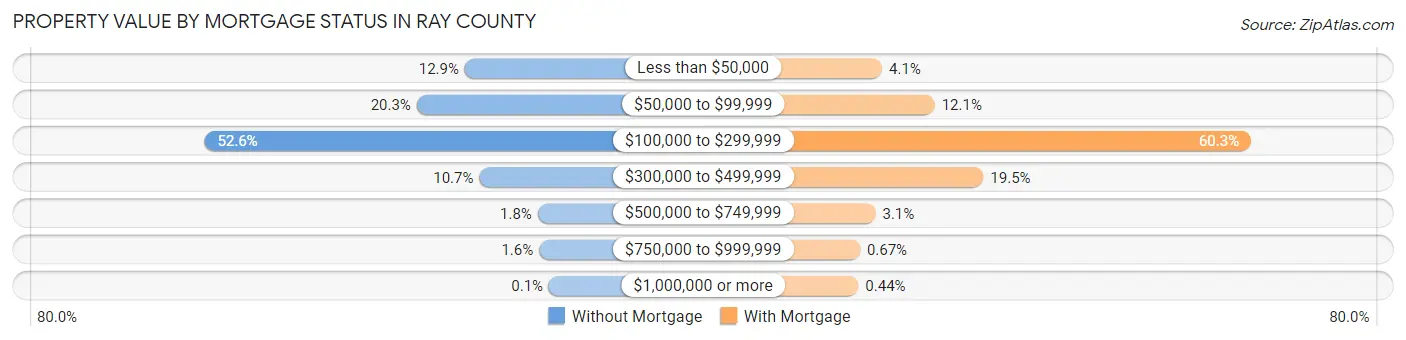
| Property Value | Without Mortgage | With Mortgage |
| Less than $50,000 | 386 (12.9%) | 158 (4.1%) |
| $50,000 to $99,999 | 605 (20.3%) | 471 (12.1%) |
| $100,000 to $299,999 | 1,571 (52.6%) | 2,351 (60.3%) |
| $300,000 to $499,999 | 320 (10.7%) | 760 (19.5%) |
| $500,000 to $749,999 | 54 (1.8%) | 119 (3.0%) |
| $750,000 to $999,999 | 48 (1.6%) | 26 (0.7%) |
| $1,000,000 or more | 3 (0.1%) | 17 (0.4%) |
| Total | 2,987 (100.0%) | 3,902 (100.0%) |
Household Income by Mortgage Status in Ray County
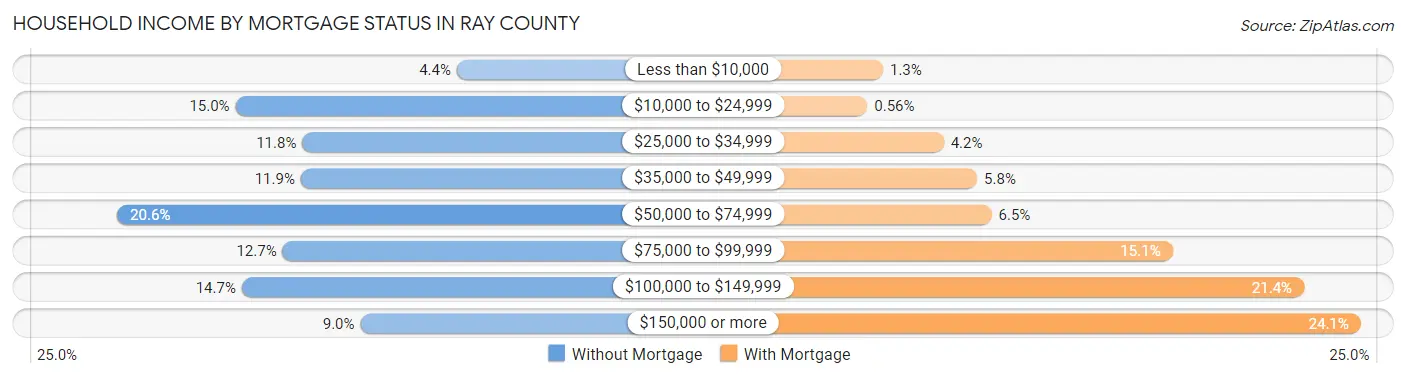
| Household Income | Without Mortgage | With Mortgage |
| Less than $10,000 | 132 (4.4%) | 51 (1.3%) |
| $10,000 to $24,999 | 447 (15.0%) | 22 (0.6%) |
| $25,000 to $34,999 | 352 (11.8%) | 164 (4.2%) |
| $35,000 to $49,999 | 354 (11.8%) | 226 (5.8%) |
| $50,000 to $74,999 | 615 (20.6%) | 253 (6.5%) |
| $75,000 to $99,999 | 380 (12.7%) | 589 (15.1%) |
| $100,000 to $149,999 | 438 (14.7%) | 833 (21.3%) |
| $150,000 or more | 269 (9.0%) | 939 (24.1%) |
| Total | 2,987 (100.0%) | 3,902 (100.0%) |
Property Value to Household Income Ratio in Ray County
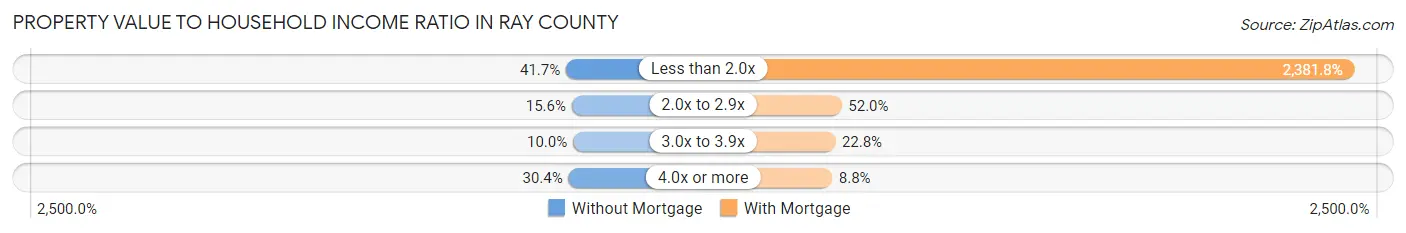
| Value-to-Income Ratio | Without Mortgage | With Mortgage |
| Less than 2.0x | 1,246 (41.7%) | 92,939 (2,381.8%) |
| 2.0x to 2.9x | 467 (15.6%) | 2,027 (51.9%) |
| 3.0x to 3.9x | 298 (10.0%) | 891 (22.8%) |
| 4.0x or more | 907 (30.4%) | 343 (8.8%) |
| Total | 2,987 (100.0%) | 3,902 (100.0%) |
Real Estate Taxes by Mortgage Status in Ray County
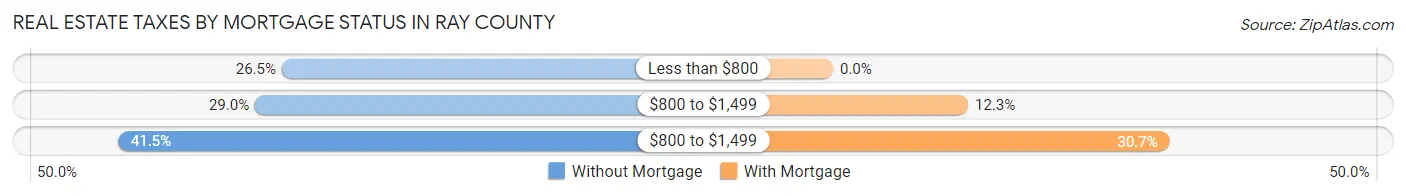
| Property Taxes | Without Mortgage | With Mortgage |
| Less than $800 | 792 (26.5%) | 0 (0.0%) |
| $800 to $1,499 | 865 (29.0%) | 481 (12.3%) |
| $800 to $1,499 | 1,239 (41.5%) | 1,199 (30.7%) |
| Total | 2,987 (100.0%) | 3,902 (100.0%) |
Health & Disability in Ray County
Health Insurance Coverage by Age in Ray County
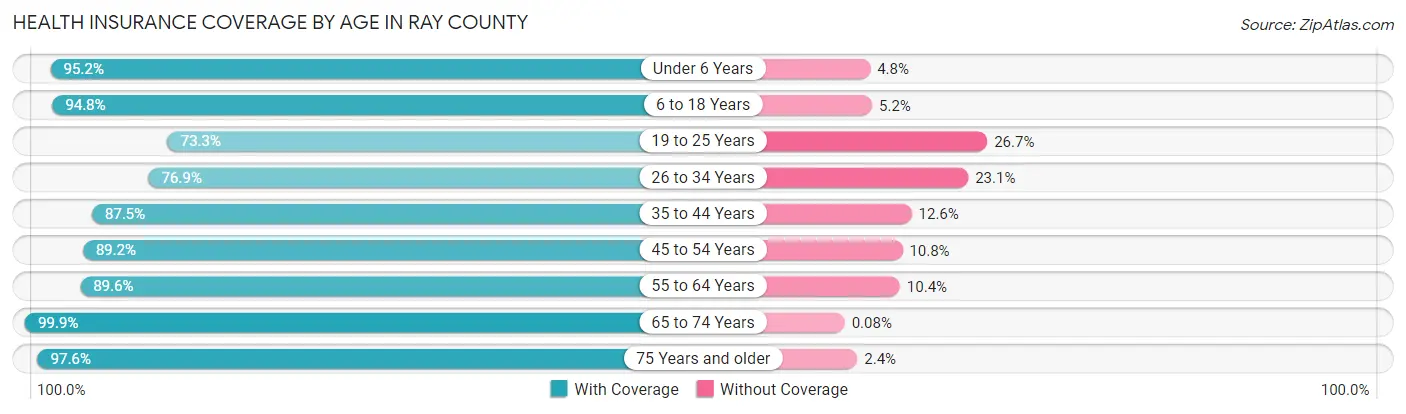
| Age Bracket | With Coverage | Without Coverage |
| Under 6 Years | 1,477 (95.2%) | 75 (4.8%) |
| 6 to 18 Years | 3,735 (94.8%) | 204 (5.2%) |
| 19 to 25 Years | 1,249 (73.3%) | 454 (26.7%) |
| 26 to 34 Years | 1,820 (76.9%) | 547 (23.1%) |
| 35 to 44 Years | 2,431 (87.5%) | 349 (12.6%) |
| 45 to 54 Years | 2,615 (89.2%) | 318 (10.8%) |
| 55 to 64 Years | 3,156 (89.6%) | 365 (10.4%) |
| 65 to 74 Years | 2,462 (99.9%) | 2 (0.1%) |
| 75 Years and older | 1,608 (97.6%) | 40 (2.4%) |
| Total | 20,553 (89.7%) | 2,354 (10.3%) |
Health Insurance Coverage by Citizenship Status in Ray County
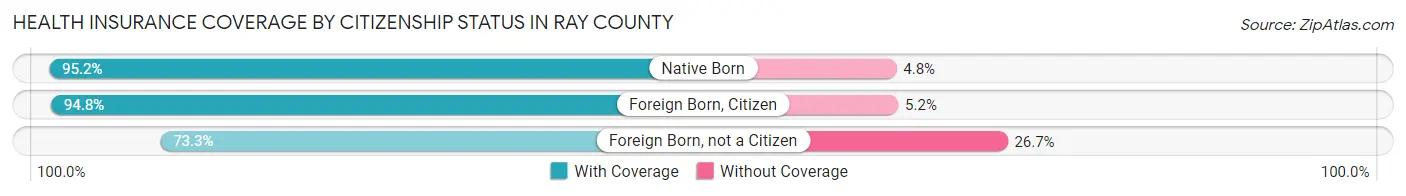
| Citizenship Status | With Coverage | Without Coverage |
| Native Born | 1,477 (95.2%) | 75 (4.8%) |
| Foreign Born, Citizen | 3,735 (94.8%) | 204 (5.2%) |
| Foreign Born, not a Citizen | 1,249 (73.3%) | 454 (26.7%) |
Health Insurance Coverage by Household Income in Ray County
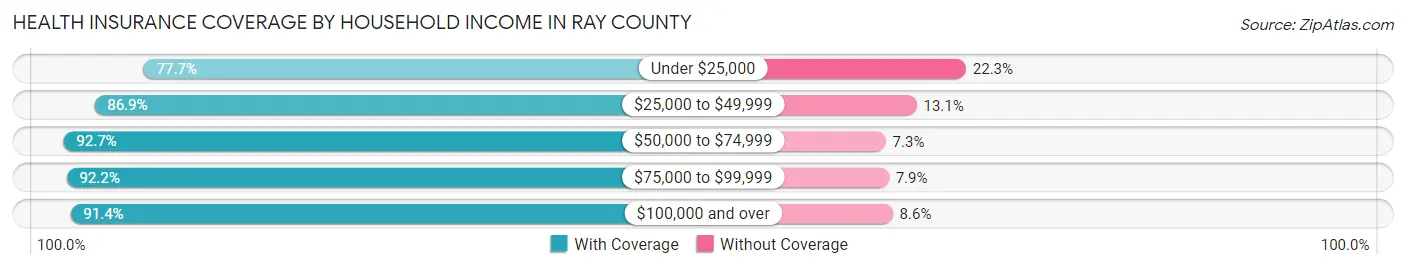
| Household Income | With Coverage | Without Coverage |
| Under $25,000 | 1,762 (77.7%) | 506 (22.3%) |
| $25,000 to $49,999 | 3,066 (86.9%) | 461 (13.1%) |
| $50,000 to $74,999 | 3,845 (92.7%) | 302 (7.3%) |
| $75,000 to $99,999 | 3,754 (92.1%) | 320 (7.9%) |
| $100,000 and over | 8,108 (91.4%) | 762 (8.6%) |
Public vs Private Health Insurance Coverage by Age in Ray County
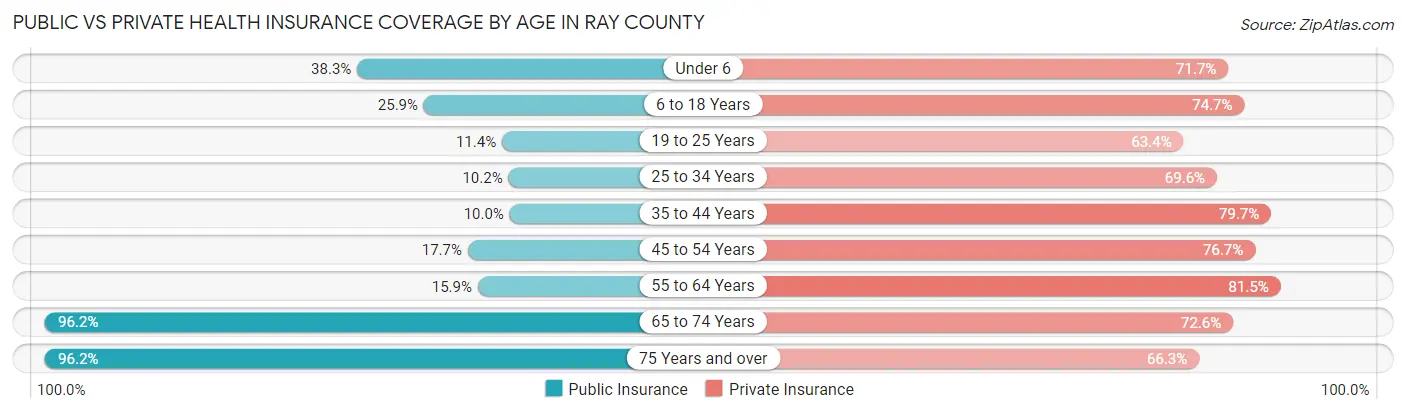
| Age Bracket | Public Insurance | Private Insurance |
| Under 6 | 594 (38.3%) | 1,113 (71.7%) |
| 6 to 18 Years | 1,020 (25.9%) | 2,943 (74.7%) |
| 19 to 25 Years | 194 (11.4%) | 1,080 (63.4%) |
| 25 to 34 Years | 241 (10.2%) | 1,648 (69.6%) |
| 35 to 44 Years | 277 (10.0%) | 2,215 (79.7%) |
| 45 to 54 Years | 520 (17.7%) | 2,250 (76.7%) |
| 55 to 64 Years | 559 (15.9%) | 2,868 (81.5%) |
| 65 to 74 Years | 2,370 (96.2%) | 1,789 (72.6%) |
| 75 Years and over | 1,585 (96.2%) | 1,093 (66.3%) |
| Total | 7,360 (32.1%) | 16,999 (74.2%) |
Disability Status by Sex by Age in Ray County
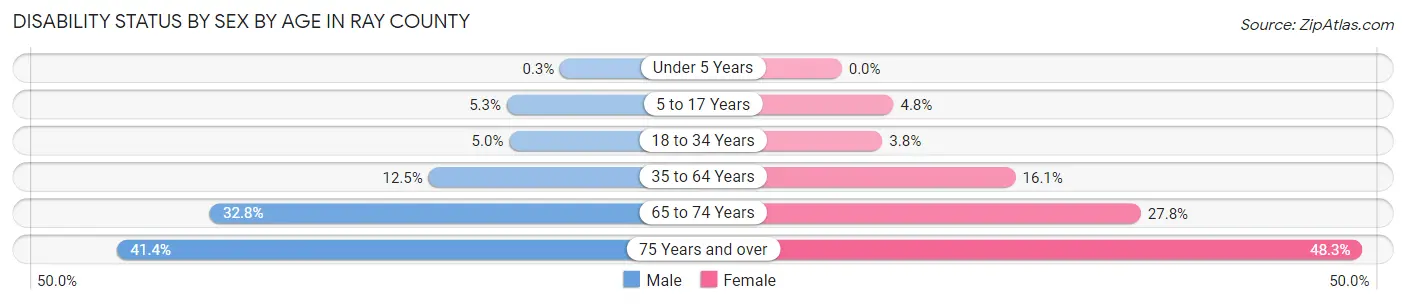
| Age Bracket | Male | Female |
| Under 5 Years | 2 (0.3%) | 0 (0.0%) |
| 5 to 17 Years | 105 (5.2%) | 94 (4.8%) |
| 18 to 34 Years | 112 (5.0%) | 79 (3.8%) |
| 35 to 64 Years | 591 (12.5%) | 727 (16.1%) |
| 65 to 74 Years | 392 (32.8%) | 352 (27.8%) |
| 75 Years and over | 292 (41.4%) | 455 (48.3%) |
Disability Class by Sex by Age in Ray County
Disability Class: Hearing Difficulty
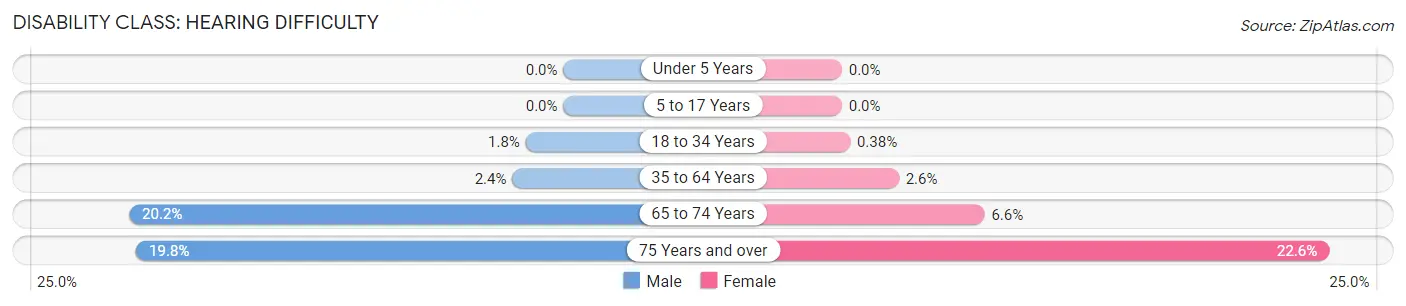
| Age Bracket | Male | Female |
| Under 5 Years | 0 (0.0%) | 0 (0.0%) |
| 5 to 17 Years | 0 (0.0%) | 0 (0.0%) |
| 18 to 34 Years | 39 (1.8%) | 8 (0.4%) |
| 35 to 64 Years | 112 (2.4%) | 119 (2.6%) |
| 65 to 74 Years | 241 (20.2%) | 84 (6.6%) |
| 75 Years and over | 140 (19.8%) | 213 (22.6%) |
Disability Class: Vision Difficulty
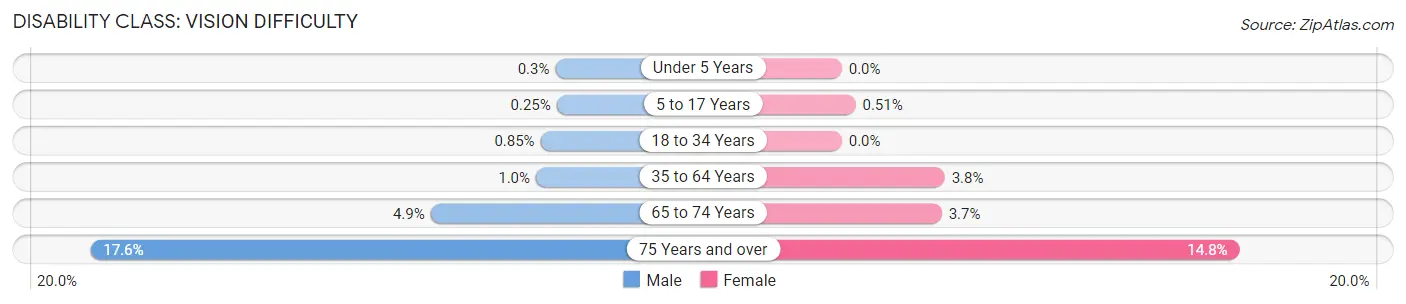
| Age Bracket | Male | Female |
| Under 5 Years | 2 (0.3%) | 0 (0.0%) |
| 5 to 17 Years | 5 (0.3%) | 10 (0.5%) |
| 18 to 34 Years | 19 (0.9%) | 0 (0.0%) |
| 35 to 64 Years | 48 (1.0%) | 172 (3.8%) |
| 65 to 74 Years | 59 (4.9%) | 47 (3.7%) |
| 75 Years and over | 124 (17.6%) | 139 (14.8%) |
Disability Class: Cognitive Difficulty
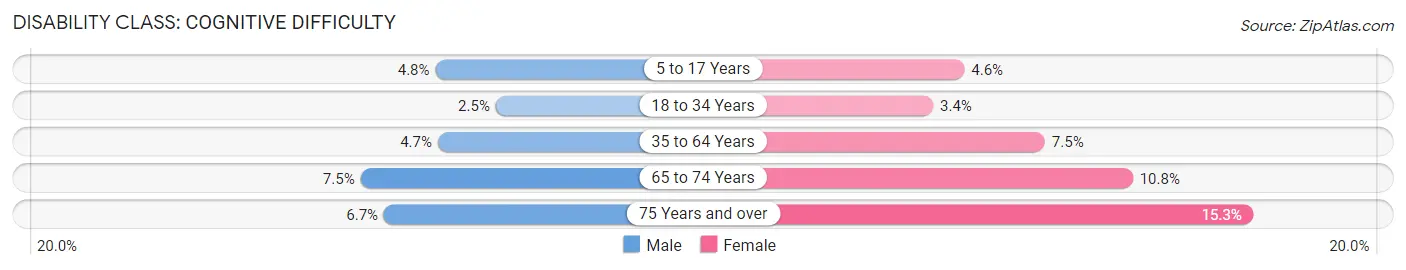
| Age Bracket | Male | Female |
| 5 to 17 Years | 95 (4.8%) | 89 (4.5%) |
| 18 to 34 Years | 56 (2.5%) | 71 (3.4%) |
| 35 to 64 Years | 220 (4.7%) | 340 (7.5%) |
| 65 to 74 Years | 90 (7.5%) | 137 (10.8%) |
| 75 Years and over | 47 (6.7%) | 144 (15.3%) |
Disability Class: Ambulatory Difficulty
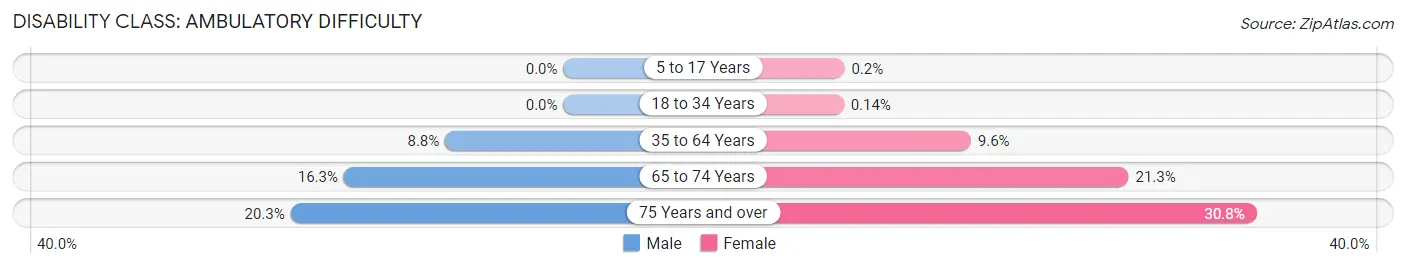
| Age Bracket | Male | Female |
| 5 to 17 Years | 0 (0.0%) | 4 (0.2%) |
| 18 to 34 Years | 0 (0.0%) | 3 (0.1%) |
| 35 to 64 Years | 415 (8.8%) | 432 (9.6%) |
| 65 to 74 Years | 195 (16.3%) | 270 (21.3%) |
| 75 Years and over | 143 (20.3%) | 290 (30.8%) |
Disability Class: Self-Care Difficulty
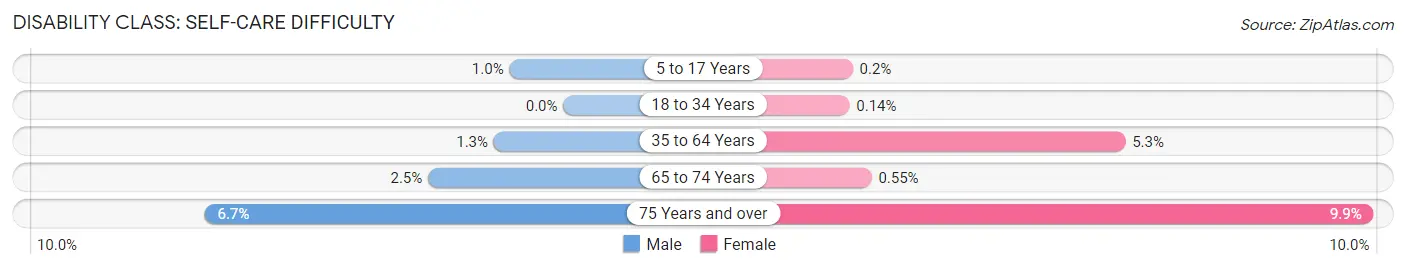
| Age Bracket | Male | Female |
| 5 to 17 Years | 20 (1.0%) | 4 (0.2%) |
| 18 to 34 Years | 0 (0.0%) | 3 (0.1%) |
| 35 to 64 Years | 61 (1.3%) | 237 (5.3%) |
| 65 to 74 Years | 30 (2.5%) | 7 (0.5%) |
| 75 Years and over | 47 (6.7%) | 93 (9.9%) |
Technology Access in Ray County
Computing Device Access in Ray County
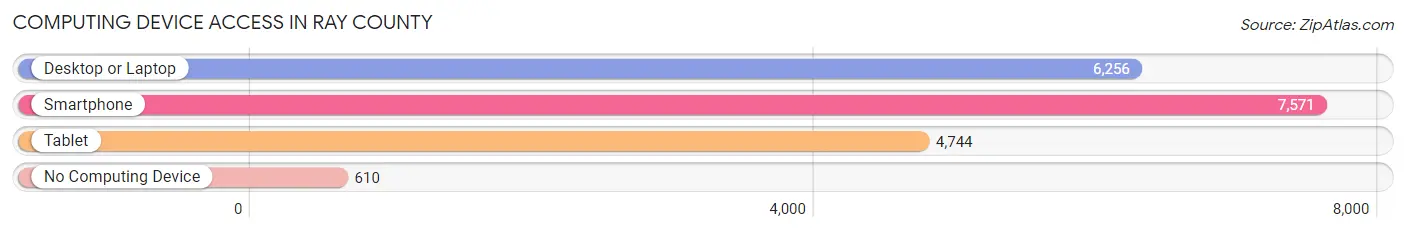
| Device Type | # Households | % Households |
| Desktop or Laptop | 6,256 | 71.3% |
| Smartphone | 7,571 | 86.3% |
| Tablet | 4,744 | 54.1% |
| No Computing Device | 610 | 7.0% |
| Total | 8,773 | 100.0% |
Internet Access in Ray County
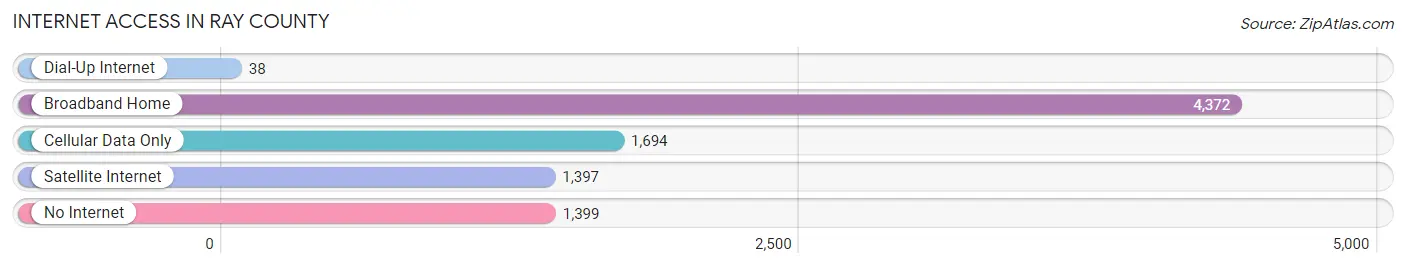
| Internet Type | # Households | % Households |
| Dial-Up Internet | 38 | 0.4% |
| Broadband Home | 4,372 | 49.8% |
| Cellular Data Only | 1,694 | 19.3% |
| Satellite Internet | 1,397 | 15.9% |
| No Internet | 1,399 | 16.0% |
| Total | 8,773 | 100.0% |
Ray County Summary
Ray County is located in the northwestern corner of Missouri and is part of the Kansas City metropolitan area. The county was established in 1820 and named after John Ray, a Missouri state legislator. The county seat is Richmond, which is also the largest city in the county. As of the 2010 census, the population of Ray County was 23,494.
Geography
Ray County is located in the northwestern corner of Missouri and is bordered by Jackson County to the north, Lafayette County to the east, Carroll County to the south, and Cass County to the west. The county covers an area of 545 square miles and is mostly rural, with the majority of the land being used for agricultural purposes. The county is located in the Missouri River Valley and is home to several small streams and creeks, including the East Fork of the Grand River, the West Fork of the Grand River, and the Little Fishing River. The highest point in the county is located in the northwest corner, at an elevation of 1,068 feet.
Economy
Agriculture is the primary economic driver in Ray County, with the majority of the land being used for farming and livestock production. The county is home to several large farms, including the Ray County Farm Bureau, which is the largest farm in the county. Other major industries in the county include manufacturing, retail, and healthcare. The county is also home to several small businesses, including restaurants, shops, and other services.
Demographics
As of the 2010 census, the population of Ray County was 23,494, with a population density of 43.3 people per square mile. The racial makeup of the county was 95.2% White, 1.7% African American, 0.4% Native American, 0.3% Asian, 0.1% Pacific Islander, 0.7% from other races, and 1.6% from two or more races. Hispanic or Latino of any race were 2.2% of the population.
The median income for a household in the county was $45,845, and the median income for a family was $54,845. The per capita income for the county was $21,845. About 10.2% of families and 13.2% of the population were below the poverty line, including 17.2% of those under age 18 and 8.2% of those age 65 or over.
Conclusion
Ray County is a rural county located in the northwestern corner of Missouri. The county is home to a population of 23,494 and is primarily agricultural, with the majority of the land being used for farming and livestock production. The county is also home to several small businesses, including restaurants, shops, and other services. The median income for a household in the county is $45,845, and the median income for a family is $54,845. Ray County is a diverse and vibrant community that is an important part of the Kansas City metropolitan area.
Common Questions
What is Per Capita Income in Ray County?
Per Capita income in Ray County is $35,601.
What is the Median Family Income in Ray County?
Median Family Income in Ray County is $82,089.
What is the Median Household income in Ray County?
Median Household Income in Ray County is $69,779.
What is Income or Wage Gap in Ray County?
Income or Wage Gap in Ray County is 30.8%.
Women in Ray County earn 69.2 cents for every dollar earned by a man.
What is Family Income Deficit in Ray County?
Family Income Deficit in Ray County is $10,482.
Families that are below poverty line in Ray County earn $10,482 less on average than the poverty threshold level.
What is Inequality or Gini Index in Ray County?
Inequality or Gini Index in Ray County is 0.43.
What is the Total Population of Ray County?
Total Population of Ray County is 23,122.
What is the Total Male Population of Ray County?
Total Male Population of Ray County is 11,611.
What is the Total Female Population of Ray County?
Total Female Population of Ray County is 11,511.
What is the Ratio of Males per 100 Females in Ray County?
There are 100.87 Males per 100 Females in Ray County.
What is the Ratio of Females per 100 Males in Ray County?
There are 99.14 Females per 100 Males in Ray County.
What is the Median Population Age in Ray County?
Median Population Age in Ray County is 42.0 Years.
What is the Average Family Size in Ray County
Average Family Size in Ray County is 3.1 People.
What is the Average Household Size in Ray County
Average Household Size in Ray County is 2.6 People.
How Large is the Labor Force in Ray County?
There are 11,374 People in the Labor Forcein in Ray County.
What is the Percentage of People in the Labor Force in Ray County?
61.5% of People are in the Labor Force in Ray County.
What is the Unemployment Rate in Ray County?
Unemployment Rate in Ray County is 3.1%.