Platte County, MO Map & Demographics
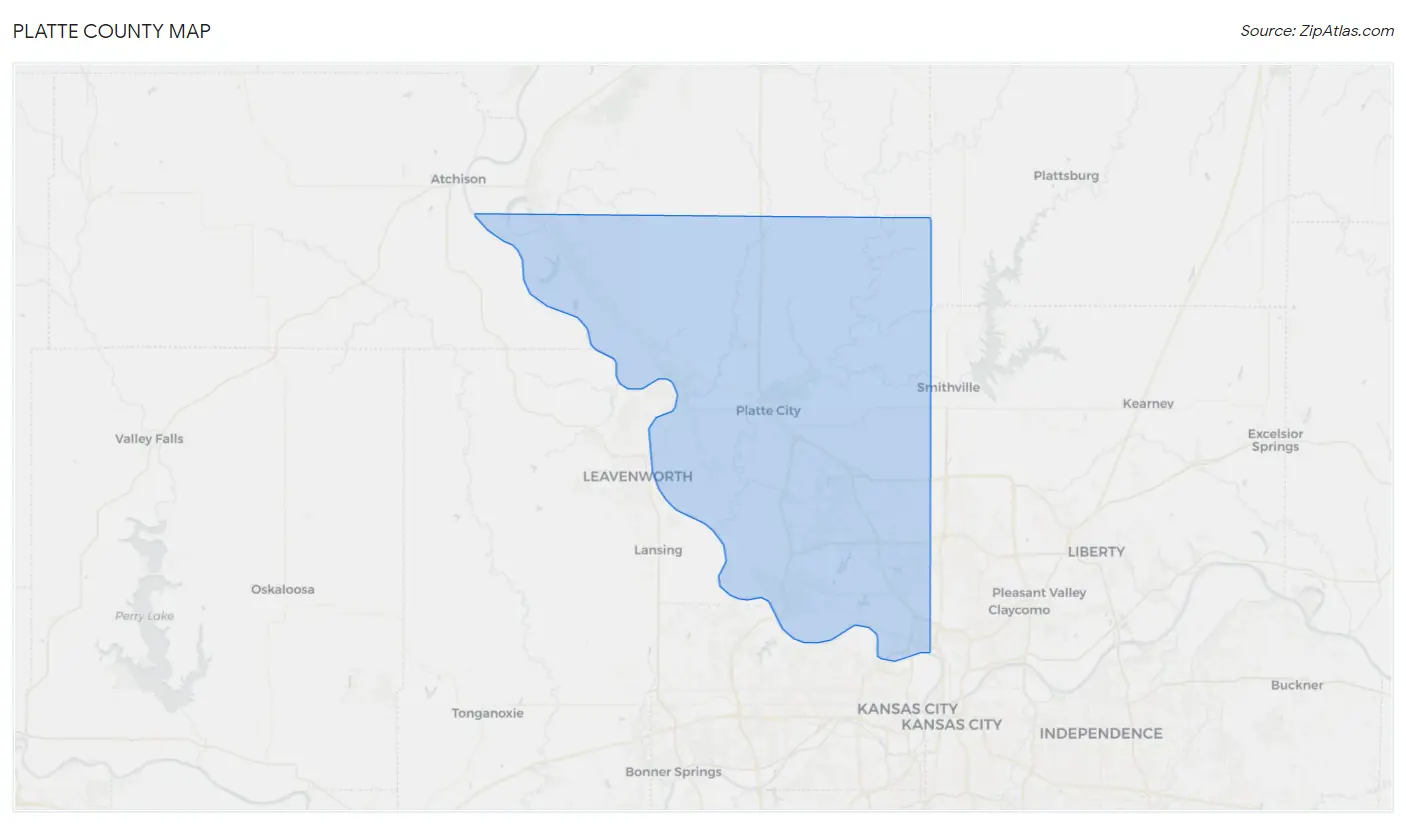
Platte County Map
Platte County Overview
$47,440
PER CAPITA INCOME
$111,610
AVG FAMILY INCOME
$92,543
AVG HOUSEHOLD INCOME
28.4%
WAGE / INCOME GAP [ % ]
71.6¢/ $1
WAGE / INCOME GAP [ $ ]
$13,827
FAMILY INCOME DEFICIT
0.43
INEQUALITY / GINI INDEX
107,033
TOTAL POPULATION
53,232
MALE POPULATION
53,801
FEMALE POPULATION
98.94
MALES / 100 FEMALES
101.07
FEMALES / 100 MALES
38.7
MEDIAN AGE
3.0
AVG FAMILY SIZE
2.5
AVG HOUSEHOLD SIZE
59,426
LABOR FORCE [ PEOPLE ]
70.2%
PERCENT IN LABOR FORCE
3.6%
UNEMPLOYMENT RATE
Platte County Area Codes
Income in Platte County
Income Overview in Platte County
Per Capita Income in Platte County is $47,440, while median incomes of families and households are $111,610 and $92,543 respectively.
| Characteristic | Number | Measure |
| Per Capita Income | 107,033 | $47,440 |
| Median Family Income | 28,427 | $111,610 |
| Mean Family Income | 28,427 | $139,189 |
| Median Household Income | 42,606 | $92,543 |
| Mean Household Income | 42,606 | $117,776 |
| Income Deficit | 28,427 | $13,827 |
| Wage / Income Gap (%) | 107,033 | 28.44% |
| Wage / Income Gap ($) | 107,033 | 71.56¢ per $1 |
| Gini / Inequality Index | 107,033 | 0.43 |
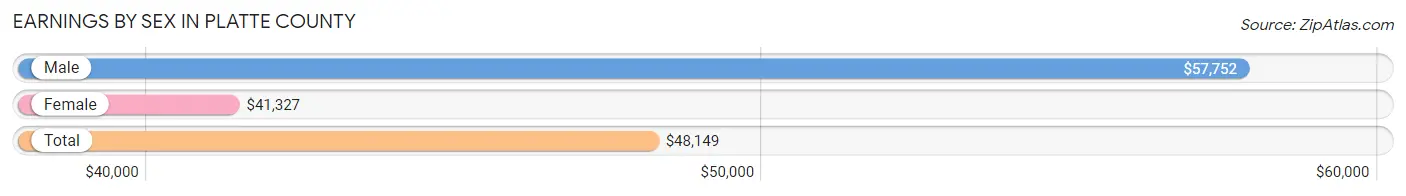
Earnings by Sex in Platte County
Average Earnings in Platte County are $48,149, $57,752 for men and $41,327 for women, a difference of 28.4%.
| Sex | Number | Average Earnings |
| Male | 32,176 (52.1%) | $57,752 |
| Female | 29,567 (47.9%) | $41,327 |
| Total | 61,743 (100.0%) | $48,149 |
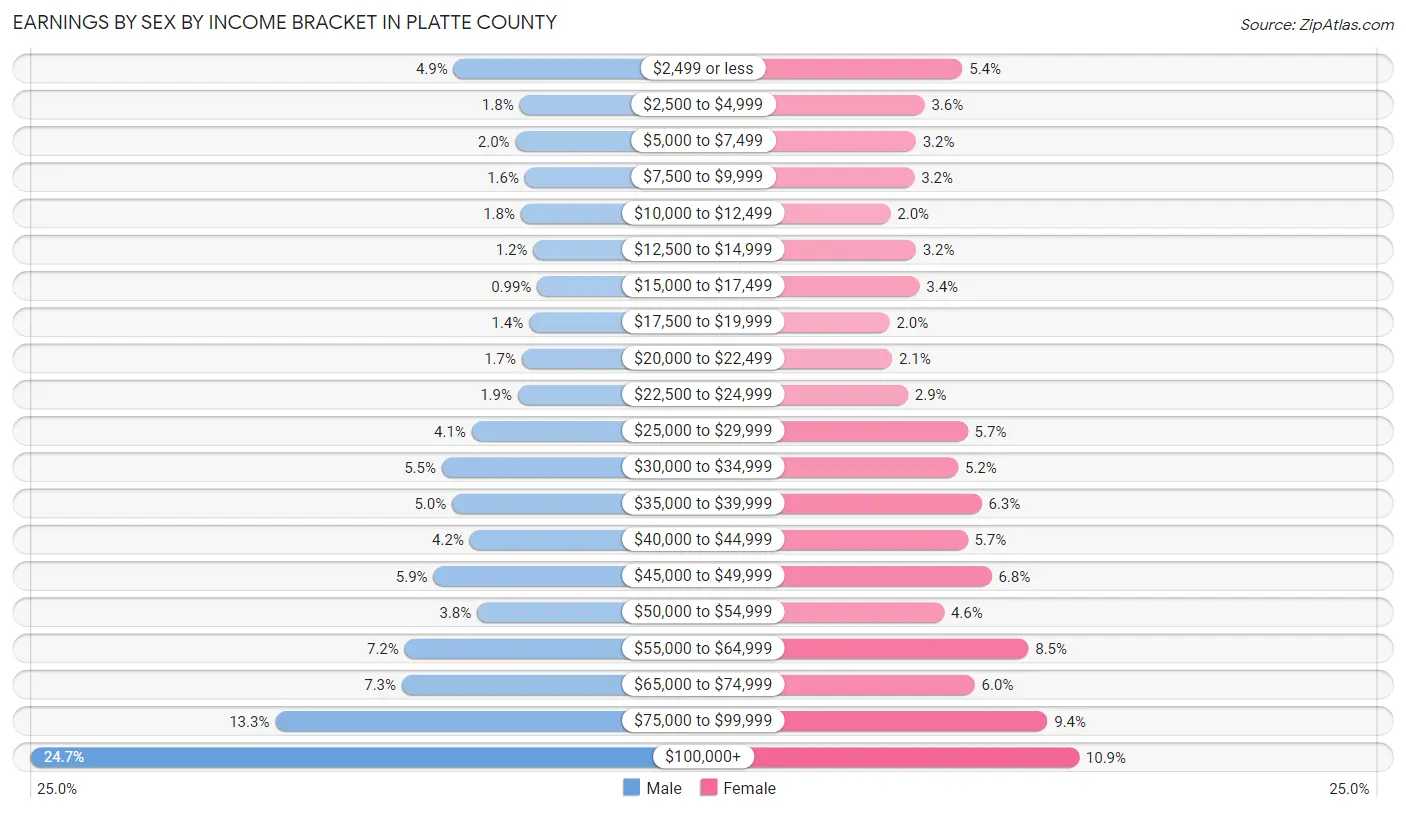
Earnings by Sex by Income Bracket in Platte County
The most common earnings brackets in Platte County are $100,000+ for men (7,950 | 24.7%) and $100,000+ for women (3,214 | 10.9%).
| Income | Male | Female |
| $2,499 or less | 1,580 (4.9%) | 1,600 (5.4%) |
| $2,500 to $4,999 | 587 (1.8%) | 1,076 (3.6%) |
| $5,000 to $7,499 | 648 (2.0%) | 956 (3.2%) |
| $7,500 to $9,999 | 504 (1.6%) | 935 (3.2%) |
| $10,000 to $12,499 | 565 (1.8%) | 604 (2.0%) |
| $12,500 to $14,999 | 375 (1.2%) | 954 (3.2%) |
| $15,000 to $17,499 | 318 (1.0%) | 1,004 (3.4%) |
| $17,500 to $19,999 | 442 (1.4%) | 590 (2.0%) |
| $20,000 to $22,499 | 549 (1.7%) | 627 (2.1%) |
| $22,500 to $24,999 | 611 (1.9%) | 845 (2.9%) |
| $25,000 to $29,999 | 1,307 (4.1%) | 1,674 (5.7%) |
| $30,000 to $34,999 | 1,756 (5.5%) | 1,541 (5.2%) |
| $35,000 to $39,999 | 1,601 (5.0%) | 1,866 (6.3%) |
| $40,000 to $44,999 | 1,334 (4.2%) | 1,670 (5.7%) |
| $45,000 to $49,999 | 1,882 (5.9%) | 2,006 (6.8%) |
| $50,000 to $54,999 | 1,226 (3.8%) | 1,344 (4.5%) |
| $55,000 to $64,999 | 2,318 (7.2%) | 2,513 (8.5%) |
| $65,000 to $74,999 | 2,357 (7.3%) | 1,771 (6.0%) |
| $75,000 to $99,999 | 4,266 (13.3%) | 2,777 (9.4%) |
| $100,000+ | 7,950 (24.7%) | 3,214 (10.9%) |
| Total | 32,176 (100.0%) | 29,567 (100.0%) |
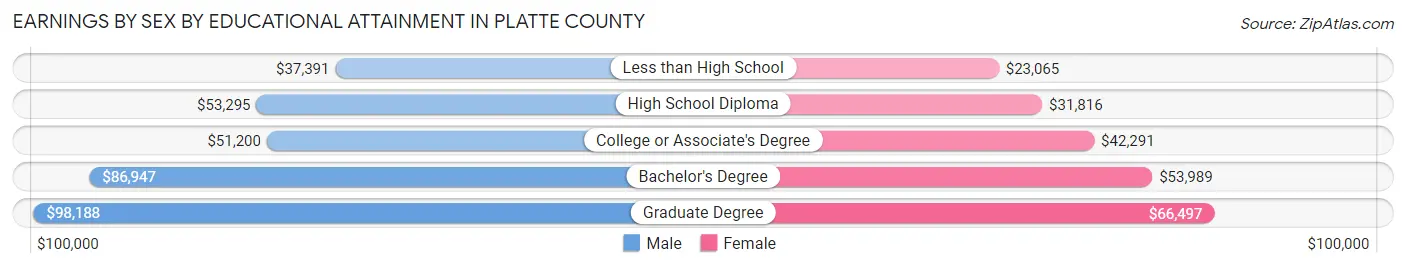
Earnings by Sex by Educational Attainment in Platte County
Average earnings in Platte County are $66,646 for men and $46,490 for women, a difference of 30.2%. Men with an educational attainment of graduate degree enjoy the highest average annual earnings of $98,188, while those with less than high school education earn the least with $37,391. Women with an educational attainment of graduate degree earn the most with the average annual earnings of $66,497, while those with less than high school education have the smallest earnings of $23,065.
| Educational Attainment | Male Income | Female Income |
| Less than High School | $37,391 | $23,065 |
| High School Diploma | $53,295 | $31,816 |
| College or Associate's Degree | $51,200 | $42,291 |
| Bachelor's Degree | $86,947 | $53,989 |
| Graduate Degree | $98,188 | $66,497 |
| Total | $66,646 | $46,490 |
Family Income in Platte County
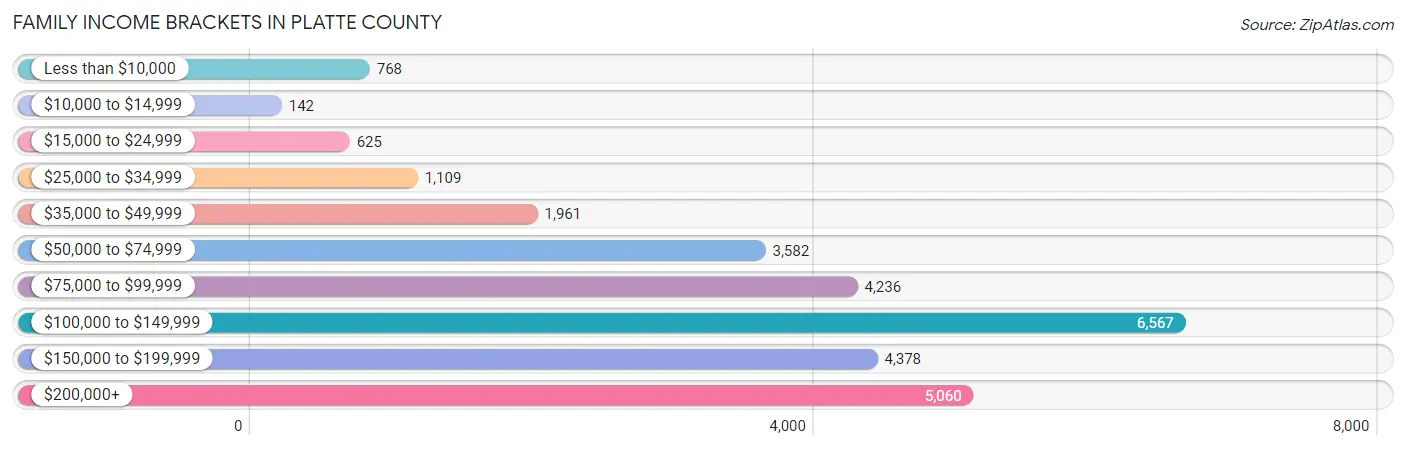
Family Income Brackets in Platte County
According to the Platte County family income data, there are 6,567 families falling into the $100,000 to $149,999 income range, which is the most common income bracket and makes up 23.1% of all families. Conversely, the $10,000 to $14,999 income bracket is the least frequent group with only 142 families (0.5%) belonging to this category.
| Income Bracket | # Families | % Families |
| Less than $10,000 | 768 | 2.7% |
| $10,000 to $14,999 | 142 | 0.5% |
| $15,000 to $24,999 | 625 | 2.2% |
| $25,000 to $34,999 | 1,109 | 3.9% |
| $35,000 to $49,999 | 1,961 | 6.9% |
| $50,000 to $74,999 | 3,582 | 12.6% |
| $75,000 to $99,999 | 4,236 | 14.9% |
| $100,000 to $149,999 | 6,567 | 23.1% |
| $150,000 to $199,999 | 4,378 | 15.4% |
| $200,000+ | 5,060 | 17.8% |
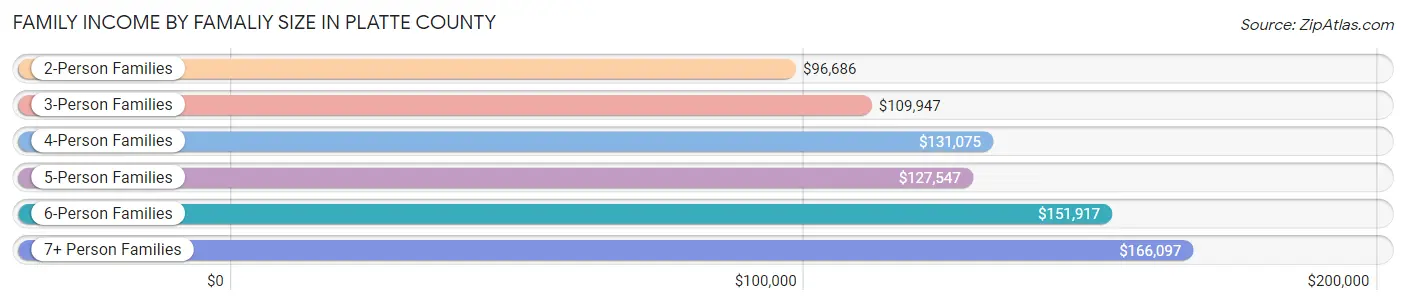
Family Income by Famaliy Size in Platte County
7+ person families (525 | 1.8%) account for the highest median family income in Platte County with $166,097 per family, while 2-person families (13,111 | 46.1%) have the highest median income of $48,343 per family member.
| Income Bracket | # Families | Median Income |
| 2-Person Families | 13,111 (46.1%) | $96,686 |
| 3-Person Families | 5,848 (20.6%) | $109,947 |
| 4-Person Families | 5,861 (20.6%) | $131,075 |
| 5-Person Families | 2,207 (7.8%) | $127,547 |
| 6-Person Families | 875 (3.1%) | $151,917 |
| 7+ Person Families | 525 (1.8%) | $166,097 |
| Total | 28,427 (100.0%) | $111,610 |
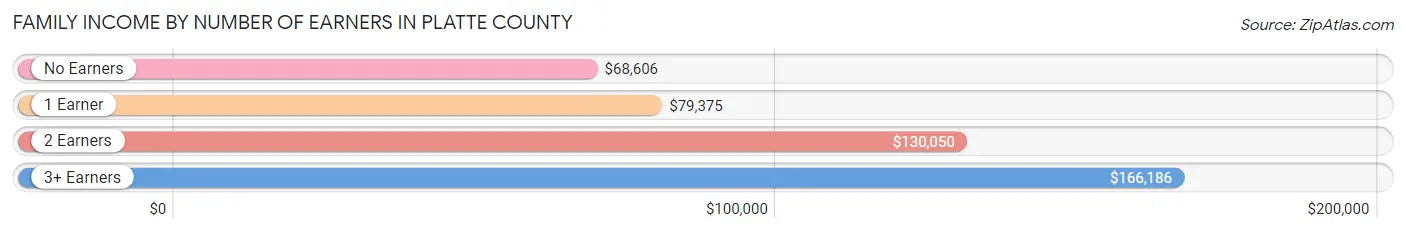
Family Income by Number of Earners in Platte County
The median family income in Platte County is $111,610, with families comprising 3+ earners (3,440) having the highest median family income of $166,186, while families with no earners (3,457) have the lowest median family income of $68,606, accounting for 12.1% and 12.2% of families, respectively.
| Number of Earners | # Families | Median Income |
| No Earners | 3,457 (12.2%) | $68,606 |
| 1 Earner | 8,635 (30.4%) | $79,375 |
| 2 Earners | 12,895 (45.4%) | $130,050 |
| 3+ Earners | 3,440 (12.1%) | $166,186 |
| Total | 28,427 (100.0%) | $111,610 |
Household Income in Platte County
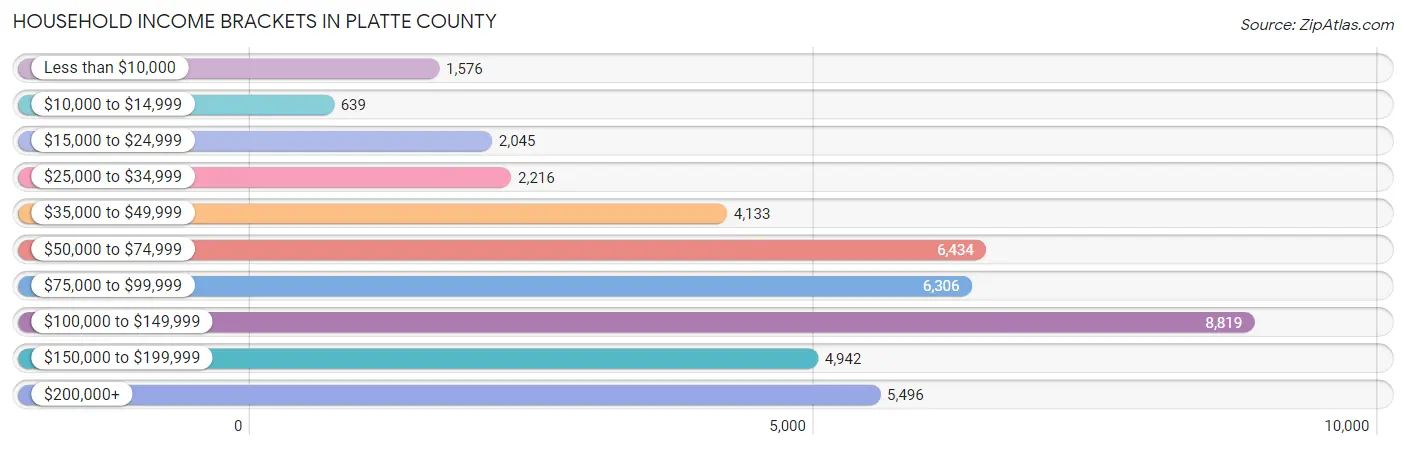
Household Income Brackets in Platte County
With 8,819 households falling in the category, the $100,000 to $149,999 income range is the most frequent in Platte County, accounting for 20.7% of all households. In contrast, only 639 households (1.5%) fall into the $10,000 to $14,999 income bracket, making it the least populous group.
| Income Bracket | # Households | % Households |
| Less than $10,000 | 1,576 | 3.7% |
| $10,000 to $14,999 | 639 | 1.5% |
| $15,000 to $24,999 | 2,045 | 4.8% |
| $25,000 to $34,999 | 2,216 | 5.2% |
| $35,000 to $49,999 | 4,133 | 9.7% |
| $50,000 to $74,999 | 6,434 | 15.1% |
| $75,000 to $99,999 | 6,306 | 14.8% |
| $100,000 to $149,999 | 8,819 | 20.7% |
| $150,000 to $199,999 | 4,942 | 11.6% |
| $200,000+ | 5,496 | 12.9% |
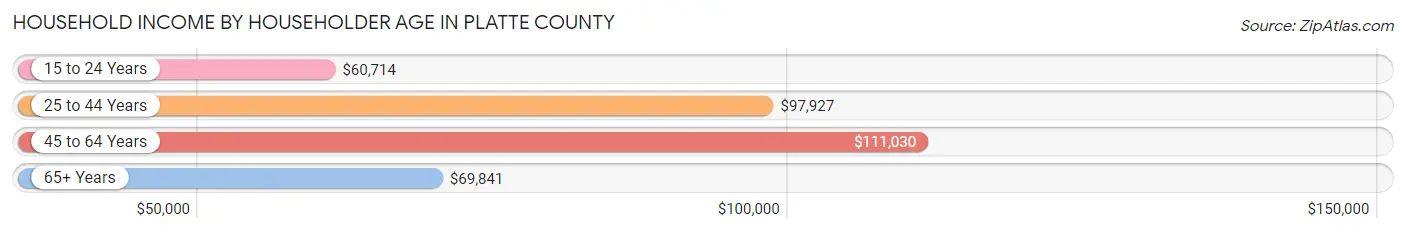
Household Income by Householder Age in Platte County
The median household income in Platte County is $92,543, with the highest median household income of $111,030 found in the 45 to 64 years age bracket for the primary householder. A total of 15,258 households (35.8%) fall into this category. Meanwhile, the 15 to 24 years age bracket for the primary householder has the lowest median household income of $60,714, with 1,748 households (4.1%) in this group.
| Income Bracket | # Households | Median Income |
| 15 to 24 Years | 1,748 (4.1%) | $60,714 |
| 25 to 44 Years | 15,373 (36.1%) | $97,927 |
| 45 to 64 Years | 15,258 (35.8%) | $111,030 |
| 65+ Years | 10,227 (24.0%) | $69,841 |
| Total | 42,606 (100.0%) | $92,543 |
Poverty in Platte County
Income Below Poverty by Sex and Age in Platte County
With 6.4% poverty level for males and 7.5% for females among the residents of Platte County, 16 and 17 year old males and 15 year old females are the most vulnerable to poverty, with 174 males (12.7%) and 196 females (21.9%) in their respective age groups living below the poverty level.
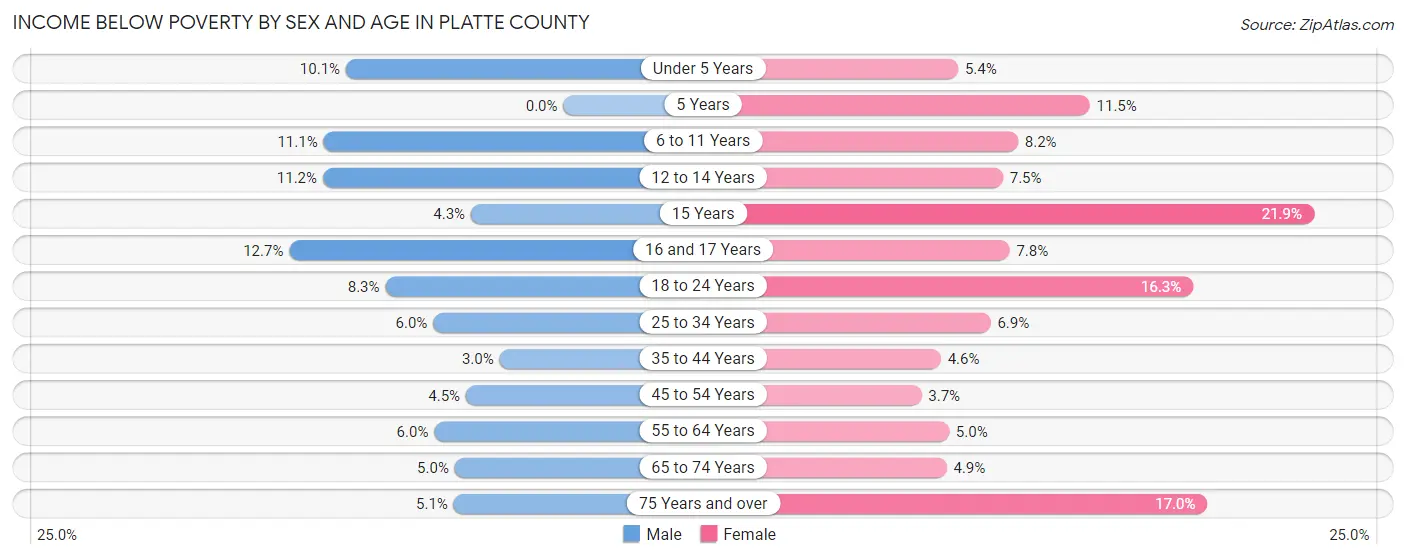
| Age Bracket | Male | Female |
| Under 5 Years | 314 (10.1%) | 161 (5.4%) |
| 5 Years | 0 (0.0%) | 92 (11.5%) |
| 6 to 11 Years | 509 (11.1%) | 323 (8.2%) |
| 12 to 14 Years | 267 (11.2%) | 160 (7.5%) |
| 15 Years | 38 (4.3%) | 196 (21.9%) |
| 16 and 17 Years | 174 (12.7%) | 99 (7.8%) |
| 18 to 24 Years | 353 (8.3%) | 679 (16.3%) |
| 25 to 34 Years | 435 (6.0%) | 484 (6.9%) |
| 35 to 44 Years | 225 (3.0%) | 353 (4.6%) |
| 45 to 54 Years | 314 (4.5%) | 251 (3.7%) |
| 55 to 64 Years | 401 (6.0%) | 337 (5.0%) |
| 65 to 74 Years | 243 (5.0%) | 256 (4.9%) |
| 75 Years and over | 131 (5.1%) | 594 (17.0%) |
| Total | 3,404 (6.4%) | 3,985 (7.5%) |
Income Above Poverty by Sex and Age in Platte County
According to the poverty statistics in Platte County, males aged 5 years and females aged 45 to 54 years are the age groups that are most secure financially, with 100.0% of males and 96.3% of females in these age groups living above the poverty line.
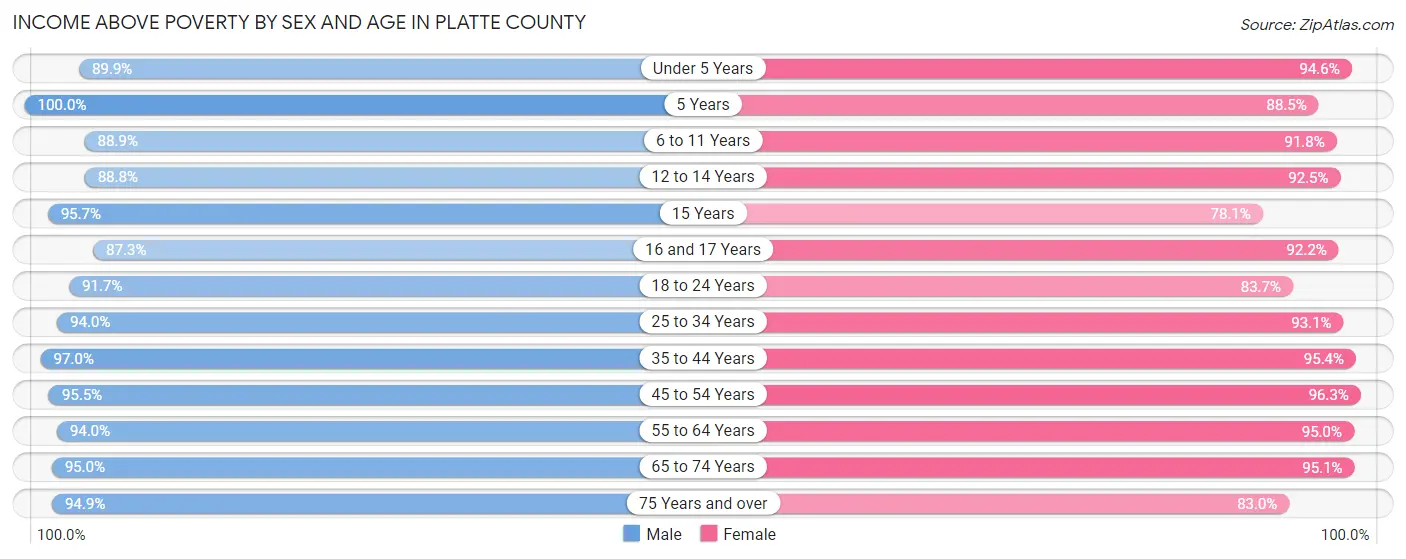
| Age Bracket | Male | Female |
| Under 5 Years | 2,798 (89.9%) | 2,824 (94.6%) |
| 5 Years | 388 (100.0%) | 708 (88.5%) |
| 6 to 11 Years | 4,066 (88.9%) | 3,629 (91.8%) |
| 12 to 14 Years | 2,126 (88.8%) | 1,983 (92.5%) |
| 15 Years | 847 (95.7%) | 699 (78.1%) |
| 16 and 17 Years | 1,194 (87.3%) | 1,174 (92.2%) |
| 18 to 24 Years | 3,921 (91.7%) | 3,487 (83.7%) |
| 25 to 34 Years | 6,765 (94.0%) | 6,532 (93.1%) |
| 35 to 44 Years | 7,371 (97.0%) | 7,332 (95.4%) |
| 45 to 54 Years | 6,629 (95.5%) | 6,545 (96.3%) |
| 55 to 64 Years | 6,294 (94.0%) | 6,443 (95.0%) |
| 65 to 74 Years | 4,583 (95.0%) | 5,008 (95.1%) |
| 75 Years and over | 2,445 (94.9%) | 2,909 (83.0%) |
| Total | 49,427 (93.6%) | 49,273 (92.5%) |
Income Below Poverty Among Married-Couple Families in Platte County
The poverty statistics for married-couple families in Platte County show that 1.9% or 421 of the total 22,357 families live below the poverty line. Families with 3 or 4 children have the highest poverty rate of 2.4%, comprising of 52 families. On the other hand, families with 5 or more children have the lowest poverty rate of 0.0%, which includes 0 families.
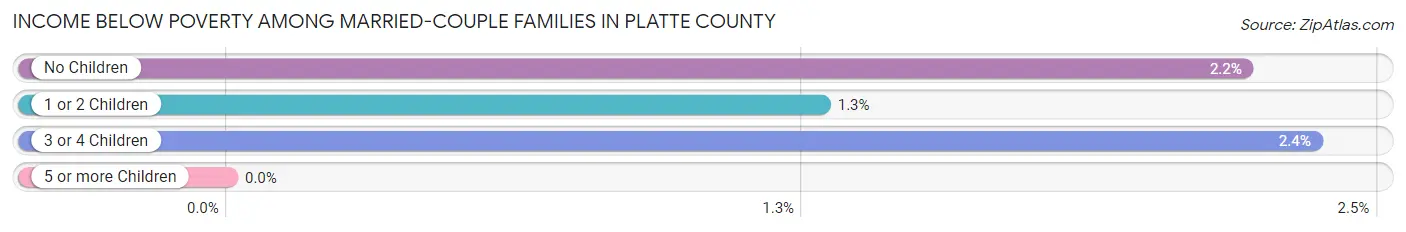
| Children | Above Poverty | Below Poverty |
| No Children | 12,000 (97.8%) | 271 (2.2%) |
| 1 or 2 Children | 7,483 (98.7%) | 98 (1.3%) |
| 3 or 4 Children | 2,154 (97.6%) | 52 (2.4%) |
| 5 or more Children | 299 (100.0%) | 0 (0.0%) |
| Total | 21,936 (98.1%) | 421 (1.9%) |
Income Below Poverty Among Single-Parent Households in Platte County
According to the poverty data in Platte County, 13.2% or 280 single-father households and 17.4% or 687 single-mother households are living below the poverty line. Among single-father households, those with 3 or 4 children have the highest poverty rate, with 96 households (67.6%) experiencing poverty. Likewise, among single-mother households, those with 5 or more children have the highest poverty rate, with 119 households (100.0%) falling below the poverty line.
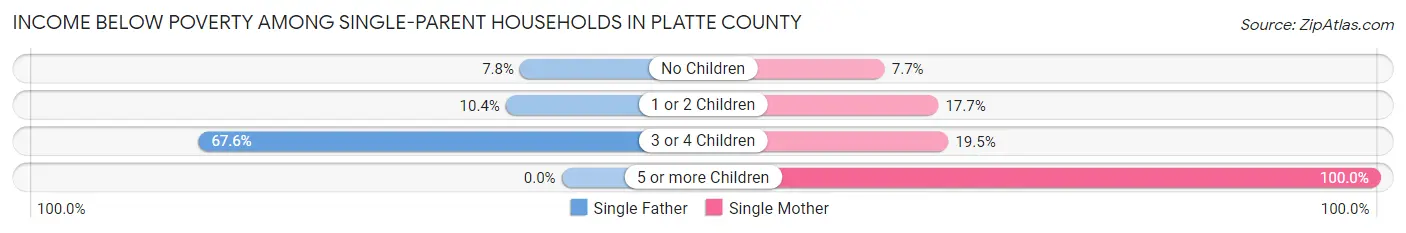
| Children | Single Father | Single Mother |
| No Children | 63 (7.8%) | 90 (7.7%) |
| 1 or 2 Children | 121 (10.4%) | 389 (17.7%) |
| 3 or 4 Children | 96 (67.6%) | 89 (19.5%) |
| 5 or more Children | 0 (0.0%) | 119 (100.0%) |
| Total | 280 (13.2%) | 687 (17.4%) |
Income Below Poverty Among Married-Couple vs Single-Parent Households in Platte County
The poverty data for Platte County shows that 421 of the married-couple family households (1.9%) and 967 of the single-parent households (15.9%) are living below the poverty level. Within the married-couple family households, those with 3 or 4 children have the highest poverty rate, with 52 households (2.4%) falling below the poverty line. Among the single-parent households, those with 5 or more children have the highest poverty rate, with 119 household (98.4%) living below poverty.
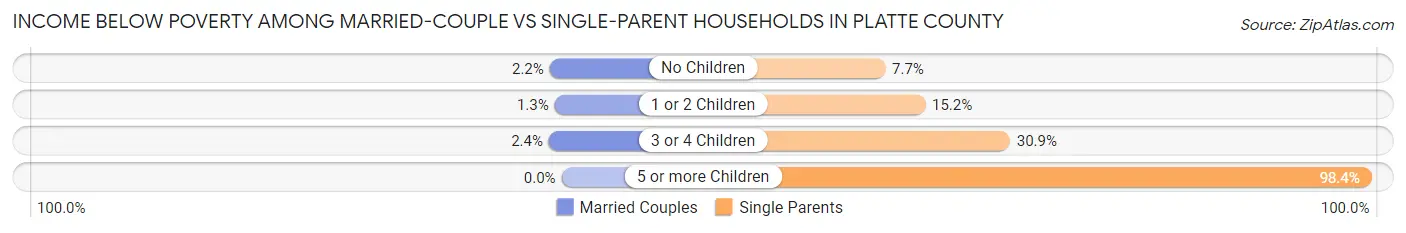
| Children | Married-Couple Families | Single-Parent Households |
| No Children | 271 (2.2%) | 153 (7.7%) |
| 1 or 2 Children | 98 (1.3%) | 510 (15.1%) |
| 3 or 4 Children | 52 (2.4%) | 185 (30.9%) |
| 5 or more Children | 0 (0.0%) | 119 (98.4%) |
| Total | 421 (1.9%) | 967 (15.9%) |
Race in Platte County
The most populous races in Platte County are White / Caucasian (87,098 | 81.4%), Black / African American (7,913 | 7.4%), and Hispanic or Latino (7,086 | 6.6%).
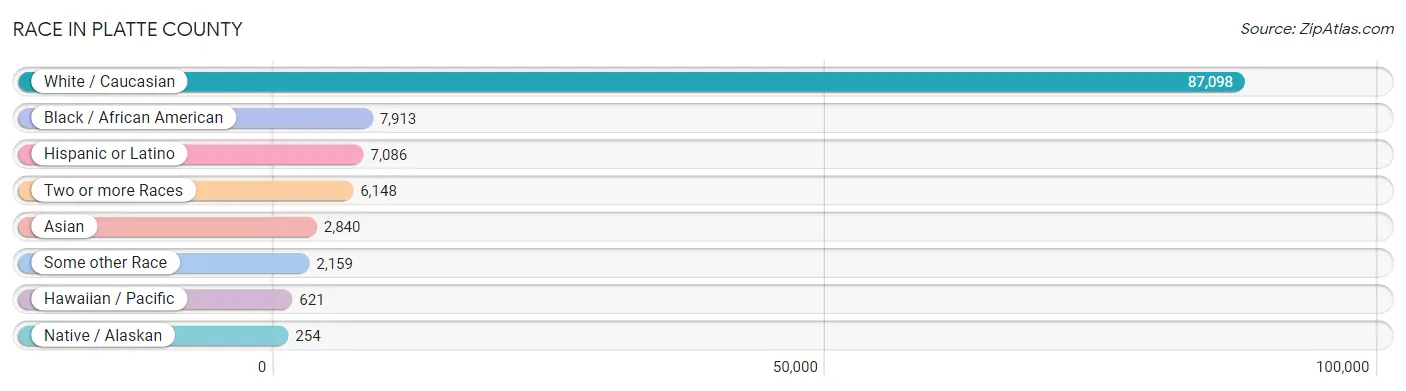
| Race | # Population | % Population |
| Asian | 2,840 | 2.6% |
| Black / African American | 7,913 | 7.4% |
| Hawaiian / Pacific | 621 | 0.6% |
| Hispanic or Latino | 7,086 | 6.6% |
| Native / Alaskan | 254 | 0.2% |
| White / Caucasian | 87,098 | 81.4% |
| Two or more Races | 6,148 | 5.7% |
| Some other Race | 2,159 | 2.0% |
| Total | 107,033 | 100.0% |
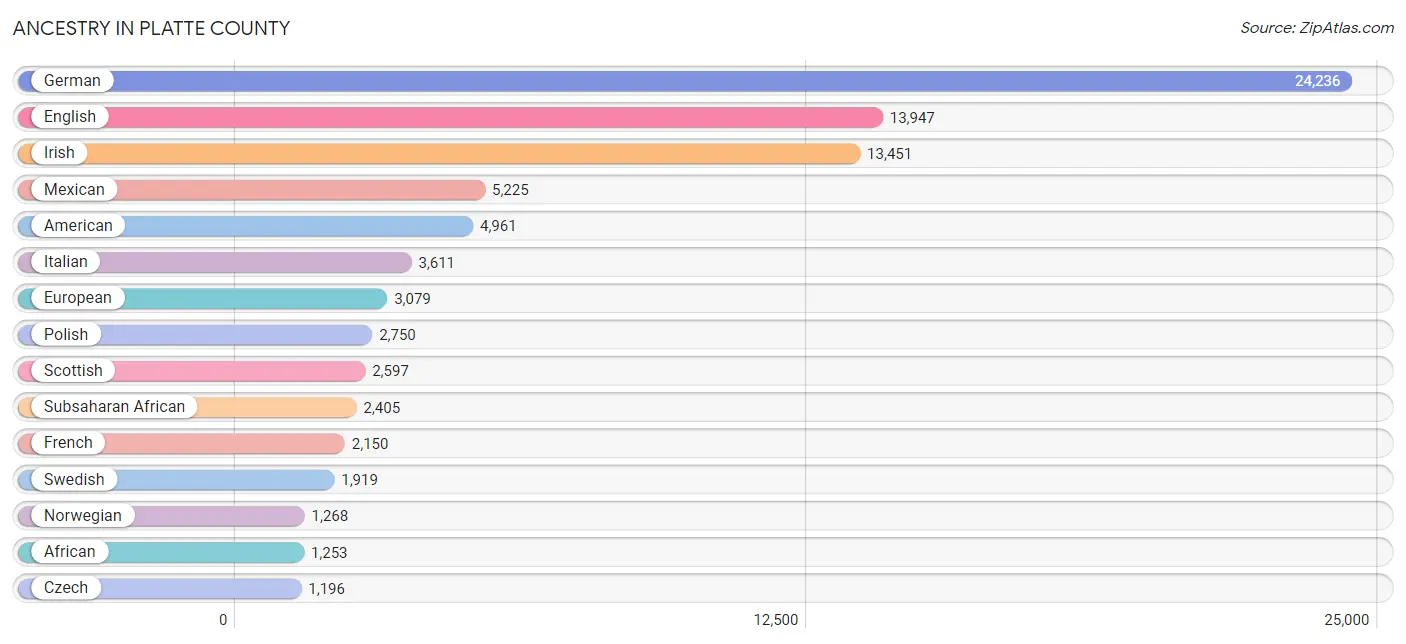
Ancestry in Platte County
The most populous ancestries reported in Platte County are German (24,236 | 22.6%), English (13,947 | 13.0%), Irish (13,451 | 12.6%), Mexican (5,225 | 4.9%), and American (4,961 | 4.6%), together accounting for 57.8% of all Platte County residents.
| Ancestry | # Population | % Population |
| African | 1,253 | 1.2% |
| Alaska Native | 8 | 0.0% |
| Albanian | 1 | 0.0% |
| Aleut | 8 | 0.0% |
| American | 4,961 | 4.6% |
| Apache | 93 | 0.1% |
| Arab | 350 | 0.3% |
| Argentinean | 35 | 0.0% |
| Armenian | 33 | 0.0% |
| Australian | 34 | 0.0% |
| Austrian | 65 | 0.1% |
| Barbadian | 10 | 0.0% |
| Belgian | 534 | 0.5% |
| Bhutanese | 284 | 0.3% |
| Blackfeet | 70 | 0.1% |
| Bolivian | 93 | 0.1% |
| British | 927 | 0.9% |
| Burmese | 493 | 0.5% |
| Canadian | 147 | 0.1% |
| Cape Verdean | 4 | 0.0% |
| Central American | 240 | 0.2% |
| Central American Indian | 51 | 0.1% |
| Cherokee | 606 | 0.6% |
| Chippewa | 36 | 0.0% |
| Choctaw | 52 | 0.1% |
| Colombian | 119 | 0.1% |
| Costa Rican | 11 | 0.0% |
| Creek | 10 | 0.0% |
| Croatian | 304 | 0.3% |
| Crow | 8 | 0.0% |
| Cuban | 42 | 0.0% |
| Czech | 1,196 | 1.1% |
| Czechoslovakian | 57 | 0.1% |
| Danish | 646 | 0.6% |
| Delaware | 4 | 0.0% |
| Dominican | 188 | 0.2% |
| Dutch | 937 | 0.9% |
| Dutch West Indian | 2 | 0.0% |
| Eastern European | 339 | 0.3% |
| Ecuadorian | 26 | 0.0% |
| Egyptian | 15 | 0.0% |
| English | 13,947 | 13.0% |
| Estonian | 1 | 0.0% |
| Ethiopian | 451 | 0.4% |
| European | 3,079 | 2.9% |
| Filipino | 21 | 0.0% |
| Finnish | 174 | 0.2% |
| French | 2,150 | 2.0% |
| French Canadian | 122 | 0.1% |
| German | 24,236 | 22.6% |
| Ghanaian | 31 | 0.0% |
| Greek | 373 | 0.4% |
| Guamanian / Chamorro | 63 | 0.1% |
| Guatemalan | 112 | 0.1% |
| Haitian | 144 | 0.1% |
| Honduran | 27 | 0.0% |
| Hungarian | 126 | 0.1% |
| Icelander | 52 | 0.1% |
| Indian (Asian) | 711 | 0.7% |
| Iranian | 62 | 0.1% |
| Iraqi | 31 | 0.0% |
| Irish | 13,451 | 12.6% |
| Iroquois | 9 | 0.0% |
| Israeli | 19 | 0.0% |
| Italian | 3,611 | 3.4% |
| Jamaican | 8 | 0.0% |
| Japanese | 41 | 0.0% |
| Kenyan | 45 | 0.0% |
| Korean | 964 | 0.9% |
| Laotian | 19 | 0.0% |
| Latvian | 3 | 0.0% |
| Lebanese | 129 | 0.1% |
| Liberian | 54 | 0.1% |
| Lithuanian | 105 | 0.1% |
| Luxembourger | 35 | 0.0% |
| Malaysian | 58 | 0.1% |
| Mexican | 5,225 | 4.9% |
| Mexican American Indian | 70 | 0.1% |
| Native Hawaiian | 273 | 0.3% |
| Navajo | 15 | 0.0% |
| Nigerian | 386 | 0.4% |
| Northern European | 214 | 0.2% |
| Norwegian | 1,268 | 1.2% |
| Osage | 7 | 0.0% |
| Ottawa | 35 | 0.0% |
| Pakistani | 69 | 0.1% |
| Panamanian | 19 | 0.0% |
| Pennsylvania German | 2 | 0.0% |
| Polish | 2,750 | 2.6% |
| Portuguese | 74 | 0.1% |
| Potawatomi | 11 | 0.0% |
| Pueblo | 12 | 0.0% |
| Puerto Rican | 476 | 0.4% |
| Romanian | 21 | 0.0% |
| Russian | 180 | 0.2% |
| Salvadoran | 71 | 0.1% |
| Samoan | 28 | 0.0% |
| Scandinavian | 478 | 0.4% |
| Scotch-Irish | 1,102 | 1.0% |
| Scottish | 2,597 | 2.4% |
| Serbian | 7 | 0.0% |
| Shoshone | 4 | 0.0% |
| Sioux | 37 | 0.0% |
| Slavic | 29 | 0.0% |
| Slovak | 37 | 0.0% |
| Slovene | 37 | 0.0% |
| Somali | 51 | 0.1% |
| South American | 593 | 0.5% |
| Spaniard | 125 | 0.1% |
| Spanish | 32 | 0.0% |
| Sri Lankan | 419 | 0.4% |
| Subsaharan African | 2,405 | 2.2% |
| Sudanese | 29 | 0.0% |
| Swedish | 1,919 | 1.8% |
| Swiss | 212 | 0.2% |
| Thai | 743 | 0.7% |
| Tlingit-Haida | 1 | 0.0% |
| Trinidadian and Tobagonian | 56 | 0.1% |
| Ugandan | 16 | 0.0% |
| Ukrainian | 46 | 0.0% |
| Uruguayan | 29 | 0.0% |
| Venezuelan | 291 | 0.3% |
| Welsh | 777 | 0.7% |
| Yugoslavian | 159 | 0.2% | View All 124 Rows |
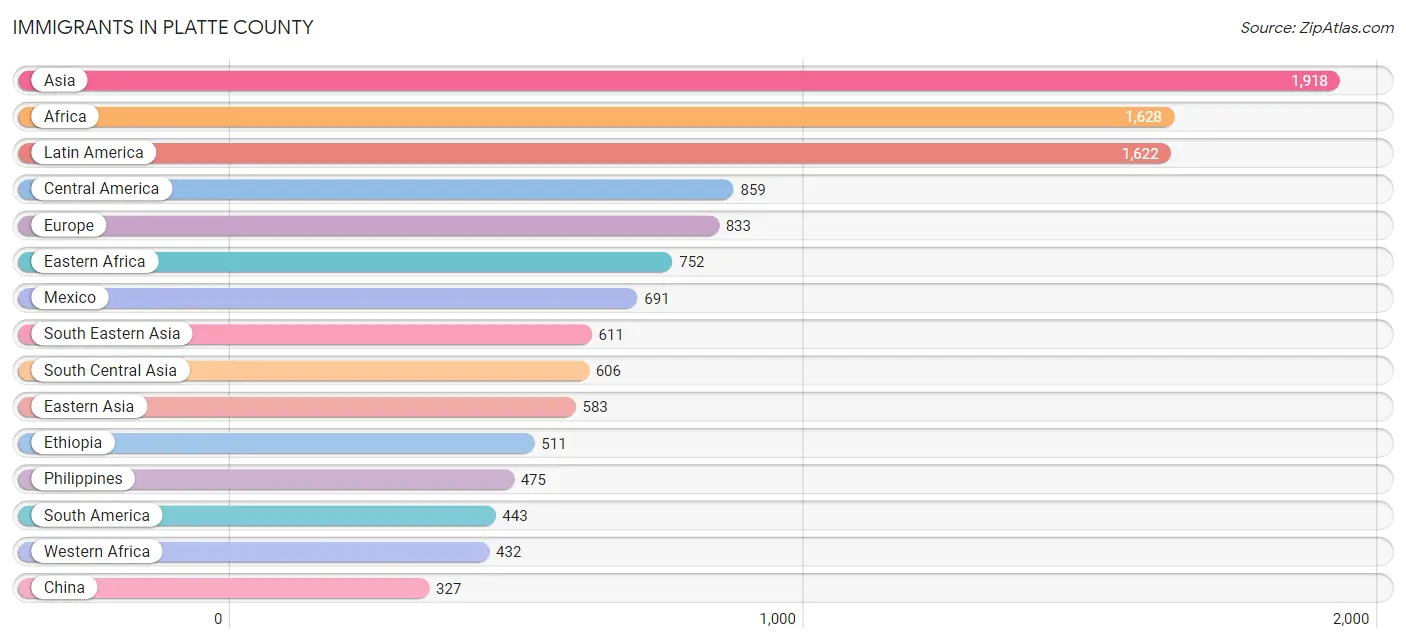
Immigrants in Platte County
The most numerous immigrant groups reported in Platte County came from Asia (1,918 | 1.8%), Africa (1,628 | 1.5%), Latin America (1,622 | 1.5%), Central America (859 | 0.8%), and Europe (833 | 0.8%), together accounting for 6.4% of all Platte County residents.
| Immigration Origin | # Population | % Population |
| Africa | 1,628 | 1.5% |
| Argentina | 31 | 0.0% |
| Asia | 1,918 | 1.8% |
| Australia | 35 | 0.0% |
| Austria | 2 | 0.0% |
| Barbados | 21 | 0.0% |
| Belgium | 1 | 0.0% |
| Bolivia | 93 | 0.1% |
| Bosnia and Herzegovina | 114 | 0.1% |
| Brazil | 21 | 0.0% |
| Cameroon | 72 | 0.1% |
| Canada | 112 | 0.1% |
| Caribbean | 320 | 0.3% |
| Central America | 859 | 0.8% |
| China | 327 | 0.3% |
| Colombia | 42 | 0.0% |
| Congo | 2 | 0.0% |
| Costa Rica | 32 | 0.0% |
| Cuba | 13 | 0.0% |
| Denmark | 11 | 0.0% |
| Dominican Republic | 180 | 0.2% |
| Eastern Africa | 752 | 0.7% |
| Eastern Asia | 583 | 0.5% |
| Eastern Europe | 304 | 0.3% |
| Ecuador | 2 | 0.0% |
| El Salvador | 16 | 0.0% |
| England | 159 | 0.2% |
| Eritrea | 52 | 0.1% |
| Ethiopia | 511 | 0.5% |
| Europe | 833 | 0.8% |
| Fiji | 16 | 0.0% |
| France | 1 | 0.0% |
| Germany | 189 | 0.2% |
| Ghana | 31 | 0.0% |
| Guatemala | 69 | 0.1% |
| Haiti | 82 | 0.1% |
| Honduras | 51 | 0.1% |
| India | 285 | 0.3% |
| Iran | 137 | 0.1% |
| Iraq | 101 | 0.1% |
| Ireland | 2 | 0.0% |
| Italy | 44 | 0.0% |
| Jamaica | 8 | 0.0% |
| Japan | 90 | 0.1% |
| Kazakhstan | 4 | 0.0% |
| Kenya | 11 | 0.0% |
| Korea | 166 | 0.2% |
| Latin America | 1,622 | 1.5% |
| Liberia | 85 | 0.1% |
| Malaysia | 2 | 0.0% |
| Mexico | 691 | 0.6% |
| Micronesia | 148 | 0.1% |
| Middle Africa | 74 | 0.1% |
| Nepal | 114 | 0.1% |
| Netherlands | 3 | 0.0% |
| Nigeria | 264 | 0.3% |
| Northern Africa | 90 | 0.1% |
| Northern Europe | 248 | 0.2% |
| Oceania | 199 | 0.2% |
| Pakistan | 66 | 0.1% |
| Philippines | 475 | 0.4% |
| Poland | 94 | 0.1% |
| Portugal | 18 | 0.0% |
| Romania | 21 | 0.0% |
| Russia | 35 | 0.0% |
| Saudi Arabia | 10 | 0.0% |
| Sierra Leone | 37 | 0.0% |
| Somalia | 114 | 0.1% |
| South Africa | 3 | 0.0% |
| South America | 443 | 0.4% |
| South Central Asia | 606 | 0.6% |
| South Eastern Asia | 611 | 0.6% |
| Southern Europe | 85 | 0.1% |
| Spain | 23 | 0.0% |
| Sudan | 60 | 0.1% |
| Sweden | 26 | 0.0% |
| Taiwan | 98 | 0.1% |
| Thailand | 36 | 0.0% |
| Trinidad and Tobago | 16 | 0.0% |
| Uganda | 16 | 0.0% |
| Ukraine | 11 | 0.0% |
| Uruguay | 29 | 0.0% |
| Venezuela | 225 | 0.2% |
| Vietnam | 98 | 0.1% |
| Western Africa | 432 | 0.4% |
| Western Asia | 111 | 0.1% |
| Western Europe | 196 | 0.2% |
| Zimbabwe | 13 | 0.0% | View All 88 Rows |
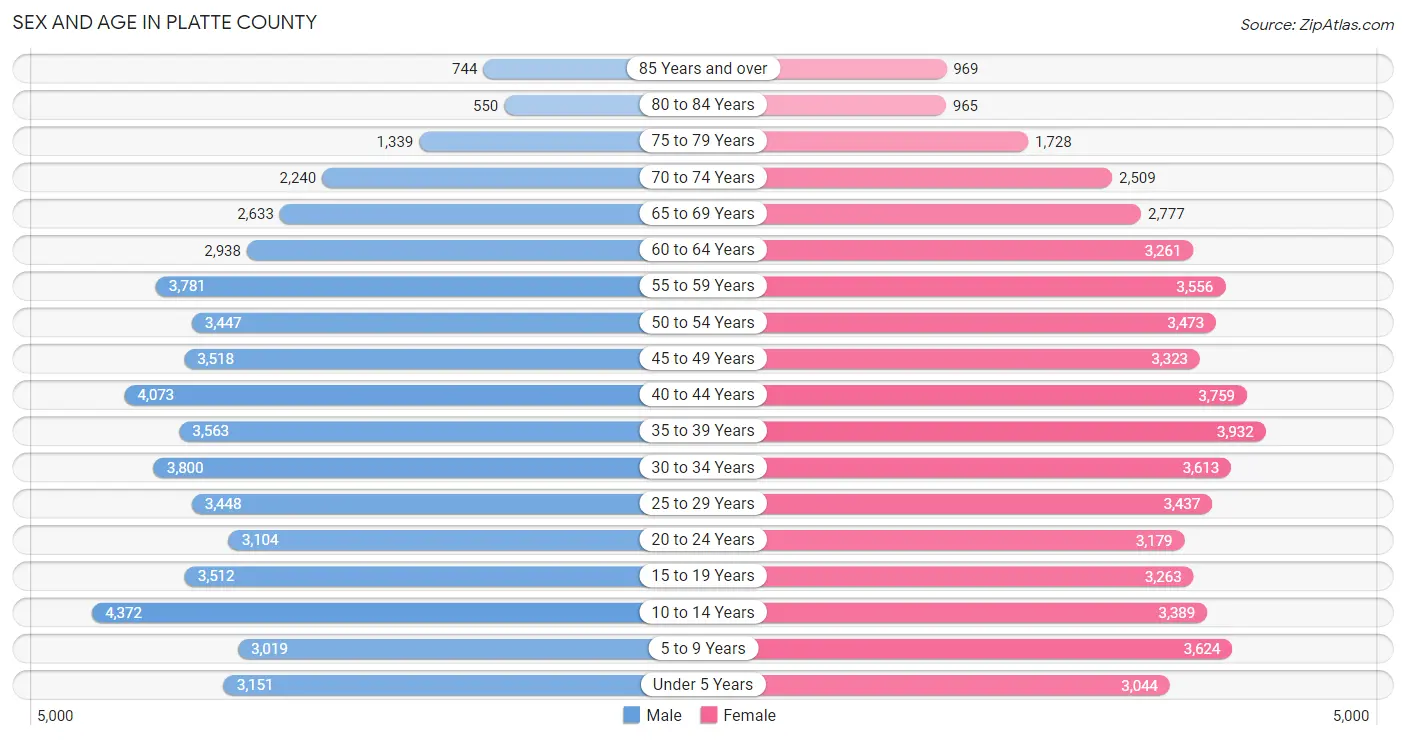
Sex and Age in Platte County
Sex and Age in Platte County
The most populous age groups in Platte County are 10 to 14 Years (4,372 | 8.2%) for men and 35 to 39 Years (3,932 | 7.3%) for women.
| Age Bracket | Male | Female |
| Under 5 Years | 3,151 (5.9%) | 3,044 (5.7%) |
| 5 to 9 Years | 3,019 (5.7%) | 3,624 (6.7%) |
| 10 to 14 Years | 4,372 (8.2%) | 3,389 (6.3%) |
| 15 to 19 Years | 3,512 (6.6%) | 3,263 (6.1%) |
| 20 to 24 Years | 3,104 (5.8%) | 3,179 (5.9%) |
| 25 to 29 Years | 3,448 (6.5%) | 3,437 (6.4%) |
| 30 to 34 Years | 3,800 (7.1%) | 3,613 (6.7%) |
| 35 to 39 Years | 3,563 (6.7%) | 3,932 (7.3%) |
| 40 to 44 Years | 4,073 (7.6%) | 3,759 (7.0%) |
| 45 to 49 Years | 3,518 (6.6%) | 3,323 (6.2%) |
| 50 to 54 Years | 3,447 (6.5%) | 3,473 (6.5%) |
| 55 to 59 Years | 3,781 (7.1%) | 3,556 (6.6%) |
| 60 to 64 Years | 2,938 (5.5%) | 3,261 (6.1%) |
| 65 to 69 Years | 2,633 (5.0%) | 2,777 (5.2%) |
| 70 to 74 Years | 2,240 (4.2%) | 2,509 (4.7%) |
| 75 to 79 Years | 1,339 (2.5%) | 1,728 (3.2%) |
| 80 to 84 Years | 550 (1.0%) | 965 (1.8%) |
| 85 Years and over | 744 (1.4%) | 969 (1.8%) |
| Total | 53,232 (100.0%) | 53,801 (100.0%) |
Families and Households in Platte County
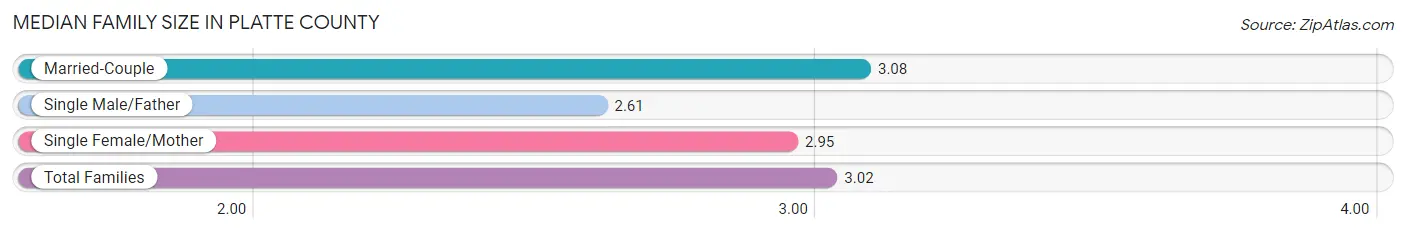
Median Family Size in Platte County
The median family size in Platte County is 3.02 persons per family, with married-couple families (22,357 | 78.6%) accounting for the largest median family size of 3.08 persons per family. On the other hand, single male/father families (2,119 | 7.4%) represent the smallest median family size with 2.61 persons per family.
| Family Type | # Families | Family Size |
| Married-Couple | 22,357 (78.6%) | 3.08 |
| Single Male/Father | 2,119 (7.4%) | 2.61 |
| Single Female/Mother | 3,951 (13.9%) | 2.95 |
| Total Families | 28,427 (100.0%) | 3.02 |
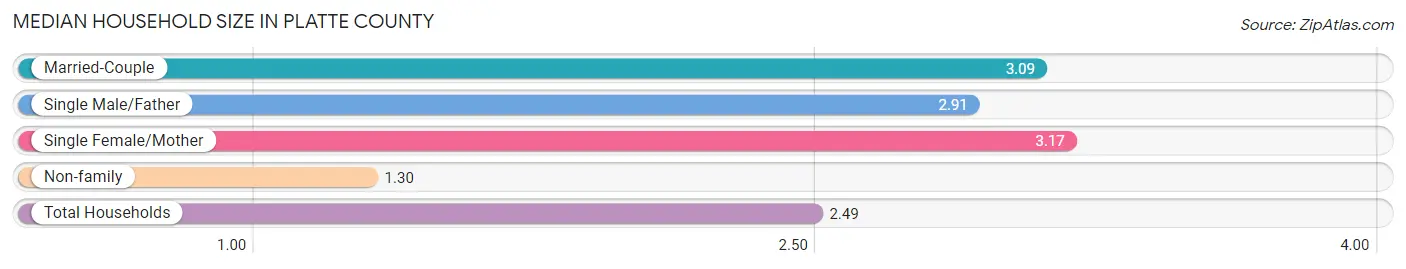
Median Household Size in Platte County
The median household size in Platte County is 2.49 persons per household, with single female/mother households (3,951 | 9.3%) accounting for the largest median household size of 3.17 persons per household. non-family households (14,179 | 33.3%) represent the smallest median household size with 1.30 persons per household.
| Household Type | # Households | Household Size |
| Married-Couple | 22,357 (52.5%) | 3.09 |
| Single Male/Father | 2,119 (5.0%) | 2.91 |
| Single Female/Mother | 3,951 (9.3%) | 3.17 |
| Non-family | 14,179 (33.3%) | 1.30 |
| Total Households | 42,606 (100.0%) | 2.49 |
Household Size by Marriage Status in Platte County
Out of a total of 42,606 households in Platte County, 28,427 (66.7%) are family households, while 14,179 (33.3%) are nonfamily households. The most numerous type of family households are 2-person households, comprising 12,493, and the most common type of nonfamily households are 1-person households, comprising 10,616.
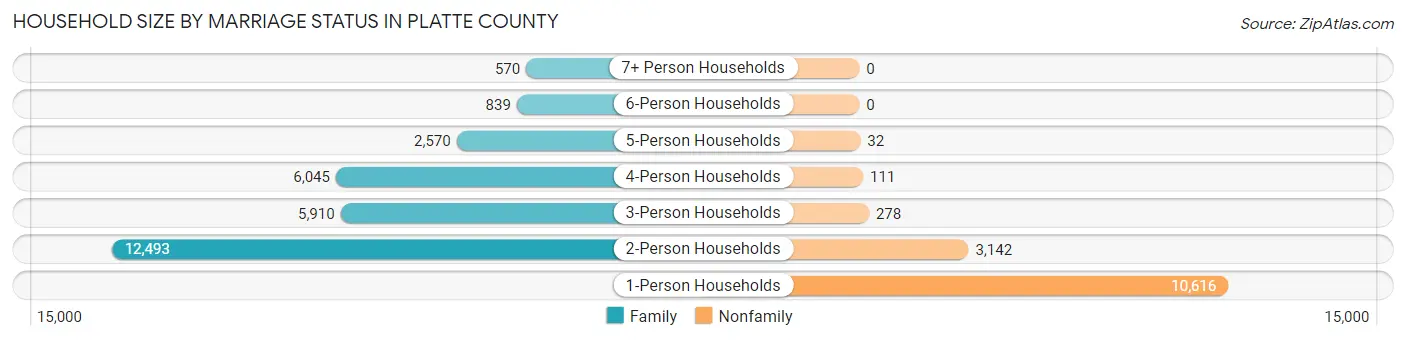
| Household Size | Family Households | Nonfamily Households |
| 1-Person Households | - | 10,616 (24.9%) |
| 2-Person Households | 12,493 (29.3%) | 3,142 (7.4%) |
| 3-Person Households | 5,910 (13.9%) | 278 (0.6%) |
| 4-Person Households | 6,045 (14.2%) | 111 (0.3%) |
| 5-Person Households | 2,570 (6.0%) | 32 (0.1%) |
| 6-Person Households | 839 (2.0%) | 0 (0.0%) |
| 7+ Person Households | 570 (1.3%) | 0 (0.0%) |
| Total | 28,427 (66.7%) | 14,179 (33.3%) |
Female Fertility in Platte County
Fertility by Age in Platte County
Average fertility rate in Platte County is 58.0 births per 1,000 women. Women in the age bracket of 20 to 34 years have the highest fertility rate with 88.0 births per 1,000 women. Women in the age bracket of 20 to 34 years acount for 62.7% of all women with births.
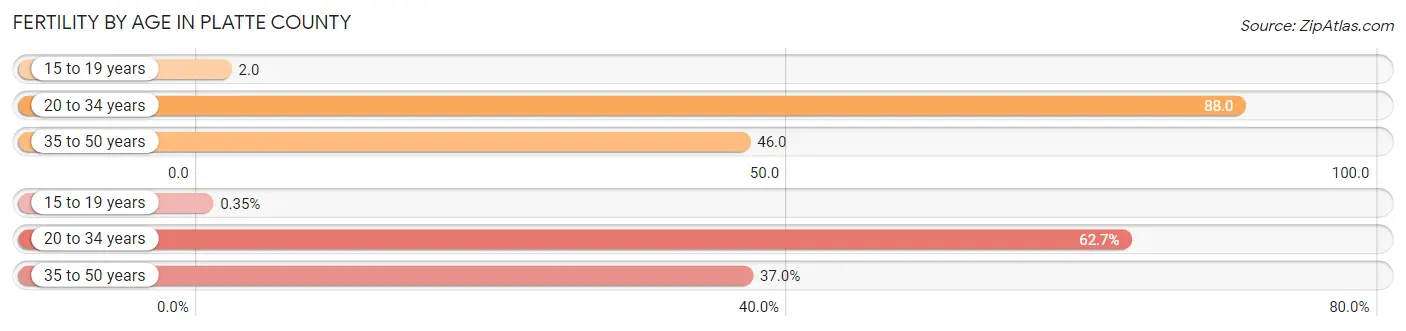
| Age Bracket | Women with Births | Births / 1,000 Women |
| 15 to 19 years | 5 (0.4%) | 2.0 |
| 20 to 34 years | 903 (62.7%) | 88.0 |
| 35 to 50 years | 533 (37.0%) | 46.0 |
| Total | 1,441 (100.0%) | 58.0 |
Fertility by Age by Marriage Status in Platte County
79.6% of women with births (1,441) in Platte County are married. The highest percentage of unmarried women with births falls into 20 to 34 years age bracket with 23.0% of them unmarried at the time of birth, while the lowest percentage of unmarried women with births belong to 15 to 19 years age bracket with 0.0% of them unmarried.
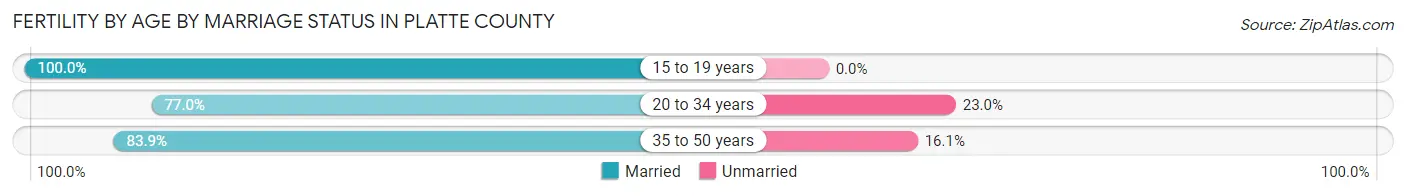
| Age Bracket | Married | Unmarried |
| 15 to 19 years | 5 (100.0%) | 0 (0.0%) |
| 20 to 34 years | 695 (77.0%) | 208 (23.0%) |
| 35 to 50 years | 447 (83.9%) | 86 (16.1%) |
| Total | 1,147 (79.6%) | 294 (20.4%) |
Fertility by Education in Platte County
Average fertility rate in Platte County is 58.0 births per 1,000 women. Women with the education attainment of bachelor's degree have the highest fertility rate of 81.0 births per 1,000 women, while women with the education attainment of less than high school have the lowest fertility at 30.0 births per 1,000 women. Women with the education attainment of bachelor's degree represent 37.8% of all women with births.
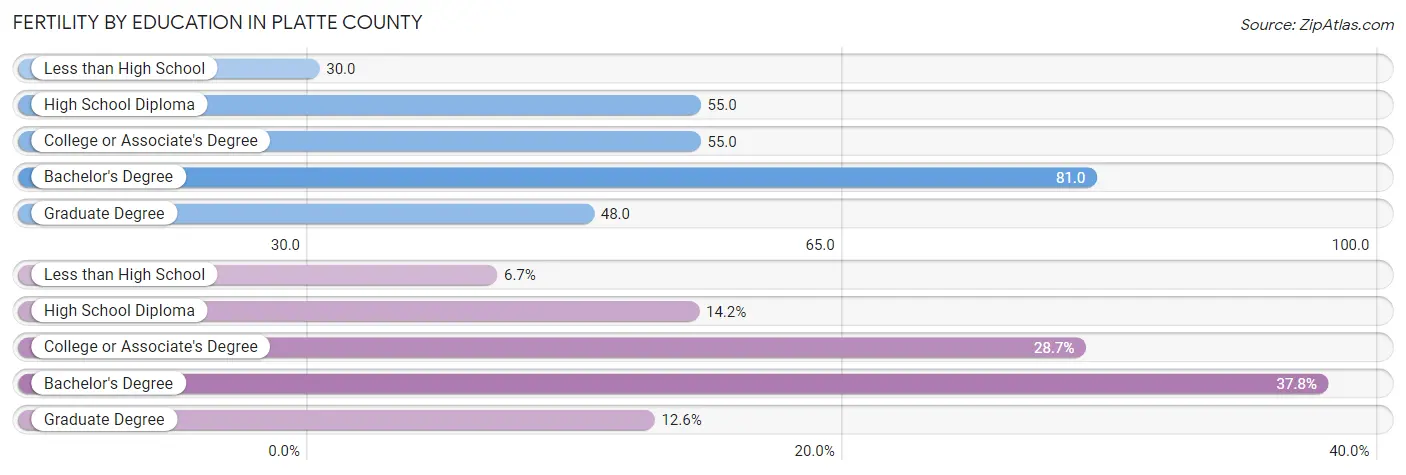
| Educational Attainment | Women with Births | Births / 1,000 Women |
| Less than High School | 96 (6.7%) | 30.0 |
| High School Diploma | 205 (14.2%) | 55.0 |
| College or Associate's Degree | 414 (28.7%) | 55.0 |
| Bachelor's Degree | 545 (37.8%) | 81.0 |
| Graduate Degree | 181 (12.6%) | 48.0 |
| Total | 1,441 (100.0%) | 58.0 |
Fertility by Education by Marriage Status in Platte County
20.4% of women with births in Platte County are unmarried. Women with the educational attainment of graduate degree are most likely to be married with 100.0% of them married at childbirth, while women with the educational attainment of high school diploma are least likely to be married with 45.4% of them unmarried at childbirth.
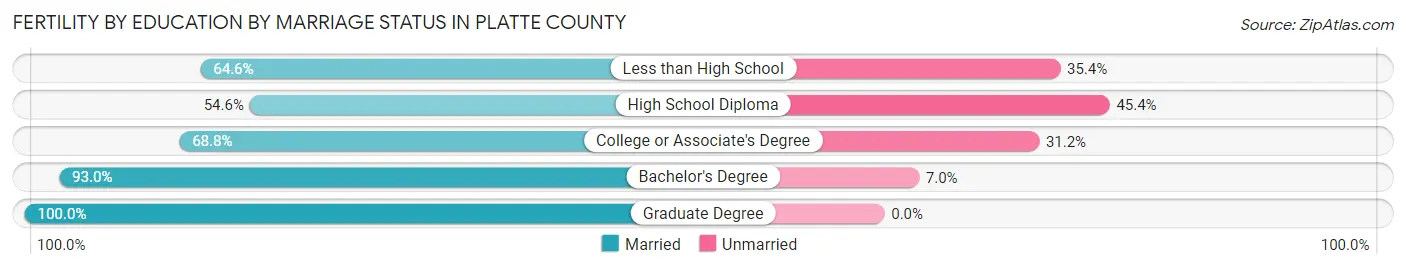
| Educational Attainment | Married | Unmarried |
| Less than High School | 62 (64.6%) | 34 (35.4%) |
| High School Diploma | 112 (54.6%) | 93 (45.4%) |
| College or Associate's Degree | 285 (68.8%) | 129 (31.2%) |
| Bachelor's Degree | 507 (93.0%) | 38 (7.0%) |
| Graduate Degree | 181 (100.0%) | 0 (0.0%) |
| Total | 1,147 (79.6%) | 294 (20.4%) |
Employment Characteristics in Platte County
Employment by Class of Employer in Platte County
Among the 56,479 employed individuals in Platte County, private company employees (38,931 | 68.9%), not-for-profit organizations (5,444 | 9.6%), and local government employees (3,503 | 6.2%) make up the most common classes of employment.
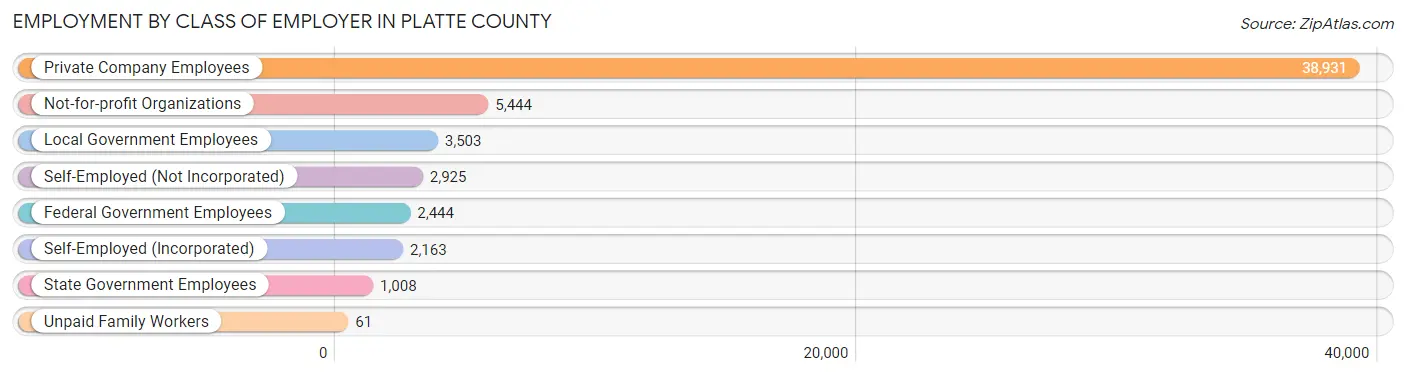
| Employer Class | # Employees | % Employees |
| Private Company Employees | 38,931 | 68.9% |
| Self-Employed (Incorporated) | 2,163 | 3.8% |
| Self-Employed (Not Incorporated) | 2,925 | 5.2% |
| Not-for-profit Organizations | 5,444 | 9.6% |
| Local Government Employees | 3,503 | 6.2% |
| State Government Employees | 1,008 | 1.8% |
| Federal Government Employees | 2,444 | 4.3% |
| Unpaid Family Workers | 61 | 0.1% |
| Total | 56,479 | 100.0% |
Employment Status by Age in Platte County
According to the labor force statistics for Platte County, out of the total population over 16 years of age (84,652), 70.2% or 59,426 individuals are in the labor force, with 3.6% or 2,139 of them unemployed. The age group with the highest labor force participation rate is 30 to 34 years, with 88.6% or 6,568 individuals in the labor force. Within the labor force, the 20 to 24 years age range has the highest percentage of unemployed individuals, with 8.1% or 410 of them being unemployed.
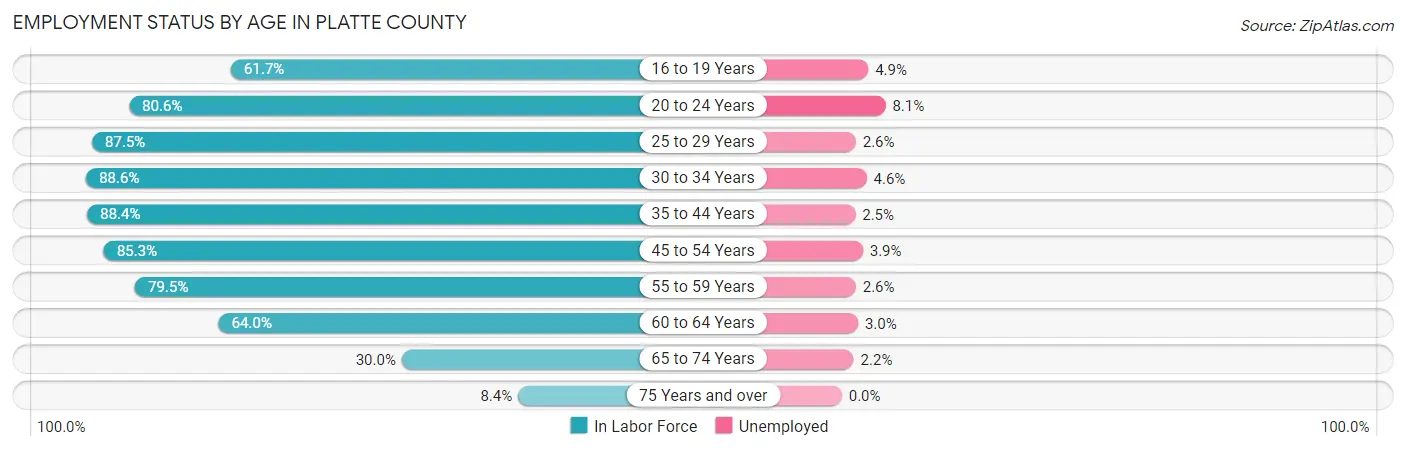
| Age Bracket | In Labor Force | Unemployed |
| 16 to 19 Years | 3,081 (61.7%) | 151 (4.9%) |
| 20 to 24 Years | 5,064 (80.6%) | 410 (8.1%) |
| 25 to 29 Years | 6,024 (87.5%) | 157 (2.6%) |
| 30 to 34 Years | 6,568 (88.6%) | 302 (4.6%) |
| 35 to 44 Years | 13,549 (88.4%) | 339 (2.5%) |
| 45 to 54 Years | 11,738 (85.3%) | 458 (3.9%) |
| 55 to 59 Years | 5,833 (79.5%) | 152 (2.6%) |
| 60 to 64 Years | 3,967 (64.0%) | 119 (3.0%) |
| 65 to 74 Years | 3,048 (30.0%) | 67 (2.2%) |
| 75 Years and over | 529 (8.4%) | 0 (0.0%) |
| Total | 59,426 (70.2%) | 2,139 (3.6%) |
Employment Status by Educational Attainment in Platte County
According to labor force statistics for Platte County, 83.8% of individuals (47,701) out of the total population between 25 and 64 years of age (56,922) are in the labor force, with 3.2% or 1,526 of them being unemployed. The group with the highest labor force participation rate are those with the educational attainment of bachelor's degree or higher, with 88.4% or 23,731 individuals in the labor force. Within the labor force, individuals with less than high school education have the highest percentage of unemployment, with 9.0% or 129 of them being unemployed.
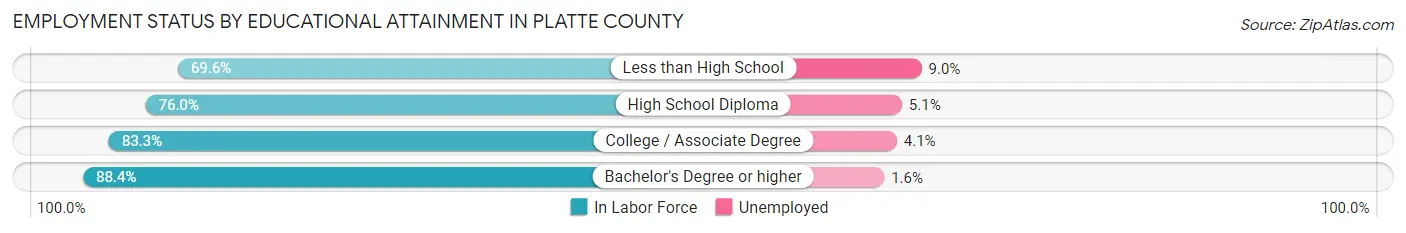
| Educational Attainment | In Labor Force | Unemployed |
| Less than High School | 1,429 (69.6%) | 185 (9.0%) |
| High School Diploma | 8,267 (76.0%) | 555 (5.1%) |
| College / Associate Degree | 14,283 (83.3%) | 703 (4.1%) |
| Bachelor's Degree or higher | 23,731 (88.4%) | 430 (1.6%) |
| Total | 47,701 (83.8%) | 1,822 (3.2%) |
Employment Occupations by Sex in Platte County
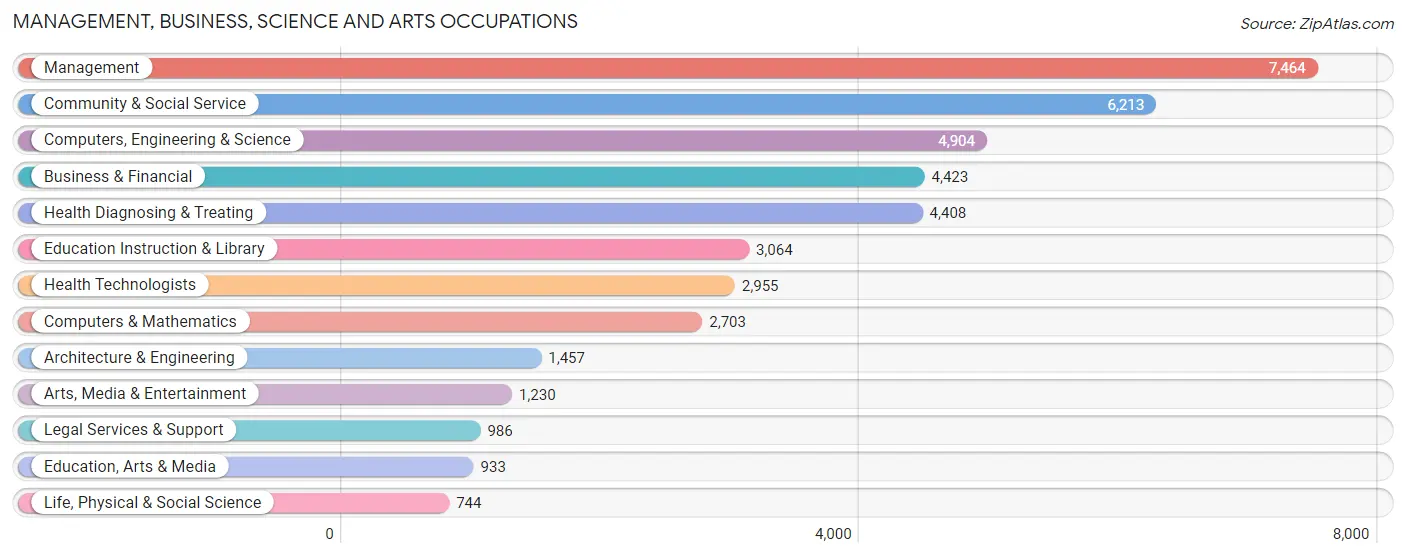
Management, Business, Science and Arts Occupations
The most common Management, Business, Science and Arts occupations in Platte County are Management (7,464 | 13.2%), Community & Social Service (6,213 | 11.0%), Computers, Engineering & Science (4,904 | 8.6%), Business & Financial (4,423 | 7.8%), and Health Diagnosing & Treating (4,408 | 7.8%).
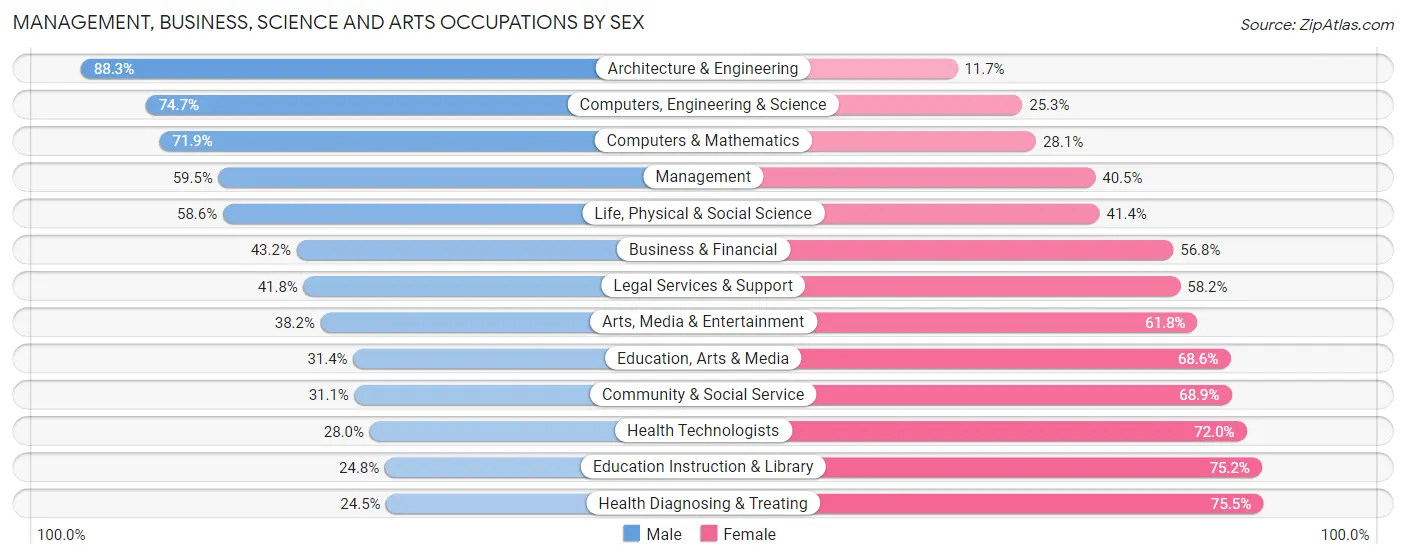
Management, Business, Science and Arts Occupations by Sex
Within the Management, Business, Science and Arts occupations in Platte County, the most male-oriented occupations are Architecture & Engineering (88.3%), Computers, Engineering & Science (74.7%), and Computers & Mathematics (71.9%), while the most female-oriented occupations are Health Diagnosing & Treating (75.5%), Education Instruction & Library (75.2%), and Health Technologists (72.0%).
| Occupation | Male | Female |
| Management | 4,442 (59.5%) | 3,022 (40.5%) |
| Business & Financial | 1,912 (43.2%) | 2,511 (56.8%) |
| Computers, Engineering & Science | 3,665 (74.7%) | 1,239 (25.3%) |
| Computers & Mathematics | 1,943 (71.9%) | 760 (28.1%) |
| Architecture & Engineering | 1,286 (88.3%) | 171 (11.7%) |
| Life, Physical & Social Science | 436 (58.6%) | 308 (41.4%) |
| Community & Social Service | 1,935 (31.1%) | 4,278 (68.9%) |
| Education, Arts & Media | 293 (31.4%) | 640 (68.6%) |
| Legal Services & Support | 412 (41.8%) | 574 (58.2%) |
| Education Instruction & Library | 760 (24.8%) | 2,304 (75.2%) |
| Arts, Media & Entertainment | 470 (38.2%) | 760 (61.8%) |
| Health Diagnosing & Treating | 1,081 (24.5%) | 3,327 (75.5%) |
| Health Technologists | 827 (28.0%) | 2,128 (72.0%) |
| Total (Category) | 13,035 (47.5%) | 14,377 (52.4%) |
| Total (Overall) | 29,626 (52.2%) | 27,072 (47.7%) |
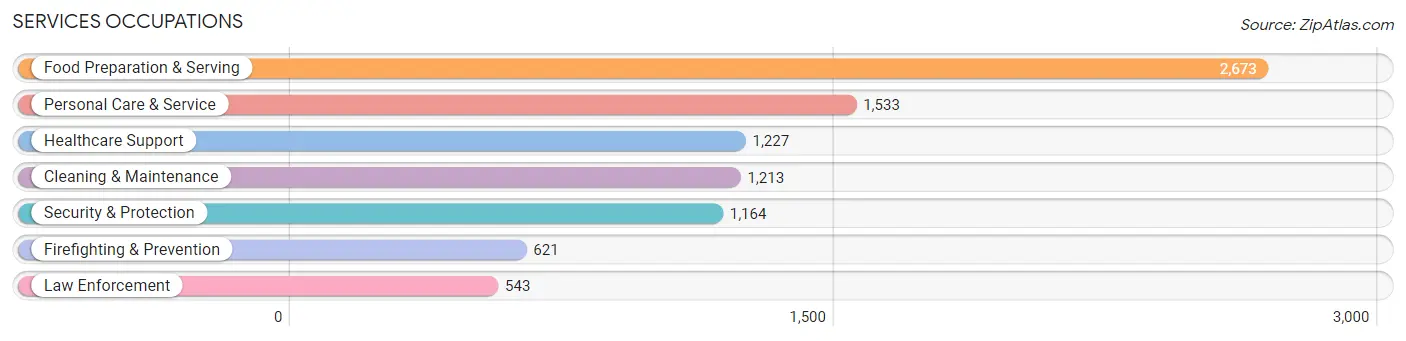
Services Occupations
The most common Services occupations in Platte County are Food Preparation & Serving (2,673 | 4.7%), Personal Care & Service (1,533 | 2.7%), Healthcare Support (1,227 | 2.2%), Cleaning & Maintenance (1,213 | 2.1%), and Security & Protection (1,164 | 2.1%).
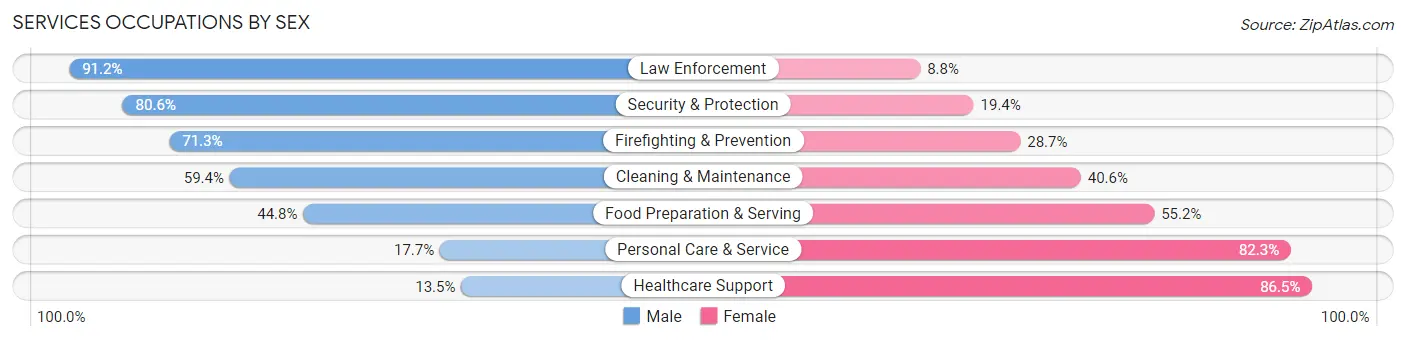
Services Occupations by Sex
Within the Services occupations in Platte County, the most male-oriented occupations are Law Enforcement (91.2%), Security & Protection (80.6%), and Firefighting & Prevention (71.3%), while the most female-oriented occupations are Healthcare Support (86.5%), Personal Care & Service (82.3%), and Food Preparation & Serving (55.2%).
| Occupation | Male | Female |
| Healthcare Support | 166 (13.5%) | 1,061 (86.5%) |
| Security & Protection | 938 (80.6%) | 226 (19.4%) |
| Firefighting & Prevention | 443 (71.3%) | 178 (28.7%) |
| Law Enforcement | 495 (91.2%) | 48 (8.8%) |
| Food Preparation & Serving | 1,198 (44.8%) | 1,475 (55.2%) |
| Cleaning & Maintenance | 720 (59.4%) | 493 (40.6%) |
| Personal Care & Service | 272 (17.7%) | 1,261 (82.3%) |
| Total (Category) | 3,294 (42.2%) | 4,516 (57.8%) |
| Total (Overall) | 29,626 (52.2%) | 27,072 (47.7%) |
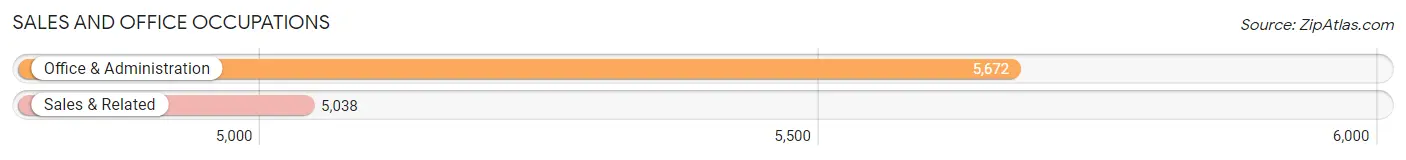
Sales and Office Occupations
The most common Sales and Office occupations in Platte County are Office & Administration (5,672 | 10.0%), and Sales & Related (5,038 | 8.9%).
Sales and Office Occupations by Sex
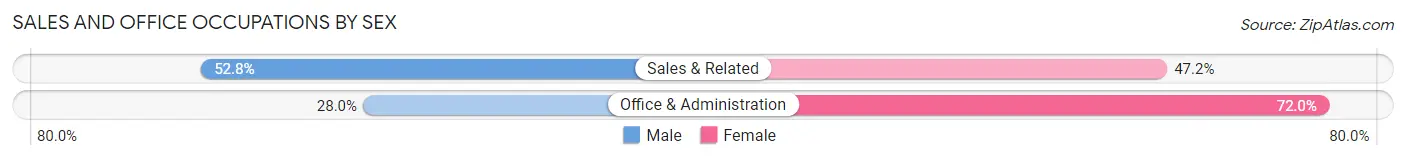
| Occupation | Male | Female |
| Sales & Related | 2,661 (52.8%) | 2,377 (47.2%) |
| Office & Administration | 1,586 (28.0%) | 4,086 (72.0%) |
| Total (Category) | 4,247 (39.7%) | 6,463 (60.4%) |
| Total (Overall) | 29,626 (52.2%) | 27,072 (47.7%) |
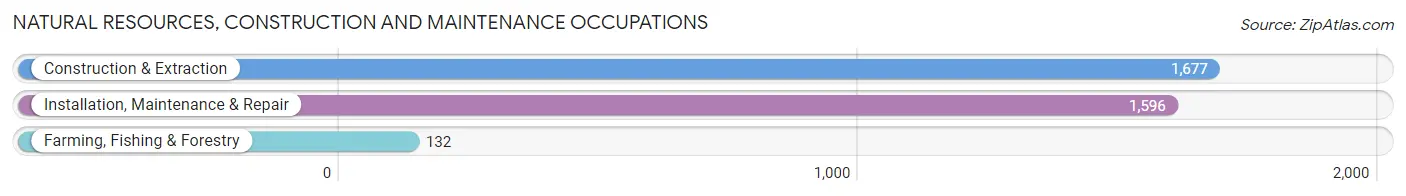
Natural Resources, Construction and Maintenance Occupations
The most common Natural Resources, Construction and Maintenance occupations in Platte County are Construction & Extraction (1,677 | 3.0%), Installation, Maintenance & Repair (1,596 | 2.8%), and Farming, Fishing & Forestry (132 | 0.2%).
Natural Resources, Construction and Maintenance Occupations by Sex
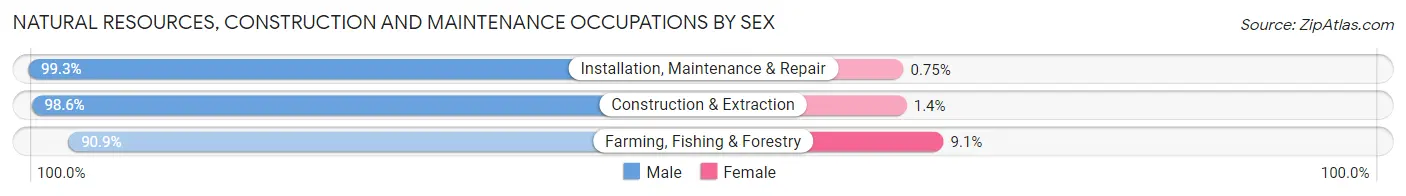
| Occupation | Male | Female |
| Farming, Fishing & Forestry | 120 (90.9%) | 12 (9.1%) |
| Construction & Extraction | 1,653 (98.6%) | 24 (1.4%) |
| Installation, Maintenance & Repair | 1,584 (99.3%) | 12 (0.7%) |
| Total (Category) | 3,357 (98.6%) | 48 (1.4%) |
| Total (Overall) | 29,626 (52.2%) | 27,072 (47.7%) |
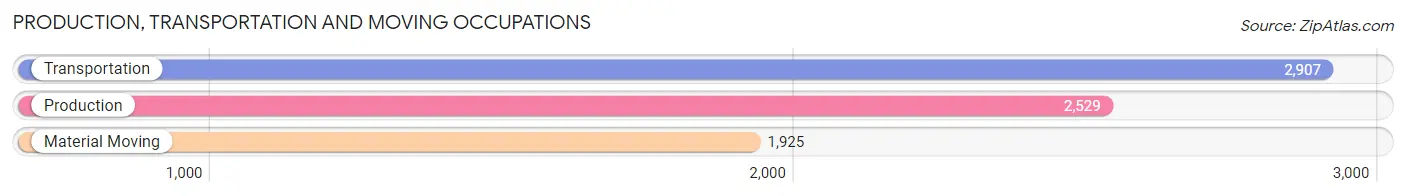
Production, Transportation and Moving Occupations
The most common Production, Transportation and Moving occupations in Platte County are Transportation (2,907 | 5.1%), Production (2,529 | 4.5%), and Material Moving (1,925 | 3.4%).
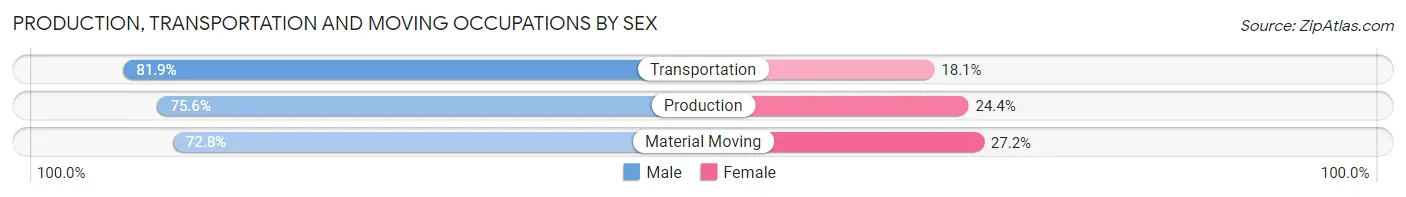
Production, Transportation and Moving Occupations by Sex
| Occupation | Male | Female |
| Production | 1,912 (75.6%) | 617 (24.4%) |
| Transportation | 2,380 (81.9%) | 527 (18.1%) |
| Material Moving | 1,401 (72.8%) | 524 (27.2%) |
| Total (Category) | 5,693 (77.3%) | 1,668 (22.7%) |
| Total (Overall) | 29,626 (52.2%) | 27,072 (47.7%) |
Employment Industries by Sex in Platte County
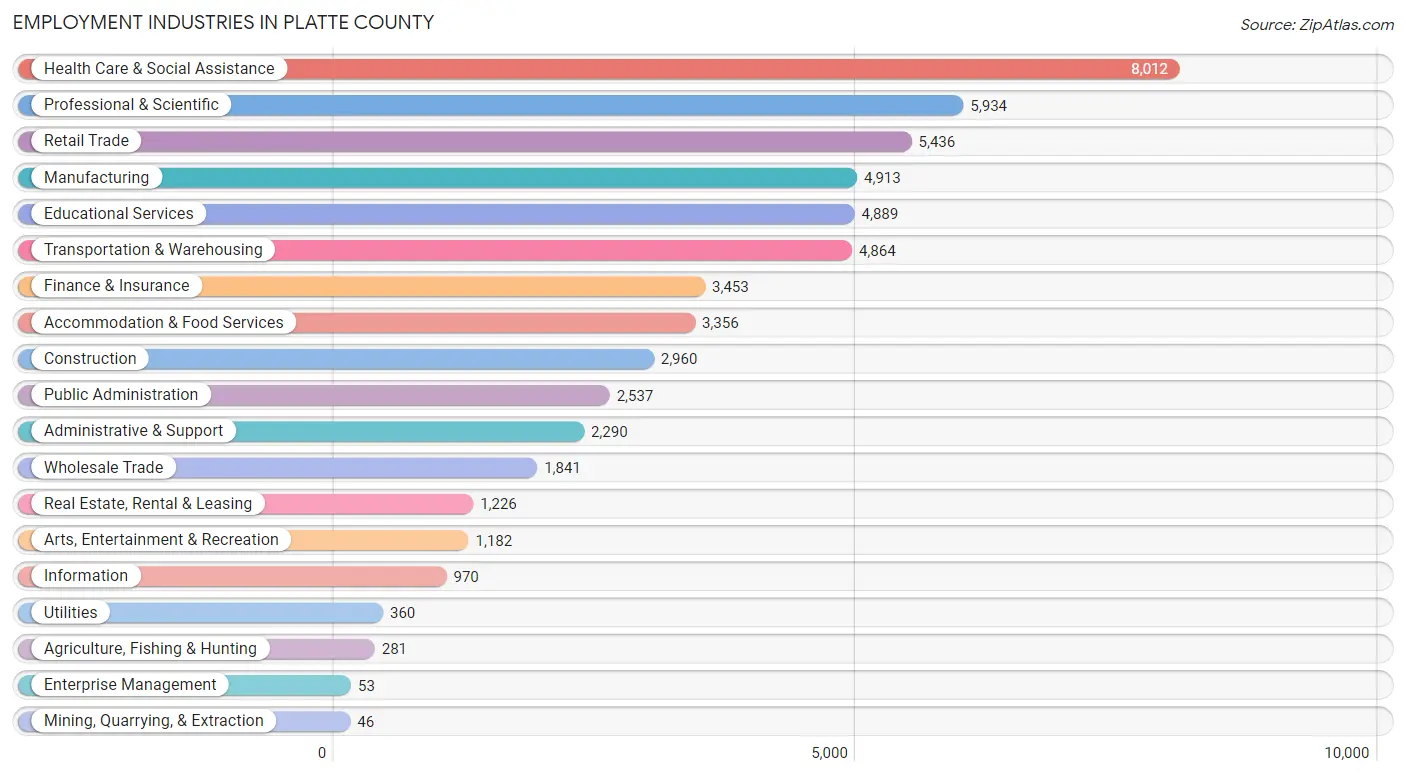
Employment Industries in Platte County
The major employment industries in Platte County include Health Care & Social Assistance (8,012 | 14.1%), Professional & Scientific (5,934 | 10.5%), Retail Trade (5,436 | 9.6%), Manufacturing (4,913 | 8.7%), and Educational Services (4,889 | 8.6%).
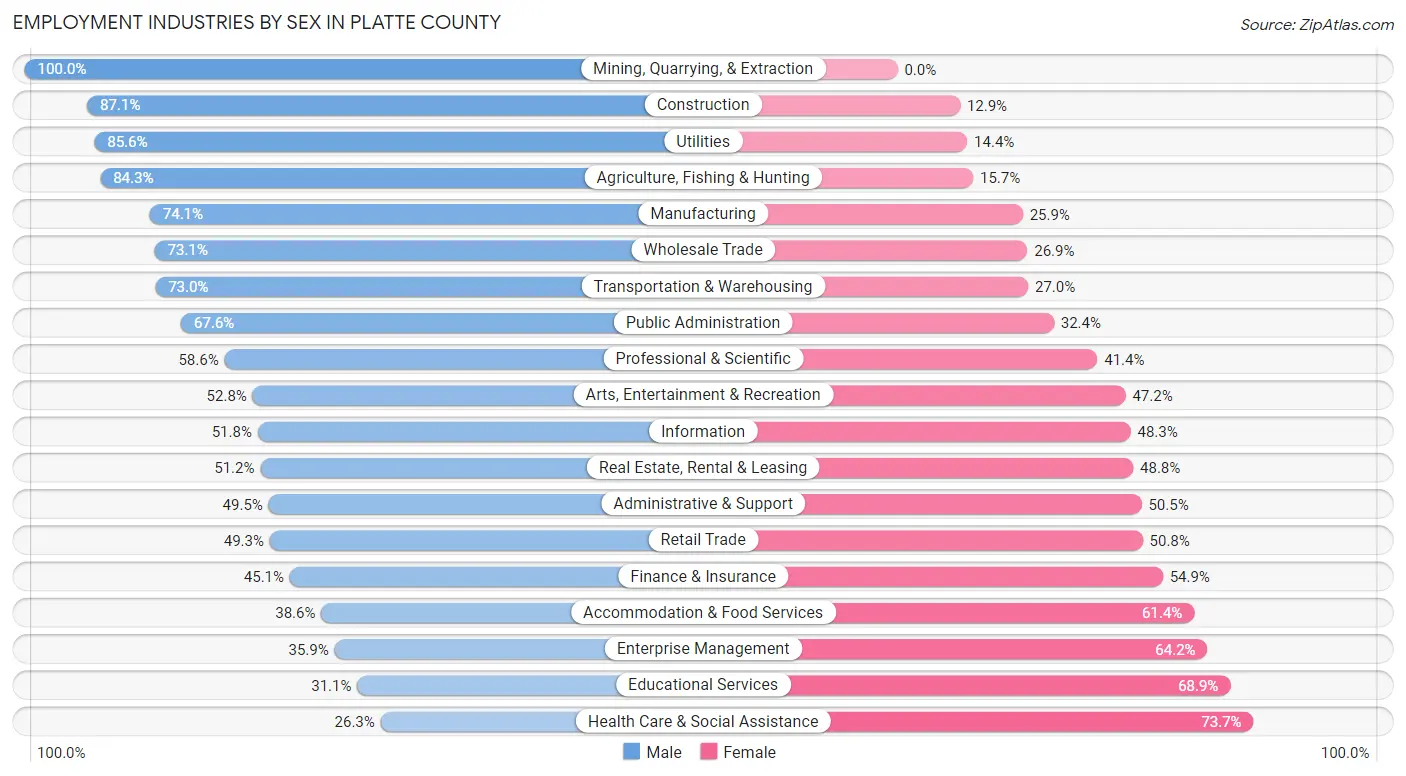
Employment Industries by Sex in Platte County
The Platte County industries that see more men than women are Mining, Quarrying, & Extraction (100.0%), Construction (87.1%), and Utilities (85.6%), whereas the industries that tend to have a higher number of women are Health Care & Social Assistance (73.7%), Educational Services (68.9%), and Enterprise Management (64.1%).
| Industry | Male | Female |
| Agriculture, Fishing & Hunting | 237 (84.3%) | 44 (15.7%) |
| Mining, Quarrying, & Extraction | 46 (100.0%) | 0 (0.0%) |
| Construction | 2,577 (87.1%) | 383 (12.9%) |
| Manufacturing | 3,639 (74.1%) | 1,274 (25.9%) |
| Wholesale Trade | 1,346 (73.1%) | 495 (26.9%) |
| Retail Trade | 2,677 (49.2%) | 2,759 (50.7%) |
| Transportation & Warehousing | 3,549 (73.0%) | 1,315 (27.0%) |
| Utilities | 308 (85.6%) | 52 (14.4%) |
| Information | 502 (51.7%) | 468 (48.2%) |
| Finance & Insurance | 1,557 (45.1%) | 1,896 (54.9%) |
| Real Estate, Rental & Leasing | 628 (51.2%) | 598 (48.8%) |
| Professional & Scientific | 3,479 (58.6%) | 2,455 (41.4%) |
| Enterprise Management | 19 (35.8%) | 34 (64.1%) |
| Administrative & Support | 1,133 (49.5%) | 1,157 (50.5%) |
| Educational Services | 1,522 (31.1%) | 3,367 (68.9%) |
| Health Care & Social Assistance | 2,108 (26.3%) | 5,904 (73.7%) |
| Arts, Entertainment & Recreation | 624 (52.8%) | 558 (47.2%) |
| Accommodation & Food Services | 1,295 (38.6%) | 2,061 (61.4%) |
| Public Administration | 1,716 (67.6%) | 821 (32.4%) |
| Total | 29,626 (52.2%) | 27,072 (47.7%) |
Education in Platte County
School Enrollment in Platte County
The most common levels of schooling among the 26,515 students in Platte County are middle school (6,239 | 23.5%), high school (5,631 | 21.2%), and elementary school (5,102 | 19.2%).
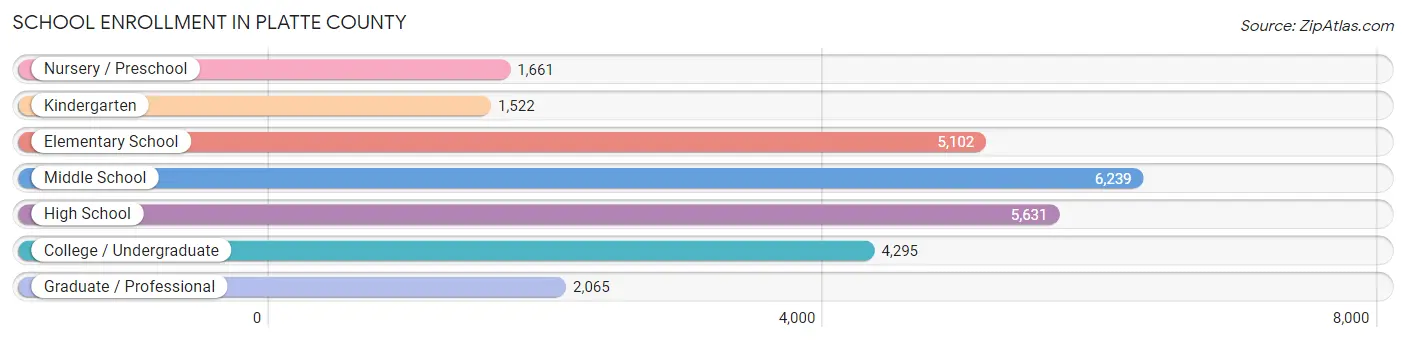
| School Level | # Students | % Students |
| Nursery / Preschool | 1,661 | 6.3% |
| Kindergarten | 1,522 | 5.7% |
| Elementary School | 5,102 | 19.2% |
| Middle School | 6,239 | 23.5% |
| High School | 5,631 | 21.2% |
| College / Undergraduate | 4,295 | 16.2% |
| Graduate / Professional | 2,065 | 7.8% |
| Total | 26,515 | 100.0% |
School Enrollment by Age by Funding Source in Platte County
Out of a total of 26,515 students who are enrolled in schools in Platte County, 4,534 (17.1%) attend a private institution, while the remaining 21,981 (82.9%) are enrolled in public schools. The age group of 25 to 34 year olds has the highest likelihood of being enrolled in private schools, with 566 (36.1% in the age bracket) enrolled. Conversely, the age group of 15 to 17 year olds has the lowest likelihood of being enrolled in a private school, with 3,925 (91.8% in the age bracket) attending a public institution.
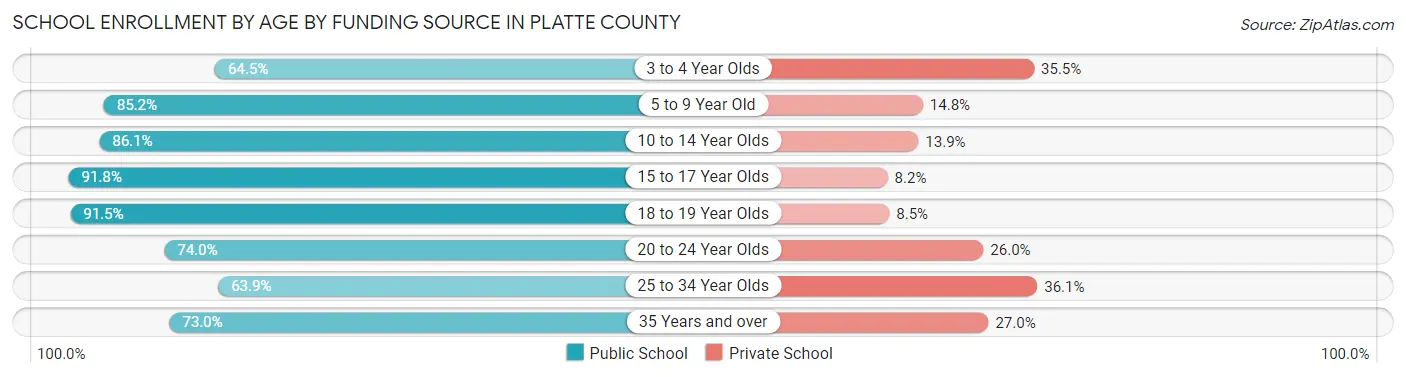
| Age Bracket | Public School | Private School |
| 3 to 4 Year Olds | 844 (64.5%) | 464 (35.5%) |
| 5 to 9 Year Old | 5,231 (85.2%) | 906 (14.8%) |
| 10 to 14 Year Olds | 6,472 (86.1%) | 1,047 (13.9%) |
| 15 to 17 Year Olds | 3,925 (91.8%) | 350 (8.2%) |
| 18 to 19 Year Olds | 1,569 (91.5%) | 146 (8.5%) |
| 20 to 24 Year Olds | 1,779 (74.0%) | 626 (26.0%) |
| 25 to 34 Year Olds | 1,003 (63.9%) | 566 (36.1%) |
| 35 Years and over | 1,159 (73.0%) | 428 (27.0%) |
| Total | 21,981 (82.9%) | 4,534 (17.1%) |
Educational Attainment by Field of Study in Platte County
Business (8,668 | 24.5%), education (4,010 | 11.4%), science & technology (3,820 | 10.8%), bio, nature & agricultural (2,590 | 7.3%), and arts & humanities (2,451 | 6.9%) are the most common fields of study among 35,303 individuals in Platte County who have obtained a bachelor's degree or higher.
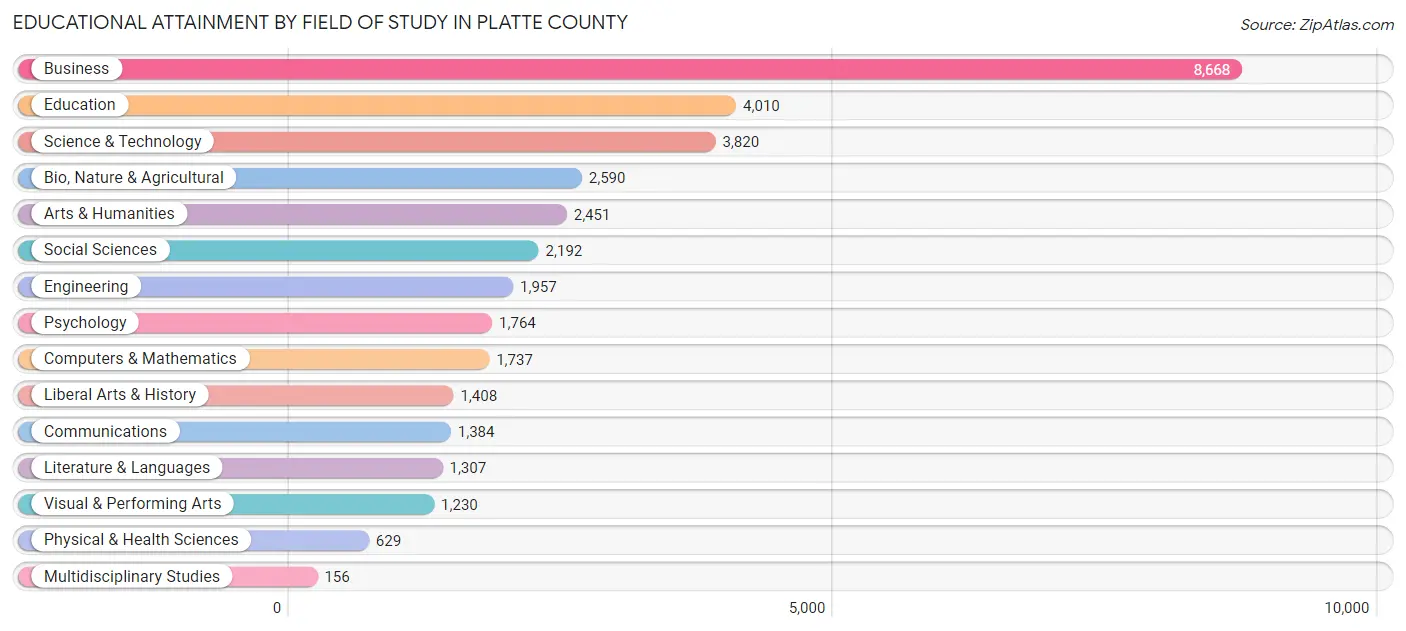
| Field of Study | # Graduates | % Graduates |
| Computers & Mathematics | 1,737 | 4.9% |
| Bio, Nature & Agricultural | 2,590 | 7.3% |
| Physical & Health Sciences | 629 | 1.8% |
| Psychology | 1,764 | 5.0% |
| Social Sciences | 2,192 | 6.2% |
| Engineering | 1,957 | 5.5% |
| Multidisciplinary Studies | 156 | 0.4% |
| Science & Technology | 3,820 | 10.8% |
| Business | 8,668 | 24.5% |
| Education | 4,010 | 11.4% |
| Literature & Languages | 1,307 | 3.7% |
| Liberal Arts & History | 1,408 | 4.0% |
| Visual & Performing Arts | 1,230 | 3.5% |
| Communications | 1,384 | 3.9% |
| Arts & Humanities | 2,451 | 6.9% |
| Total | 35,303 | 100.0% |
Transportation & Commute in Platte County
Vehicle Availability by Sex in Platte County
The most prevalent vehicle ownership categories in Platte County are males with 2 vehicles (14,397, accounting for 48.6%) and females with 2 vehicles (11,693, making up 53.8%).
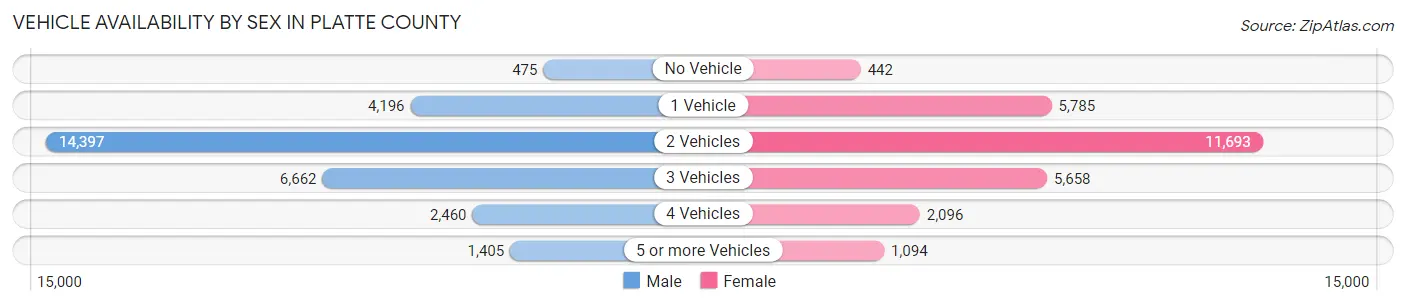
| Vehicles Available | Male | Female |
| No Vehicle | 475 (1.6%) | 442 (1.7%) |
| 1 Vehicle | 4,196 (14.2%) | 5,785 (21.6%) |
| 2 Vehicles | 14,397 (48.6%) | 11,693 (43.7%) |
| 3 Vehicles | 6,662 (22.5%) | 5,658 (21.1%) |
| 4 Vehicles | 2,460 (8.3%) | 2,096 (7.8%) |
| 5 or more Vehicles | 1,405 (4.8%) | 1,094 (4.1%) |
| Total | 29,595 (100.0%) | 26,768 (100.0%) |
Commute Time in Platte County
The most frequently occuring commute durations in Platte County are 20 to 24 minutes (8,740 commuters, 17.8%), 30 to 34 minutes (7,737 commuters, 15.8%), and 15 to 19 minutes (6,972 commuters, 14.2%).
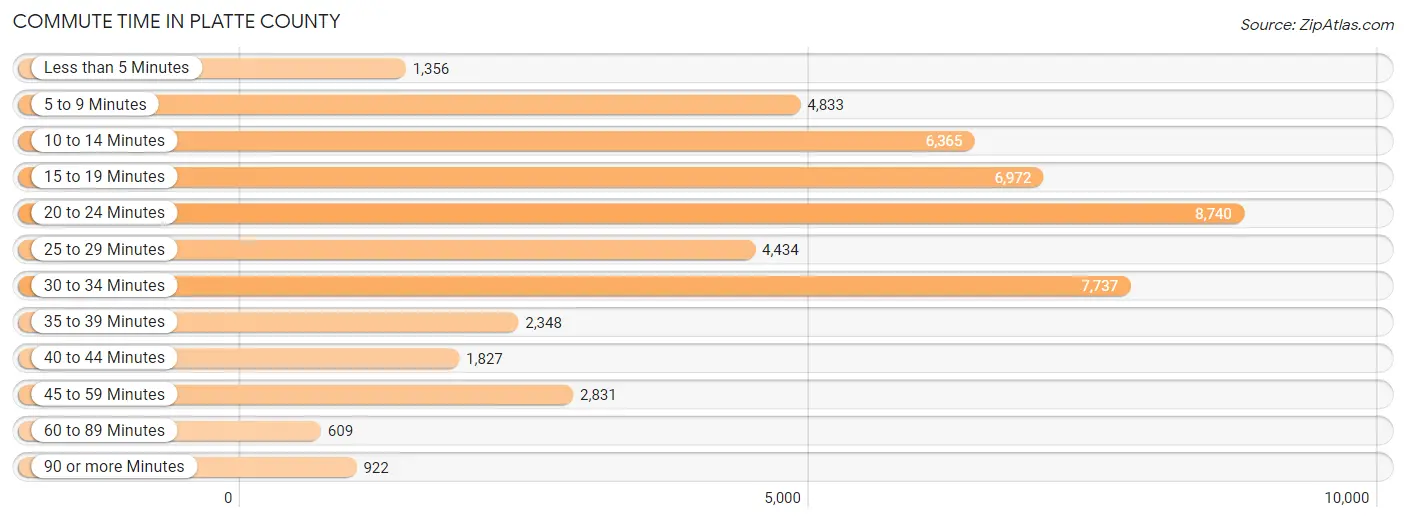
| Commute Time | # Commuters | % Commuters |
| Less than 5 Minutes | 1,356 | 2.8% |
| 5 to 9 Minutes | 4,833 | 9.9% |
| 10 to 14 Minutes | 6,365 | 13.0% |
| 15 to 19 Minutes | 6,972 | 14.2% |
| 20 to 24 Minutes | 8,740 | 17.8% |
| 25 to 29 Minutes | 4,434 | 9.0% |
| 30 to 34 Minutes | 7,737 | 15.8% |
| 35 to 39 Minutes | 2,348 | 4.8% |
| 40 to 44 Minutes | 1,827 | 3.7% |
| 45 to 59 Minutes | 2,831 | 5.8% |
| 60 to 89 Minutes | 609 | 1.2% |
| 90 or more Minutes | 922 | 1.9% |
Commute Time by Sex in Platte County
The most common commute times in Platte County are 20 to 24 minutes (5,200 commuters, 19.9%) for males and 20 to 24 minutes (3,540 commuters, 15.5%) for females.
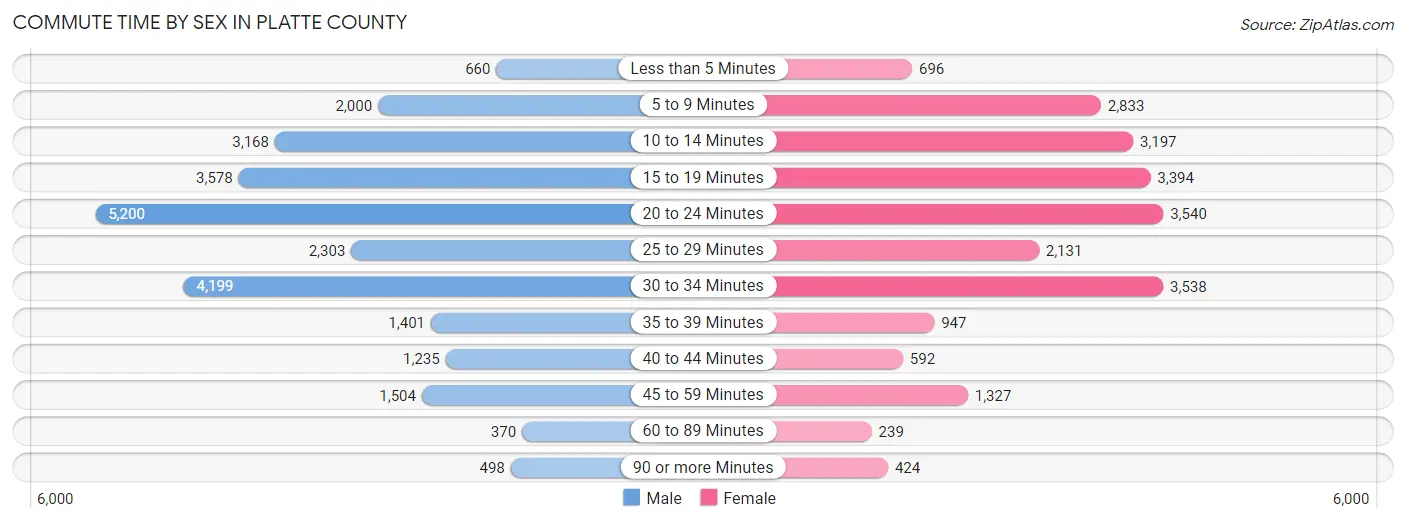
| Commute Time | Male | Female |
| Less than 5 Minutes | 660 (2.5%) | 696 (3.0%) |
| 5 to 9 Minutes | 2,000 (7.7%) | 2,833 (12.4%) |
| 10 to 14 Minutes | 3,168 (12.1%) | 3,197 (14.0%) |
| 15 to 19 Minutes | 3,578 (13.7%) | 3,394 (14.8%) |
| 20 to 24 Minutes | 5,200 (19.9%) | 3,540 (15.5%) |
| 25 to 29 Minutes | 2,303 (8.8%) | 2,131 (9.3%) |
| 30 to 34 Minutes | 4,199 (16.1%) | 3,538 (15.5%) |
| 35 to 39 Minutes | 1,401 (5.4%) | 947 (4.1%) |
| 40 to 44 Minutes | 1,235 (4.7%) | 592 (2.6%) |
| 45 to 59 Minutes | 1,504 (5.8%) | 1,327 (5.8%) |
| 60 to 89 Minutes | 370 (1.4%) | 239 (1.1%) |
| 90 or more Minutes | 498 (1.9%) | 424 (1.8%) |
Time of Departure to Work by Sex in Platte County
The most frequent times of departure to work in Platte County are 7:00 AM to 7:29 AM (4,125, 15.8%) for males and 7:00 AM to 7:29 AM (3,995, 17.5%) for females.
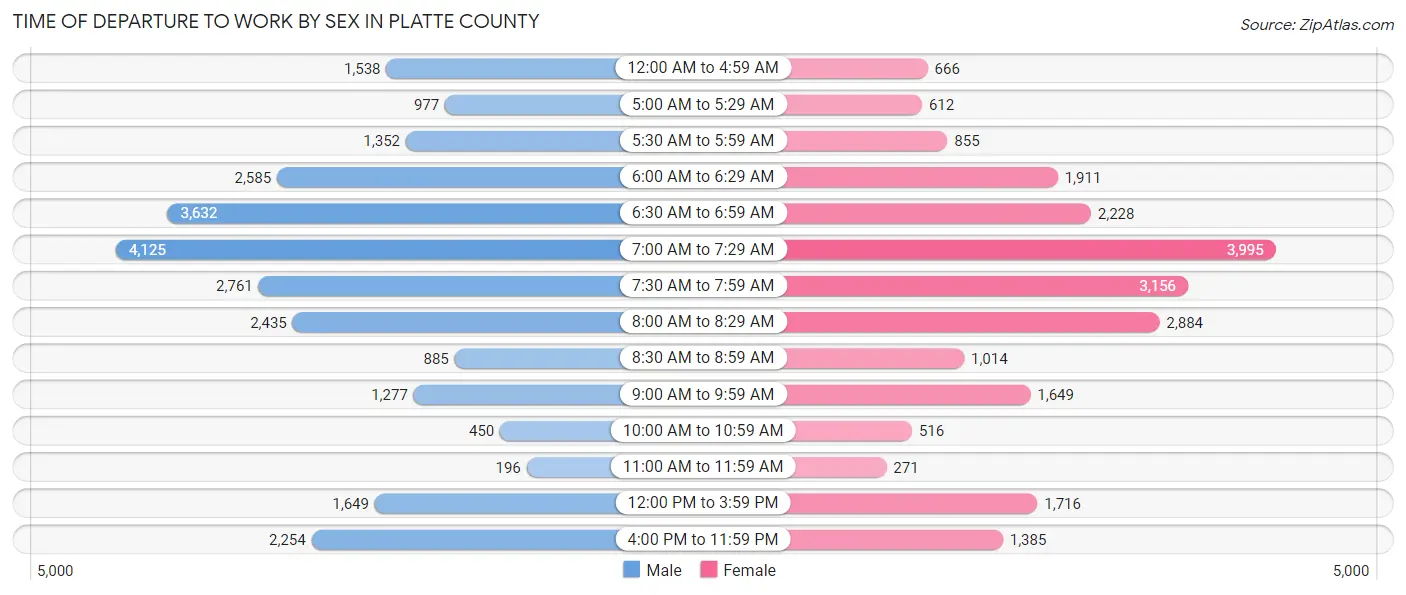
| Time of Departure | Male | Female |
| 12:00 AM to 4:59 AM | 1,538 (5.9%) | 666 (2.9%) |
| 5:00 AM to 5:29 AM | 977 (3.7%) | 612 (2.7%) |
| 5:30 AM to 5:59 AM | 1,352 (5.2%) | 855 (3.7%) |
| 6:00 AM to 6:29 AM | 2,585 (9.9%) | 1,911 (8.4%) |
| 6:30 AM to 6:59 AM | 3,632 (13.9%) | 2,228 (9.8%) |
| 7:00 AM to 7:29 AM | 4,125 (15.8%) | 3,995 (17.5%) |
| 7:30 AM to 7:59 AM | 2,761 (10.6%) | 3,156 (13.8%) |
| 8:00 AM to 8:29 AM | 2,435 (9.3%) | 2,884 (12.6%) |
| 8:30 AM to 8:59 AM | 885 (3.4%) | 1,014 (4.4%) |
| 9:00 AM to 9:59 AM | 1,277 (4.9%) | 1,649 (7.2%) |
| 10:00 AM to 10:59 AM | 450 (1.7%) | 516 (2.3%) |
| 11:00 AM to 11:59 AM | 196 (0.7%) | 271 (1.2%) |
| 12:00 PM to 3:59 PM | 1,649 (6.3%) | 1,716 (7.5%) |
| 4:00 PM to 11:59 PM | 2,254 (8.6%) | 1,385 (6.1%) |
| Total | 26,116 (100.0%) | 22,858 (100.0%) |
Housing Occupancy in Platte County
Occupancy by Ownership in Platte County
Of the total 42,606 dwellings in Platte County, owner-occupied units account for 28,301 (66.4%), while renter-occupied units make up 14,305 (33.6%).
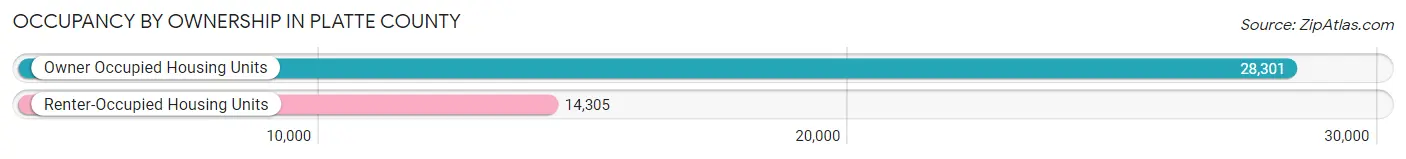
| Occupancy | # Housing Units | % Housing Units |
| Owner Occupied Housing Units | 28,301 | 66.4% |
| Renter-Occupied Housing Units | 14,305 | 33.6% |
| Total Occupied Housing Units | 42,606 | 100.0% |
Occupancy by Household Size in Platte County
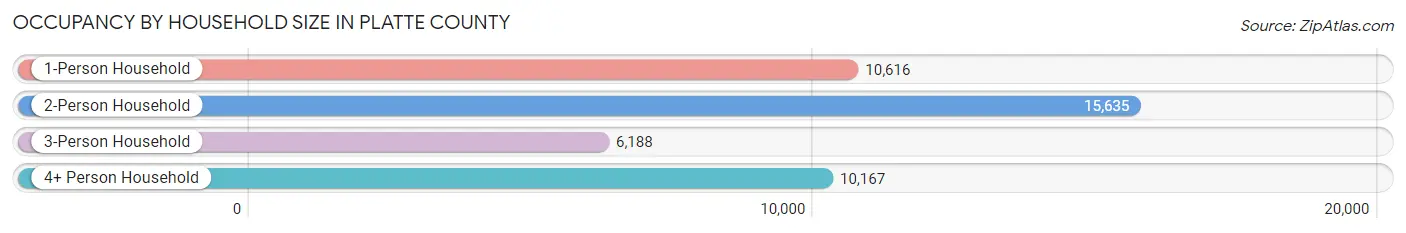
| Household Size | # Housing Units | % Housing Units |
| 1-Person Household | 10,616 | 24.9% |
| 2-Person Household | 15,635 | 36.7% |
| 3-Person Household | 6,188 | 14.5% |
| 4+ Person Household | 10,167 | 23.9% |
| Total Housing Units | 42,606 | 100.0% |
Occupancy by Ownership by Household Size in Platte County
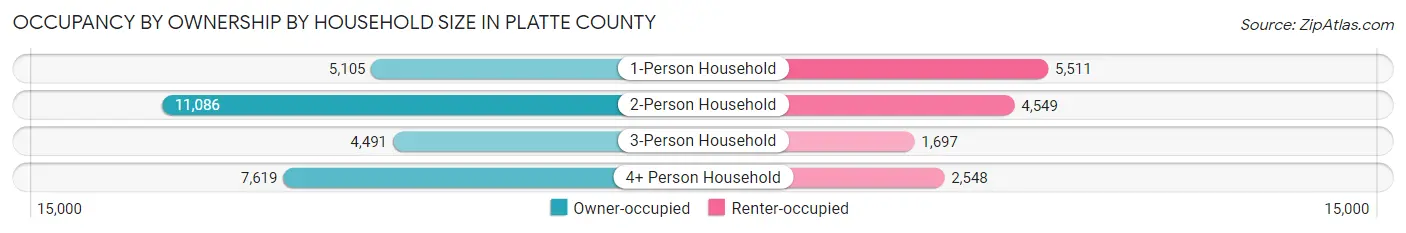
| Household Size | Owner-occupied | Renter-occupied |
| 1-Person Household | 5,105 (48.1%) | 5,511 (51.9%) |
| 2-Person Household | 11,086 (70.9%) | 4,549 (29.1%) |
| 3-Person Household | 4,491 (72.6%) | 1,697 (27.4%) |
| 4+ Person Household | 7,619 (74.9%) | 2,548 (25.1%) |
| Total Housing Units | 28,301 (66.4%) | 14,305 (33.6%) |
Occupancy by Educational Attainment in Platte County
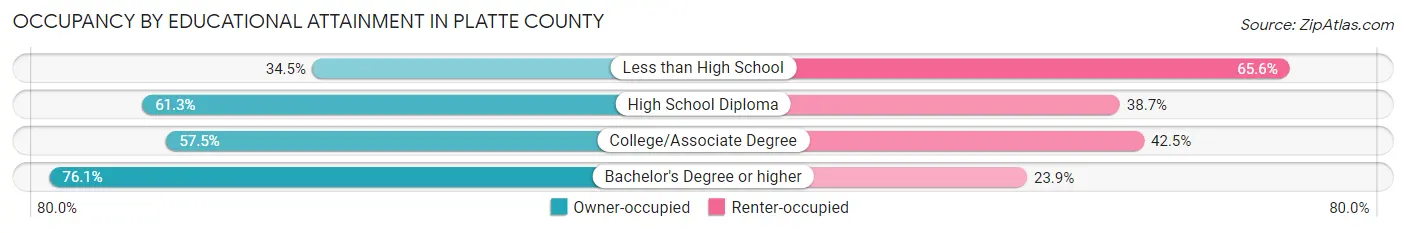
| Household Size | Owner-occupied | Renter-occupied |
| Less than High School | 433 (34.4%) | 824 (65.5%) |
| High School Diploma | 4,989 (61.3%) | 3,144 (38.7%) |
| College/Associate Degree | 7,397 (57.5%) | 5,468 (42.5%) |
| Bachelor's Degree or higher | 15,482 (76.1%) | 4,869 (23.9%) |
Occupancy by Age of Householder in Platte County
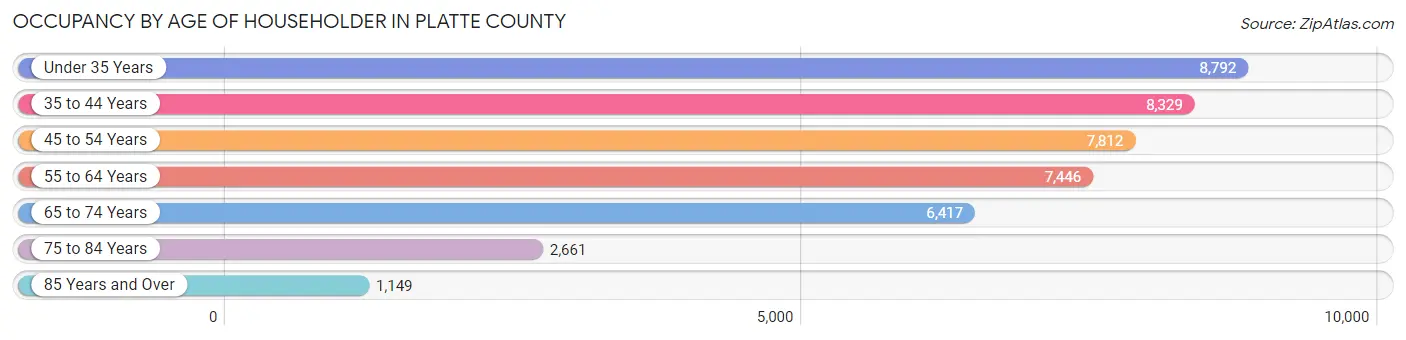
| Age Bracket | # Households | % Households |
| Under 35 Years | 8,792 | 20.6% |
| 35 to 44 Years | 8,329 | 19.6% |
| 45 to 54 Years | 7,812 | 18.3% |
| 55 to 64 Years | 7,446 | 17.5% |
| 65 to 74 Years | 6,417 | 15.1% |
| 75 to 84 Years | 2,661 | 6.2% |
| 85 Years and Over | 1,149 | 2.7% |
| Total | 42,606 | 100.0% |
Housing Finances in Platte County
Median Income by Occupancy in Platte County
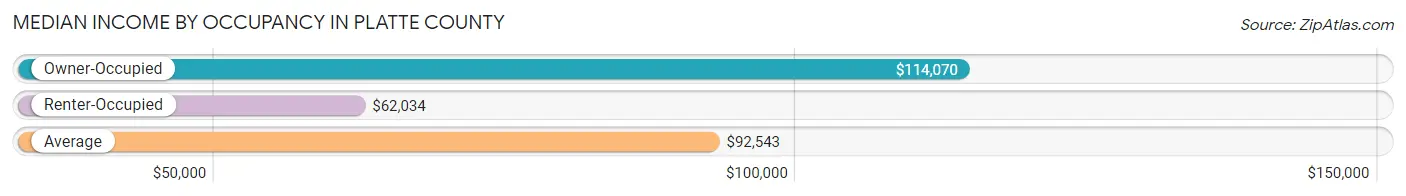
| Occupancy Type | # Households | Median Income |
| Owner-Occupied | 28,301 (66.4%) | $114,070 |
| Renter-Occupied | 14,305 (33.6%) | $62,034 |
| Average | 42,606 (100.0%) | $92,543 |
Occupancy by Householder Income Bracket in Platte County
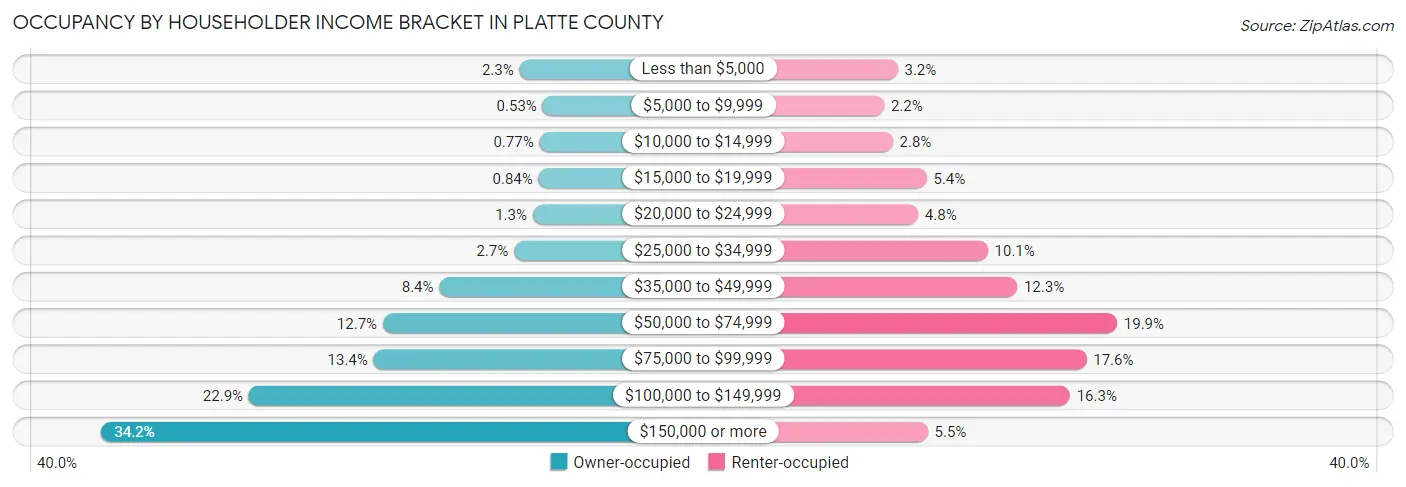
| Income Bracket | Owner-occupied | Renter-occupied |
| Less than $5,000 | 647 (2.3%) | 458 (3.2%) |
| $5,000 to $9,999 | 151 (0.5%) | 310 (2.2%) |
| $10,000 to $14,999 | 218 (0.8%) | 403 (2.8%) |
| $15,000 to $19,999 | 239 (0.8%) | 774 (5.4%) |
| $20,000 to $24,999 | 362 (1.3%) | 679 (4.8%) |
| $25,000 to $34,999 | 768 (2.7%) | 1,439 (10.1%) |
| $35,000 to $49,999 | 2,377 (8.4%) | 1,760 (12.3%) |
| $50,000 to $74,999 | 3,594 (12.7%) | 2,848 (19.9%) |
| $75,000 to $99,999 | 3,796 (13.4%) | 2,515 (17.6%) |
| $100,000 to $149,999 | 6,484 (22.9%) | 2,334 (16.3%) |
| $150,000 or more | 9,665 (34.2%) | 785 (5.5%) |
| Total | 28,301 (100.0%) | 14,305 (100.0%) |
Monthly Housing Cost Tiers in Platte County
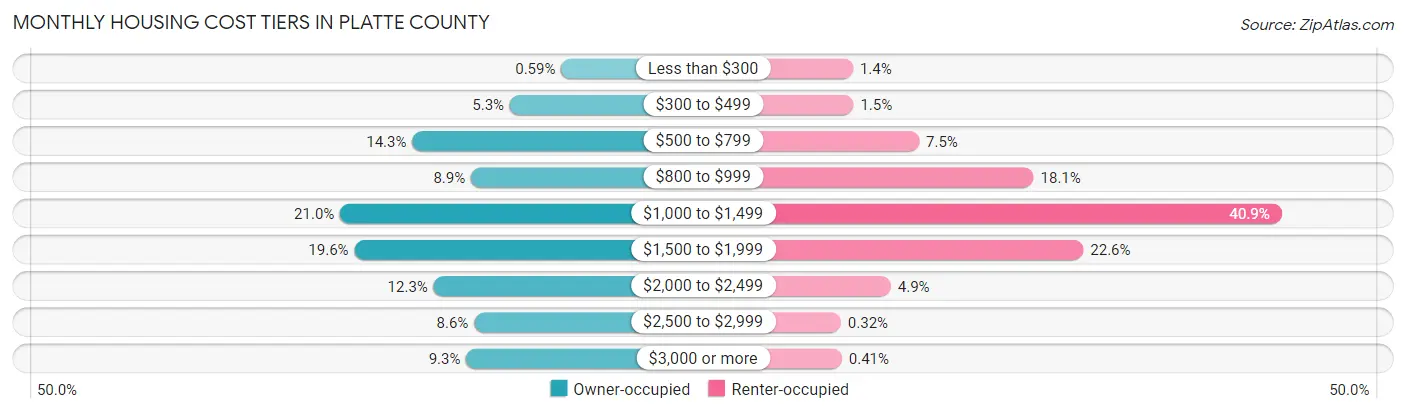
| Monthly Cost | Owner-occupied | Renter-occupied |
| Less than $300 | 167 (0.6%) | 204 (1.4%) |
| $300 to $499 | 1,505 (5.3%) | 211 (1.5%) |
| $500 to $799 | 4,051 (14.3%) | 1,076 (7.5%) |
| $800 to $999 | 2,518 (8.9%) | 2,583 (18.1%) |
| $1,000 to $1,499 | 5,930 (20.9%) | 5,850 (40.9%) |
| $1,500 to $1,999 | 5,558 (19.6%) | 3,239 (22.6%) |
| $2,000 to $2,499 | 3,493 (12.3%) | 704 (4.9%) |
| $2,500 to $2,999 | 2,436 (8.6%) | 46 (0.3%) |
| $3,000 or more | 2,643 (9.3%) | 59 (0.4%) |
| Total | 28,301 (100.0%) | 14,305 (100.0%) |
Physical Housing Characteristics in Platte County
Housing Structures in Platte County
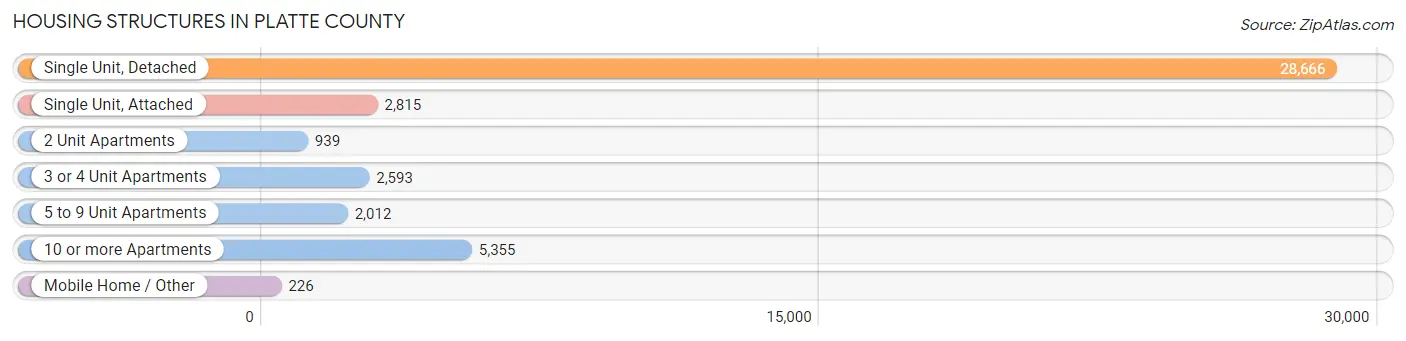
| Structure Type | # Housing Units | % Housing Units |
| Single Unit, Detached | 28,666 | 67.3% |
| Single Unit, Attached | 2,815 | 6.6% |
| 2 Unit Apartments | 939 | 2.2% |
| 3 or 4 Unit Apartments | 2,593 | 6.1% |
| 5 to 9 Unit Apartments | 2,012 | 4.7% |
| 10 or more Apartments | 5,355 | 12.6% |
| Mobile Home / Other | 226 | 0.5% |
| Total | 42,606 | 100.0% |
Housing Structures by Occupancy in Platte County
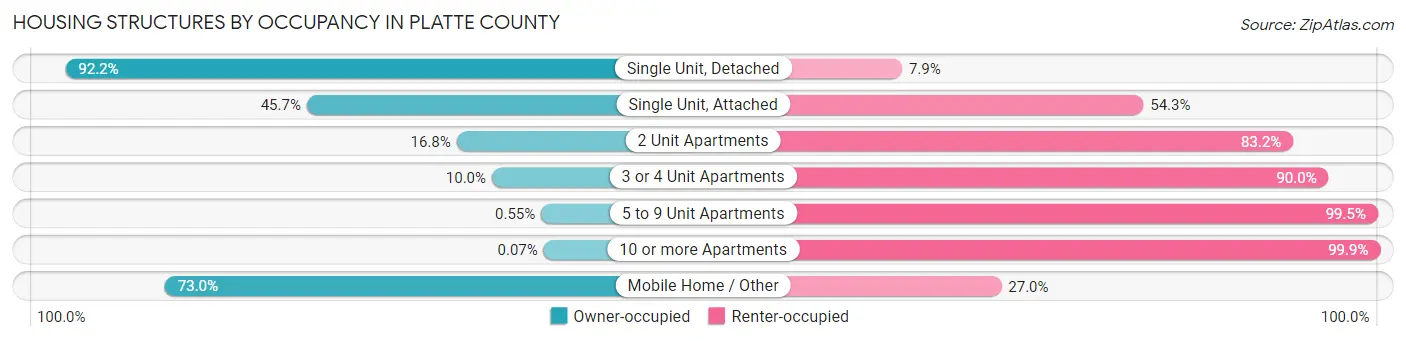
| Structure Type | Owner-occupied | Renter-occupied |
| Single Unit, Detached | 26,417 (92.1%) | 2,249 (7.9%) |
| Single Unit, Attached | 1,286 (45.7%) | 1,529 (54.3%) |
| 2 Unit Apartments | 158 (16.8%) | 781 (83.2%) |
| 3 or 4 Unit Apartments | 260 (10.0%) | 2,333 (90.0%) |
| 5 to 9 Unit Apartments | 11 (0.5%) | 2,001 (99.5%) |
| 10 or more Apartments | 4 (0.1%) | 5,351 (99.9%) |
| Mobile Home / Other | 165 (73.0%) | 61 (27.0%) |
| Total | 28,301 (66.4%) | 14,305 (33.6%) |
Housing Structures by Number of Rooms in Platte County
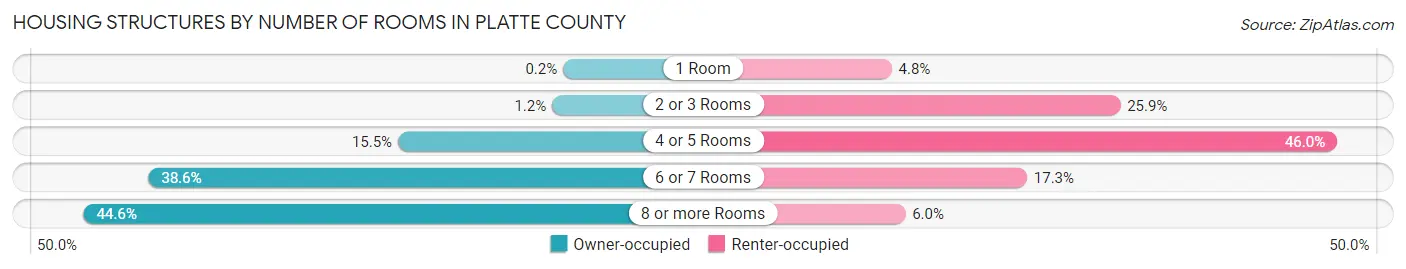
| Number of Rooms | Owner-occupied | Renter-occupied |
| 1 Room | 57 (0.2%) | 684 (4.8%) |
| 2 or 3 Rooms | 345 (1.2%) | 3,708 (25.9%) |
| 4 or 5 Rooms | 4,377 (15.5%) | 6,576 (46.0%) |
| 6 or 7 Rooms | 10,914 (38.6%) | 2,473 (17.3%) |
| 8 or more Rooms | 12,608 (44.6%) | 864 (6.0%) |
| Total | 28,301 (100.0%) | 14,305 (100.0%) |
Housing Structure by Heating Type in Platte County
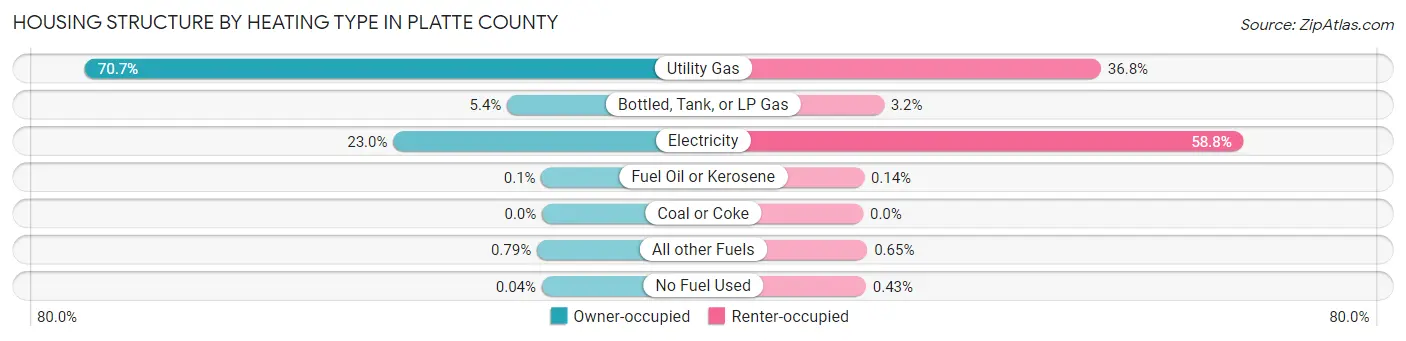
| Heating Type | Owner-occupied | Renter-occupied |
| Utility Gas | 20,000 (70.7%) | 5,260 (36.8%) |
| Bottled, Tank, or LP Gas | 1,527 (5.4%) | 457 (3.2%) |
| Electricity | 6,510 (23.0%) | 8,413 (58.8%) |
| Fuel Oil or Kerosene | 28 (0.1%) | 20 (0.1%) |
| Coal or Coke | 0 (0.0%) | 0 (0.0%) |
| All other Fuels | 224 (0.8%) | 93 (0.6%) |
| No Fuel Used | 12 (0.0%) | 62 (0.4%) |
| Total | 28,301 (100.0%) | 14,305 (100.0%) |
Household Vehicle Usage in Platte County
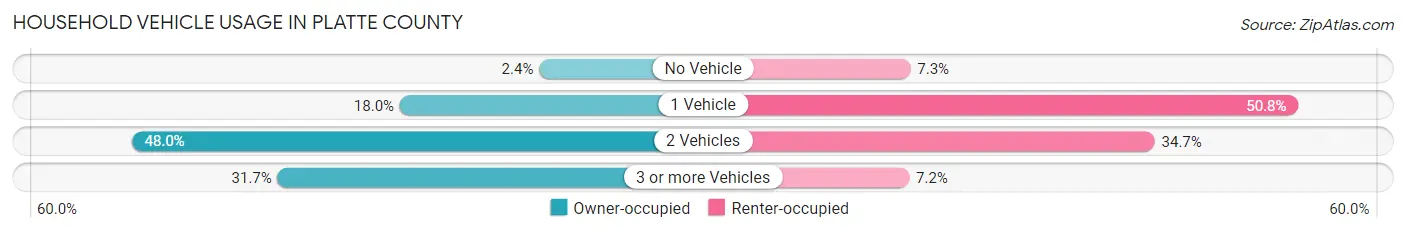
| Vehicles per Household | Owner-occupied | Renter-occupied |
| No Vehicle | 665 (2.4%) | 1,048 (7.3%) |
| 1 Vehicle | 5,083 (18.0%) | 7,266 (50.8%) |
| 2 Vehicles | 13,594 (48.0%) | 4,962 (34.7%) |
| 3 or more Vehicles | 8,959 (31.7%) | 1,029 (7.2%) |
| Total | 28,301 (100.0%) | 14,305 (100.0%) |
Real Estate & Mortgages in Platte County
Real Estate and Mortgage Overview in Platte County
| Characteristic | Without Mortgage | With Mortgage |
| Housing Units | 8,602 | 19,699 |
| Median Property Value | $282,800 | $290,100 |
| Median Household Income | $85,723 | $7,719 |
| Monthly Housing Costs | $702 | $2,623 |
| Real Estate Taxes | $2,978 | $105 |
Property Value by Mortgage Status in Platte County
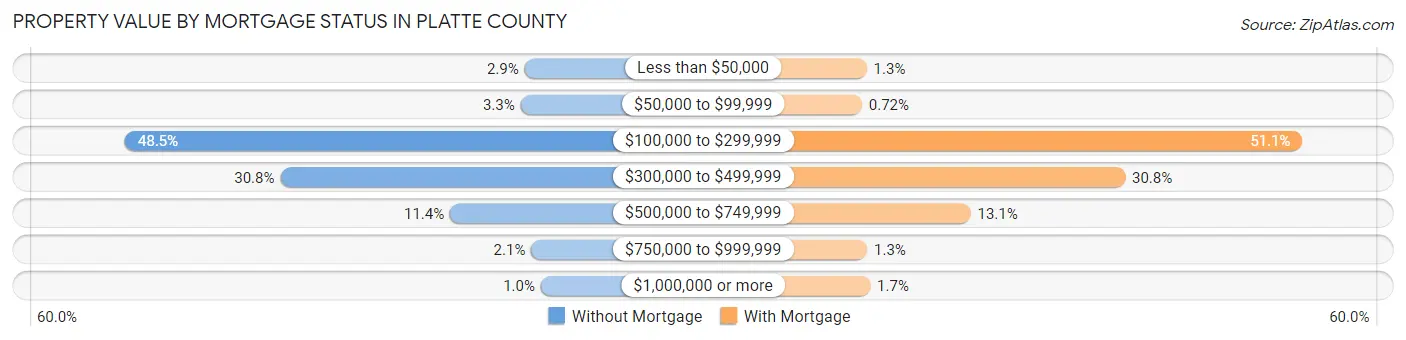
| Property Value | Without Mortgage | With Mortgage |
| Less than $50,000 | 246 (2.9%) | 251 (1.3%) |
| $50,000 to $99,999 | 286 (3.3%) | 142 (0.7%) |
| $100,000 to $299,999 | 4,175 (48.5%) | 10,061 (51.1%) |
| $300,000 to $499,999 | 2,648 (30.8%) | 6,068 (30.8%) |
| $500,000 to $749,999 | 979 (11.4%) | 2,588 (13.1%) |
| $750,000 to $999,999 | 181 (2.1%) | 260 (1.3%) |
| $1,000,000 or more | 87 (1.0%) | 329 (1.7%) |
| Total | 8,602 (100.0%) | 19,699 (100.0%) |
Household Income by Mortgage Status in Platte County
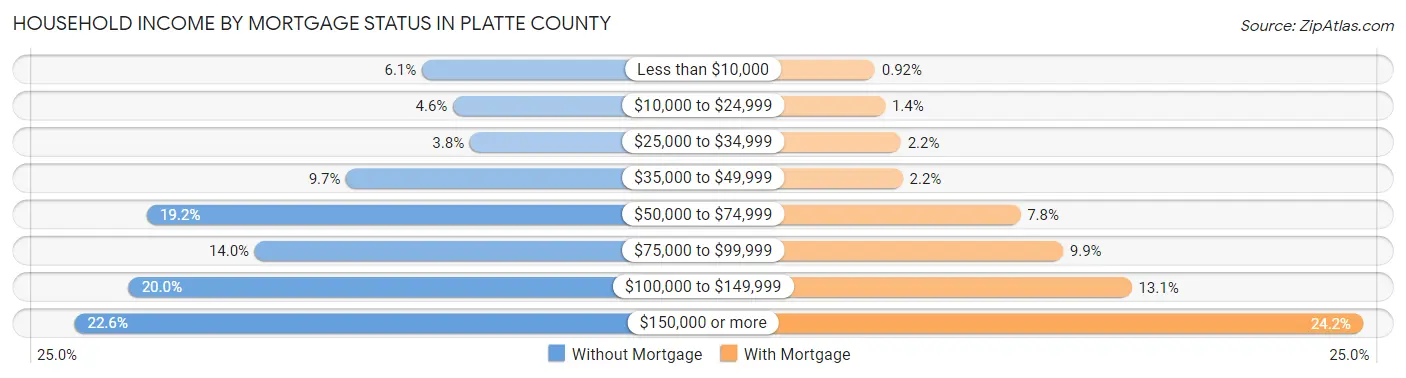
| Household Income | Without Mortgage | With Mortgage |
| Less than $10,000 | 522 (6.1%) | 182 (0.9%) |
| $10,000 to $24,999 | 395 (4.6%) | 276 (1.4%) |
| $25,000 to $34,999 | 326 (3.8%) | 424 (2.1%) |
| $35,000 to $49,999 | 833 (9.7%) | 442 (2.2%) |
| $50,000 to $74,999 | 1,649 (19.2%) | 1,544 (7.8%) |
| $75,000 to $99,999 | 1,207 (14.0%) | 1,945 (9.9%) |
| $100,000 to $149,999 | 1,724 (20.0%) | 2,589 (13.1%) |
| $150,000 or more | 1,946 (22.6%) | 4,760 (24.2%) |
| Total | 8,602 (100.0%) | 19,699 (100.0%) |
Property Value to Household Income Ratio in Platte County
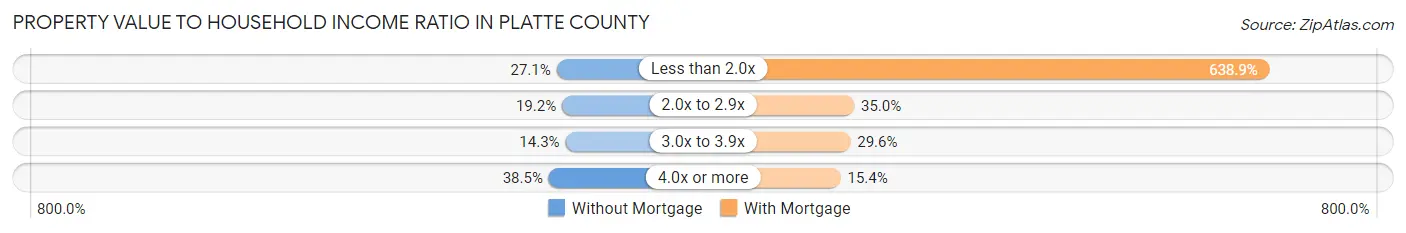
| Value-to-Income Ratio | Without Mortgage | With Mortgage |
| Less than 2.0x | 2,335 (27.1%) | 125,854 (638.9%) |
| 2.0x to 2.9x | 1,653 (19.2%) | 6,901 (35.0%) |
| 3.0x to 3.9x | 1,228 (14.3%) | 5,836 (29.6%) |
| 4.0x or more | 3,310 (38.5%) | 3,040 (15.4%) |
| Total | 8,602 (100.0%) | 19,699 (100.0%) |
Real Estate Taxes by Mortgage Status in Platte County
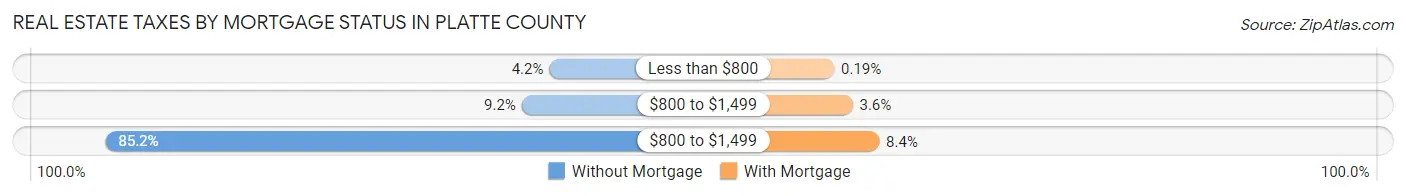
| Property Taxes | Without Mortgage | With Mortgage |
| Less than $800 | 359 (4.2%) | 37 (0.2%) |
| $800 to $1,499 | 792 (9.2%) | 701 (3.6%) |
| $800 to $1,499 | 7,332 (85.2%) | 1,659 (8.4%) |
| Total | 8,602 (100.0%) | 19,699 (100.0%) |
Health & Disability in Platte County
Health Insurance Coverage by Age in Platte County
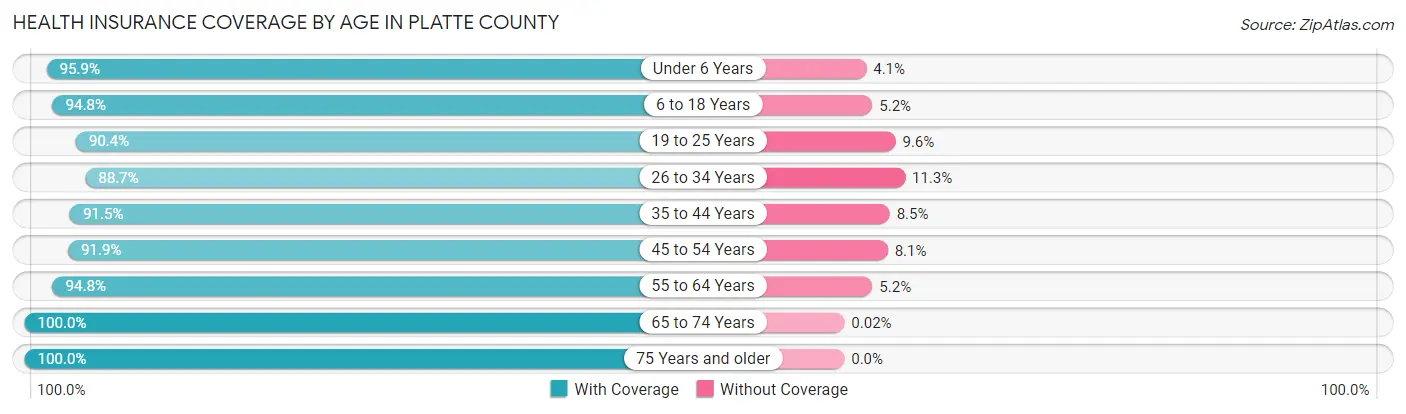
| Age Bracket | With Coverage | Without Coverage |
| Under 6 Years | 7,085 (95.9%) | 303 (4.1%) |
| 6 to 18 Years | 17,981 (94.8%) | 993 (5.2%) |
| 19 to 25 Years | 7,788 (90.4%) | 823 (9.6%) |
| 26 to 34 Years | 11,255 (88.7%) | 1,439 (11.3%) |
| 35 to 44 Years | 13,700 (91.5%) | 1,267 (8.5%) |
| 45 to 54 Years | 12,556 (91.9%) | 1,107 (8.1%) |
| 55 to 64 Years | 12,769 (94.8%) | 706 (5.2%) |
| 65 to 74 Years | 10,088 (100.0%) | 2 (0.0%) |
| 75 Years and older | 6,079 (100.0%) | 0 (0.0%) |
| Total | 99,301 (93.7%) | 6,640 (6.3%) |
Health Insurance Coverage by Citizenship Status in Platte County
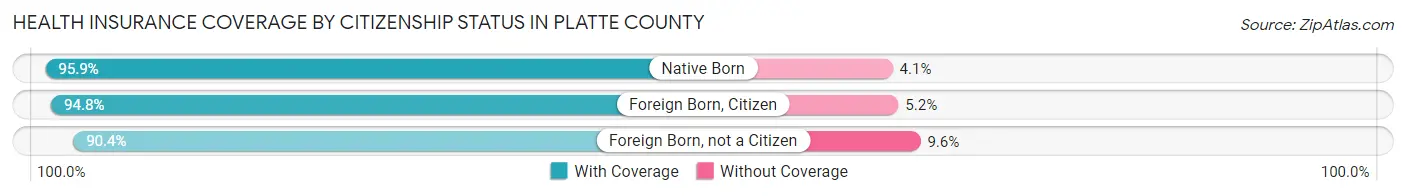
| Citizenship Status | With Coverage | Without Coverage |
| Native Born | 7,085 (95.9%) | 303 (4.1%) |
| Foreign Born, Citizen | 17,981 (94.8%) | 993 (5.2%) |
| Foreign Born, not a Citizen | 7,788 (90.4%) | 823 (9.6%) |
Health Insurance Coverage by Household Income in Platte County
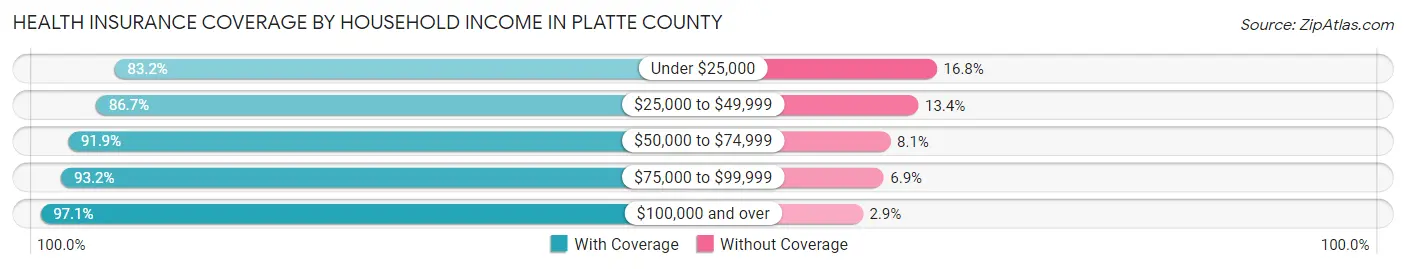
| Household Income | With Coverage | Without Coverage |
| Under $25,000 | 5,668 (83.2%) | 1,147 (16.8%) |
| $25,000 to $49,999 | 10,370 (86.7%) | 1,597 (13.4%) |
| $50,000 to $74,999 | 12,347 (91.9%) | 1,089 (8.1%) |
| $75,000 to $99,999 | 14,190 (93.1%) | 1,043 (6.9%) |
| $100,000 and over | 56,396 (97.1%) | 1,704 (2.9%) |
Public vs Private Health Insurance Coverage by Age in Platte County
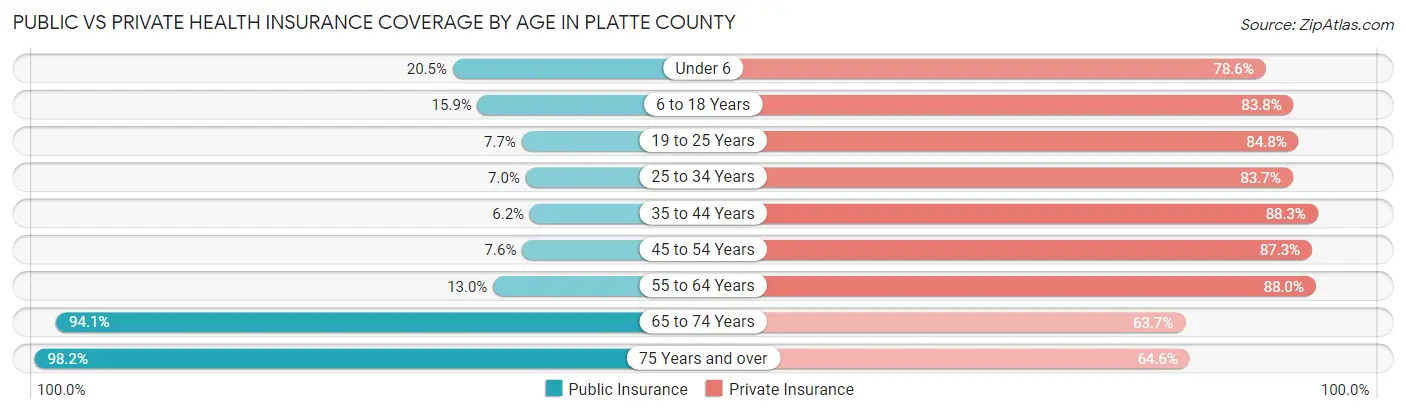
| Age Bracket | Public Insurance | Private Insurance |
| Under 6 | 1,516 (20.5%) | 5,810 (78.6%) |
| 6 to 18 Years | 3,019 (15.9%) | 15,907 (83.8%) |
| 19 to 25 Years | 666 (7.7%) | 7,301 (84.8%) |
| 25 to 34 Years | 887 (7.0%) | 10,619 (83.7%) |
| 35 to 44 Years | 930 (6.2%) | 13,221 (88.3%) |
| 45 to 54 Years | 1,043 (7.6%) | 11,922 (87.3%) |
| 55 to 64 Years | 1,754 (13.0%) | 11,854 (88.0%) |
| 65 to 74 Years | 9,499 (94.1%) | 6,427 (63.7%) |
| 75 Years and over | 5,967 (98.2%) | 3,925 (64.6%) |
| Total | 25,281 (23.9%) | 86,986 (82.1%) |
Disability Status by Sex by Age in Platte County
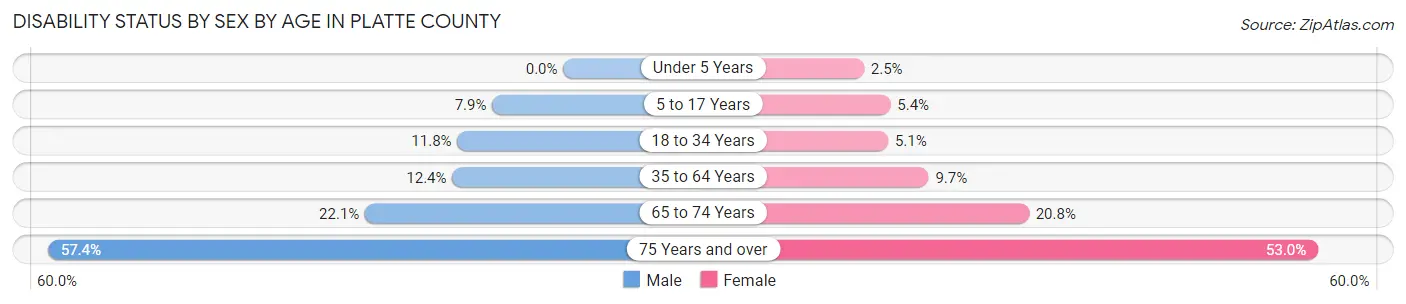
| Age Bracket | Male | Female |
| Under 5 Years | 0 (0.0%) | 75 (2.5%) |
| 5 to 17 Years | 763 (7.9%) | 497 (5.4%) |
| 18 to 34 Years | 1,350 (11.8%) | 576 (5.1%) |
| 35 to 64 Years | 2,594 (12.4%) | 2,038 (9.7%) |
| 65 to 74 Years | 1,065 (22.1%) | 1,096 (20.8%) |
| 75 Years and over | 1,479 (57.4%) | 1,858 (53.0%) |
Disability Class by Sex by Age in Platte County
Disability Class: Hearing Difficulty
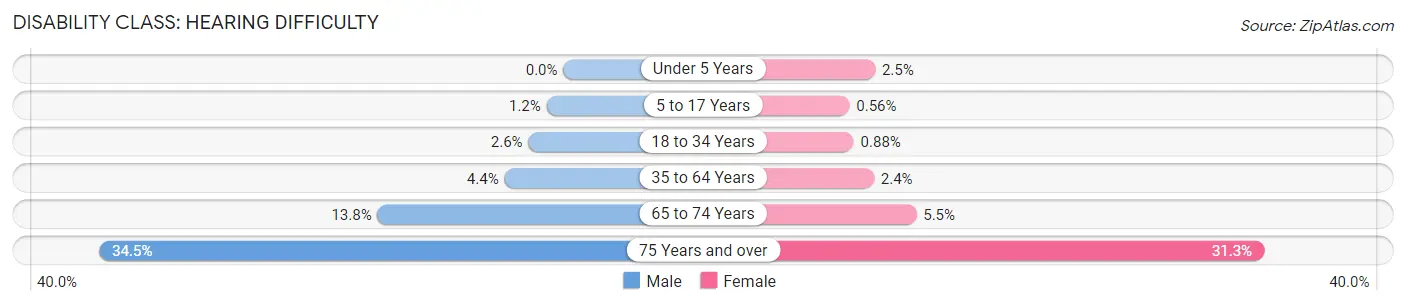
| Age Bracket | Male | Female |
| Under 5 Years | 0 (0.0%) | 75 (2.5%) |
| 5 to 17 Years | 120 (1.2%) | 51 (0.6%) |
| 18 to 34 Years | 296 (2.6%) | 99 (0.9%) |
| 35 to 64 Years | 918 (4.4%) | 502 (2.4%) |
| 65 to 74 Years | 666 (13.8%) | 291 (5.5%) |
| 75 Years and over | 888 (34.5%) | 1,098 (31.3%) |
Disability Class: Vision Difficulty
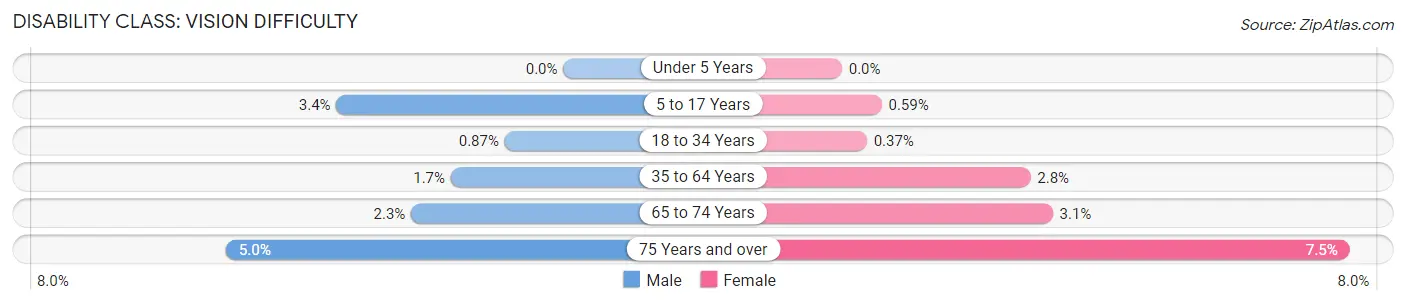
| Age Bracket | Male | Female |
| Under 5 Years | 0 (0.0%) | 0 (0.0%) |
| 5 to 17 Years | 325 (3.4%) | 54 (0.6%) |
| 18 to 34 Years | 100 (0.9%) | 41 (0.4%) |
| 35 to 64 Years | 351 (1.7%) | 592 (2.8%) |
| 65 to 74 Years | 109 (2.3%) | 165 (3.1%) |
| 75 Years and over | 129 (5.0%) | 264 (7.5%) |
Disability Class: Cognitive Difficulty
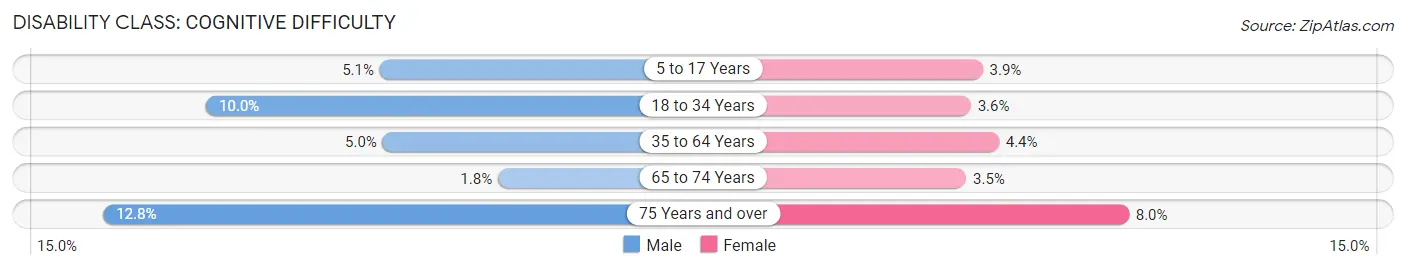
| Age Bracket | Male | Female |
| 5 to 17 Years | 493 (5.1%) | 360 (3.9%) |
| 18 to 34 Years | 1,138 (10.0%) | 402 (3.6%) |
| 35 to 64 Years | 1,056 (5.0%) | 922 (4.4%) |
| 65 to 74 Years | 88 (1.8%) | 182 (3.5%) |
| 75 Years and over | 330 (12.8%) | 280 (8.0%) |
Disability Class: Ambulatory Difficulty
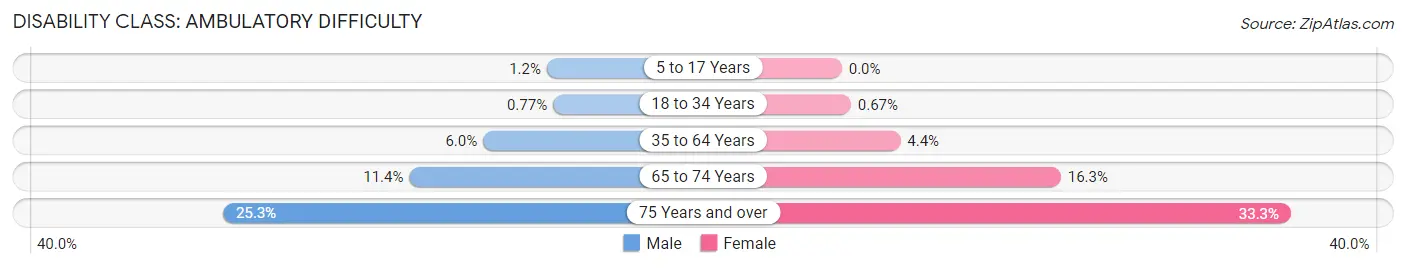
| Age Bracket | Male | Female |
| 5 to 17 Years | 119 (1.2%) | 0 (0.0%) |
| 18 to 34 Years | 88 (0.8%) | 75 (0.7%) |
| 35 to 64 Years | 1,251 (6.0%) | 919 (4.3%) |
| 65 to 74 Years | 552 (11.4%) | 856 (16.3%) |
| 75 Years and over | 651 (25.3%) | 1,168 (33.3%) |
Disability Class: Self-Care Difficulty
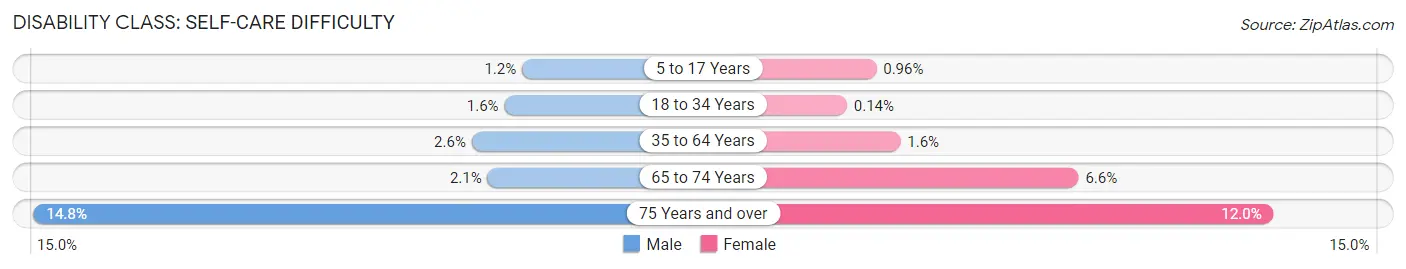
| Age Bracket | Male | Female |
| 5 to 17 Years | 111 (1.1%) | 88 (1.0%) |
| 18 to 34 Years | 188 (1.6%) | 16 (0.1%) |
| 35 to 64 Years | 536 (2.5%) | 344 (1.6%) |
| 65 to 74 Years | 102 (2.1%) | 347 (6.6%) |
| 75 Years and over | 380 (14.7%) | 421 (12.0%) |
Technology Access in Platte County
Computing Device Access in Platte County
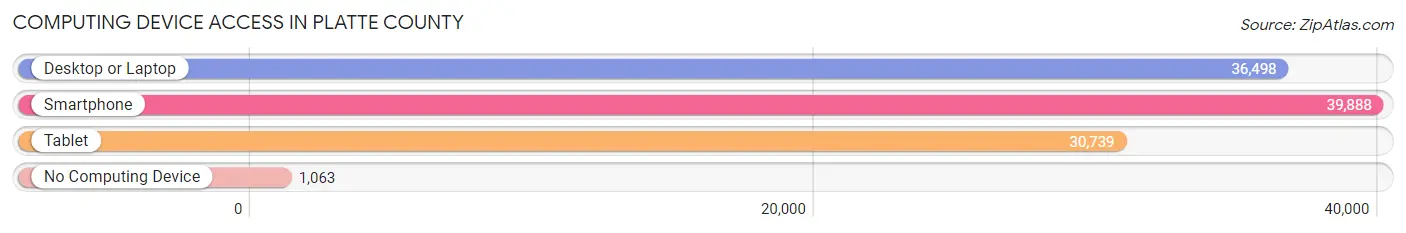
| Device Type | # Households | % Households |
| Desktop or Laptop | 36,498 | 85.7% |
| Smartphone | 39,888 | 93.6% |
| Tablet | 30,739 | 72.2% |
| No Computing Device | 1,063 | 2.5% |
| Total | 42,606 | 100.0% |
Internet Access in Platte County
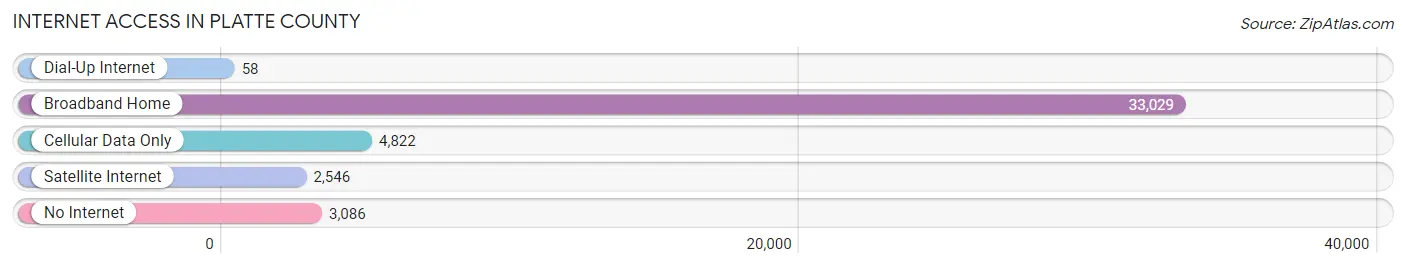
| Internet Type | # Households | % Households |
| Dial-Up Internet | 58 | 0.1% |
| Broadband Home | 33,029 | 77.5% |
| Cellular Data Only | 4,822 | 11.3% |
| Satellite Internet | 2,546 | 6.0% |
| No Internet | 3,086 | 7.2% |
| Total | 42,606 | 100.0% |
Platte County Summary
Platte County, Missouri is located in the northwest corner of the state and is part of the Kansas City metropolitan area. The county was established in 1838 and is named after the Platte River, which runs through the county. The county seat is Platte City and the largest city is Parkville. As of the 2010 census, the population was 89,322.
Geography
Platte County is located in the northwest corner of Missouri and is bordered by Clay County to the north, Jackson County to the east, Cass County to the south, and Leavenworth County, Kansas to the west. The county covers an area of 545 square miles and is mostly flat with rolling hills in the northern part of the county. The Platte River runs through the county and is a major tributary of the Missouri River. The county is part of the Missouri River watershed.
The climate of Platte County is humid continental, with hot, humid summers and cold, dry winters. The average annual temperature is 54°F and the average annual precipitation is 39.5 inches.
Economy
The economy of Platte County is largely based on agriculture and manufacturing. The county is home to several large agricultural operations, including dairy farms, beef cattle farms, and poultry farms. The county is also home to several large manufacturing companies, including Ford Motor Company, which has a large assembly plant in Claycomo.
The county also has a large tourism industry, with several popular attractions, including the Weston Bend State Park, the Platte County Historical Society Museum, and the Parkville Nature Sanctuary.
Demographics
As of the 2010 census, the population of Platte County was 89,322, with a population density of 164 people per square mile. The racial makeup of the county was 87.3% White, 6.2% African American, 0.7% Native American, 1.3% Asian, 0.1% Pacific Islander, 1.7% from other races, and 2.9% from two or more races. Hispanic or Latino of any race were 4.2% of the population.
The median income for a household in the county was $50,945 and the median income for a family was $60,945. The per capita income for the county was $25,945. About 8.2% of families and 10.3% of the population were below the poverty line, including 14.2% of those under age 18 and 6.2% of those age 65 or over.
Platte County is served by several school districts, including the Park Hill School District, the North Platte County R-I School District, and the Platte County R-III School District. The county is also home to several higher education institutions, including Park University, Avila University, and the University of Missouri-Kansas City.
Platte County is a diverse and vibrant community with a strong economy and a rich history. The county is home to a variety of industries, attractions, and educational institutions, making it an ideal place to live, work, and play.
Common Questions
What is Per Capita Income in Platte County?
Per Capita income in Platte County is $47,440.
What is the Median Family Income in Platte County?
Median Family Income in Platte County is $111,610.
What is the Median Household income in Platte County?
Median Household Income in Platte County is $92,543.
What is Income or Wage Gap in Platte County?
Income or Wage Gap in Platte County is 28.4%.
Women in Platte County earn 71.6 cents for every dollar earned by a man.
What is Family Income Deficit in Platte County?
Family Income Deficit in Platte County is $13,827.
Families that are below poverty line in Platte County earn $13,827 less on average than the poverty threshold level.
What is Inequality or Gini Index in Platte County?
Inequality or Gini Index in Platte County is 0.43.
What is the Total Population of Platte County?
Total Population of Platte County is 107,033.
What is the Total Male Population of Platte County?
Total Male Population of Platte County is 53,232.
What is the Total Female Population of Platte County?
Total Female Population of Platte County is 53,801.
What is the Ratio of Males per 100 Females in Platte County?
There are 98.94 Males per 100 Females in Platte County.
What is the Ratio of Females per 100 Males in Platte County?
There are 101.07 Females per 100 Males in Platte County.
What is the Median Population Age in Platte County?
Median Population Age in Platte County is 38.7 Years.
What is the Average Family Size in Platte County
Average Family Size in Platte County is 3.0 People.
What is the Average Household Size in Platte County
Average Household Size in Platte County is 2.5 People.
How Large is the Labor Force in Platte County?
There are 59,426 People in the Labor Forcein in Platte County.
What is the Percentage of People in the Labor Force in Platte County?
70.2% of People are in the Labor Force in Platte County.
What is the Unemployment Rate in Platte County?
Unemployment Rate in Platte County is 3.6%.