Ozark County, MO Map & Demographics
Ozark County Map
Ozark County Overview
$26,638
PER CAPITA INCOME
$49,116
AVG FAMILY INCOME
$39,125
AVG HOUSEHOLD INCOME
31.6%
WAGE / INCOME GAP [ % ]
68.4¢/ $1
WAGE / INCOME GAP [ $ ]
$11,856
FAMILY INCOME DEFICIT
0.53
INEQUALITY / GINI INDEX
8,688
TOTAL POPULATION
4,343
MALE POPULATION
4,345
FEMALE POPULATION
99.95
MALES / 100 FEMALES
100.05
FEMALES / 100 MALES
52.6
MEDIAN AGE
3.0
AVG FAMILY SIZE
2.4
AVG HOUSEHOLD SIZE
3,167
LABOR FORCE [ PEOPLE ]
44.0%
PERCENT IN LABOR FORCE
6.2%
UNEMPLOYMENT RATE
Ozark County Area Codes
Income in Ozark County
Income Overview in Ozark County
Per Capita Income in Ozark County is $26,638, while median incomes of families and households are $49,116 and $39,125 respectively.
| Characteristic | Number | Measure |
| Per Capita Income | 8,688 | $26,638 |
| Median Family Income | 2,347 | $49,116 |
| Mean Family Income | 2,347 | $73,308 |
| Median Household Income | 3,654 | $39,125 |
| Mean Household Income | 3,654 | $60,133 |
| Income Deficit | 2,347 | $11,856 |
| Wage / Income Gap (%) | 8,688 | 31.59% |
| Wage / Income Gap ($) | 8,688 | 68.41¢ per $1 |
| Gini / Inequality Index | 8,688 | 0.53 |
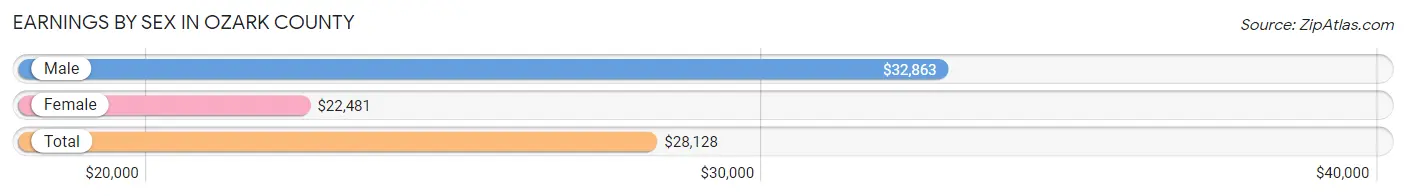
Earnings by Sex in Ozark County
Average Earnings in Ozark County are $28,128, $32,863 for men and $22,481 for women, a difference of 31.6%.
| Sex | Number | Average Earnings |
| Male | 1,764 (53.2%) | $32,863 |
| Female | 1,549 (46.8%) | $22,481 |
| Total | 3,313 (100.0%) | $28,128 |
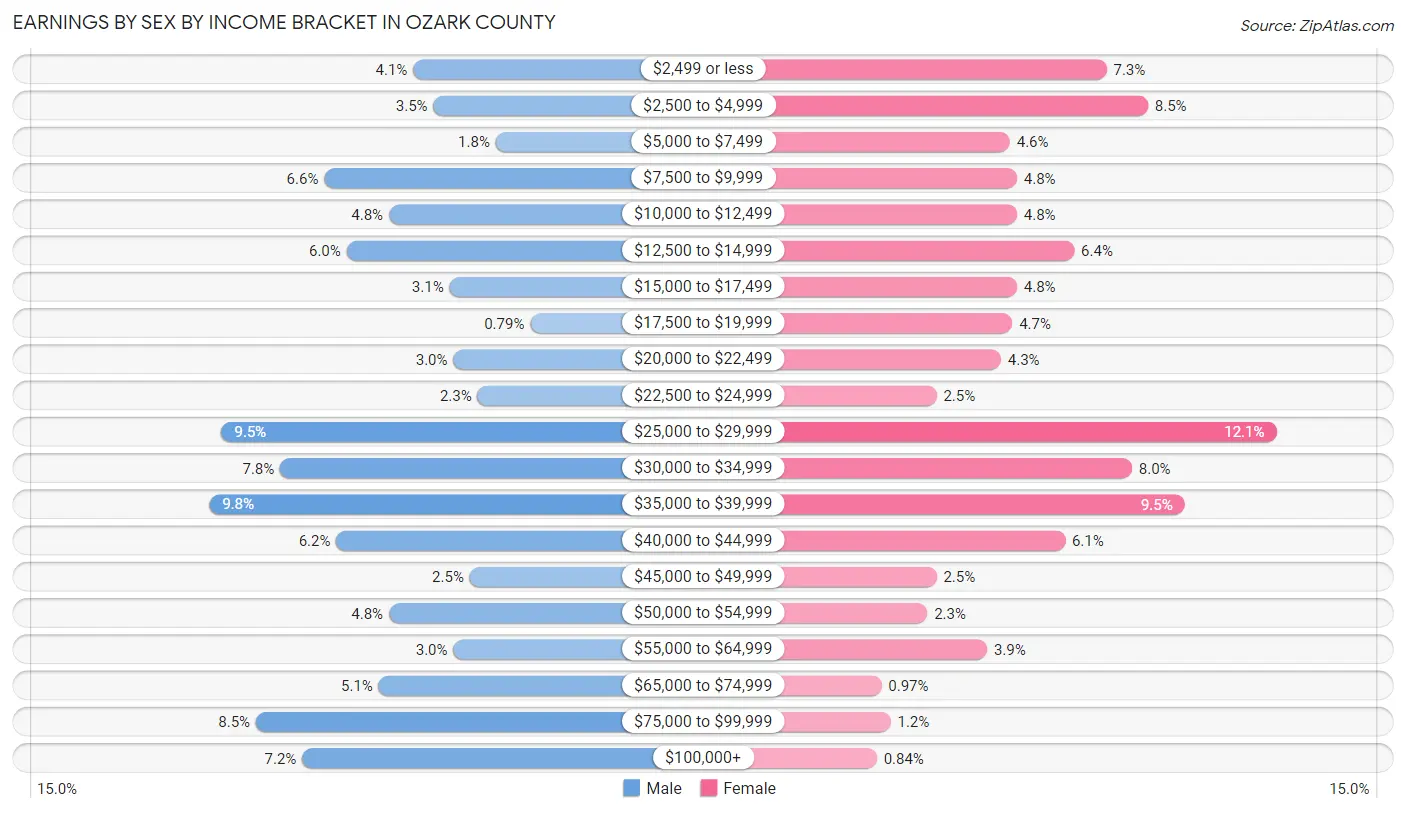
Earnings by Sex by Income Bracket in Ozark County
The most common earnings brackets in Ozark County are $35,000 to $39,999 for men (173 | 9.8%) and $25,000 to $29,999 for women (187 | 12.1%).
| Income | Male | Female |
| $2,499 or less | 72 (4.1%) | 113 (7.3%) |
| $2,500 to $4,999 | 62 (3.5%) | 131 (8.5%) |
| $5,000 to $7,499 | 31 (1.8%) | 71 (4.6%) |
| $7,500 to $9,999 | 116 (6.6%) | 74 (4.8%) |
| $10,000 to $12,499 | 84 (4.8%) | 74 (4.8%) |
| $12,500 to $14,999 | 105 (5.9%) | 99 (6.4%) |
| $15,000 to $17,499 | 54 (3.1%) | 74 (4.8%) |
| $17,500 to $19,999 | 14 (0.8%) | 72 (4.6%) |
| $20,000 to $22,499 | 52 (2.9%) | 67 (4.3%) |
| $22,500 to $24,999 | 40 (2.3%) | 39 (2.5%) |
| $25,000 to $29,999 | 167 (9.5%) | 187 (12.1%) |
| $30,000 to $34,999 | 138 (7.8%) | 124 (8.0%) |
| $35,000 to $39,999 | 173 (9.8%) | 147 (9.5%) |
| $40,000 to $44,999 | 110 (6.2%) | 95 (6.1%) |
| $45,000 to $49,999 | 44 (2.5%) | 39 (2.5%) |
| $50,000 to $54,999 | 84 (4.8%) | 35 (2.3%) |
| $55,000 to $64,999 | 52 (2.9%) | 61 (3.9%) |
| $65,000 to $74,999 | 89 (5.1%) | 15 (1.0%) |
| $75,000 to $99,999 | 150 (8.5%) | 19 (1.2%) |
| $100,000+ | 127 (7.2%) | 13 (0.8%) |
| Total | 1,764 (100.0%) | 1,549 (100.0%) |
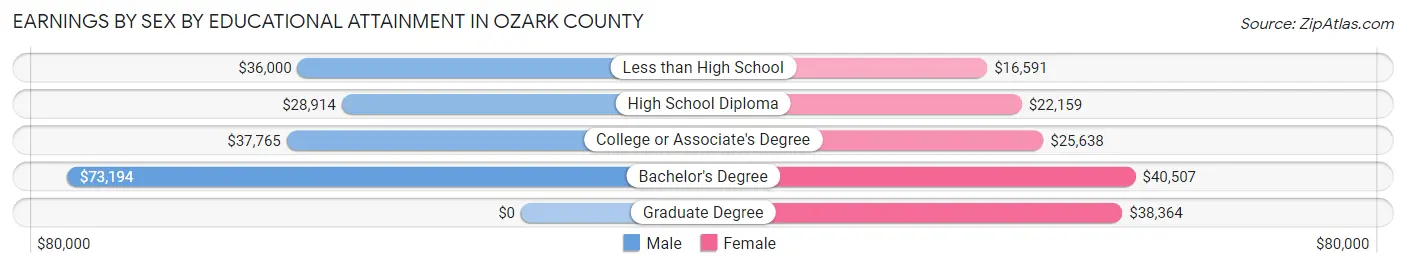
Earnings by Sex by Educational Attainment in Ozark County
Average earnings in Ozark County are $33,958 for men and $25,180 for women, a difference of 25.9%. Men with an educational attainment of bachelor's degree enjoy the highest average annual earnings of $73,194, while those with high school diploma education earn the least with $28,914. Women with an educational attainment of bachelor's degree earn the most with the average annual earnings of $40,507, while those with less than high school education have the smallest earnings of $16,591.
| Educational Attainment | Male Income | Female Income |
| Less than High School | $36,000 | $16,591 |
| High School Diploma | $28,914 | $22,159 |
| College or Associate's Degree | $37,765 | $25,638 |
| Bachelor's Degree | $73,194 | $40,507 |
| Graduate Degree | - | - |
| Total | $33,958 | $25,180 |
Family Income in Ozark County
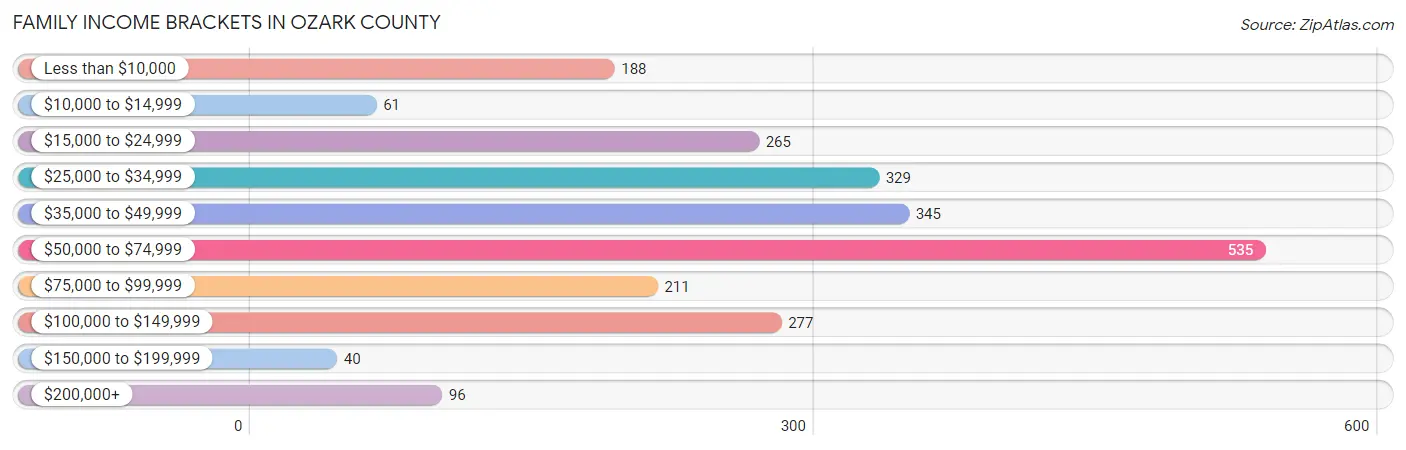
Family Income Brackets in Ozark County
According to the Ozark County family income data, there are 535 families falling into the $50,000 to $74,999 income range, which is the most common income bracket and makes up 22.8% of all families. Conversely, the $150,000 to $199,999 income bracket is the least frequent group with only 40 families (1.7%) belonging to this category.
| Income Bracket | # Families | % Families |
| Less than $10,000 | 188 | 8.0% |
| $10,000 to $14,999 | 61 | 2.6% |
| $15,000 to $24,999 | 265 | 11.3% |
| $25,000 to $34,999 | 329 | 14.0% |
| $35,000 to $49,999 | 345 | 14.7% |
| $50,000 to $74,999 | 535 | 22.8% |
| $75,000 to $99,999 | 211 | 9.0% |
| $100,000 to $149,999 | 277 | 11.8% |
| $150,000 to $199,999 | 40 | 1.7% |
| $200,000+ | 96 | 4.1% |
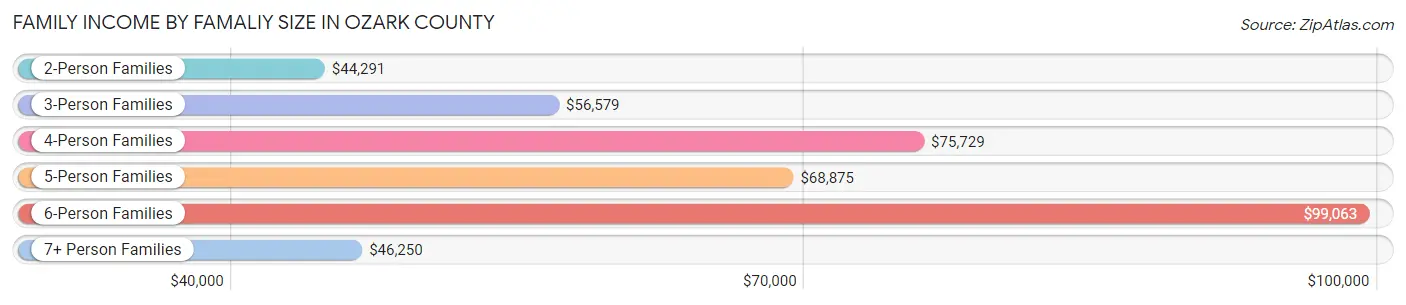
Family Income by Famaliy Size in Ozark County
6-person families (9 | 0.4%) account for the highest median family income in Ozark County with $99,063 per family, while 2-person families (1,503 | 64.0%) have the highest median income of $22,146 per family member.
| Income Bracket | # Families | Median Income |
| 2-Person Families | 1,503 (64.0%) | $44,291 |
| 3-Person Families | 376 (16.0%) | $56,579 |
| 4-Person Families | 269 (11.5%) | $75,729 |
| 5-Person Families | 167 (7.1%) | $68,875 |
| 6-Person Families | 9 (0.4%) | $99,063 |
| 7+ Person Families | 23 (1.0%) | $46,250 |
| Total | 2,347 (100.0%) | $49,116 |
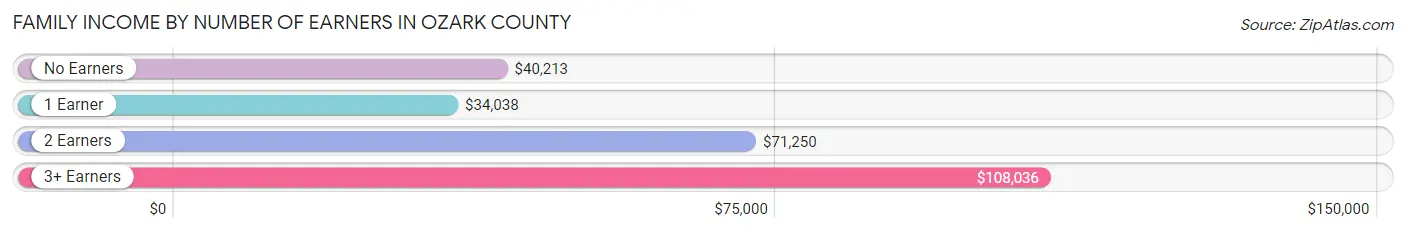
Family Income by Number of Earners in Ozark County
The median family income in Ozark County is $49,116, with families comprising 3+ earners (67) having the highest median family income of $108,036, while families with 1 earner (706) have the lowest median family income of $34,038, accounting for 2.9% and 30.1% of families, respectively.
| Number of Earners | # Families | Median Income |
| No Earners | 851 (36.3%) | $40,213 |
| 1 Earner | 706 (30.1%) | $34,038 |
| 2 Earners | 723 (30.8%) | $71,250 |
| 3+ Earners | 67 (2.9%) | $108,036 |
| Total | 2,347 (100.0%) | $49,116 |
Household Income in Ozark County
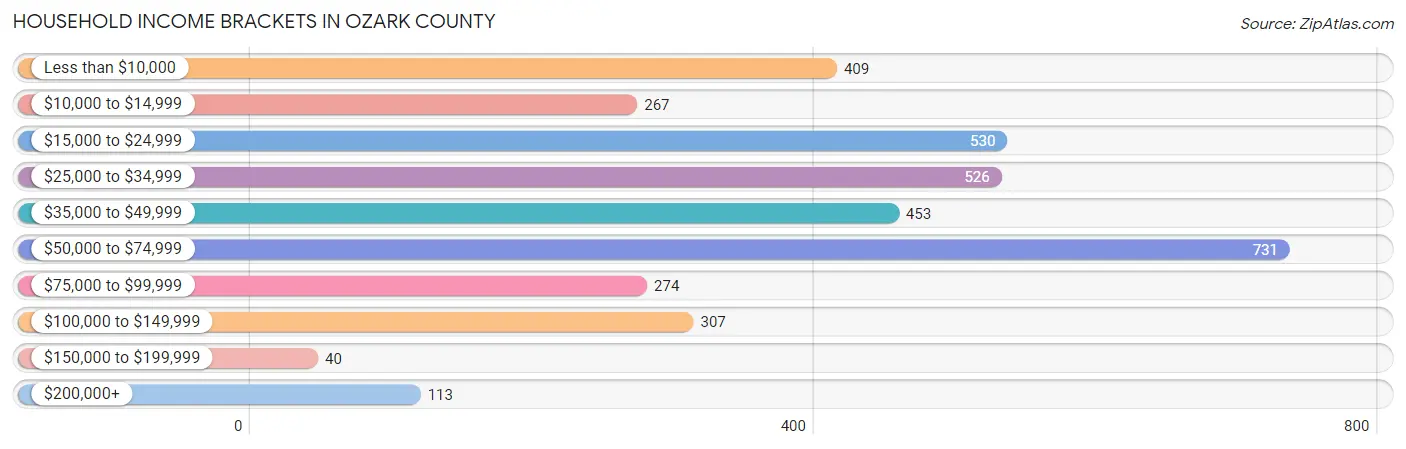
Household Income Brackets in Ozark County
With 731 households falling in the category, the $50,000 to $74,999 income range is the most frequent in Ozark County, accounting for 20.0% of all households. In contrast, only 40 households (1.1%) fall into the $150,000 to $199,999 income bracket, making it the least populous group.
| Income Bracket | # Households | % Households |
| Less than $10,000 | 409 | 11.2% |
| $10,000 to $14,999 | 267 | 7.3% |
| $15,000 to $24,999 | 530 | 14.5% |
| $25,000 to $34,999 | 526 | 14.4% |
| $35,000 to $49,999 | 453 | 12.4% |
| $50,000 to $74,999 | 731 | 20.0% |
| $75,000 to $99,999 | 274 | 7.5% |
| $100,000 to $149,999 | 307 | 8.4% |
| $150,000 to $199,999 | 40 | 1.1% |
| $200,000+ | 113 | 3.1% |
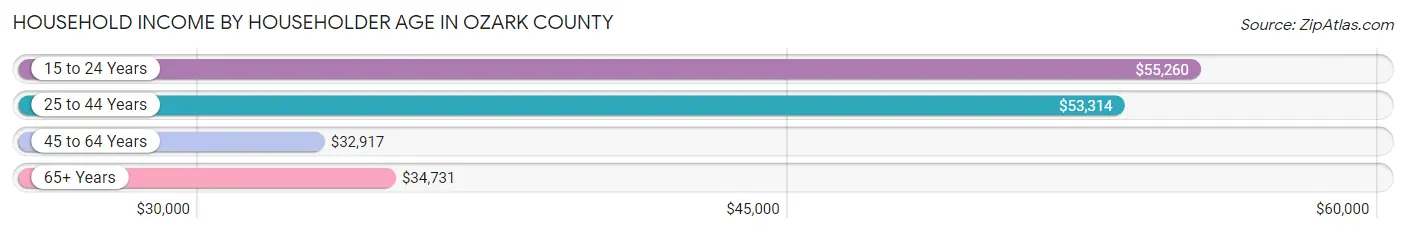
Household Income by Householder Age in Ozark County
The median household income in Ozark County is $39,125, with the highest median household income of $55,260 found in the 15 to 24 years age bracket for the primary householder. A total of 49 households (1.3%) fall into this category. Meanwhile, the 45 to 64 years age bracket for the primary householder has the lowest median household income of $32,917, with 1,463 households (40.0%) in this group.
| Income Bracket | # Households | Median Income |
| 15 to 24 Years | 49 (1.3%) | $55,260 |
| 25 to 44 Years | 620 (17.0%) | $53,314 |
| 45 to 64 Years | 1,463 (40.0%) | $32,917 |
| 65+ Years | 1,522 (41.6%) | $34,731 |
| Total | 3,654 (100.0%) | $39,125 |
Poverty in Ozark County
Income Below Poverty by Sex and Age in Ozark County
With 20.7% poverty level for males and 24.3% for females among the residents of Ozark County, 15 year old males and 6 to 11 year old females are the most vulnerable to poverty, with 34 males (55.7%) and 93 females (49.5%) in their respective age groups living below the poverty level.
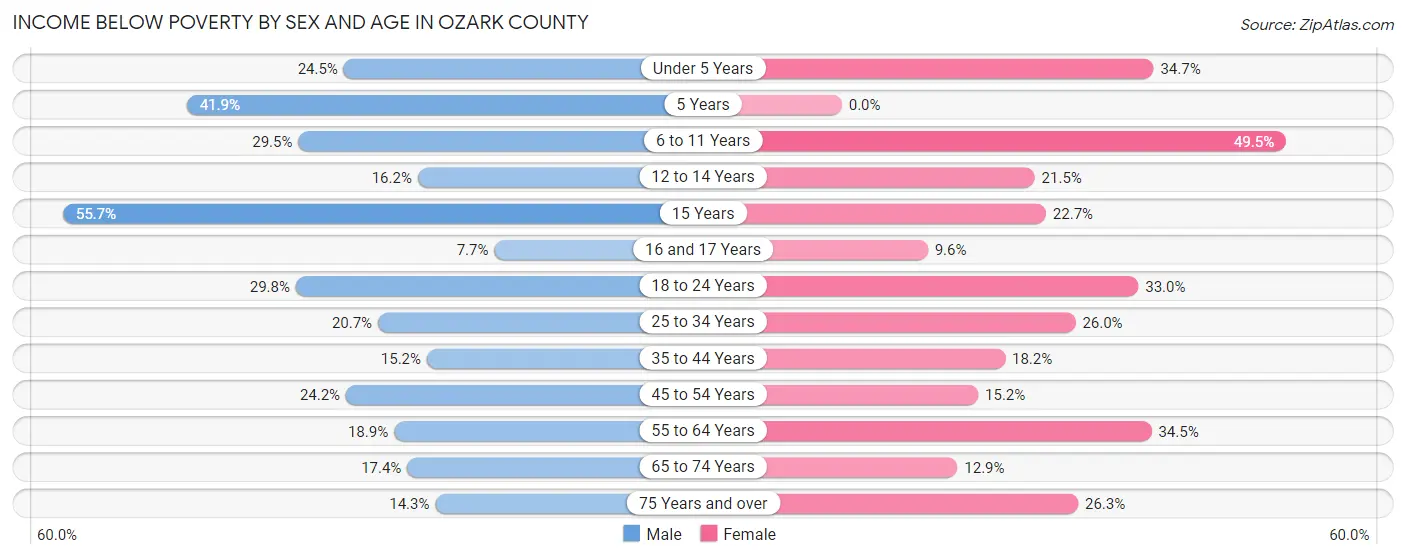
| Age Bracket | Male | Female |
| Under 5 Years | 34 (24.5%) | 59 (34.7%) |
| 5 Years | 13 (41.9%) | 0 (0.0%) |
| 6 to 11 Years | 111 (29.5%) | 93 (49.5%) |
| 12 to 14 Years | 18 (16.2%) | 58 (21.5%) |
| 15 Years | 34 (55.7%) | 15 (22.7%) |
| 16 and 17 Years | 7 (7.7%) | 9 (9.6%) |
| 18 to 24 Years | 73 (29.8%) | 71 (33.0%) |
| 25 to 34 Years | 70 (20.6%) | 89 (26.0%) |
| 35 to 44 Years | 62 (15.2%) | 78 (18.2%) |
| 45 to 54 Years | 122 (24.2%) | 75 (15.2%) |
| 55 to 64 Years | 142 (18.9%) | 268 (34.5%) |
| 65 to 74 Years | 129 (17.4%) | 88 (12.9%) |
| 75 Years and over | 67 (14.3%) | 146 (26.3%) |
| Total | 882 (20.7%) | 1,049 (24.3%) |
Income Above Poverty by Sex and Age in Ozark County
According to the poverty statistics in Ozark County, males aged 16 and 17 years and females aged 5 years are the age groups that are most secure financially, with 92.3% of males and 100.0% of females in these age groups living above the poverty line.
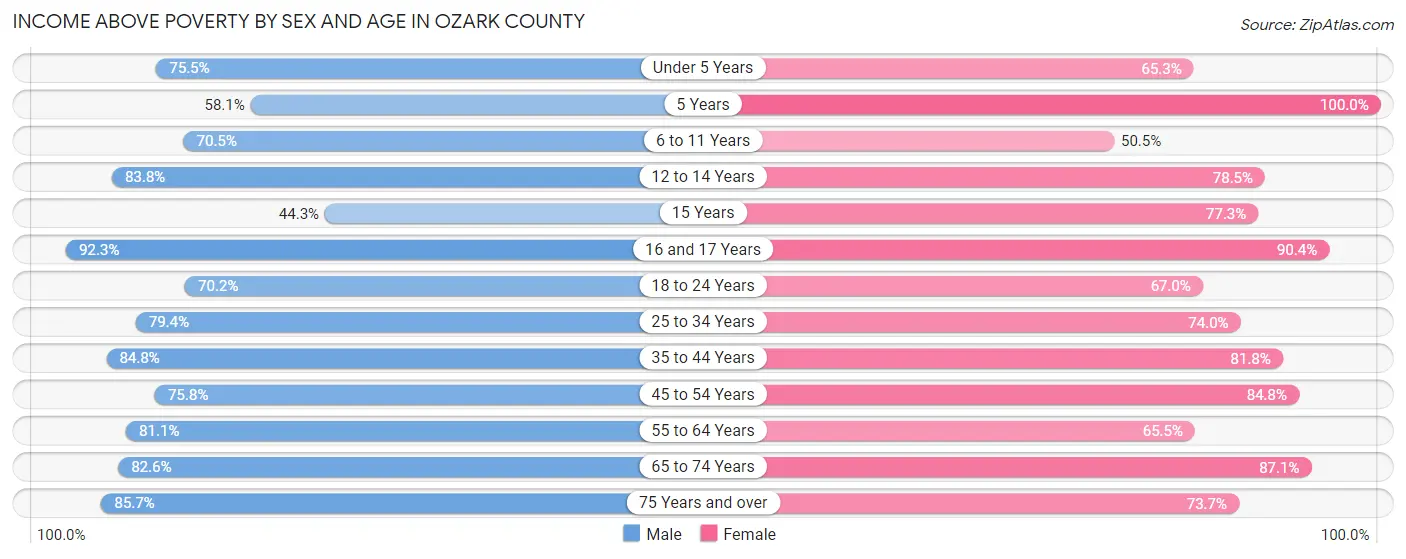
| Age Bracket | Male | Female |
| Under 5 Years | 105 (75.5%) | 111 (65.3%) |
| 5 Years | 18 (58.1%) | 39 (100.0%) |
| 6 to 11 Years | 265 (70.5%) | 95 (50.5%) |
| 12 to 14 Years | 93 (83.8%) | 212 (78.5%) |
| 15 Years | 27 (44.3%) | 51 (77.3%) |
| 16 and 17 Years | 84 (92.3%) | 85 (90.4%) |
| 18 to 24 Years | 172 (70.2%) | 144 (67.0%) |
| 25 to 34 Years | 269 (79.3%) | 253 (74.0%) |
| 35 to 44 Years | 346 (84.8%) | 351 (81.8%) |
| 45 to 54 Years | 382 (75.8%) | 419 (84.8%) |
| 55 to 64 Years | 611 (81.1%) | 509 (65.5%) |
| 65 to 74 Years | 613 (82.6%) | 596 (87.1%) |
| 75 Years and over | 403 (85.7%) | 409 (73.7%) |
| Total | 3,388 (79.3%) | 3,274 (75.7%) |
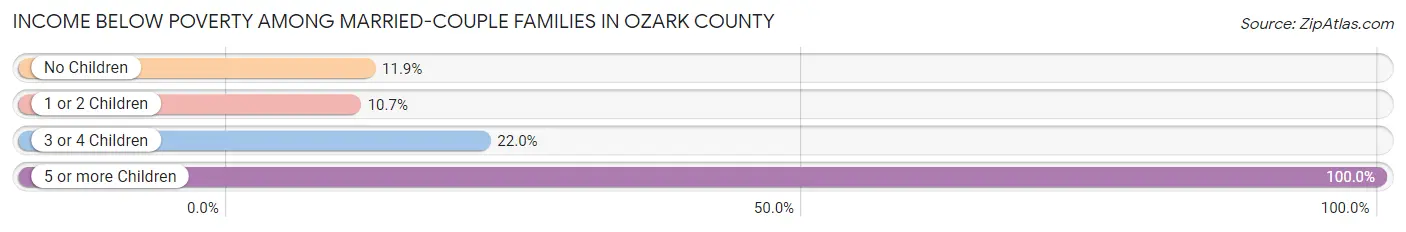
Income Below Poverty Among Married-Couple Families in Ozark County
The poverty statistics for married-couple families in Ozark County show that 12.7% or 268 of the total 2,115 families live below the poverty line. Families with 5 or more children have the highest poverty rate of 100.0%, comprising of 8 families. On the other hand, families with 1 or 2 children have the lowest poverty rate of 10.7%, which includes 39 families.
| Children | Above Poverty | Below Poverty |
| No Children | 1,418 (88.1%) | 192 (11.9%) |
| 1 or 2 Children | 326 (89.3%) | 39 (10.7%) |
| 3 or 4 Children | 103 (78.0%) | 29 (22.0%) |
| 5 or more Children | 0 (0.0%) | 8 (100.0%) |
| Total | 1,847 (87.3%) | 268 (12.7%) |
Income Below Poverty Among Single-Parent Households in Ozark County
According to the poverty data in Ozark County, 41.8% or 33 single-father households and 62.7% or 96 single-mother households are living below the poverty line. Among single-father households, those with 3 or 4 children have the highest poverty rate, with 2 households (100.0%) experiencing poverty. Likewise, among single-mother households, those with 3 or 4 children have the highest poverty rate, with 20 households (69.0%) falling below the poverty line.
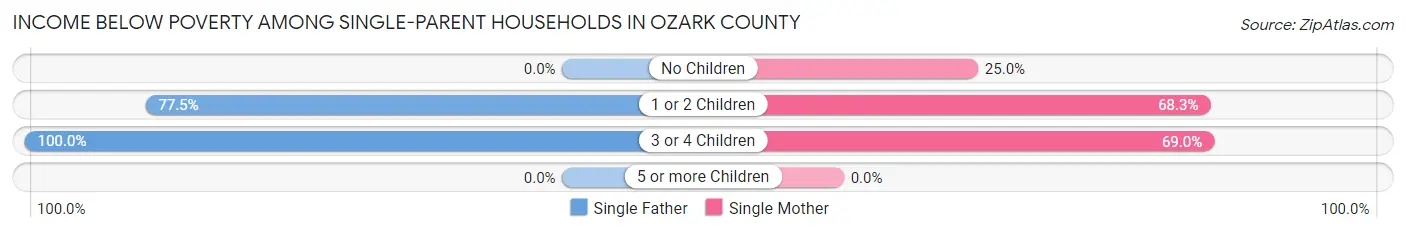
| Children | Single Father | Single Mother |
| No Children | 0 (0.0%) | 5 (25.0%) |
| 1 or 2 Children | 31 (77.5%) | 71 (68.3%) |
| 3 or 4 Children | 2 (100.0%) | 20 (69.0%) |
| 5 or more Children | 0 (0.0%) | 0 (0.0%) |
| Total | 33 (41.8%) | 96 (62.7%) |
Income Below Poverty Among Married-Couple vs Single-Parent Households in Ozark County
The poverty data for Ozark County shows that 268 of the married-couple family households (12.7%) and 129 of the single-parent households (55.6%) are living below the poverty level. Within the married-couple family households, those with 5 or more children have the highest poverty rate, with 8 households (100.0%) falling below the poverty line. Among the single-parent households, those with 3 or 4 children have the highest poverty rate, with 22 household (71.0%) living below poverty.
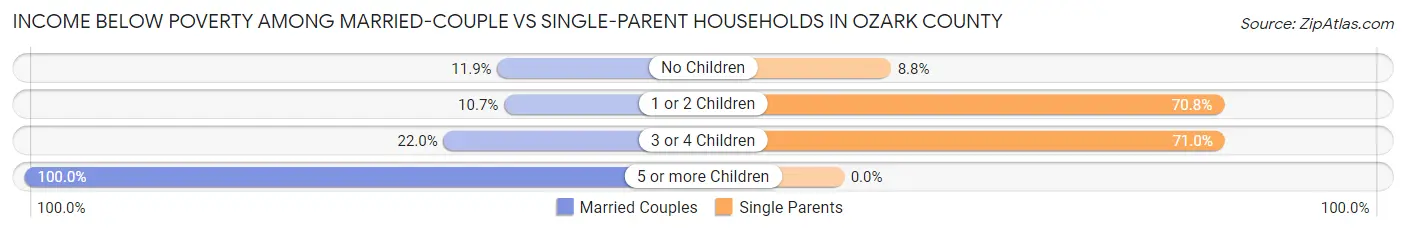
| Children | Married-Couple Families | Single-Parent Households |
| No Children | 192 (11.9%) | 5 (8.8%) |
| 1 or 2 Children | 39 (10.7%) | 102 (70.8%) |
| 3 or 4 Children | 29 (22.0%) | 22 (71.0%) |
| 5 or more Children | 8 (100.0%) | 0 (0.0%) |
| Total | 268 (12.7%) | 129 (55.6%) |
Race in Ozark County
The most populous races in Ozark County are White / Caucasian (8,222 | 94.6%), Two or more Races (347 | 4.0%), and Hispanic or Latino (180 | 2.1%).
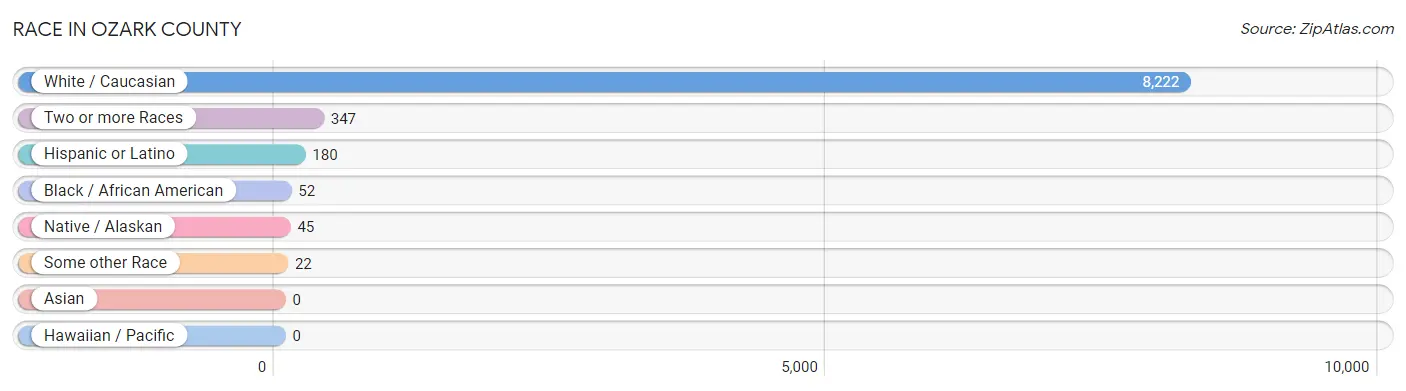
| Race | # Population | % Population |
| Asian | 0 | 0.0% |
| Black / African American | 52 | 0.6% |
| Hawaiian / Pacific | 0 | 0.0% |
| Hispanic or Latino | 180 | 2.1% |
| Native / Alaskan | 45 | 0.5% |
| White / Caucasian | 8,222 | 94.6% |
| Two or more Races | 347 | 4.0% |
| Some other Race | 22 | 0.3% |
| Total | 8,688 | 100.0% |
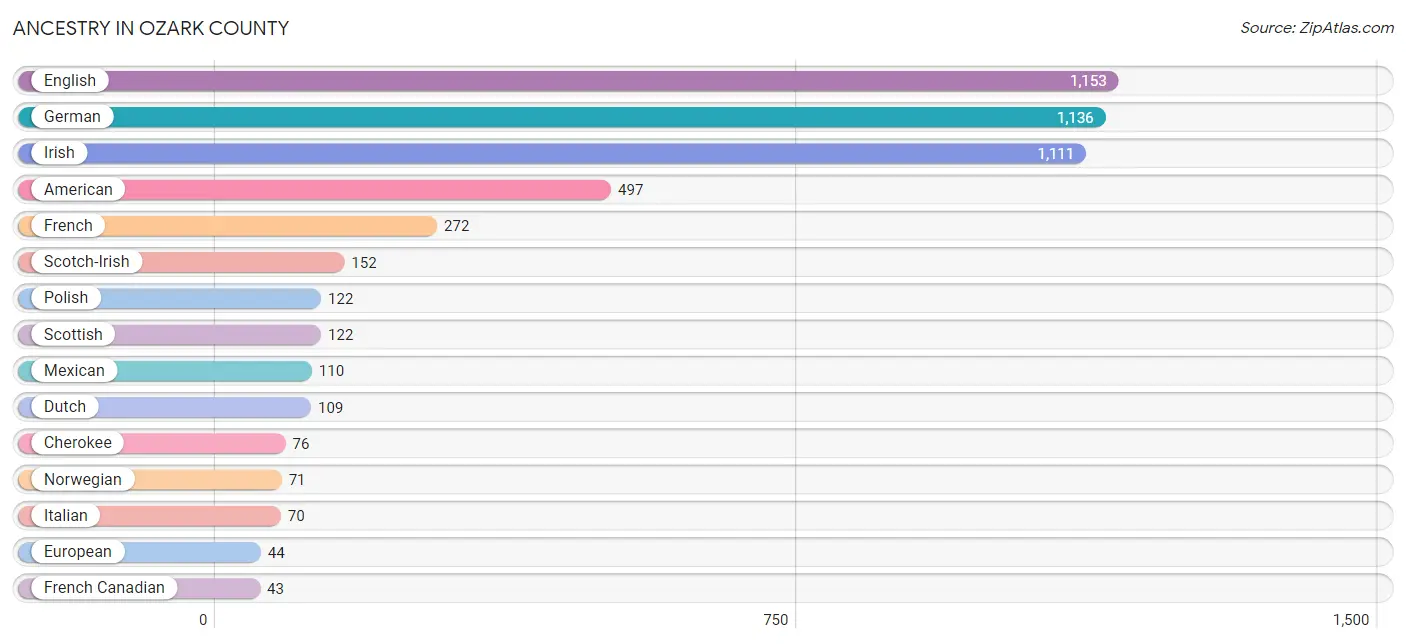
Ancestry in Ozark County
The most populous ancestries reported in Ozark County are English (1,153 | 13.3%), German (1,136 | 13.1%), Irish (1,111 | 12.8%), American (497 | 5.7%), and French (272 | 3.1%), together accounting for 48.0% of all Ozark County residents.
| Ancestry | # Population | % Population |
| American | 497 | 5.7% |
| Arab | 6 | 0.1% |
| Austrian | 17 | 0.2% |
| Belgian | 4 | 0.1% |
| Blackfeet | 14 | 0.2% |
| Cajun | 26 | 0.3% |
| Central American Indian | 10 | 0.1% |
| Cherokee | 76 | 0.9% |
| Choctaw | 3 | 0.0% |
| Colombian | 15 | 0.2% |
| Colville | 1 | 0.0% |
| Croatian | 3 | 0.0% |
| Czech | 9 | 0.1% |
| Czechoslovakian | 6 | 0.1% |
| Danish | 24 | 0.3% |
| Dutch | 109 | 1.3% |
| Eastern European | 7 | 0.1% |
| English | 1,153 | 13.3% |
| European | 44 | 0.5% |
| French | 272 | 3.1% |
| French Canadian | 43 | 0.5% |
| German | 1,136 | 13.1% |
| Hungarian | 2 | 0.0% |
| Indian (Asian) | 1 | 0.0% |
| Irish | 1,111 | 12.8% |
| Italian | 70 | 0.8% |
| Lithuanian | 12 | 0.1% |
| Mexican | 110 | 1.3% |
| Northern European | 5 | 0.1% |
| Norwegian | 71 | 0.8% |
| Polish | 122 | 1.4% |
| Portuguese | 8 | 0.1% |
| Puerto Rican | 15 | 0.2% |
| Russian | 2 | 0.0% |
| Scandinavian | 5 | 0.1% |
| Scotch-Irish | 152 | 1.8% |
| Scottish | 122 | 1.4% |
| Serbian | 3 | 0.0% |
| Slovak | 18 | 0.2% |
| South American | 15 | 0.2% |
| Spanish | 26 | 0.3% |
| Swedish | 40 | 0.5% |
| Swiss | 10 | 0.1% |
| Ukrainian | 4 | 0.1% |
| Welsh | 18 | 0.2% | View All 45 Rows |
Immigrants in Ozark County
The most numerous immigrant groups reported in Ozark County came from Central America (36 | 0.4%), Latin America (36 | 0.4%), Mexico (36 | 0.4%), Africa (11 | 0.1%), and South Africa (11 | 0.1%), together accounting for 1.5% of all Ozark County residents.
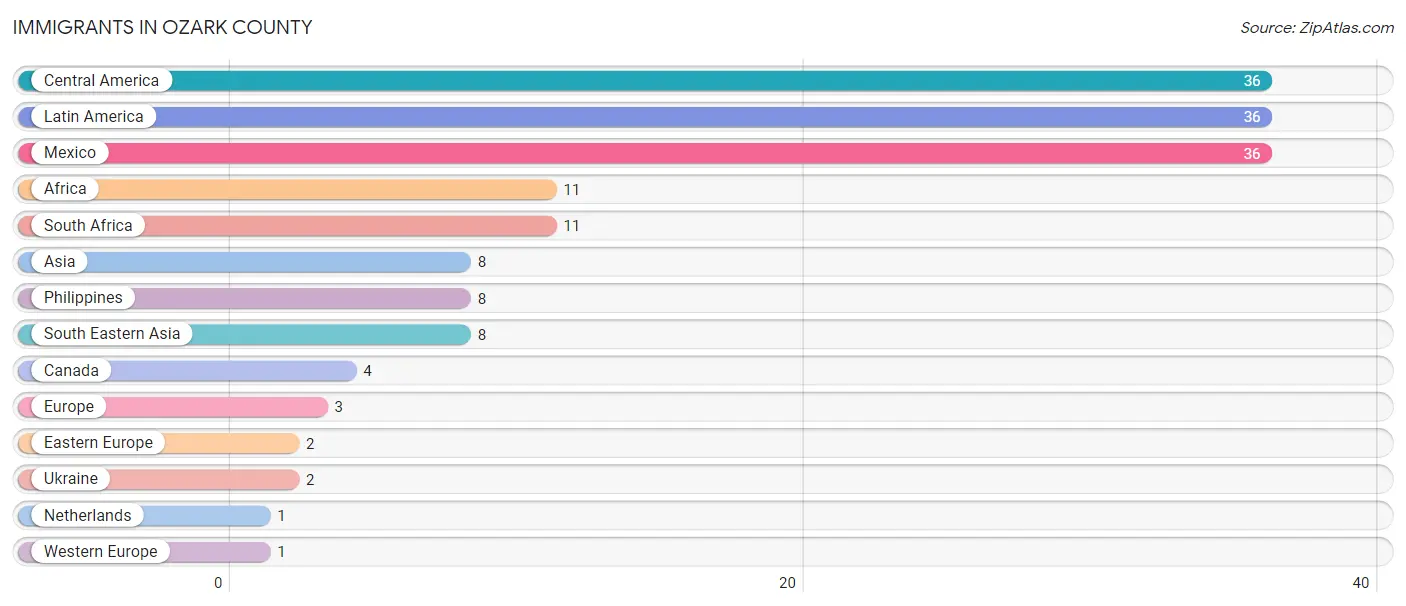
| Immigration Origin | # Population | % Population |
| Africa | 11 | 0.1% |
| Asia | 8 | 0.1% |
| Canada | 4 | 0.1% |
| Central America | 36 | 0.4% |
| Eastern Europe | 2 | 0.0% |
| Europe | 3 | 0.0% |
| Latin America | 36 | 0.4% |
| Mexico | 36 | 0.4% |
| Netherlands | 1 | 0.0% |
| Philippines | 8 | 0.1% |
| South Africa | 11 | 0.1% |
| South Eastern Asia | 8 | 0.1% |
| Ukraine | 2 | 0.0% |
| Western Europe | 1 | 0.0% | View All 14 Rows |
Sex and Age in Ozark County
Sex and Age in Ozark County
The most populous age groups in Ozark County are 65 to 69 Years (483 | 11.1%) for men and 60 to 64 Years (428 | 9.9%) for women.
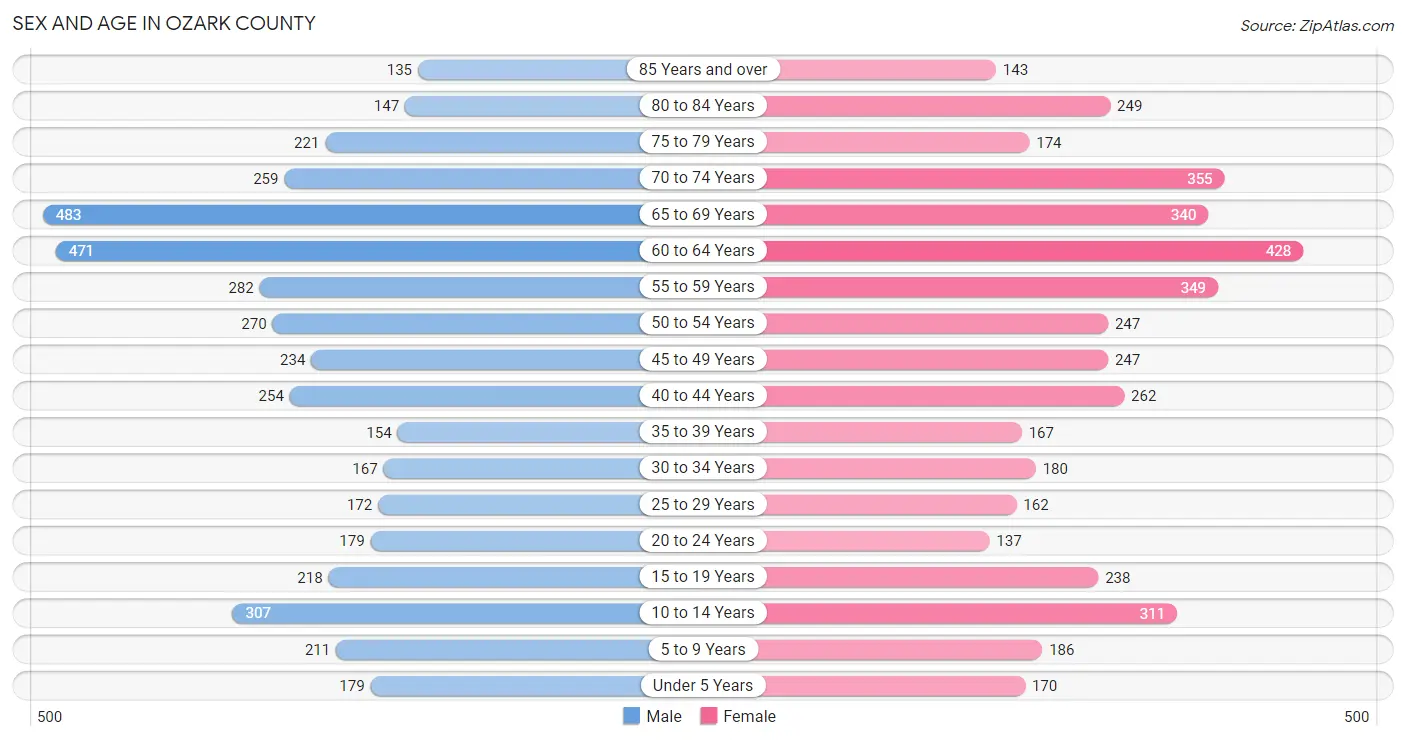
| Age Bracket | Male | Female |
| Under 5 Years | 179 (4.1%) | 170 (3.9%) |
| 5 to 9 Years | 211 (4.9%) | 186 (4.3%) |
| 10 to 14 Years | 307 (7.1%) | 311 (7.2%) |
| 15 to 19 Years | 218 (5.0%) | 238 (5.5%) |
| 20 to 24 Years | 179 (4.1%) | 137 (3.2%) |
| 25 to 29 Years | 172 (4.0%) | 162 (3.7%) |
| 30 to 34 Years | 167 (3.8%) | 180 (4.1%) |
| 35 to 39 Years | 154 (3.5%) | 167 (3.8%) |
| 40 to 44 Years | 254 (5.9%) | 262 (6.0%) |
| 45 to 49 Years | 234 (5.4%) | 247 (5.7%) |
| 50 to 54 Years | 270 (6.2%) | 247 (5.7%) |
| 55 to 59 Years | 282 (6.5%) | 349 (8.0%) |
| 60 to 64 Years | 471 (10.8%) | 428 (9.9%) |
| 65 to 69 Years | 483 (11.1%) | 340 (7.8%) |
| 70 to 74 Years | 259 (6.0%) | 355 (8.2%) |
| 75 to 79 Years | 221 (5.1%) | 174 (4.0%) |
| 80 to 84 Years | 147 (3.4%) | 249 (5.7%) |
| 85 Years and over | 135 (3.1%) | 143 (3.3%) |
| Total | 4,343 (100.0%) | 4,345 (100.0%) |
Families and Households in Ozark County
Median Family Size in Ozark County
The median family size in Ozark County is 2.96 persons per family, with single male/father families (79 | 3.4%) accounting for the largest median family size of 4.29 persons per family. On the other hand, married-couple families (2,115 | 90.1%) represent the smallest median family size with 2.84 persons per family.
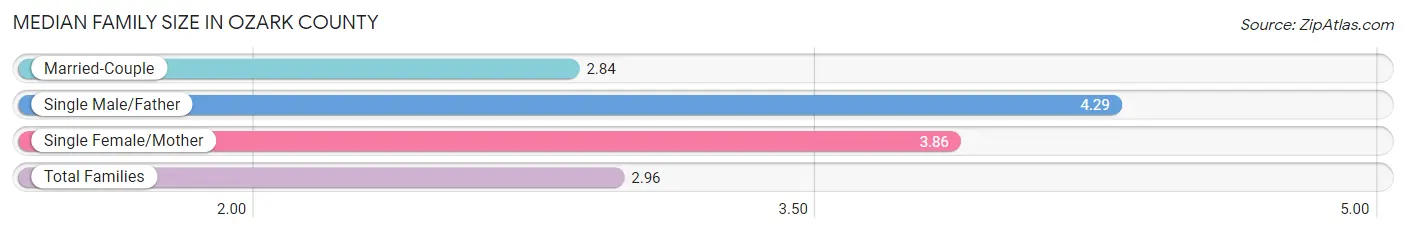
| Family Type | # Families | Family Size |
| Married-Couple | 2,115 (90.1%) | 2.84 |
| Single Male/Father | 79 (3.4%) | 4.29 |
| Single Female/Mother | 153 (6.5%) | 3.86 |
| Total Families | 2,347 (100.0%) | 2.96 |
Median Household Size in Ozark County
The median household size in Ozark County is 2.36 persons per household, with single male/father households (79 | 2.2%) accounting for the largest median household size of 4.66 persons per household. non-family households (1,307 | 35.8%) represent the smallest median household size with 1.22 persons per household.
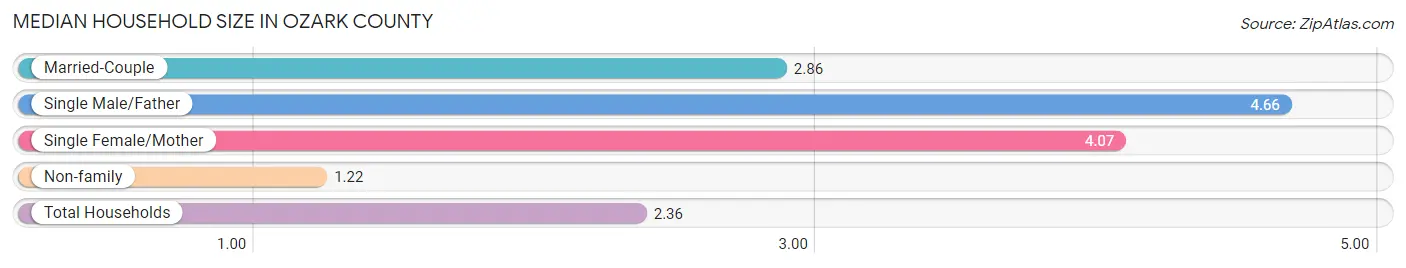
| Household Type | # Households | Household Size |
| Married-Couple | 2,115 (57.9%) | 2.86 |
| Single Male/Father | 79 (2.2%) | 4.66 |
| Single Female/Mother | 153 (4.2%) | 4.07 |
| Non-family | 1,307 (35.8%) | 1.22 |
| Total Households | 3,654 (100.0%) | 2.36 |
Household Size by Marriage Status in Ozark County
Out of a total of 3,654 households in Ozark County, 2,347 (64.2%) are family households, while 1,307 (35.8%) are nonfamily households. The most numerous type of family households are 2-person households, comprising 1,489, and the most common type of nonfamily households are 1-person households, comprising 1,135.
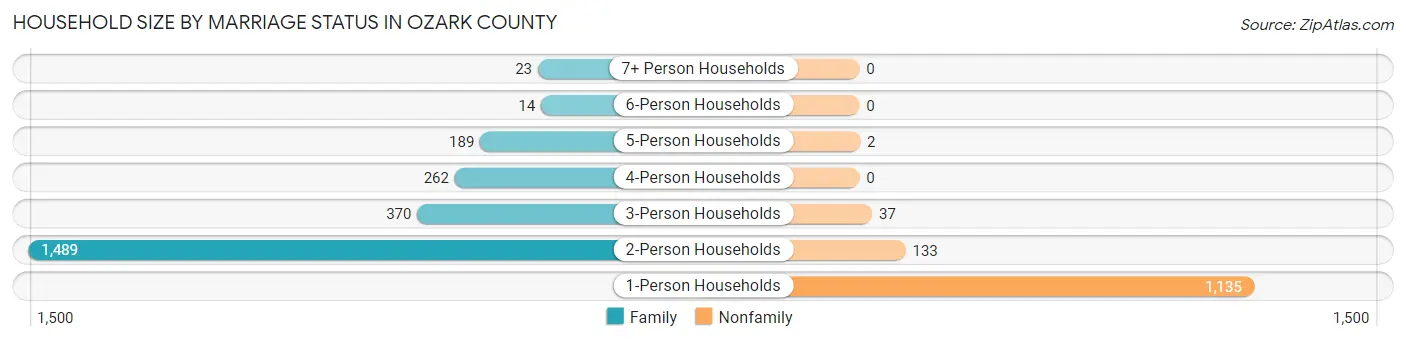
| Household Size | Family Households | Nonfamily Households |
| 1-Person Households | - | 1,135 (31.1%) |
| 2-Person Households | 1,489 (40.7%) | 133 (3.6%) |
| 3-Person Households | 370 (10.1%) | 37 (1.0%) |
| 4-Person Households | 262 (7.2%) | 0 (0.0%) |
| 5-Person Households | 189 (5.2%) | 2 (0.1%) |
| 6-Person Households | 14 (0.4%) | 0 (0.0%) |
| 7+ Person Households | 23 (0.6%) | 0 (0.0%) |
| Total | 2,347 (64.2%) | 1,307 (35.8%) |
Female Fertility in Ozark County
Fertility by Age in Ozark County
Average fertility rate in Ozark County is 46.0 births per 1,000 women. Women in the age bracket of 15 to 19 years have the highest fertility rate with 101.0 births per 1,000 women. Women in the age bracket of 20 to 34 years acount for 44.6% of all women with births.
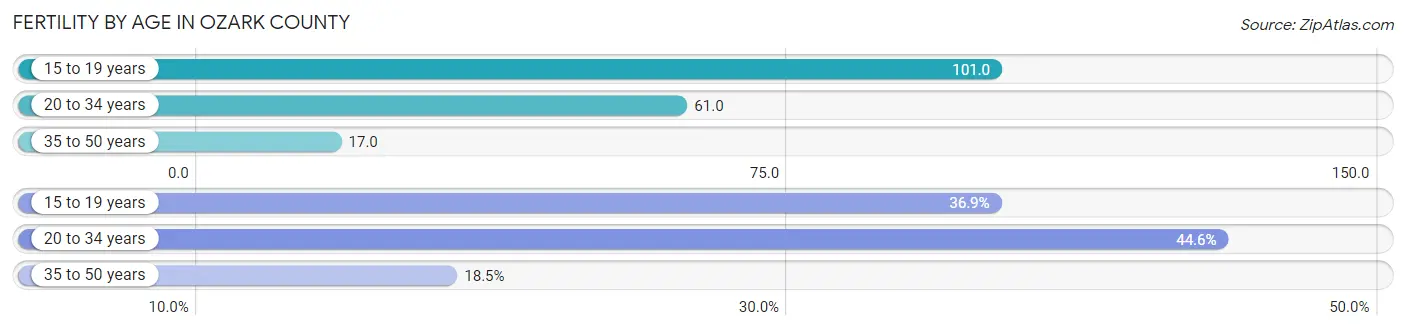
| Age Bracket | Women with Births | Births / 1,000 Women |
| 15 to 19 years | 24 (36.9%) | 101.0 |
| 20 to 34 years | 29 (44.6%) | 61.0 |
| 35 to 50 years | 12 (18.5%) | 17.0 |
| Total | 65 (100.0%) | 46.0 |
Fertility by Age by Marriage Status in Ozark County
56.9% of women with births (65) in Ozark County are married. The highest percentage of unmarried women with births falls into 15 to 19 years age bracket with 100.0% of them unmarried at the time of birth, while the lowest percentage of unmarried women with births belong to 20 to 34 years age bracket with 3.4% of them unmarried.
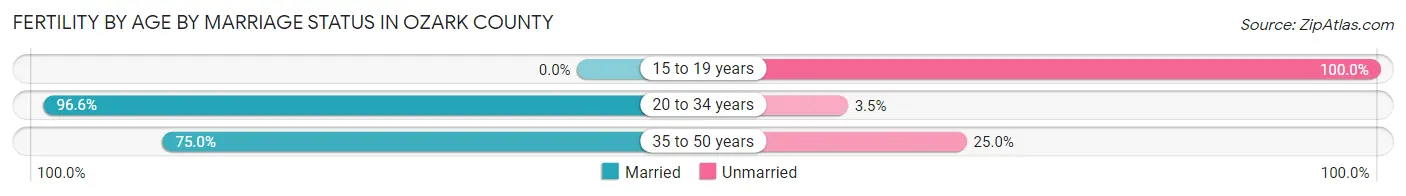
| Age Bracket | Married | Unmarried |
| 15 to 19 years | 0 (0.0%) | 24 (100.0%) |
| 20 to 34 years | 28 (96.6%) | 1 (3.5%) |
| 35 to 50 years | 9 (75.0%) | 3 (25.0%) |
| Total | 37 (56.9%) | 28 (43.1%) |
Fertility by Education in Ozark County
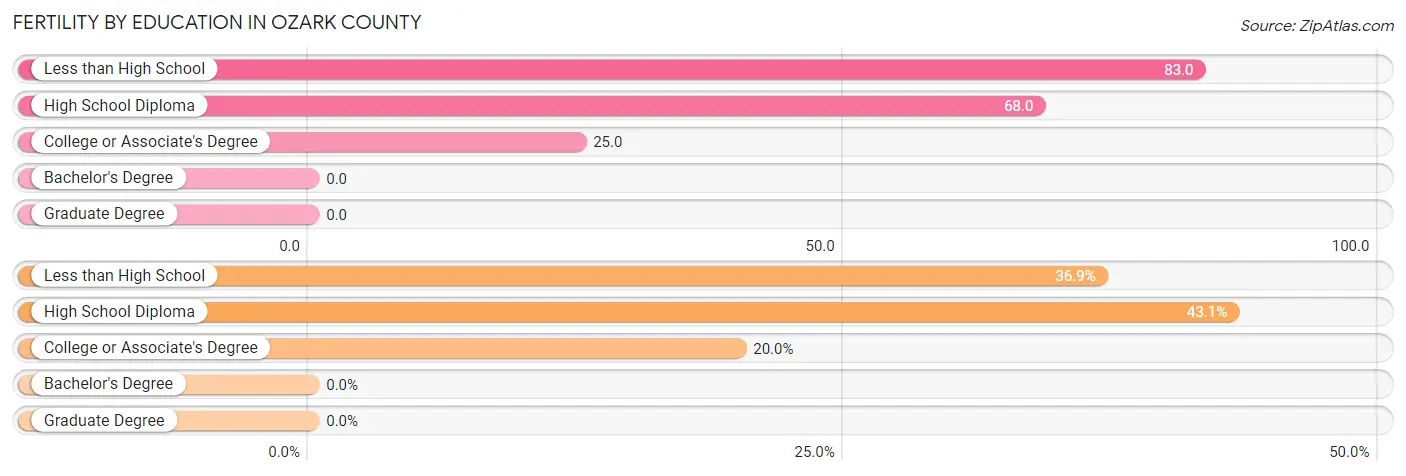
| Educational Attainment | Women with Births | Births / 1,000 Women |
| Less than High School | 24 (36.9%) | 83.0 |
| High School Diploma | 28 (43.1%) | 68.0 |
| College or Associate's Degree | 13 (20.0%) | 25.0 |
| Bachelor's Degree | 0 (0.0%) | 0.0 |
| Graduate Degree | 0 (0.0%) | 0.0 |
| Total | 65 (100.0%) | 46.0 |
Fertility by Education by Marriage Status in Ozark County
43.1% of women with births in Ozark County are unmarried. Women with the educational attainment of high school diploma are most likely to be married with 100.0% of them married at childbirth, while women with the educational attainment of less than high school are least likely to be married with 100.0% of them unmarried at childbirth.
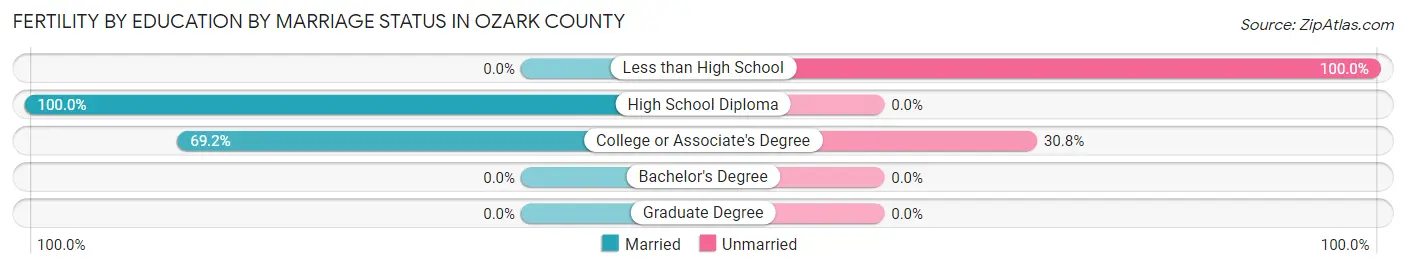
| Educational Attainment | Married | Unmarried |
| Less than High School | 0 (0.0%) | 24 (100.0%) |
| High School Diploma | 28 (100.0%) | 0 (0.0%) |
| College or Associate's Degree | 9 (69.2%) | 4 (30.8%) |
| Bachelor's Degree | 0 (0.0%) | 0 (0.0%) |
| Graduate Degree | 0 (0.0%) | 0 (0.0%) |
| Total | 37 (56.9%) | 28 (43.1%) |
Employment Characteristics in Ozark County
Employment by Class of Employer in Ozark County
Among the 2,892 employed individuals in Ozark County, private company employees (1,806 | 62.5%), self-employed (not incorporated) (346 | 12.0%), and not-for-profit organizations (202 | 7.0%) make up the most common classes of employment.
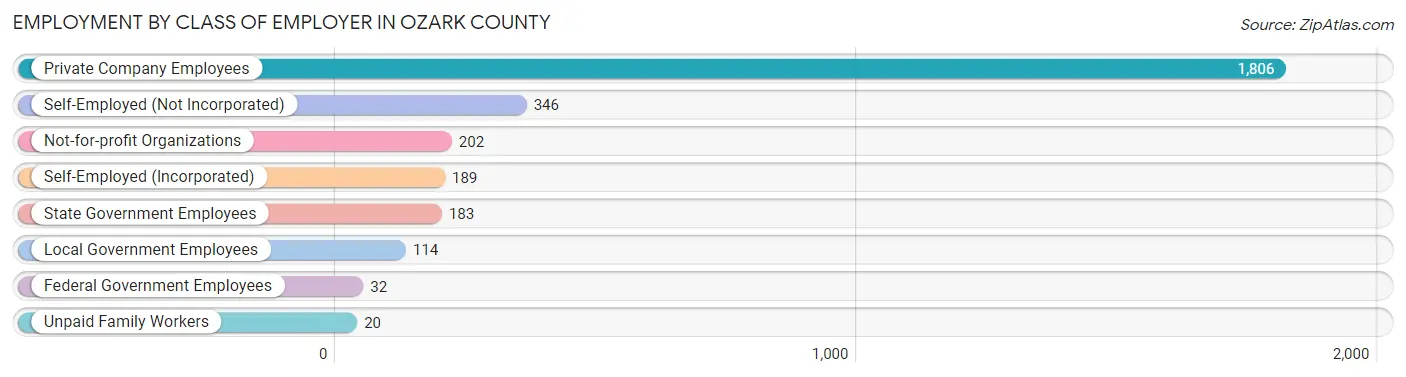
| Employer Class | # Employees | % Employees |
| Private Company Employees | 1,806 | 62.5% |
| Self-Employed (Incorporated) | 189 | 6.5% |
| Self-Employed (Not Incorporated) | 346 | 12.0% |
| Not-for-profit Organizations | 202 | 7.0% |
| Local Government Employees | 114 | 3.9% |
| State Government Employees | 183 | 6.3% |
| Federal Government Employees | 32 | 1.1% |
| Unpaid Family Workers | 20 | 0.7% |
| Total | 2,892 | 100.0% |
Employment Status by Age in Ozark County
According to the labor force statistics for Ozark County, out of the total population over 16 years of age (7,197), 44.0% or 3,167 individuals are in the labor force, with 6.2% or 196 of them unemployed. The age group with the highest labor force participation rate is 30 to 34 years, with 83.3% or 289 individuals in the labor force. Within the labor force, the 16 to 19 years age range has the highest percentage of unemployed individuals, with 54.4% or 68 of them being unemployed.
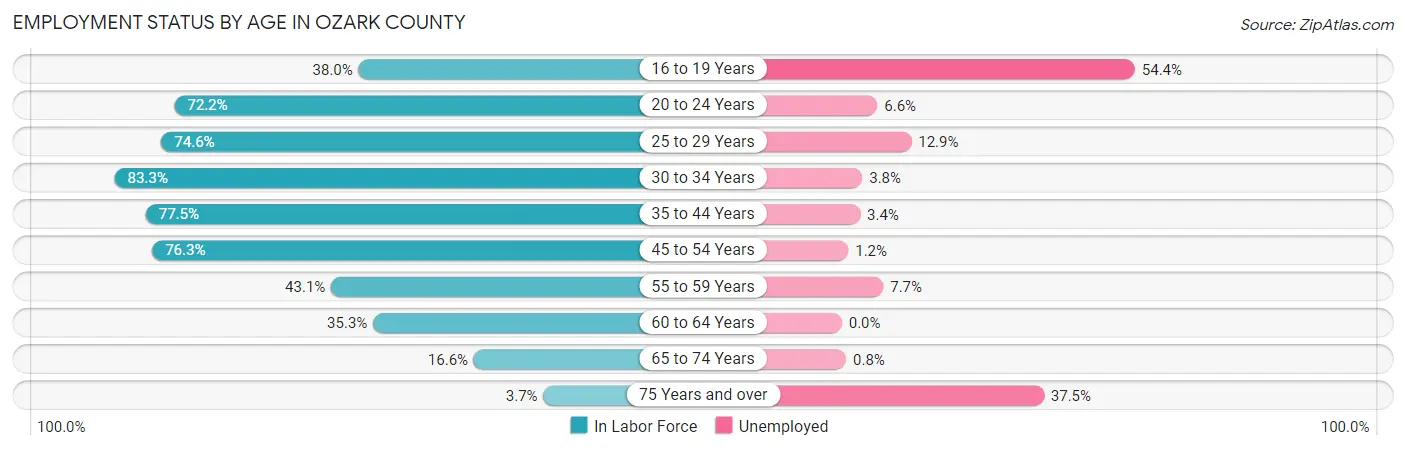
| Age Bracket | In Labor Force | Unemployed |
| 16 to 19 Years | 125 (38.0%) | 68 (54.4%) |
| 20 to 24 Years | 228 (72.2%) | 15 (6.6%) |
| 25 to 29 Years | 249 (74.6%) | 32 (12.9%) |
| 30 to 34 Years | 289 (83.3%) | 11 (3.8%) |
| 35 to 44 Years | 649 (77.5%) | 22 (3.4%) |
| 45 to 54 Years | 761 (76.3%) | 9 (1.2%) |
| 55 to 59 Years | 272 (43.1%) | 21 (7.7%) |
| 60 to 64 Years | 317 (35.3%) | 0 (0.0%) |
| 65 to 74 Years | 239 (16.6%) | 2 (0.8%) |
| 75 Years and over | 40 (3.7%) | 15 (37.5%) |
| Total | 3,167 (44.0%) | 196 (6.2%) |
Employment Status by Educational Attainment in Ozark County
According to labor force statistics for Ozark County, 62.7% of individuals (2,537) out of the total population between 25 and 64 years of age (4,046) are in the labor force, with 3.7% or 94 of them being unemployed. The group with the highest labor force participation rate are those with the educational attainment of bachelor's degree or higher, with 78.0% or 384 individuals in the labor force. Within the labor force, individuals with high school diploma education have the highest percentage of unemployment, with 6.6% or 63 of them being unemployed.
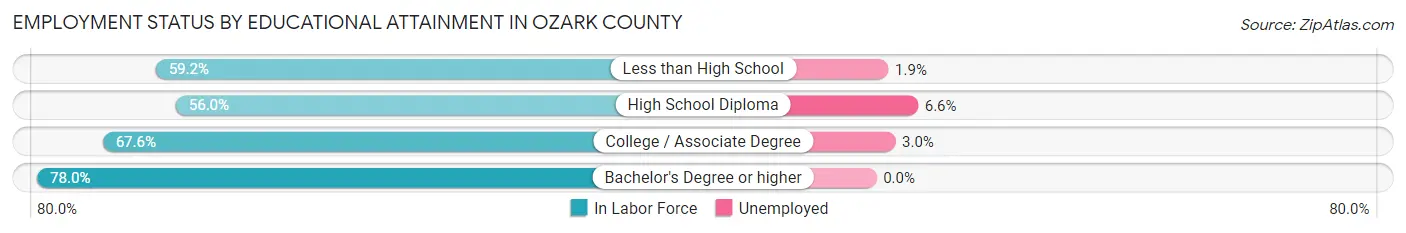
| Educational Attainment | In Labor Force | Unemployed |
| Less than High School | 367 (59.2%) | 12 (1.9%) |
| High School Diploma | 956 (56.0%) | 113 (6.6%) |
| College / Associate Degree | 829 (67.6%) | 37 (3.0%) |
| Bachelor's Degree or higher | 384 (78.0%) | 0 (0.0%) |
| Total | 2,537 (62.7%) | 150 (3.7%) |
Employment Occupations by Sex in Ozark County
Management, Business, Science and Arts Occupations
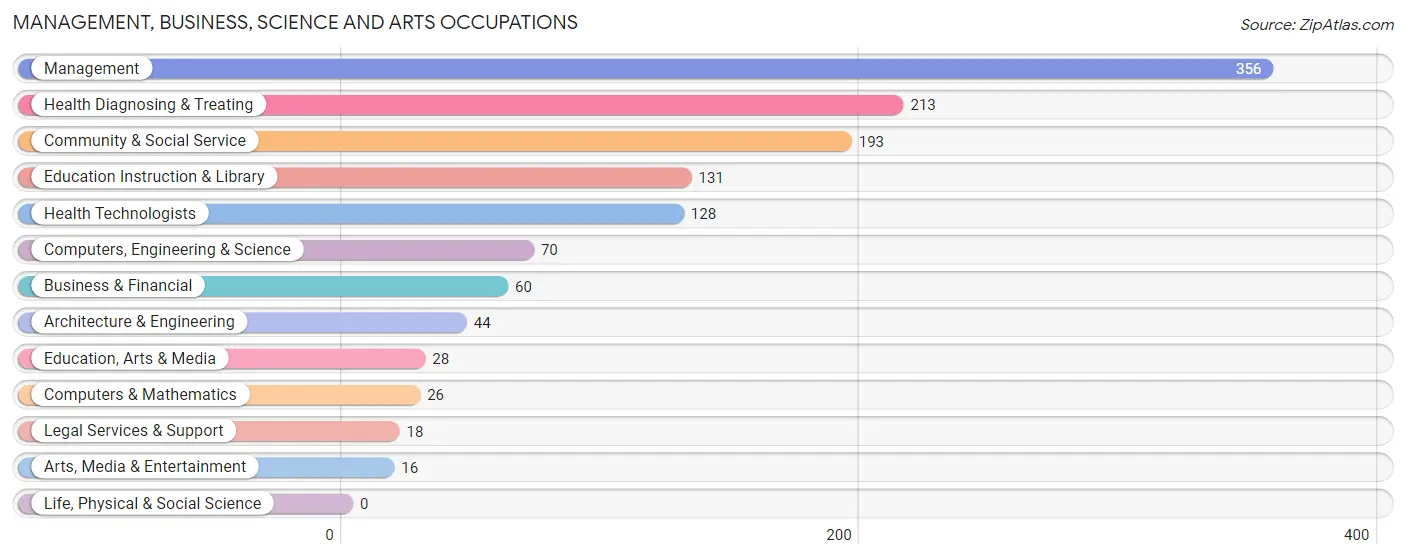
The most common Management, Business, Science and Arts occupations in Ozark County are Management (356 | 12.0%), Health Diagnosing & Treating (213 | 7.2%), Community & Social Service (193 | 6.5%), Education Instruction & Library (131 | 4.4%), and Health Technologists (128 | 4.3%).
Management, Business, Science and Arts Occupations by Sex
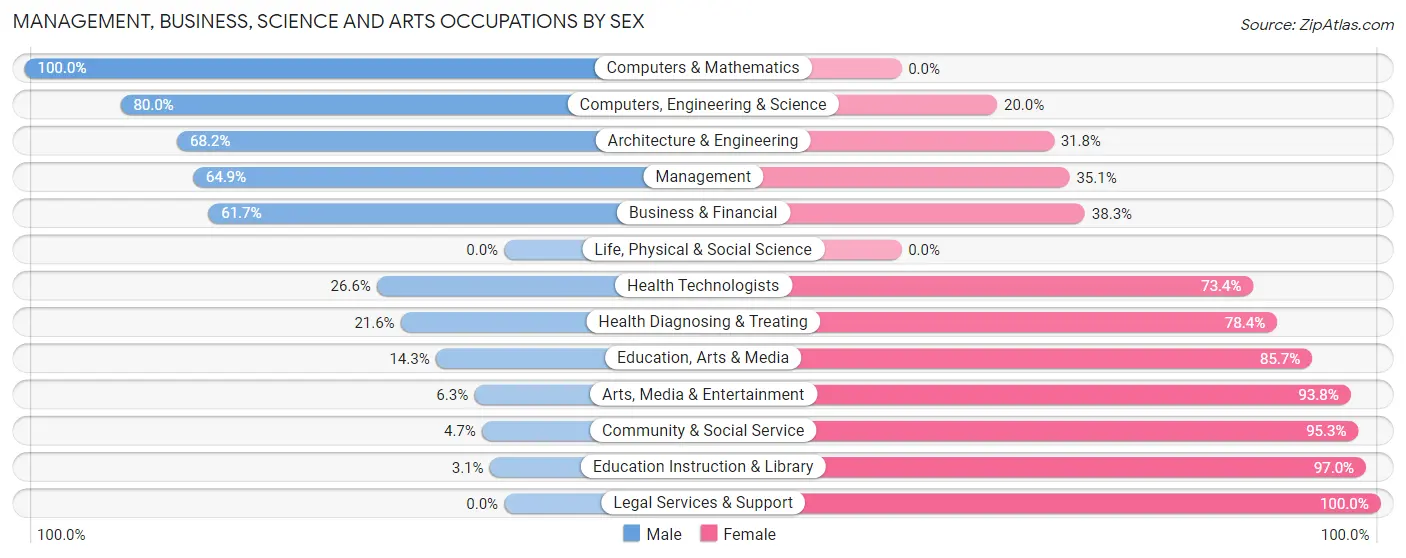
Within the Management, Business, Science and Arts occupations in Ozark County, the most male-oriented occupations are Computers & Mathematics (100.0%), Computers, Engineering & Science (80.0%), and Architecture & Engineering (68.2%), while the most female-oriented occupations are Legal Services & Support (100.0%), Education Instruction & Library (97.0%), and Community & Social Service (95.3%).
| Occupation | Male | Female |
| Management | 231 (64.9%) | 125 (35.1%) |
| Business & Financial | 37 (61.7%) | 23 (38.3%) |
| Computers, Engineering & Science | 56 (80.0%) | 14 (20.0%) |
| Computers & Mathematics | 26 (100.0%) | 0 (0.0%) |
| Architecture & Engineering | 30 (68.2%) | 14 (31.8%) |
| Life, Physical & Social Science | 0 (0.0%) | 0 (0.0%) |
| Community & Social Service | 9 (4.7%) | 184 (95.3%) |
| Education, Arts & Media | 4 (14.3%) | 24 (85.7%) |
| Legal Services & Support | 0 (0.0%) | 18 (100.0%) |
| Education Instruction & Library | 4 (3.0%) | 127 (97.0%) |
| Arts, Media & Entertainment | 1 (6.2%) | 15 (93.8%) |
| Health Diagnosing & Treating | 46 (21.6%) | 167 (78.4%) |
| Health Technologists | 34 (26.6%) | 94 (73.4%) |
| Total (Category) | 379 (42.5%) | 513 (57.5%) |
| Total (Overall) | 1,586 (53.3%) | 1,388 (46.7%) |
Services Occupations
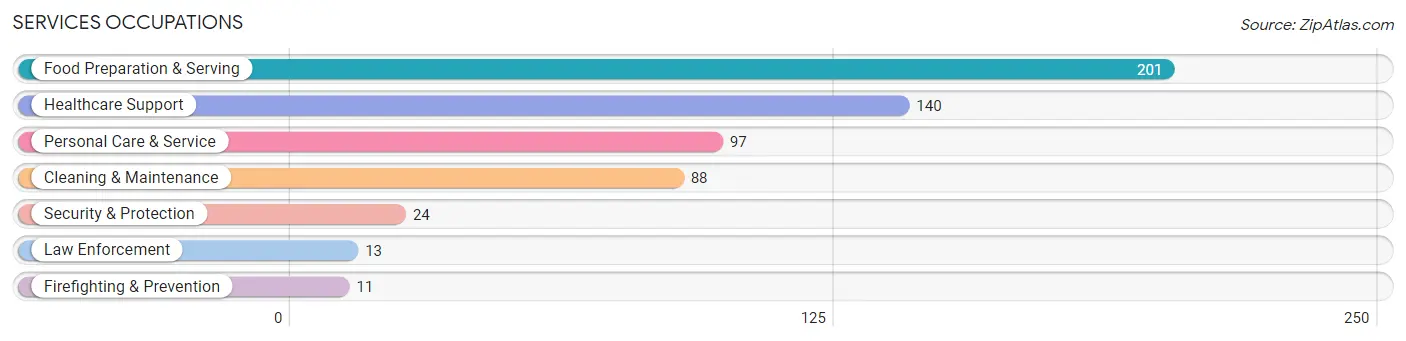
The most common Services occupations in Ozark County are Food Preparation & Serving (201 | 6.8%), Healthcare Support (140 | 4.7%), Personal Care & Service (97 | 3.3%), Cleaning & Maintenance (88 | 3.0%), and Security & Protection (24 | 0.8%).
Services Occupations by Sex
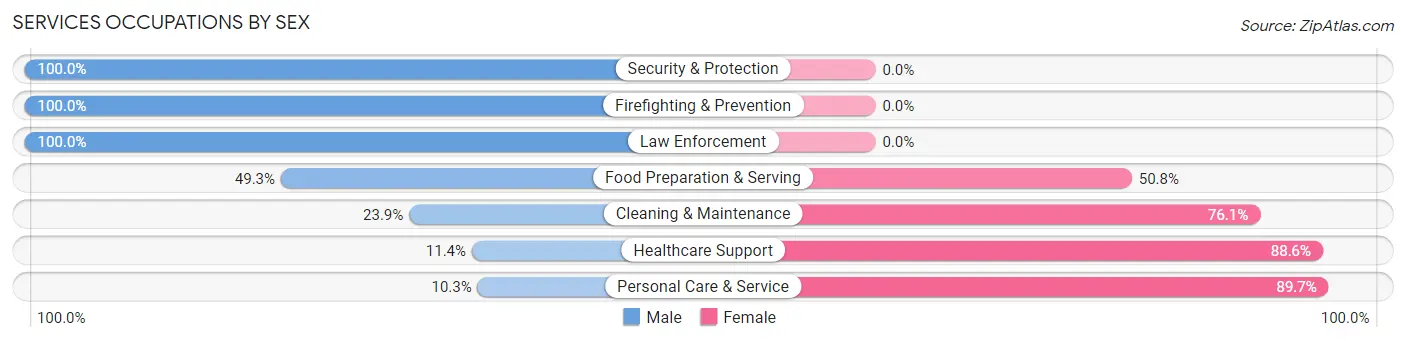
Within the Services occupations in Ozark County, the most male-oriented occupations are Security & Protection (100.0%), Firefighting & Prevention (100.0%), and Law Enforcement (100.0%), while the most female-oriented occupations are Personal Care & Service (89.7%), Healthcare Support (88.6%), and Cleaning & Maintenance (76.1%).
| Occupation | Male | Female |
| Healthcare Support | 16 (11.4%) | 124 (88.6%) |
| Security & Protection | 24 (100.0%) | 0 (0.0%) |
| Firefighting & Prevention | 11 (100.0%) | 0 (0.0%) |
| Law Enforcement | 13 (100.0%) | 0 (0.0%) |
| Food Preparation & Serving | 99 (49.2%) | 102 (50.7%) |
| Cleaning & Maintenance | 21 (23.9%) | 67 (76.1%) |
| Personal Care & Service | 10 (10.3%) | 87 (89.7%) |
| Total (Category) | 170 (30.9%) | 380 (69.1%) |
| Total (Overall) | 1,586 (53.3%) | 1,388 (46.7%) |
Sales and Office Occupations
The most common Sales and Office occupations in Ozark County are Office & Administration (224 | 7.5%), and Sales & Related (137 | 4.6%).

Sales and Office Occupations by Sex

| Occupation | Male | Female |
| Sales & Related | 117 (85.4%) | 20 (14.6%) |
| Office & Administration | 19 (8.5%) | 205 (91.5%) |
| Total (Category) | 136 (37.7%) | 225 (62.3%) |
| Total (Overall) | 1,586 (53.3%) | 1,388 (46.7%) |
Natural Resources, Construction and Maintenance Occupations
The most common Natural Resources, Construction and Maintenance occupations in Ozark County are Construction & Extraction (224 | 7.5%), Installation, Maintenance & Repair (123 | 4.1%), and Farming, Fishing & Forestry (119 | 4.0%).

Natural Resources, Construction and Maintenance Occupations by Sex
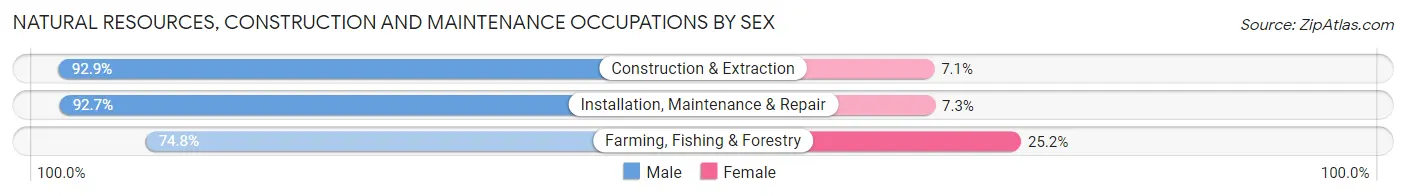
| Occupation | Male | Female |
| Farming, Fishing & Forestry | 89 (74.8%) | 30 (25.2%) |
| Construction & Extraction | 208 (92.9%) | 16 (7.1%) |
| Installation, Maintenance & Repair | 114 (92.7%) | 9 (7.3%) |
| Total (Category) | 411 (88.2%) | 55 (11.8%) |
| Total (Overall) | 1,586 (53.3%) | 1,388 (46.7%) |
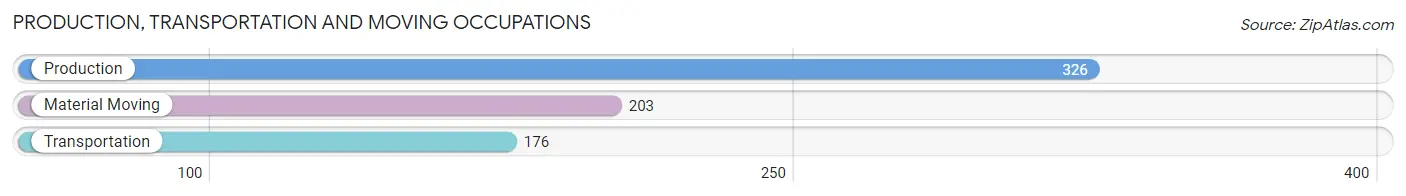
Production, Transportation and Moving Occupations
The most common Production, Transportation and Moving occupations in Ozark County are Production (326 | 11.0%), Material Moving (203 | 6.8%), and Transportation (176 | 5.9%).
Production, Transportation and Moving Occupations by Sex
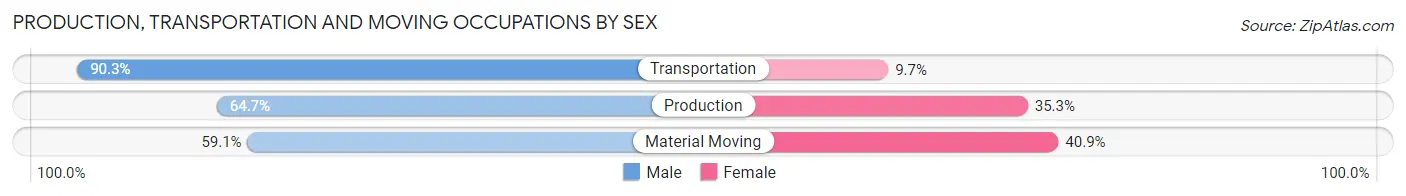
| Occupation | Male | Female |
| Production | 211 (64.7%) | 115 (35.3%) |
| Transportation | 159 (90.3%) | 17 (9.7%) |
| Material Moving | 120 (59.1%) | 83 (40.9%) |
| Total (Category) | 490 (69.5%) | 215 (30.5%) |
| Total (Overall) | 1,586 (53.3%) | 1,388 (46.7%) |
Employment Industries by Sex in Ozark County
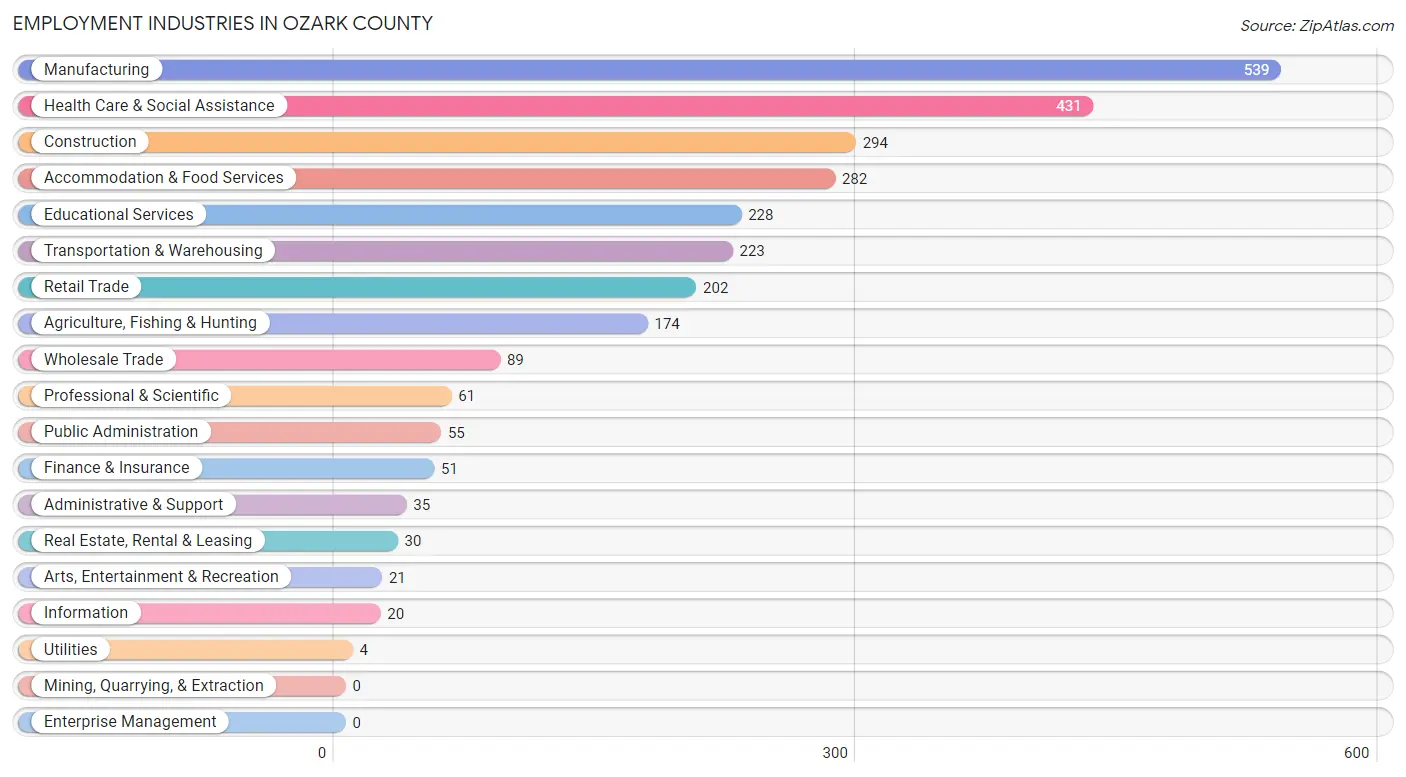
Employment Industries in Ozark County
The major employment industries in Ozark County include Manufacturing (539 | 18.1%), Health Care & Social Assistance (431 | 14.5%), Construction (294 | 9.9%), Accommodation & Food Services (282 | 9.5%), and Educational Services (228 | 7.7%).
Employment Industries by Sex in Ozark County
The Ozark County industries that see more men than women are Utilities (100.0%), Information (100.0%), and Construction (94.6%), whereas the industries that tend to have a higher number of women are Finance & Insurance (90.2%), Professional & Scientific (82.0%), and Health Care & Social Assistance (76.6%).
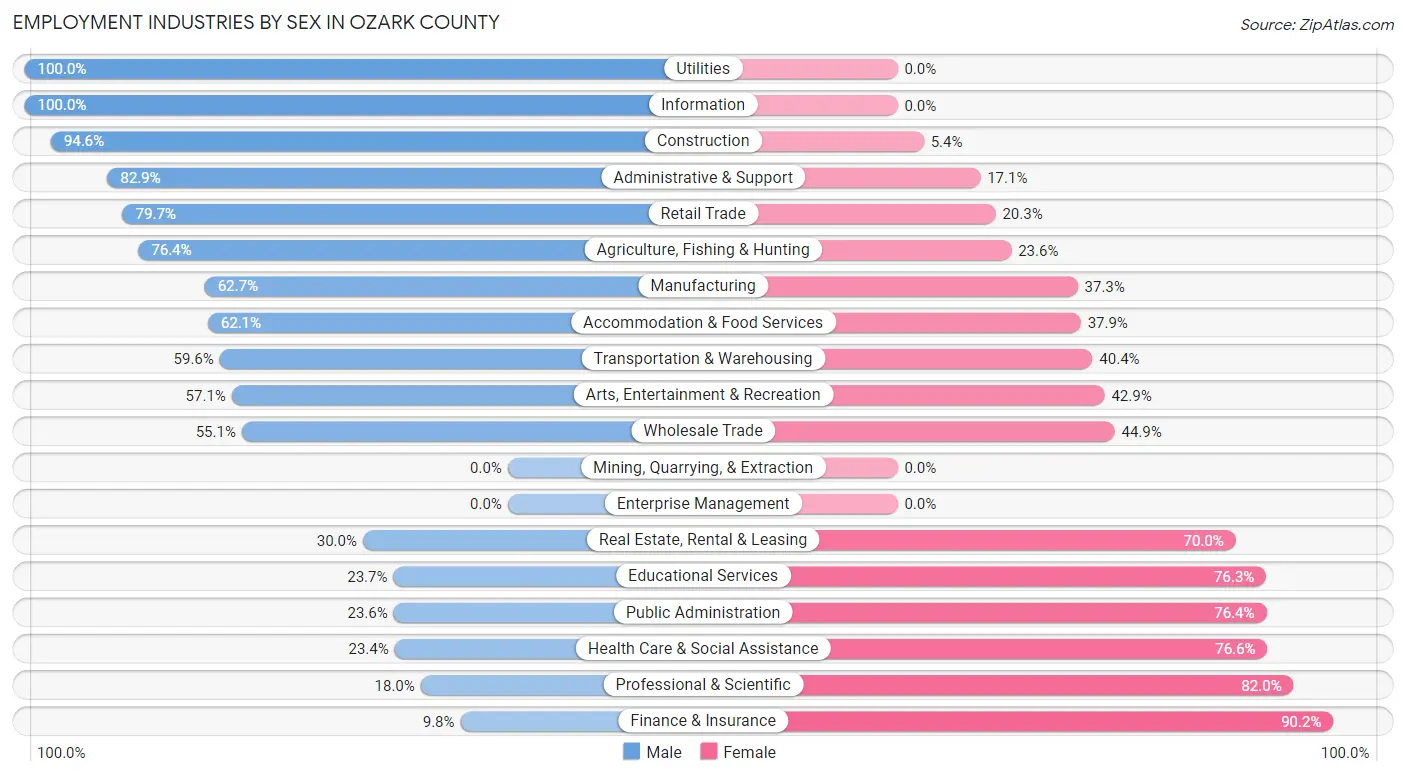
| Industry | Male | Female |
| Agriculture, Fishing & Hunting | 133 (76.4%) | 41 (23.6%) |
| Mining, Quarrying, & Extraction | 0 (0.0%) | 0 (0.0%) |
| Construction | 278 (94.6%) | 16 (5.4%) |
| Manufacturing | 338 (62.7%) | 201 (37.3%) |
| Wholesale Trade | 49 (55.1%) | 40 (44.9%) |
| Retail Trade | 161 (79.7%) | 41 (20.3%) |
| Transportation & Warehousing | 133 (59.6%) | 90 (40.4%) |
| Utilities | 4 (100.0%) | 0 (0.0%) |
| Information | 20 (100.0%) | 0 (0.0%) |
| Finance & Insurance | 5 (9.8%) | 46 (90.2%) |
| Real Estate, Rental & Leasing | 9 (30.0%) | 21 (70.0%) |
| Professional & Scientific | 11 (18.0%) | 50 (82.0%) |
| Enterprise Management | 0 (0.0%) | 0 (0.0%) |
| Administrative & Support | 29 (82.9%) | 6 (17.1%) |
| Educational Services | 54 (23.7%) | 174 (76.3%) |
| Health Care & Social Assistance | 101 (23.4%) | 330 (76.6%) |
| Arts, Entertainment & Recreation | 12 (57.1%) | 9 (42.9%) |
| Accommodation & Food Services | 175 (62.1%) | 107 (37.9%) |
| Public Administration | 13 (23.6%) | 42 (76.4%) |
| Total | 1,586 (53.3%) | 1,388 (46.7%) |
Education in Ozark County
School Enrollment in Ozark County
The most common levels of schooling among the 1,501 students in Ozark County are middle school (459 | 30.6%), elementary school (372 | 24.8%), and high school (338 | 22.5%).
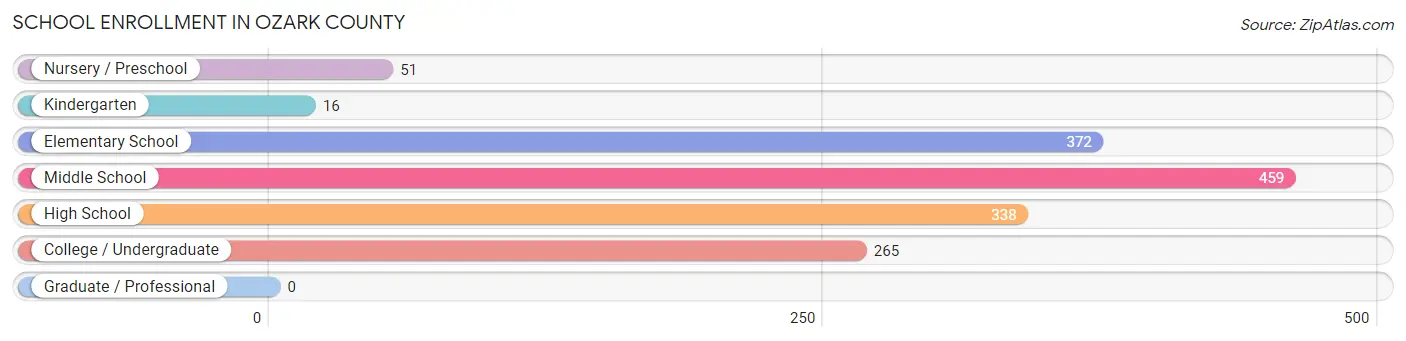
| School Level | # Students | % Students |
| Nursery / Preschool | 51 | 3.4% |
| Kindergarten | 16 | 1.1% |
| Elementary School | 372 | 24.8% |
| Middle School | 459 | 30.6% |
| High School | 338 | 22.5% |
| College / Undergraduate | 265 | 17.6% |
| Graduate / Professional | 0 | 0.0% |
| Total | 1,501 | 100.0% |
School Enrollment by Age by Funding Source in Ozark County
Out of a total of 1,501 students who are enrolled in schools in Ozark County, 227 (15.1%) attend a private institution, while the remaining 1,274 (84.9%) are enrolled in public schools. The age group of 15 to 17 year olds has the highest likelihood of being enrolled in private schools, with 75 (26.3% in the age bracket) enrolled. Conversely, the age group of 3 to 4 year olds has the lowest likelihood of being enrolled in a private school, with 30 (100.0% in the age bracket) attending a public institution.
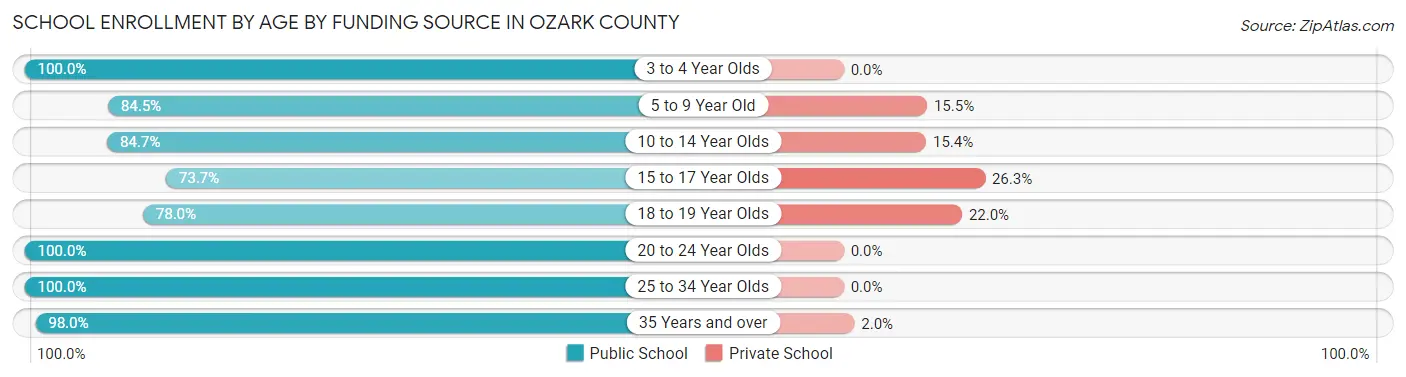
| Age Bracket | Public School | Private School |
| 3 to 4 Year Olds | 30 (100.0%) | 0 (0.0%) |
| 5 to 9 Year Old | 234 (84.5%) | 43 (15.5%) |
| 10 to 14 Year Olds | 513 (84.7%) | 93 (15.3%) |
| 15 to 17 Year Olds | 210 (73.7%) | 75 (26.3%) |
| 18 to 19 Year Olds | 46 (78.0%) | 13 (22.0%) |
| 20 to 24 Year Olds | 67 (100.0%) | 0 (0.0%) |
| 25 to 34 Year Olds | 26 (100.0%) | 0 (0.0%) |
| 35 Years and over | 148 (98.0%) | 3 (2.0%) |
| Total | 1,274 (84.9%) | 227 (15.1%) |
Educational Attainment by Field of Study in Ozark County
Education (260 | 33.5%), business (151 | 19.4%), bio, nature & agricultural (108 | 13.9%), visual & performing arts (64 | 8.2%), and social sciences (40 | 5.1%) are the most common fields of study among 777 individuals in Ozark County who have obtained a bachelor's degree or higher.
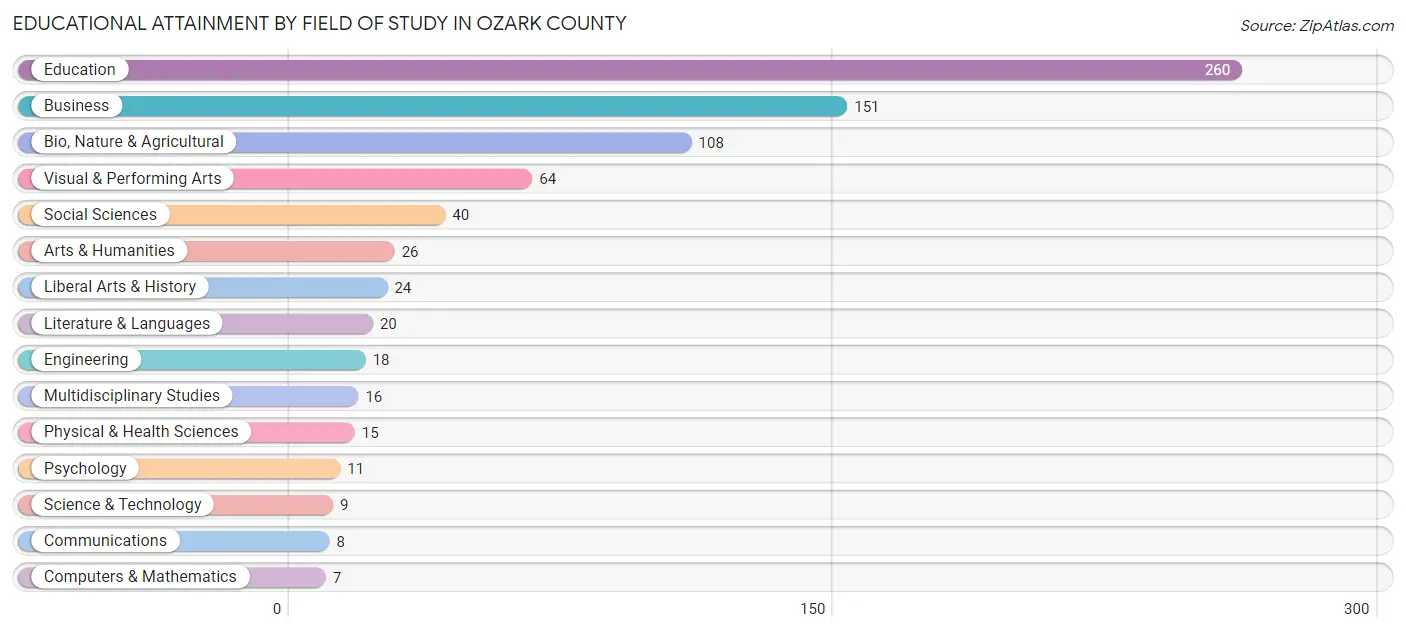
| Field of Study | # Graduates | % Graduates |
| Computers & Mathematics | 7 | 0.9% |
| Bio, Nature & Agricultural | 108 | 13.9% |
| Physical & Health Sciences | 15 | 1.9% |
| Psychology | 11 | 1.4% |
| Social Sciences | 40 | 5.1% |
| Engineering | 18 | 2.3% |
| Multidisciplinary Studies | 16 | 2.1% |
| Science & Technology | 9 | 1.2% |
| Business | 151 | 19.4% |
| Education | 260 | 33.5% |
| Literature & Languages | 20 | 2.6% |
| Liberal Arts & History | 24 | 3.1% |
| Visual & Performing Arts | 64 | 8.2% |
| Communications | 8 | 1.0% |
| Arts & Humanities | 26 | 3.4% |
| Total | 777 | 100.0% |
Transportation & Commute in Ozark County
Vehicle Availability by Sex in Ozark County
The most prevalent vehicle ownership categories in Ozark County are males with 2 vehicles (627, accounting for 40.8%) and females with 2 vehicles (595, making up 46.2%).
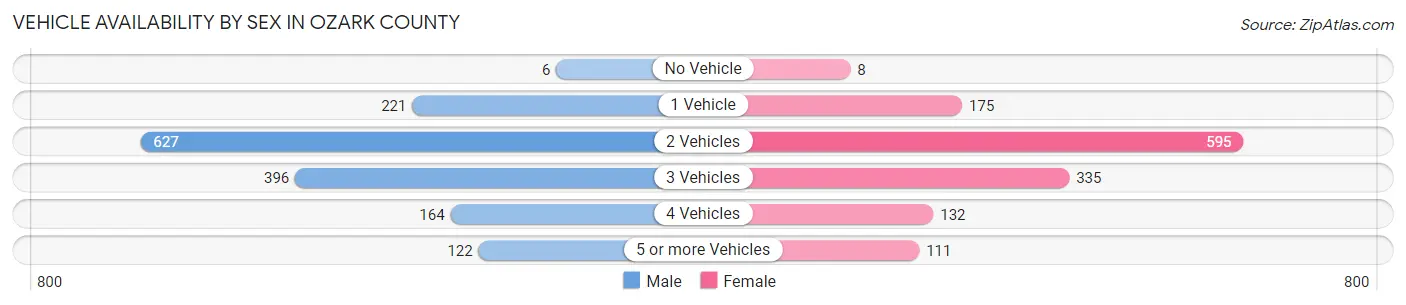
| Vehicles Available | Male | Female |
| No Vehicle | 6 (0.4%) | 8 (0.6%) |
| 1 Vehicle | 221 (14.4%) | 175 (12.9%) |
| 2 Vehicles | 627 (40.8%) | 595 (43.9%) |
| 3 Vehicles | 396 (25.8%) | 335 (24.7%) |
| 4 Vehicles | 164 (10.7%) | 132 (9.7%) |
| 5 or more Vehicles | 122 (7.9%) | 111 (8.2%) |
| Total | 1,536 (100.0%) | 1,356 (100.0%) |
Commute Time in Ozark County
The most frequently occuring commute durations in Ozark County are 30 to 34 minutes (521 commuters, 20.4%), less than 5 minutes (298 commuters, 11.7%), and 45 to 59 minutes (286 commuters, 11.2%).
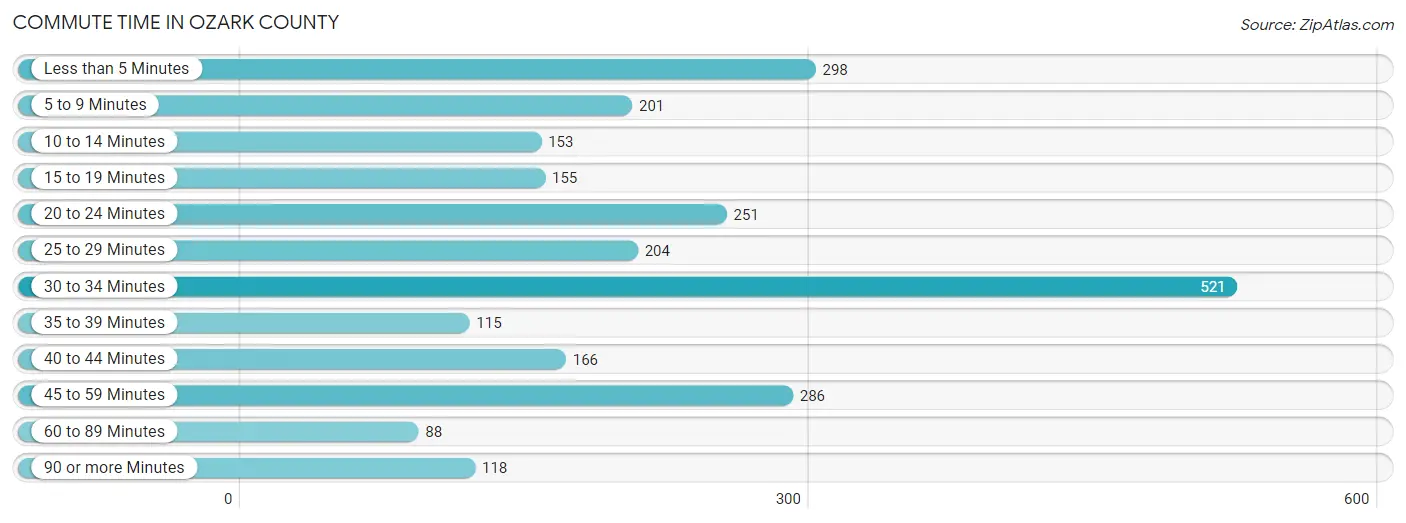
| Commute Time | # Commuters | % Commuters |
| Less than 5 Minutes | 298 | 11.7% |
| 5 to 9 Minutes | 201 | 7.9% |
| 10 to 14 Minutes | 153 | 6.0% |
| 15 to 19 Minutes | 155 | 6.1% |
| 20 to 24 Minutes | 251 | 9.8% |
| 25 to 29 Minutes | 204 | 8.0% |
| 30 to 34 Minutes | 521 | 20.4% |
| 35 to 39 Minutes | 115 | 4.5% |
| 40 to 44 Minutes | 166 | 6.5% |
| 45 to 59 Minutes | 286 | 11.2% |
| 60 to 89 Minutes | 88 | 3.4% |
| 90 or more Minutes | 118 | 4.6% |
Commute Time by Sex in Ozark County
The most common commute times in Ozark County are 30 to 34 minutes (227 commuters, 16.6%) for males and 30 to 34 minutes (294 commuters, 24.7%) for females.
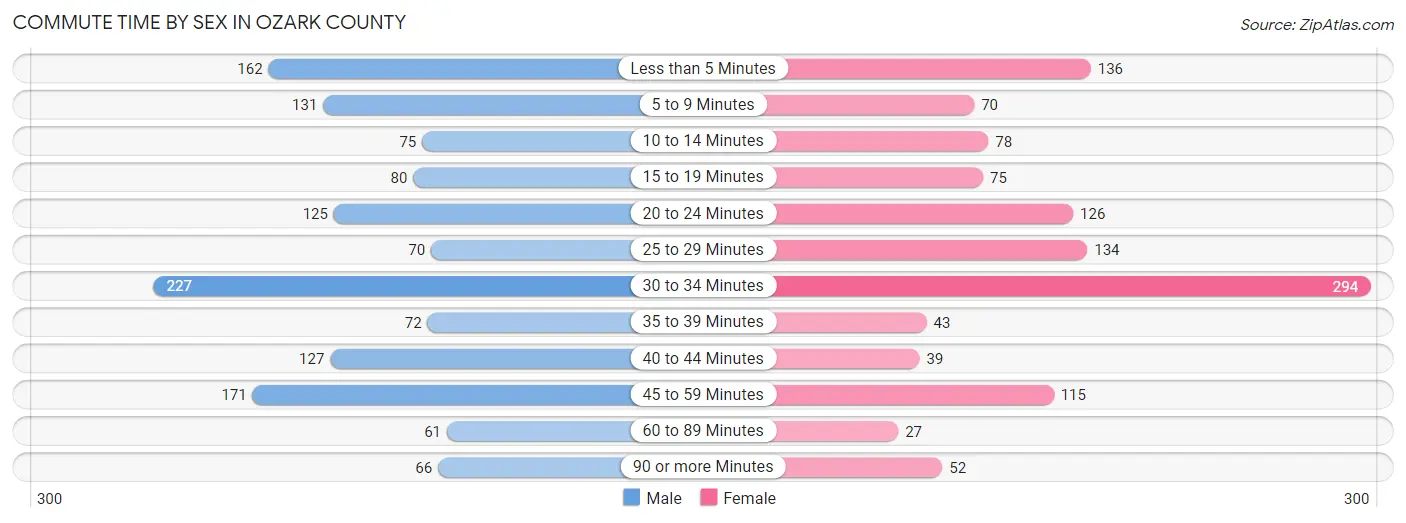
| Commute Time | Male | Female |
| Less than 5 Minutes | 162 (11.8%) | 136 (11.4%) |
| 5 to 9 Minutes | 131 (9.6%) | 70 (5.9%) |
| 10 to 14 Minutes | 75 (5.5%) | 78 (6.6%) |
| 15 to 19 Minutes | 80 (5.9%) | 75 (6.3%) |
| 20 to 24 Minutes | 125 (9.1%) | 126 (10.6%) |
| 25 to 29 Minutes | 70 (5.1%) | 134 (11.3%) |
| 30 to 34 Minutes | 227 (16.6%) | 294 (24.7%) |
| 35 to 39 Minutes | 72 (5.3%) | 43 (3.6%) |
| 40 to 44 Minutes | 127 (9.3%) | 39 (3.3%) |
| 45 to 59 Minutes | 171 (12.5%) | 115 (9.7%) |
| 60 to 89 Minutes | 61 (4.5%) | 27 (2.3%) |
| 90 or more Minutes | 66 (4.8%) | 52 (4.4%) |
Time of Departure to Work by Sex in Ozark County
The most frequent times of departure to work in Ozark County are 7:00 AM to 7:29 AM (281, 20.6%) for males and 7:30 AM to 7:59 AM (329, 27.7%) for females.
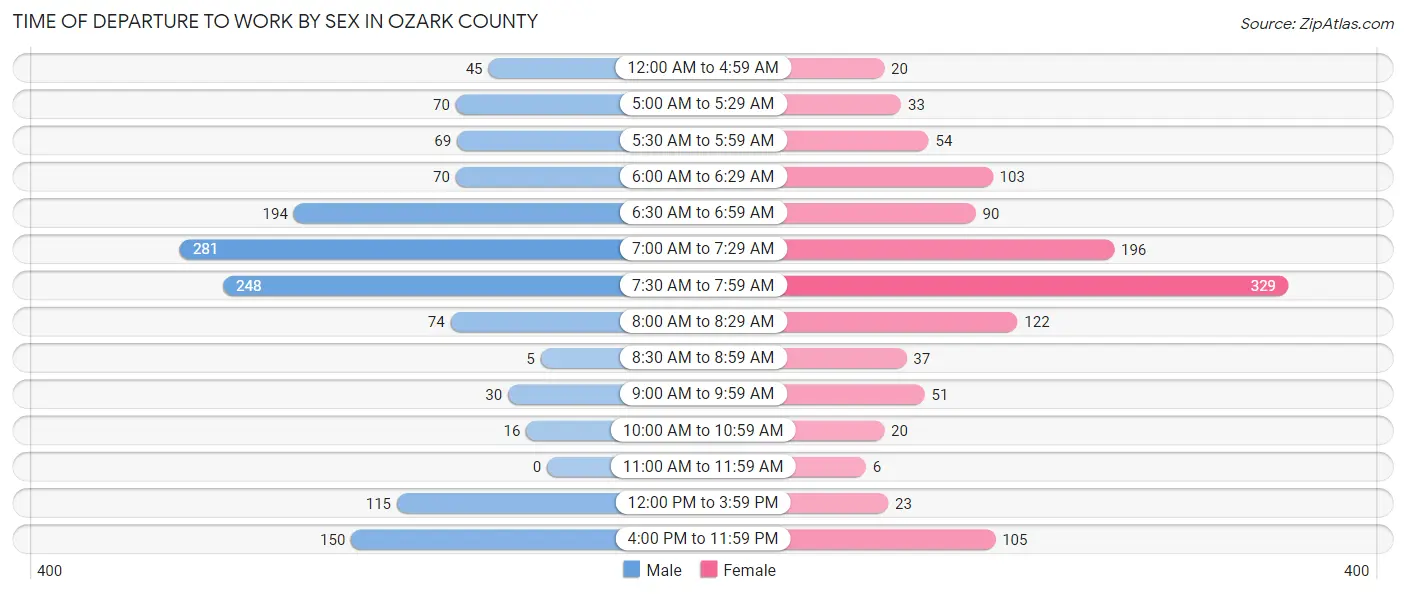
| Time of Departure | Male | Female |
| 12:00 AM to 4:59 AM | 45 (3.3%) | 20 (1.7%) |
| 5:00 AM to 5:29 AM | 70 (5.1%) | 33 (2.8%) |
| 5:30 AM to 5:59 AM | 69 (5.1%) | 54 (4.5%) |
| 6:00 AM to 6:29 AM | 70 (5.1%) | 103 (8.7%) |
| 6:30 AM to 6:59 AM | 194 (14.2%) | 90 (7.6%) |
| 7:00 AM to 7:29 AM | 281 (20.6%) | 196 (16.5%) |
| 7:30 AM to 7:59 AM | 248 (18.1%) | 329 (27.7%) |
| 8:00 AM to 8:29 AM | 74 (5.4%) | 122 (10.3%) |
| 8:30 AM to 8:59 AM | 5 (0.4%) | 37 (3.1%) |
| 9:00 AM to 9:59 AM | 30 (2.2%) | 51 (4.3%) |
| 10:00 AM to 10:59 AM | 16 (1.2%) | 20 (1.7%) |
| 11:00 AM to 11:59 AM | 0 (0.0%) | 6 (0.5%) |
| 12:00 PM to 3:59 PM | 115 (8.4%) | 23 (1.9%) |
| 4:00 PM to 11:59 PM | 150 (11.0%) | 105 (8.8%) |
| Total | 1,367 (100.0%) | 1,189 (100.0%) |
Housing Occupancy in Ozark County
Occupancy by Ownership in Ozark County
Of the total 3,654 dwellings in Ozark County, owner-occupied units account for 2,895 (79.2%), while renter-occupied units make up 759 (20.8%).
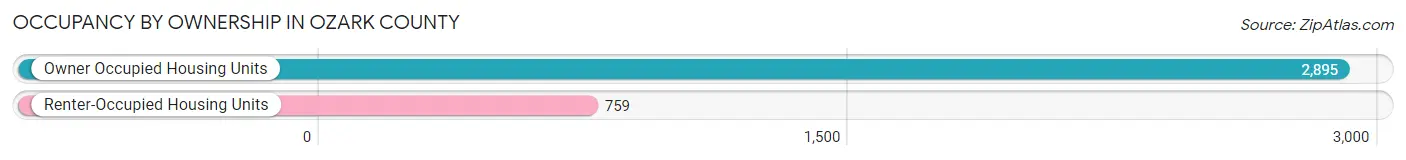
| Occupancy | # Housing Units | % Housing Units |
| Owner Occupied Housing Units | 2,895 | 79.2% |
| Renter-Occupied Housing Units | 759 | 20.8% |
| Total Occupied Housing Units | 3,654 | 100.0% |
Occupancy by Household Size in Ozark County
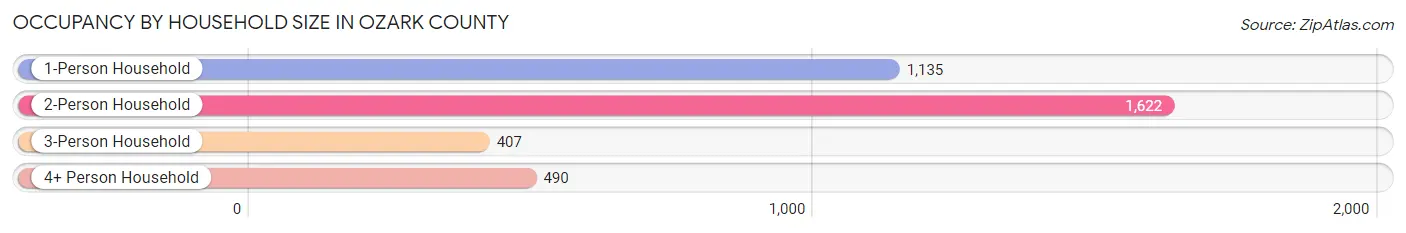
| Household Size | # Housing Units | % Housing Units |
| 1-Person Household | 1,135 | 31.1% |
| 2-Person Household | 1,622 | 44.4% |
| 3-Person Household | 407 | 11.1% |
| 4+ Person Household | 490 | 13.4% |
| Total Housing Units | 3,654 | 100.0% |
Occupancy by Ownership by Household Size in Ozark County
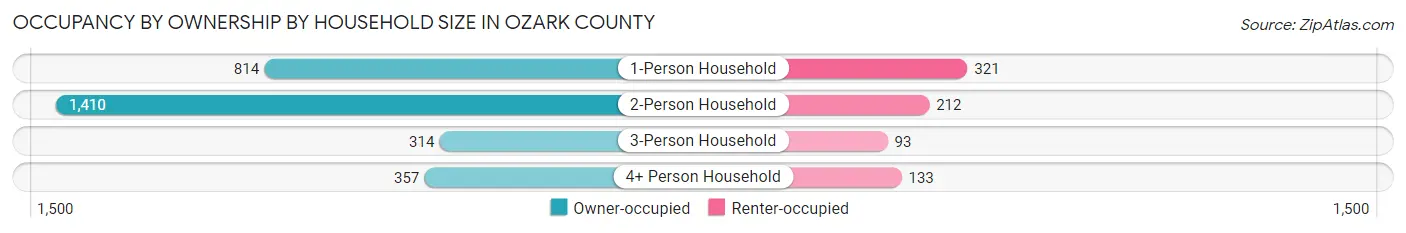
| Household Size | Owner-occupied | Renter-occupied |
| 1-Person Household | 814 (71.7%) | 321 (28.3%) |
| 2-Person Household | 1,410 (86.9%) | 212 (13.1%) |
| 3-Person Household | 314 (77.1%) | 93 (22.9%) |
| 4+ Person Household | 357 (72.9%) | 133 (27.1%) |
| Total Housing Units | 2,895 (79.2%) | 759 (20.8%) |
Occupancy by Educational Attainment in Ozark County
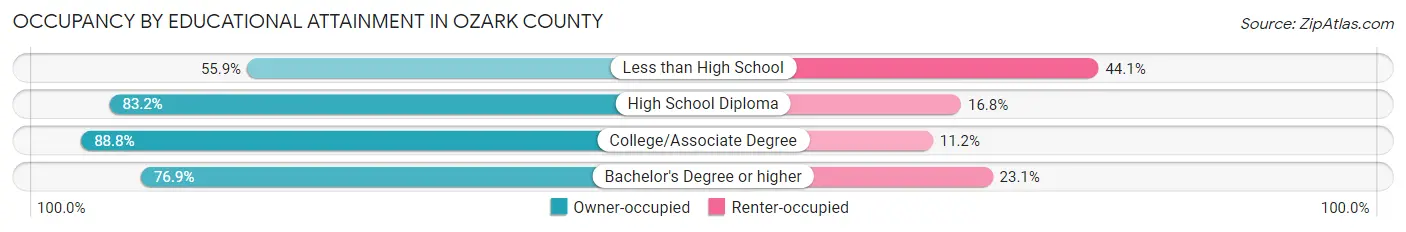
| Household Size | Owner-occupied | Renter-occupied |
| Less than High School | 373 (55.9%) | 294 (44.1%) |
| High School Diploma | 1,216 (83.2%) | 246 (16.8%) |
| College/Associate Degree | 996 (88.8%) | 126 (11.2%) |
| Bachelor's Degree or higher | 310 (76.9%) | 93 (23.1%) |
Occupancy by Age of Householder in Ozark County
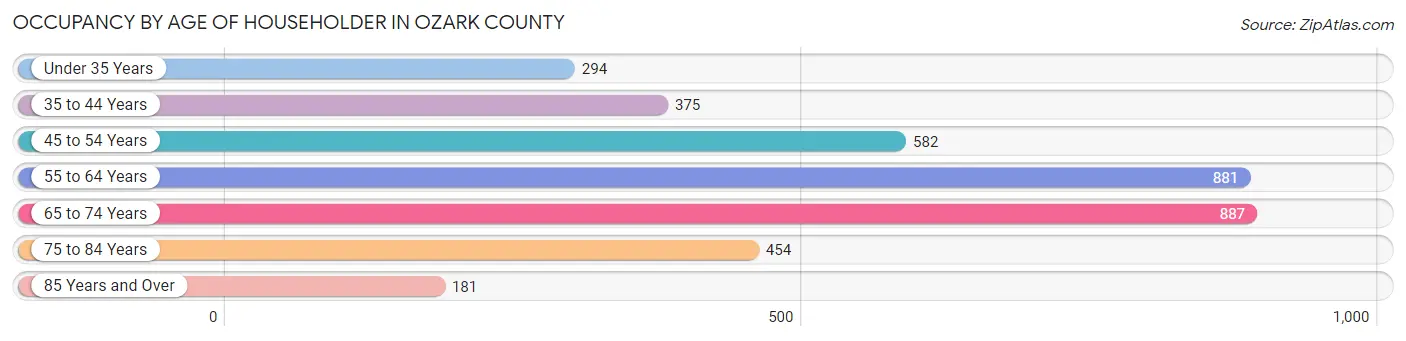
| Age Bracket | # Households | % Households |
| Under 35 Years | 294 | 8.1% |
| 35 to 44 Years | 375 | 10.3% |
| 45 to 54 Years | 582 | 15.9% |
| 55 to 64 Years | 881 | 24.1% |
| 65 to 74 Years | 887 | 24.3% |
| 75 to 84 Years | 454 | 12.4% |
| 85 Years and Over | 181 | 5.0% |
| Total | 3,654 | 100.0% |
Housing Finances in Ozark County
Median Income by Occupancy in Ozark County
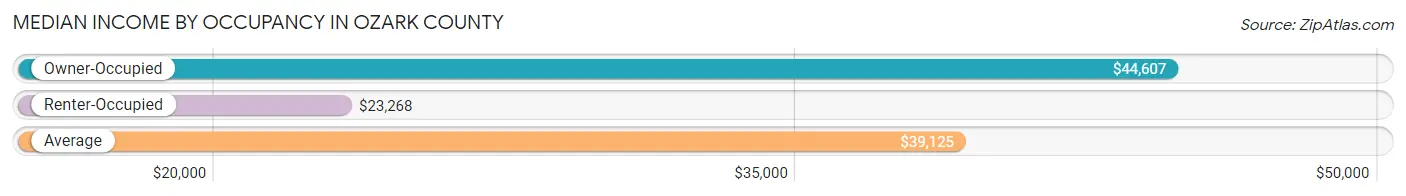
| Occupancy Type | # Households | Median Income |
| Owner-Occupied | 2,895 (79.2%) | $44,607 |
| Renter-Occupied | 759 (20.8%) | $23,268 |
| Average | 3,654 (100.0%) | $39,125 |
Occupancy by Householder Income Bracket in Ozark County
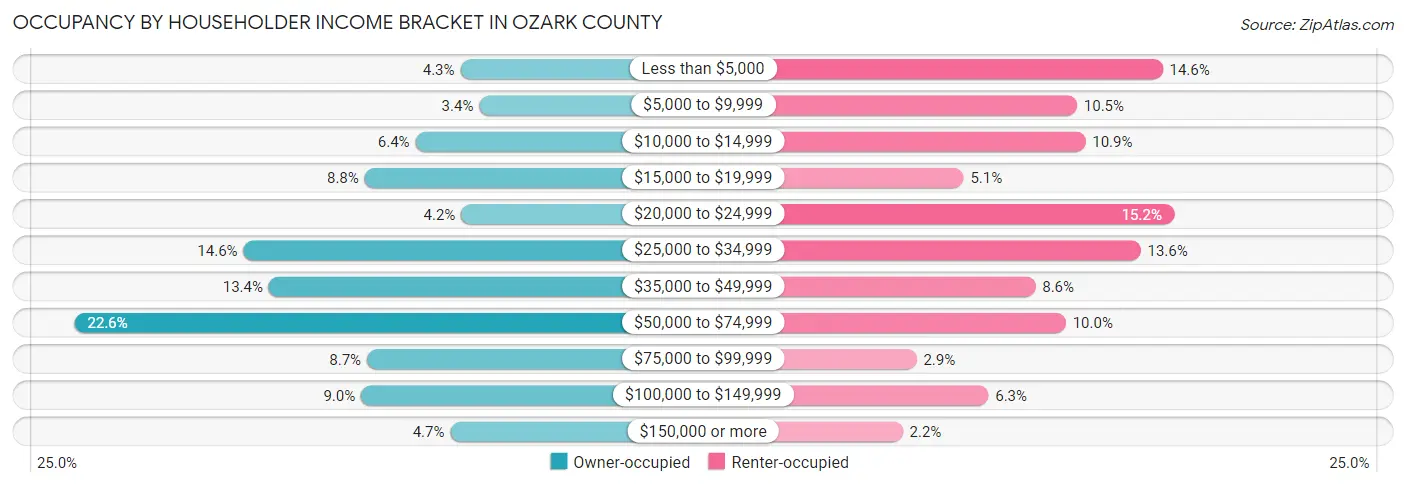
| Income Bracket | Owner-occupied | Renter-occupied |
| Less than $5,000 | 123 (4.3%) | 111 (14.6%) |
| $5,000 to $9,999 | 97 (3.4%) | 80 (10.5%) |
| $10,000 to $14,999 | 185 (6.4%) | 83 (10.9%) |
| $15,000 to $19,999 | 255 (8.8%) | 39 (5.1%) |
| $20,000 to $24,999 | 122 (4.2%) | 115 (15.1%) |
| $25,000 to $34,999 | 422 (14.6%) | 103 (13.6%) |
| $35,000 to $49,999 | 387 (13.4%) | 65 (8.6%) |
| $50,000 to $74,999 | 655 (22.6%) | 76 (10.0%) |
| $75,000 to $99,999 | 252 (8.7%) | 22 (2.9%) |
| $100,000 to $149,999 | 260 (9.0%) | 48 (6.3%) |
| $150,000 or more | 137 (4.7%) | 17 (2.2%) |
| Total | 2,895 (100.0%) | 759 (100.0%) |
Monthly Housing Cost Tiers in Ozark County
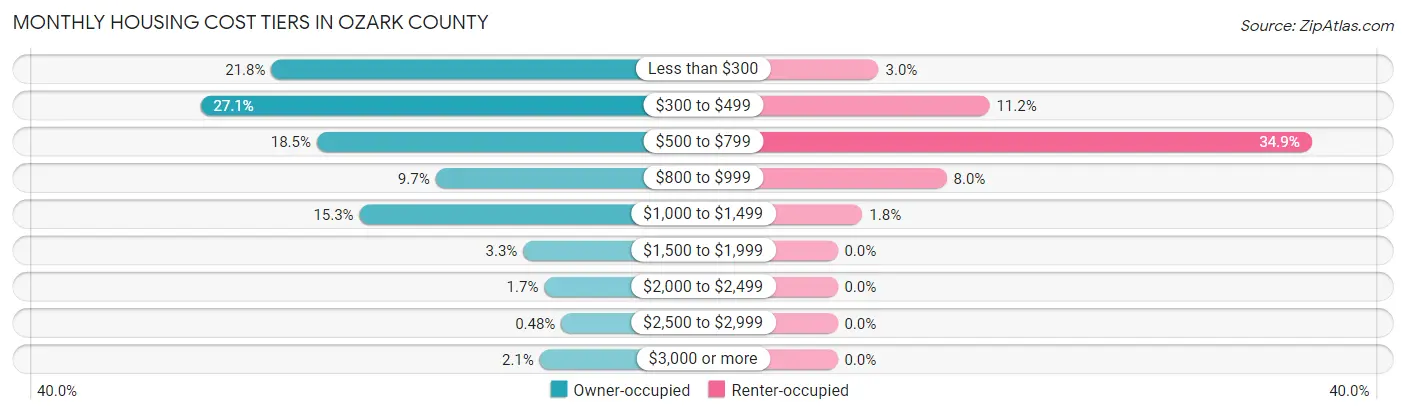
| Monthly Cost | Owner-occupied | Renter-occupied |
| Less than $300 | 632 (21.8%) | 23 (3.0%) |
| $300 to $499 | 783 (27.1%) | 85 (11.2%) |
| $500 to $799 | 535 (18.5%) | 265 (34.9%) |
| $800 to $999 | 282 (9.7%) | 61 (8.0%) |
| $1,000 to $1,499 | 444 (15.3%) | 14 (1.8%) |
| $1,500 to $1,999 | 95 (3.3%) | 0 (0.0%) |
| $2,000 to $2,499 | 50 (1.7%) | 0 (0.0%) |
| $2,500 to $2,999 | 14 (0.5%) | 0 (0.0%) |
| $3,000 or more | 60 (2.1%) | 0 (0.0%) |
| Total | 2,895 (100.0%) | 759 (100.0%) |
Physical Housing Characteristics in Ozark County
Housing Structures in Ozark County
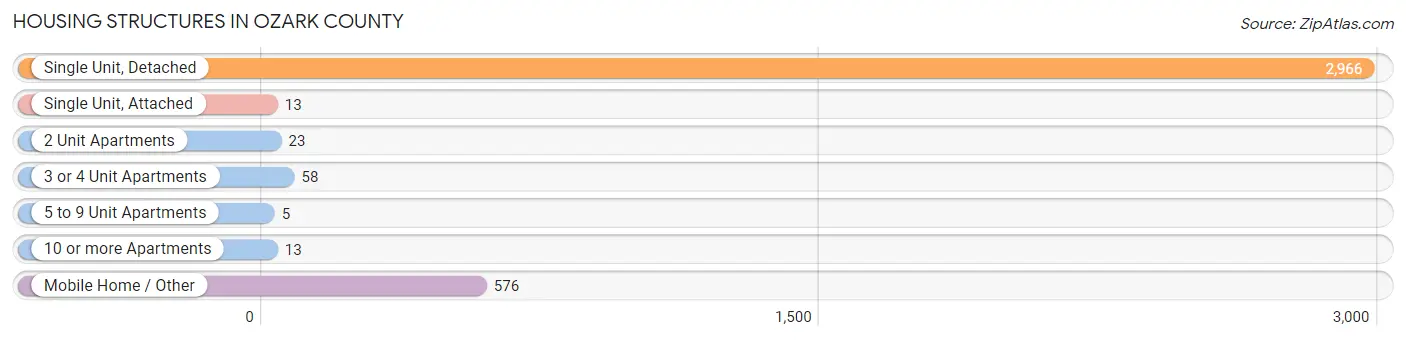
| Structure Type | # Housing Units | % Housing Units |
| Single Unit, Detached | 2,966 | 81.2% |
| Single Unit, Attached | 13 | 0.4% |
| 2 Unit Apartments | 23 | 0.6% |
| 3 or 4 Unit Apartments | 58 | 1.6% |
| 5 to 9 Unit Apartments | 5 | 0.1% |
| 10 or more Apartments | 13 | 0.4% |
| Mobile Home / Other | 576 | 15.8% |
| Total | 3,654 | 100.0% |
Housing Structures by Occupancy in Ozark County
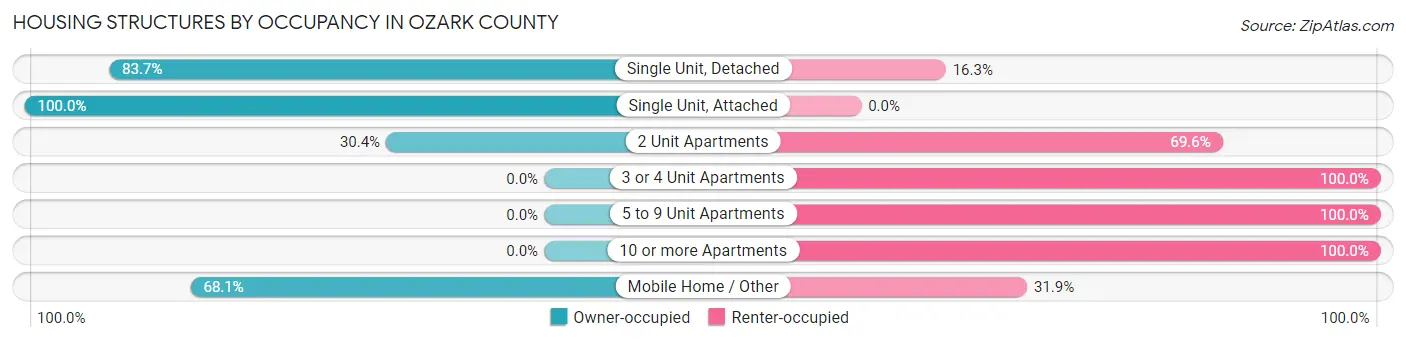
| Structure Type | Owner-occupied | Renter-occupied |
| Single Unit, Detached | 2,483 (83.7%) | 483 (16.3%) |
| Single Unit, Attached | 13 (100.0%) | 0 (0.0%) |
| 2 Unit Apartments | 7 (30.4%) | 16 (69.6%) |
| 3 or 4 Unit Apartments | 0 (0.0%) | 58 (100.0%) |
| 5 to 9 Unit Apartments | 0 (0.0%) | 5 (100.0%) |
| 10 or more Apartments | 0 (0.0%) | 13 (100.0%) |
| Mobile Home / Other | 392 (68.1%) | 184 (31.9%) |
| Total | 2,895 (79.2%) | 759 (20.8%) |
Housing Structures by Number of Rooms in Ozark County
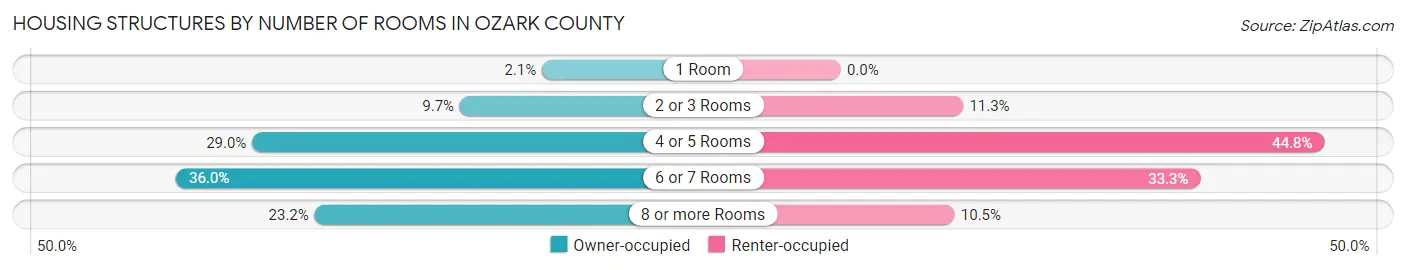
| Number of Rooms | Owner-occupied | Renter-occupied |
| 1 Room | 62 (2.1%) | 0 (0.0%) |
| 2 or 3 Rooms | 282 (9.7%) | 86 (11.3%) |
| 4 or 5 Rooms | 838 (28.9%) | 340 (44.8%) |
| 6 or 7 Rooms | 1,042 (36.0%) | 253 (33.3%) |
| 8 or more Rooms | 671 (23.2%) | 80 (10.5%) |
| Total | 2,895 (100.0%) | 759 (100.0%) |
Housing Structure by Heating Type in Ozark County
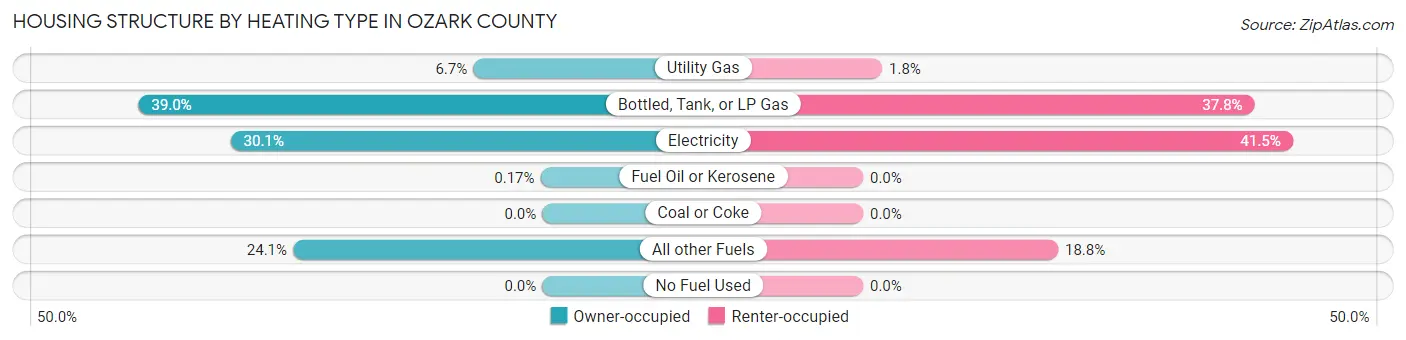
| Heating Type | Owner-occupied | Renter-occupied |
| Utility Gas | 193 (6.7%) | 14 (1.8%) |
| Bottled, Tank, or LP Gas | 1,129 (39.0%) | 287 (37.8%) |
| Electricity | 871 (30.1%) | 315 (41.5%) |
| Fuel Oil or Kerosene | 5 (0.2%) | 0 (0.0%) |
| Coal or Coke | 0 (0.0%) | 0 (0.0%) |
| All other Fuels | 697 (24.1%) | 143 (18.8%) |
| No Fuel Used | 0 (0.0%) | 0 (0.0%) |
| Total | 2,895 (100.0%) | 759 (100.0%) |
Household Vehicle Usage in Ozark County
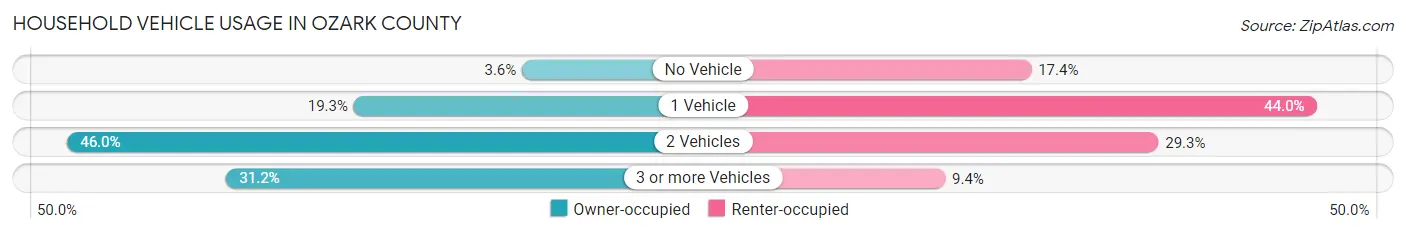
| Vehicles per Household | Owner-occupied | Renter-occupied |
| No Vehicle | 103 (3.6%) | 132 (17.4%) |
| 1 Vehicle | 558 (19.3%) | 334 (44.0%) |
| 2 Vehicles | 1,332 (46.0%) | 222 (29.2%) |
| 3 or more Vehicles | 902 (31.2%) | 71 (9.3%) |
| Total | 2,895 (100.0%) | 759 (100.0%) |
Real Estate & Mortgages in Ozark County
Real Estate and Mortgage Overview in Ozark County
| Characteristic | Without Mortgage | With Mortgage |
| Housing Units | 1,854 | 1,041 |
| Median Property Value | $135,400 | $143,900 |
| Median Household Income | $35,523 | $47 |
| Monthly Housing Costs | $350 | $51 |
| Real Estate Taxes | $626 | $17 |
Property Value by Mortgage Status in Ozark County
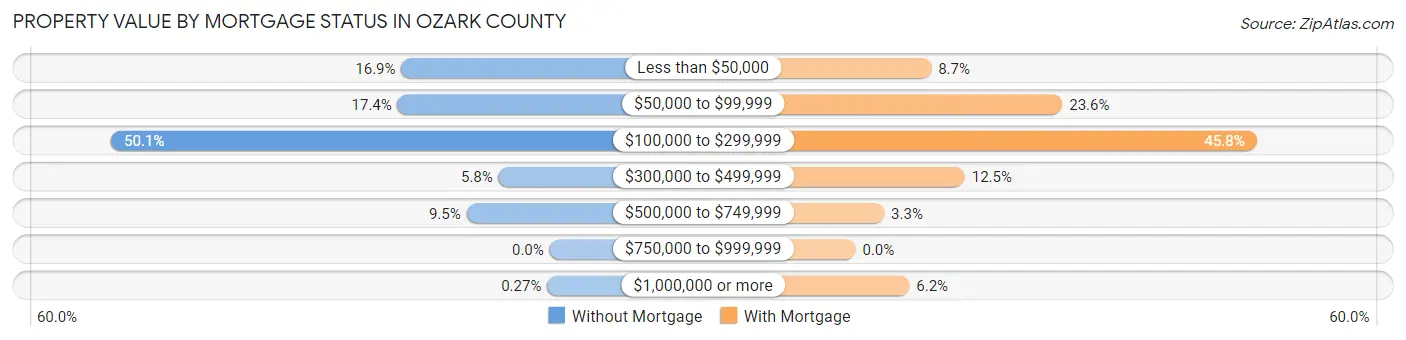
| Property Value | Without Mortgage | With Mortgage |
| Less than $50,000 | 314 (16.9%) | 90 (8.6%) |
| $50,000 to $99,999 | 322 (17.4%) | 246 (23.6%) |
| $100,000 to $299,999 | 929 (50.1%) | 477 (45.8%) |
| $300,000 to $499,999 | 108 (5.8%) | 130 (12.5%) |
| $500,000 to $749,999 | 176 (9.5%) | 34 (3.3%) |
| $750,000 to $999,999 | 0 (0.0%) | 0 (0.0%) |
| $1,000,000 or more | 5 (0.3%) | 64 (6.1%) |
| Total | 1,854 (100.0%) | 1,041 (100.0%) |
Household Income by Mortgage Status in Ozark County
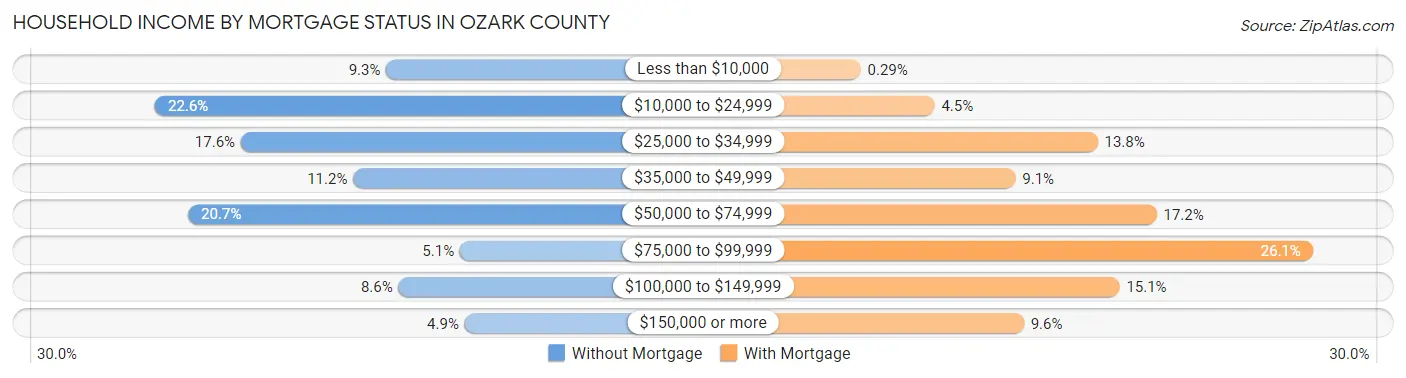
| Household Income | Without Mortgage | With Mortgage |
| Less than $10,000 | 173 (9.3%) | 3 (0.3%) |
| $10,000 to $24,999 | 418 (22.6%) | 47 (4.5%) |
| $25,000 to $34,999 | 327 (17.6%) | 144 (13.8%) |
| $35,000 to $49,999 | 208 (11.2%) | 95 (9.1%) |
| $50,000 to $74,999 | 383 (20.7%) | 179 (17.2%) |
| $75,000 to $99,999 | 95 (5.1%) | 272 (26.1%) |
| $100,000 to $149,999 | 160 (8.6%) | 157 (15.1%) |
| $150,000 or more | 90 (4.9%) | 100 (9.6%) |
| Total | 1,854 (100.0%) | 1,041 (100.0%) |
Property Value to Household Income Ratio in Ozark County
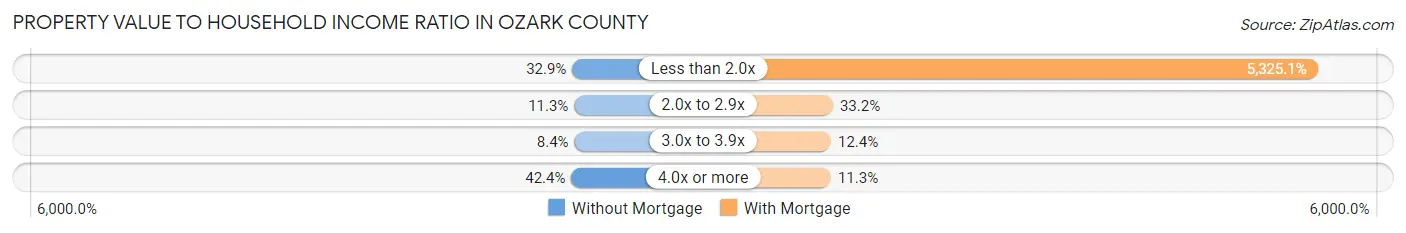
| Value-to-Income Ratio | Without Mortgage | With Mortgage |
| Less than 2.0x | 609 (32.9%) | 55,434 (5,325.1%) |
| 2.0x to 2.9x | 210 (11.3%) | 346 (33.2%) |
| 3.0x to 3.9x | 156 (8.4%) | 129 (12.4%) |
| 4.0x or more | 786 (42.4%) | 118 (11.3%) |
| Total | 1,854 (100.0%) | 1,041 (100.0%) |
Real Estate Taxes by Mortgage Status in Ozark County
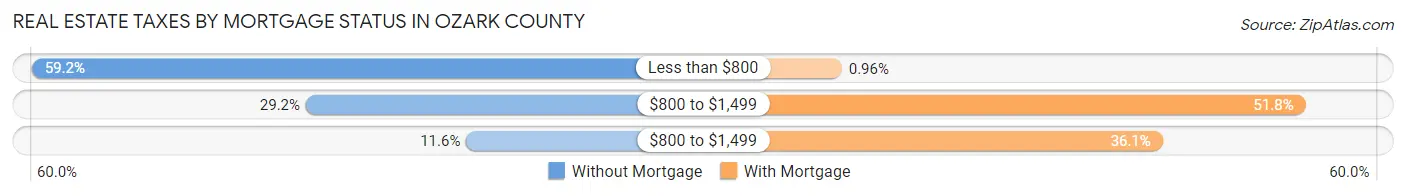
| Property Taxes | Without Mortgage | With Mortgage |
| Less than $800 | 1,098 (59.2%) | 10 (1.0%) |
| $800 to $1,499 | 541 (29.2%) | 539 (51.8%) |
| $800 to $1,499 | 215 (11.6%) | 376 (36.1%) |
| Total | 1,854 (100.0%) | 1,041 (100.0%) |
Health & Disability in Ozark County
Health Insurance Coverage by Age in Ozark County
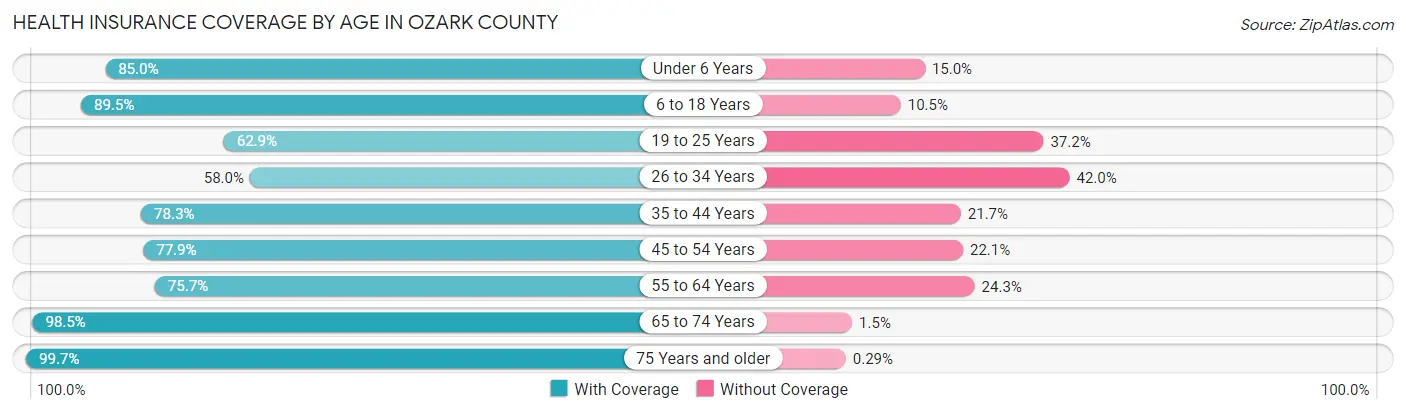
| Age Bracket | With Coverage | Without Coverage |
| Under 6 Years | 356 (85.0%) | 63 (15.0%) |
| 6 to 18 Years | 1,198 (89.5%) | 141 (10.5%) |
| 19 to 25 Years | 269 (62.8%) | 159 (37.1%) |
| 26 to 34 Years | 366 (58.0%) | 265 (42.0%) |
| 35 to 44 Years | 655 (78.3%) | 182 (21.7%) |
| 45 to 54 Years | 777 (77.9%) | 221 (22.1%) |
| 55 to 64 Years | 1,158 (75.7%) | 372 (24.3%) |
| 65 to 74 Years | 1,405 (98.5%) | 21 (1.5%) |
| 75 Years and older | 1,022 (99.7%) | 3 (0.3%) |
| Total | 7,206 (83.5%) | 1,427 (16.5%) |
Health Insurance Coverage by Citizenship Status in Ozark County

| Citizenship Status | With Coverage | Without Coverage |
| Native Born | 356 (85.0%) | 63 (15.0%) |
| Foreign Born, Citizen | 1,198 (89.5%) | 141 (10.5%) |
| Foreign Born, not a Citizen | 269 (62.8%) | 159 (37.1%) |
Health Insurance Coverage by Household Income in Ozark County
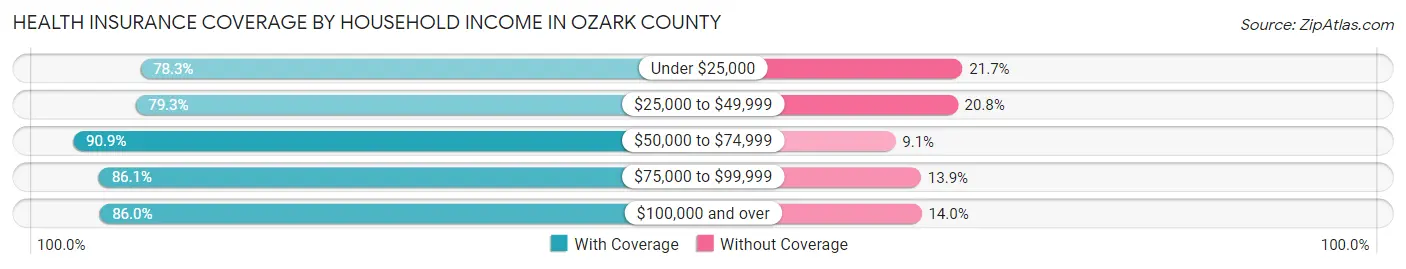
| Household Income | With Coverage | Without Coverage |
| Under $25,000 | 1,704 (78.3%) | 471 (21.7%) |
| $25,000 to $49,999 | 1,726 (79.2%) | 452 (20.7%) |
| $50,000 to $74,999 | 1,748 (90.9%) | 175 (9.1%) |
| $75,000 to $99,999 | 719 (86.1%) | 116 (13.9%) |
| $100,000 and over | 1,309 (86.0%) | 213 (14.0%) |
Public vs Private Health Insurance Coverage by Age in Ozark County
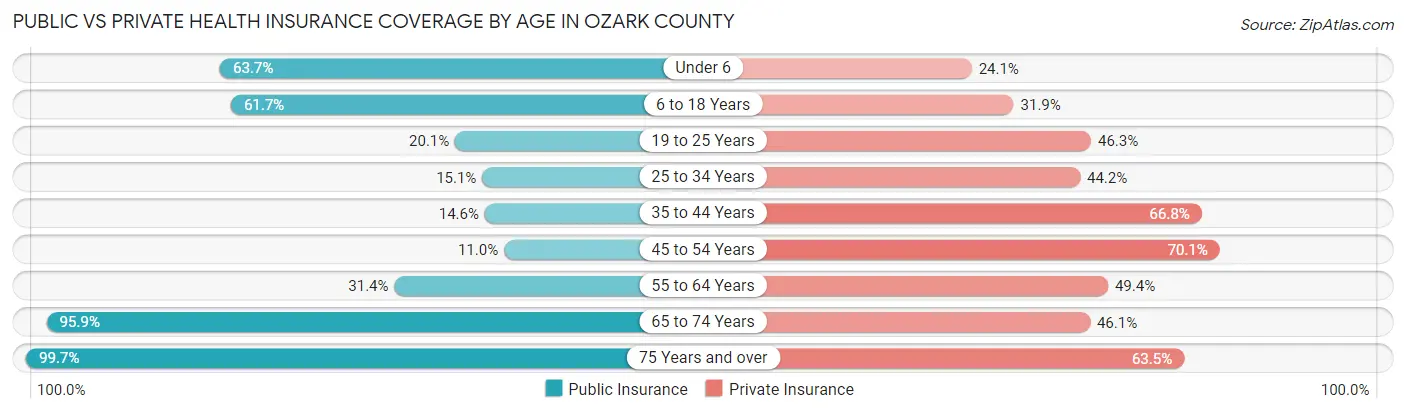
| Age Bracket | Public Insurance | Private Insurance |
| Under 6 | 267 (63.7%) | 101 (24.1%) |
| 6 to 18 Years | 826 (61.7%) | 427 (31.9%) |
| 19 to 25 Years | 86 (20.1%) | 198 (46.3%) |
| 25 to 34 Years | 95 (15.1%) | 279 (44.2%) |
| 35 to 44 Years | 122 (14.6%) | 559 (66.8%) |
| 45 to 54 Years | 110 (11.0%) | 700 (70.1%) |
| 55 to 64 Years | 480 (31.4%) | 756 (49.4%) |
| 65 to 74 Years | 1,368 (95.9%) | 657 (46.1%) |
| 75 Years and over | 1,022 (99.7%) | 651 (63.5%) |
| Total | 4,376 (50.7%) | 4,328 (50.1%) |
Disability Status by Sex by Age in Ozark County
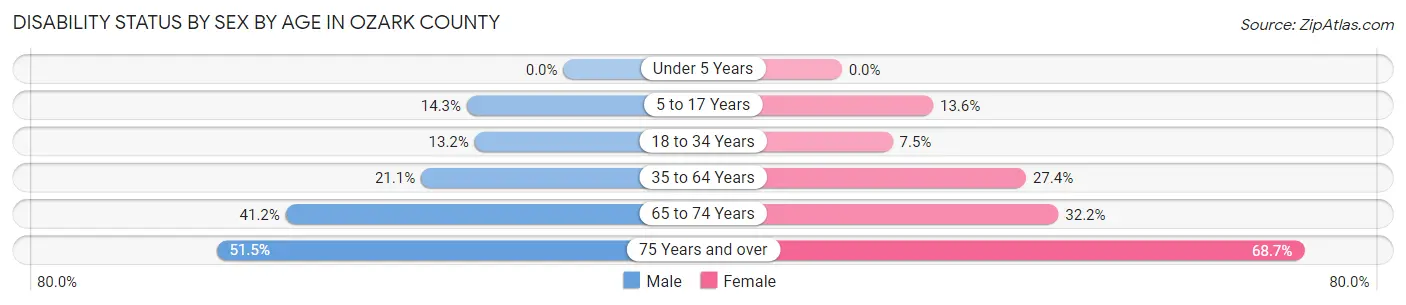
| Age Bracket | Male | Female |
| Under 5 Years | 0 (0.0%) | 0 (0.0%) |
| 5 to 17 Years | 96 (14.3%) | 89 (13.6%) |
| 18 to 34 Years | 77 (13.2%) | 42 (7.5%) |
| 35 to 64 Years | 352 (21.1%) | 465 (27.4%) |
| 65 to 74 Years | 306 (41.2%) | 220 (32.2%) |
| 75 Years and over | 242 (51.5%) | 381 (68.6%) |
Disability Class by Sex by Age in Ozark County
Disability Class: Hearing Difficulty
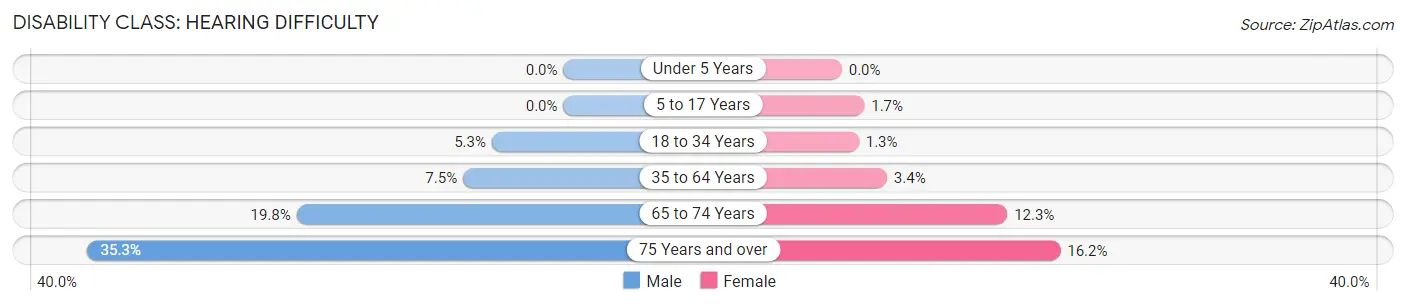
| Age Bracket | Male | Female |
| Under 5 Years | 0 (0.0%) | 0 (0.0%) |
| 5 to 17 Years | 0 (0.0%) | 11 (1.7%) |
| 18 to 34 Years | 31 (5.3%) | 7 (1.3%) |
| 35 to 64 Years | 124 (7.4%) | 57 (3.4%) |
| 65 to 74 Years | 147 (19.8%) | 84 (12.3%) |
| 75 Years and over | 166 (35.3%) | 90 (16.2%) |
Disability Class: Vision Difficulty
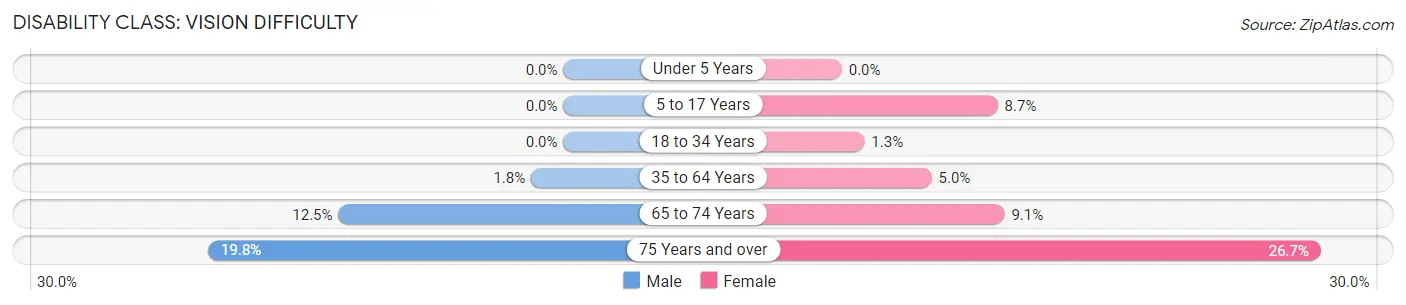
| Age Bracket | Male | Female |
| Under 5 Years | 0 (0.0%) | 0 (0.0%) |
| 5 to 17 Years | 0 (0.0%) | 57 (8.7%) |
| 18 to 34 Years | 0 (0.0%) | 7 (1.3%) |
| 35 to 64 Years | 30 (1.8%) | 85 (5.0%) |
| 65 to 74 Years | 93 (12.5%) | 62 (9.1%) |
| 75 Years and over | 93 (19.8%) | 148 (26.7%) |
Disability Class: Cognitive Difficulty
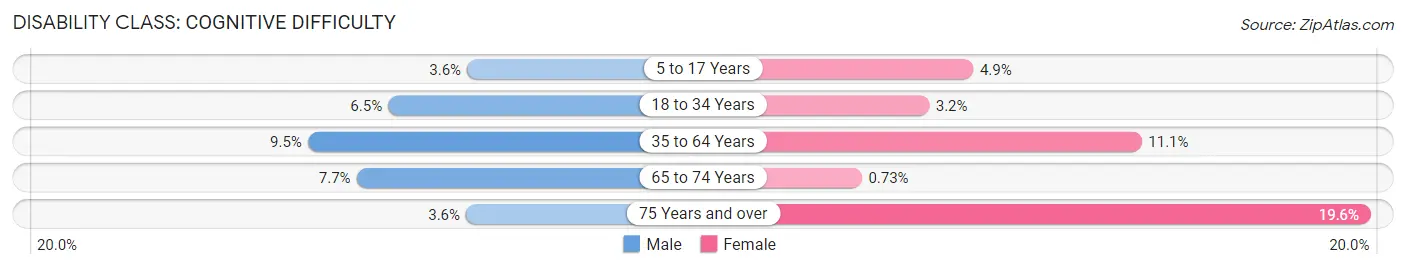
| Age Bracket | Male | Female |
| 5 to 17 Years | 24 (3.6%) | 32 (4.9%) |
| 18 to 34 Years | 38 (6.5%) | 18 (3.2%) |
| 35 to 64 Years | 158 (9.5%) | 189 (11.1%) |
| 65 to 74 Years | 57 (7.7%) | 5 (0.7%) |
| 75 Years and over | 17 (3.6%) | 109 (19.6%) |
Disability Class: Ambulatory Difficulty
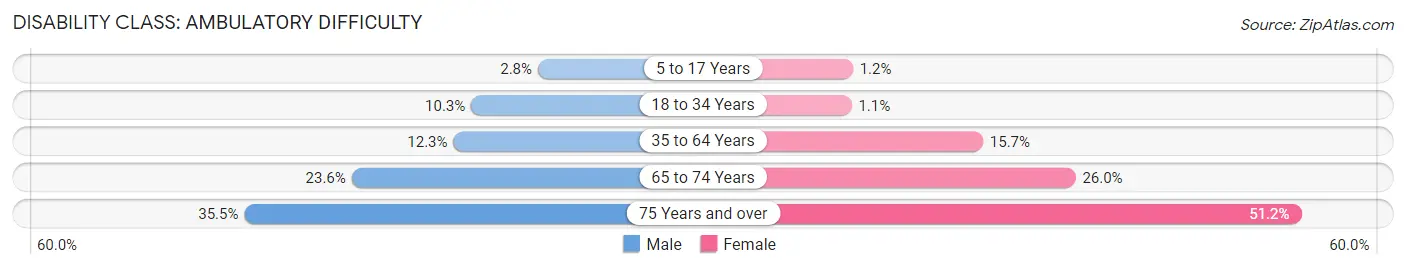
| Age Bracket | Male | Female |
| 5 to 17 Years | 19 (2.8%) | 8 (1.2%) |
| 18 to 34 Years | 60 (10.3%) | 6 (1.1%) |
| 35 to 64 Years | 204 (12.2%) | 267 (15.7%) |
| 65 to 74 Years | 175 (23.6%) | 178 (26.0%) |
| 75 Years and over | 167 (35.5%) | 284 (51.2%) |
Disability Class: Self-Care Difficulty
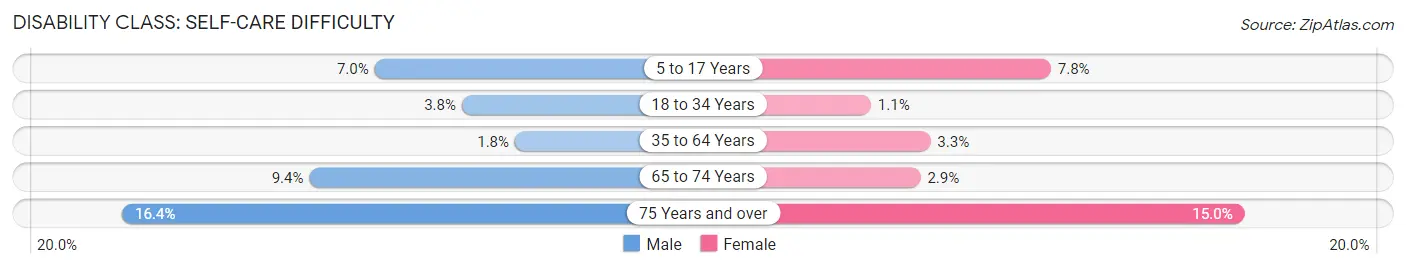
| Age Bracket | Male | Female |
| 5 to 17 Years | 47 (7.0%) | 51 (7.8%) |
| 18 to 34 Years | 22 (3.8%) | 6 (1.1%) |
| 35 to 64 Years | 30 (1.8%) | 56 (3.3%) |
| 65 to 74 Years | 70 (9.4%) | 20 (2.9%) |
| 75 Years and over | 77 (16.4%) | 83 (14.9%) |
Technology Access in Ozark County
Computing Device Access in Ozark County
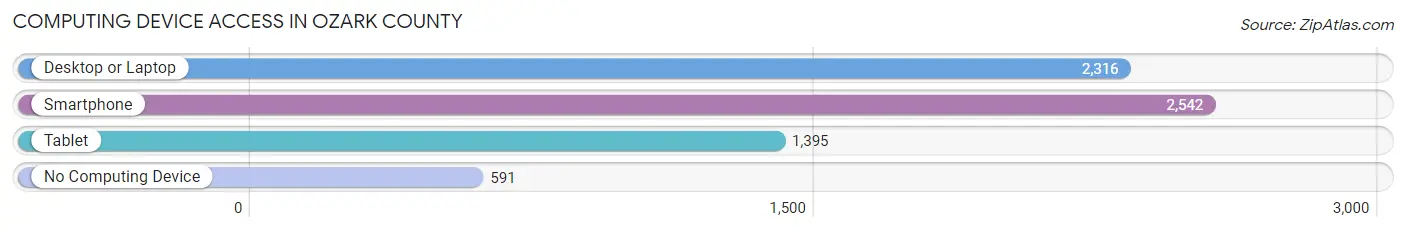
| Device Type | # Households | % Households |
| Desktop or Laptop | 2,316 | 63.4% |
| Smartphone | 2,542 | 69.6% |
| Tablet | 1,395 | 38.2% |
| No Computing Device | 591 | 16.2% |
| Total | 3,654 | 100.0% |
Internet Access in Ozark County
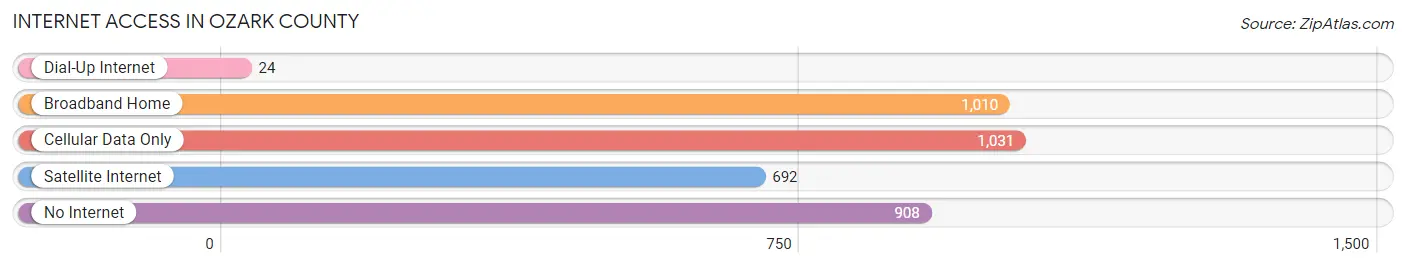
| Internet Type | # Households | % Households |
| Dial-Up Internet | 24 | 0.7% |
| Broadband Home | 1,010 | 27.6% |
| Cellular Data Only | 1,031 | 28.2% |
| Satellite Internet | 692 | 18.9% |
| No Internet | 908 | 24.8% |
| Total | 3,654 | 100.0% |
Ozark County Summary
Ozark County is located in the south-central region of Missouri, and is part of the Ozark Plateau. It is bordered by Douglas County to the north, Taney County to the east, Howell County to the south, and Shannon County to the west. The county seat is Gainesville, and the largest city is Gainesville. The county was established in 1841 and named after the Ozark Mountains.
Geography
Ozark County covers an area of 576 square miles, and is located in the Ozark Mountains. The terrain is mostly hilly and forested, with some open areas. The highest point in the county is located at the summit of Round Mountain, at an elevation of 1,717 feet. The county is drained by the North Fork River, which flows through the center of the county. Other major waterways include the Bryant Creek, the White River, and the James River.
Climate
Ozark County has a humid subtropical climate, with hot, humid summers and mild winters. The average annual temperature is around 57°F, and the average annual precipitation is around 45 inches.
Demographics
As of the 2010 census, there were 9,723 people, 3,845 households, and 2,717 families living in Ozark County. The population density was 17 people per square mile. The racial makeup of the county was 97.2% White, 0.3% African American, 0.4% Native American, 0.2% Asian, 0.1% Pacific Islander, 0.5% from other races, and 1.3% from two or more races. Hispanic or Latino of any race were 1.3% of the population.
The median income for a household in the county was $30,945, and the median income for a family was $37,917. The per capita income for the county was $16,845. About 16.2% of families and 20.2% of the population were below the poverty line, including 28.2% of those under age 18 and 11.2% of those age 65 or over.
Economy
The economy of Ozark County is largely based on agriculture and tourism. The county is home to several large farms, which produce a variety of crops, including corn, soybeans, wheat, hay, and livestock. Tourism is also an important part of the economy, with many visitors coming to the area to enjoy the natural beauty of the Ozark Mountains.
The county is also home to several small businesses, including restaurants, retail stores, and service providers. The county is served by several state highways, as well as the Gainesville Municipal Airport.
Conclusion
Ozark County is a rural county located in the south-central region of Missouri. It is home to a diverse population, and the economy is largely based on agriculture and tourism. The county is home to several large farms, and is a popular destination for visitors looking to enjoy the natural beauty of the Ozark Mountains.
Common Questions
What is Per Capita Income in Ozark County?
Per Capita income in Ozark County is $26,638.
What is the Median Family Income in Ozark County?
Median Family Income in Ozark County is $49,116.
What is the Median Household income in Ozark County?
Median Household Income in Ozark County is $39,125.
What is Income or Wage Gap in Ozark County?
Income or Wage Gap in Ozark County is 31.6%.
Women in Ozark County earn 68.4 cents for every dollar earned by a man.
What is Family Income Deficit in Ozark County?
Family Income Deficit in Ozark County is $11,856.
Families that are below poverty line in Ozark County earn $11,856 less on average than the poverty threshold level.
What is Inequality or Gini Index in Ozark County?
Inequality or Gini Index in Ozark County is 0.53.
What is the Total Population of Ozark County?
Total Population of Ozark County is 8,688.
What is the Total Male Population of Ozark County?
Total Male Population of Ozark County is 4,343.
What is the Total Female Population of Ozark County?
Total Female Population of Ozark County is 4,345.
What is the Ratio of Males per 100 Females in Ozark County?
There are 99.95 Males per 100 Females in Ozark County.
What is the Ratio of Females per 100 Males in Ozark County?
There are 100.05 Females per 100 Males in Ozark County.
What is the Median Population Age in Ozark County?
Median Population Age in Ozark County is 52.6 Years.
What is the Average Family Size in Ozark County
Average Family Size in Ozark County is 3.0 People.
What is the Average Household Size in Ozark County
Average Household Size in Ozark County is 2.4 People.
How Large is the Labor Force in Ozark County?
There are 3,167 People in the Labor Forcein in Ozark County.
What is the Percentage of People in the Labor Force in Ozark County?
44.0% of People are in the Labor Force in Ozark County.
What is the Unemployment Rate in Ozark County?
Unemployment Rate in Ozark County is 6.2%.