Oregon County, MO Map & Demographics
Oregon County Map
Oregon County Overview
$21,405
PER CAPITA INCOME
$50,451
AVG FAMILY INCOME
$41,365
AVG HOUSEHOLD INCOME
34.0%
WAGE / INCOME GAP [ % ]
66.0¢/ $1
WAGE / INCOME GAP [ $ ]
$6,986
FAMILY INCOME DEFICIT
0.43
INEQUALITY / GINI INDEX
8,783
TOTAL POPULATION
4,367
MALE POPULATION
4,416
FEMALE POPULATION
98.89
MALES / 100 FEMALES
101.12
FEMALES / 100 MALES
44.7
MEDIAN AGE
3.0
AVG FAMILY SIZE
2.6
AVG HOUSEHOLD SIZE
3,387
LABOR FORCE [ PEOPLE ]
48.6%
PERCENT IN LABOR FORCE
4.5%
UNEMPLOYMENT RATE
Oregon County Area Codes
Income in Oregon County
Income Overview in Oregon County
Per Capita Income in Oregon County is $21,405, while median incomes of families and households are $50,451 and $41,365 respectively.
| Characteristic | Number | Measure |
| Per Capita Income | 8,783 | $21,405 |
| Median Family Income | 2,346 | $50,451 |
| Mean Family Income | 2,346 | $60,040 |
| Median Household Income | 3,383 | $41,365 |
| Mean Household Income | 3,383 | $52,756 |
| Income Deficit | 2,346 | $6,986 |
| Wage / Income Gap (%) | 8,783 | 34.04% |
| Wage / Income Gap ($) | 8,783 | 65.96¢ per $1 |
| Gini / Inequality Index | 8,783 | 0.43 |
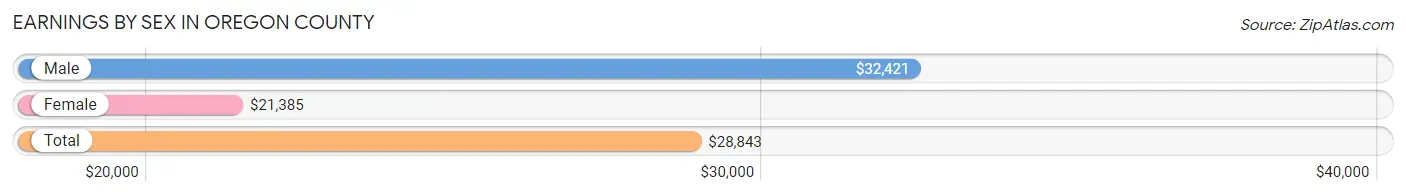
Earnings by Sex in Oregon County
Average Earnings in Oregon County are $28,843, $32,421 for men and $21,385 for women, a difference of 34.0%.
| Sex | Number | Average Earnings |
| Male | 1,887 (53.3%) | $32,421 |
| Female | 1,654 (46.7%) | $21,385 |
| Total | 3,541 (100.0%) | $28,843 |
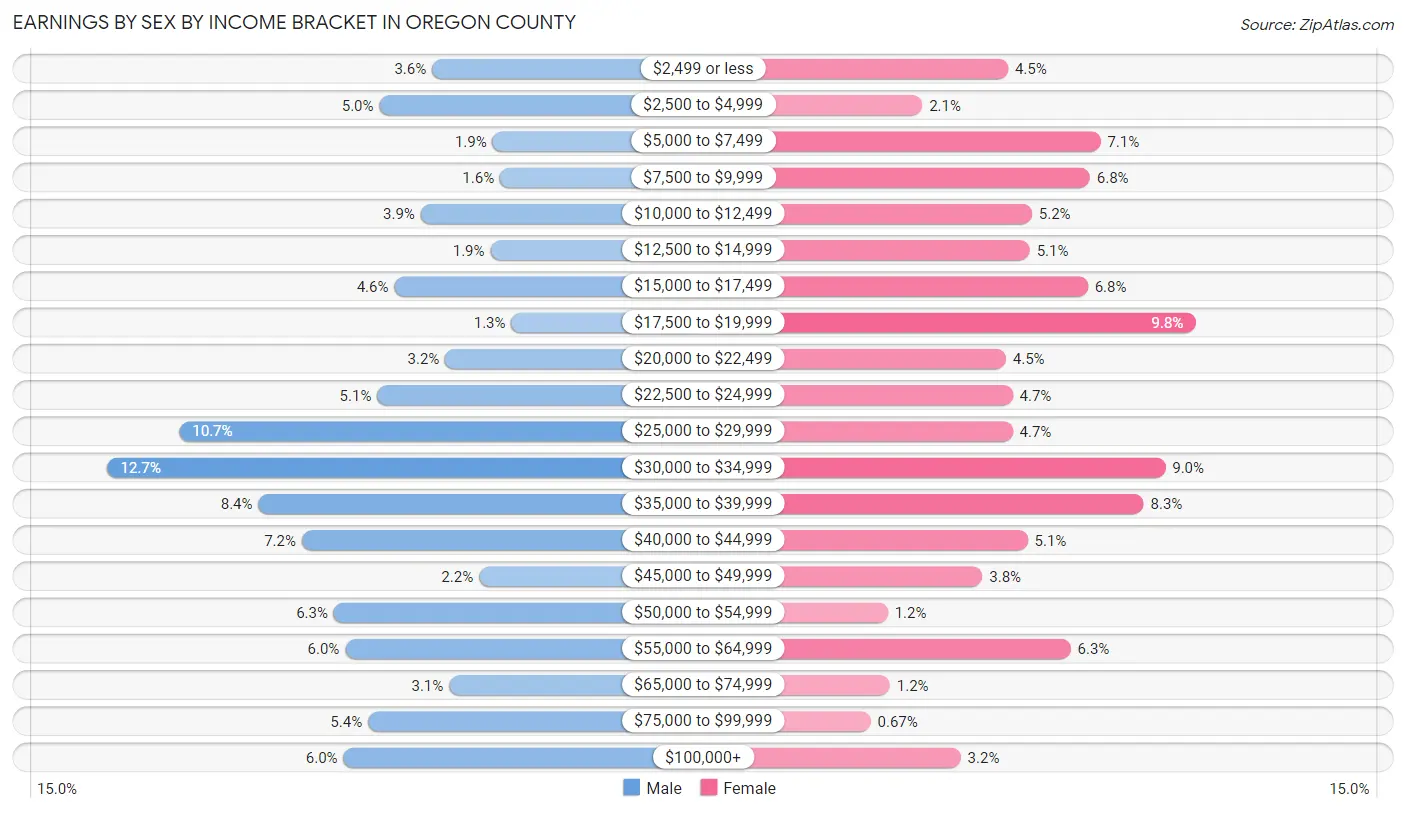
Earnings by Sex by Income Bracket in Oregon County
The most common earnings brackets in Oregon County are $30,000 to $34,999 for men (239 | 12.7%) and $17,500 to $19,999 for women (162 | 9.8%).
| Income | Male | Female |
| $2,499 or less | 67 (3.5%) | 75 (4.5%) |
| $2,500 to $4,999 | 95 (5.0%) | 35 (2.1%) |
| $5,000 to $7,499 | 35 (1.8%) | 118 (7.1%) |
| $7,500 to $9,999 | 31 (1.6%) | 113 (6.8%) |
| $10,000 to $12,499 | 73 (3.9%) | 86 (5.2%) |
| $12,500 to $14,999 | 36 (1.9%) | 85 (5.1%) |
| $15,000 to $17,499 | 87 (4.6%) | 112 (6.8%) |
| $17,500 to $19,999 | 25 (1.3%) | 162 (9.8%) |
| $20,000 to $22,499 | 60 (3.2%) | 74 (4.5%) |
| $22,500 to $24,999 | 96 (5.1%) | 77 (4.7%) |
| $25,000 to $29,999 | 201 (10.6%) | 77 (4.7%) |
| $30,000 to $34,999 | 239 (12.7%) | 148 (8.9%) |
| $35,000 to $39,999 | 159 (8.4%) | 138 (8.3%) |
| $40,000 to $44,999 | 136 (7.2%) | 84 (5.1%) |
| $45,000 to $49,999 | 42 (2.2%) | 63 (3.8%) |
| $50,000 to $54,999 | 119 (6.3%) | 19 (1.1%) |
| $55,000 to $64,999 | 113 (6.0%) | 104 (6.3%) |
| $65,000 to $74,999 | 58 (3.1%) | 20 (1.2%) |
| $75,000 to $99,999 | 101 (5.3%) | 11 (0.7%) |
| $100,000+ | 114 (6.0%) | 53 (3.2%) |
| Total | 1,887 (100.0%) | 1,654 (100.0%) |
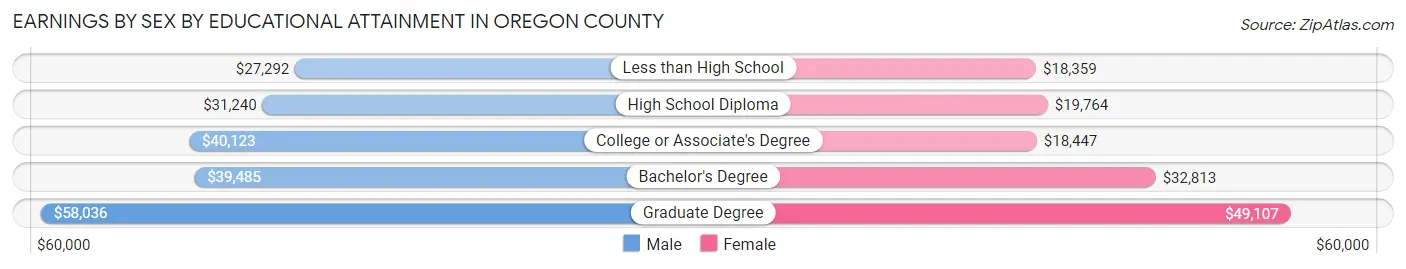
Earnings by Sex by Educational Attainment in Oregon County
Average earnings in Oregon County are $33,686 for men and $22,365 for women, a difference of 33.6%. Men with an educational attainment of graduate degree enjoy the highest average annual earnings of $58,036, while those with less than high school education earn the least with $27,292. Women with an educational attainment of graduate degree earn the most with the average annual earnings of $49,107, while those with less than high school education have the smallest earnings of $18,359.
| Educational Attainment | Male Income | Female Income |
| Less than High School | $27,292 | $18,359 |
| High School Diploma | $31,240 | $19,764 |
| College or Associate's Degree | $40,123 | $18,447 |
| Bachelor's Degree | $39,485 | $32,813 |
| Graduate Degree | $58,036 | $49,107 |
| Total | $33,686 | $22,365 |
Family Income in Oregon County
Family Income Brackets in Oregon County
According to the Oregon County family income data, there are 638 families falling into the $50,000 to $74,999 income range, which is the most common income bracket and makes up 27.2% of all families. Conversely, the $150,000 to $199,999 income bracket is the least frequent group with only 35 families (1.5%) belonging to this category.
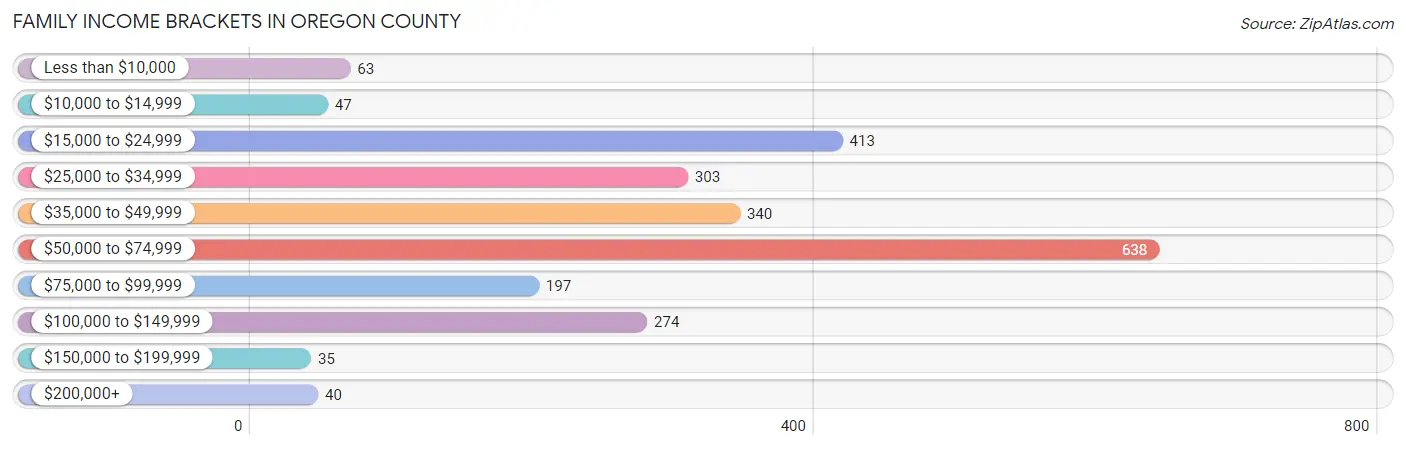
| Income Bracket | # Families | % Families |
| Less than $10,000 | 63 | 2.7% |
| $10,000 to $14,999 | 47 | 2.0% |
| $15,000 to $24,999 | 413 | 17.6% |
| $25,000 to $34,999 | 303 | 12.9% |
| $35,000 to $49,999 | 340 | 14.5% |
| $50,000 to $74,999 | 638 | 27.2% |
| $75,000 to $99,999 | 197 | 8.4% |
| $100,000 to $149,999 | 274 | 11.7% |
| $150,000 to $199,999 | 35 | 1.5% |
| $200,000+ | 40 | 1.7% |
Family Income by Famaliy Size in Oregon County
5-person families (182 | 7.8%) account for the highest median family income in Oregon County with $58,646 per family, while 2-person families (1,253 | 53.4%) have the highest median income of $23,880 per family member.
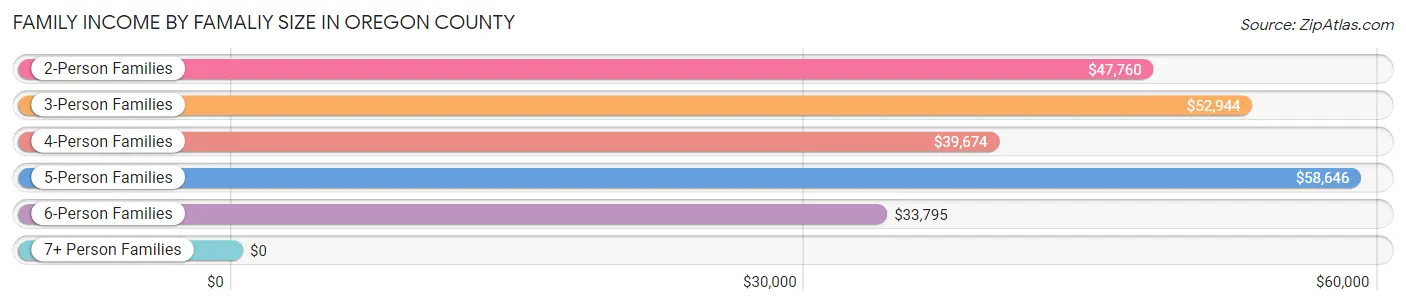
| Income Bracket | # Families | Median Income |
| 2-Person Families | 1,253 (53.4%) | $47,760 |
| 3-Person Families | 481 (20.5%) | $52,944 |
| 4-Person Families | 350 (14.9%) | $39,674 |
| 5-Person Families | 182 (7.8%) | $58,646 |
| 6-Person Families | 33 (1.4%) | $33,795 |
| 7+ Person Families | 47 (2.0%) | $0 |
| Total | 2,346 (100.0%) | $50,451 |
Family Income by Number of Earners in Oregon County
The median family income in Oregon County is $50,451, with families comprising 3+ earners (130) having the highest median family income of $81,184, while families with no earners (773) have the lowest median family income of $28,355, accounting for 5.5% and 33.0% of families, respectively.
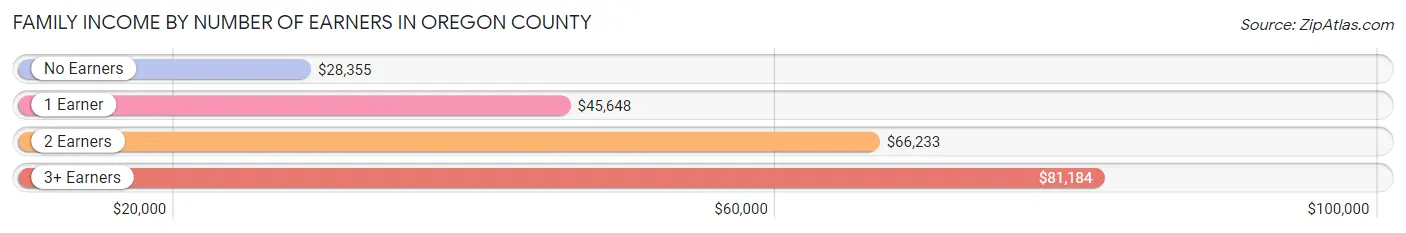
| Number of Earners | # Families | Median Income |
| No Earners | 773 (33.0%) | $28,355 |
| 1 Earner | 650 (27.7%) | $45,648 |
| 2 Earners | 793 (33.8%) | $66,233 |
| 3+ Earners | 130 (5.5%) | $81,184 |
| Total | 2,346 (100.0%) | $50,451 |
Household Income in Oregon County
Household Income Brackets in Oregon County
With 687 households falling in the category, the $50,000 to $74,999 income range is the most frequent in Oregon County, accounting for 20.3% of all households. In contrast, only 41 households (1.2%) fall into the $200,000+ income bracket, making it the least populous group.
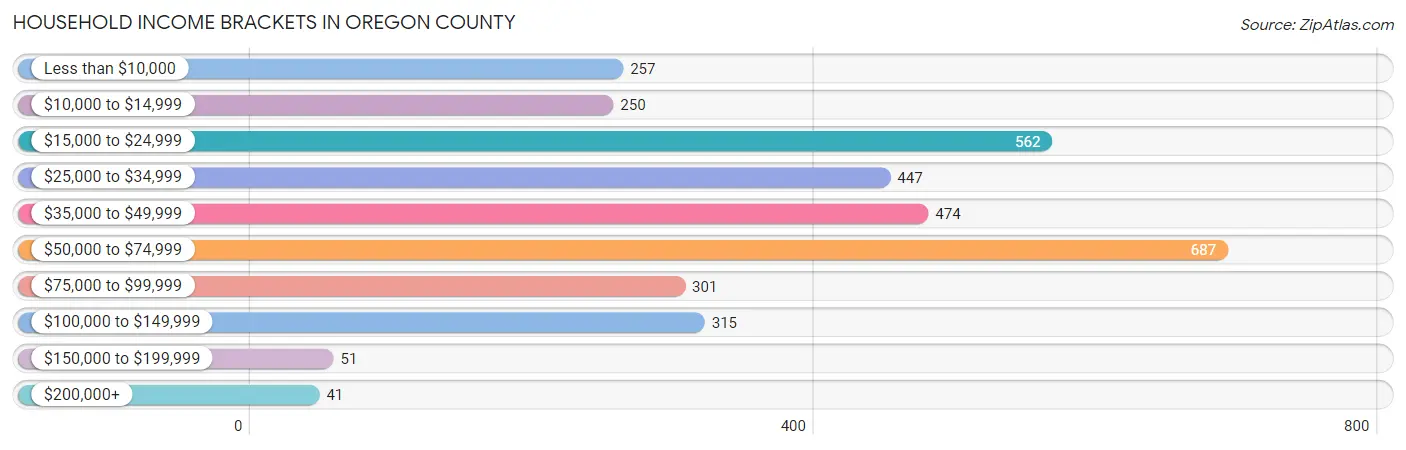
| Income Bracket | # Households | % Households |
| Less than $10,000 | 257 | 7.6% |
| $10,000 to $14,999 | 250 | 7.4% |
| $15,000 to $24,999 | 562 | 16.6% |
| $25,000 to $34,999 | 447 | 13.2% |
| $35,000 to $49,999 | 474 | 14.0% |
| $50,000 to $74,999 | 687 | 20.3% |
| $75,000 to $99,999 | 301 | 8.9% |
| $100,000 to $149,999 | 315 | 9.3% |
| $150,000 to $199,999 | 51 | 1.5% |
| $200,000+ | 41 | 1.2% |
Household Income by Householder Age in Oregon County
The median household income in Oregon County is $41,365, with the highest median household income of $49,401 found in the 25 to 44 years age bracket for the primary householder. A total of 787 households (23.3%) fall into this category. Meanwhile, the 15 to 24 years age bracket for the primary householder has the lowest median household income of $0, with 116 households (3.4%) in this group.
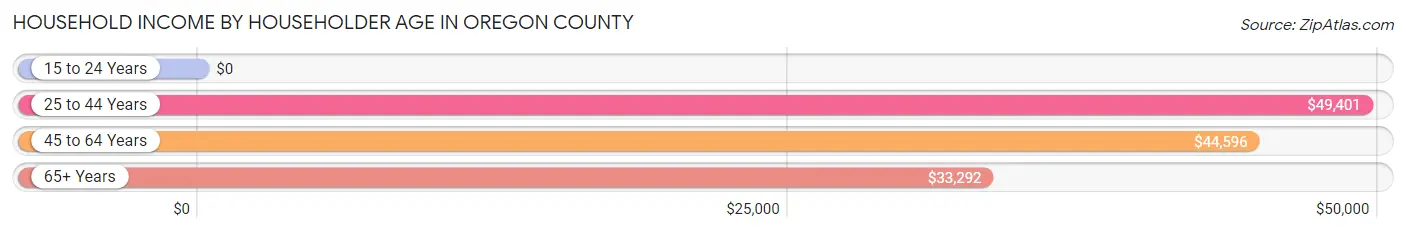
| Income Bracket | # Households | Median Income |
| 15 to 24 Years | 116 (3.4%) | $0 |
| 25 to 44 Years | 787 (23.3%) | $49,401 |
| 45 to 64 Years | 1,235 (36.5%) | $44,596 |
| 65+ Years | 1,245 (36.8%) | $33,292 |
| Total | 3,383 (100.0%) | $41,365 |
Poverty in Oregon County
Income Below Poverty by Sex and Age in Oregon County
With 20.5% poverty level for males and 25.5% for females among the residents of Oregon County, 5 year old males and 16 and 17 year old females are the most vulnerable to poverty, with 46 males (74.2%) and 64 females (66.7%) in their respective age groups living below the poverty level.
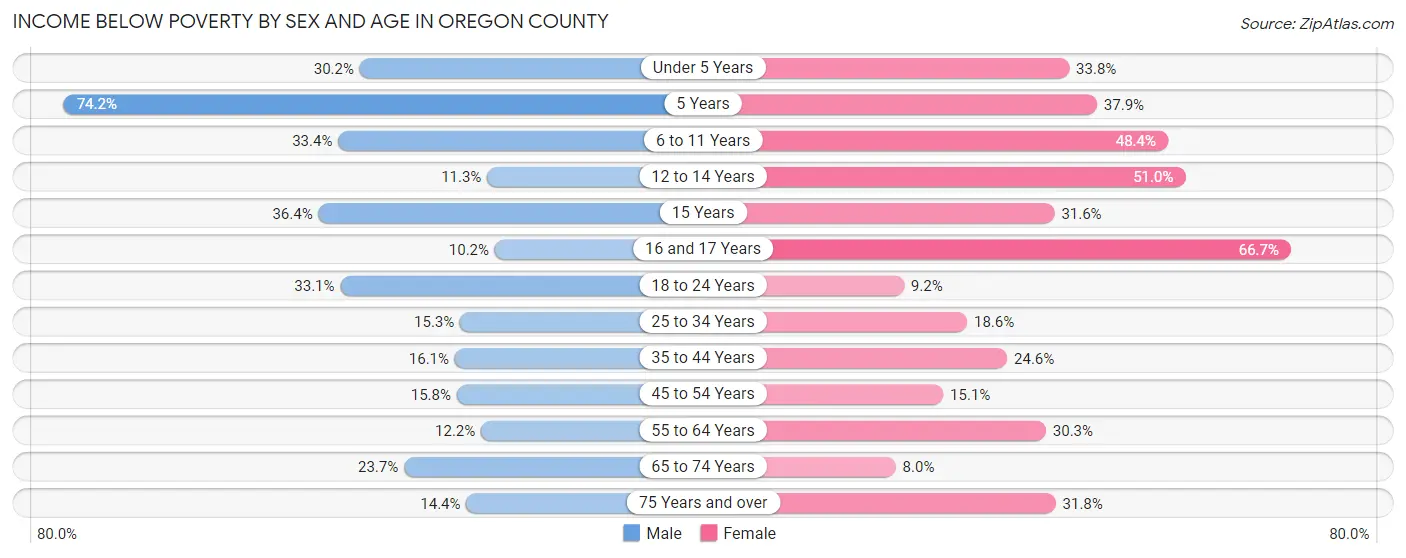
| Age Bracket | Male | Female |
| Under 5 Years | 78 (30.2%) | 80 (33.8%) |
| 5 Years | 46 (74.2%) | 25 (37.9%) |
| 6 to 11 Years | 119 (33.4%) | 136 (48.4%) |
| 12 to 14 Years | 19 (11.3%) | 77 (51.0%) |
| 15 Years | 28 (36.4%) | 24 (31.6%) |
| 16 and 17 Years | 12 (10.2%) | 64 (66.7%) |
| 18 to 24 Years | 97 (33.1%) | 27 (9.2%) |
| 25 to 34 Years | 69 (15.3%) | 77 (18.6%) |
| 35 to 44 Years | 67 (16.1%) | 122 (24.5%) |
| 45 to 54 Years | 78 (15.8%) | 76 (15.0%) |
| 55 to 64 Years | 83 (12.2%) | 200 (30.3%) |
| 65 to 74 Years | 131 (23.6%) | 46 (8.0%) |
| 75 Years and over | 52 (14.4%) | 140 (31.8%) |
| Total | 879 (20.5%) | 1,094 (25.5%) |
Income Above Poverty by Sex and Age in Oregon County
According to the poverty statistics in Oregon County, males aged 16 and 17 years and females aged 65 to 74 years are the age groups that are most secure financially, with 89.8% of males and 92.0% of females in these age groups living above the poverty line.
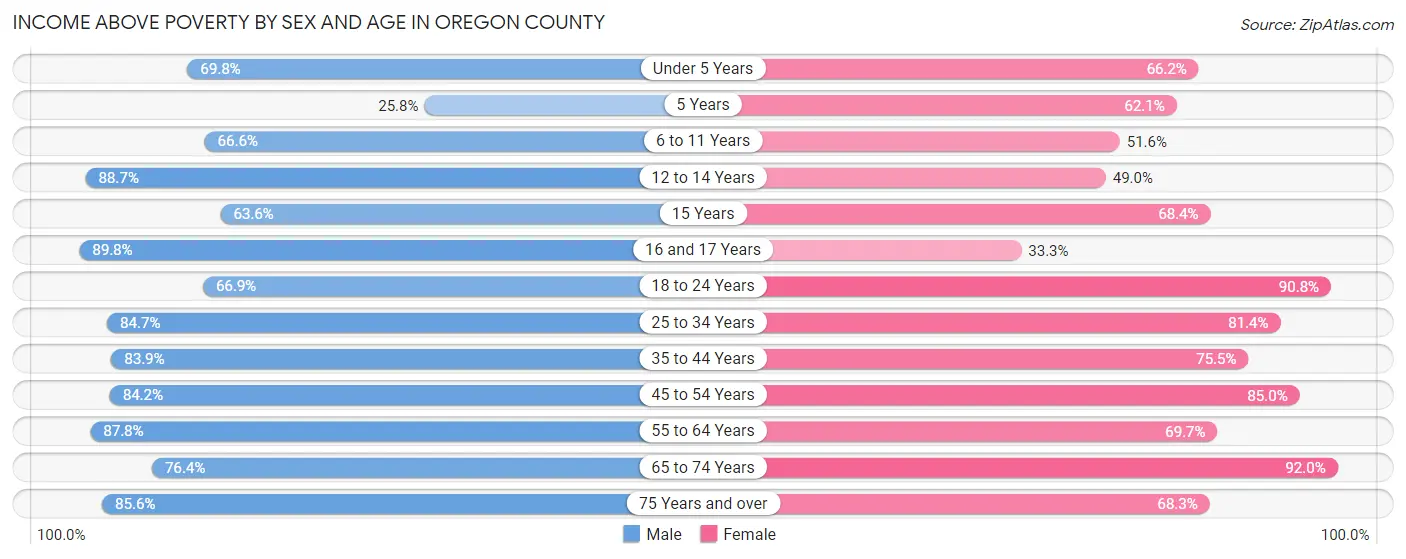
| Age Bracket | Male | Female |
| Under 5 Years | 180 (69.8%) | 157 (66.2%) |
| 5 Years | 16 (25.8%) | 41 (62.1%) |
| 6 to 11 Years | 237 (66.6%) | 145 (51.6%) |
| 12 to 14 Years | 149 (88.7%) | 74 (49.0%) |
| 15 Years | 49 (63.6%) | 52 (68.4%) |
| 16 and 17 Years | 106 (89.8%) | 32 (33.3%) |
| 18 to 24 Years | 196 (66.9%) | 266 (90.8%) |
| 25 to 34 Years | 381 (84.7%) | 337 (81.4%) |
| 35 to 44 Years | 349 (83.9%) | 375 (75.4%) |
| 45 to 54 Years | 415 (84.2%) | 429 (85.0%) |
| 55 to 64 Years | 597 (87.8%) | 460 (69.7%) |
| 65 to 74 Years | 423 (76.3%) | 529 (92.0%) |
| 75 Years and over | 309 (85.6%) | 301 (68.2%) |
| Total | 3,407 (79.5%) | 3,198 (74.5%) |
Income Below Poverty Among Married-Couple Families in Oregon County
The poverty statistics for married-couple families in Oregon County show that 13.4% or 243 of the total 1,820 families live below the poverty line. Families with 3 or 4 children have the highest poverty rate of 33.1%, comprising of 55 families. On the other hand, families with no children have the lowest poverty rate of 10.6%, which includes 127 families.
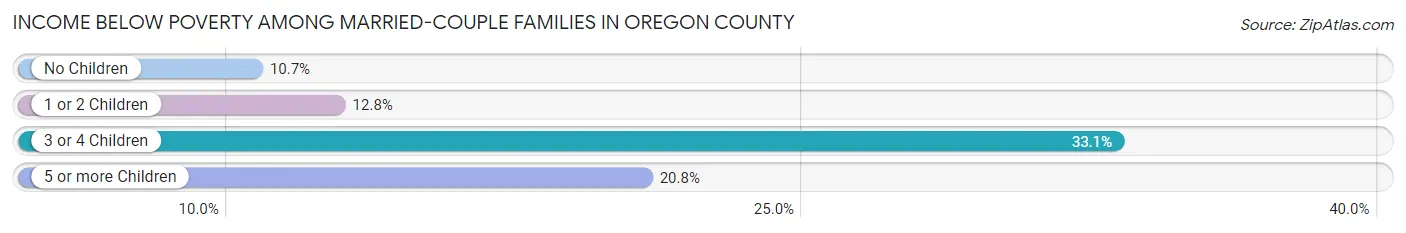
| Children | Above Poverty | Below Poverty |
| No Children | 1,066 (89.3%) | 127 (10.6%) |
| 1 or 2 Children | 381 (87.2%) | 56 (12.8%) |
| 3 or 4 Children | 111 (66.9%) | 55 (33.1%) |
| 5 or more Children | 19 (79.2%) | 5 (20.8%) |
| Total | 1,577 (86.7%) | 243 (13.4%) |
Income Below Poverty Among Single-Parent Households in Oregon County
According to the poverty data in Oregon County, 25.7% or 28 single-father households and 40.3% or 168 single-mother households are living below the poverty line. Among single-father households, those with 1 or 2 children have the highest poverty rate, with 24 households (37.5%) experiencing poverty. Likewise, among single-mother households, those with 5 or more children have the highest poverty rate, with 4 households (100.0%) falling below the poverty line.
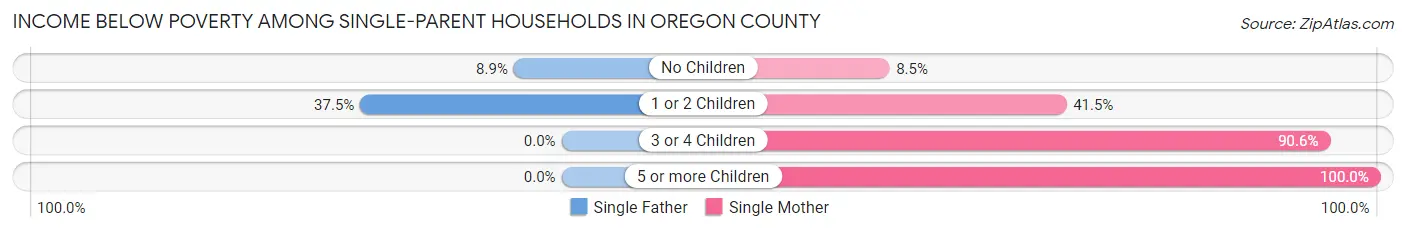
| Children | Single Father | Single Mother |
| No Children | 4 (8.9%) | 14 (8.5%) |
| 1 or 2 Children | 24 (37.5%) | 63 (41.4%) |
| 3 or 4 Children | 0 (0.0%) | 87 (90.6%) |
| 5 or more Children | 0 (0.0%) | 4 (100.0%) |
| Total | 28 (25.7%) | 168 (40.3%) |
Income Below Poverty Among Married-Couple vs Single-Parent Households in Oregon County
The poverty data for Oregon County shows that 243 of the married-couple family households (13.4%) and 196 of the single-parent households (37.3%) are living below the poverty level. Within the married-couple family households, those with 3 or 4 children have the highest poverty rate, with 55 households (33.1%) falling below the poverty line. Among the single-parent households, those with 5 or more children have the highest poverty rate, with 4 household (100.0%) living below poverty.
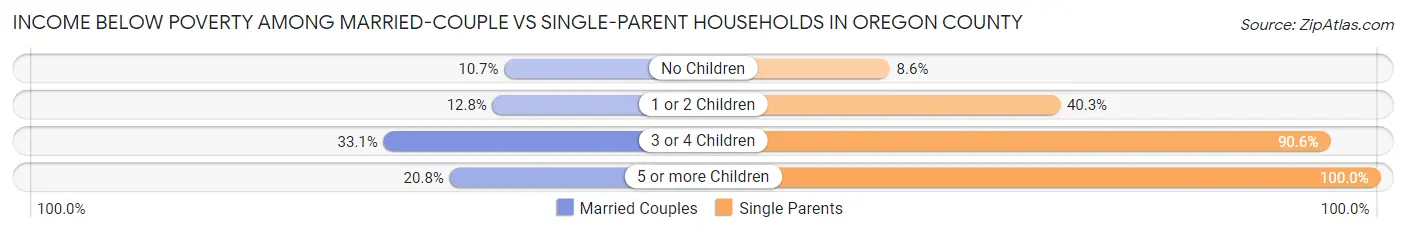
| Children | Married-Couple Families | Single-Parent Households |
| No Children | 127 (10.6%) | 18 (8.6%) |
| 1 or 2 Children | 56 (12.8%) | 87 (40.3%) |
| 3 or 4 Children | 55 (33.1%) | 87 (90.6%) |
| 5 or more Children | 5 (20.8%) | 4 (100.0%) |
| Total | 243 (13.4%) | 196 (37.3%) |
Race in Oregon County
The most populous races in Oregon County are White / Caucasian (8,291 | 94.4%), Two or more Races (402 | 4.6%), and Hispanic or Latino (171 | 1.9%).
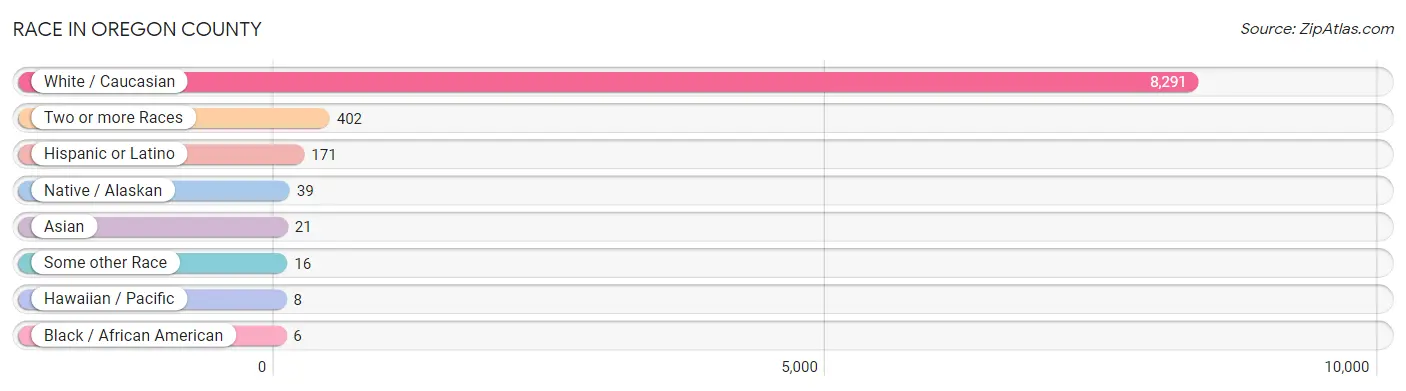
| Race | # Population | % Population |
| Asian | 21 | 0.2% |
| Black / African American | 6 | 0.1% |
| Hawaiian / Pacific | 8 | 0.1% |
| Hispanic or Latino | 171 | 1.9% |
| Native / Alaskan | 39 | 0.4% |
| White / Caucasian | 8,291 | 94.4% |
| Two or more Races | 402 | 4.6% |
| Some other Race | 16 | 0.2% |
| Total | 8,783 | 100.0% |
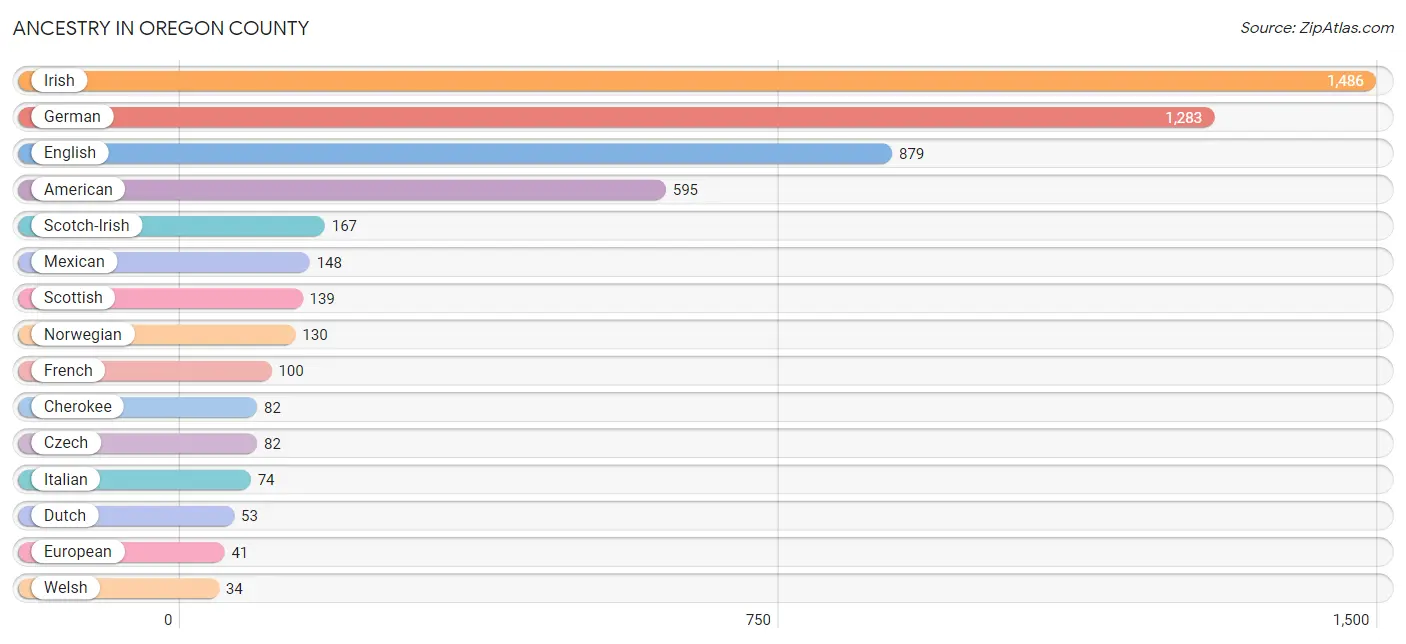
Ancestry in Oregon County
The most populous ancestries reported in Oregon County are Irish (1,486 | 16.9%), German (1,283 | 14.6%), English (879 | 10.0%), American (595 | 6.8%), and Scotch-Irish (167 | 1.9%), together accounting for 50.2% of all Oregon County residents.
| Ancestry | # Population | % Population |
| Aleut | 10 | 0.1% |
| American | 595 | 6.8% |
| Arab | 4 | 0.1% |
| Austrian | 2 | 0.0% |
| Bhutanese | 4 | 0.1% |
| Blackfeet | 5 | 0.1% |
| British | 13 | 0.2% |
| Canadian | 3 | 0.0% |
| Cherokee | 82 | 0.9% |
| Choctaw | 15 | 0.2% |
| Czech | 82 | 0.9% |
| Danish | 18 | 0.2% |
| Dutch | 53 | 0.6% |
| English | 879 | 10.0% |
| European | 41 | 0.5% |
| French | 100 | 1.1% |
| French Canadian | 20 | 0.2% |
| German | 1,283 | 14.6% |
| Greek | 4 | 0.1% |
| Hungarian | 8 | 0.1% |
| Indian (Asian) | 1 | 0.0% |
| Irish | 1,486 | 16.9% |
| Italian | 74 | 0.8% |
| Korean | 32 | 0.4% |
| Lithuanian | 5 | 0.1% |
| Mexican | 148 | 1.7% |
| Native Hawaiian | 6 | 0.1% |
| Navajo | 11 | 0.1% |
| Norwegian | 130 | 1.5% |
| Pennsylvania German | 3 | 0.0% |
| Polish | 12 | 0.1% |
| Russian | 20 | 0.2% |
| Scandinavian | 11 | 0.1% |
| Scotch-Irish | 167 | 1.9% |
| Scottish | 139 | 1.6% |
| Seminole | 5 | 0.1% |
| Spaniard | 9 | 0.1% |
| Spanish | 14 | 0.2% |
| Sri Lankan | 17 | 0.2% |
| Swedish | 6 | 0.1% |
| Swiss | 12 | 0.1% |
| Syrian | 4 | 0.1% |
| Welsh | 34 | 0.4% | View All 43 Rows |
Immigrants in Oregon County
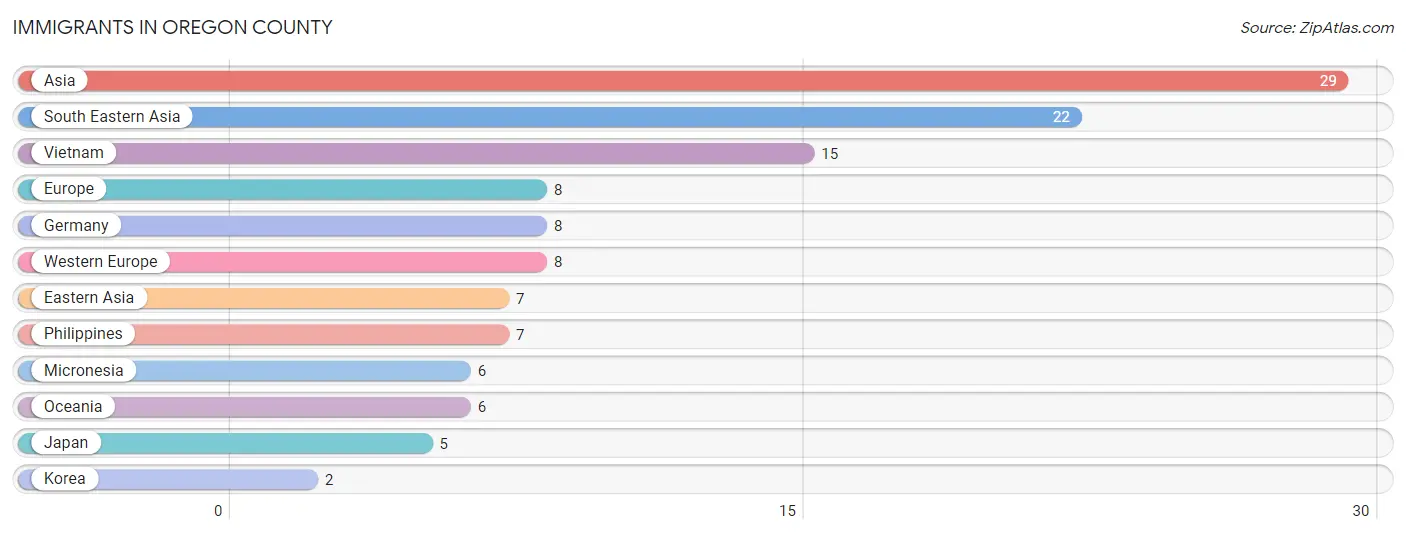
The most numerous immigrant groups reported in Oregon County came from Asia (29 | 0.3%), South Eastern Asia (22 | 0.3%), Vietnam (15 | 0.2%), Europe (8 | 0.1%), and Germany (8 | 0.1%), together accounting for 0.9% of all Oregon County residents.
| Immigration Origin | # Population | % Population |
| Asia | 29 | 0.3% |
| Eastern Asia | 7 | 0.1% |
| Europe | 8 | 0.1% |
| Germany | 8 | 0.1% |
| Japan | 5 | 0.1% |
| Korea | 2 | 0.0% |
| Micronesia | 6 | 0.1% |
| Oceania | 6 | 0.1% |
| Philippines | 7 | 0.1% |
| South Eastern Asia | 22 | 0.3% |
| Vietnam | 15 | 0.2% |
| Western Europe | 8 | 0.1% | View All 12 Rows |
Sex and Age in Oregon County
Sex and Age in Oregon County
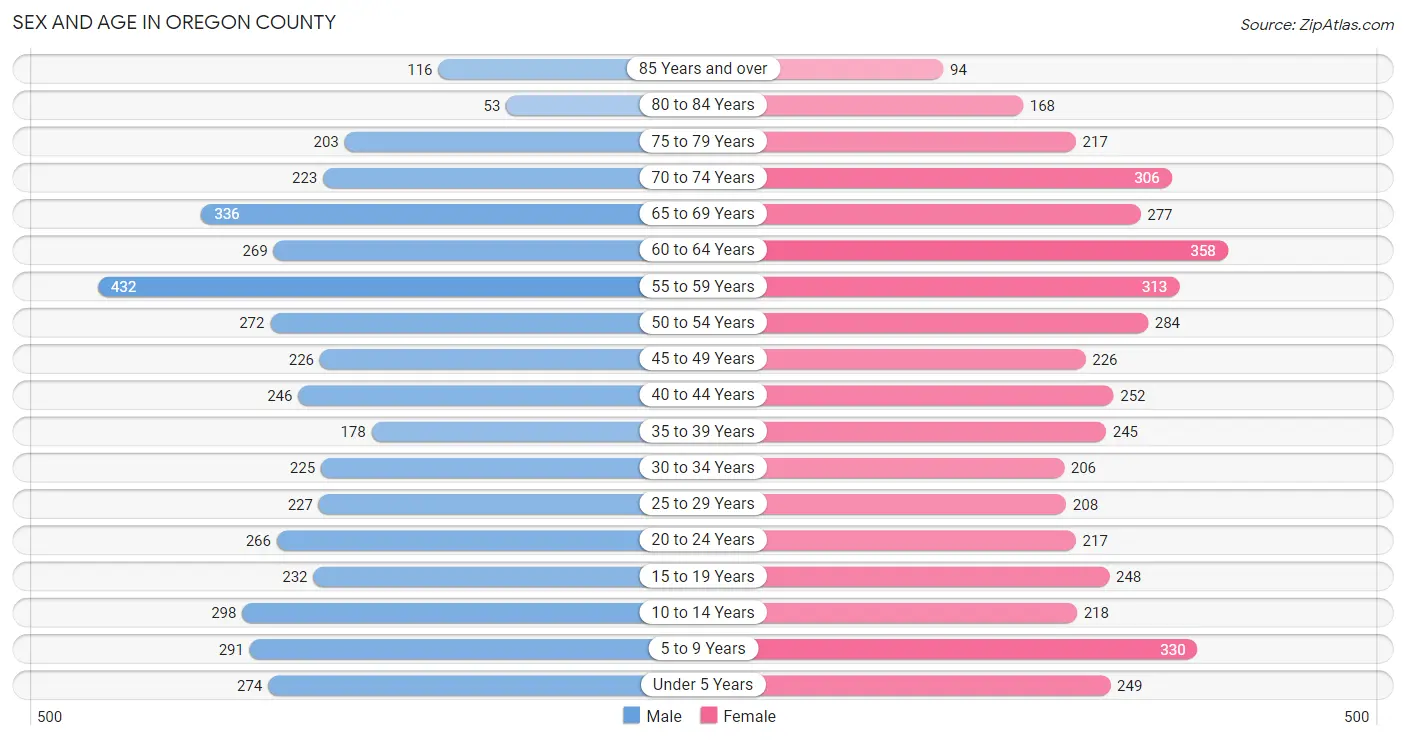
The most populous age groups in Oregon County are 55 to 59 Years (432 | 9.9%) for men and 60 to 64 Years (358 | 8.1%) for women.
| Age Bracket | Male | Female |
| Under 5 Years | 274 (6.3%) | 249 (5.6%) |
| 5 to 9 Years | 291 (6.7%) | 330 (7.5%) |
| 10 to 14 Years | 298 (6.8%) | 218 (4.9%) |
| 15 to 19 Years | 232 (5.3%) | 248 (5.6%) |
| 20 to 24 Years | 266 (6.1%) | 217 (4.9%) |
| 25 to 29 Years | 227 (5.2%) | 208 (4.7%) |
| 30 to 34 Years | 225 (5.1%) | 206 (4.7%) |
| 35 to 39 Years | 178 (4.1%) | 245 (5.6%) |
| 40 to 44 Years | 246 (5.6%) | 252 (5.7%) |
| 45 to 49 Years | 226 (5.2%) | 226 (5.1%) |
| 50 to 54 Years | 272 (6.2%) | 284 (6.4%) |
| 55 to 59 Years | 432 (9.9%) | 313 (7.1%) |
| 60 to 64 Years | 269 (6.2%) | 358 (8.1%) |
| 65 to 69 Years | 336 (7.7%) | 277 (6.3%) |
| 70 to 74 Years | 223 (5.1%) | 306 (6.9%) |
| 75 to 79 Years | 203 (4.6%) | 217 (4.9%) |
| 80 to 84 Years | 53 (1.2%) | 168 (3.8%) |
| 85 Years and over | 116 (2.7%) | 94 (2.1%) |
| Total | 4,367 (100.0%) | 4,416 (100.0%) |
Families and Households in Oregon County
Median Family Size in Oregon County
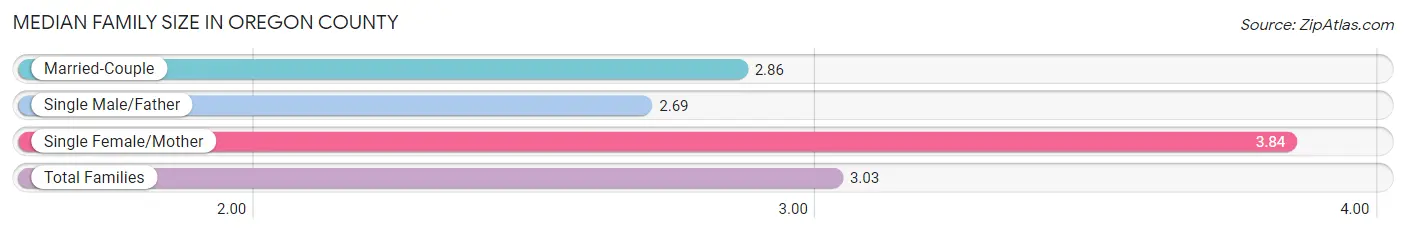
The median family size in Oregon County is 3.03 persons per family, with single female/mother families (417 | 17.8%) accounting for the largest median family size of 3.84 persons per family. On the other hand, single male/father families (109 | 4.6%) represent the smallest median family size with 2.69 persons per family.
| Family Type | # Families | Family Size |
| Married-Couple | 1,820 (77.6%) | 2.86 |
| Single Male/Father | 109 (4.6%) | 2.69 |
| Single Female/Mother | 417 (17.8%) | 3.84 |
| Total Families | 2,346 (100.0%) | 3.03 |
Median Household Size in Oregon County
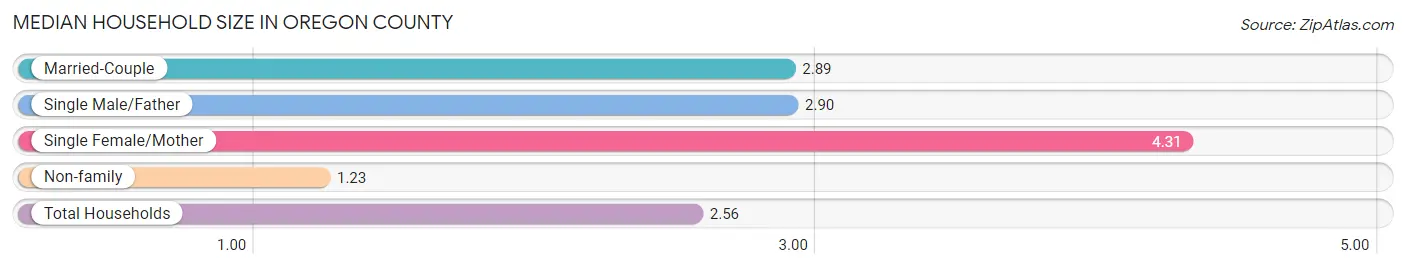
The median household size in Oregon County is 2.56 persons per household, with single female/mother households (417 | 12.3%) accounting for the largest median household size of 4.31 persons per household. non-family households (1,037 | 30.6%) represent the smallest median household size with 1.23 persons per household.
| Household Type | # Households | Household Size |
| Married-Couple | 1,820 (53.8%) | 2.89 |
| Single Male/Father | 109 (3.2%) | 2.90 |
| Single Female/Mother | 417 (12.3%) | 4.31 |
| Non-family | 1,037 (30.6%) | 1.23 |
| Total Households | 3,383 (100.0%) | 2.56 |
Household Size by Marriage Status in Oregon County
Out of a total of 3,383 households in Oregon County, 2,346 (69.4%) are family households, while 1,037 (30.6%) are nonfamily households. The most numerous type of family households are 2-person households, comprising 1,213, and the most common type of nonfamily households are 1-person households, comprising 877.
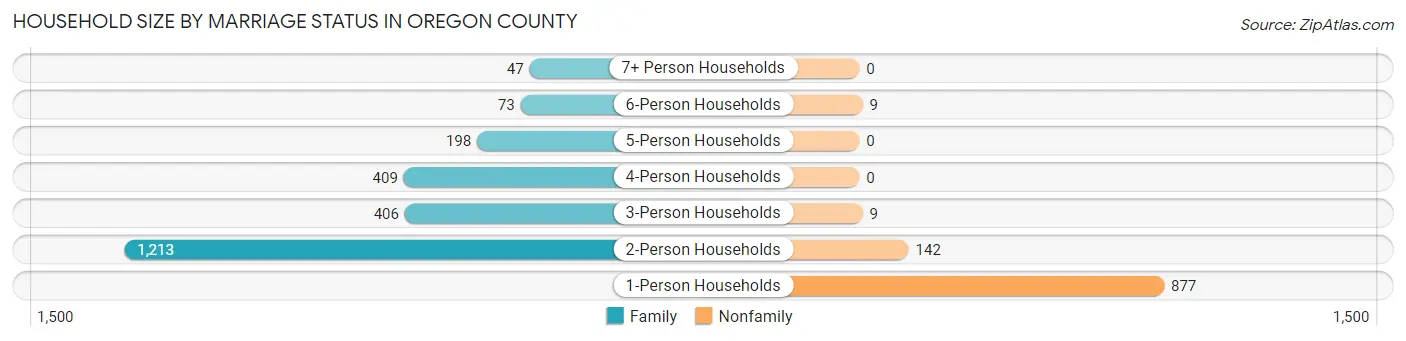
| Household Size | Family Households | Nonfamily Households |
| 1-Person Households | - | 877 (25.9%) |
| 2-Person Households | 1,213 (35.9%) | 142 (4.2%) |
| 3-Person Households | 406 (12.0%) | 9 (0.3%) |
| 4-Person Households | 409 (12.1%) | 0 (0.0%) |
| 5-Person Households | 198 (5.9%) | 0 (0.0%) |
| 6-Person Households | 73 (2.2%) | 9 (0.3%) |
| 7+ Person Households | 47 (1.4%) | 0 (0.0%) |
| Total | 2,346 (69.4%) | 1,037 (30.6%) |
Female Fertility in Oregon County
Fertility by Age in Oregon County
Average fertility rate in Oregon County is 56.0 births per 1,000 women. Women in the age bracket of 20 to 34 years have the highest fertility rate with 114.0 births per 1,000 women. Women in the age bracket of 20 to 34 years acount for 75.8% of all women with births.
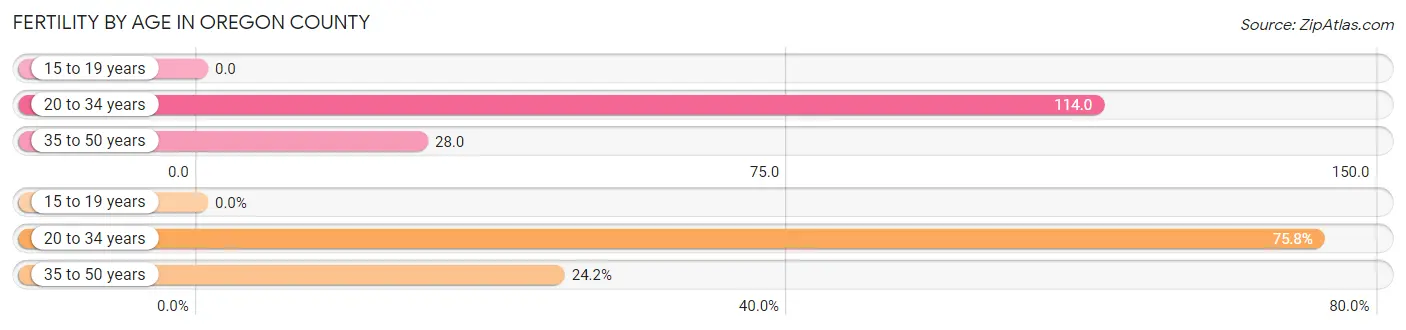
| Age Bracket | Women with Births | Births / 1,000 Women |
| 15 to 19 years | 0 (0.0%) | 0.0 |
| 20 to 34 years | 72 (75.8%) | 114.0 |
| 35 to 50 years | 23 (24.2%) | 28.0 |
| Total | 95 (100.0%) | 56.0 |
Fertility by Age by Marriage Status in Oregon County
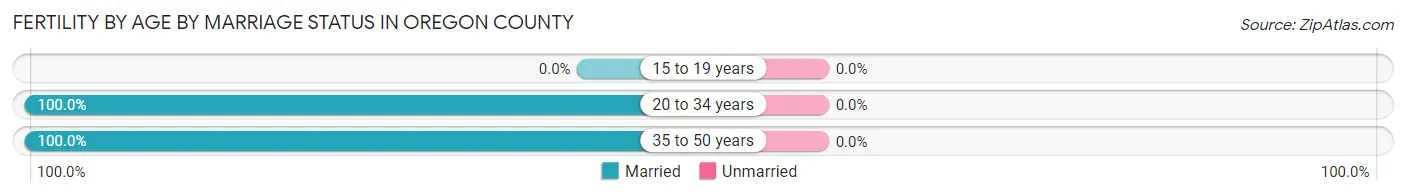
| Age Bracket | Married | Unmarried |
| 15 to 19 years | 0 (0.0%) | 0 (0.0%) |
| 20 to 34 years | 72 (100.0%) | 0 (0.0%) |
| 35 to 50 years | 23 (100.0%) | 0 (0.0%) |
| Total | 95 (100.0%) | 0 (0.0%) |
Fertility by Education in Oregon County
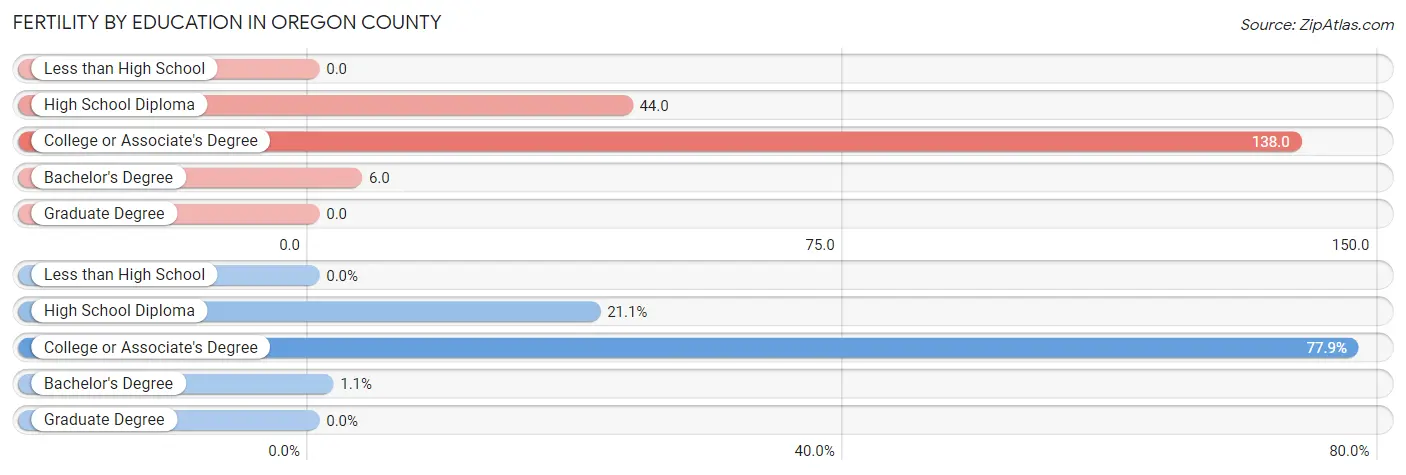
| Educational Attainment | Women with Births | Births / 1,000 Women |
| Less than High School | 0 (0.0%) | 0.0 |
| High School Diploma | 20 (21.0%) | 44.0 |
| College or Associate's Degree | 74 (77.9%) | 138.0 |
| Bachelor's Degree | 1 (1.1%) | 6.0 |
| Graduate Degree | 0 (0.0%) | 0.0 |
| Total | 95 (100.0%) | 56.0 |
Fertility by Education by Marriage Status in Oregon County
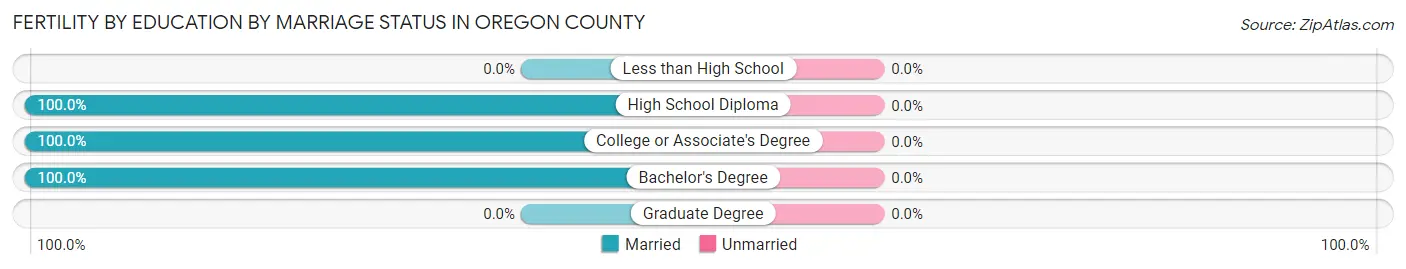
| Educational Attainment | Married | Unmarried |
| Less than High School | 0 (0.0%) | 0 (0.0%) |
| High School Diploma | 20 (100.0%) | 0 (0.0%) |
| College or Associate's Degree | 74 (100.0%) | 0 (0.0%) |
| Bachelor's Degree | 1 (100.0%) | 0 (0.0%) |
| Graduate Degree | 0 (0.0%) | 0 (0.0%) |
| Total | 95 (100.0%) | 0 (0.0%) |
Employment Characteristics in Oregon County
Employment by Class of Employer in Oregon County
Among the 3,205 employed individuals in Oregon County, private company employees (1,976 | 61.7%), self-employed (not incorporated) (406 | 12.7%), and not-for-profit organizations (212 | 6.6%) make up the most common classes of employment.
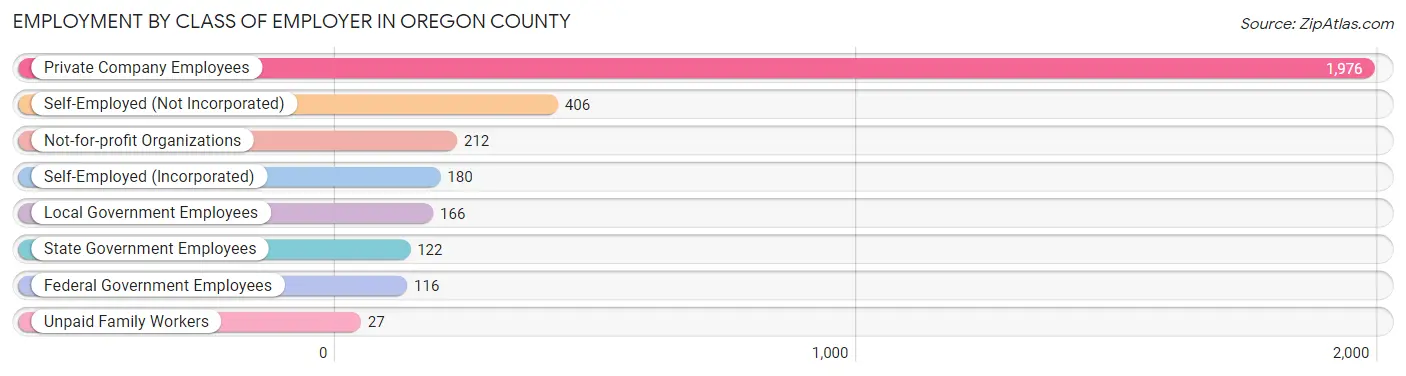
| Employer Class | # Employees | % Employees |
| Private Company Employees | 1,976 | 61.7% |
| Self-Employed (Incorporated) | 180 | 5.6% |
| Self-Employed (Not Incorporated) | 406 | 12.7% |
| Not-for-profit Organizations | 212 | 6.6% |
| Local Government Employees | 166 | 5.2% |
| State Government Employees | 122 | 3.8% |
| Federal Government Employees | 116 | 3.6% |
| Unpaid Family Workers | 27 | 0.8% |
| Total | 3,205 | 100.0% |
Employment Status by Age in Oregon County
According to the labor force statistics for Oregon County, out of the total population over 16 years of age (6,970), 48.6% or 3,387 individuals are in the labor force, with 4.5% or 152 of them unemployed. The age group with the highest labor force participation rate is 25 to 29 years, with 89.9% or 391 individuals in the labor force. Within the labor force, the 20 to 24 years age range has the highest percentage of unemployed individuals, with 22.4% or 84 of them being unemployed.
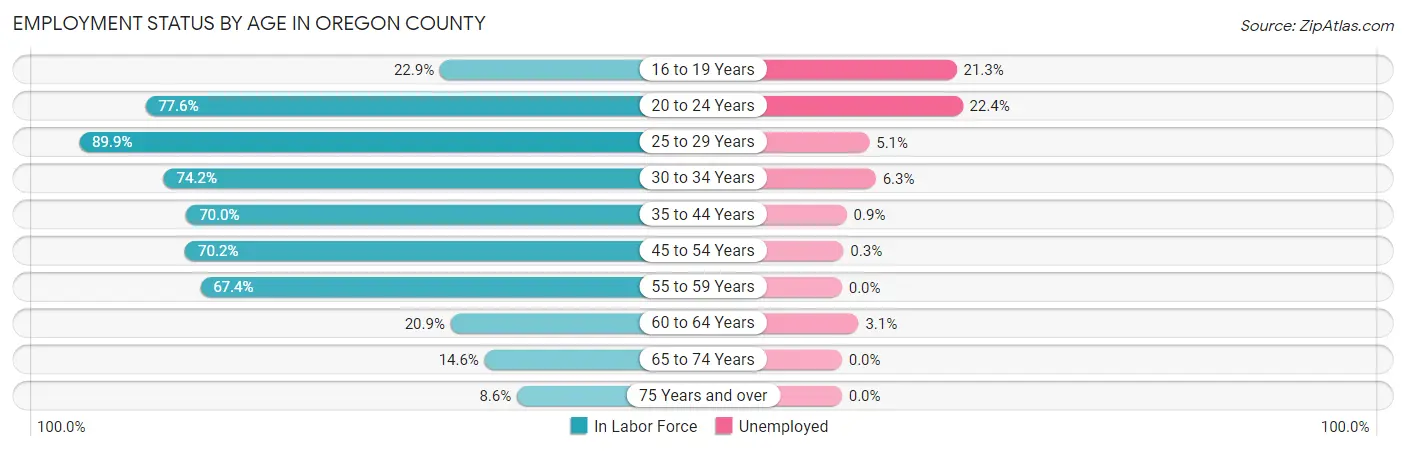
| Age Bracket | In Labor Force | Unemployed |
| 16 to 19 Years | 75 (22.9%) | 16 (21.3%) |
| 20 to 24 Years | 375 (77.6%) | 84 (22.4%) |
| 25 to 29 Years | 391 (89.9%) | 20 (5.1%) |
| 30 to 34 Years | 320 (74.2%) | 20 (6.3%) |
| 35 to 44 Years | 645 (70.0%) | 6 (0.9%) |
| 45 to 54 Years | 708 (70.2%) | 2 (0.3%) |
| 55 to 59 Years | 502 (67.4%) | 0 (0.0%) |
| 60 to 64 Years | 131 (20.9%) | 4 (3.1%) |
| 65 to 74 Years | 167 (14.6%) | 0 (0.0%) |
| 75 Years and over | 73 (8.6%) | 0 (0.0%) |
| Total | 3,387 (48.6%) | 152 (4.5%) |
Employment Status by Educational Attainment in Oregon County
According to labor force statistics for Oregon County, 64.7% of individuals (2,696) out of the total population between 25 and 64 years of age (4,167) are in the labor force, with 1.9% or 51 of them being unemployed. The group with the highest labor force participation rate are those with the educational attainment of bachelor's degree or higher, with 84.2% or 540 individuals in the labor force. Within the labor force, individuals with less than high school education have the highest percentage of unemployment, with 10.1% or 26 of them being unemployed.
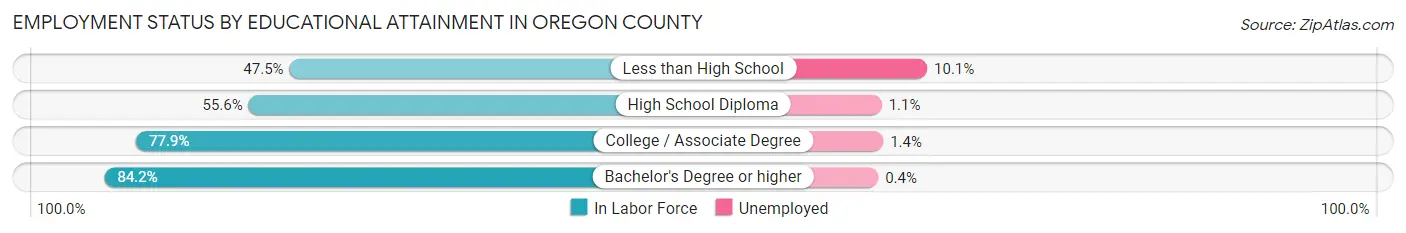
| Educational Attainment | In Labor Force | Unemployed |
| Less than High School | 257 (47.5%) | 55 (10.1%) |
| High School Diploma | 1,060 (55.6%) | 21 (1.1%) |
| College / Associate Degree | 841 (77.9%) | 15 (1.4%) |
| Bachelor's Degree or higher | 540 (84.2%) | 3 (0.4%) |
| Total | 2,696 (64.7%) | 79 (1.9%) |
Employment Occupations by Sex in Oregon County
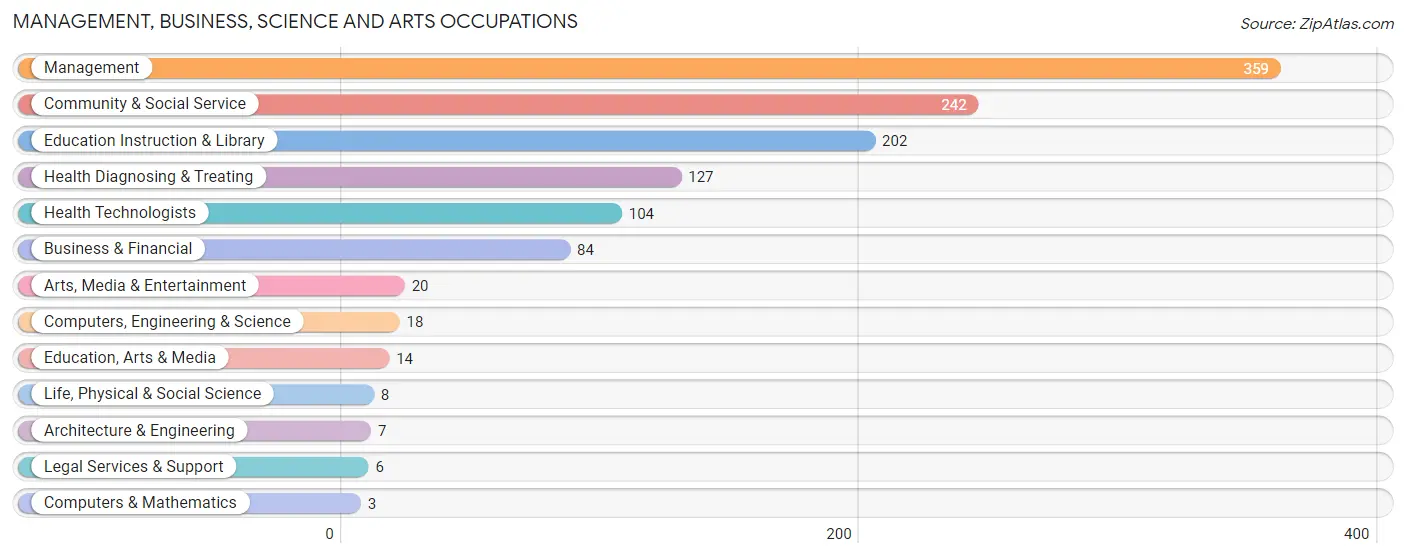
Management, Business, Science and Arts Occupations
The most common Management, Business, Science and Arts occupations in Oregon County are Management (359 | 11.1%), Community & Social Service (242 | 7.5%), Education Instruction & Library (202 | 6.2%), Health Diagnosing & Treating (127 | 3.9%), and Health Technologists (104 | 3.2%).
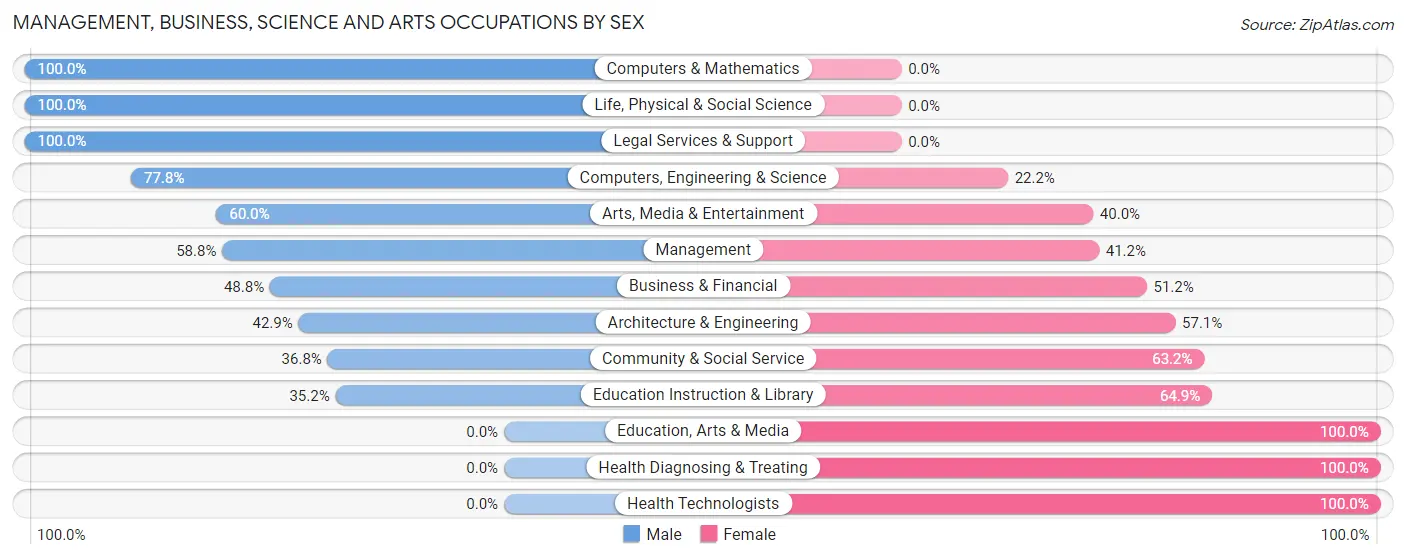
Management, Business, Science and Arts Occupations by Sex
Within the Management, Business, Science and Arts occupations in Oregon County, the most male-oriented occupations are Computers & Mathematics (100.0%), Life, Physical & Social Science (100.0%), and Legal Services & Support (100.0%), while the most female-oriented occupations are Education, Arts & Media (100.0%), Health Diagnosing & Treating (100.0%), and Health Technologists (100.0%).
| Occupation | Male | Female |
| Management | 211 (58.8%) | 148 (41.2%) |
| Business & Financial | 41 (48.8%) | 43 (51.2%) |
| Computers, Engineering & Science | 14 (77.8%) | 4 (22.2%) |
| Computers & Mathematics | 3 (100.0%) | 0 (0.0%) |
| Architecture & Engineering | 3 (42.9%) | 4 (57.1%) |
| Life, Physical & Social Science | 8 (100.0%) | 0 (0.0%) |
| Community & Social Service | 89 (36.8%) | 153 (63.2%) |
| Education, Arts & Media | 0 (0.0%) | 14 (100.0%) |
| Legal Services & Support | 6 (100.0%) | 0 (0.0%) |
| Education Instruction & Library | 71 (35.1%) | 131 (64.8%) |
| Arts, Media & Entertainment | 12 (60.0%) | 8 (40.0%) |
| Health Diagnosing & Treating | 0 (0.0%) | 127 (100.0%) |
| Health Technologists | 0 (0.0%) | 104 (100.0%) |
| Total (Category) | 355 (42.8%) | 475 (57.2%) |
| Total (Overall) | 1,743 (53.9%) | 1,492 (46.1%) |
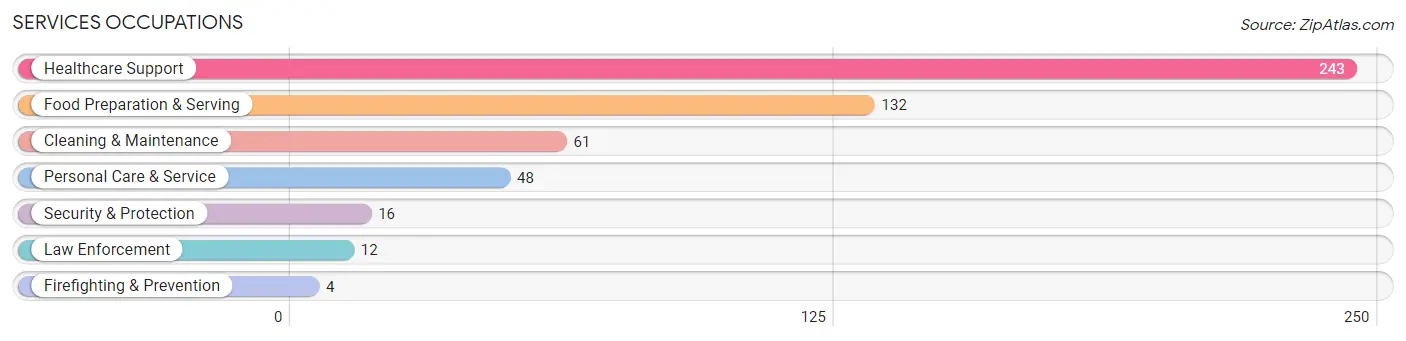
Services Occupations
The most common Services occupations in Oregon County are Healthcare Support (243 | 7.5%), Food Preparation & Serving (132 | 4.1%), Cleaning & Maintenance (61 | 1.9%), Personal Care & Service (48 | 1.5%), and Security & Protection (16 | 0.5%).
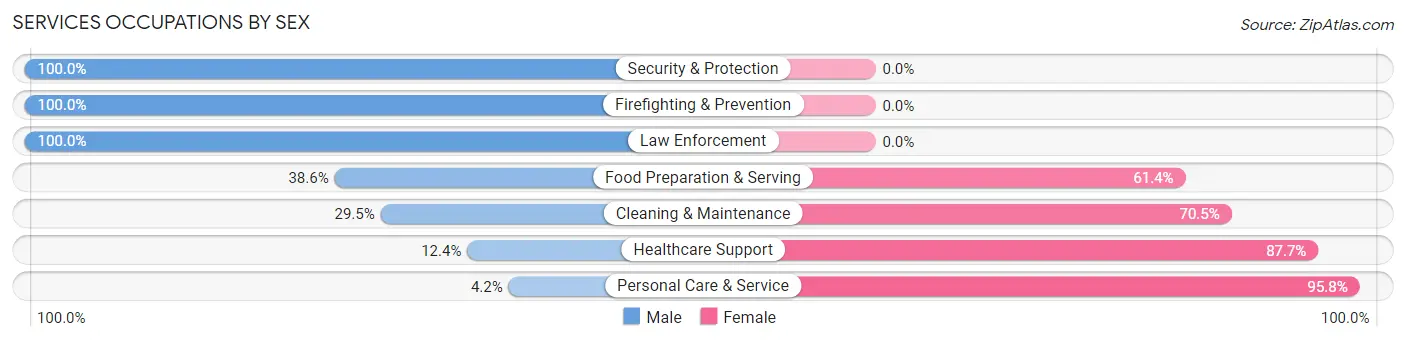
Services Occupations by Sex
Within the Services occupations in Oregon County, the most male-oriented occupations are Security & Protection (100.0%), Firefighting & Prevention (100.0%), and Law Enforcement (100.0%), while the most female-oriented occupations are Personal Care & Service (95.8%), Healthcare Support (87.6%), and Cleaning & Maintenance (70.5%).
| Occupation | Male | Female |
| Healthcare Support | 30 (12.3%) | 213 (87.6%) |
| Security & Protection | 16 (100.0%) | 0 (0.0%) |
| Firefighting & Prevention | 4 (100.0%) | 0 (0.0%) |
| Law Enforcement | 12 (100.0%) | 0 (0.0%) |
| Food Preparation & Serving | 51 (38.6%) | 81 (61.4%) |
| Cleaning & Maintenance | 18 (29.5%) | 43 (70.5%) |
| Personal Care & Service | 2 (4.2%) | 46 (95.8%) |
| Total (Category) | 117 (23.4%) | 383 (76.6%) |
| Total (Overall) | 1,743 (53.9%) | 1,492 (46.1%) |
Sales and Office Occupations
The most common Sales and Office occupations in Oregon County are Sales & Related (415 | 12.8%), and Office & Administration (361 | 11.2%).
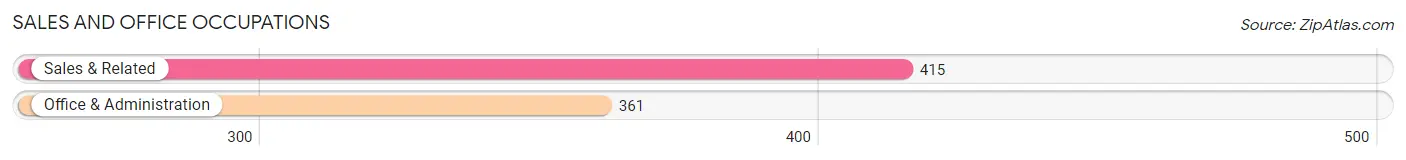
Sales and Office Occupations by Sex
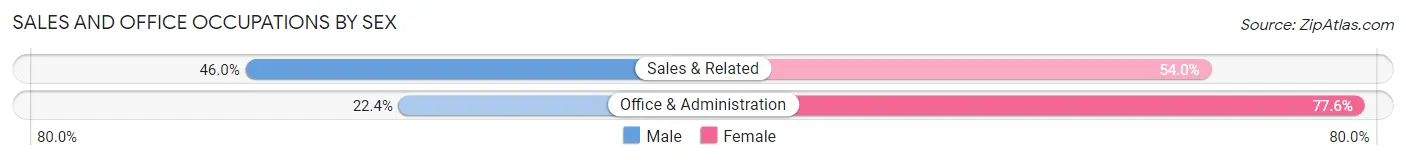
| Occupation | Male | Female |
| Sales & Related | 191 (46.0%) | 224 (54.0%) |
| Office & Administration | 81 (22.4%) | 280 (77.6%) |
| Total (Category) | 272 (35.0%) | 504 (64.9%) |
| Total (Overall) | 1,743 (53.9%) | 1,492 (46.1%) |
Natural Resources, Construction and Maintenance Occupations
The most common Natural Resources, Construction and Maintenance occupations in Oregon County are Construction & Extraction (125 | 3.9%), Installation, Maintenance & Repair (102 | 3.2%), and Farming, Fishing & Forestry (101 | 3.1%).
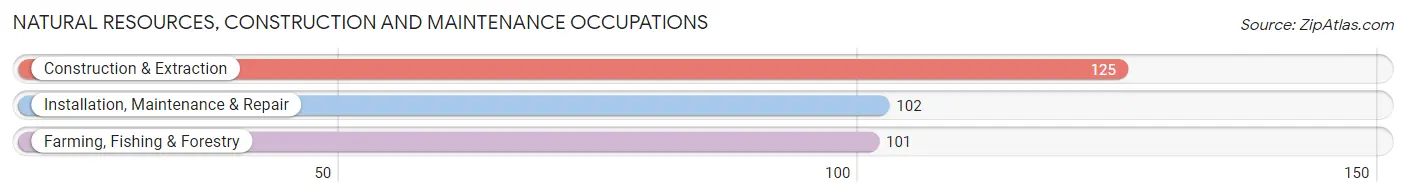
Natural Resources, Construction and Maintenance Occupations by Sex
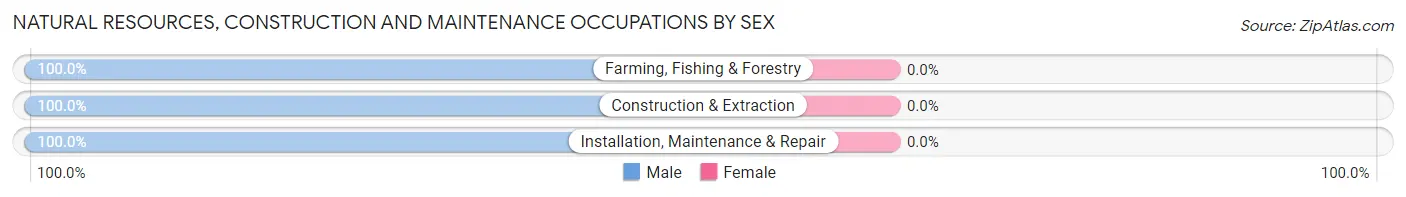
| Occupation | Male | Female |
| Farming, Fishing & Forestry | 101 (100.0%) | 0 (0.0%) |
| Construction & Extraction | 125 (100.0%) | 0 (0.0%) |
| Installation, Maintenance & Repair | 102 (100.0%) | 0 (0.0%) |
| Total (Category) | 328 (100.0%) | 0 (0.0%) |
| Total (Overall) | 1,743 (53.9%) | 1,492 (46.1%) |
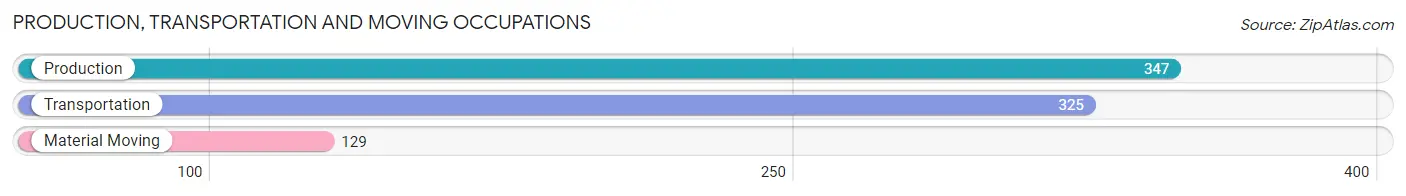
Production, Transportation and Moving Occupations
The most common Production, Transportation and Moving occupations in Oregon County are Production (347 | 10.7%), Transportation (325 | 10.1%), and Material Moving (129 | 4.0%).
Production, Transportation and Moving Occupations by Sex
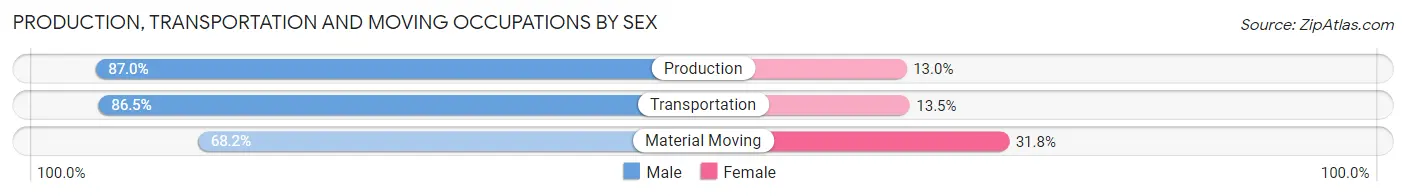
| Occupation | Male | Female |
| Production | 302 (87.0%) | 45 (13.0%) |
| Transportation | 281 (86.5%) | 44 (13.5%) |
| Material Moving | 88 (68.2%) | 41 (31.8%) |
| Total (Category) | 671 (83.8%) | 130 (16.2%) |
| Total (Overall) | 1,743 (53.9%) | 1,492 (46.1%) |
Employment Industries by Sex in Oregon County
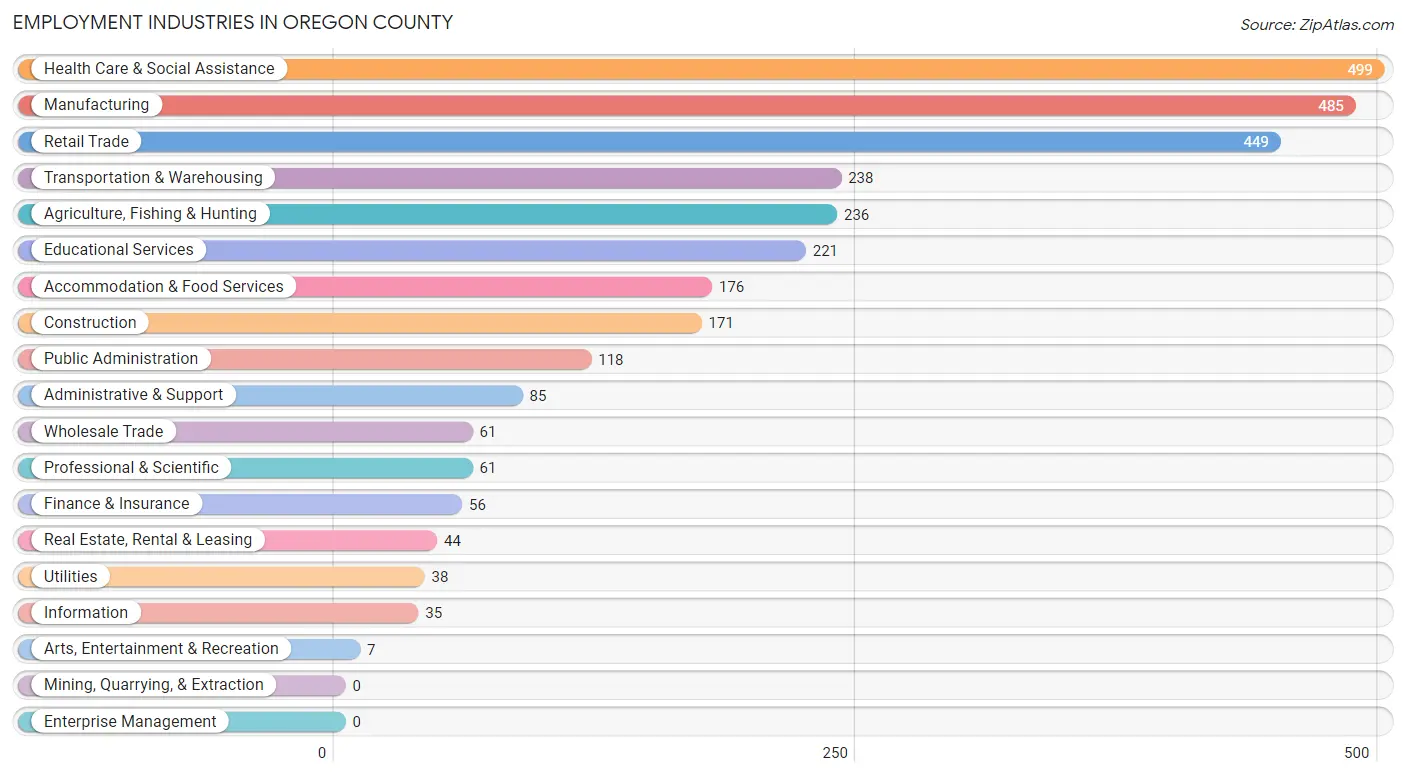
Employment Industries in Oregon County
The major employment industries in Oregon County include Health Care & Social Assistance (499 | 15.4%), Manufacturing (485 | 15.0%), Retail Trade (449 | 13.9%), Transportation & Warehousing (238 | 7.4%), and Agriculture, Fishing & Hunting (236 | 7.3%).
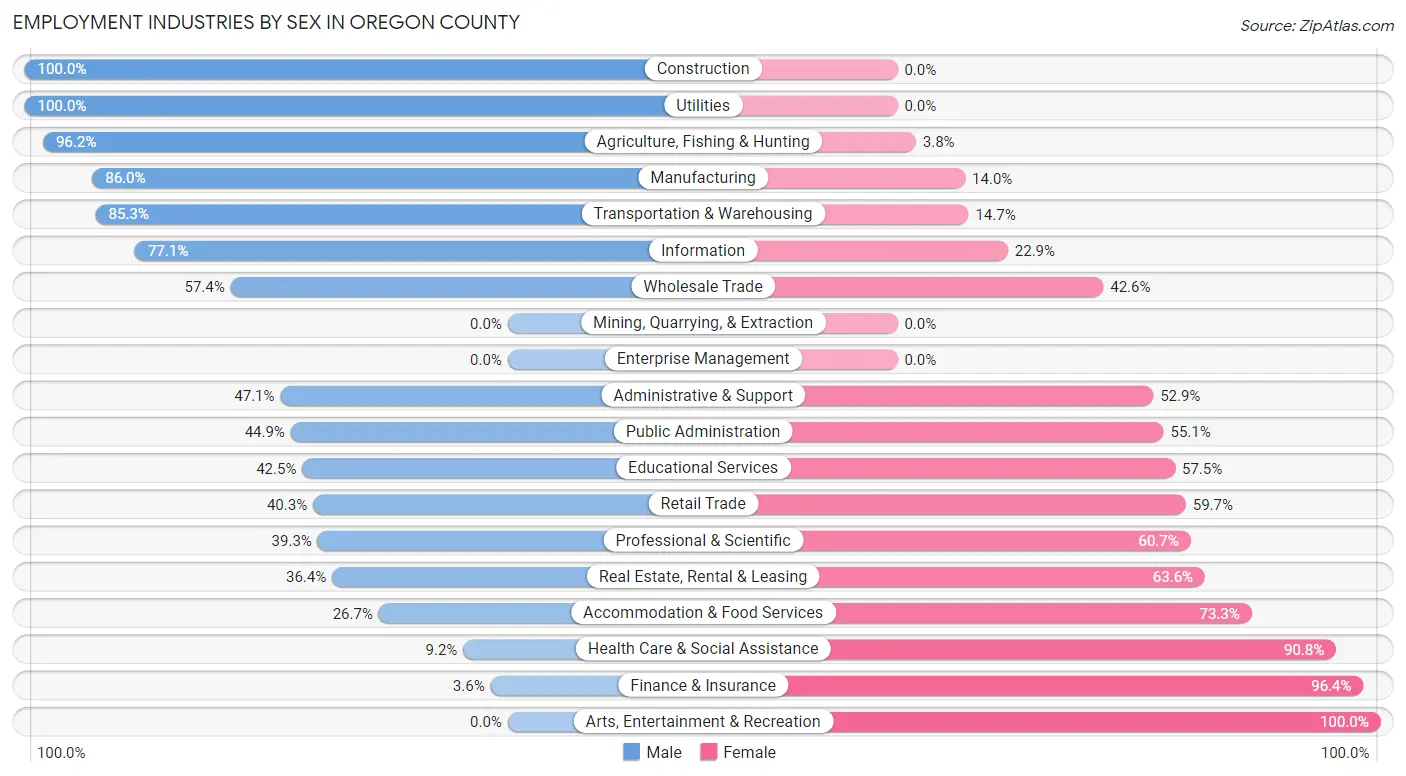
Employment Industries by Sex in Oregon County
The Oregon County industries that see more men than women are Construction (100.0%), Utilities (100.0%), and Agriculture, Fishing & Hunting (96.2%), whereas the industries that tend to have a higher number of women are Arts, Entertainment & Recreation (100.0%), Finance & Insurance (96.4%), and Health Care & Social Assistance (90.8%).
| Industry | Male | Female |
| Agriculture, Fishing & Hunting | 227 (96.2%) | 9 (3.8%) |
| Mining, Quarrying, & Extraction | 0 (0.0%) | 0 (0.0%) |
| Construction | 171 (100.0%) | 0 (0.0%) |
| Manufacturing | 417 (86.0%) | 68 (14.0%) |
| Wholesale Trade | 35 (57.4%) | 26 (42.6%) |
| Retail Trade | 181 (40.3%) | 268 (59.7%) |
| Transportation & Warehousing | 203 (85.3%) | 35 (14.7%) |
| Utilities | 38 (100.0%) | 0 (0.0%) |
| Information | 27 (77.1%) | 8 (22.9%) |
| Finance & Insurance | 2 (3.6%) | 54 (96.4%) |
| Real Estate, Rental & Leasing | 16 (36.4%) | 28 (63.6%) |
| Professional & Scientific | 24 (39.3%) | 37 (60.7%) |
| Enterprise Management | 0 (0.0%) | 0 (0.0%) |
| Administrative & Support | 40 (47.1%) | 45 (52.9%) |
| Educational Services | 94 (42.5%) | 127 (57.5%) |
| Health Care & Social Assistance | 46 (9.2%) | 453 (90.8%) |
| Arts, Entertainment & Recreation | 0 (0.0%) | 7 (100.0%) |
| Accommodation & Food Services | 47 (26.7%) | 129 (73.3%) |
| Public Administration | 53 (44.9%) | 65 (55.1%) |
| Total | 1,743 (53.9%) | 1,492 (46.1%) |
Education in Oregon County
School Enrollment in Oregon County
The most common levels of schooling among the 1,731 students in Oregon County are elementary school (502 | 29.0%), middle school (423 | 24.4%), and high school (378 | 21.8%).
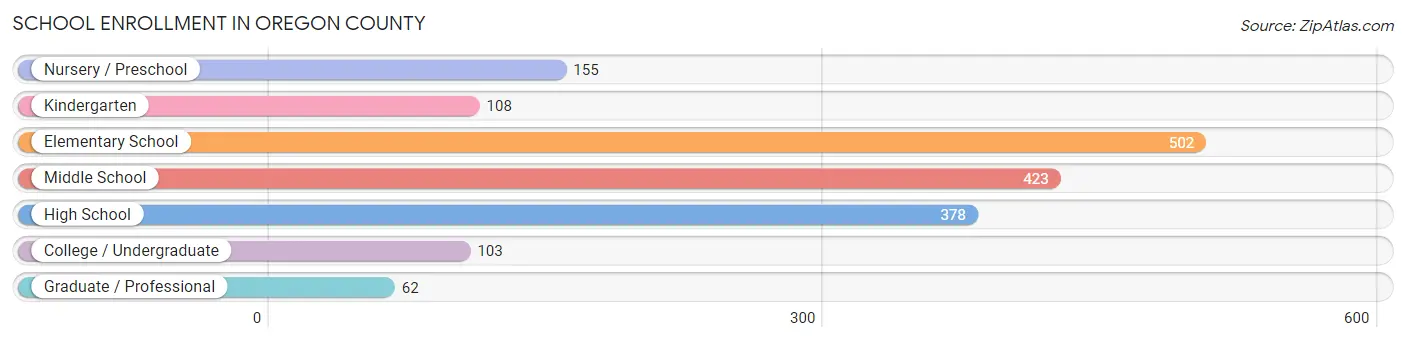
| School Level | # Students | % Students |
| Nursery / Preschool | 155 | 8.9% |
| Kindergarten | 108 | 6.2% |
| Elementary School | 502 | 29.0% |
| Middle School | 423 | 24.4% |
| High School | 378 | 21.8% |
| College / Undergraduate | 103 | 5.9% |
| Graduate / Professional | 62 | 3.6% |
| Total | 1,731 | 100.0% |
School Enrollment by Age by Funding Source in Oregon County
Out of a total of 1,731 students who are enrolled in schools in Oregon County, 57 (3.3%) attend a private institution, while the remaining 1,674 (96.7%) are enrolled in public schools. The age group of 35 years and over has the highest likelihood of being enrolled in private schools, with 5 (6.9% in the age bracket) enrolled. Conversely, the age group of 3 to 4 year olds has the lowest likelihood of being enrolled in a private school, with 124 (100.0% in the age bracket) attending a public institution.
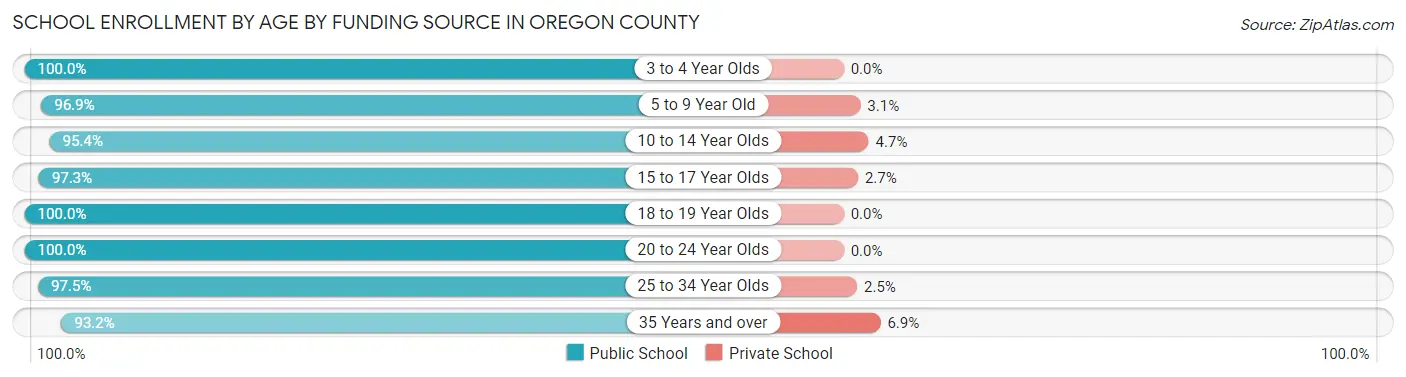
| Age Bracket | Public School | Private School |
| 3 to 4 Year Olds | 124 (100.0%) | 0 (0.0%) |
| 5 to 9 Year Old | 558 (96.9%) | 18 (3.1%) |
| 10 to 14 Year Olds | 492 (95.4%) | 24 (4.6%) |
| 15 to 17 Year Olds | 329 (97.3%) | 9 (2.7%) |
| 18 to 19 Year Olds | 20 (100.0%) | 0 (0.0%) |
| 20 to 24 Year Olds | 44 (100.0%) | 0 (0.0%) |
| 25 to 34 Year Olds | 39 (97.5%) | 1 (2.5%) |
| 35 Years and over | 68 (93.1%) | 5 (6.9%) |
| Total | 1,674 (96.7%) | 57 (3.3%) |
Educational Attainment by Field of Study in Oregon County
Education (308 | 30.4%), arts & humanities (115 | 11.4%), business (114 | 11.3%), science & technology (97 | 9.6%), and psychology (96 | 9.5%) are the most common fields of study among 1,013 individuals in Oregon County who have obtained a bachelor's degree or higher.
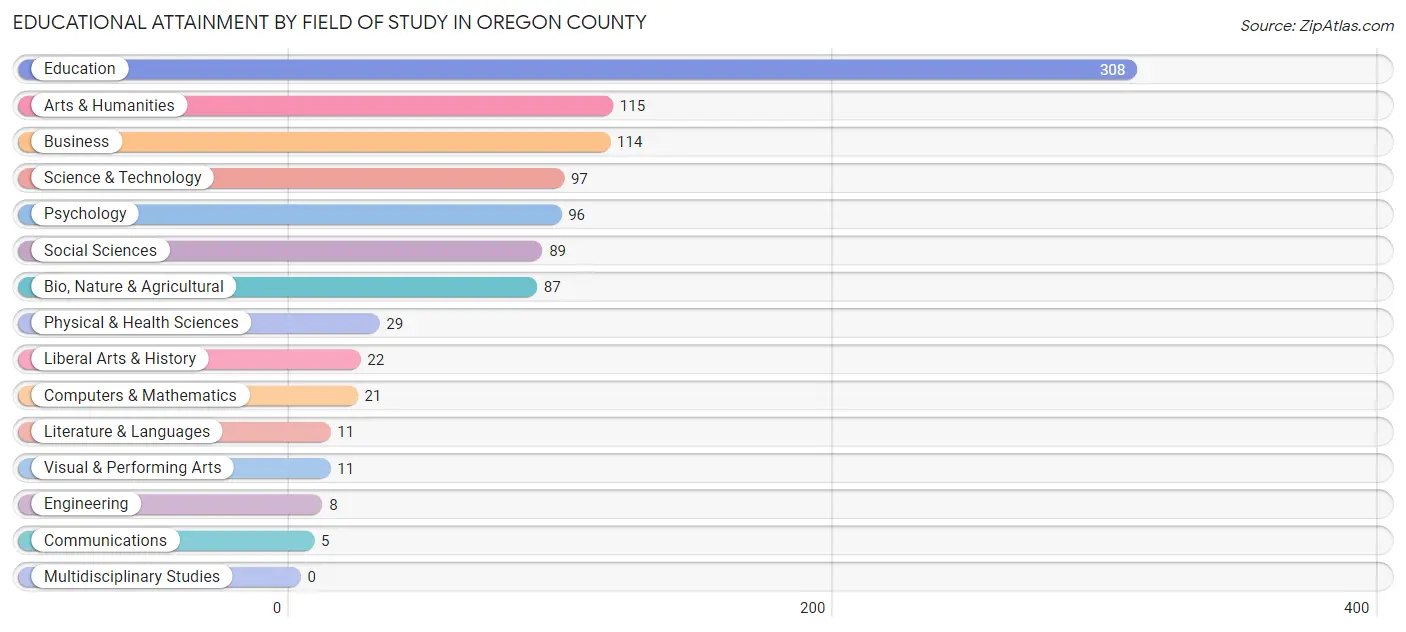
| Field of Study | # Graduates | % Graduates |
| Computers & Mathematics | 21 | 2.1% |
| Bio, Nature & Agricultural | 87 | 8.6% |
| Physical & Health Sciences | 29 | 2.9% |
| Psychology | 96 | 9.5% |
| Social Sciences | 89 | 8.8% |
| Engineering | 8 | 0.8% |
| Multidisciplinary Studies | 0 | 0.0% |
| Science & Technology | 97 | 9.6% |
| Business | 114 | 11.3% |
| Education | 308 | 30.4% |
| Literature & Languages | 11 | 1.1% |
| Liberal Arts & History | 22 | 2.2% |
| Visual & Performing Arts | 11 | 1.1% |
| Communications | 5 | 0.5% |
| Arts & Humanities | 115 | 11.4% |
| Total | 1,013 | 100.0% |
Transportation & Commute in Oregon County
Vehicle Availability by Sex in Oregon County
The most prevalent vehicle ownership categories in Oregon County are males with 3 vehicles (508, accounting for 29.7%) and females with 3 vehicles (343, making up 34.1%).
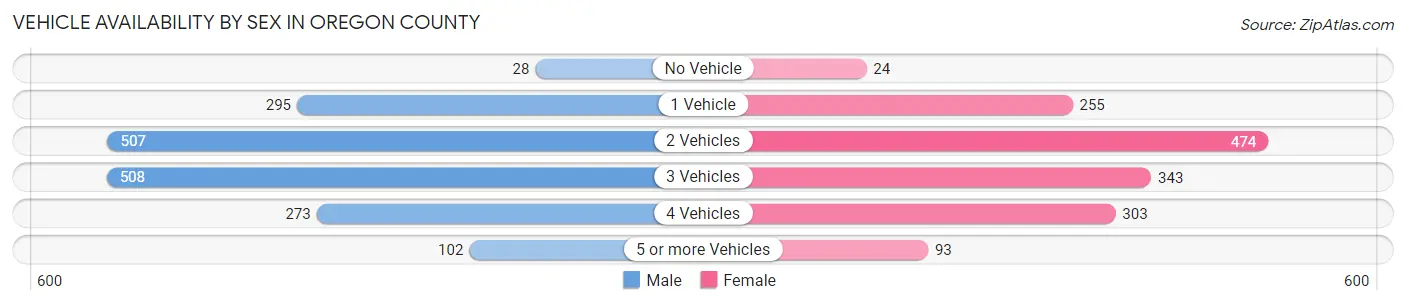
| Vehicles Available | Male | Female |
| No Vehicle | 28 (1.6%) | 24 (1.6%) |
| 1 Vehicle | 295 (17.2%) | 255 (17.1%) |
| 2 Vehicles | 507 (29.6%) | 474 (31.8%) |
| 3 Vehicles | 508 (29.7%) | 343 (23.0%) |
| 4 Vehicles | 273 (15.9%) | 303 (20.3%) |
| 5 or more Vehicles | 102 (5.9%) | 93 (6.2%) |
| Total | 1,713 (100.0%) | 1,492 (100.0%) |
Commute Time in Oregon County
The most frequently occuring commute durations in Oregon County are 5 to 9 minutes (704 commuters, 25.3%), 15 to 19 minutes (430 commuters, 15.4%), and 30 to 34 minutes (334 commuters, 12.0%).
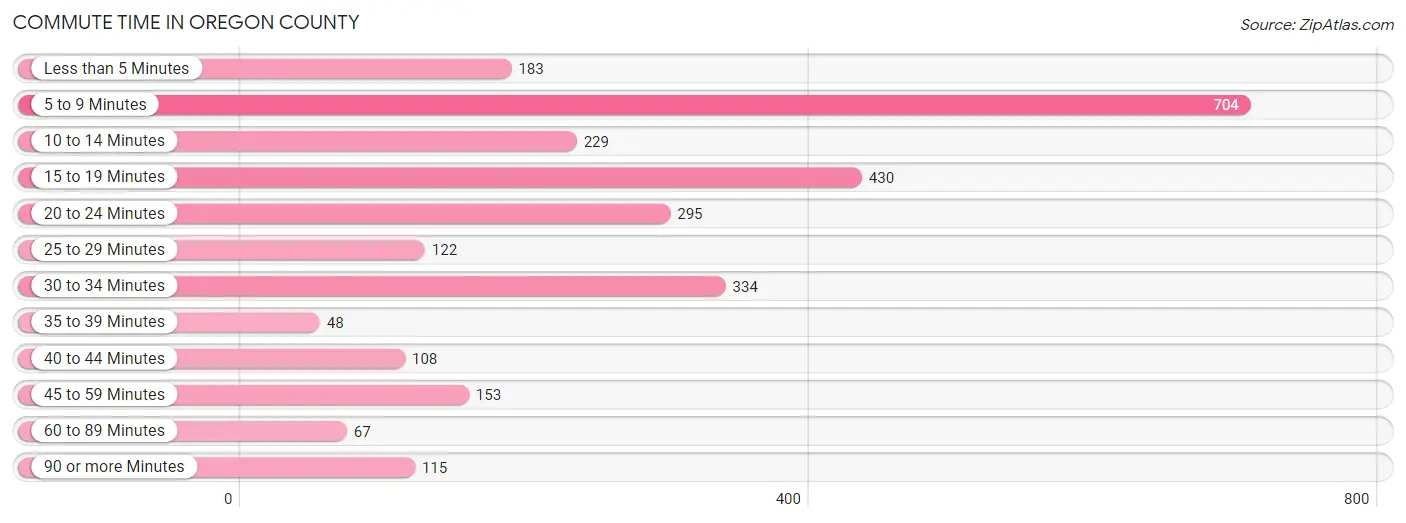
| Commute Time | # Commuters | % Commuters |
| Less than 5 Minutes | 183 | 6.6% |
| 5 to 9 Minutes | 704 | 25.3% |
| 10 to 14 Minutes | 229 | 8.2% |
| 15 to 19 Minutes | 430 | 15.4% |
| 20 to 24 Minutes | 295 | 10.6% |
| 25 to 29 Minutes | 122 | 4.4% |
| 30 to 34 Minutes | 334 | 12.0% |
| 35 to 39 Minutes | 48 | 1.7% |
| 40 to 44 Minutes | 108 | 3.9% |
| 45 to 59 Minutes | 153 | 5.5% |
| 60 to 89 Minutes | 67 | 2.4% |
| 90 or more Minutes | 115 | 4.1% |
Commute Time by Sex in Oregon County
The most common commute times in Oregon County are 5 to 9 minutes (389 commuters, 25.9%) for males and 5 to 9 minutes (315 commuters, 24.5%) for females.
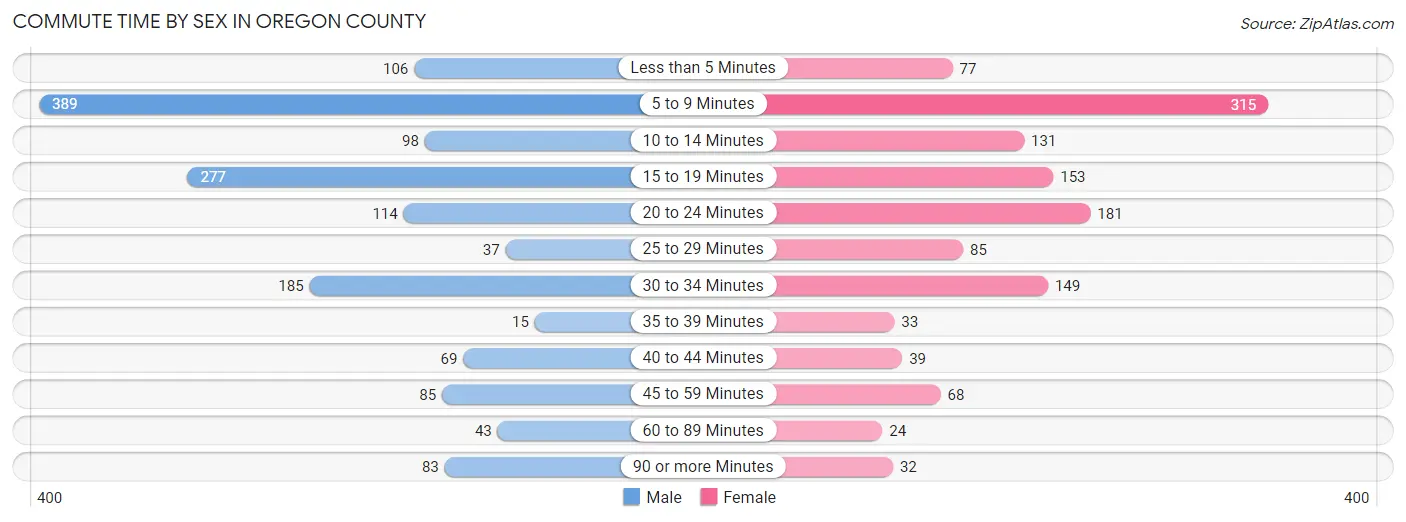
| Commute Time | Male | Female |
| Less than 5 Minutes | 106 (7.1%) | 77 (6.0%) |
| 5 to 9 Minutes | 389 (25.9%) | 315 (24.5%) |
| 10 to 14 Minutes | 98 (6.5%) | 131 (10.2%) |
| 15 to 19 Minutes | 277 (18.4%) | 153 (11.9%) |
| 20 to 24 Minutes | 114 (7.6%) | 181 (14.1%) |
| 25 to 29 Minutes | 37 (2.5%) | 85 (6.6%) |
| 30 to 34 Minutes | 185 (12.3%) | 149 (11.6%) |
| 35 to 39 Minutes | 15 (1.0%) | 33 (2.6%) |
| 40 to 44 Minutes | 69 (4.6%) | 39 (3.0%) |
| 45 to 59 Minutes | 85 (5.7%) | 68 (5.3%) |
| 60 to 89 Minutes | 43 (2.9%) | 24 (1.9%) |
| 90 or more Minutes | 83 (5.5%) | 32 (2.5%) |
Time of Departure to Work by Sex in Oregon County
The most frequent times of departure to work in Oregon County are 7:30 AM to 7:59 AM (267, 17.8%) for males and 7:30 AM to 7:59 AM (230, 17.9%) for females.
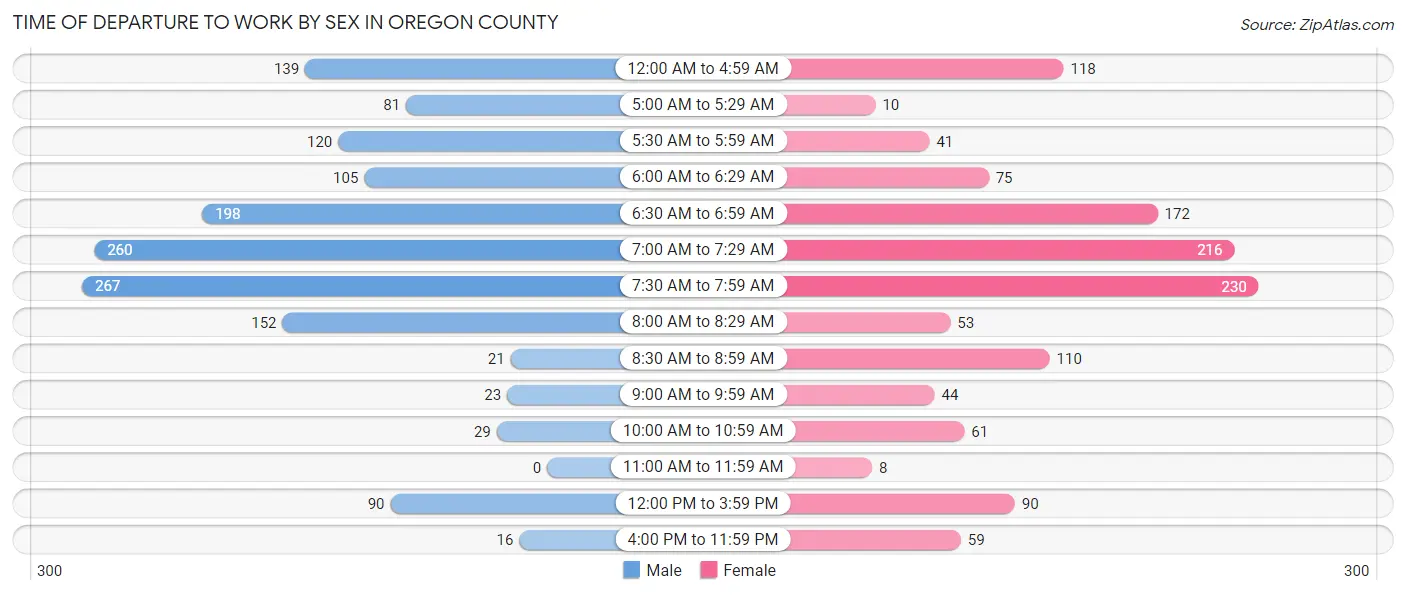
| Time of Departure | Male | Female |
| 12:00 AM to 4:59 AM | 139 (9.3%) | 118 (9.2%) |
| 5:00 AM to 5:29 AM | 81 (5.4%) | 10 (0.8%) |
| 5:30 AM to 5:59 AM | 120 (8.0%) | 41 (3.2%) |
| 6:00 AM to 6:29 AM | 105 (7.0%) | 75 (5.8%) |
| 6:30 AM to 6:59 AM | 198 (13.2%) | 172 (13.4%) |
| 7:00 AM to 7:29 AM | 260 (17.3%) | 216 (16.8%) |
| 7:30 AM to 7:59 AM | 267 (17.8%) | 230 (17.9%) |
| 8:00 AM to 8:29 AM | 152 (10.1%) | 53 (4.1%) |
| 8:30 AM to 8:59 AM | 21 (1.4%) | 110 (8.6%) |
| 9:00 AM to 9:59 AM | 23 (1.5%) | 44 (3.4%) |
| 10:00 AM to 10:59 AM | 29 (1.9%) | 61 (4.7%) |
| 11:00 AM to 11:59 AM | 0 (0.0%) | 8 (0.6%) |
| 12:00 PM to 3:59 PM | 90 (6.0%) | 90 (7.0%) |
| 4:00 PM to 11:59 PM | 16 (1.1%) | 59 (4.6%) |
| Total | 1,501 (100.0%) | 1,287 (100.0%) |
Housing Occupancy in Oregon County
Occupancy by Ownership in Oregon County
Of the total 3,383 dwellings in Oregon County, owner-occupied units account for 2,399 (70.9%), while renter-occupied units make up 984 (29.1%).
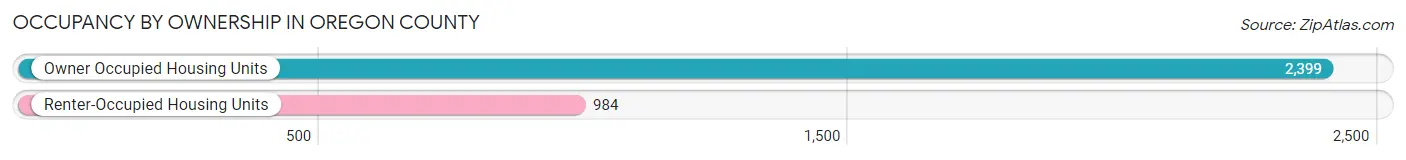
| Occupancy | # Housing Units | % Housing Units |
| Owner Occupied Housing Units | 2,399 | 70.9% |
| Renter-Occupied Housing Units | 984 | 29.1% |
| Total Occupied Housing Units | 3,383 | 100.0% |
Occupancy by Household Size in Oregon County
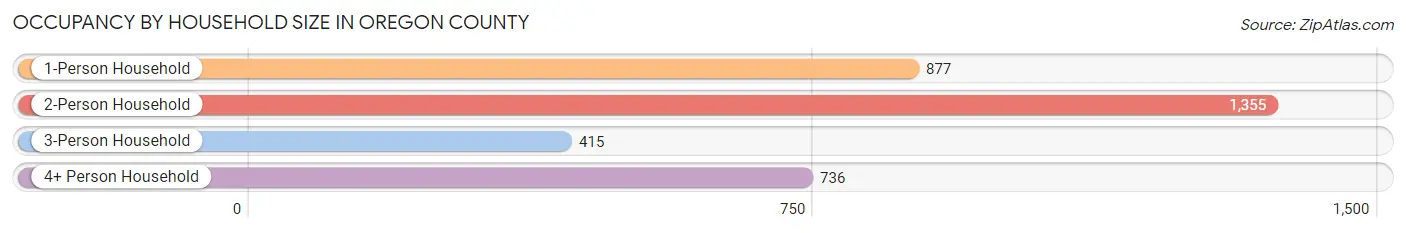
| Household Size | # Housing Units | % Housing Units |
| 1-Person Household | 877 | 25.9% |
| 2-Person Household | 1,355 | 40.1% |
| 3-Person Household | 415 | 12.3% |
| 4+ Person Household | 736 | 21.8% |
| Total Housing Units | 3,383 | 100.0% |
Occupancy by Ownership by Household Size in Oregon County
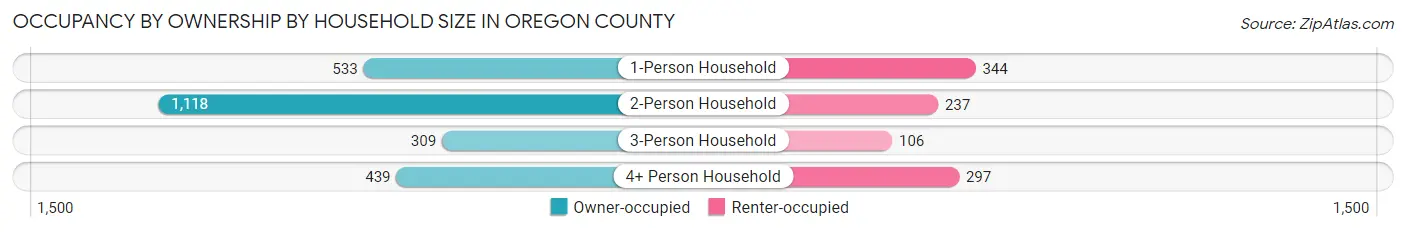
| Household Size | Owner-occupied | Renter-occupied |
| 1-Person Household | 533 (60.8%) | 344 (39.2%) |
| 2-Person Household | 1,118 (82.5%) | 237 (17.5%) |
| 3-Person Household | 309 (74.5%) | 106 (25.5%) |
| 4+ Person Household | 439 (59.7%) | 297 (40.4%) |
| Total Housing Units | 2,399 (70.9%) | 984 (29.1%) |
Occupancy by Educational Attainment in Oregon County
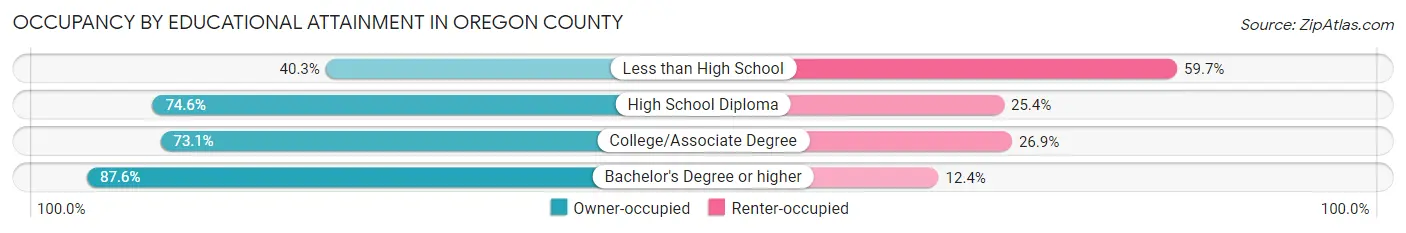
| Household Size | Owner-occupied | Renter-occupied |
| Less than High School | 200 (40.3%) | 296 (59.7%) |
| High School Diploma | 1,077 (74.6%) | 366 (25.4%) |
| College/Associate Degree | 719 (73.1%) | 265 (26.9%) |
| Bachelor's Degree or higher | 403 (87.6%) | 57 (12.4%) |
Occupancy by Age of Householder in Oregon County
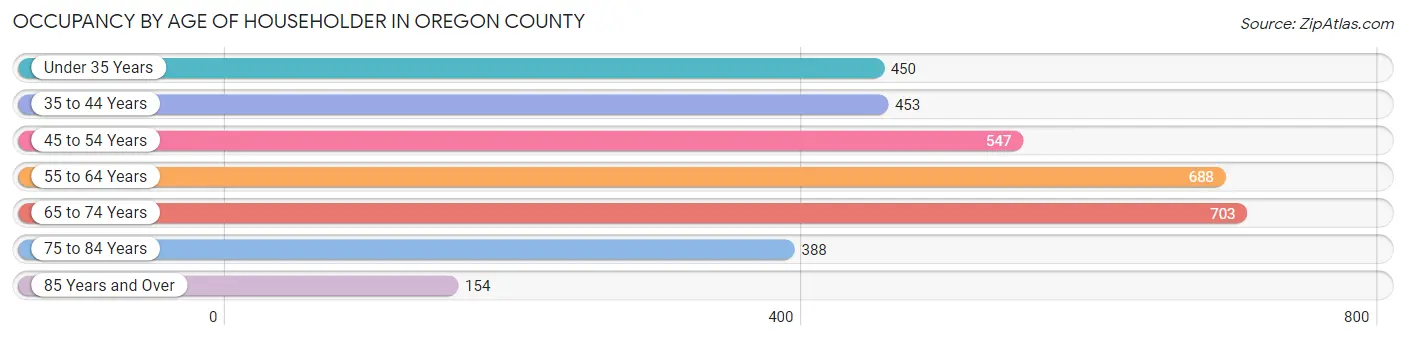
| Age Bracket | # Households | % Households |
| Under 35 Years | 450 | 13.3% |
| 35 to 44 Years | 453 | 13.4% |
| 45 to 54 Years | 547 | 16.2% |
| 55 to 64 Years | 688 | 20.3% |
| 65 to 74 Years | 703 | 20.8% |
| 75 to 84 Years | 388 | 11.5% |
| 85 Years and Over | 154 | 4.5% |
| Total | 3,383 | 100.0% |
Housing Finances in Oregon County
Median Income by Occupancy in Oregon County
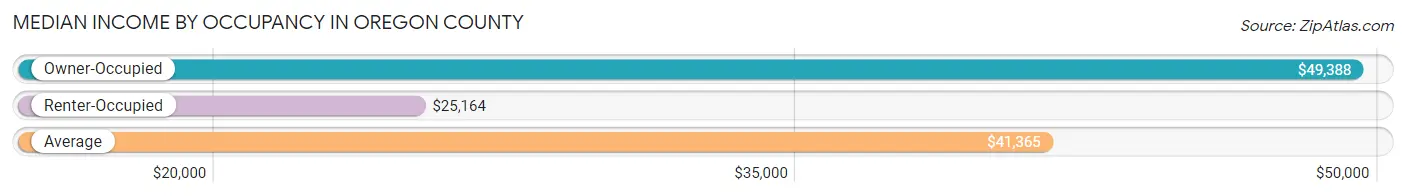
| Occupancy Type | # Households | Median Income |
| Owner-Occupied | 2,399 (70.9%) | $49,388 |
| Renter-Occupied | 984 (29.1%) | $25,164 |
| Average | 3,383 (100.0%) | $41,365 |
Occupancy by Householder Income Bracket in Oregon County
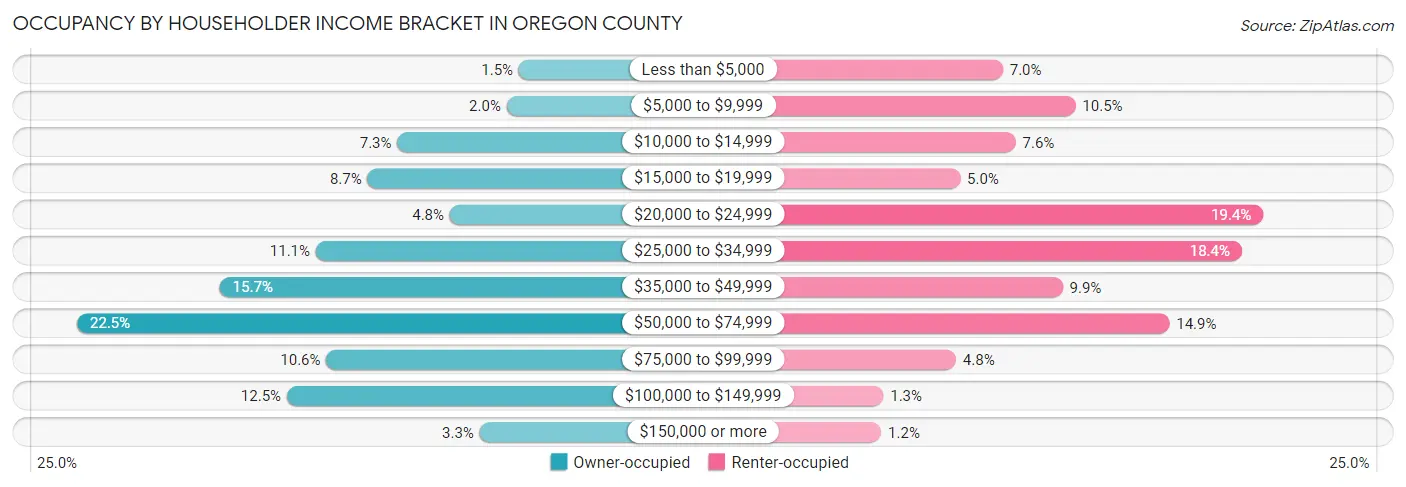
| Income Bracket | Owner-occupied | Renter-occupied |
| Less than $5,000 | 35 (1.5%) | 69 (7.0%) |
| $5,000 to $9,999 | 49 (2.0%) | 103 (10.5%) |
| $10,000 to $14,999 | 174 (7.2%) | 75 (7.6%) |
| $15,000 to $19,999 | 208 (8.7%) | 49 (5.0%) |
| $20,000 to $24,999 | 114 (4.8%) | 191 (19.4%) |
| $25,000 to $34,999 | 267 (11.1%) | 181 (18.4%) |
| $35,000 to $49,999 | 377 (15.7%) | 97 (9.9%) |
| $50,000 to $74,999 | 540 (22.5%) | 147 (14.9%) |
| $75,000 to $99,999 | 255 (10.6%) | 47 (4.8%) |
| $100,000 to $149,999 | 300 (12.5%) | 13 (1.3%) |
| $150,000 or more | 80 (3.3%) | 12 (1.2%) |
| Total | 2,399 (100.0%) | 984 (100.0%) |
Monthly Housing Cost Tiers in Oregon County
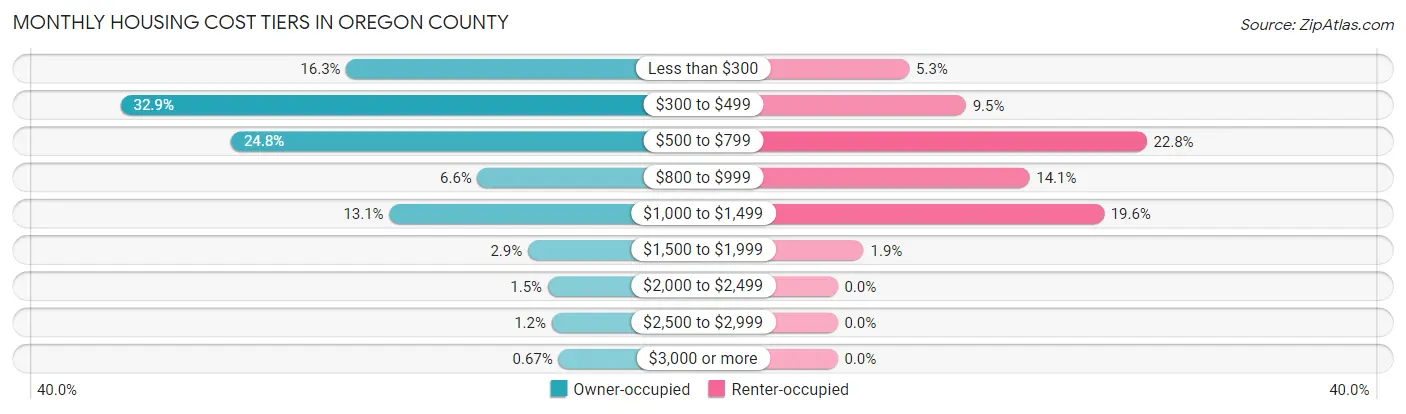
| Monthly Cost | Owner-occupied | Renter-occupied |
| Less than $300 | 391 (16.3%) | 52 (5.3%) |
| $300 to $499 | 790 (32.9%) | 93 (9.5%) |
| $500 to $799 | 595 (24.8%) | 224 (22.8%) |
| $800 to $999 | 159 (6.6%) | 139 (14.1%) |
| $1,000 to $1,499 | 315 (13.1%) | 193 (19.6%) |
| $1,500 to $1,999 | 70 (2.9%) | 19 (1.9%) |
| $2,000 to $2,499 | 35 (1.5%) | 0 (0.0%) |
| $2,500 to $2,999 | 28 (1.2%) | 0 (0.0%) |
| $3,000 or more | 16 (0.7%) | 0 (0.0%) |
| Total | 2,399 (100.0%) | 984 (100.0%) |
Physical Housing Characteristics in Oregon County
Housing Structures in Oregon County
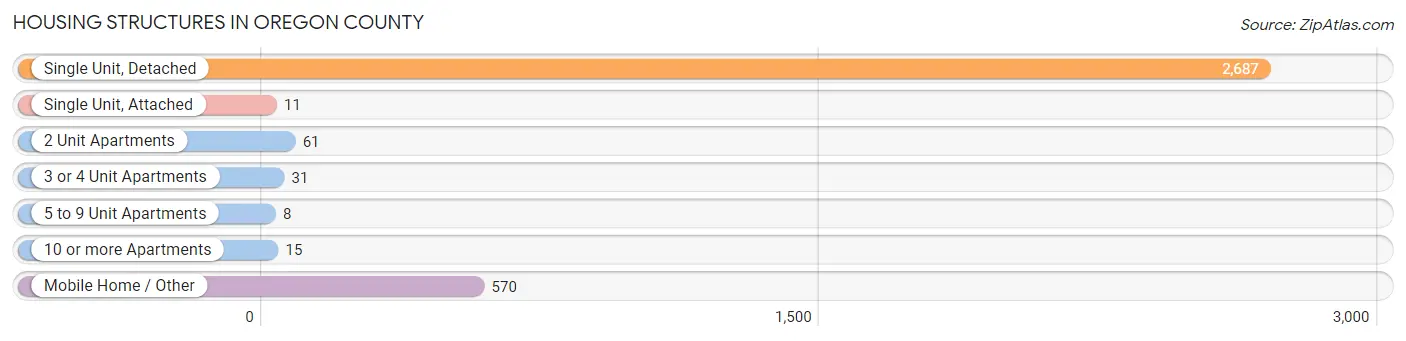
| Structure Type | # Housing Units | % Housing Units |
| Single Unit, Detached | 2,687 | 79.4% |
| Single Unit, Attached | 11 | 0.3% |
| 2 Unit Apartments | 61 | 1.8% |
| 3 or 4 Unit Apartments | 31 | 0.9% |
| 5 to 9 Unit Apartments | 8 | 0.2% |
| 10 or more Apartments | 15 | 0.4% |
| Mobile Home / Other | 570 | 16.9% |
| Total | 3,383 | 100.0% |
Housing Structures by Occupancy in Oregon County
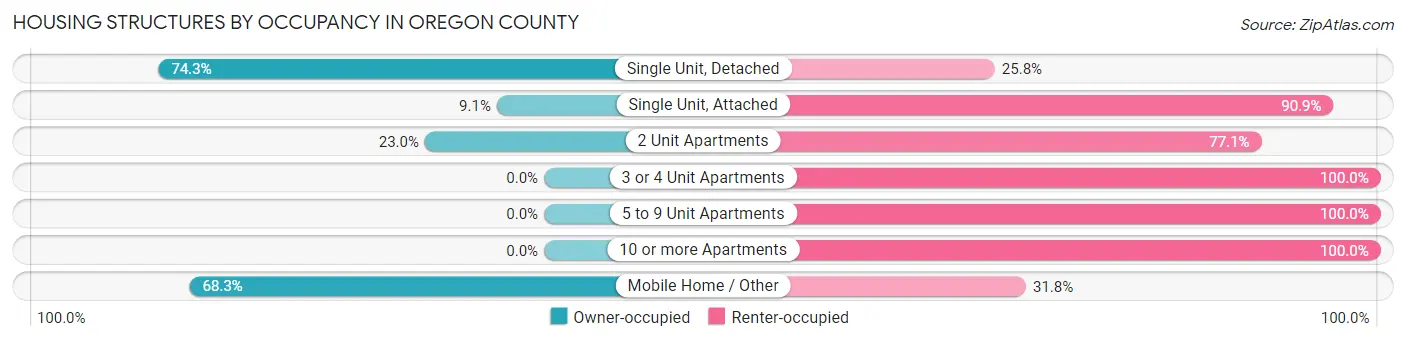
| Structure Type | Owner-occupied | Renter-occupied |
| Single Unit, Detached | 1,995 (74.3%) | 692 (25.8%) |
| Single Unit, Attached | 1 (9.1%) | 10 (90.9%) |
| 2 Unit Apartments | 14 (23.0%) | 47 (77.0%) |
| 3 or 4 Unit Apartments | 0 (0.0%) | 31 (100.0%) |
| 5 to 9 Unit Apartments | 0 (0.0%) | 8 (100.0%) |
| 10 or more Apartments | 0 (0.0%) | 15 (100.0%) |
| Mobile Home / Other | 389 (68.2%) | 181 (31.8%) |
| Total | 2,399 (70.9%) | 984 (29.1%) |
Housing Structures by Number of Rooms in Oregon County
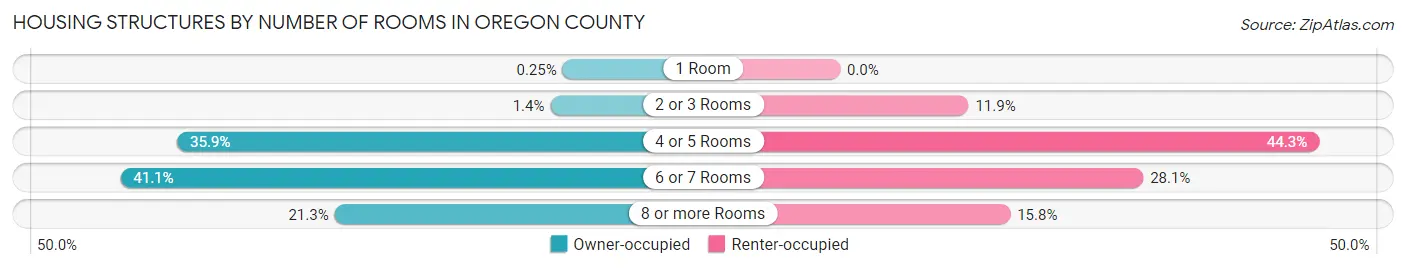
| Number of Rooms | Owner-occupied | Renter-occupied |
| 1 Room | 6 (0.3%) | 0 (0.0%) |
| 2 or 3 Rooms | 33 (1.4%) | 117 (11.9%) |
| 4 or 5 Rooms | 861 (35.9%) | 436 (44.3%) |
| 6 or 7 Rooms | 987 (41.1%) | 276 (28.1%) |
| 8 or more Rooms | 512 (21.3%) | 155 (15.8%) |
| Total | 2,399 (100.0%) | 984 (100.0%) |
Housing Structure by Heating Type in Oregon County
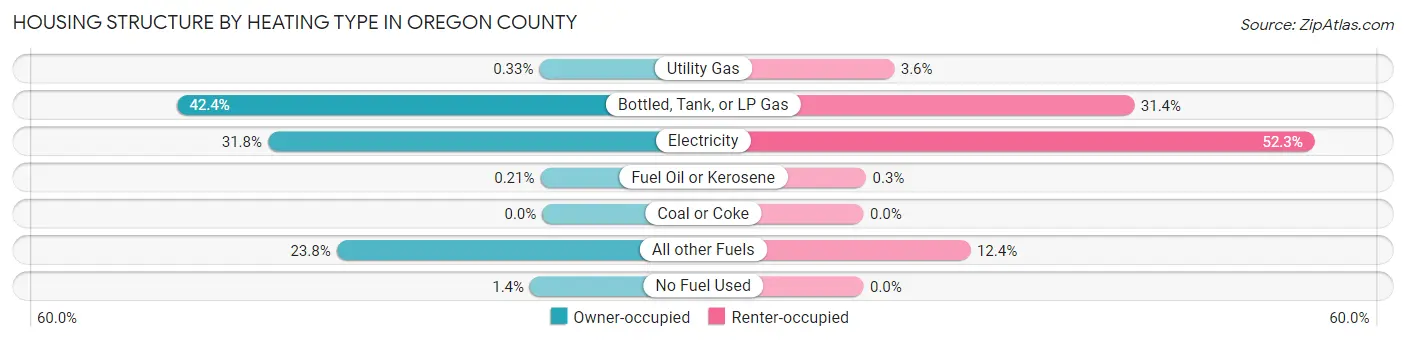
| Heating Type | Owner-occupied | Renter-occupied |
| Utility Gas | 8 (0.3%) | 35 (3.6%) |
| Bottled, Tank, or LP Gas | 1,017 (42.4%) | 309 (31.4%) |
| Electricity | 763 (31.8%) | 515 (52.3%) |
| Fuel Oil or Kerosene | 5 (0.2%) | 3 (0.3%) |
| Coal or Coke | 0 (0.0%) | 0 (0.0%) |
| All other Fuels | 572 (23.8%) | 122 (12.4%) |
| No Fuel Used | 34 (1.4%) | 0 (0.0%) |
| Total | 2,399 (100.0%) | 984 (100.0%) |
Household Vehicle Usage in Oregon County
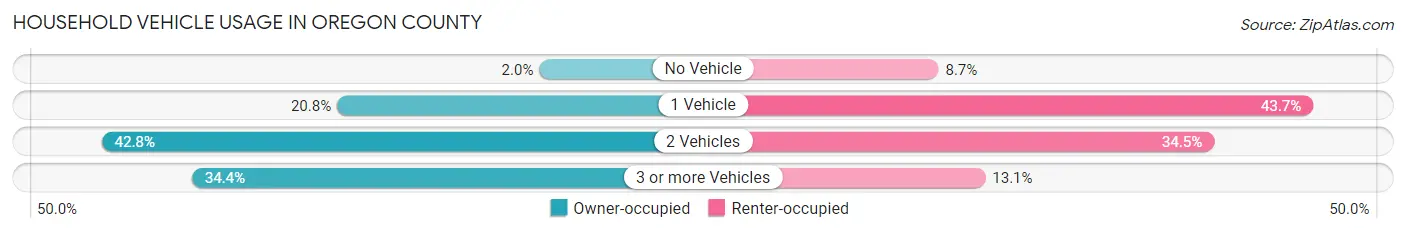
| Vehicles per Household | Owner-occupied | Renter-occupied |
| No Vehicle | 47 (2.0%) | 86 (8.7%) |
| 1 Vehicle | 500 (20.8%) | 430 (43.7%) |
| 2 Vehicles | 1,027 (42.8%) | 339 (34.4%) |
| 3 or more Vehicles | 825 (34.4%) | 129 (13.1%) |
| Total | 2,399 (100.0%) | 984 (100.0%) |
Real Estate & Mortgages in Oregon County
Real Estate and Mortgage Overview in Oregon County
| Characteristic | Without Mortgage | With Mortgage |
| Housing Units | 1,494 | 905 |
| Median Property Value | $101,300 | $124,900 |
| Median Household Income | $39,844 | $17 |
| Monthly Housing Costs | $359 | $16 |
| Real Estate Taxes | $581 | $16 |
Property Value by Mortgage Status in Oregon County
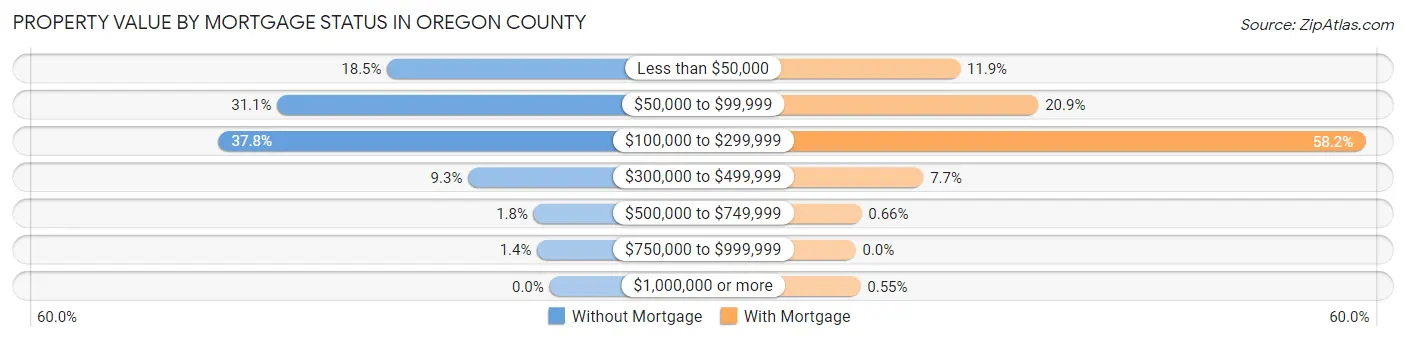
| Property Value | Without Mortgage | With Mortgage |
| Less than $50,000 | 277 (18.5%) | 108 (11.9%) |
| $50,000 to $99,999 | 465 (31.1%) | 189 (20.9%) |
| $100,000 to $299,999 | 565 (37.8%) | 527 (58.2%) |
| $300,000 to $499,999 | 139 (9.3%) | 70 (7.7%) |
| $500,000 to $749,999 | 27 (1.8%) | 6 (0.7%) |
| $750,000 to $999,999 | 21 (1.4%) | 0 (0.0%) |
| $1,000,000 or more | 0 (0.0%) | 5 (0.5%) |
| Total | 1,494 (100.0%) | 905 (100.0%) |
Household Income by Mortgage Status in Oregon County
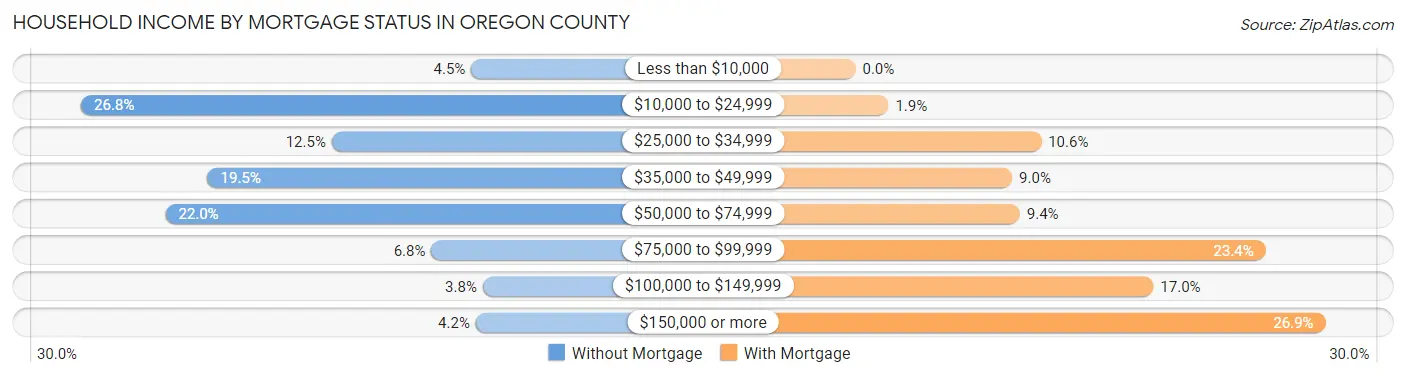
| Household Income | Without Mortgage | With Mortgage |
| Less than $10,000 | 67 (4.5%) | 0 (0.0%) |
| $10,000 to $24,999 | 400 (26.8%) | 17 (1.9%) |
| $25,000 to $34,999 | 186 (12.4%) | 96 (10.6%) |
| $35,000 to $49,999 | 292 (19.5%) | 81 (8.9%) |
| $50,000 to $74,999 | 328 (22.0%) | 85 (9.4%) |
| $75,000 to $99,999 | 101 (6.8%) | 212 (23.4%) |
| $100,000 to $149,999 | 57 (3.8%) | 154 (17.0%) |
| $150,000 or more | 63 (4.2%) | 243 (26.9%) |
| Total | 1,494 (100.0%) | 905 (100.0%) |
Property Value to Household Income Ratio in Oregon County
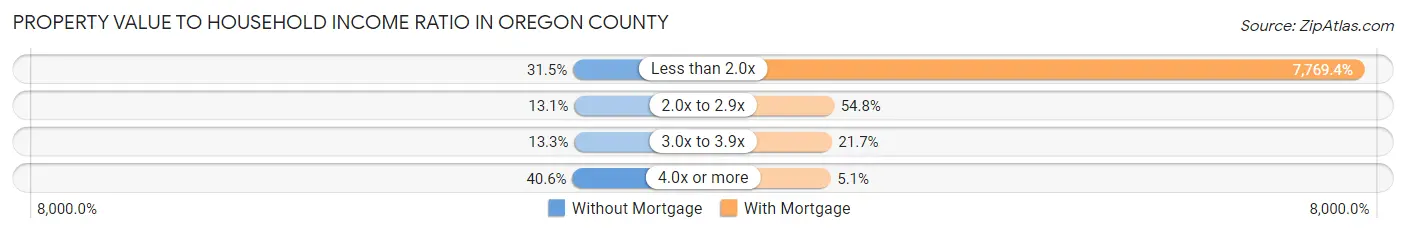
| Value-to-Income Ratio | Without Mortgage | With Mortgage |
| Less than 2.0x | 471 (31.5%) | 70,313 (7,769.4%) |
| 2.0x to 2.9x | 195 (13.1%) | 496 (54.8%) |
| 3.0x to 3.9x | 198 (13.3%) | 196 (21.7%) |
| 4.0x or more | 606 (40.6%) | 46 (5.1%) |
| Total | 1,494 (100.0%) | 905 (100.0%) |
Real Estate Taxes by Mortgage Status in Oregon County
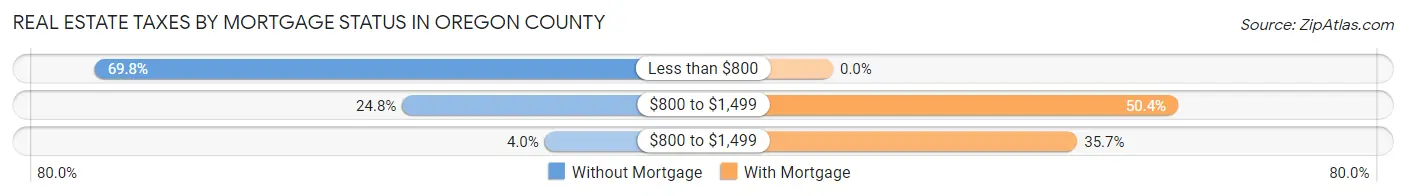
| Property Taxes | Without Mortgage | With Mortgage |
| Less than $800 | 1,042 (69.8%) | 0 (0.0%) |
| $800 to $1,499 | 371 (24.8%) | 456 (50.4%) |
| $800 to $1,499 | 60 (4.0%) | 323 (35.7%) |
| Total | 1,494 (100.0%) | 905 (100.0%) |
Health & Disability in Oregon County
Health Insurance Coverage by Age in Oregon County
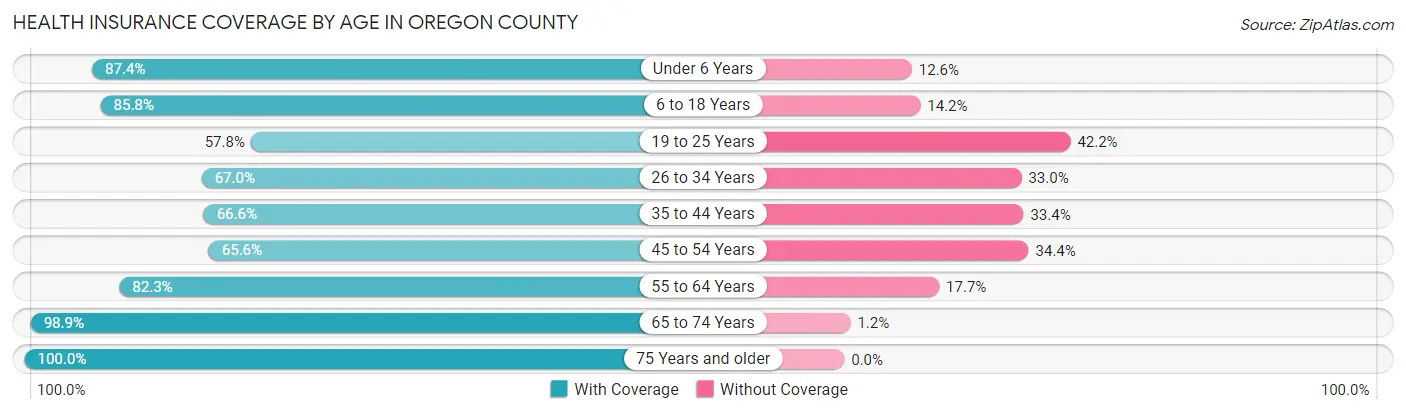
| Age Bracket | With Coverage | Without Coverage |
| Under 6 Years | 569 (87.4%) | 82 (12.6%) |
| 6 to 18 Years | 1,235 (85.8%) | 204 (14.2%) |
| 19 to 25 Years | 347 (57.8%) | 253 (42.2%) |
| 26 to 34 Years | 527 (67.0%) | 260 (33.0%) |
| 35 to 44 Years | 608 (66.6%) | 305 (33.4%) |
| 45 to 54 Years | 655 (65.6%) | 343 (34.4%) |
| 55 to 64 Years | 1,103 (82.3%) | 237 (17.7%) |
| 65 to 74 Years | 1,116 (98.9%) | 13 (1.1%) |
| 75 Years and older | 802 (100.0%) | 0 (0.0%) |
| Total | 6,962 (80.4%) | 1,697 (19.6%) |
Health Insurance Coverage by Citizenship Status in Oregon County
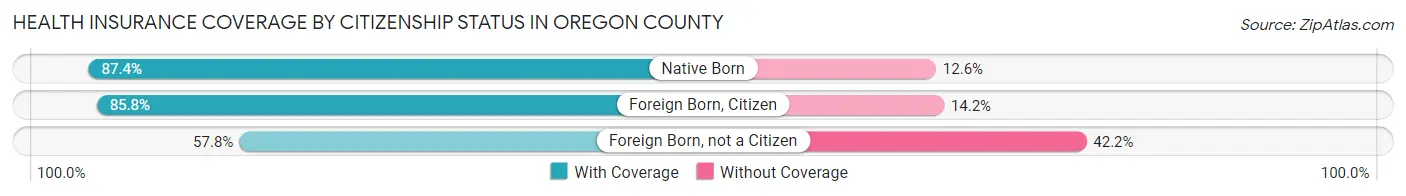
| Citizenship Status | With Coverage | Without Coverage |
| Native Born | 569 (87.4%) | 82 (12.6%) |
| Foreign Born, Citizen | 1,235 (85.8%) | 204 (14.2%) |
| Foreign Born, not a Citizen | 347 (57.8%) | 253 (42.2%) |
Health Insurance Coverage by Household Income in Oregon County
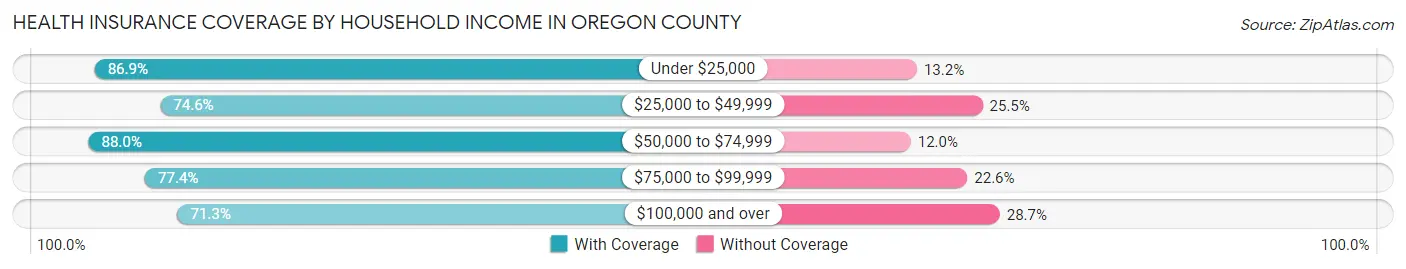
| Household Income | With Coverage | Without Coverage |
| Under $25,000 | 1,730 (86.9%) | 262 (13.2%) |
| $25,000 to $49,999 | 1,661 (74.6%) | 567 (25.5%) |
| $50,000 to $74,999 | 1,849 (88.0%) | 252 (12.0%) |
| $75,000 to $99,999 | 651 (77.4%) | 190 (22.6%) |
| $100,000 and over | 1,060 (71.3%) | 426 (28.7%) |
Public vs Private Health Insurance Coverage by Age in Oregon County
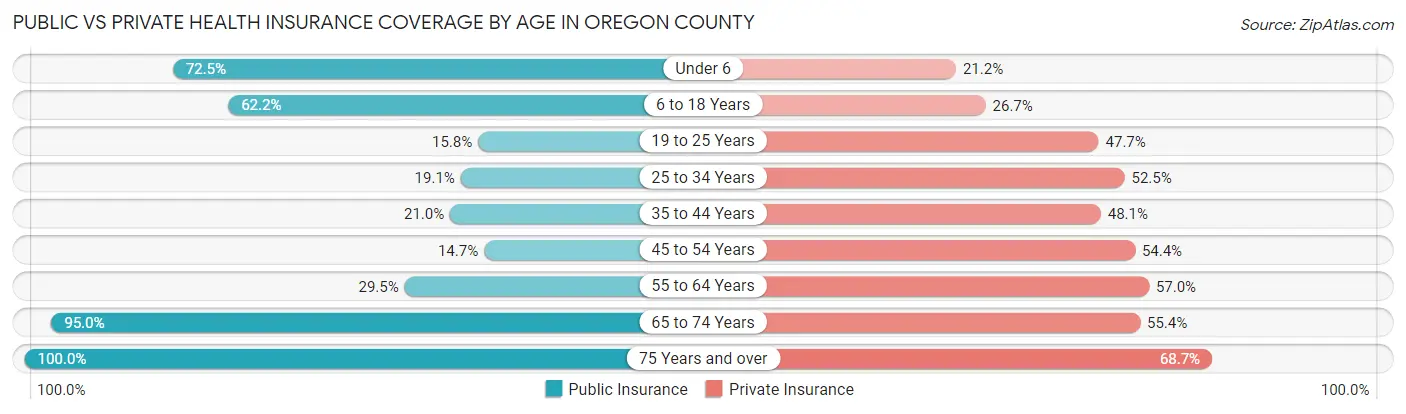
| Age Bracket | Public Insurance | Private Insurance |
| Under 6 | 472 (72.5%) | 138 (21.2%) |
| 6 to 18 Years | 895 (62.2%) | 384 (26.7%) |
| 19 to 25 Years | 95 (15.8%) | 286 (47.7%) |
| 25 to 34 Years | 150 (19.1%) | 413 (52.5%) |
| 35 to 44 Years | 192 (21.0%) | 439 (48.1%) |
| 45 to 54 Years | 147 (14.7%) | 543 (54.4%) |
| 55 to 64 Years | 395 (29.5%) | 764 (57.0%) |
| 65 to 74 Years | 1,073 (95.0%) | 625 (55.4%) |
| 75 Years and over | 802 (100.0%) | 551 (68.7%) |
| Total | 4,221 (48.7%) | 4,143 (47.8%) |
Disability Status by Sex by Age in Oregon County
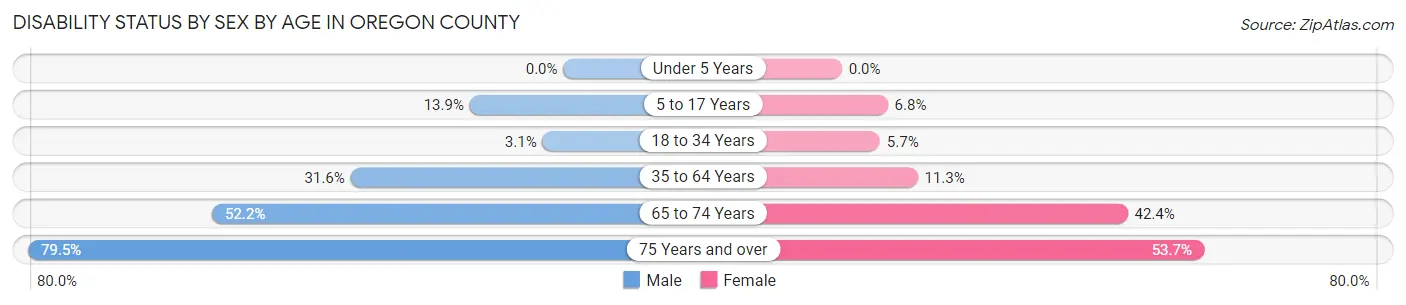
| Age Bracket | Male | Female |
| Under 5 Years | 0 (0.0%) | 0 (0.0%) |
| 5 to 17 Years | 109 (13.9%) | 49 (6.8%) |
| 18 to 34 Years | 23 (3.1%) | 40 (5.7%) |
| 35 to 64 Years | 502 (31.6%) | 187 (11.3%) |
| 65 to 74 Years | 289 (52.2%) | 244 (42.4%) |
| 75 Years and over | 287 (79.5%) | 237 (53.7%) |
Disability Class by Sex by Age in Oregon County
Disability Class: Hearing Difficulty
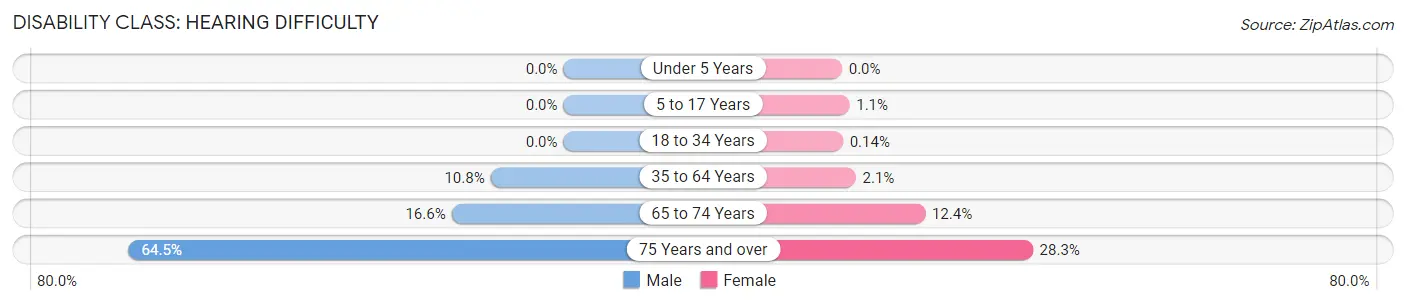
| Age Bracket | Male | Female |
| Under 5 Years | 0 (0.0%) | 0 (0.0%) |
| 5 to 17 Years | 0 (0.0%) | 8 (1.1%) |
| 18 to 34 Years | 0 (0.0%) | 1 (0.1%) |
| 35 to 64 Years | 172 (10.8%) | 34 (2.1%) |
| 65 to 74 Years | 92 (16.6%) | 71 (12.3%) |
| 75 Years and over | 233 (64.5%) | 125 (28.3%) |
Disability Class: Vision Difficulty
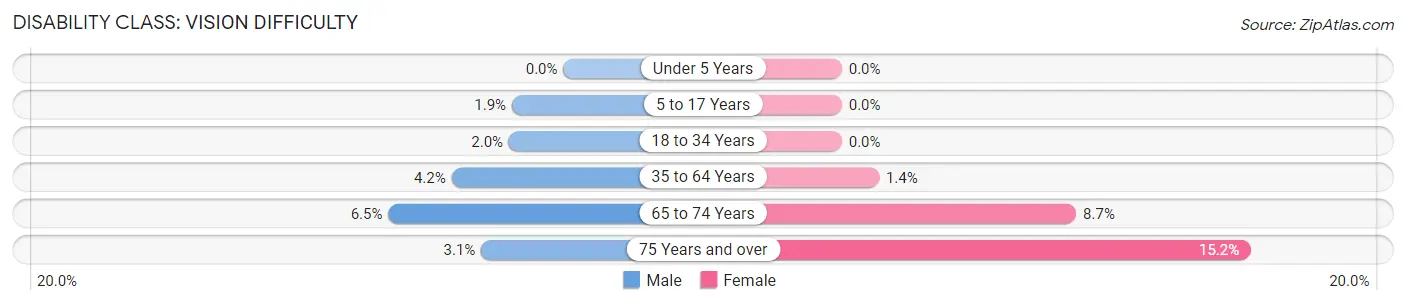
| Age Bracket | Male | Female |
| Under 5 Years | 0 (0.0%) | 0 (0.0%) |
| 5 to 17 Years | 15 (1.9%) | 0 (0.0%) |
| 18 to 34 Years | 15 (2.0%) | 0 (0.0%) |
| 35 to 64 Years | 66 (4.2%) | 23 (1.4%) |
| 65 to 74 Years | 36 (6.5%) | 50 (8.7%) |
| 75 Years and over | 11 (3.0%) | 67 (15.2%) |
Disability Class: Cognitive Difficulty
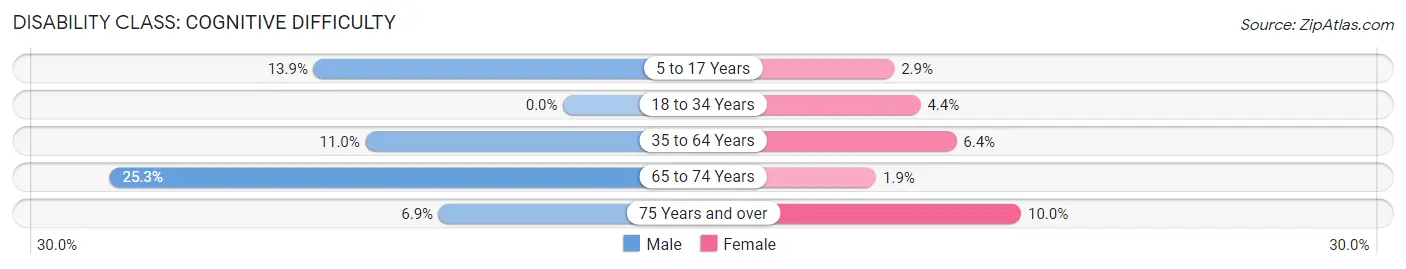
| Age Bracket | Male | Female |
| 5 to 17 Years | 109 (13.9%) | 21 (2.9%) |
| 18 to 34 Years | 0 (0.0%) | 31 (4.4%) |
| 35 to 64 Years | 175 (11.0%) | 106 (6.4%) |
| 65 to 74 Years | 140 (25.3%) | 11 (1.9%) |
| 75 Years and over | 25 (6.9%) | 44 (10.0%) |
Disability Class: Ambulatory Difficulty
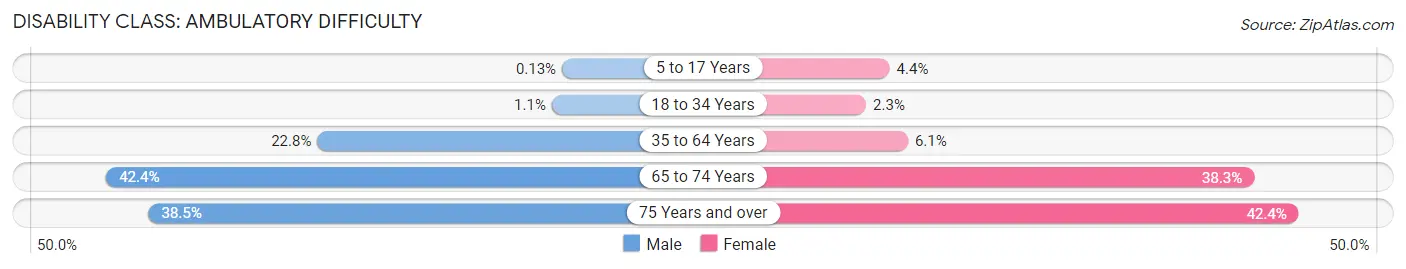
| Age Bracket | Male | Female |
| 5 to 17 Years | 1 (0.1%) | 32 (4.4%) |
| 18 to 34 Years | 8 (1.1%) | 16 (2.3%) |
| 35 to 64 Years | 363 (22.8%) | 102 (6.1%) |
| 65 to 74 Years | 235 (42.4%) | 220 (38.3%) |
| 75 Years and over | 139 (38.5%) | 187 (42.4%) |
Disability Class: Self-Care Difficulty
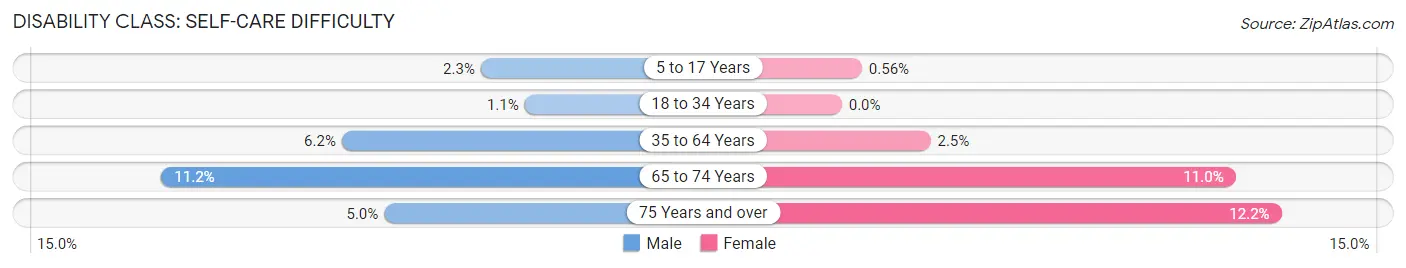
| Age Bracket | Male | Female |
| 5 to 17 Years | 18 (2.3%) | 4 (0.6%) |
| 18 to 34 Years | 8 (1.1%) | 0 (0.0%) |
| 35 to 64 Years | 98 (6.2%) | 41 (2.5%) |
| 65 to 74 Years | 62 (11.2%) | 63 (11.0%) |
| 75 Years and over | 18 (5.0%) | 54 (12.2%) |
Technology Access in Oregon County
Computing Device Access in Oregon County
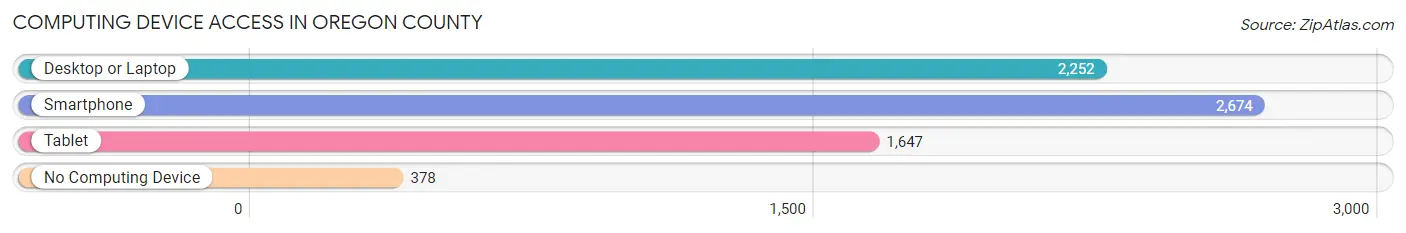
| Device Type | # Households | % Households |
| Desktop or Laptop | 2,252 | 66.6% |
| Smartphone | 2,674 | 79.0% |
| Tablet | 1,647 | 48.7% |
| No Computing Device | 378 | 11.2% |
| Total | 3,383 | 100.0% |
Internet Access in Oregon County
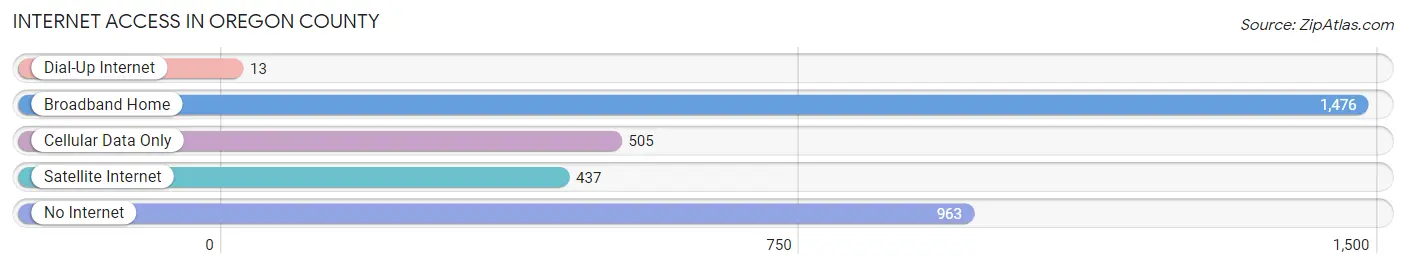
| Internet Type | # Households | % Households |
| Dial-Up Internet | 13 | 0.4% |
| Broadband Home | 1,476 | 43.6% |
| Cellular Data Only | 505 | 14.9% |
| Satellite Internet | 437 | 12.9% |
| No Internet | 963 | 28.5% |
| Total | 3,383 | 100.0% |
Oregon County Summary
Introduction
Oregon County is located in the Ozark Mountains of southern Missouri. It is bordered by Howell County to the north, Carter County to the east, Ripley County to the south, and Shannon County to the west. The county seat is Alton, and the largest city is Thayer. The county was established in 1845 and named after the Oregon Territory.
History
The area that is now Oregon County was originally inhabited by the Osage Indians. The first white settlers arrived in the area in the early 1800s. The county was officially established in 1845 and named after the Oregon Territory.
The county was largely agricultural in the 19th century, with cotton, corn, and wheat being the main crops. The county also had a thriving timber industry.
In the early 20th century, the county experienced a population boom due to the discovery of oil and natural gas. This led to the development of several small towns, such as Alton, Thayer, and Koshkonong.
Geography
Oregon County is located in the Ozark Mountains of southern Missouri. It is bordered by Howell County to the north, Carter County to the east, Ripley County to the south, and Shannon County to the west. The county has a total area of 576 square miles, of which 574 square miles is land and 2 square miles is water.
The county is mostly hilly and forested, with the highest point being Pilot Knob at 1,068 feet. The Eleven Point River runs through the county, and there are several small lakes and reservoirs.
Economy
Oregon County has a largely agricultural economy. The main crops are corn, soybeans, wheat, and hay. The county also has a thriving timber industry.
The county is home to several small businesses, including a furniture factory, a sawmill, and a canning factory. There are also several tourist attractions, such as the Eleven Point National Scenic River and the Ozark National Scenic Riverways.
Demographics
As of the 2010 census, Oregon County had a population of 10,881. The racial makeup of the county was 97.3% White, 0.5% Black or African American, 0.3% Native American, 0.2% Asian, 0.1% Pacific Islander, 0.7% from other races, and 0.9% from two or more races. 1.7% of the population were Hispanic or Latino of any race.
The median household income was $30,945 and the median family income was $37,917. The per capita income was $16,845. About 17.2% of the population was below the poverty line.
Conclusion
Oregon County is located in the Ozark Mountains of southern Missouri. It has a largely agricultural economy, with corn, soybeans, wheat, and hay being the main crops. The county also has a thriving timber industry. The population of Oregon County is 10,881, and the median household income is $30,945.
Common Questions
What is Per Capita Income in Oregon County?
Per Capita income in Oregon County is $21,405.
What is the Median Family Income in Oregon County?
Median Family Income in Oregon County is $50,451.
What is the Median Household income in Oregon County?
Median Household Income in Oregon County is $41,365.
What is Income or Wage Gap in Oregon County?
Income or Wage Gap in Oregon County is 34.0%.
Women in Oregon County earn 66.0 cents for every dollar earned by a man.
What is Family Income Deficit in Oregon County?
Family Income Deficit in Oregon County is $6,986.
Families that are below poverty line in Oregon County earn $6,986 less on average than the poverty threshold level.
What is Inequality or Gini Index in Oregon County?
Inequality or Gini Index in Oregon County is 0.43.
What is the Total Population of Oregon County?
Total Population of Oregon County is 8,783.
What is the Total Male Population of Oregon County?
Total Male Population of Oregon County is 4,367.
What is the Total Female Population of Oregon County?
Total Female Population of Oregon County is 4,416.
What is the Ratio of Males per 100 Females in Oregon County?
There are 98.89 Males per 100 Females in Oregon County.
What is the Ratio of Females per 100 Males in Oregon County?
There are 101.12 Females per 100 Males in Oregon County.
What is the Median Population Age in Oregon County?
Median Population Age in Oregon County is 44.7 Years.
What is the Average Family Size in Oregon County
Average Family Size in Oregon County is 3.0 People.
What is the Average Household Size in Oregon County
Average Household Size in Oregon County is 2.6 People.
How Large is the Labor Force in Oregon County?
There are 3,387 People in the Labor Forcein in Oregon County.
What is the Percentage of People in the Labor Force in Oregon County?
48.6% of People are in the Labor Force in Oregon County.
What is the Unemployment Rate in Oregon County?
Unemployment Rate in Oregon County is 4.5%.