Nodaway County, MO Map & Demographics
Nodaway County Map
Nodaway County Overview
$28,136
PER CAPITA INCOME
$76,875
AVG FAMILY INCOME
$53,917
AVG HOUSEHOLD INCOME
33.4%
WAGE / INCOME GAP [ % ]
66.6¢/ $1
WAGE / INCOME GAP [ $ ]
$10,421
FAMILY INCOME DEFICIT
0.45
INEQUALITY / GINI INDEX
21,140
TOTAL POPULATION
10,575
MALE POPULATION
10,565
FEMALE POPULATION
100.09
MALES / 100 FEMALES
99.91
FEMALES / 100 MALES
33.5
MEDIAN AGE
2.8
AVG FAMILY SIZE
2.2
AVG HOUSEHOLD SIZE
10,256
LABOR FORCE [ PEOPLE ]
56.7%
PERCENT IN LABOR FORCE
2.3%
UNEMPLOYMENT RATE
Nodaway County Area Codes
Income in Nodaway County
Income Overview in Nodaway County
Per Capita Income in Nodaway County is $28,136, while median incomes of families and households are $76,875 and $53,917 respectively.
| Characteristic | Number | Measure |
| Per Capita Income | 21,140 | $28,136 |
| Median Family Income | 4,638 | $76,875 |
| Mean Family Income | 4,638 | $89,563 |
| Median Household Income | 8,261 | $53,917 |
| Mean Household Income | 8,261 | $69,957 |
| Income Deficit | 4,638 | $10,421 |
| Wage / Income Gap (%) | 21,140 | 33.43% |
| Wage / Income Gap ($) | 21,140 | 66.57¢ per $1 |
| Gini / Inequality Index | 21,140 | 0.45 |
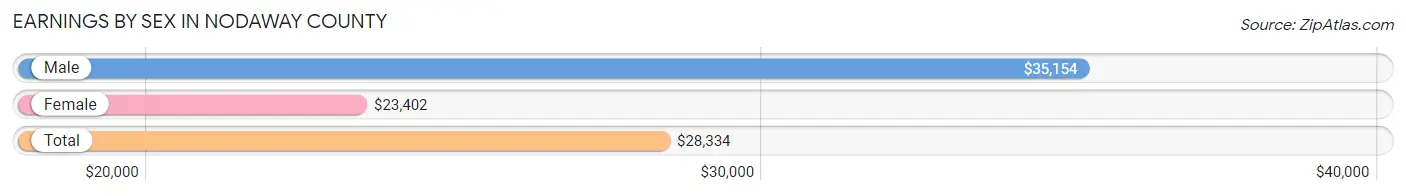
Earnings by Sex in Nodaway County
Average Earnings in Nodaway County are $28,334, $35,154 for men and $23,402 for women, a difference of 33.4%.
| Sex | Number | Average Earnings |
| Male | 6,262 (53.4%) | $35,154 |
| Female | 5,463 (46.6%) | $23,402 |
| Total | 11,725 (100.0%) | $28,334 |
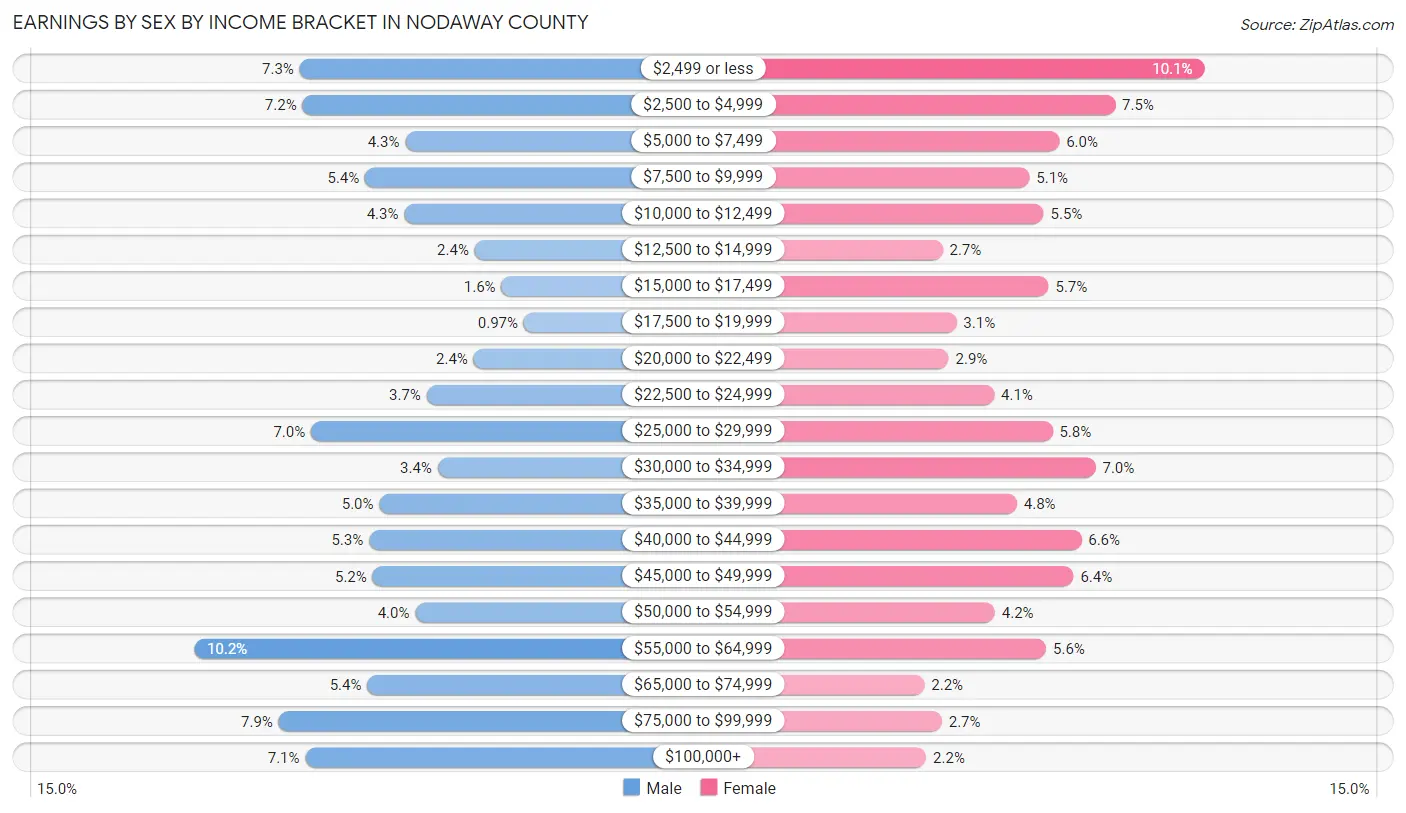
Earnings by Sex by Income Bracket in Nodaway County
The most common earnings brackets in Nodaway County are $55,000 to $64,999 for men (641 | 10.2%) and $2,499 or less for women (549 | 10.1%).
| Income | Male | Female |
| $2,499 or less | 455 (7.3%) | 549 (10.1%) |
| $2,500 to $4,999 | 450 (7.2%) | 412 (7.5%) |
| $5,000 to $7,499 | 269 (4.3%) | 326 (6.0%) |
| $7,500 to $9,999 | 340 (5.4%) | 280 (5.1%) |
| $10,000 to $12,499 | 271 (4.3%) | 302 (5.5%) |
| $12,500 to $14,999 | 147 (2.4%) | 147 (2.7%) |
| $15,000 to $17,499 | 100 (1.6%) | 310 (5.7%) |
| $17,500 to $19,999 | 61 (1.0%) | 168 (3.1%) |
| $20,000 to $22,499 | 149 (2.4%) | 156 (2.9%) |
| $22,500 to $24,999 | 232 (3.7%) | 226 (4.1%) |
| $25,000 to $29,999 | 435 (7.0%) | 316 (5.8%) |
| $30,000 to $34,999 | 212 (3.4%) | 382 (7.0%) |
| $35,000 to $39,999 | 315 (5.0%) | 261 (4.8%) |
| $40,000 to $44,999 | 333 (5.3%) | 360 (6.6%) |
| $45,000 to $49,999 | 327 (5.2%) | 348 (6.4%) |
| $50,000 to $54,999 | 252 (4.0%) | 227 (4.2%) |
| $55,000 to $64,999 | 641 (10.2%) | 306 (5.6%) |
| $65,000 to $74,999 | 336 (5.4%) | 119 (2.2%) |
| $75,000 to $99,999 | 492 (7.9%) | 146 (2.7%) |
| $100,000+ | 445 (7.1%) | 122 (2.2%) |
| Total | 6,262 (100.0%) | 5,463 (100.0%) |
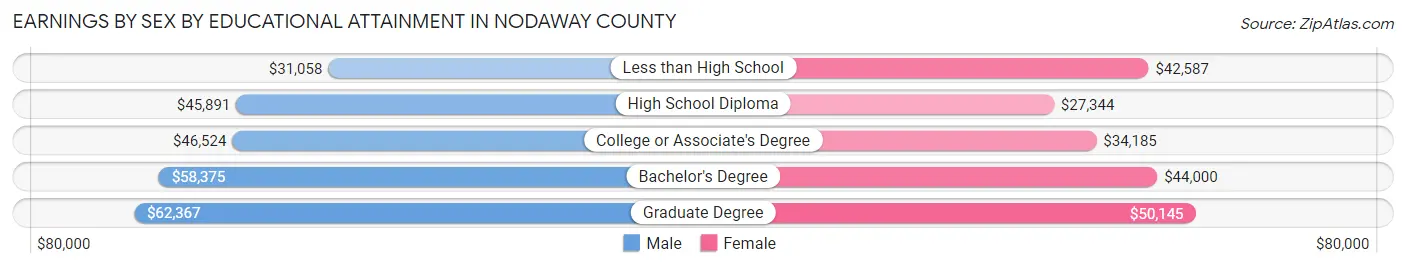
Earnings by Sex by Educational Attainment in Nodaway County
Average earnings in Nodaway County are $49,024 for men and $37,147 for women, a difference of 24.2%. Men with an educational attainment of graduate degree enjoy the highest average annual earnings of $62,367, while those with less than high school education earn the least with $31,058. Women with an educational attainment of graduate degree earn the most with the average annual earnings of $50,145, while those with high school diploma education have the smallest earnings of $27,344.
| Educational Attainment | Male Income | Female Income |
| Less than High School | $31,058 | $42,587 |
| High School Diploma | $45,891 | $27,344 |
| College or Associate's Degree | $46,524 | $34,185 |
| Bachelor's Degree | $58,375 | $44,000 |
| Graduate Degree | $62,367 | $50,145 |
| Total | $49,024 | $37,147 |
Family Income in Nodaway County
Family Income Brackets in Nodaway County
According to the Nodaway County family income data, there are 993 families falling into the $50,000 to $74,999 income range, which is the most common income bracket and makes up 21.4% of all families. Conversely, the $10,000 to $14,999 income bracket is the least frequent group with only 116 families (2.5%) belonging to this category.
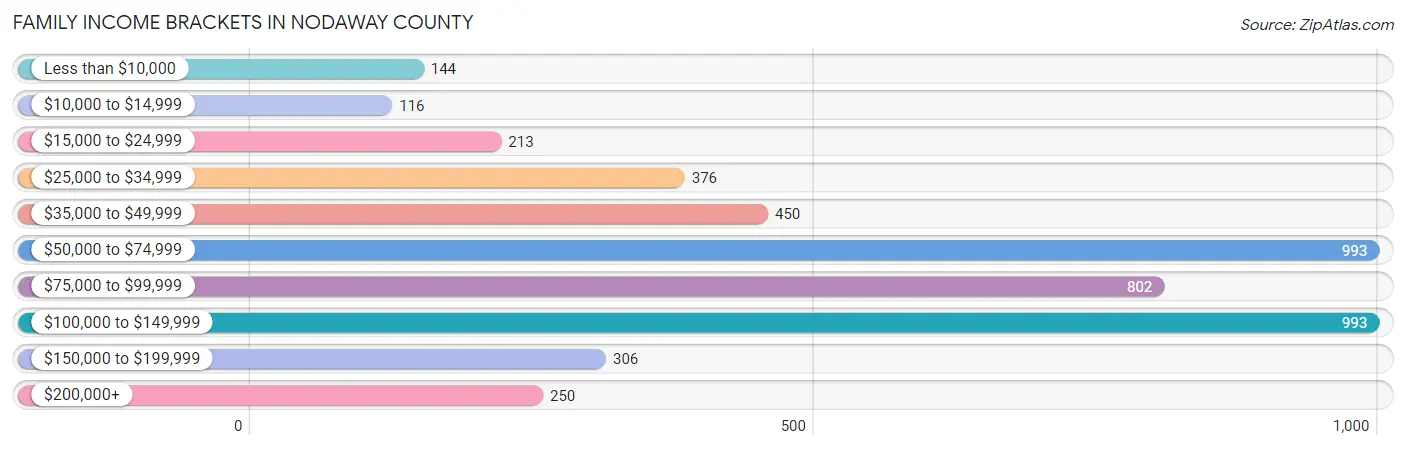
| Income Bracket | # Families | % Families |
| Less than $10,000 | 144 | 3.1% |
| $10,000 to $14,999 | 116 | 2.5% |
| $15,000 to $24,999 | 213 | 4.6% |
| $25,000 to $34,999 | 376 | 8.1% |
| $35,000 to $49,999 | 450 | 9.7% |
| $50,000 to $74,999 | 993 | 21.4% |
| $75,000 to $99,999 | 802 | 17.3% |
| $100,000 to $149,999 | 993 | 21.4% |
| $150,000 to $199,999 | 306 | 6.6% |
| $200,000+ | 250 | 5.4% |
Family Income by Famaliy Size in Nodaway County
5-person families (347 | 7.5%) account for the highest median family income in Nodaway County with $91,047 per family, while 2-person families (2,658 | 57.3%) have the highest median income of $36,758 per family member.
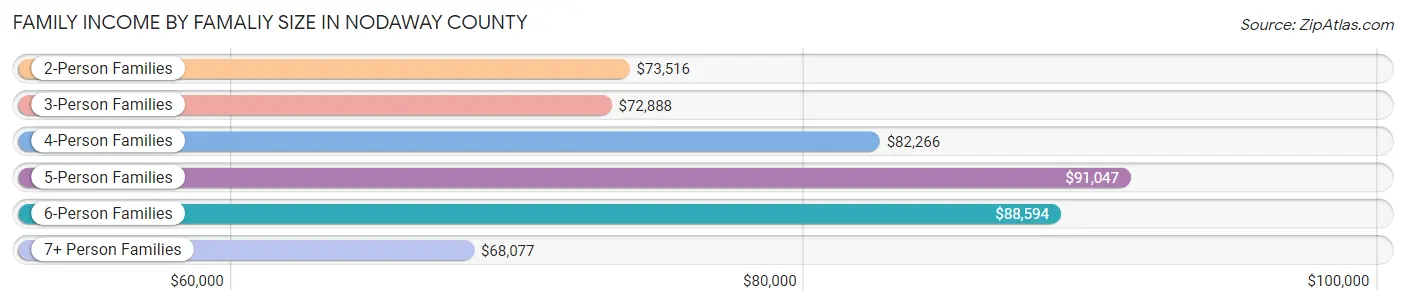
| Income Bracket | # Families | Median Income |
| 2-Person Families | 2,658 (57.3%) | $73,516 |
| 3-Person Families | 809 (17.4%) | $72,888 |
| 4-Person Families | 693 (14.9%) | $82,266 |
| 5-Person Families | 347 (7.5%) | $91,047 |
| 6-Person Families | 85 (1.8%) | $88,594 |
| 7+ Person Families | 46 (1.0%) | $68,077 |
| Total | 4,638 (100.0%) | $76,875 |
Family Income by Number of Earners in Nodaway County
The median family income in Nodaway County is $76,875, with families comprising 3+ earners (307) having the highest median family income of $102,829, while families with no earners (736) have the lowest median family income of $53,333, accounting for 6.6% and 15.9% of families, respectively.
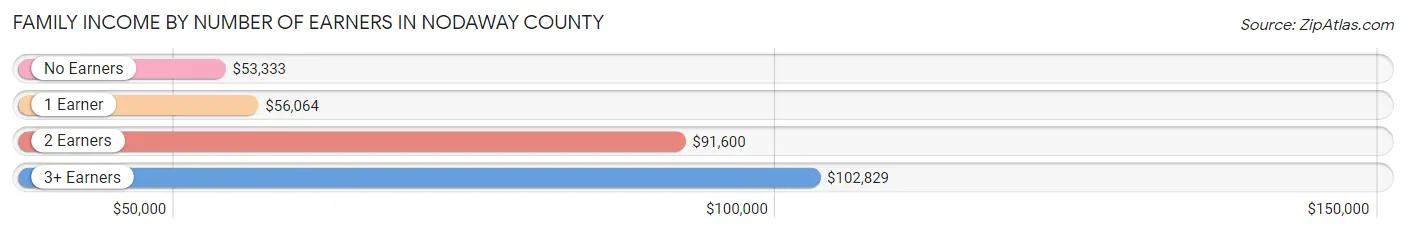
| Number of Earners | # Families | Median Income |
| No Earners | 736 (15.9%) | $53,333 |
| 1 Earner | 1,439 (31.0%) | $56,064 |
| 2 Earners | 2,156 (46.5%) | $91,600 |
| 3+ Earners | 307 (6.6%) | $102,829 |
| Total | 4,638 (100.0%) | $76,875 |
Household Income in Nodaway County
Household Income Brackets in Nodaway County
With 1,611 households falling in the category, the $50,000 to $74,999 income range is the most frequent in Nodaway County, accounting for 19.5% of all households. In contrast, only 281 households (3.4%) fall into the $200,000+ income bracket, making it the least populous group.
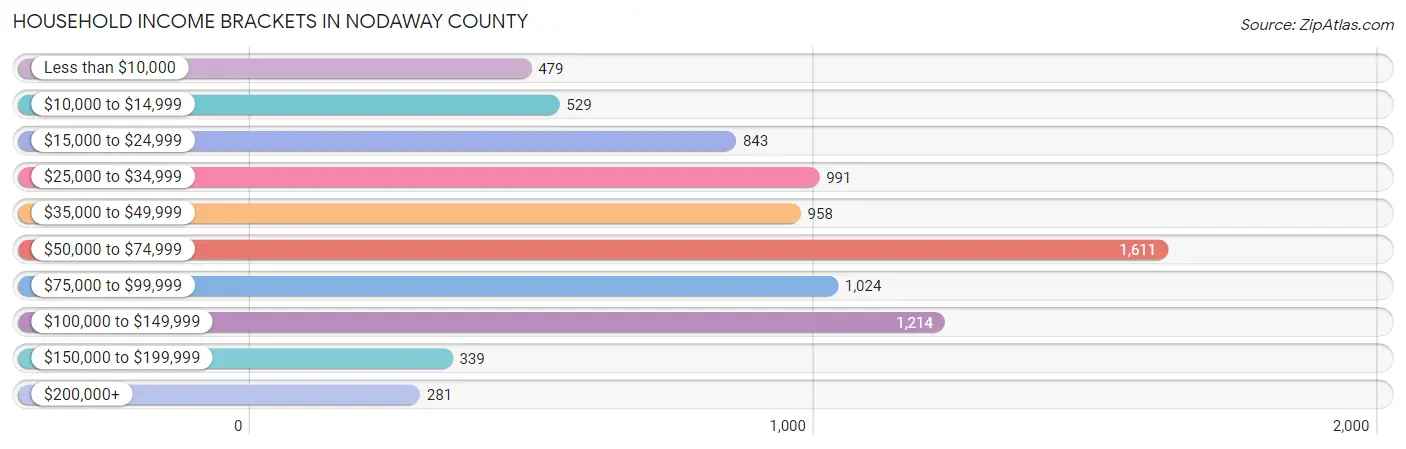
| Income Bracket | # Households | % Households |
| Less than $10,000 | 479 | 5.8% |
| $10,000 to $14,999 | 529 | 6.4% |
| $15,000 to $24,999 | 843 | 10.2% |
| $25,000 to $34,999 | 991 | 12.0% |
| $35,000 to $49,999 | 958 | 11.6% |
| $50,000 to $74,999 | 1,611 | 19.5% |
| $75,000 to $99,999 | 1,024 | 12.4% |
| $100,000 to $149,999 | 1,214 | 14.7% |
| $150,000 to $199,999 | 339 | 4.1% |
| $200,000+ | 281 | 3.4% |
Household Income by Householder Age in Nodaway County
The median household income in Nodaway County is $53,917, with the highest median household income of $73,869 found in the 45 to 64 years age bracket for the primary householder. A total of 2,620 households (31.7%) fall into this category. Meanwhile, the 15 to 24 years age bracket for the primary householder has the lowest median household income of $24,766, with 1,143 households (13.8%) in this group.
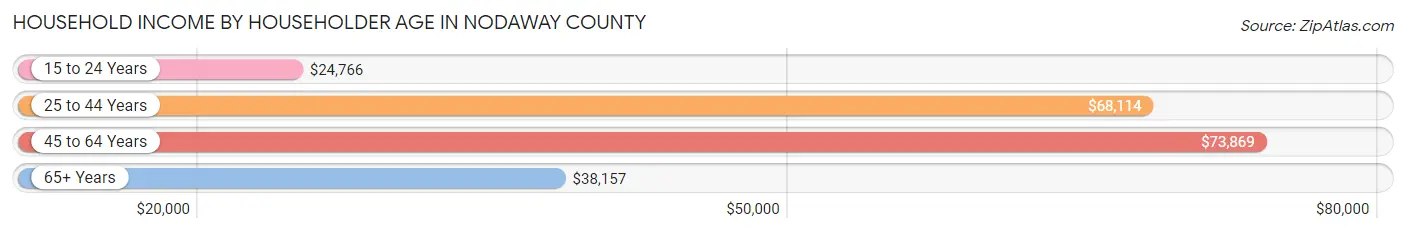
| Income Bracket | # Households | Median Income |
| 15 to 24 Years | 1,143 (13.8%) | $24,766 |
| 25 to 44 Years | 2,315 (28.0%) | $68,114 |
| 45 to 64 Years | 2,620 (31.7%) | $73,869 |
| 65+ Years | 2,183 (26.4%) | $38,157 |
| Total | 8,261 (100.0%) | $53,917 |
Poverty in Nodaway County
Income Below Poverty by Sex and Age in Nodaway County
With 20.0% poverty level for males and 18.9% for females among the residents of Nodaway County, 18 to 24 year old males and 18 to 24 year old females are the most vulnerable to poverty, with 898 males (52.6%) and 838 females (58.9%) in their respective age groups living below the poverty level.
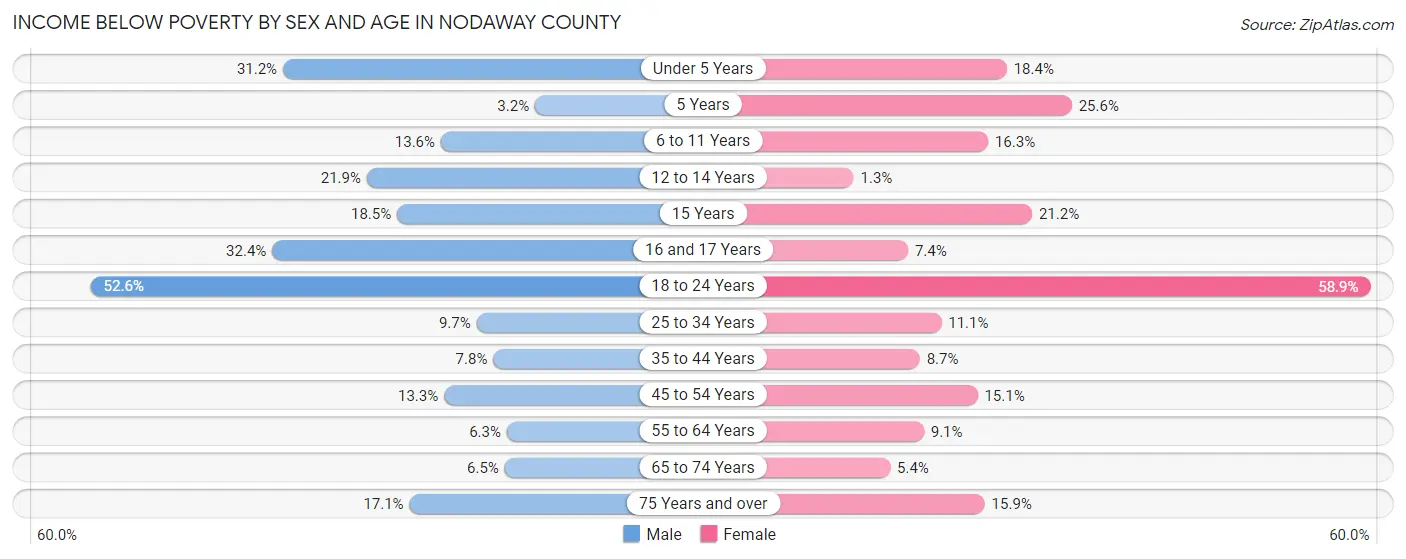
| Age Bracket | Male | Female |
| Under 5 Years | 173 (31.2%) | 88 (18.4%) |
| 5 Years | 3 (3.2%) | 21 (25.6%) |
| 6 to 11 Years | 63 (13.6%) | 91 (16.3%) |
| 12 to 14 Years | 81 (21.9%) | 3 (1.3%) |
| 15 Years | 10 (18.5%) | 18 (21.2%) |
| 16 and 17 Years | 60 (32.4%) | 14 (7.4%) |
| 18 to 24 Years | 898 (52.6%) | 838 (58.9%) |
| 25 to 34 Years | 101 (9.7%) | 113 (11.1%) |
| 35 to 44 Years | 77 (7.8%) | 93 (8.7%) |
| 45 to 54 Years | 128 (13.3%) | 144 (15.1%) |
| 55 to 64 Years | 78 (6.3%) | 111 (9.1%) |
| 65 to 74 Years | 60 (6.5%) | 51 (5.4%) |
| 75 Years and over | 108 (17.1%) | 134 (15.9%) |
| Total | 1,840 (20.0%) | 1,719 (18.9%) |
Income Above Poverty by Sex and Age in Nodaway County
According to the poverty statistics in Nodaway County, males aged 5 years and females aged 12 to 14 years are the age groups that are most secure financially, with 96.8% of males and 98.7% of females in these age groups living above the poverty line.
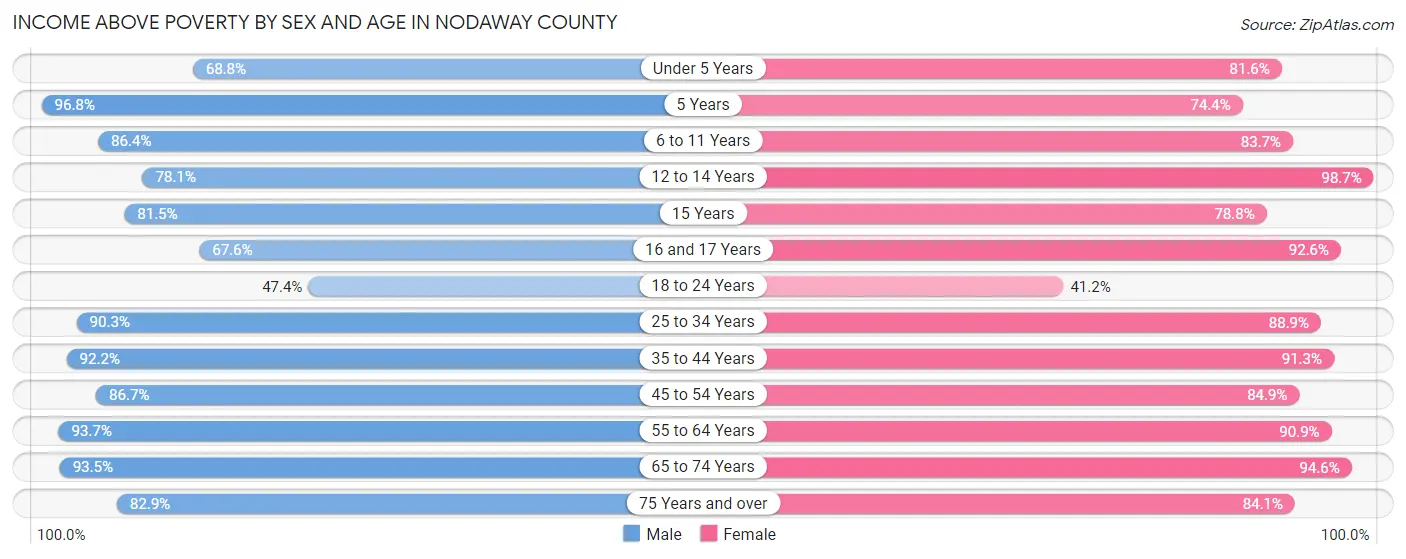
| Age Bracket | Male | Female |
| Under 5 Years | 381 (68.8%) | 391 (81.6%) |
| 5 Years | 92 (96.8%) | 61 (74.4%) |
| 6 to 11 Years | 399 (86.4%) | 468 (83.7%) |
| 12 to 14 Years | 289 (78.1%) | 226 (98.7%) |
| 15 Years | 44 (81.5%) | 67 (78.8%) |
| 16 and 17 Years | 125 (67.6%) | 176 (92.6%) |
| 18 to 24 Years | 808 (47.4%) | 586 (41.1%) |
| 25 to 34 Years | 943 (90.3%) | 907 (88.9%) |
| 35 to 44 Years | 909 (92.2%) | 979 (91.3%) |
| 45 to 54 Years | 835 (86.7%) | 809 (84.9%) |
| 55 to 64 Years | 1,161 (93.7%) | 1,105 (90.9%) |
| 65 to 74 Years | 859 (93.5%) | 897 (94.6%) |
| 75 Years and over | 522 (82.9%) | 708 (84.1%) |
| Total | 7,367 (80.0%) | 7,380 (81.1%) |
Income Below Poverty Among Married-Couple Families in Nodaway County
The poverty statistics for married-couple families in Nodaway County show that 4.1% or 150 of the total 3,668 families live below the poverty line. Families with 5 or more children have the highest poverty rate of 24.2%, comprising of 8 families. On the other hand, families with no children have the lowest poverty rate of 3.2%, which includes 76 families.
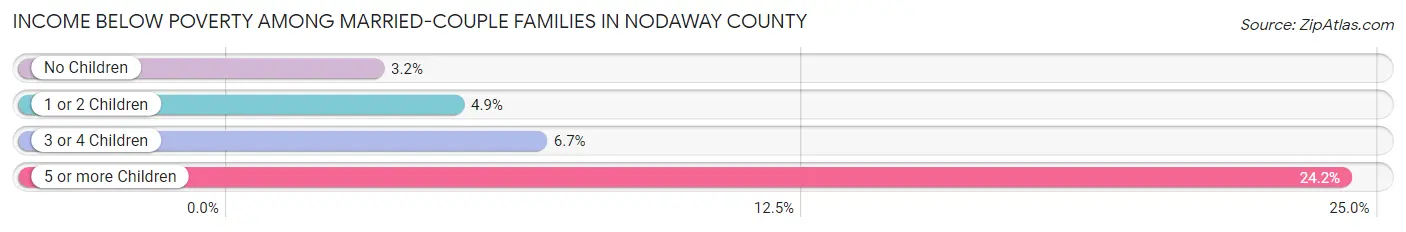
| Children | Above Poverty | Below Poverty |
| No Children | 2,315 (96.8%) | 76 (3.2%) |
| 1 or 2 Children | 928 (95.1%) | 48 (4.9%) |
| 3 or 4 Children | 250 (93.3%) | 18 (6.7%) |
| 5 or more Children | 25 (75.8%) | 8 (24.2%) |
| Total | 3,518 (95.9%) | 150 (4.1%) |
Income Below Poverty Among Single-Parent Households in Nodaway County
According to the poverty data in Nodaway County, 14.2% or 44 single-father households and 36.2% or 239 single-mother households are living below the poverty line. Among single-father households, those with 3 or 4 children have the highest poverty rate, with 12 households (29.3%) experiencing poverty. Likewise, among single-mother households, those with 5 or more children have the highest poverty rate, with 25 households (100.0%) falling below the poverty line.
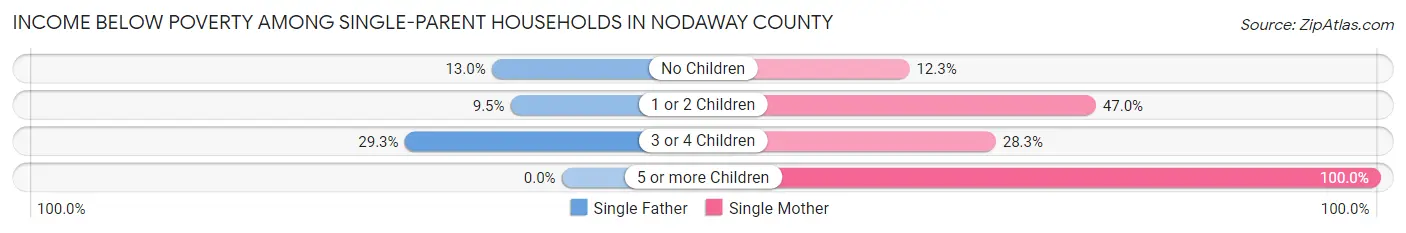
| Children | Single Father | Single Mother |
| No Children | 24 (13.0%) | 26 (12.3%) |
| 1 or 2 Children | 8 (9.5%) | 171 (47.0%) |
| 3 or 4 Children | 12 (29.3%) | 17 (28.3%) |
| 5 or more Children | 0 (0.0%) | 25 (100.0%) |
| Total | 44 (14.2%) | 239 (36.2%) |
Income Below Poverty Among Married-Couple vs Single-Parent Households in Nodaway County
The poverty data for Nodaway County shows that 150 of the married-couple family households (4.1%) and 283 of the single-parent households (29.2%) are living below the poverty level. Within the married-couple family households, those with 5 or more children have the highest poverty rate, with 8 households (24.2%) falling below the poverty line. Among the single-parent households, those with 5 or more children have the highest poverty rate, with 25 household (100.0%) living below poverty.
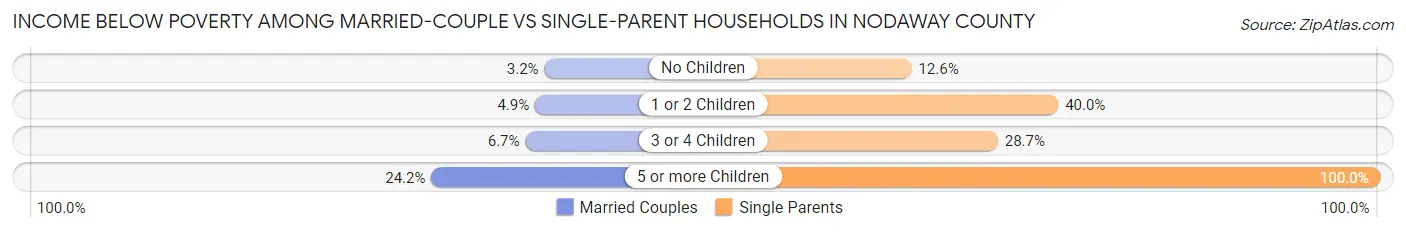
| Children | Married-Couple Families | Single-Parent Households |
| No Children | 76 (3.2%) | 50 (12.6%) |
| 1 or 2 Children | 48 (4.9%) | 179 (40.0%) |
| 3 or 4 Children | 18 (6.7%) | 29 (28.7%) |
| 5 or more Children | 8 (24.2%) | 25 (100.0%) |
| Total | 150 (4.1%) | 283 (29.2%) |
Race in Nodaway County
The most populous races in Nodaway County are White / Caucasian (19,799 | 93.7%), Black / African American (457 | 2.2%), and Two or more Races (387 | 1.8%).
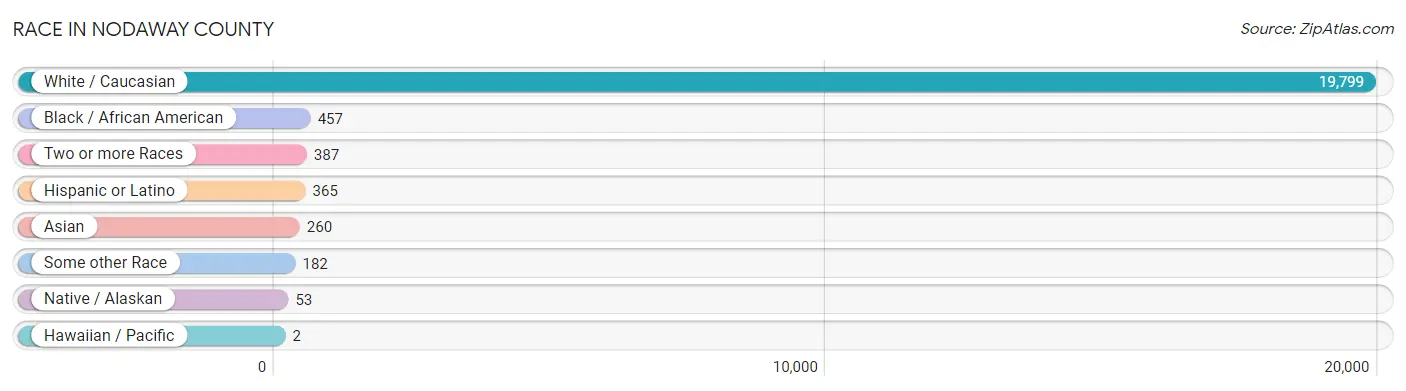
| Race | # Population | % Population |
| Asian | 260 | 1.2% |
| Black / African American | 457 | 2.2% |
| Hawaiian / Pacific | 2 | 0.0% |
| Hispanic or Latino | 365 | 1.7% |
| Native / Alaskan | 53 | 0.3% |
| White / Caucasian | 19,799 | 93.7% |
| Two or more Races | 387 | 1.8% |
| Some other Race | 182 | 0.9% |
| Total | 21,140 | 100.0% |
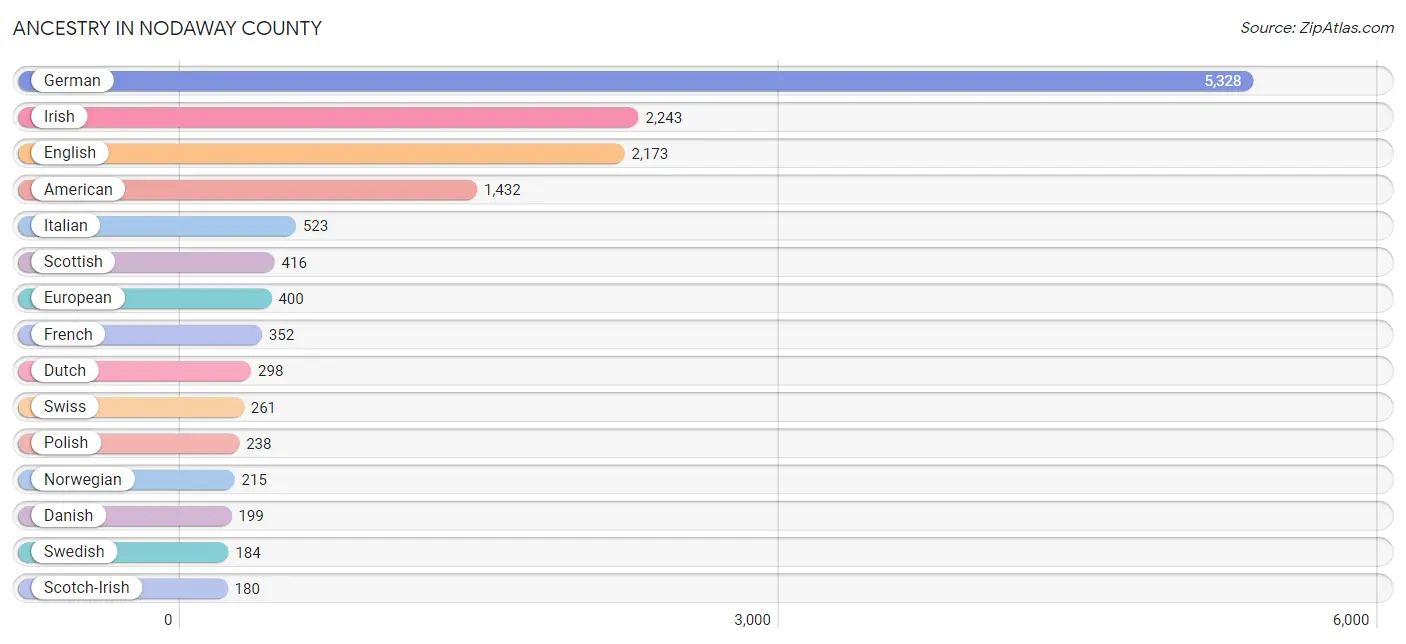
Ancestry in Nodaway County
The most populous ancestries reported in Nodaway County are German (5,328 | 25.2%), Irish (2,243 | 10.6%), English (2,173 | 10.3%), American (1,432 | 6.8%), and Italian (523 | 2.5%), together accounting for 55.3% of all Nodaway County residents.
| Ancestry | # Population | % Population |
| African | 72 | 0.3% |
| American | 1,432 | 6.8% |
| Arab | 9 | 0.0% |
| Austrian | 9 | 0.0% |
| Basque | 1 | 0.0% |
| Bhutanese | 1 | 0.0% |
| Blackfeet | 6 | 0.0% |
| British | 61 | 0.3% |
| Burmese | 13 | 0.1% |
| Canadian | 18 | 0.1% |
| Central American | 27 | 0.1% |
| Cherokee | 24 | 0.1% |
| Choctaw | 5 | 0.0% |
| Costa Rican | 2 | 0.0% |
| Creek | 20 | 0.1% |
| Croatian | 61 | 0.3% |
| Cuban | 18 | 0.1% |
| Czech | 137 | 0.6% |
| Czechoslovakian | 28 | 0.1% |
| Danish | 199 | 0.9% |
| Dominican | 3 | 0.0% |
| Dutch | 298 | 1.4% |
| Eastern European | 60 | 0.3% |
| English | 2,173 | 10.3% |
| European | 400 | 1.9% |
| Finnish | 5 | 0.0% |
| French | 352 | 1.7% |
| French American Indian | 2 | 0.0% |
| French Canadian | 19 | 0.1% |
| German | 5,328 | 25.2% |
| Greek | 33 | 0.2% |
| Guatemalan | 8 | 0.0% |
| Hungarian | 24 | 0.1% |
| Indian (Asian) | 37 | 0.2% |
| Irish | 2,243 | 10.6% |
| Italian | 523 | 2.5% |
| Japanese | 24 | 0.1% |
| Korean | 113 | 0.5% |
| Lebanese | 3 | 0.0% |
| Luxembourger | 2 | 0.0% |
| Mexican | 137 | 0.6% |
| Navajo | 12 | 0.1% |
| Nigerian | 10 | 0.1% |
| Northern European | 2 | 0.0% |
| Norwegian | 215 | 1.0% |
| Osage | 1 | 0.0% |
| Panamanian | 2 | 0.0% |
| Pennsylvania German | 12 | 0.1% |
| Polish | 238 | 1.1% |
| Potawatomi | 9 | 0.0% |
| Puerto Rican | 96 | 0.4% |
| Russian | 23 | 0.1% |
| Salvadoran | 15 | 0.1% |
| Samoan | 11 | 0.1% |
| Scandinavian | 32 | 0.2% |
| Scotch-Irish | 180 | 0.9% |
| Scottish | 416 | 2.0% |
| Sioux | 13 | 0.1% |
| Spaniard | 4 | 0.0% |
| Spanish | 8 | 0.0% |
| Sri Lankan | 19 | 0.1% |
| Subsaharan African | 82 | 0.4% |
| Swedish | 184 | 0.9% |
| Swiss | 261 | 1.2% |
| Thai | 97 | 0.5% |
| Turkish | 20 | 0.1% |
| Welsh | 50 | 0.2% | View All 67 Rows |
Immigrants in Nodaway County
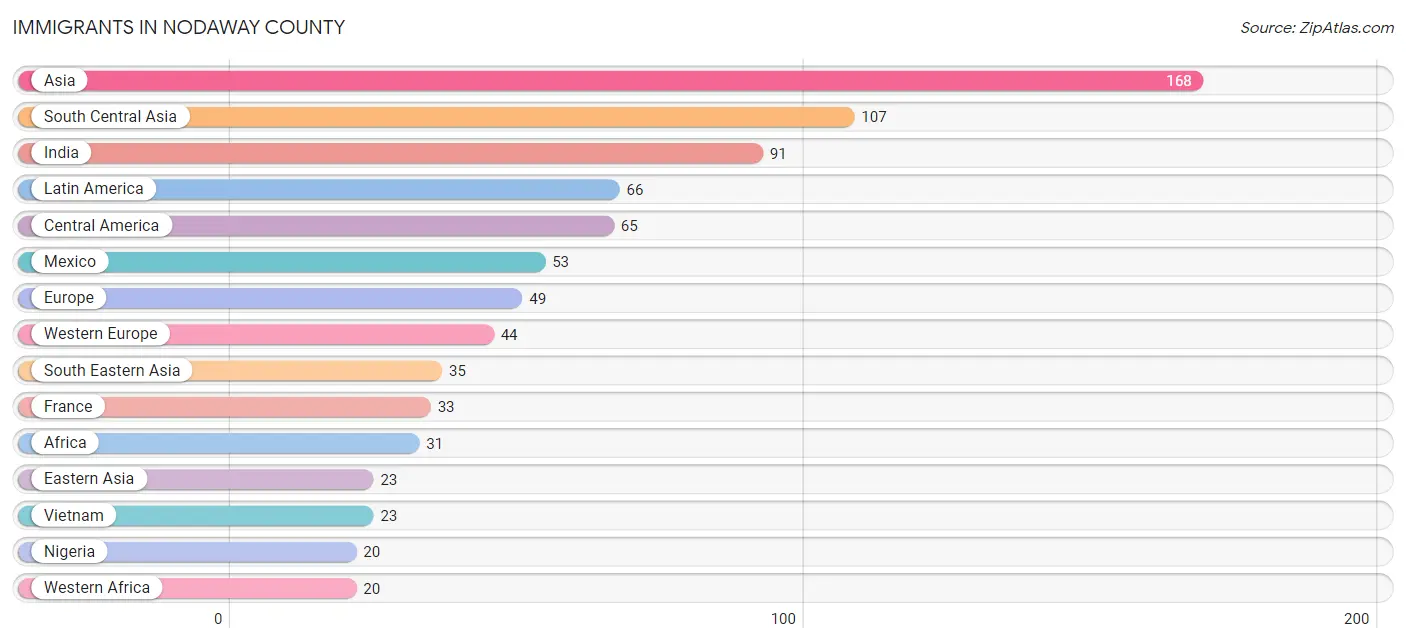
The most numerous immigrant groups reported in Nodaway County came from Asia (168 | 0.8%), South Central Asia (107 | 0.5%), India (91 | 0.4%), Latin America (66 | 0.3%), and Central America (65 | 0.3%), together accounting for 2.4% of all Nodaway County residents.
| Immigration Origin | # Population | % Population |
| Africa | 31 | 0.2% |
| Asia | 168 | 0.8% |
| Canada | 7 | 0.0% |
| Central America | 65 | 0.3% |
| China | 9 | 0.0% |
| Eastern Africa | 2 | 0.0% |
| Eastern Asia | 23 | 0.1% |
| Egypt | 9 | 0.0% |
| El Salvador | 4 | 0.0% |
| England | 3 | 0.0% |
| Ethiopia | 2 | 0.0% |
| Europe | 49 | 0.2% |
| France | 33 | 0.2% |
| Germany | 11 | 0.1% |
| Guatemala | 8 | 0.0% |
| Hong Kong | 6 | 0.0% |
| India | 91 | 0.4% |
| Israel | 3 | 0.0% |
| Japan | 1 | 0.0% |
| Korea | 13 | 0.1% |
| Latin America | 66 | 0.3% |
| Mexico | 53 | 0.3% |
| Nepal | 16 | 0.1% |
| Nigeria | 20 | 0.1% |
| Northern Africa | 9 | 0.0% |
| Northern Europe | 5 | 0.0% |
| Philippines | 12 | 0.1% |
| South America | 1 | 0.0% |
| South Central Asia | 107 | 0.5% |
| South Eastern Asia | 35 | 0.2% |
| Vietnam | 23 | 0.1% |
| Western Africa | 20 | 0.1% |
| Western Asia | 3 | 0.0% |
| Western Europe | 44 | 0.2% | View All 34 Rows |
Sex and Age in Nodaway County
Sex and Age in Nodaway County
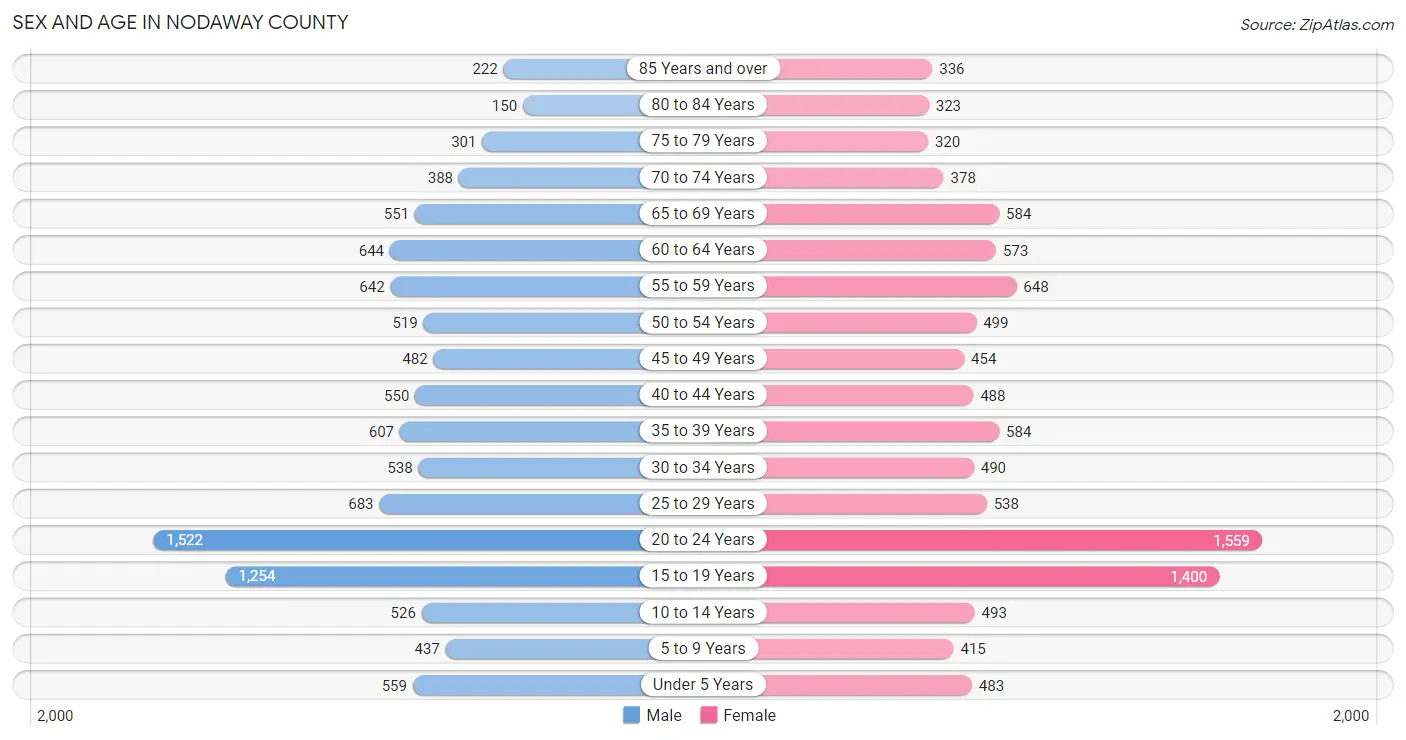
The most populous age groups in Nodaway County are 20 to 24 Years (1,522 | 14.4%) for men and 20 to 24 Years (1,559 | 14.8%) for women.
| Age Bracket | Male | Female |
| Under 5 Years | 559 (5.3%) | 483 (4.6%) |
| 5 to 9 Years | 437 (4.1%) | 415 (3.9%) |
| 10 to 14 Years | 526 (5.0%) | 493 (4.7%) |
| 15 to 19 Years | 1,254 (11.9%) | 1,400 (13.3%) |
| 20 to 24 Years | 1,522 (14.4%) | 1,559 (14.8%) |
| 25 to 29 Years | 683 (6.5%) | 538 (5.1%) |
| 30 to 34 Years | 538 (5.1%) | 490 (4.6%) |
| 35 to 39 Years | 607 (5.7%) | 584 (5.5%) |
| 40 to 44 Years | 550 (5.2%) | 488 (4.6%) |
| 45 to 49 Years | 482 (4.6%) | 454 (4.3%) |
| 50 to 54 Years | 519 (4.9%) | 499 (4.7%) |
| 55 to 59 Years | 642 (6.1%) | 648 (6.1%) |
| 60 to 64 Years | 644 (6.1%) | 573 (5.4%) |
| 65 to 69 Years | 551 (5.2%) | 584 (5.5%) |
| 70 to 74 Years | 388 (3.7%) | 378 (3.6%) |
| 75 to 79 Years | 301 (2.9%) | 320 (3.0%) |
| 80 to 84 Years | 150 (1.4%) | 323 (3.1%) |
| 85 Years and over | 222 (2.1%) | 336 (3.2%) |
| Total | 10,575 (100.0%) | 10,565 (100.0%) |
Families and Households in Nodaway County
Median Family Size in Nodaway County
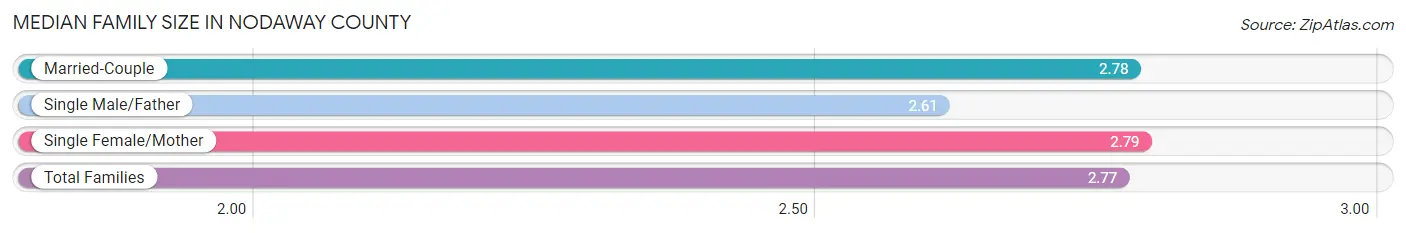
The median family size in Nodaway County is 2.77 persons per family, with single female/mother families (661 | 14.2%) accounting for the largest median family size of 2.79 persons per family. On the other hand, single male/father families (309 | 6.7%) represent the smallest median family size with 2.61 persons per family.
| Family Type | # Families | Family Size |
| Married-Couple | 3,668 (79.1%) | 2.78 |
| Single Male/Father | 309 (6.7%) | 2.61 |
| Single Female/Mother | 661 (14.2%) | 2.79 |
| Total Families | 4,638 (100.0%) | 2.77 |
Median Household Size in Nodaway County
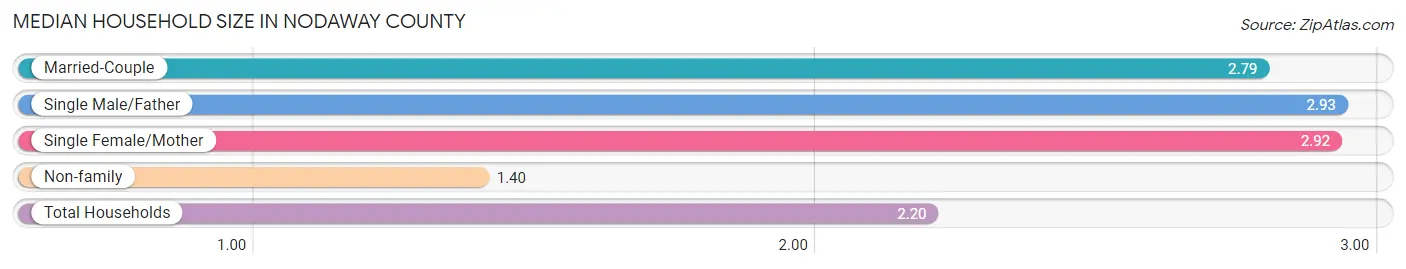
The median household size in Nodaway County is 2.20 persons per household, with single male/father households (309 | 3.7%) accounting for the largest median household size of 2.93 persons per household. non-family households (3,623 | 43.9%) represent the smallest median household size with 1.40 persons per household.
| Household Type | # Households | Household Size |
| Married-Couple | 3,668 (44.4%) | 2.79 |
| Single Male/Father | 309 (3.7%) | 2.93 |
| Single Female/Mother | 661 (8.0%) | 2.92 |
| Non-family | 3,623 (43.9%) | 1.40 |
| Total Households | 8,261 (100.0%) | 2.20 |
Household Size by Marriage Status in Nodaway County
Out of a total of 8,261 households in Nodaway County, 4,638 (56.1%) are family households, while 3,623 (43.9%) are nonfamily households. The most numerous type of family households are 2-person households, comprising 2,566, and the most common type of nonfamily households are 1-person households, comprising 2,696.
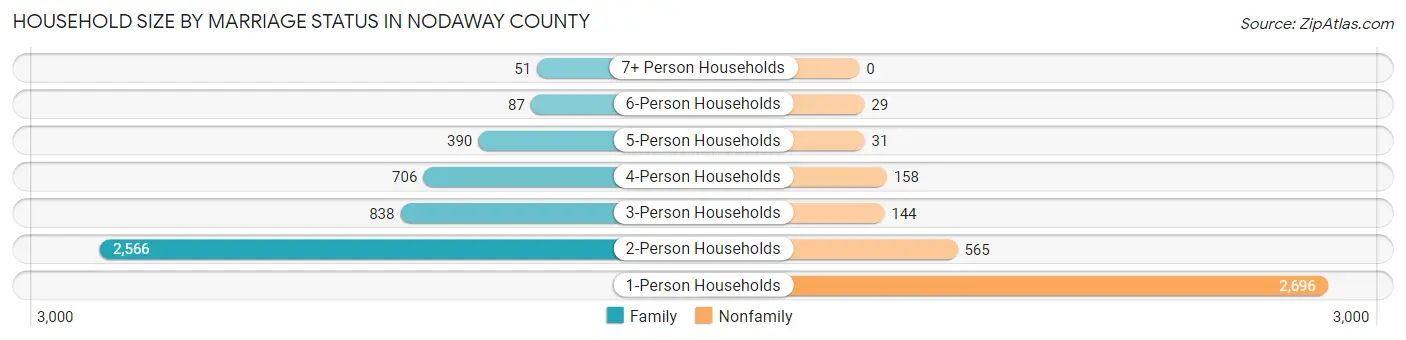
| Household Size | Family Households | Nonfamily Households |
| 1-Person Households | - | 2,696 (32.6%) |
| 2-Person Households | 2,566 (31.1%) | 565 (6.8%) |
| 3-Person Households | 838 (10.1%) | 144 (1.7%) |
| 4-Person Households | 706 (8.6%) | 158 (1.9%) |
| 5-Person Households | 390 (4.7%) | 31 (0.4%) |
| 6-Person Households | 87 (1.1%) | 29 (0.4%) |
| 7+ Person Households | 51 (0.6%) | 0 (0.0%) |
| Total | 4,638 (56.1%) | 3,623 (43.9%) |
Female Fertility in Nodaway County
Fertility by Age in Nodaway County
Average fertility rate in Nodaway County is 62.0 births per 1,000 women. Women in the age bracket of 20 to 34 years have the highest fertility rate with 115.0 births per 1,000 women. Women in the age bracket of 20 to 34 years acount for 86.9% of all women with births.
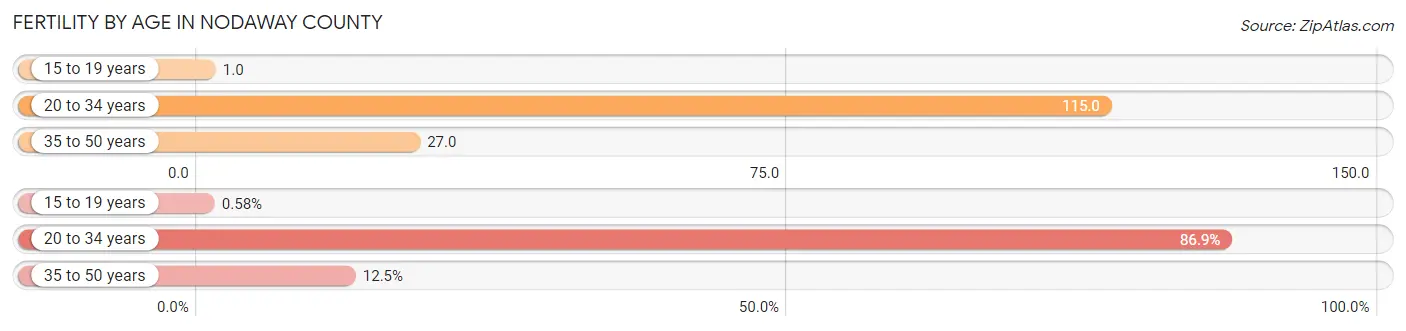
| Age Bracket | Women with Births | Births / 1,000 Women |
| 15 to 19 years | 2 (0.6%) | 1.0 |
| 20 to 34 years | 298 (86.9%) | 115.0 |
| 35 to 50 years | 43 (12.5%) | 27.0 |
| Total | 343 (100.0%) | 62.0 |
Fertility by Age by Marriage Status in Nodaway County
69.1% of women with births (343) in Nodaway County are married. The highest percentage of unmarried women with births falls into 15 to 19 years age bracket with 100.0% of them unmarried at the time of birth, while the lowest percentage of unmarried women with births belong to 35 to 50 years age bracket with 2.3% of them unmarried.
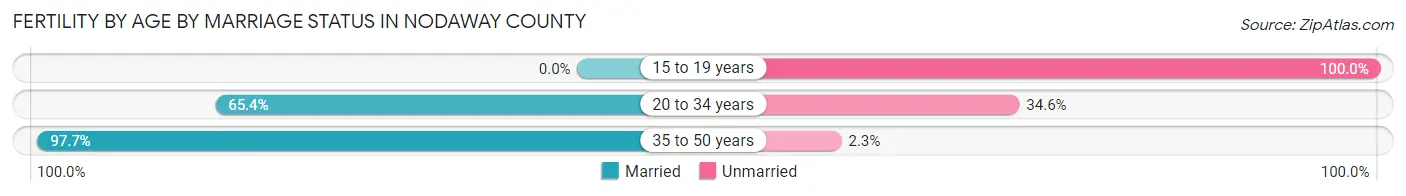
| Age Bracket | Married | Unmarried |
| 15 to 19 years | 0 (0.0%) | 2 (100.0%) |
| 20 to 34 years | 195 (65.4%) | 103 (34.6%) |
| 35 to 50 years | 42 (97.7%) | 1 (2.3%) |
| Total | 237 (69.1%) | 106 (30.9%) |
Fertility by Education in Nodaway County
Average fertility rate in Nodaway County is 62.0 births per 1,000 women. Women with the education attainment of high school diploma have the highest fertility rate of 133.0 births per 1,000 women, while women with the education attainment of less than high school have the lowest fertility at 17.0 births per 1,000 women. Women with the education attainment of high school diploma represent 44.6% of all women with births.
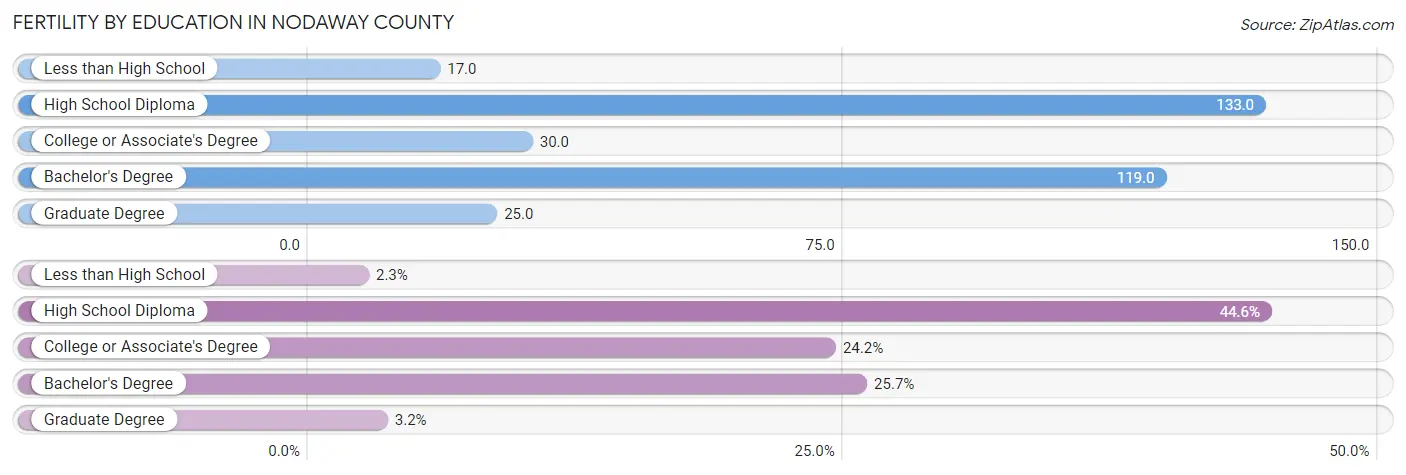
| Educational Attainment | Women with Births | Births / 1,000 Women |
| Less than High School | 8 (2.3%) | 17.0 |
| High School Diploma | 153 (44.6%) | 133.0 |
| College or Associate's Degree | 83 (24.2%) | 30.0 |
| Bachelor's Degree | 88 (25.7%) | 119.0 |
| Graduate Degree | 11 (3.2%) | 25.0 |
| Total | 343 (100.0%) | 62.0 |
Fertility by Education by Marriage Status in Nodaway County
30.9% of women with births in Nodaway County are unmarried. Women with the educational attainment of less than high school are most likely to be married with 100.0% of them married at childbirth, while women with the educational attainment of college or associate's degree are least likely to be married with 37.3% of them unmarried at childbirth.
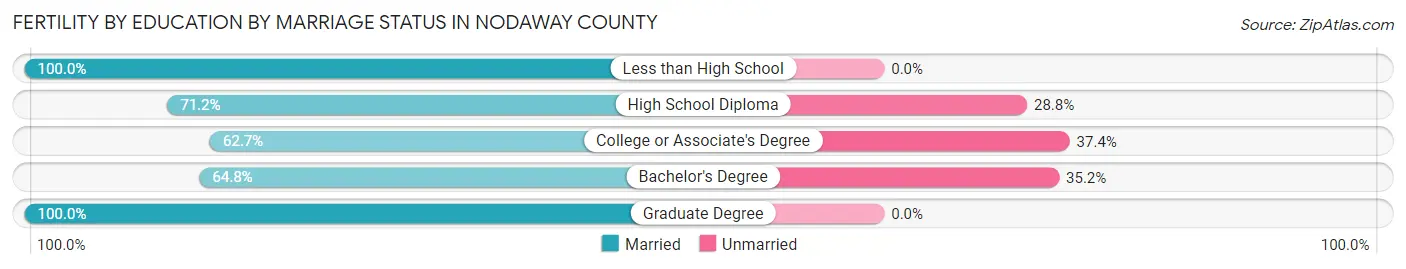
| Educational Attainment | Married | Unmarried |
| Less than High School | 8 (100.0%) | 0 (0.0%) |
| High School Diploma | 109 (71.2%) | 44 (28.8%) |
| College or Associate's Degree | 52 (62.6%) | 31 (37.3%) |
| Bachelor's Degree | 57 (64.8%) | 31 (35.2%) |
| Graduate Degree | 11 (100.0%) | 0 (0.0%) |
| Total | 237 (69.1%) | 106 (30.9%) |
Employment Characteristics in Nodaway County
Employment by Class of Employer in Nodaway County
Among the 9,880 employed individuals in Nodaway County, private company employees (6,057 | 61.3%), state government employees (1,060 | 10.7%), and self-employed (not incorporated) (893 | 9.0%) make up the most common classes of employment.
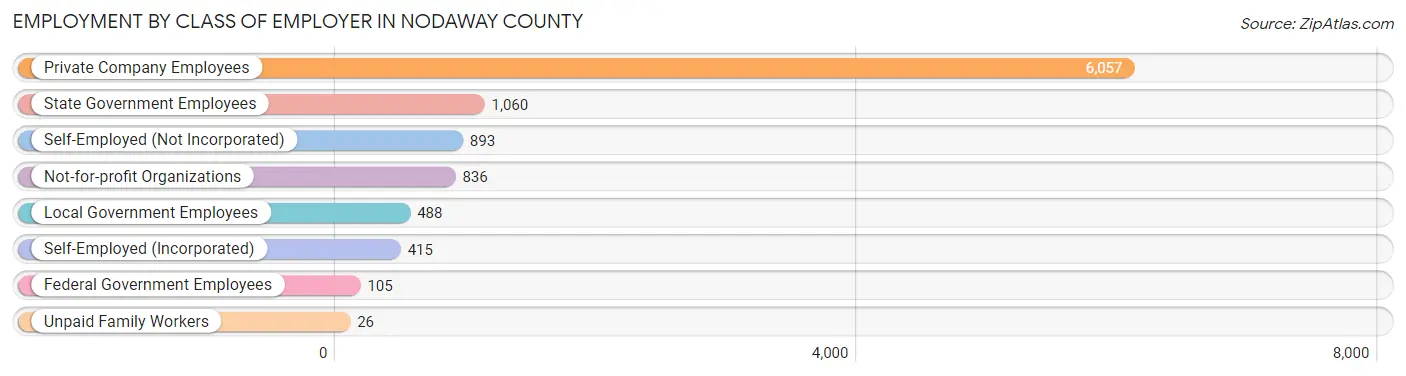
| Employer Class | # Employees | % Employees |
| Private Company Employees | 6,057 | 61.3% |
| Self-Employed (Incorporated) | 415 | 4.2% |
| Self-Employed (Not Incorporated) | 893 | 9.0% |
| Not-for-profit Organizations | 836 | 8.5% |
| Local Government Employees | 488 | 4.9% |
| State Government Employees | 1,060 | 10.7% |
| Federal Government Employees | 105 | 1.1% |
| Unpaid Family Workers | 26 | 0.3% |
| Total | 9,880 | 100.0% |
Employment Status by Age in Nodaway County
According to the labor force statistics for Nodaway County, out of the total population over 16 years of age (18,088), 56.7% or 10,256 individuals are in the labor force, with 2.3% or 236 of them unemployed. The age group with the highest labor force participation rate is 25 to 29 years, with 86.7% or 1,059 individuals in the labor force. Within the labor force, the 16 to 19 years age range has the highest percentage of unemployed individuals, with 6.5% or 53 of them being unemployed.
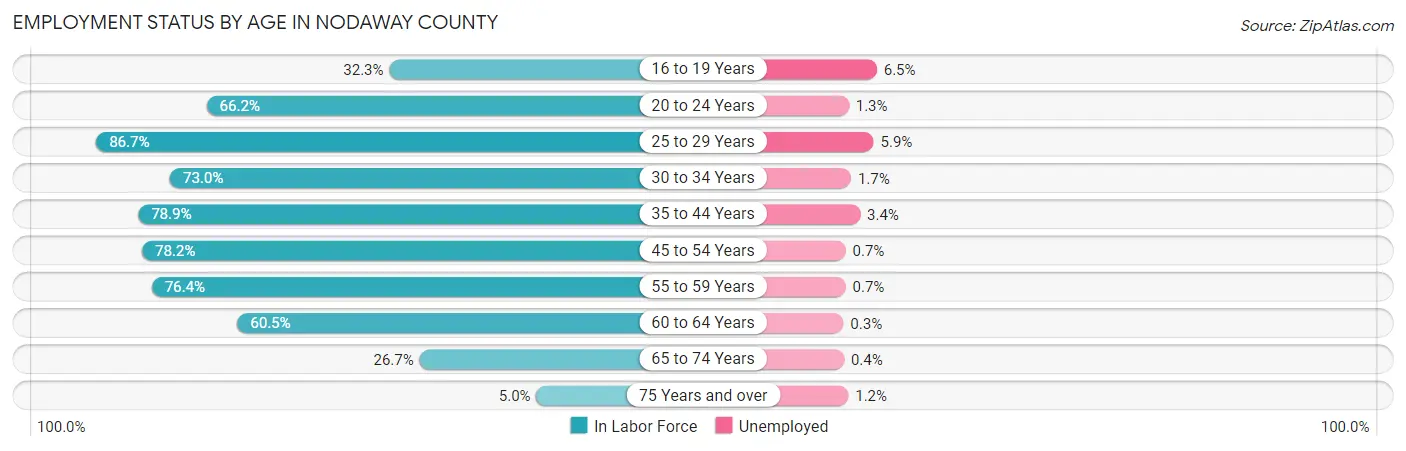
| Age Bracket | In Labor Force | Unemployed |
| 16 to 19 Years | 812 (32.3%) | 53 (6.5%) |
| 20 to 24 Years | 2,040 (66.2%) | 27 (1.3%) |
| 25 to 29 Years | 1,059 (86.7%) | 62 (5.9%) |
| 30 to 34 Years | 750 (73.0%) | 13 (1.7%) |
| 35 to 44 Years | 1,759 (78.9%) | 60 (3.4%) |
| 45 to 54 Years | 1,528 (78.2%) | 11 (0.7%) |
| 55 to 59 Years | 986 (76.4%) | 7 (0.7%) |
| 60 to 64 Years | 736 (60.5%) | 2 (0.3%) |
| 65 to 74 Years | 508 (26.7%) | 2 (0.4%) |
| 75 Years and over | 83 (5.0%) | 1 (1.2%) |
| Total | 10,256 (56.7%) | 236 (2.3%) |
Employment Status by Educational Attainment in Nodaway County
According to labor force statistics for Nodaway County, 76.3% of individuals (6,820) out of the total population between 25 and 64 years of age (8,939) are in the labor force, with 2.3% or 157 of them being unemployed. The group with the highest labor force participation rate are those with the educational attainment of bachelor's degree or higher, with 87.3% or 2,200 individuals in the labor force. Within the labor force, individuals with college / associate degree education have the highest percentage of unemployment, with 3.4% or 71 of them being unemployed.
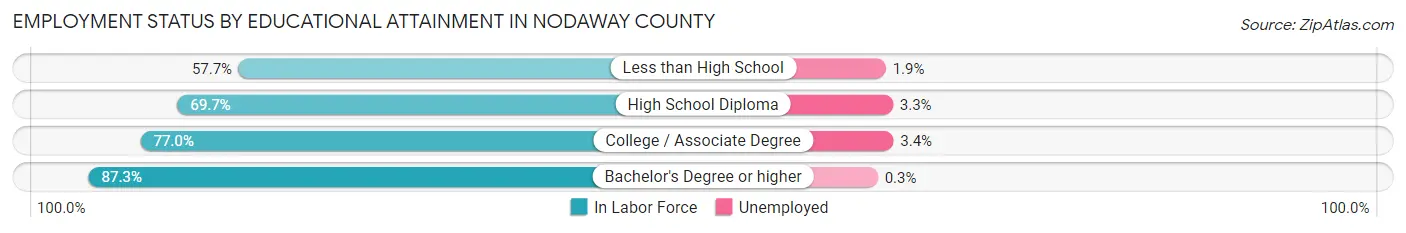
| Educational Attainment | In Labor Force | Unemployed |
| Less than High School | 259 (57.7%) | 9 (1.9%) |
| High School Diploma | 2,275 (69.7%) | 108 (3.3%) |
| College / Associate Degree | 2,084 (77.0%) | 92 (3.4%) |
| Bachelor's Degree or higher | 2,200 (87.3%) | 8 (0.3%) |
| Total | 6,820 (76.3%) | 206 (2.3%) |
Employment Occupations by Sex in Nodaway County
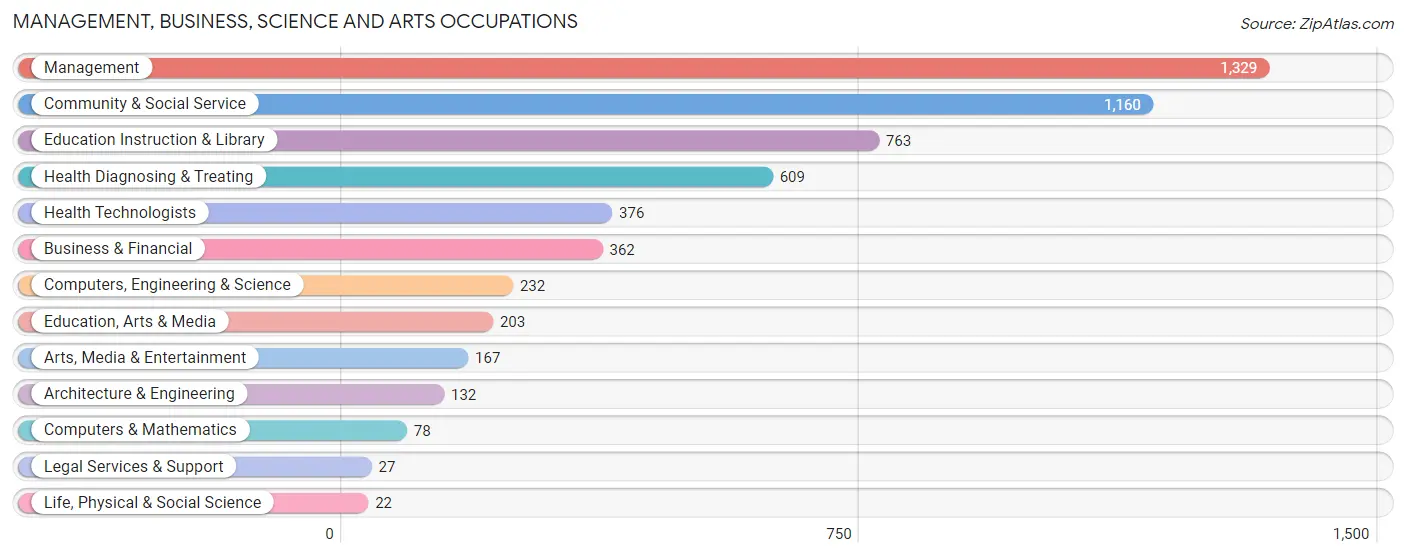
Management, Business, Science and Arts Occupations
The most common Management, Business, Science and Arts occupations in Nodaway County are Management (1,329 | 13.3%), Community & Social Service (1,160 | 11.6%), Education Instruction & Library (763 | 7.6%), Health Diagnosing & Treating (609 | 6.1%), and Health Technologists (376 | 3.8%).
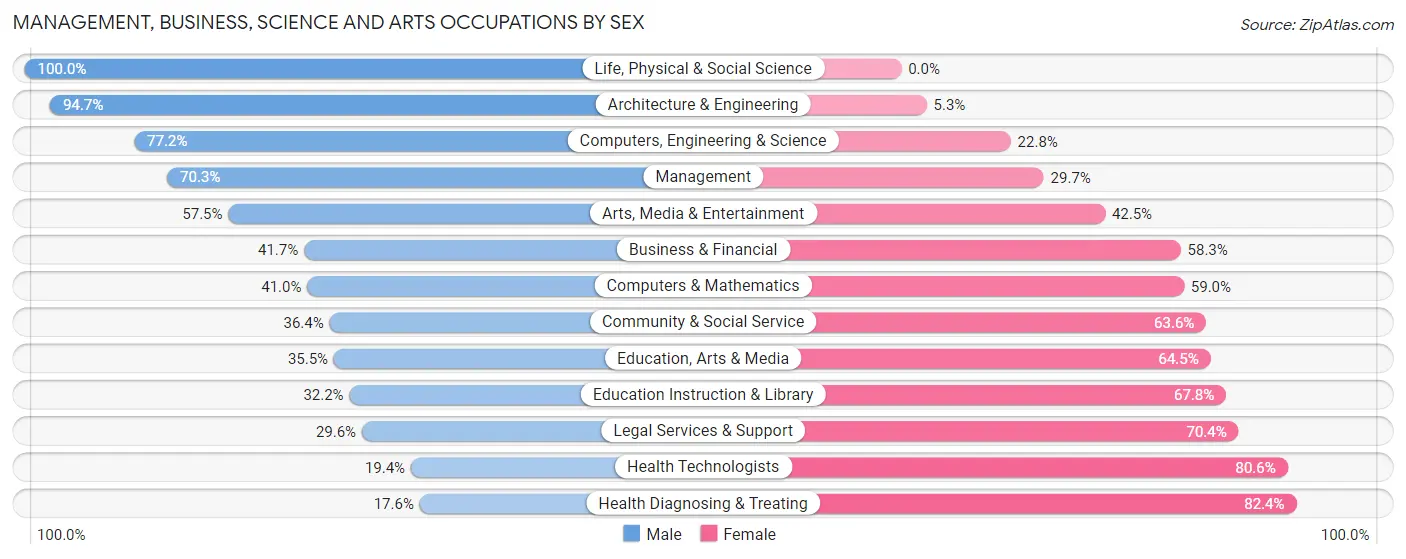
Management, Business, Science and Arts Occupations by Sex
Within the Management, Business, Science and Arts occupations in Nodaway County, the most male-oriented occupations are Life, Physical & Social Science (100.0%), Architecture & Engineering (94.7%), and Computers, Engineering & Science (77.2%), while the most female-oriented occupations are Health Diagnosing & Treating (82.4%), Health Technologists (80.6%), and Legal Services & Support (70.4%).
| Occupation | Male | Female |
| Management | 934 (70.3%) | 395 (29.7%) |
| Business & Financial | 151 (41.7%) | 211 (58.3%) |
| Computers, Engineering & Science | 179 (77.2%) | 53 (22.8%) |
| Computers & Mathematics | 32 (41.0%) | 46 (59.0%) |
| Architecture & Engineering | 125 (94.7%) | 7 (5.3%) |
| Life, Physical & Social Science | 22 (100.0%) | 0 (0.0%) |
| Community & Social Service | 422 (36.4%) | 738 (63.6%) |
| Education, Arts & Media | 72 (35.5%) | 131 (64.5%) |
| Legal Services & Support | 8 (29.6%) | 19 (70.4%) |
| Education Instruction & Library | 246 (32.2%) | 517 (67.8%) |
| Arts, Media & Entertainment | 96 (57.5%) | 71 (42.5%) |
| Health Diagnosing & Treating | 107 (17.6%) | 502 (82.4%) |
| Health Technologists | 73 (19.4%) | 303 (80.6%) |
| Total (Category) | 1,793 (48.6%) | 1,899 (51.4%) |
| Total (Overall) | 5,285 (52.8%) | 4,723 (47.2%) |
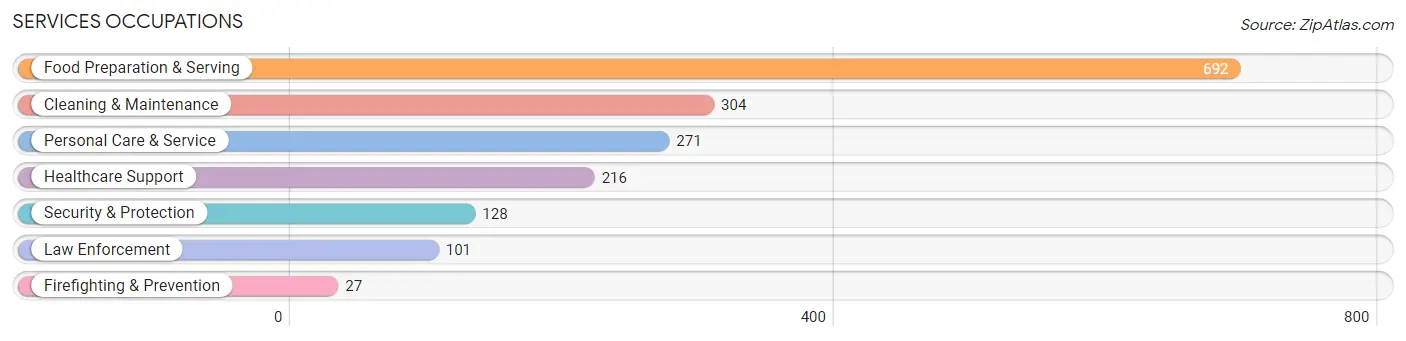
Services Occupations
The most common Services occupations in Nodaway County are Food Preparation & Serving (692 | 6.9%), Cleaning & Maintenance (304 | 3.0%), Personal Care & Service (271 | 2.7%), Healthcare Support (216 | 2.2%), and Security & Protection (128 | 1.3%).
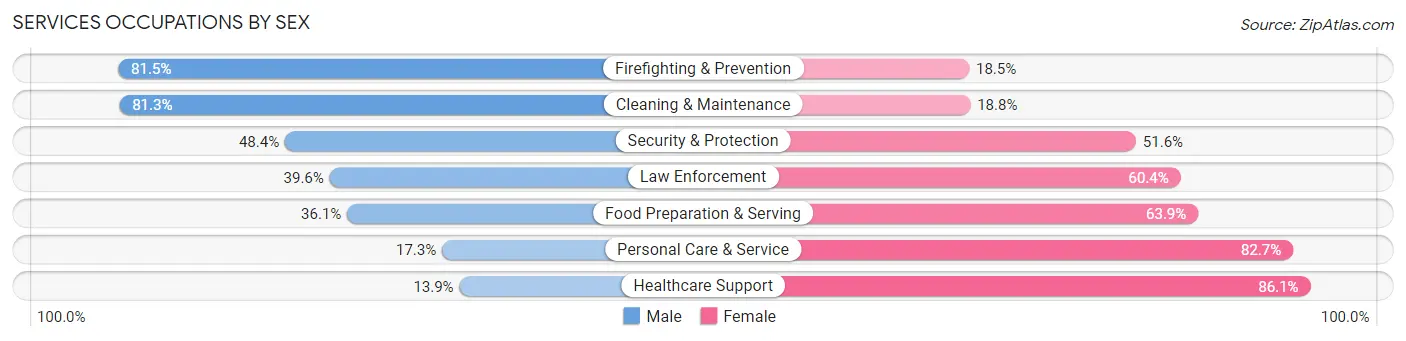
Services Occupations by Sex
Within the Services occupations in Nodaway County, the most male-oriented occupations are Firefighting & Prevention (81.5%), Cleaning & Maintenance (81.2%), and Security & Protection (48.4%), while the most female-oriented occupations are Healthcare Support (86.1%), Personal Care & Service (82.7%), and Food Preparation & Serving (63.9%).
| Occupation | Male | Female |
| Healthcare Support | 30 (13.9%) | 186 (86.1%) |
| Security & Protection | 62 (48.4%) | 66 (51.6%) |
| Firefighting & Prevention | 22 (81.5%) | 5 (18.5%) |
| Law Enforcement | 40 (39.6%) | 61 (60.4%) |
| Food Preparation & Serving | 250 (36.1%) | 442 (63.9%) |
| Cleaning & Maintenance | 247 (81.2%) | 57 (18.8%) |
| Personal Care & Service | 47 (17.3%) | 224 (82.7%) |
| Total (Category) | 636 (39.5%) | 975 (60.5%) |
| Total (Overall) | 5,285 (52.8%) | 4,723 (47.2%) |
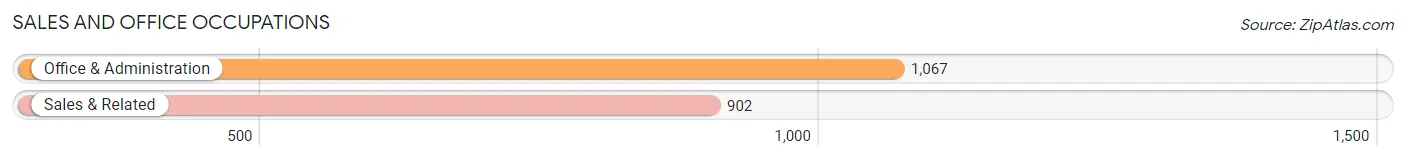
Sales and Office Occupations
The most common Sales and Office occupations in Nodaway County are Office & Administration (1,067 | 10.7%), and Sales & Related (902 | 9.0%).
Sales and Office Occupations by Sex
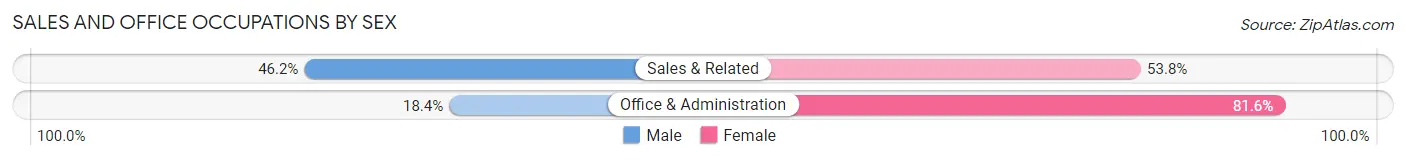
| Occupation | Male | Female |
| Sales & Related | 417 (46.2%) | 485 (53.8%) |
| Office & Administration | 196 (18.4%) | 871 (81.6%) |
| Total (Category) | 613 (31.1%) | 1,356 (68.9%) |
| Total (Overall) | 5,285 (52.8%) | 4,723 (47.2%) |
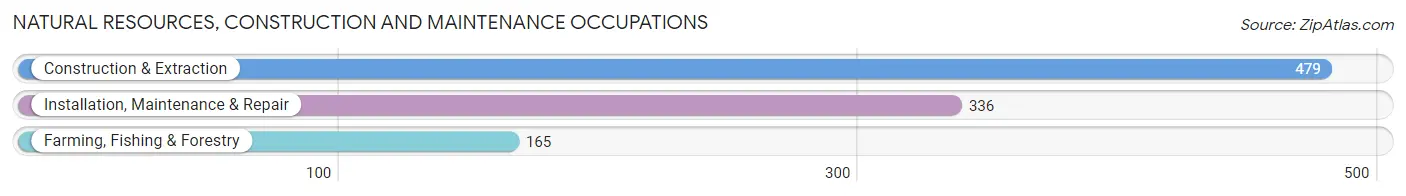
Natural Resources, Construction and Maintenance Occupations
The most common Natural Resources, Construction and Maintenance occupations in Nodaway County are Construction & Extraction (479 | 4.8%), Installation, Maintenance & Repair (336 | 3.4%), and Farming, Fishing & Forestry (165 | 1.7%).
Natural Resources, Construction and Maintenance Occupations by Sex
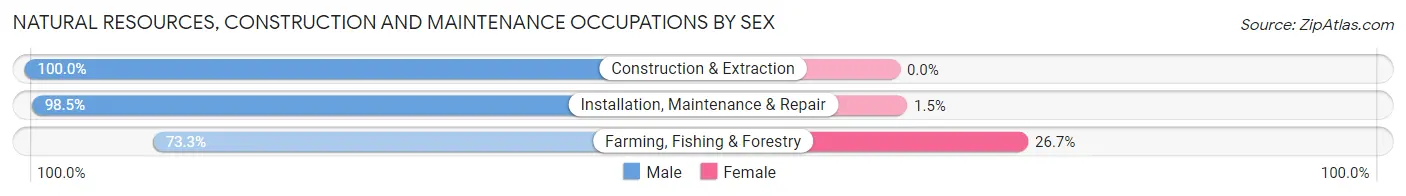
| Occupation | Male | Female |
| Farming, Fishing & Forestry | 121 (73.3%) | 44 (26.7%) |
| Construction & Extraction | 479 (100.0%) | 0 (0.0%) |
| Installation, Maintenance & Repair | 331 (98.5%) | 5 (1.5%) |
| Total (Category) | 931 (95.0%) | 49 (5.0%) |
| Total (Overall) | 5,285 (52.8%) | 4,723 (47.2%) |
Production, Transportation and Moving Occupations
The most common Production, Transportation and Moving occupations in Nodaway County are Production (890 | 8.9%), Material Moving (514 | 5.1%), and Transportation (352 | 3.5%).
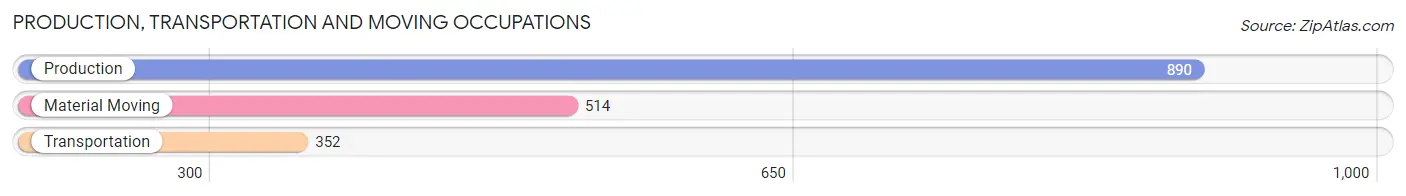
Production, Transportation and Moving Occupations by Sex
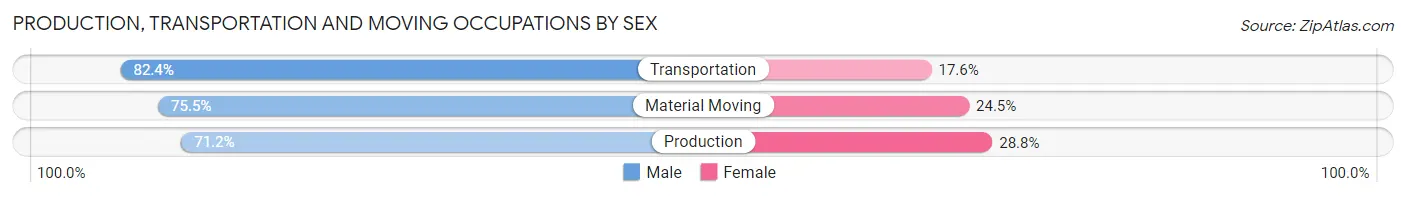
| Occupation | Male | Female |
| Production | 634 (71.2%) | 256 (28.8%) |
| Transportation | 290 (82.4%) | 62 (17.6%) |
| Material Moving | 388 (75.5%) | 126 (24.5%) |
| Total (Category) | 1,312 (74.7%) | 444 (25.3%) |
| Total (Overall) | 5,285 (52.8%) | 4,723 (47.2%) |
Employment Industries by Sex in Nodaway County
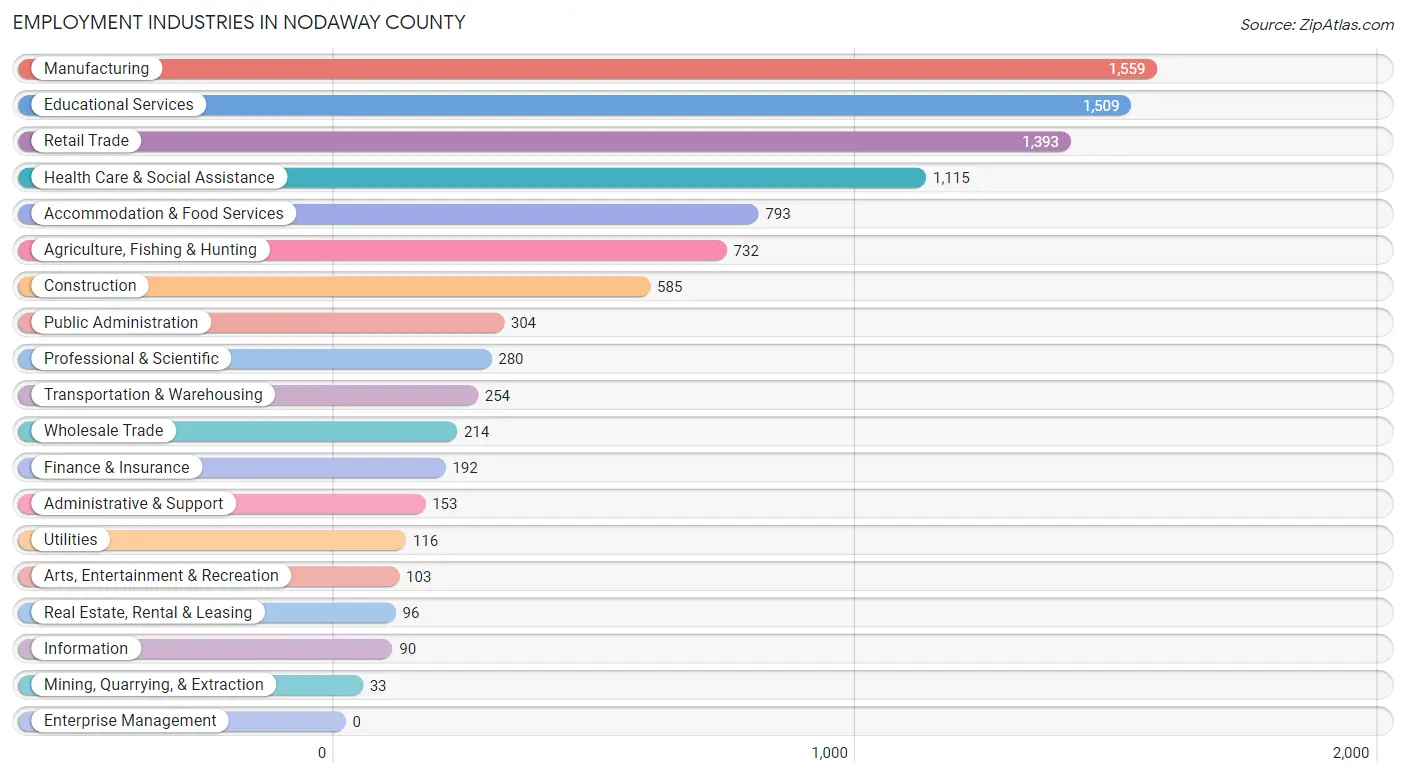
Employment Industries in Nodaway County
The major employment industries in Nodaway County include Manufacturing (1,559 | 15.6%), Educational Services (1,509 | 15.1%), Retail Trade (1,393 | 13.9%), Health Care & Social Assistance (1,115 | 11.1%), and Accommodation & Food Services (793 | 7.9%).
Employment Industries by Sex in Nodaway County
The Nodaway County industries that see more men than women are Mining, Quarrying, & Extraction (100.0%), Construction (94.4%), and Information (88.9%), whereas the industries that tend to have a higher number of women are Health Care & Social Assistance (86.4%), Finance & Insurance (78.6%), and Educational Services (72.2%).
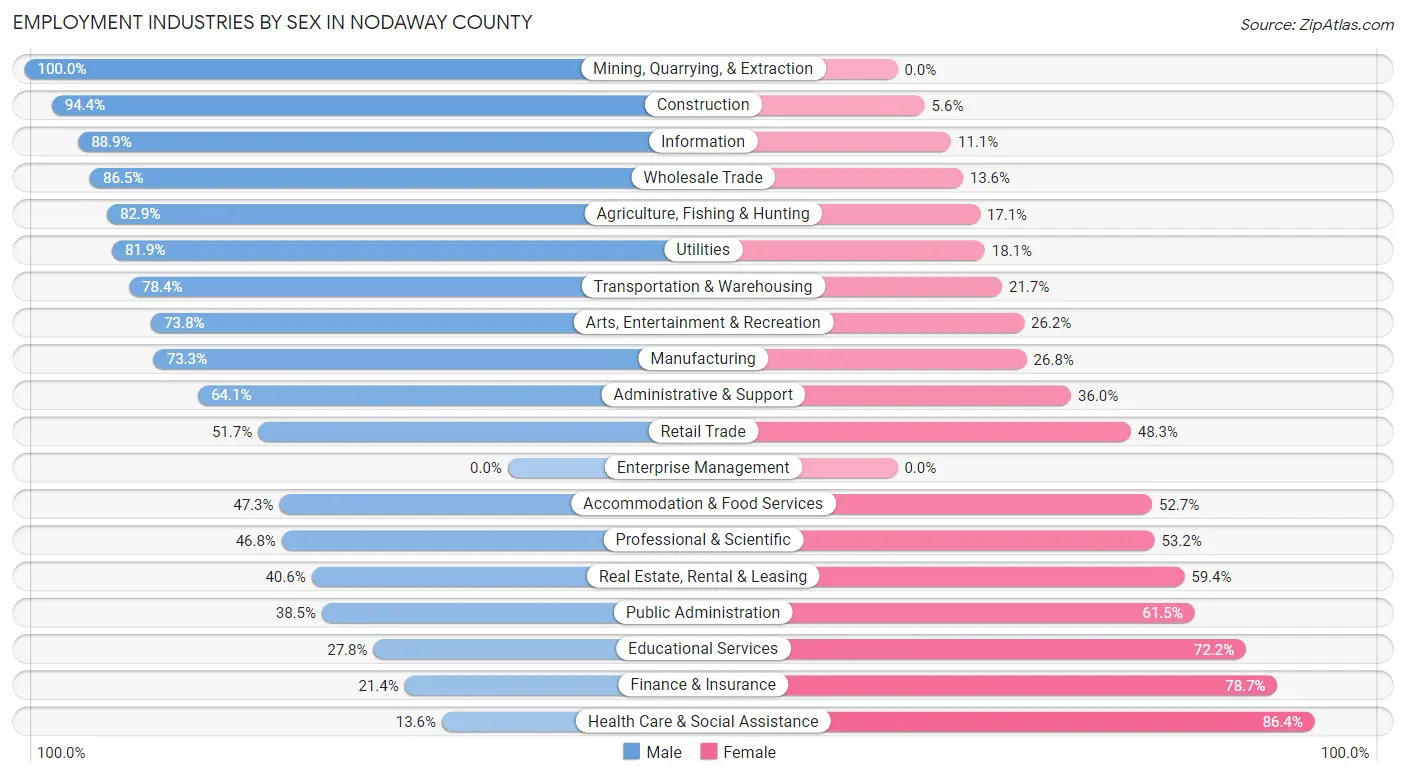
| Industry | Male | Female |
| Agriculture, Fishing & Hunting | 607 (82.9%) | 125 (17.1%) |
| Mining, Quarrying, & Extraction | 33 (100.0%) | 0 (0.0%) |
| Construction | 552 (94.4%) | 33 (5.6%) |
| Manufacturing | 1,142 (73.3%) | 417 (26.8%) |
| Wholesale Trade | 185 (86.5%) | 29 (13.6%) |
| Retail Trade | 720 (51.7%) | 673 (48.3%) |
| Transportation & Warehousing | 199 (78.3%) | 55 (21.6%) |
| Utilities | 95 (81.9%) | 21 (18.1%) |
| Information | 80 (88.9%) | 10 (11.1%) |
| Finance & Insurance | 41 (21.3%) | 151 (78.6%) |
| Real Estate, Rental & Leasing | 39 (40.6%) | 57 (59.4%) |
| Professional & Scientific | 131 (46.8%) | 149 (53.2%) |
| Enterprise Management | 0 (0.0%) | 0 (0.0%) |
| Administrative & Support | 98 (64.0%) | 55 (35.9%) |
| Educational Services | 420 (27.8%) | 1,089 (72.2%) |
| Health Care & Social Assistance | 152 (13.6%) | 963 (86.4%) |
| Arts, Entertainment & Recreation | 76 (73.8%) | 27 (26.2%) |
| Accommodation & Food Services | 375 (47.3%) | 418 (52.7%) |
| Public Administration | 117 (38.5%) | 187 (61.5%) |
| Total | 5,285 (52.8%) | 4,723 (47.2%) |
Education in Nodaway County
School Enrollment in Nodaway County
The most common levels of schooling among the 7,193 students in Nodaway County are college / undergraduate (4,120 | 57.3%), middle school (845 | 11.7%), and high school (837 | 11.6%).
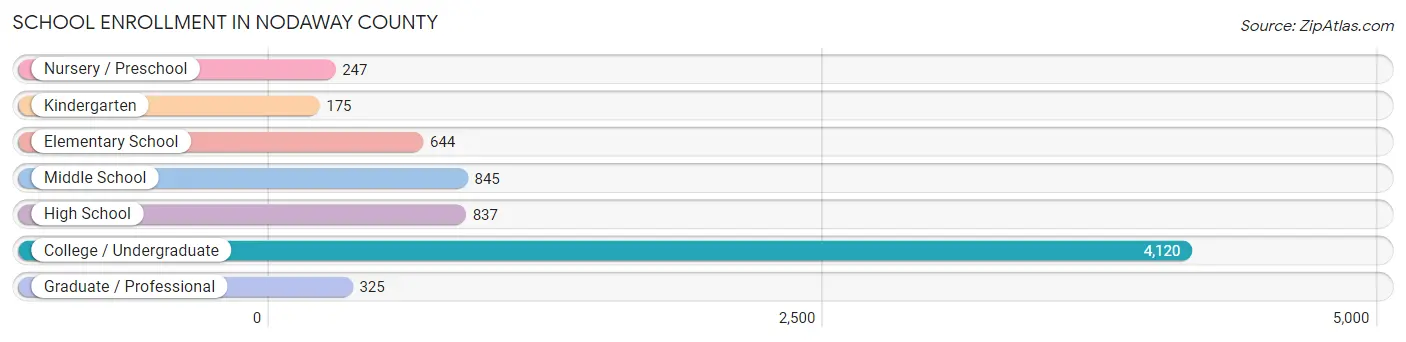
| School Level | # Students | % Students |
| Nursery / Preschool | 247 | 3.4% |
| Kindergarten | 175 | 2.4% |
| Elementary School | 644 | 8.9% |
| Middle School | 845 | 11.7% |
| High School | 837 | 11.6% |
| College / Undergraduate | 4,120 | 57.3% |
| Graduate / Professional | 325 | 4.5% |
| Total | 7,193 | 100.0% |
School Enrollment by Age by Funding Source in Nodaway County
Out of a total of 7,193 students who are enrolled in schools in Nodaway County, 575 (8.0%) attend a private institution, while the remaining 6,618 (92.0%) are enrolled in public schools. The age group of 3 to 4 year olds has the highest likelihood of being enrolled in private schools, with 61 (33.5% in the age bracket) enrolled. Conversely, the age group of 18 to 19 year olds has the lowest likelihood of being enrolled in a private school, with 1,824 (98.6% in the age bracket) attending a public institution.
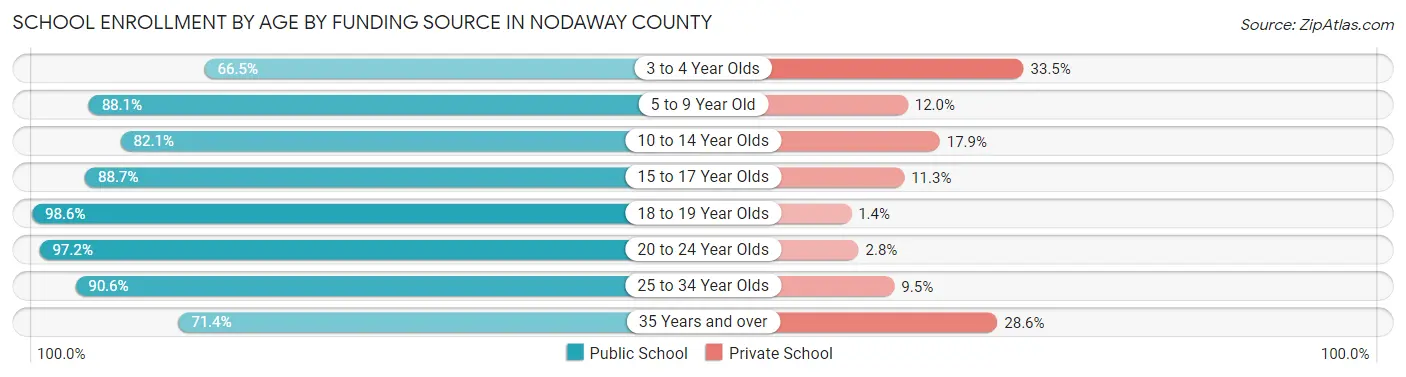
| Age Bracket | Public School | Private School |
| 3 to 4 Year Olds | 121 (66.5%) | 61 (33.5%) |
| 5 to 9 Year Old | 722 (88.0%) | 98 (11.9%) |
| 10 to 14 Year Olds | 821 (82.1%) | 179 (17.9%) |
| 15 to 17 Year Olds | 511 (88.7%) | 65 (11.3%) |
| 18 to 19 Year Olds | 1,824 (98.6%) | 26 (1.4%) |
| 20 to 24 Year Olds | 2,272 (97.2%) | 65 (2.8%) |
| 25 to 34 Year Olds | 182 (90.5%) | 19 (9.5%) |
| 35 Years and over | 162 (71.4%) | 65 (28.6%) |
| Total | 6,618 (92.0%) | 575 (8.0%) |
Educational Attainment by Field of Study in Nodaway County
Education (910 | 25.9%), bio, nature & agricultural (489 | 13.9%), business (472 | 13.4%), arts & humanities (292 | 8.3%), and science & technology (263 | 7.5%) are the most common fields of study among 3,514 individuals in Nodaway County who have obtained a bachelor's degree or higher.
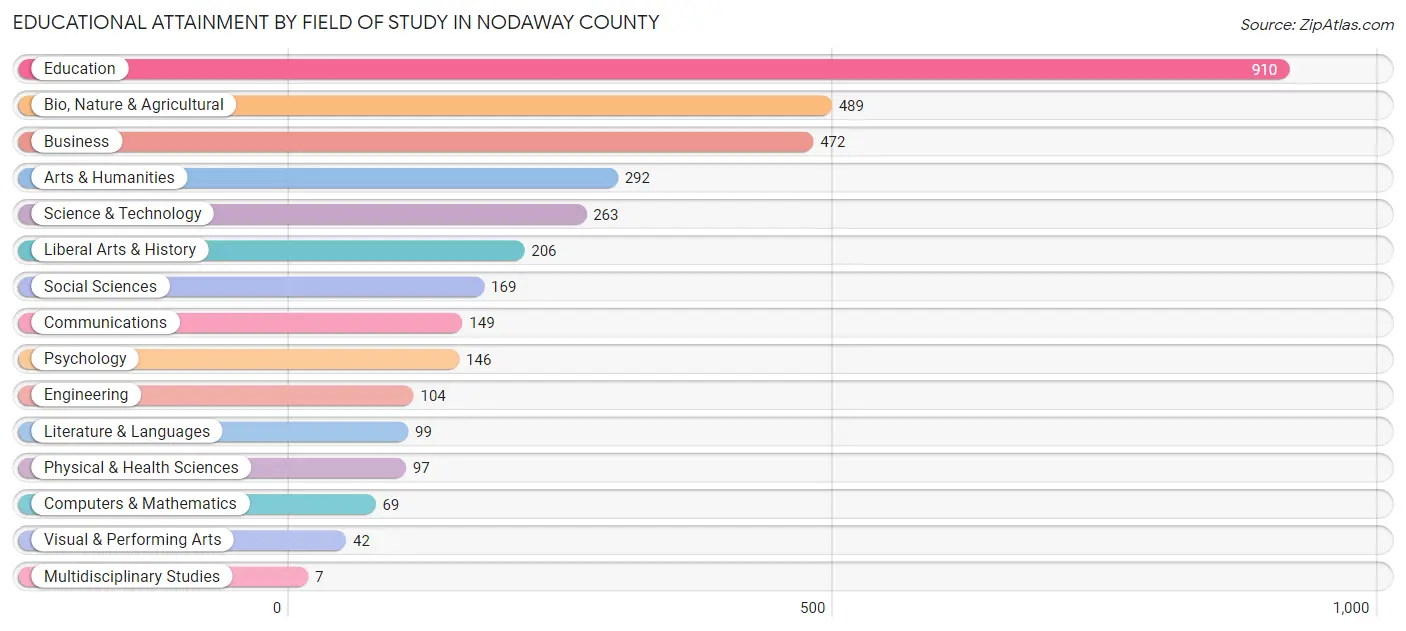
| Field of Study | # Graduates | % Graduates |
| Computers & Mathematics | 69 | 2.0% |
| Bio, Nature & Agricultural | 489 | 13.9% |
| Physical & Health Sciences | 97 | 2.8% |
| Psychology | 146 | 4.2% |
| Social Sciences | 169 | 4.8% |
| Engineering | 104 | 3.0% |
| Multidisciplinary Studies | 7 | 0.2% |
| Science & Technology | 263 | 7.5% |
| Business | 472 | 13.4% |
| Education | 910 | 25.9% |
| Literature & Languages | 99 | 2.8% |
| Liberal Arts & History | 206 | 5.9% |
| Visual & Performing Arts | 42 | 1.2% |
| Communications | 149 | 4.2% |
| Arts & Humanities | 292 | 8.3% |
| Total | 3,514 | 100.0% |
Transportation & Commute in Nodaway County
Vehicle Availability by Sex in Nodaway County
The most prevalent vehicle ownership categories in Nodaway County are males with 2 vehicles (1,988, accounting for 39.6%) and females with 2 vehicles (1,555, making up 46.0%).
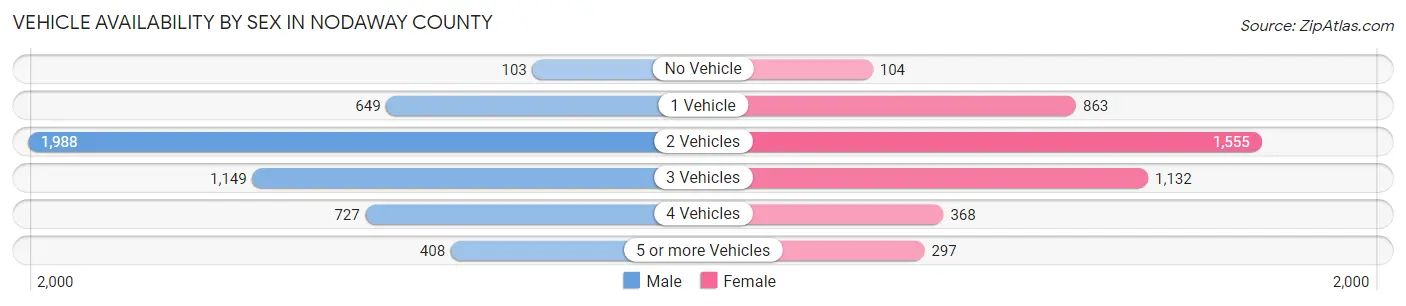
| Vehicles Available | Male | Female |
| No Vehicle | 103 (2.1%) | 104 (2.4%) |
| 1 Vehicle | 649 (12.9%) | 863 (20.0%) |
| 2 Vehicles | 1,988 (39.6%) | 1,555 (36.0%) |
| 3 Vehicles | 1,149 (22.9%) | 1,132 (26.2%) |
| 4 Vehicles | 727 (14.5%) | 368 (8.5%) |
| 5 or more Vehicles | 408 (8.1%) | 297 (6.9%) |
| Total | 5,024 (100.0%) | 4,319 (100.0%) |
Commute Time in Nodaway County
The most frequently occuring commute durations in Nodaway County are 5 to 9 minutes (2,838 commuters, 30.4%), 10 to 14 minutes (1,987 commuters, 21.3%), and 15 to 19 minutes (1,095 commuters, 11.7%).
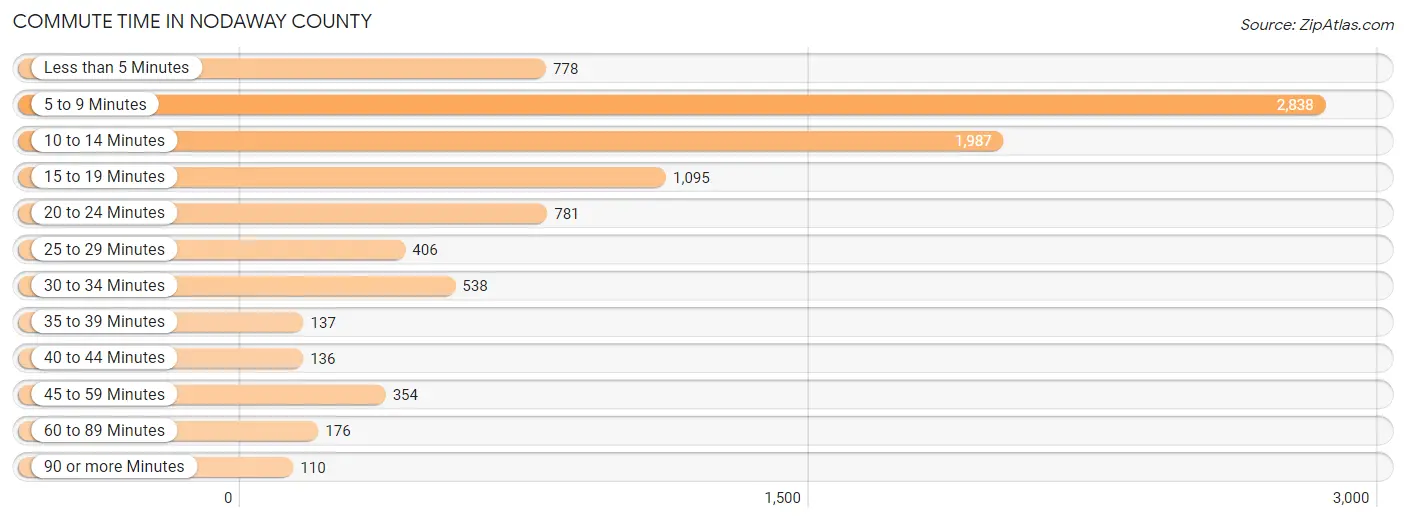
| Commute Time | # Commuters | % Commuters |
| Less than 5 Minutes | 778 | 8.3% |
| 5 to 9 Minutes | 2,838 | 30.4% |
| 10 to 14 Minutes | 1,987 | 21.3% |
| 15 to 19 Minutes | 1,095 | 11.7% |
| 20 to 24 Minutes | 781 | 8.4% |
| 25 to 29 Minutes | 406 | 4.3% |
| 30 to 34 Minutes | 538 | 5.8% |
| 35 to 39 Minutes | 137 | 1.5% |
| 40 to 44 Minutes | 136 | 1.5% |
| 45 to 59 Minutes | 354 | 3.8% |
| 60 to 89 Minutes | 176 | 1.9% |
| 90 or more Minutes | 110 | 1.2% |
Commute Time by Sex in Nodaway County
The most common commute times in Nodaway County are 5 to 9 minutes (1,439 commuters, 29.6%) for males and 5 to 9 minutes (1,399 commuters, 31.3%) for females.
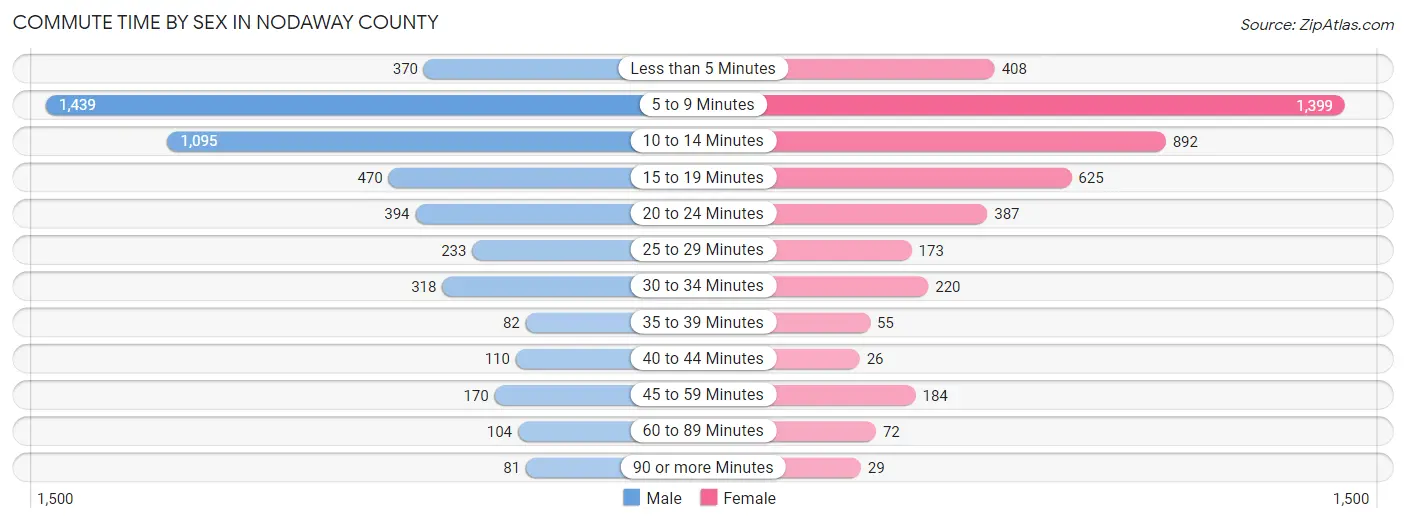
| Commute Time | Male | Female |
| Less than 5 Minutes | 370 (7.6%) | 408 (9.1%) |
| 5 to 9 Minutes | 1,439 (29.6%) | 1,399 (31.3%) |
| 10 to 14 Minutes | 1,095 (22.5%) | 892 (20.0%) |
| 15 to 19 Minutes | 470 (9.7%) | 625 (14.0%) |
| 20 to 24 Minutes | 394 (8.1%) | 387 (8.7%) |
| 25 to 29 Minutes | 233 (4.8%) | 173 (3.9%) |
| 30 to 34 Minutes | 318 (6.5%) | 220 (4.9%) |
| 35 to 39 Minutes | 82 (1.7%) | 55 (1.2%) |
| 40 to 44 Minutes | 110 (2.3%) | 26 (0.6%) |
| 45 to 59 Minutes | 170 (3.5%) | 184 (4.1%) |
| 60 to 89 Minutes | 104 (2.1%) | 72 (1.6%) |
| 90 or more Minutes | 81 (1.7%) | 29 (0.6%) |
Time of Departure to Work by Sex in Nodaway County
The most frequent times of departure to work in Nodaway County are 7:00 AM to 7:29 AM (957, 19.7%) for males and 7:30 AM to 7:59 AM (715, 16.0%) for females.
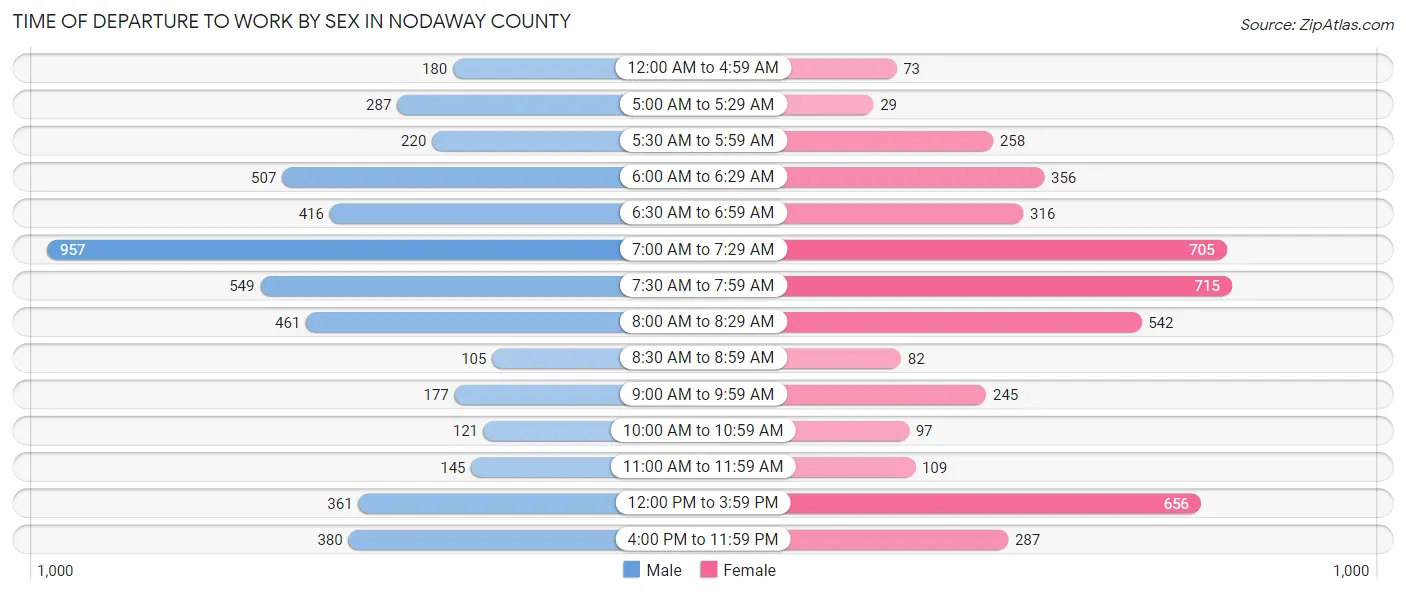
| Time of Departure | Male | Female |
| 12:00 AM to 4:59 AM | 180 (3.7%) | 73 (1.6%) |
| 5:00 AM to 5:29 AM | 287 (5.9%) | 29 (0.6%) |
| 5:30 AM to 5:59 AM | 220 (4.5%) | 258 (5.8%) |
| 6:00 AM to 6:29 AM | 507 (10.4%) | 356 (8.0%) |
| 6:30 AM to 6:59 AM | 416 (8.6%) | 316 (7.1%) |
| 7:00 AM to 7:29 AM | 957 (19.7%) | 705 (15.8%) |
| 7:30 AM to 7:59 AM | 549 (11.3%) | 715 (16.0%) |
| 8:00 AM to 8:29 AM | 461 (9.5%) | 542 (12.1%) |
| 8:30 AM to 8:59 AM | 105 (2.2%) | 82 (1.8%) |
| 9:00 AM to 9:59 AM | 177 (3.6%) | 245 (5.5%) |
| 10:00 AM to 10:59 AM | 121 (2.5%) | 97 (2.2%) |
| 11:00 AM to 11:59 AM | 145 (3.0%) | 109 (2.4%) |
| 12:00 PM to 3:59 PM | 361 (7.4%) | 656 (14.7%) |
| 4:00 PM to 11:59 PM | 380 (7.8%) | 287 (6.4%) |
| Total | 4,866 (100.0%) | 4,470 (100.0%) |
Housing Occupancy in Nodaway County
Occupancy by Ownership in Nodaway County
Of the total 8,261 dwellings in Nodaway County, owner-occupied units account for 5,239 (63.4%), while renter-occupied units make up 3,022 (36.6%).
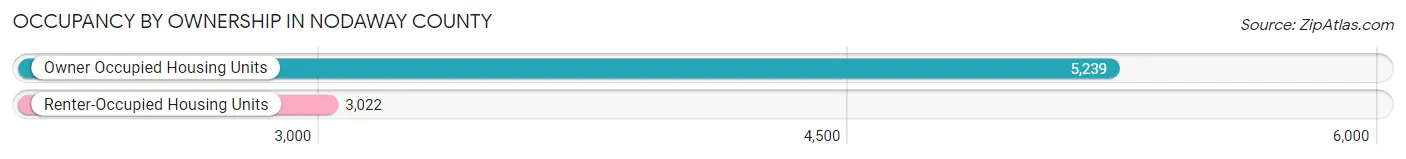
| Occupancy | # Housing Units | % Housing Units |
| Owner Occupied Housing Units | 5,239 | 63.4% |
| Renter-Occupied Housing Units | 3,022 | 36.6% |
| Total Occupied Housing Units | 8,261 | 100.0% |
Occupancy by Household Size in Nodaway County
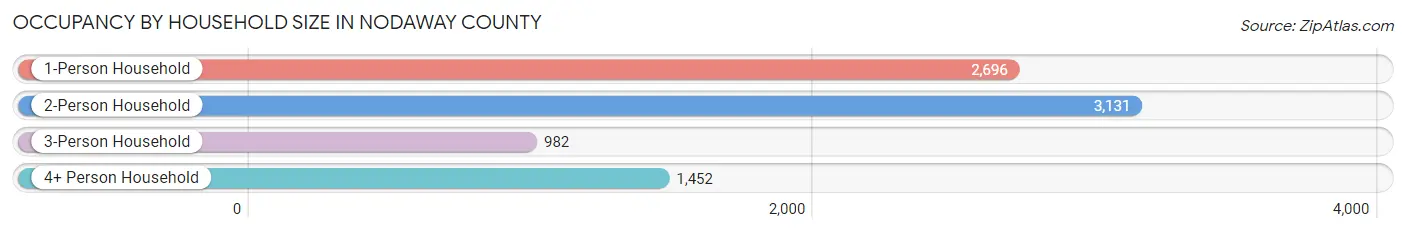
| Household Size | # Housing Units | % Housing Units |
| 1-Person Household | 2,696 | 32.6% |
| 2-Person Household | 3,131 | 37.9% |
| 3-Person Household | 982 | 11.9% |
| 4+ Person Household | 1,452 | 17.6% |
| Total Housing Units | 8,261 | 100.0% |
Occupancy by Ownership by Household Size in Nodaway County
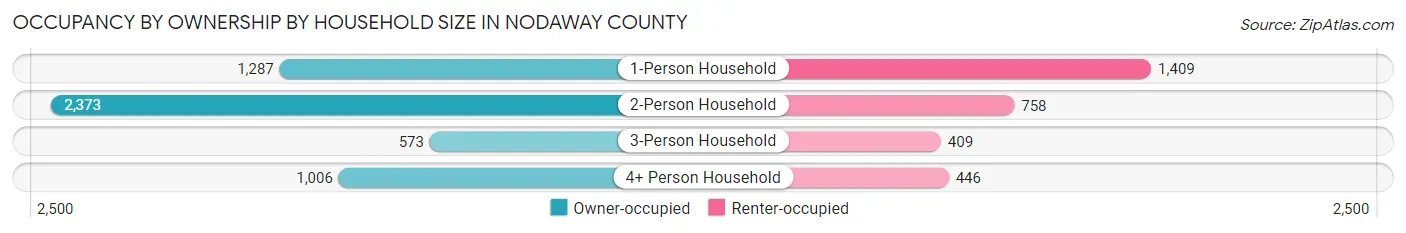
| Household Size | Owner-occupied | Renter-occupied |
| 1-Person Household | 1,287 (47.7%) | 1,409 (52.3%) |
| 2-Person Household | 2,373 (75.8%) | 758 (24.2%) |
| 3-Person Household | 573 (58.4%) | 409 (41.6%) |
| 4+ Person Household | 1,006 (69.3%) | 446 (30.7%) |
| Total Housing Units | 5,239 (63.4%) | 3,022 (36.6%) |
Occupancy by Educational Attainment in Nodaway County
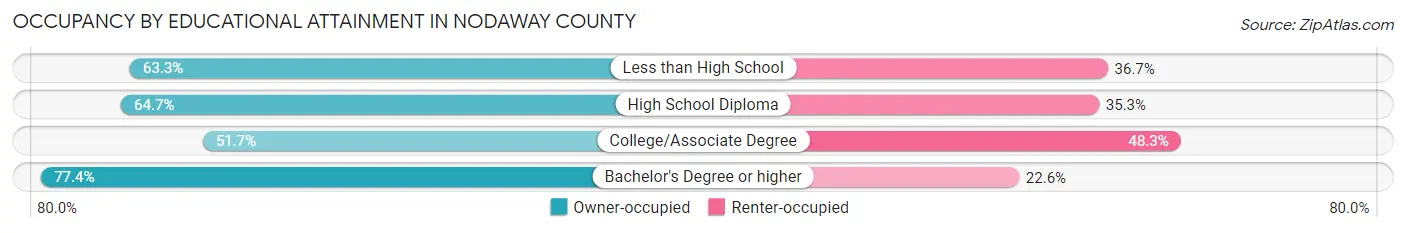
| Household Size | Owner-occupied | Renter-occupied |
| Less than High School | 231 (63.3%) | 134 (36.7%) |
| High School Diploma | 1,806 (64.7%) | 986 (35.3%) |
| College/Associate Degree | 1,507 (51.7%) | 1,406 (48.3%) |
| Bachelor's Degree or higher | 1,695 (77.4%) | 496 (22.6%) |
Occupancy by Age of Householder in Nodaway County
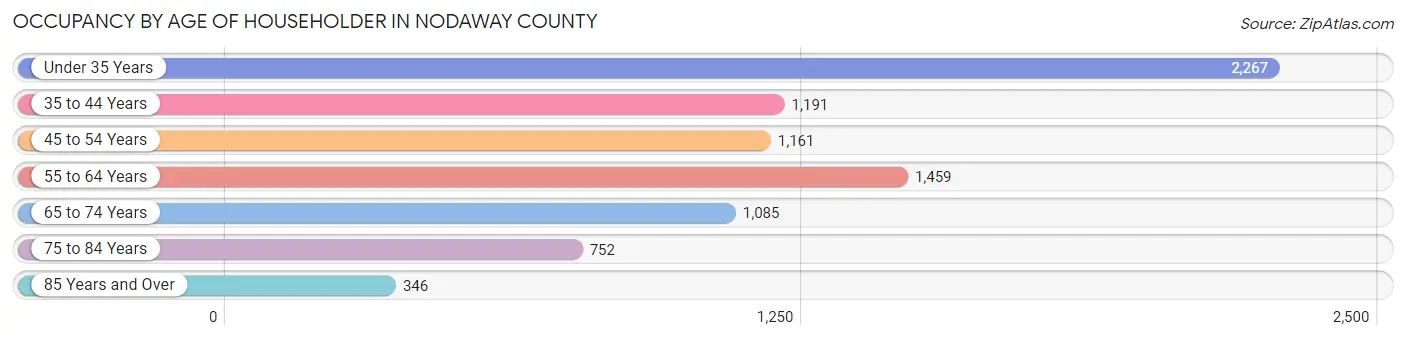
| Age Bracket | # Households | % Households |
| Under 35 Years | 2,267 | 27.4% |
| 35 to 44 Years | 1,191 | 14.4% |
| 45 to 54 Years | 1,161 | 14.1% |
| 55 to 64 Years | 1,459 | 17.7% |
| 65 to 74 Years | 1,085 | 13.1% |
| 75 to 84 Years | 752 | 9.1% |
| 85 Years and Over | 346 | 4.2% |
| Total | 8,261 | 100.0% |
Housing Finances in Nodaway County
Median Income by Occupancy in Nodaway County
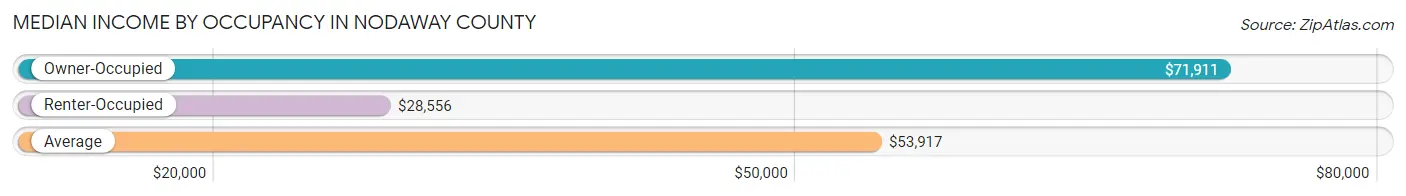
| Occupancy Type | # Households | Median Income |
| Owner-Occupied | 5,239 (63.4%) | $71,911 |
| Renter-Occupied | 3,022 (36.6%) | $28,556 |
| Average | 8,261 (100.0%) | $53,917 |
Occupancy by Householder Income Bracket in Nodaway County
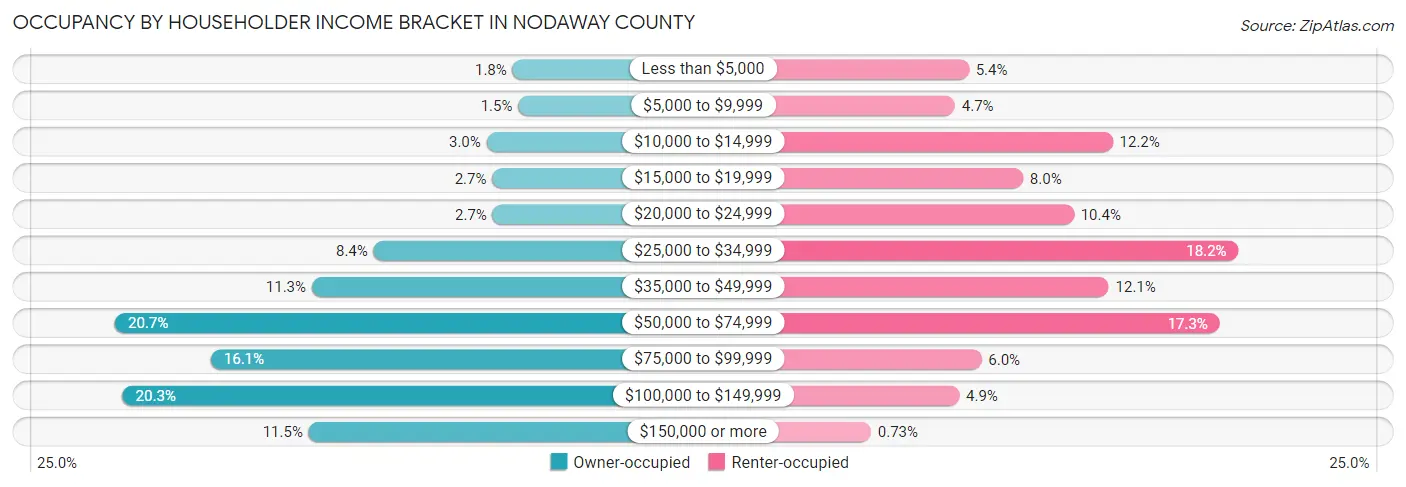
| Income Bracket | Owner-occupied | Renter-occupied |
| Less than $5,000 | 92 (1.8%) | 163 (5.4%) |
| $5,000 to $9,999 | 78 (1.5%) | 143 (4.7%) |
| $10,000 to $14,999 | 157 (3.0%) | 370 (12.2%) |
| $15,000 to $19,999 | 143 (2.7%) | 241 (8.0%) |
| $20,000 to $24,999 | 142 (2.7%) | 314 (10.4%) |
| $25,000 to $34,999 | 439 (8.4%) | 551 (18.2%) |
| $35,000 to $49,999 | 593 (11.3%) | 364 (12.0%) |
| $50,000 to $74,999 | 1,084 (20.7%) | 524 (17.3%) |
| $75,000 to $99,999 | 845 (16.1%) | 181 (6.0%) |
| $100,000 to $149,999 | 1,065 (20.3%) | 149 (4.9%) |
| $150,000 or more | 601 (11.5%) | 22 (0.7%) |
| Total | 5,239 (100.0%) | 3,022 (100.0%) |
Monthly Housing Cost Tiers in Nodaway County
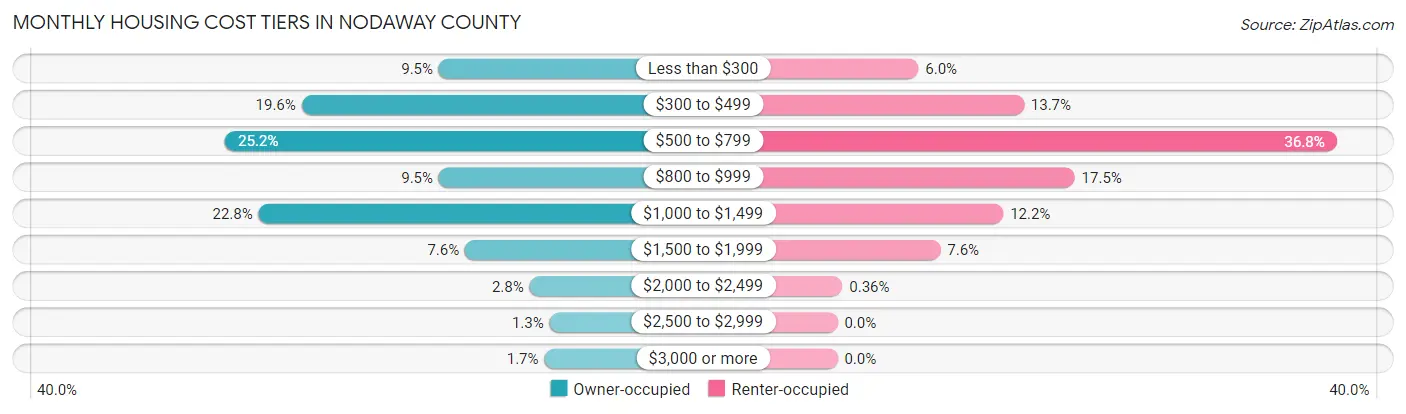
| Monthly Cost | Owner-occupied | Renter-occupied |
| Less than $300 | 497 (9.5%) | 180 (6.0%) |
| $300 to $499 | 1,027 (19.6%) | 415 (13.7%) |
| $500 to $799 | 1,322 (25.2%) | 1,111 (36.8%) |
| $800 to $999 | 497 (9.5%) | 528 (17.5%) |
| $1,000 to $1,499 | 1,193 (22.8%) | 369 (12.2%) |
| $1,500 to $1,999 | 396 (7.6%) | 229 (7.6%) |
| $2,000 to $2,499 | 147 (2.8%) | 11 (0.4%) |
| $2,500 to $2,999 | 70 (1.3%) | 0 (0.0%) |
| $3,000 or more | 90 (1.7%) | 0 (0.0%) |
| Total | 5,239 (100.0%) | 3,022 (100.0%) |
Physical Housing Characteristics in Nodaway County
Housing Structures in Nodaway County
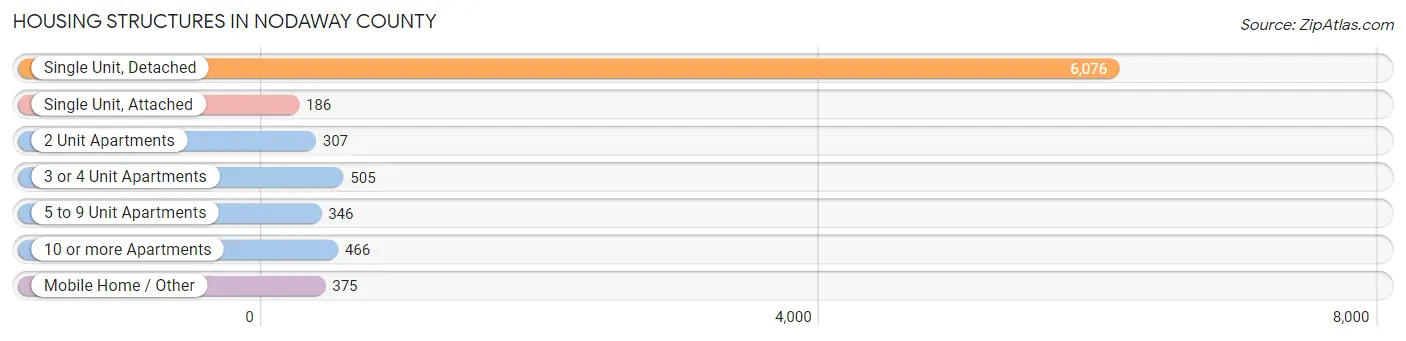
| Structure Type | # Housing Units | % Housing Units |
| Single Unit, Detached | 6,076 | 73.6% |
| Single Unit, Attached | 186 | 2.2% |
| 2 Unit Apartments | 307 | 3.7% |
| 3 or 4 Unit Apartments | 505 | 6.1% |
| 5 to 9 Unit Apartments | 346 | 4.2% |
| 10 or more Apartments | 466 | 5.6% |
| Mobile Home / Other | 375 | 4.5% |
| Total | 8,261 | 100.0% |
Housing Structures by Occupancy in Nodaway County
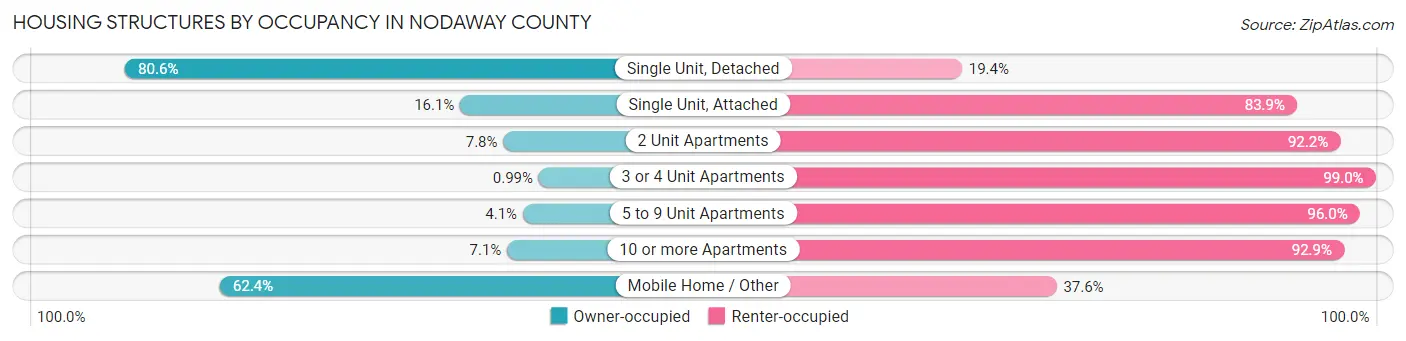
| Structure Type | Owner-occupied | Renter-occupied |
| Single Unit, Detached | 4,899 (80.6%) | 1,177 (19.4%) |
| Single Unit, Attached | 30 (16.1%) | 156 (83.9%) |
| 2 Unit Apartments | 24 (7.8%) | 283 (92.2%) |
| 3 or 4 Unit Apartments | 5 (1.0%) | 500 (99.0%) |
| 5 to 9 Unit Apartments | 14 (4.1%) | 332 (96.0%) |
| 10 or more Apartments | 33 (7.1%) | 433 (92.9%) |
| Mobile Home / Other | 234 (62.4%) | 141 (37.6%) |
| Total | 5,239 (63.4%) | 3,022 (36.6%) |
Housing Structures by Number of Rooms in Nodaway County
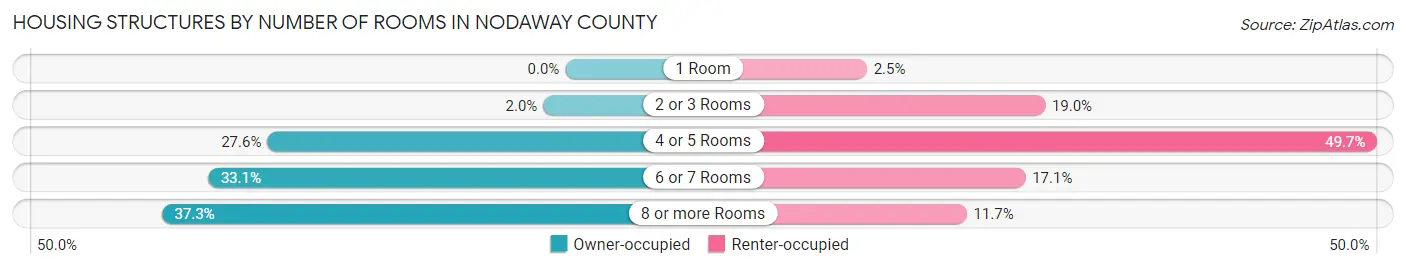
| Number of Rooms | Owner-occupied | Renter-occupied |
| 1 Room | 0 (0.0%) | 75 (2.5%) |
| 2 or 3 Rooms | 107 (2.0%) | 573 (19.0%) |
| 4 or 5 Rooms | 1,444 (27.6%) | 1,502 (49.7%) |
| 6 or 7 Rooms | 1,732 (33.1%) | 518 (17.1%) |
| 8 or more Rooms | 1,956 (37.3%) | 354 (11.7%) |
| Total | 5,239 (100.0%) | 3,022 (100.0%) |
Housing Structure by Heating Type in Nodaway County
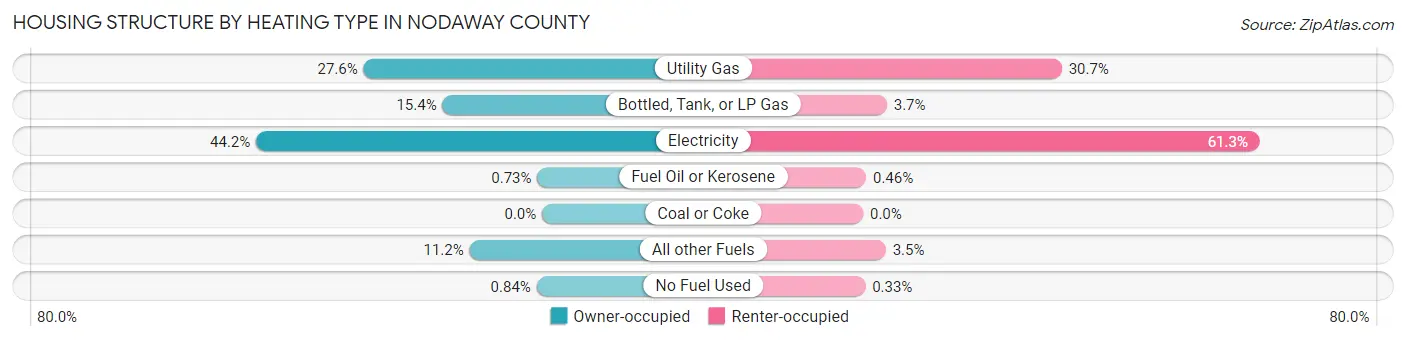
| Heating Type | Owner-occupied | Renter-occupied |
| Utility Gas | 1,446 (27.6%) | 928 (30.7%) |
| Bottled, Tank, or LP Gas | 807 (15.4%) | 111 (3.7%) |
| Electricity | 2,316 (44.2%) | 1,853 (61.3%) |
| Fuel Oil or Kerosene | 38 (0.7%) | 14 (0.5%) |
| Coal or Coke | 0 (0.0%) | 0 (0.0%) |
| All other Fuels | 588 (11.2%) | 106 (3.5%) |
| No Fuel Used | 44 (0.8%) | 10 (0.3%) |
| Total | 5,239 (100.0%) | 3,022 (100.0%) |
Household Vehicle Usage in Nodaway County
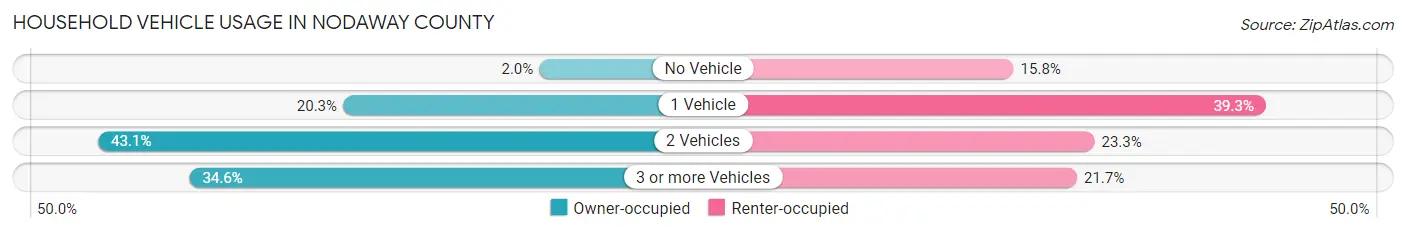
| Vehicles per Household | Owner-occupied | Renter-occupied |
| No Vehicle | 103 (2.0%) | 476 (15.8%) |
| 1 Vehicle | 1,063 (20.3%) | 1,187 (39.3%) |
| 2 Vehicles | 2,260 (43.1%) | 704 (23.3%) |
| 3 or more Vehicles | 1,813 (34.6%) | 655 (21.7%) |
| Total | 5,239 (100.0%) | 3,022 (100.0%) |
Real Estate & Mortgages in Nodaway County
Real Estate and Mortgage Overview in Nodaway County
| Characteristic | Without Mortgage | With Mortgage |
| Housing Units | 2,672 | 2,567 |
| Median Property Value | $139,700 | $167,400 |
| Median Household Income | $66,705 | $365 |
| Monthly Housing Costs | $470 | $83 |
| Real Estate Taxes | $1,281 | $17 |
Property Value by Mortgage Status in Nodaway County
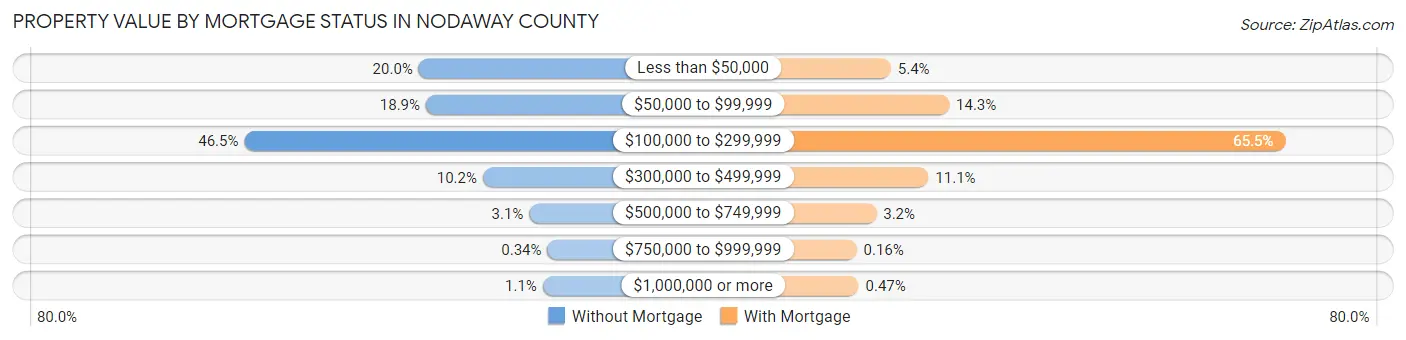
| Property Value | Without Mortgage | With Mortgage |
| Less than $50,000 | 533 (20.0%) | 138 (5.4%) |
| $50,000 to $99,999 | 504 (18.9%) | 366 (14.3%) |
| $100,000 to $299,999 | 1,243 (46.5%) | 1,681 (65.5%) |
| $300,000 to $499,999 | 272 (10.2%) | 285 (11.1%) |
| $500,000 to $749,999 | 83 (3.1%) | 81 (3.2%) |
| $750,000 to $999,999 | 9 (0.3%) | 4 (0.2%) |
| $1,000,000 or more | 28 (1.1%) | 12 (0.5%) |
| Total | 2,672 (100.0%) | 2,567 (100.0%) |
Household Income by Mortgage Status in Nodaway County
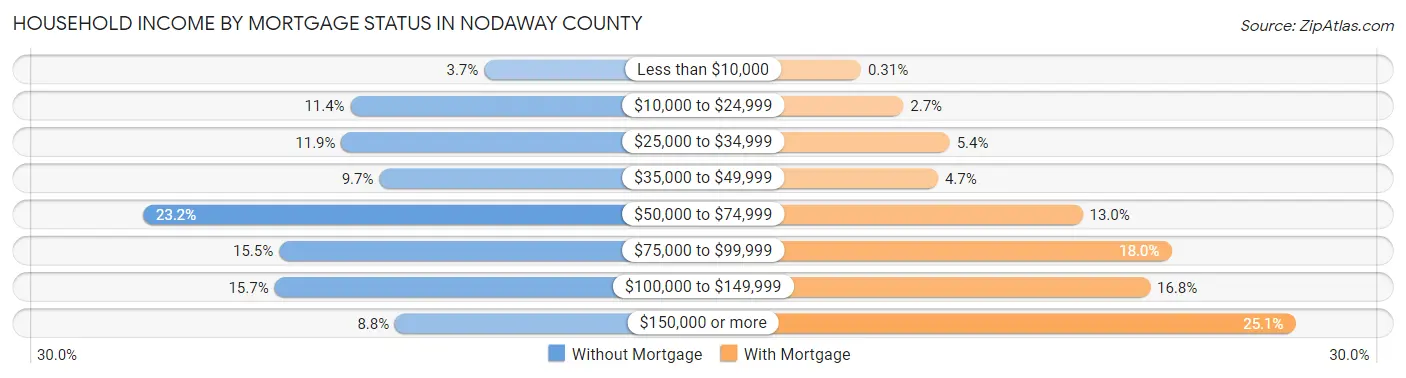
| Household Income | Without Mortgage | With Mortgage |
| Less than $10,000 | 100 (3.7%) | 8 (0.3%) |
| $10,000 to $24,999 | 304 (11.4%) | 70 (2.7%) |
| $25,000 to $34,999 | 318 (11.9%) | 138 (5.4%) |
| $35,000 to $49,999 | 260 (9.7%) | 121 (4.7%) |
| $50,000 to $74,999 | 621 (23.2%) | 333 (13.0%) |
| $75,000 to $99,999 | 413 (15.5%) | 463 (18.0%) |
| $100,000 to $149,999 | 420 (15.7%) | 432 (16.8%) |
| $150,000 or more | 236 (8.8%) | 645 (25.1%) |
| Total | 2,672 (100.0%) | 2,567 (100.0%) |
Property Value to Household Income Ratio in Nodaway County
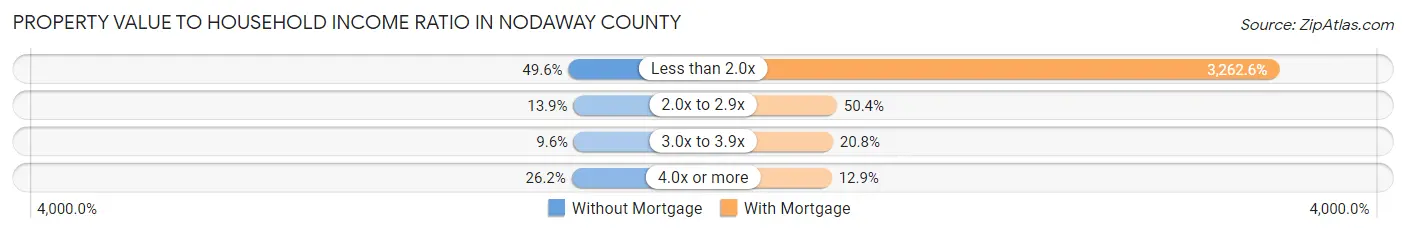
| Value-to-Income Ratio | Without Mortgage | With Mortgage |
| Less than 2.0x | 1,325 (49.6%) | 83,750 (3,262.6%) |
| 2.0x to 2.9x | 370 (13.9%) | 1,293 (50.4%) |
| 3.0x to 3.9x | 256 (9.6%) | 534 (20.8%) |
| 4.0x or more | 699 (26.2%) | 331 (12.9%) |
| Total | 2,672 (100.0%) | 2,567 (100.0%) |
Real Estate Taxes by Mortgage Status in Nodaway County
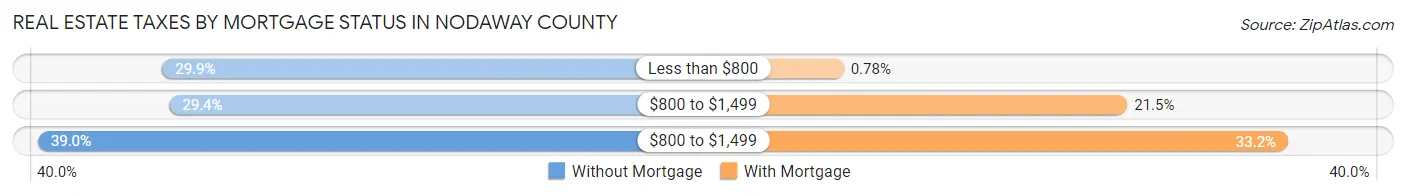
| Property Taxes | Without Mortgage | With Mortgage |
| Less than $800 | 800 (29.9%) | 20 (0.8%) |
| $800 to $1,499 | 786 (29.4%) | 552 (21.5%) |
| $800 to $1,499 | 1,043 (39.0%) | 853 (33.2%) |
| Total | 2,672 (100.0%) | 2,567 (100.0%) |
Health & Disability in Nodaway County
Health Insurance Coverage by Age in Nodaway County
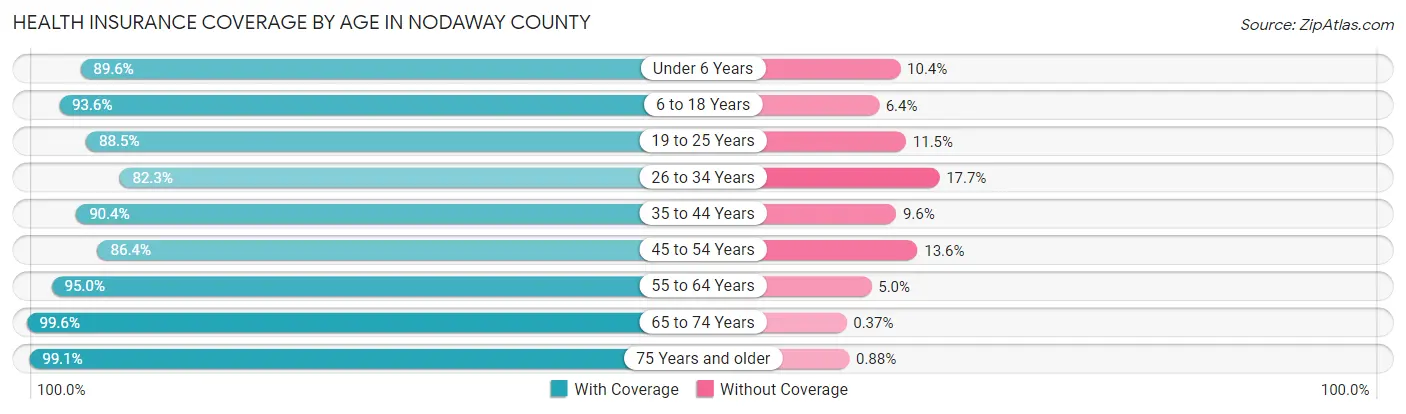
| Age Bracket | With Coverage | Without Coverage |
| Under 6 Years | 1,101 (89.6%) | 128 (10.4%) |
| 6 to 18 Years | 3,004 (93.6%) | 206 (6.4%) |
| 19 to 25 Years | 3,893 (88.5%) | 505 (11.5%) |
| 26 to 34 Years | 1,506 (82.3%) | 324 (17.7%) |
| 35 to 44 Years | 1,858 (90.4%) | 198 (9.6%) |
| 45 to 54 Years | 1,655 (86.4%) | 261 (13.6%) |
| 55 to 64 Years | 2,322 (95.0%) | 123 (5.0%) |
| 65 to 74 Years | 1,860 (99.6%) | 7 (0.4%) |
| 75 Years and older | 1,459 (99.1%) | 13 (0.9%) |
| Total | 18,658 (91.4%) | 1,765 (8.6%) |
Health Insurance Coverage by Citizenship Status in Nodaway County
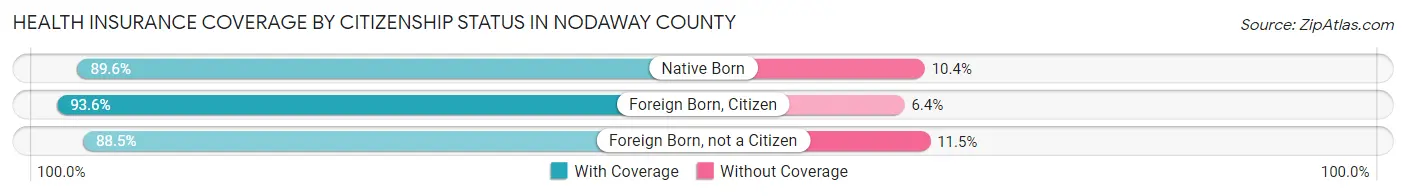
| Citizenship Status | With Coverage | Without Coverage |
| Native Born | 1,101 (89.6%) | 128 (10.4%) |
| Foreign Born, Citizen | 3,004 (93.6%) | 206 (6.4%) |
| Foreign Born, not a Citizen | 3,893 (88.5%) | 505 (11.5%) |
Health Insurance Coverage by Household Income in Nodaway County
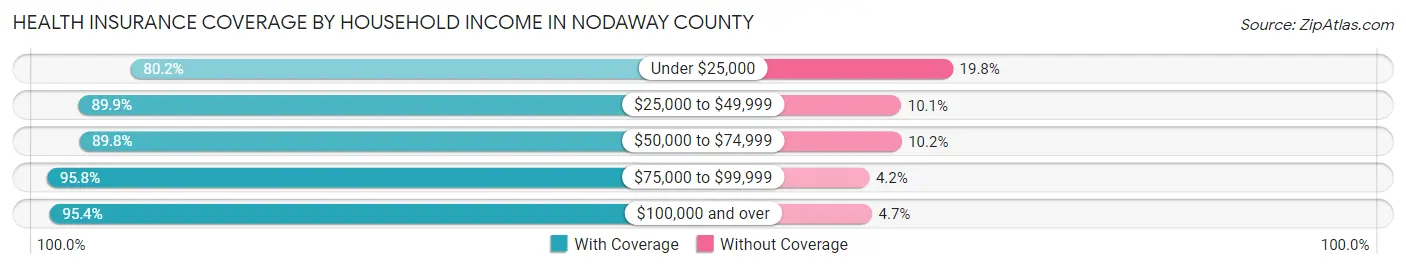
| Household Income | With Coverage | Without Coverage |
| Under $25,000 | 2,375 (80.2%) | 587 (19.8%) |
| $25,000 to $49,999 | 3,216 (89.9%) | 362 (10.1%) |
| $50,000 to $74,999 | 3,540 (89.8%) | 402 (10.2%) |
| $75,000 to $99,999 | 2,533 (95.8%) | 110 (4.2%) |
| $100,000 and over | 4,776 (95.4%) | 233 (4.6%) |
Public vs Private Health Insurance Coverage by Age in Nodaway County
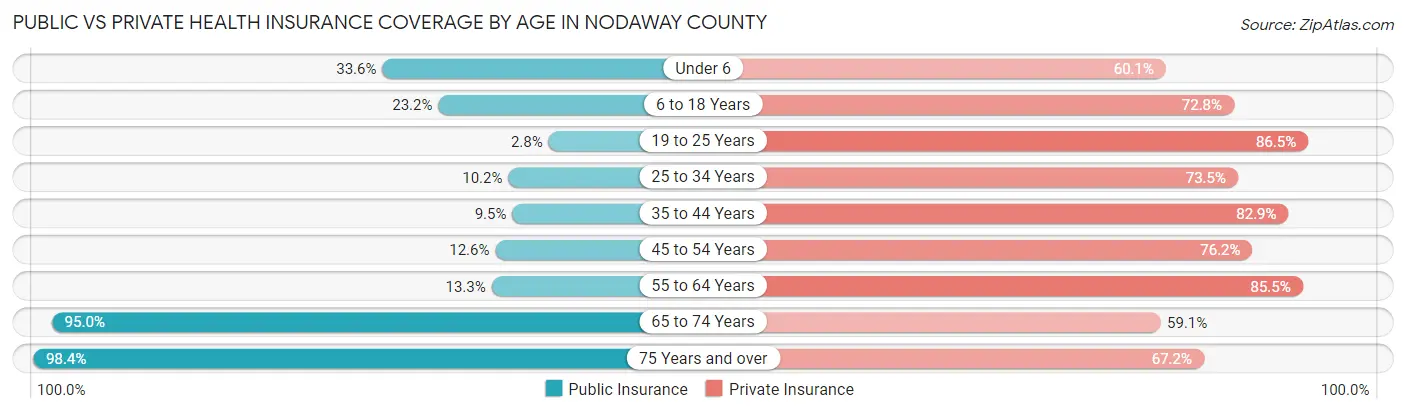
| Age Bracket | Public Insurance | Private Insurance |
| Under 6 | 413 (33.6%) | 739 (60.1%) |
| 6 to 18 Years | 745 (23.2%) | 2,336 (72.8%) |
| 19 to 25 Years | 121 (2.8%) | 3,806 (86.5%) |
| 25 to 34 Years | 187 (10.2%) | 1,345 (73.5%) |
| 35 to 44 Years | 195 (9.5%) | 1,704 (82.9%) |
| 45 to 54 Years | 242 (12.6%) | 1,460 (76.2%) |
| 55 to 64 Years | 326 (13.3%) | 2,091 (85.5%) |
| 65 to 74 Years | 1,773 (95.0%) | 1,103 (59.1%) |
| 75 Years and over | 1,449 (98.4%) | 989 (67.2%) |
| Total | 5,451 (26.7%) | 15,573 (76.2%) |
Disability Status by Sex by Age in Nodaway County
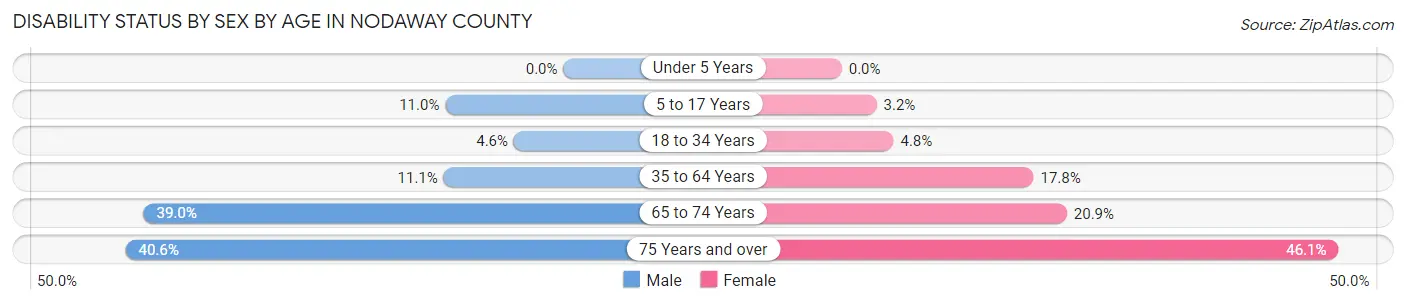
| Age Bracket | Male | Female |
| Under 5 Years | 0 (0.0%) | 0 (0.0%) |
| 5 to 17 Years | 138 (11.0%) | 39 (3.2%) |
| 18 to 34 Years | 161 (4.6%) | 175 (4.8%) |
| 35 to 64 Years | 353 (11.1%) | 577 (17.8%) |
| 65 to 74 Years | 358 (39.0%) | 198 (20.9%) |
| 75 Years and over | 256 (40.6%) | 388 (46.1%) |
Disability Class by Sex by Age in Nodaway County
Disability Class: Hearing Difficulty
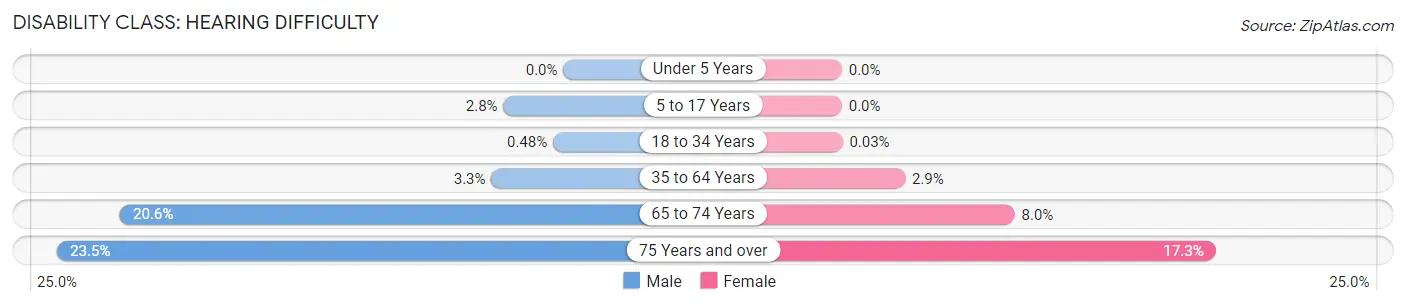
| Age Bracket | Male | Female |
| Under 5 Years | 0 (0.0%) | 0 (0.0%) |
| 5 to 17 Years | 35 (2.8%) | 0 (0.0%) |
| 18 to 34 Years | 17 (0.5%) | 1 (0.0%) |
| 35 to 64 Years | 106 (3.3%) | 95 (2.9%) |
| 65 to 74 Years | 189 (20.6%) | 76 (8.0%) |
| 75 Years and over | 148 (23.5%) | 146 (17.3%) |
Disability Class: Vision Difficulty
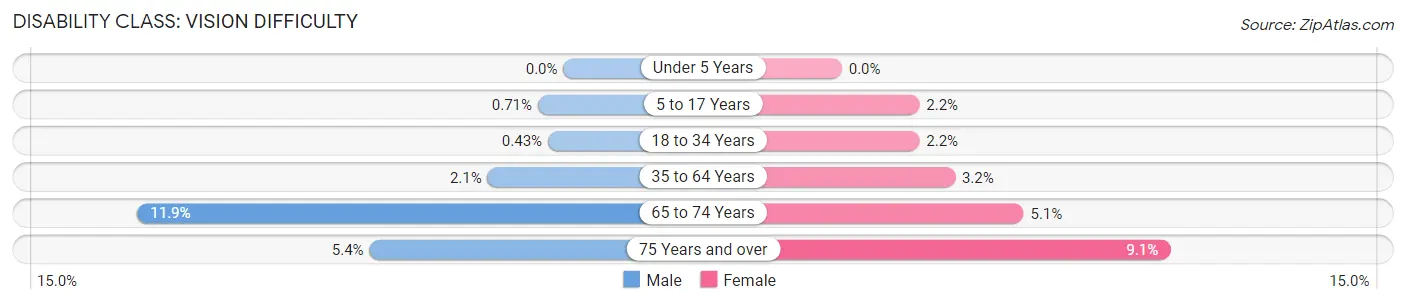
| Age Bracket | Male | Female |
| Under 5 Years | 0 (0.0%) | 0 (0.0%) |
| 5 to 17 Years | 9 (0.7%) | 26 (2.2%) |
| 18 to 34 Years | 15 (0.4%) | 79 (2.2%) |
| 35 to 64 Years | 67 (2.1%) | 102 (3.2%) |
| 65 to 74 Years | 109 (11.9%) | 48 (5.1%) |
| 75 Years and over | 34 (5.4%) | 77 (9.1%) |
Disability Class: Cognitive Difficulty
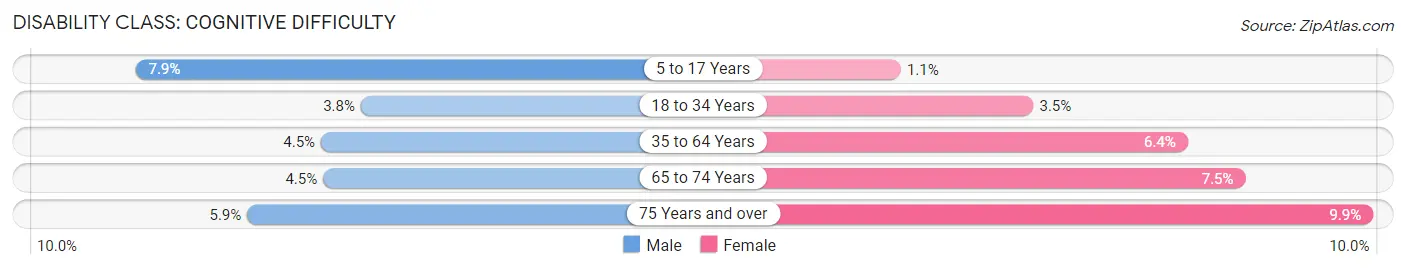
| Age Bracket | Male | Female |
| 5 to 17 Years | 100 (7.9%) | 13 (1.1%) |
| 18 to 34 Years | 132 (3.8%) | 129 (3.5%) |
| 35 to 64 Years | 143 (4.5%) | 208 (6.4%) |
| 65 to 74 Years | 41 (4.5%) | 71 (7.5%) |
| 75 Years and over | 37 (5.9%) | 83 (9.9%) |
Disability Class: Ambulatory Difficulty
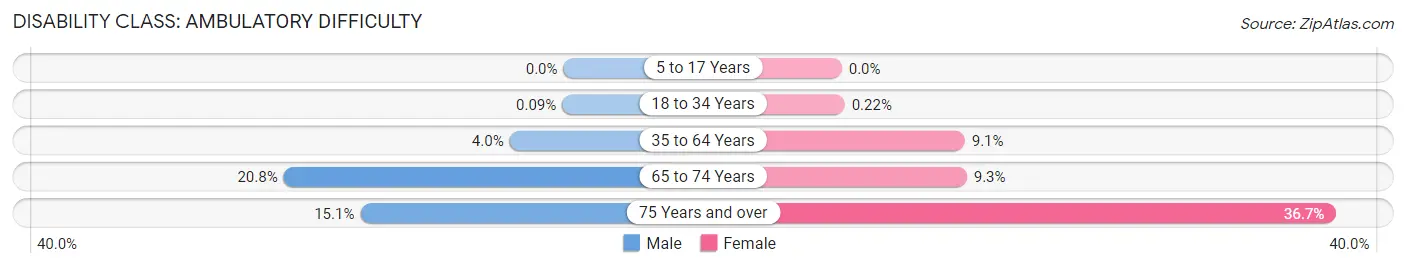
| Age Bracket | Male | Female |
| 5 to 17 Years | 0 (0.0%) | 0 (0.0%) |
| 18 to 34 Years | 3 (0.1%) | 8 (0.2%) |
| 35 to 64 Years | 127 (4.0%) | 296 (9.1%) |
| 65 to 74 Years | 191 (20.8%) | 88 (9.3%) |
| 75 Years and over | 95 (15.1%) | 309 (36.7%) |
Disability Class: Self-Care Difficulty
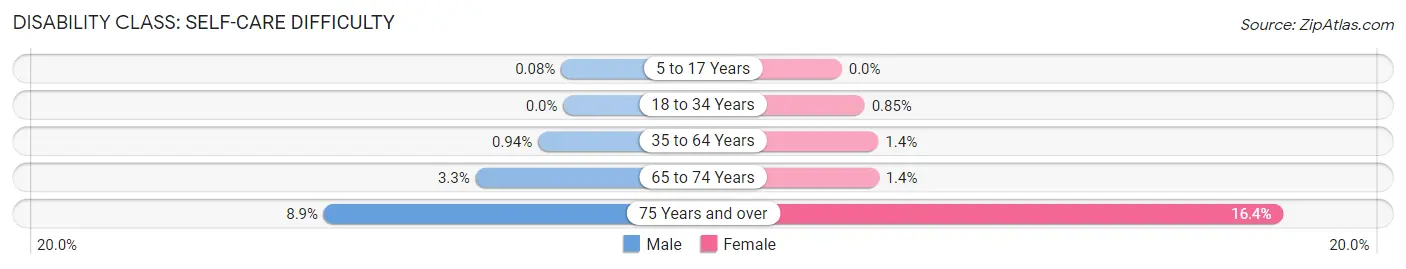
| Age Bracket | Male | Female |
| 5 to 17 Years | 1 (0.1%) | 0 (0.0%) |
| 18 to 34 Years | 0 (0.0%) | 31 (0.9%) |
| 35 to 64 Years | 30 (0.9%) | 44 (1.4%) |
| 65 to 74 Years | 30 (3.3%) | 13 (1.4%) |
| 75 Years and over | 56 (8.9%) | 138 (16.4%) |
Technology Access in Nodaway County
Computing Device Access in Nodaway County
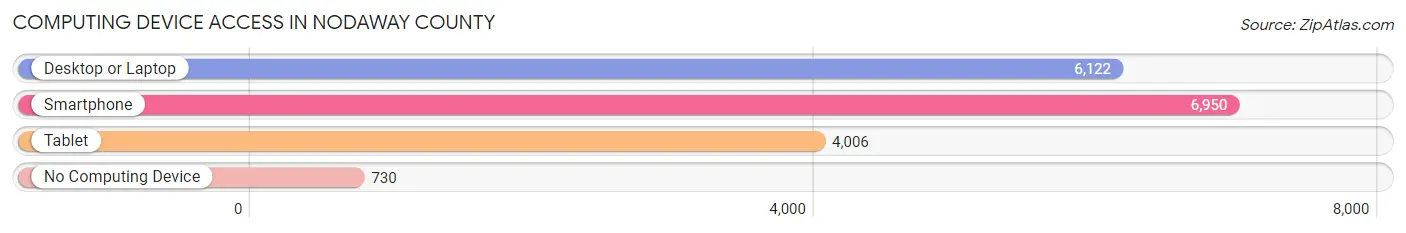
| Device Type | # Households | % Households |
| Desktop or Laptop | 6,122 | 74.1% |
| Smartphone | 6,950 | 84.1% |
| Tablet | 4,006 | 48.5% |
| No Computing Device | 730 | 8.8% |
| Total | 8,261 | 100.0% |
Internet Access in Nodaway County
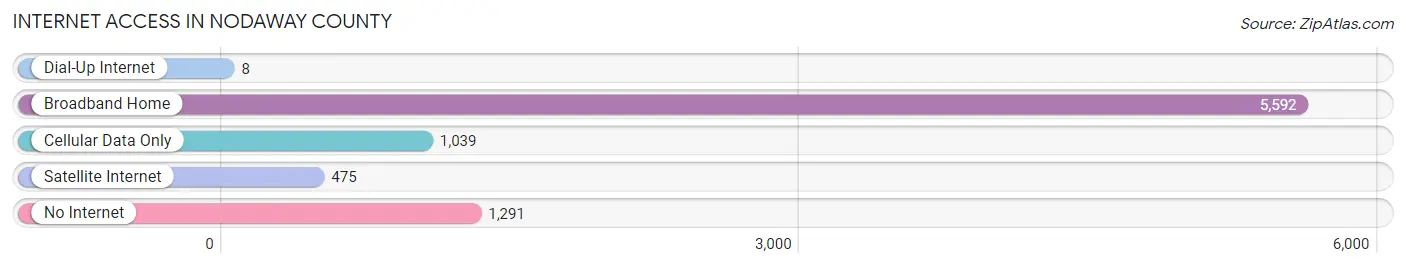
| Internet Type | # Households | % Households |
| Dial-Up Internet | 8 | 0.1% |
| Broadband Home | 5,592 | 67.7% |
| Cellular Data Only | 1,039 | 12.6% |
| Satellite Internet | 475 | 5.8% |
| No Internet | 1,291 | 15.6% |
| Total | 8,261 | 100.0% |
Nodaway County Summary
Nodaway County is located in the northwest corner of Missouri and is part of the St. Joseph Metropolitan Statistical Area. The county was established in 1845 and is named after the Nodaway River, which flows through the county. The county seat is Maryville, which is also the largest city in the county. As of the 2010 census, the population of Nodaway County was 23,370.
Geography
Nodaway County is located in the northwest corner of Missouri and is bordered by Atchison County, Kansas to the north, Holt County to the east, Andrew County to the south, and Doniphan County, Kansas to the west. The county covers an area of 576 square miles and is mostly rural, with the majority of the land being used for agricultural purposes. The terrain is mostly flat, with some rolling hills in the northern part of the county. The Nodaway River flows through the county, and there are several small lakes and ponds scattered throughout the area.
Climate
Nodaway County has a humid continental climate, with hot, humid summers and cold, dry winters. The average annual temperature is around 54°F, with the average high in the summer months reaching around 90°F and the average low in the winter months reaching around 20°F. The average annual precipitation is around 37 inches, with the majority of the precipitation occurring in the spring and summer months.
Demographics
As of the 2010 census, the population of Nodaway County was 23,370, with a population density of 40.3 people per square mile. The racial makeup of the county was 95.3% White, 1.3% African American, 0.4% Native American, 0.5% Asian, 0.1% Pacific Islander, 1.2% from other races, and 1.2% from two or more races. Hispanic or Latino of any race were 3.2% of the population.
The median income for a household in the county was $41,945, and the median income for a family was $50,945. The per capita income for the county was $20,845. About 11.2% of the population was below the poverty line.
Economy
Nodaway County is primarily an agricultural county, with the majority of the land being used for farming and ranching. The main crops grown in the county are corn, soybeans, wheat, and hay. Livestock production is also an important part of the county's economy, with beef cattle, dairy cattle, and hogs being the main types of livestock raised in the area.
In addition to agriculture, Nodaway County also has a thriving manufacturing sector. The county is home to several large manufacturing companies, including a paper mill, a plastics plant, and a metal fabrication plant. The county also has a growing tourism industry, with several popular attractions, such as the Nodaway County Historical Museum and the Nodaway County Fairgrounds.
Conclusion
Nodaway County is a rural county located in the northwest corner of Missouri. The county is mostly agricultural, with the majority of the land being used for farming and ranching. The county also has a thriving manufacturing sector and a growing tourism industry. The population of the county is 23,370, with a median household income of $41,945.
Common Questions
What is Per Capita Income in Nodaway County?
Per Capita income in Nodaway County is $28,136.
What is the Median Family Income in Nodaway County?
Median Family Income in Nodaway County is $76,875.
What is the Median Household income in Nodaway County?
Median Household Income in Nodaway County is $53,917.
What is Income or Wage Gap in Nodaway County?
Income or Wage Gap in Nodaway County is 33.4%.
Women in Nodaway County earn 66.6 cents for every dollar earned by a man.
What is Family Income Deficit in Nodaway County?
Family Income Deficit in Nodaway County is $10,421.
Families that are below poverty line in Nodaway County earn $10,421 less on average than the poverty threshold level.
What is Inequality or Gini Index in Nodaway County?
Inequality or Gini Index in Nodaway County is 0.45.
What is the Total Population of Nodaway County?
Total Population of Nodaway County is 21,140.
What is the Total Male Population of Nodaway County?
Total Male Population of Nodaway County is 10,575.
What is the Total Female Population of Nodaway County?
Total Female Population of Nodaway County is 10,565.
What is the Ratio of Males per 100 Females in Nodaway County?
There are 100.09 Males per 100 Females in Nodaway County.
What is the Ratio of Females per 100 Males in Nodaway County?
There are 99.91 Females per 100 Males in Nodaway County.
What is the Median Population Age in Nodaway County?
Median Population Age in Nodaway County is 33.5 Years.
What is the Average Family Size in Nodaway County
Average Family Size in Nodaway County is 2.8 People.
What is the Average Household Size in Nodaway County
Average Household Size in Nodaway County is 2.2 People.
How Large is the Labor Force in Nodaway County?
There are 10,256 People in the Labor Forcein in Nodaway County.
What is the Percentage of People in the Labor Force in Nodaway County?
56.7% of People are in the Labor Force in Nodaway County.
What is the Unemployment Rate in Nodaway County?
Unemployment Rate in Nodaway County is 2.3%.