Mercer County, MO Map & Demographics
Mercer County Map
Mercer County Overview
$26,850
PER CAPITA INCOME
$76,875
AVG FAMILY INCOME
$55,592
AVG HOUSEHOLD INCOME
2.8%
WAGE / INCOME GAP [ % ]
97.2¢/ $1
WAGE / INCOME GAP [ $ ]
0.41
INEQUALITY / GINI INDEX
3,517
TOTAL POPULATION
1,726
MALE POPULATION
1,791
FEMALE POPULATION
96.37
MALES / 100 FEMALES
103.77
FEMALES / 100 MALES
41.7
MEDIAN AGE
3.7
AVG FAMILY SIZE
2.8
AVG HOUSEHOLD SIZE
1,547
LABOR FORCE [ PEOPLE ]
57.2%
PERCENT IN LABOR FORCE
2.9%
UNEMPLOYMENT RATE
Mercer County Area Codes
Income in Mercer County
Income Overview in Mercer County
Per Capita Income in Mercer County is $26,850, while median incomes of families and households are $76,875 and $55,592 respectively.
| Characteristic | Number | Measure |
| Per Capita Income | 3,517 | $26,850 |
| Median Family Income | 747 | $76,875 |
| Mean Family Income | 747 | $83,255 |
| Median Household Income | 1,253 | $55,592 |
| Mean Household Income | 1,253 | $67,162 |
| Income Deficit | 747 | $0 |
| Wage / Income Gap (%) | 3,517 | 2.76% |
| Wage / Income Gap ($) | 3,517 | 97.24¢ per $1 |
| Gini / Inequality Index | 3,517 | 0.41 |
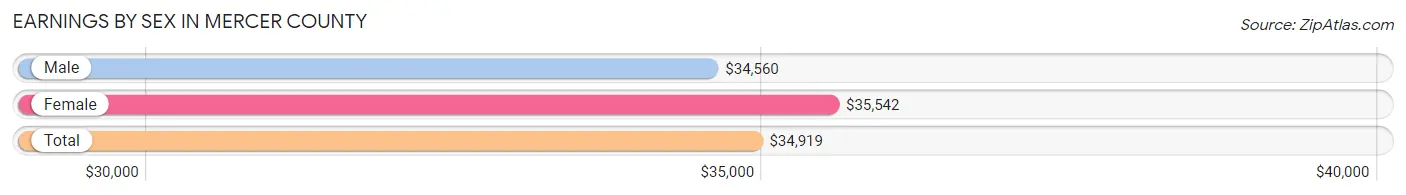
Earnings by Sex in Mercer County
Average Earnings in Mercer County are $34,919, $34,560 for men and $35,542 for women, a difference of 2.8%.
| Sex | Number | Average Earnings |
| Male | 777 (49.4%) | $34,560 |
| Female | 795 (50.6%) | $35,542 |
| Total | 1,572 (100.0%) | $34,919 |
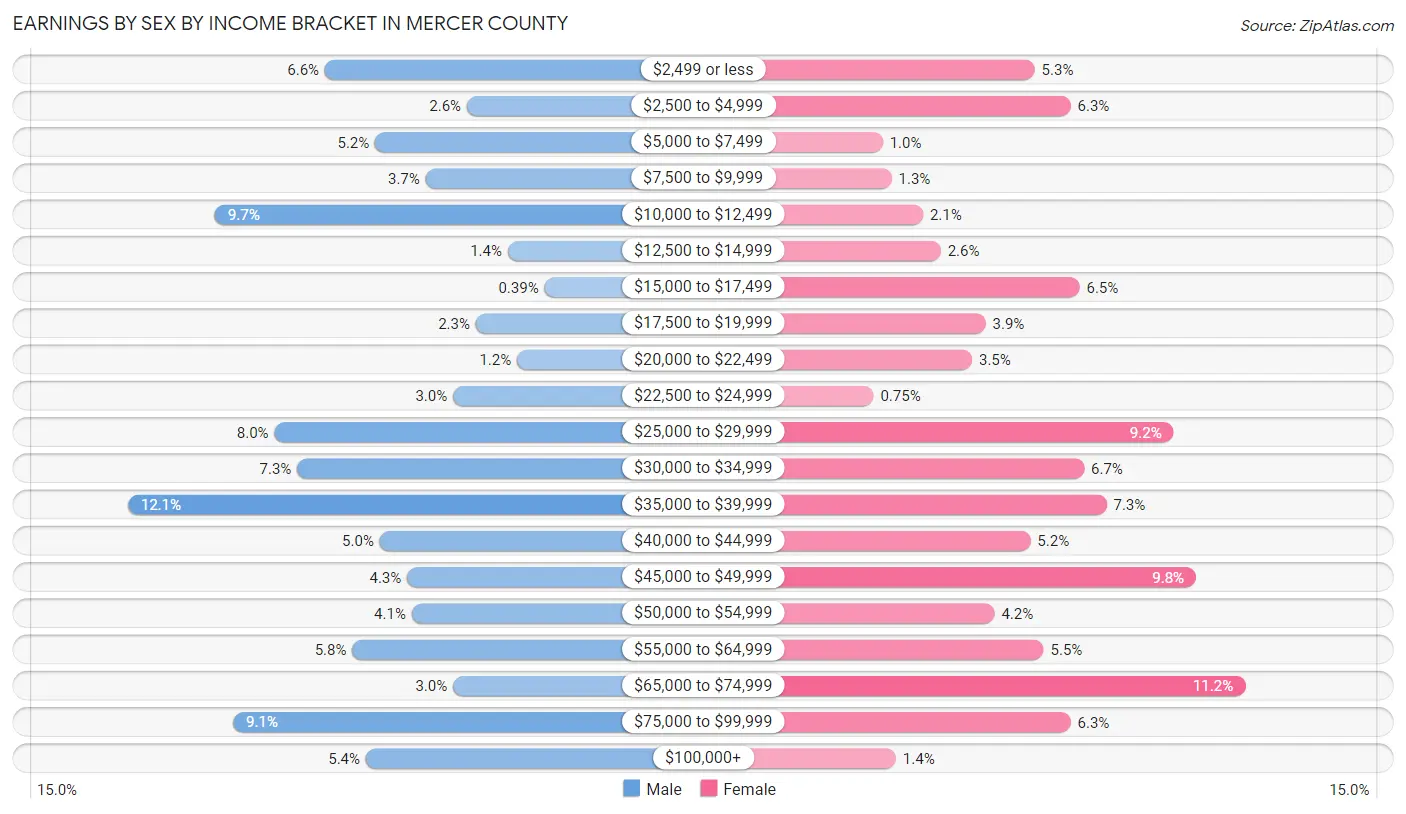
Earnings by Sex by Income Bracket in Mercer County
The most common earnings brackets in Mercer County are $35,000 to $39,999 for men (94 | 12.1%) and $65,000 to $74,999 for women (89 | 11.2%).
| Income | Male | Female |
| $2,499 or less | 51 (6.6%) | 42 (5.3%) |
| $2,500 to $4,999 | 20 (2.6%) | 50 (6.3%) |
| $5,000 to $7,499 | 40 (5.1%) | 8 (1.0%) |
| $7,500 to $9,999 | 29 (3.7%) | 10 (1.3%) |
| $10,000 to $12,499 | 75 (9.7%) | 17 (2.1%) |
| $12,500 to $14,999 | 11 (1.4%) | 21 (2.6%) |
| $15,000 to $17,499 | 3 (0.4%) | 52 (6.5%) |
| $17,500 to $19,999 | 18 (2.3%) | 31 (3.9%) |
| $20,000 to $22,499 | 9 (1.2%) | 28 (3.5%) |
| $22,500 to $24,999 | 23 (3.0%) | 6 (0.7%) |
| $25,000 to $29,999 | 62 (8.0%) | 73 (9.2%) |
| $30,000 to $34,999 | 57 (7.3%) | 53 (6.7%) |
| $35,000 to $39,999 | 94 (12.1%) | 58 (7.3%) |
| $40,000 to $44,999 | 39 (5.0%) | 41 (5.2%) |
| $45,000 to $49,999 | 33 (4.3%) | 78 (9.8%) |
| $50,000 to $54,999 | 32 (4.1%) | 33 (4.2%) |
| $55,000 to $64,999 | 45 (5.8%) | 44 (5.5%) |
| $65,000 to $74,999 | 23 (3.0%) | 89 (11.2%) |
| $75,000 to $99,999 | 71 (9.1%) | 50 (6.3%) |
| $100,000+ | 42 (5.4%) | 11 (1.4%) |
| Total | 777 (100.0%) | 795 (100.0%) |
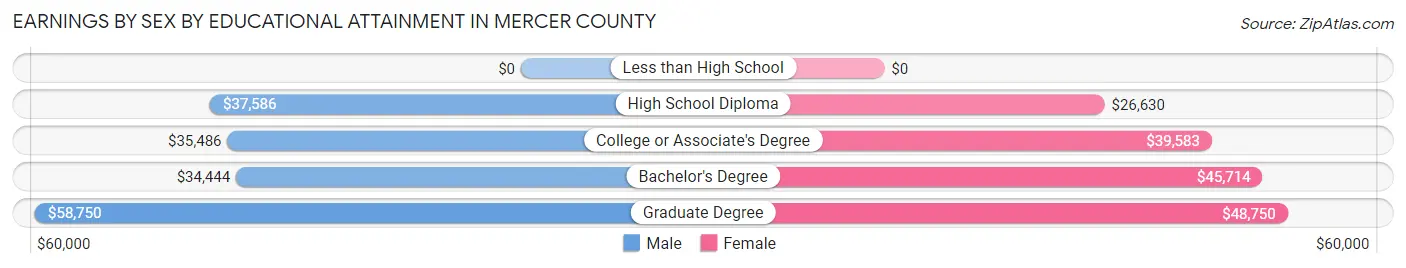
Earnings by Sex by Educational Attainment in Mercer County
Average earnings in Mercer County are $36,120 for men and $39,598 for women, a difference of 8.8%. Men with an educational attainment of graduate degree enjoy the highest average annual earnings of $58,750, while those with bachelor's degree education earn the least with $34,444. Women with an educational attainment of graduate degree earn the most with the average annual earnings of $48,750, while those with high school diploma education have the smallest earnings of $26,630.
| Educational Attainment | Male Income | Female Income |
| Less than High School | - | - |
| High School Diploma | $37,586 | $26,630 |
| College or Associate's Degree | $35,486 | $39,583 |
| Bachelor's Degree | $34,444 | $45,714 |
| Graduate Degree | $58,750 | $48,750 |
| Total | $36,120 | $39,598 |
Family Income in Mercer County
Family Income Brackets in Mercer County
According to the Mercer County family income data, there are 178 families falling into the $75,000 to $99,999 income range, which is the most common income bracket and makes up 23.8% of all families. Conversely, the $10,000 to $14,999 income bracket is the least frequent group with only 6 families (0.8%) belonging to this category.
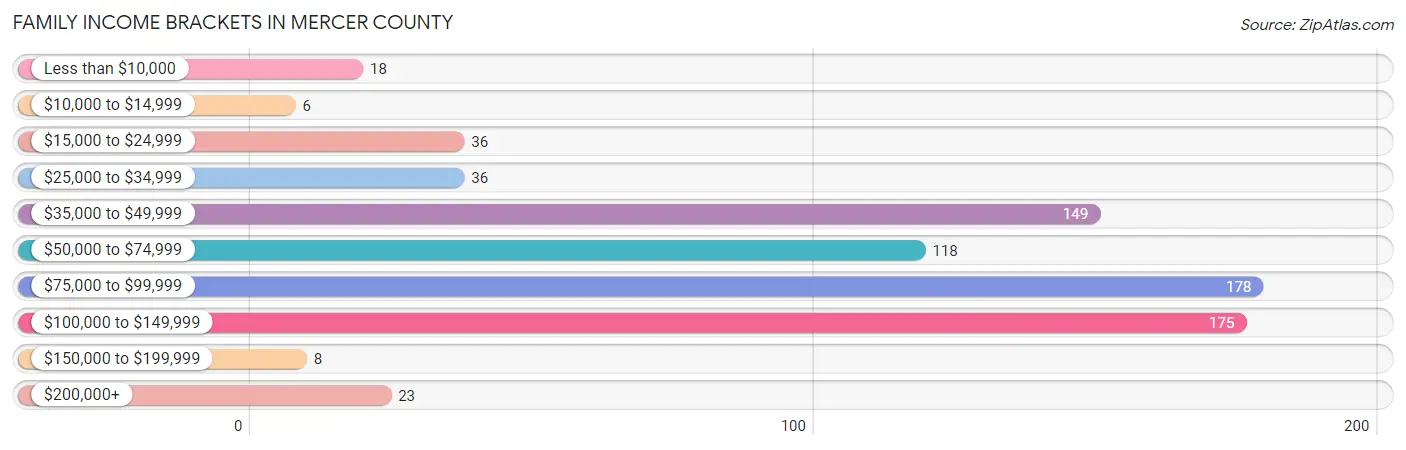
| Income Bracket | # Families | % Families |
| Less than $10,000 | 18 | 2.4% |
| $10,000 to $14,999 | 6 | 0.8% |
| $15,000 to $24,999 | 36 | 4.8% |
| $25,000 to $34,999 | 36 | 4.8% |
| $35,000 to $49,999 | 149 | 19.9% |
| $50,000 to $74,999 | 118 | 15.8% |
| $75,000 to $99,999 | 178 | 23.8% |
| $100,000 to $149,999 | 175 | 23.4% |
| $150,000 to $199,999 | 8 | 1.1% |
| $200,000+ | 23 | 3.1% |
Family Income by Famaliy Size in Mercer County
3-person families (100 | 13.4%) account for the highest median family income in Mercer County with $102,778 per family, while 2-person families (470 | 62.9%) have the highest median income of $35,125 per family member.
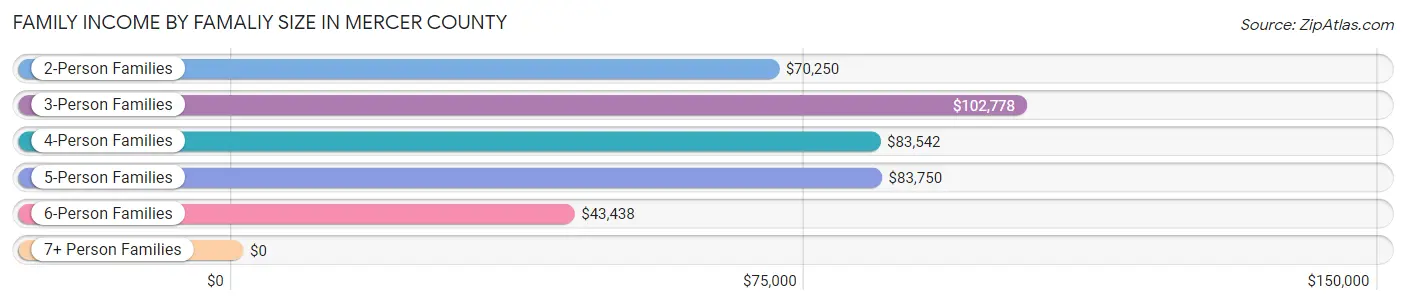
| Income Bracket | # Families | Median Income |
| 2-Person Families | 470 (62.9%) | $70,250 |
| 3-Person Families | 100 (13.4%) | $102,778 |
| 4-Person Families | 119 (15.9%) | $83,542 |
| 5-Person Families | 39 (5.2%) | $83,750 |
| 6-Person Families | 12 (1.6%) | $43,438 |
| 7+ Person Families | 7 (0.9%) | $0 |
| Total | 747 (100.0%) | $76,875 |
Family Income by Number of Earners in Mercer County
The median family income in Mercer County is $76,875, with families comprising 3+ earners (82) having the highest median family income of $97,656, while families with no earners (185) have the lowest median family income of $50,250, accounting for 11.0% and 24.8% of families, respectively.
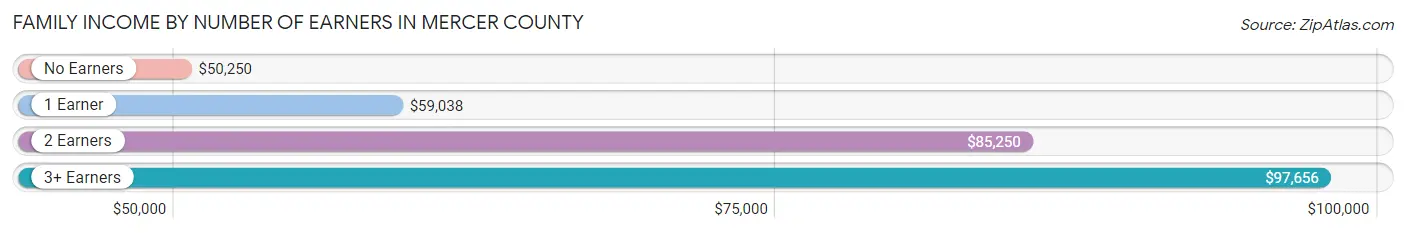
| Number of Earners | # Families | Median Income |
| No Earners | 185 (24.8%) | $50,250 |
| 1 Earner | 202 (27.0%) | $59,038 |
| 2 Earners | 278 (37.2%) | $85,250 |
| 3+ Earners | 82 (11.0%) | $97,656 |
| Total | 747 (100.0%) | $76,875 |
Household Income in Mercer County
Household Income Brackets in Mercer County
With 219 households falling in the category, the $100,000 to $149,999 income range is the most frequent in Mercer County, accounting for 17.5% of all households. In contrast, only 14 households (1.1%) fall into the $150,000 to $199,999 income bracket, making it the least populous group.
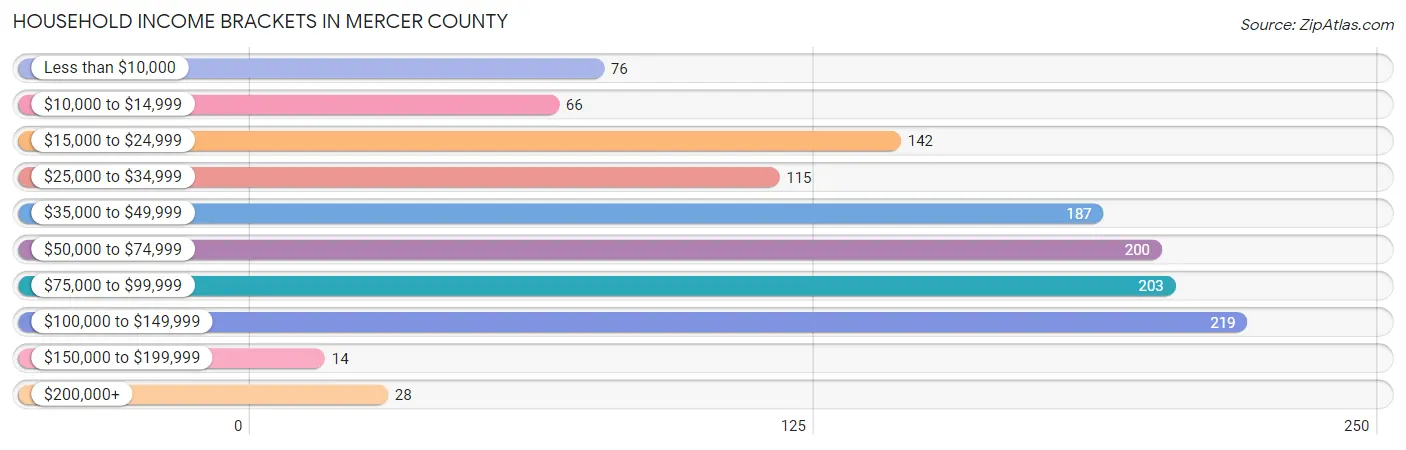
| Income Bracket | # Households | % Households |
| Less than $10,000 | 76 | 6.1% |
| $10,000 to $14,999 | 66 | 5.3% |
| $15,000 to $24,999 | 142 | 11.3% |
| $25,000 to $34,999 | 115 | 9.2% |
| $35,000 to $49,999 | 187 | 14.9% |
| $50,000 to $74,999 | 200 | 16.0% |
| $75,000 to $99,999 | 203 | 16.2% |
| $100,000 to $149,999 | 219 | 17.5% |
| $150,000 to $199,999 | 14 | 1.1% |
| $200,000+ | 28 | 2.2% |
Household Income by Householder Age in Mercer County
The median household income in Mercer County is $55,592, with the highest median household income of $71,250 found in the 25 to 44 years age bracket for the primary householder. A total of 284 households (22.7%) fall into this category. Meanwhile, the 15 to 24 years age bracket for the primary householder has the lowest median household income of $0, with 27 households (2.1%) in this group.
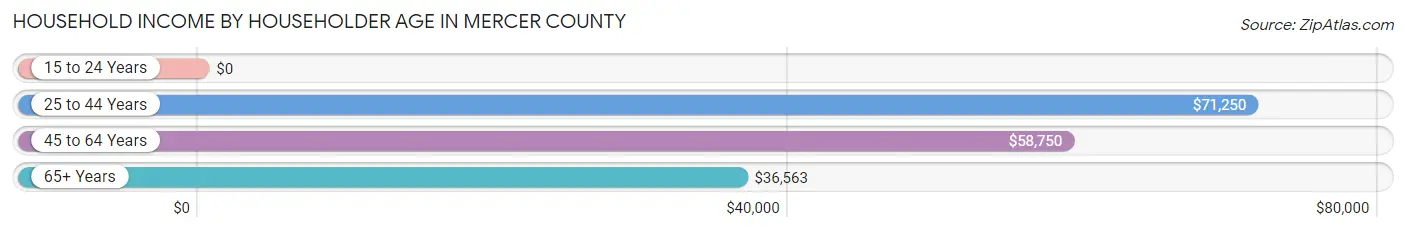
| Income Bracket | # Households | Median Income |
| 15 to 24 Years | 27 (2.1%) | $0 |
| 25 to 44 Years | 284 (22.7%) | $71,250 |
| 45 to 64 Years | 490 (39.1%) | $58,750 |
| 65+ Years | 452 (36.1%) | $36,563 |
| Total | 1,253 (100.0%) | $55,592 |
Poverty in Mercer County
Income Below Poverty by Sex and Age in Mercer County
With 15.4% poverty level for males and 14.5% for females among the residents of Mercer County, 15 year old males and 12 to 14 year old females are the most vulnerable to poverty, with 22 males (43.1%) and 47 females (55.3%) in their respective age groups living below the poverty level.
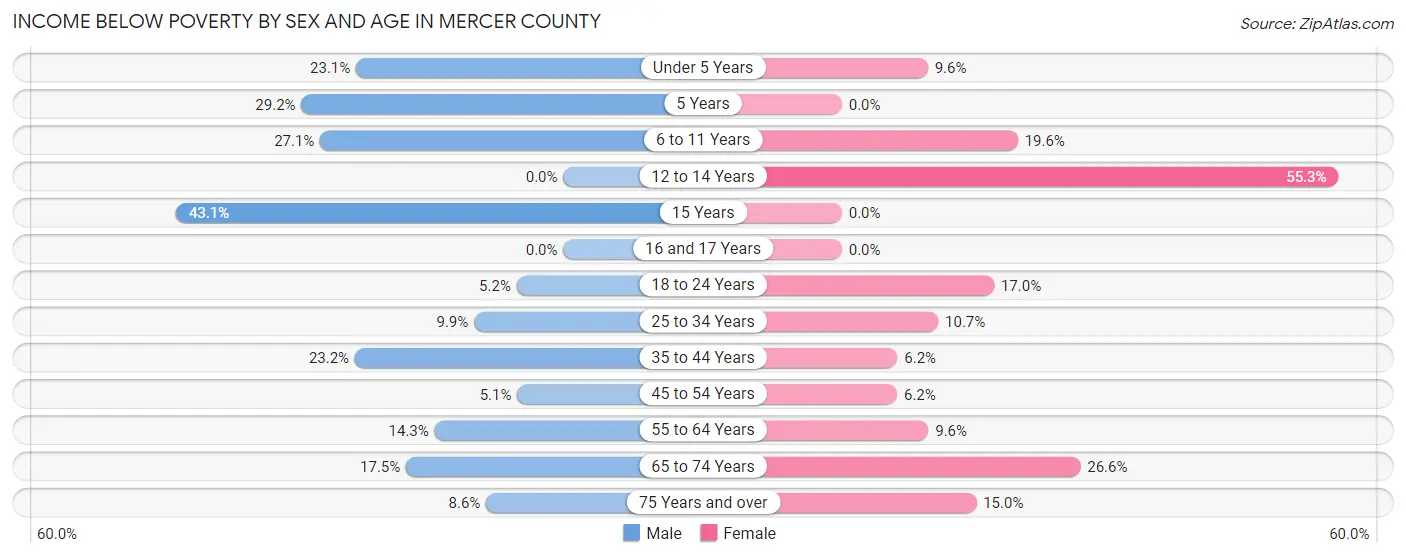
| Age Bracket | Male | Female |
| Under 5 Years | 33 (23.1%) | 11 (9.6%) |
| 5 Years | 7 (29.2%) | 0 (0.0%) |
| 6 to 11 Years | 39 (27.1%) | 29 (19.6%) |
| 12 to 14 Years | 0 (0.0%) | 47 (55.3%) |
| 15 Years | 22 (43.1%) | 0 (0.0%) |
| 16 and 17 Years | 0 (0.0%) | 0 (0.0%) |
| 18 to 24 Years | 7 (5.2%) | 20 (17.0%) |
| 25 to 34 Years | 18 (9.9%) | 19 (10.7%) |
| 35 to 44 Years | 39 (23.2%) | 12 (6.2%) |
| 45 to 54 Years | 10 (5.1%) | 12 (6.1%) |
| 55 to 64 Years | 37 (14.3%) | 26 (9.6%) |
| 65 to 74 Years | 38 (17.5%) | 51 (26.6%) |
| 75 Years and over | 11 (8.6%) | 28 (15.0%) |
| Total | 261 (15.4%) | 255 (14.5%) |
Income Above Poverty by Sex and Age in Mercer County
According to the poverty statistics in Mercer County, males aged 12 to 14 years and females aged 5 years are the age groups that are most secure financially, with 100.0% of males and 100.0% of females in these age groups living above the poverty line.
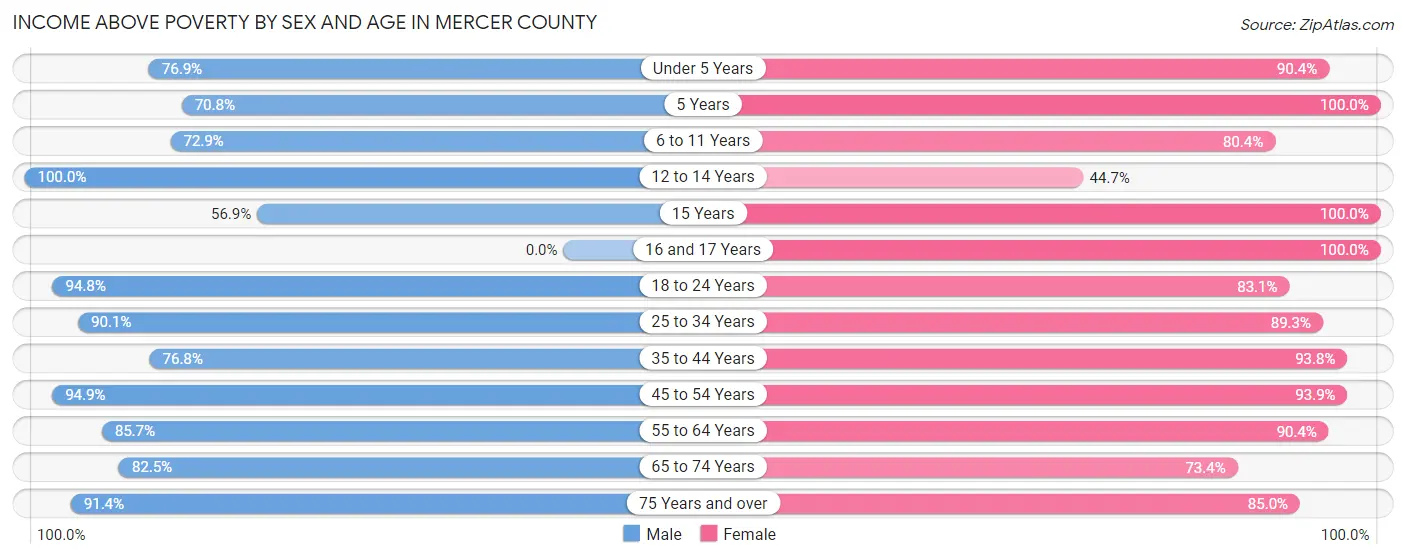
| Age Bracket | Male | Female |
| Under 5 Years | 110 (76.9%) | 104 (90.4%) |
| 5 Years | 17 (70.8%) | 16 (100.0%) |
| 6 to 11 Years | 105 (72.9%) | 119 (80.4%) |
| 12 to 14 Years | 50 (100.0%) | 38 (44.7%) |
| 15 Years | 29 (56.9%) | 27 (100.0%) |
| 16 and 17 Years | 0 (0.0%) | 38 (100.0%) |
| 18 to 24 Years | 128 (94.8%) | 98 (83.1%) |
| 25 to 34 Years | 163 (90.1%) | 158 (89.3%) |
| 35 to 44 Years | 129 (76.8%) | 182 (93.8%) |
| 45 to 54 Years | 185 (94.9%) | 183 (93.9%) |
| 55 to 64 Years | 221 (85.7%) | 244 (90.4%) |
| 65 to 74 Years | 179 (82.5%) | 141 (73.4%) |
| 75 Years and over | 117 (91.4%) | 159 (85.0%) |
| Total | 1,433 (84.6%) | 1,507 (85.5%) |
Income Below Poverty Among Married-Couple Families in Mercer County
The poverty statistics for married-couple families in Mercer County show that 3.9% or 25 of the total 639 families live below the poverty line. Families with 5 or more children have the highest poverty rate of 100.0%, comprising of 2 families. On the other hand, families with no children have the lowest poverty rate of 2.1%, which includes 10 families.
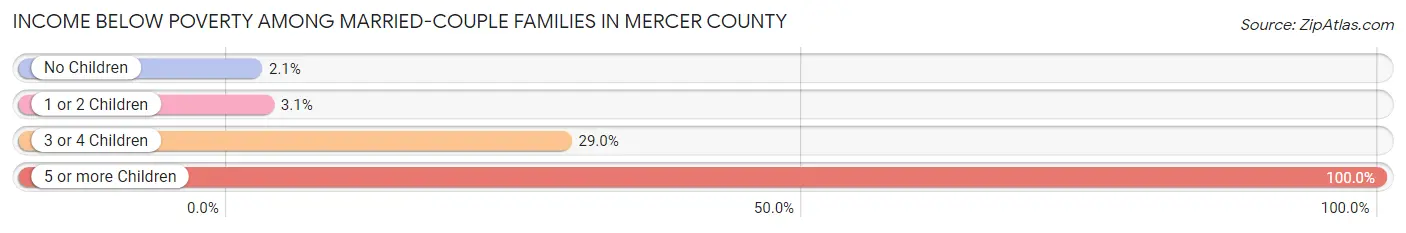
| Children | Above Poverty | Below Poverty |
| No Children | 468 (97.9%) | 10 (2.1%) |
| 1 or 2 Children | 124 (96.9%) | 4 (3.1%) |
| 3 or 4 Children | 22 (71.0%) | 9 (29.0%) |
| 5 or more Children | 0 (0.0%) | 2 (100.0%) |
| Total | 614 (96.1%) | 25 (3.9%) |
Income Below Poverty Among Single-Parent Households in Mercer County
According to the poverty data in Mercer County, 44.7% or 21 single-father households and 3.3% or 2 single-mother households are living below the poverty line. Among single-father households, those with 5 or more children have the highest poverty rate, with 4 households (100.0%) experiencing poverty. Likewise, among single-mother households, those with 3 or 4 children have the highest poverty rate, with 2 households (100.0%) falling below the poverty line.
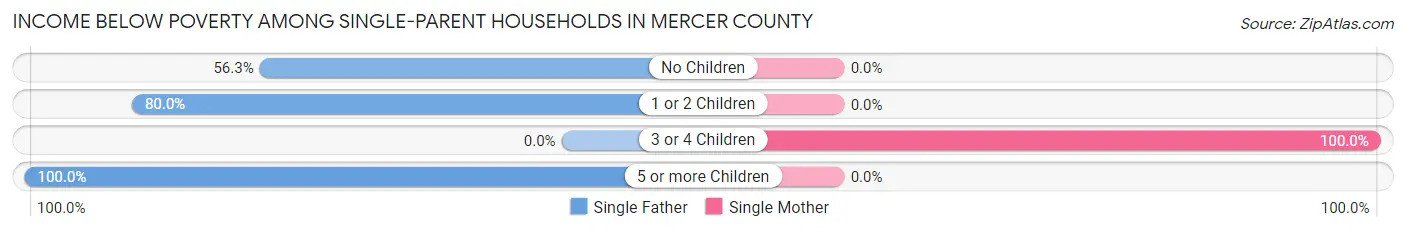
| Children | Single Father | Single Mother |
| No Children | 9 (56.2%) | 0 (0.0%) |
| 1 or 2 Children | 8 (80.0%) | 0 (0.0%) |
| 3 or 4 Children | 0 (0.0%) | 2 (100.0%) |
| 5 or more Children | 4 (100.0%) | 0 (0.0%) |
| Total | 21 (44.7%) | 2 (3.3%) |
Income Below Poverty Among Married-Couple vs Single-Parent Households in Mercer County
The poverty data for Mercer County shows that 25 of the married-couple family households (3.9%) and 23 of the single-parent households (21.3%) are living below the poverty level. Within the married-couple family households, those with 5 or more children have the highest poverty rate, with 2 households (100.0%) falling below the poverty line. Among the single-parent households, those with 5 or more children have the highest poverty rate, with 4 household (100.0%) living below poverty.
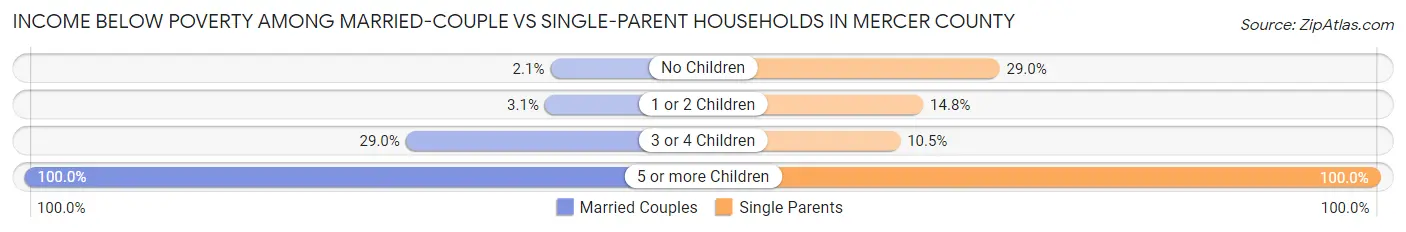
| Children | Married-Couple Families | Single-Parent Households |
| No Children | 10 (2.1%) | 9 (29.0%) |
| 1 or 2 Children | 4 (3.1%) | 8 (14.8%) |
| 3 or 4 Children | 9 (29.0%) | 2 (10.5%) |
| 5 or more Children | 2 (100.0%) | 4 (100.0%) |
| Total | 25 (3.9%) | 23 (21.3%) |
Race in Mercer County
The most populous races in Mercer County are White / Caucasian (3,320 | 94.4%), Two or more Races (107 | 3.0%), and Hispanic or Latino (105 | 3.0%).
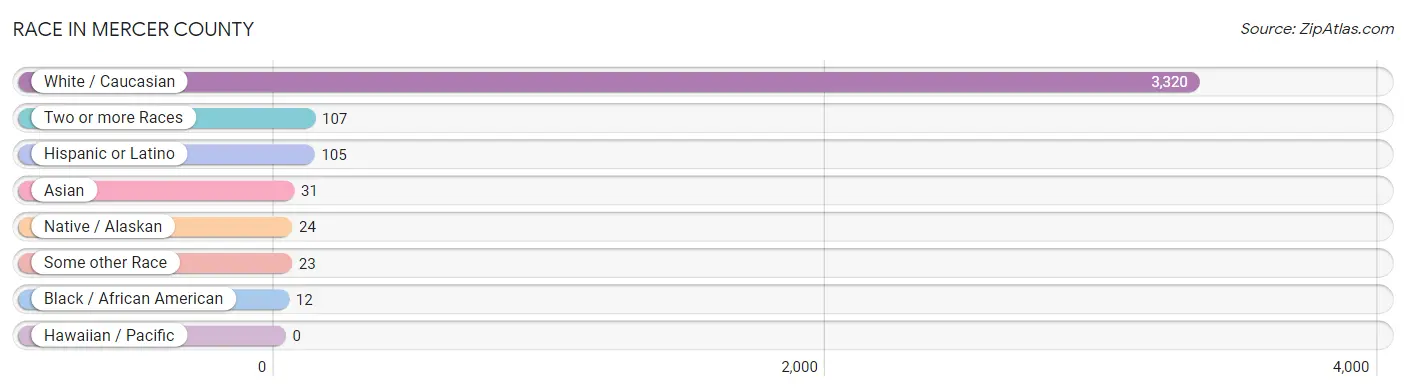
| Race | # Population | % Population |
| Asian | 31 | 0.9% |
| Black / African American | 12 | 0.3% |
| Hawaiian / Pacific | 0 | 0.0% |
| Hispanic or Latino | 105 | 3.0% |
| Native / Alaskan | 24 | 0.7% |
| White / Caucasian | 3,320 | 94.4% |
| Two or more Races | 107 | 3.0% |
| Some other Race | 23 | 0.6% |
| Total | 3,517 | 100.0% |
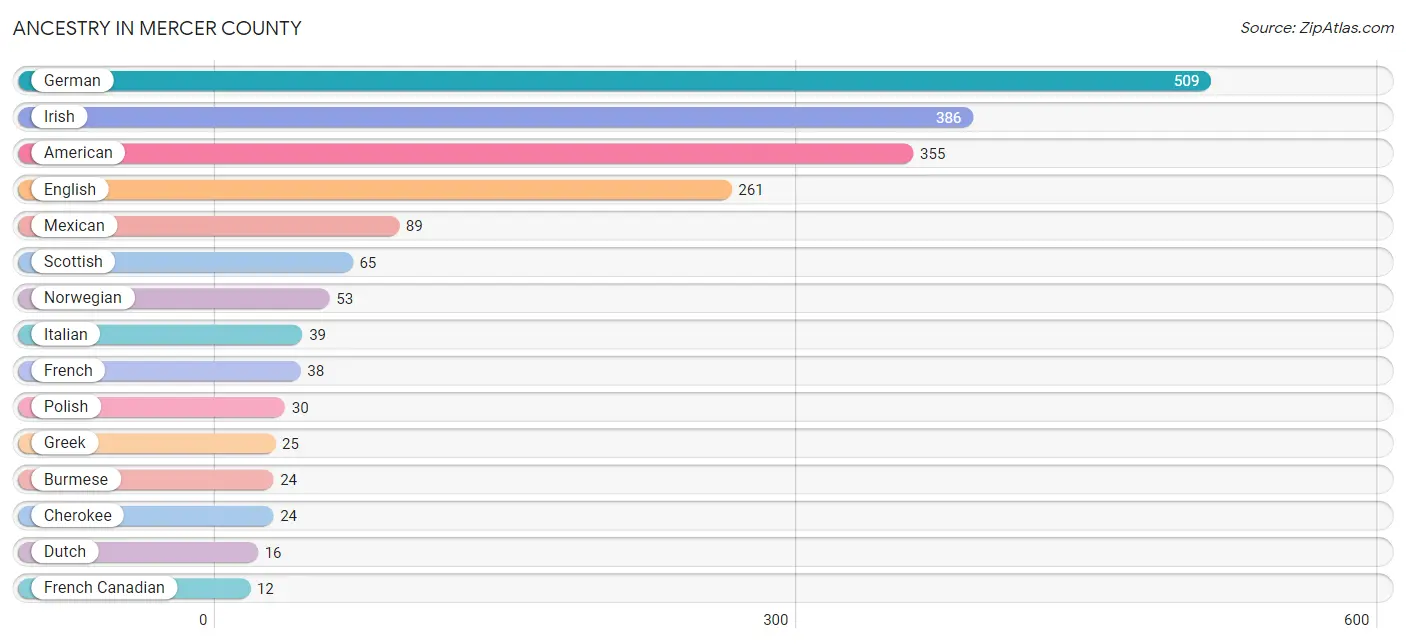
Ancestry in Mercer County
The most populous ancestries reported in Mercer County are German (509 | 14.5%), Irish (386 | 11.0%), American (355 | 10.1%), English (261 | 7.4%), and Mexican (89 | 2.5%), together accounting for 45.5% of all Mercer County residents.
| Ancestry | # Population | % Population |
| African | 2 | 0.1% |
| American | 355 | 10.1% |
| Arab | 11 | 0.3% |
| Austrian | 3 | 0.1% |
| British | 1 | 0.0% |
| Burmese | 24 | 0.7% |
| Cajun | 3 | 0.1% |
| Central American Indian | 5 | 0.1% |
| Cherokee | 24 | 0.7% |
| Czechoslovakian | 5 | 0.1% |
| Dutch | 16 | 0.4% |
| Egyptian | 11 | 0.3% |
| English | 261 | 7.4% |
| European | 6 | 0.2% |
| French | 38 | 1.1% |
| French Canadian | 12 | 0.3% |
| German | 509 | 14.5% |
| Greek | 25 | 0.7% |
| Hungarian | 6 | 0.2% |
| Irish | 386 | 11.0% |
| Italian | 39 | 1.1% |
| Mexican | 89 | 2.5% |
| Norwegian | 53 | 1.5% |
| Pennsylvania German | 5 | 0.1% |
| Polish | 30 | 0.9% |
| Puerto Rican | 4 | 0.1% |
| Romanian | 2 | 0.1% |
| Russian | 12 | 0.3% |
| Scotch-Irish | 10 | 0.3% |
| Scottish | 65 | 1.8% |
| South American | 10 | 0.3% |
| Spaniard | 1 | 0.0% |
| Subsaharan African | 2 | 0.1% |
| Swedish | 12 | 0.3% |
| Swiss | 7 | 0.2% |
| Welsh | 5 | 0.1% | View All 36 Rows |
Immigrants in Mercer County
The most numerous immigrant groups reported in Mercer County came from Central America (71 | 2.0%), Latin America (71 | 2.0%), Mexico (71 | 2.0%), Asia (31 | 0.9%), and Eastern Asia (16 | 0.4%), together accounting for 7.4% of all Mercer County residents.
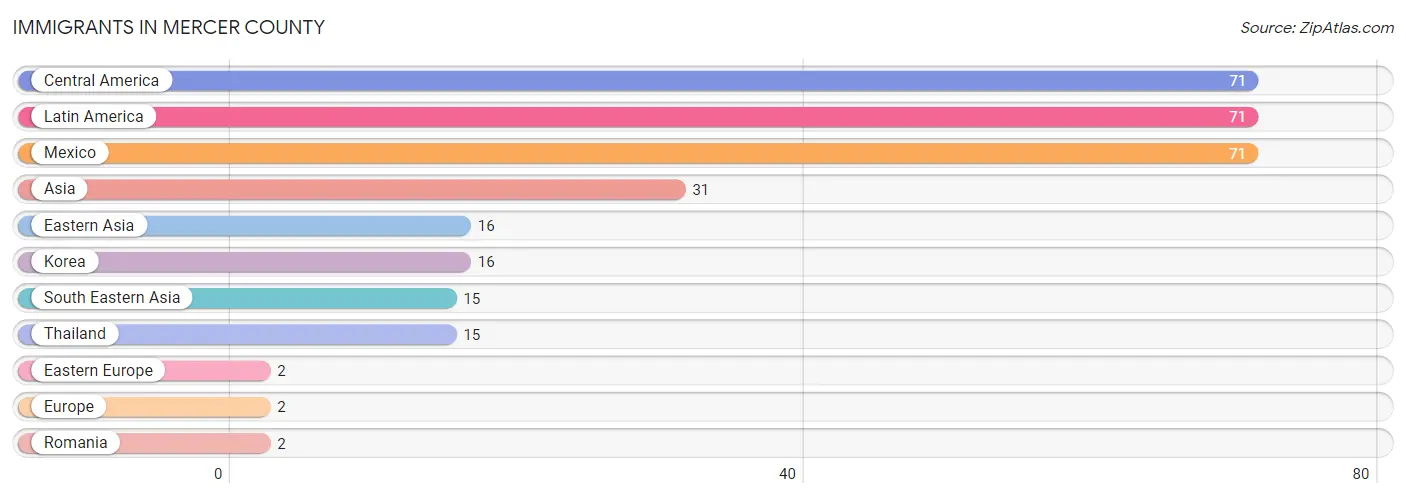
| Immigration Origin | # Population | % Population |
| Asia | 31 | 0.9% |
| Central America | 71 | 2.0% |
| Eastern Asia | 16 | 0.4% |
| Eastern Europe | 2 | 0.1% |
| Europe | 2 | 0.1% |
| Korea | 16 | 0.4% |
| Latin America | 71 | 2.0% |
| Mexico | 71 | 2.0% |
| Romania | 2 | 0.1% |
| South Eastern Asia | 15 | 0.4% |
| Thailand | 15 | 0.4% | View All 11 Rows |
Sex and Age in Mercer County
Sex and Age in Mercer County
The most populous age groups in Mercer County are Under 5 Years (143 | 8.3%) for men and 60 to 64 Years (158 | 8.8%) for women.
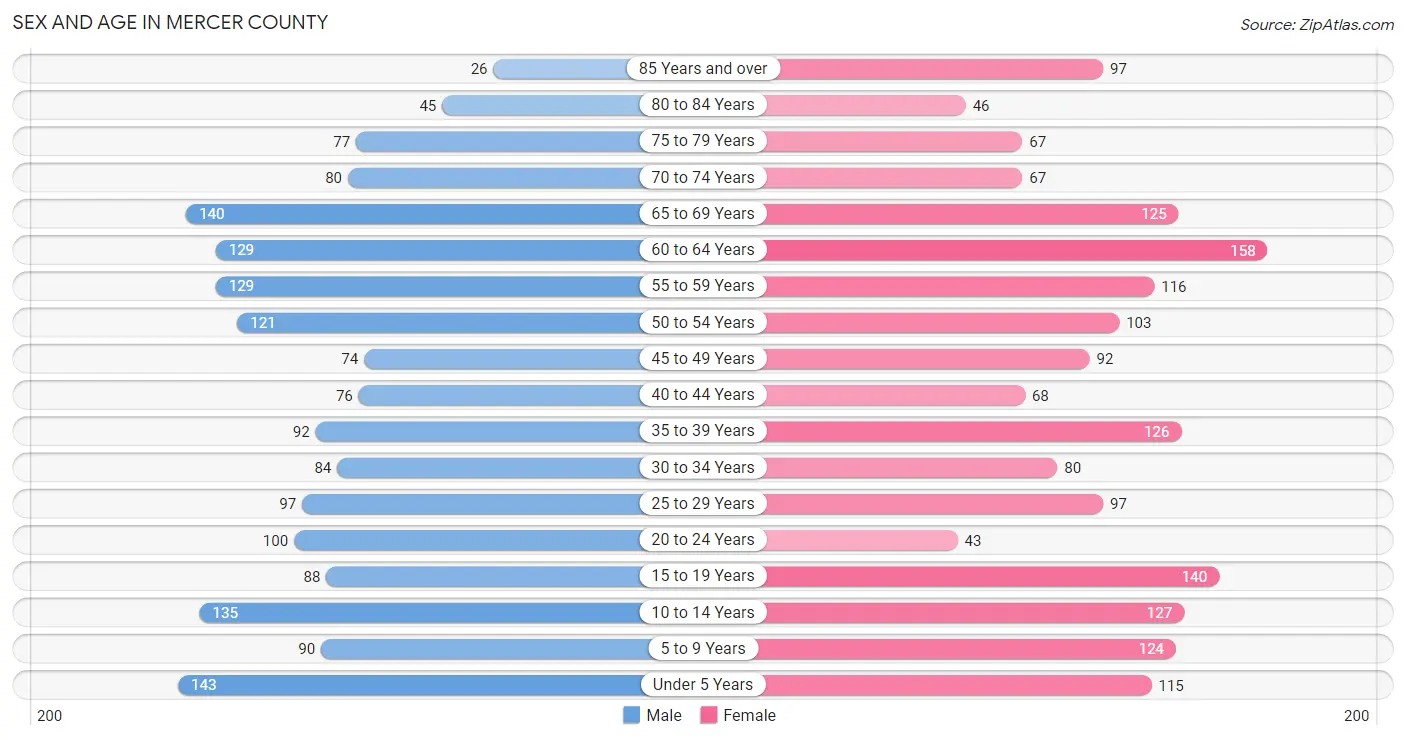
| Age Bracket | Male | Female |
| Under 5 Years | 143 (8.3%) | 115 (6.4%) |
| 5 to 9 Years | 90 (5.2%) | 124 (6.9%) |
| 10 to 14 Years | 135 (7.8%) | 127 (7.1%) |
| 15 to 19 Years | 88 (5.1%) | 140 (7.8%) |
| 20 to 24 Years | 100 (5.8%) | 43 (2.4%) |
| 25 to 29 Years | 97 (5.6%) | 97 (5.4%) |
| 30 to 34 Years | 84 (4.9%) | 80 (4.5%) |
| 35 to 39 Years | 92 (5.3%) | 126 (7.0%) |
| 40 to 44 Years | 76 (4.4%) | 68 (3.8%) |
| 45 to 49 Years | 74 (4.3%) | 92 (5.1%) |
| 50 to 54 Years | 121 (7.0%) | 103 (5.8%) |
| 55 to 59 Years | 129 (7.5%) | 116 (6.5%) |
| 60 to 64 Years | 129 (7.5%) | 158 (8.8%) |
| 65 to 69 Years | 140 (8.1%) | 125 (7.0%) |
| 70 to 74 Years | 80 (4.6%) | 67 (3.7%) |
| 75 to 79 Years | 77 (4.5%) | 67 (3.7%) |
| 80 to 84 Years | 45 (2.6%) | 46 (2.6%) |
| 85 Years and over | 26 (1.5%) | 97 (5.4%) |
| Total | 1,726 (100.0%) | 1,791 (100.0%) |
Families and Households in Mercer County
Median Family Size in Mercer County
The median family size in Mercer County is 3.67 persons per family, with single female/mother families (61 | 8.2%) accounting for the largest median family size of 4.31 persons per family. On the other hand, married-couple families (639 | 85.5%) represent the smallest median family size with 3.56 persons per family.
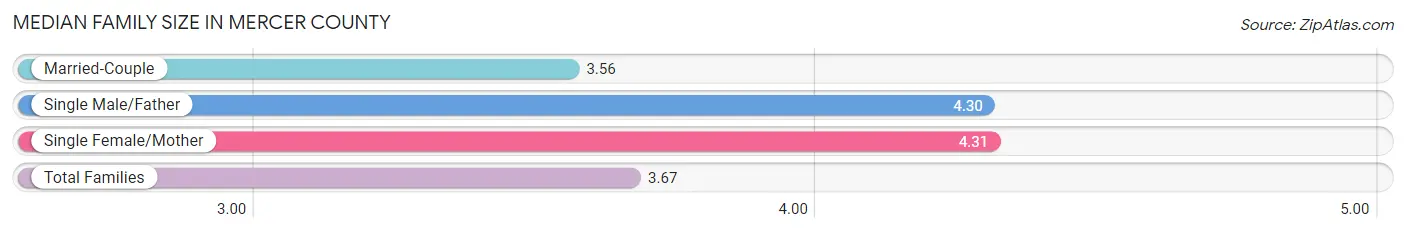
| Family Type | # Families | Family Size |
| Married-Couple | 639 (85.5%) | 3.56 |
| Single Male/Father | 47 (6.3%) | 4.30 |
| Single Female/Mother | 61 (8.2%) | 4.31 |
| Total Families | 747 (100.0%) | 3.67 |
Median Household Size in Mercer County
The median household size in Mercer County is 2.75 persons per household, with single male/father households (47 | 3.7%) accounting for the largest median household size of 5.28 persons per household. non-family households (506 | 40.4%) represent the smallest median household size with 1.25 persons per household.
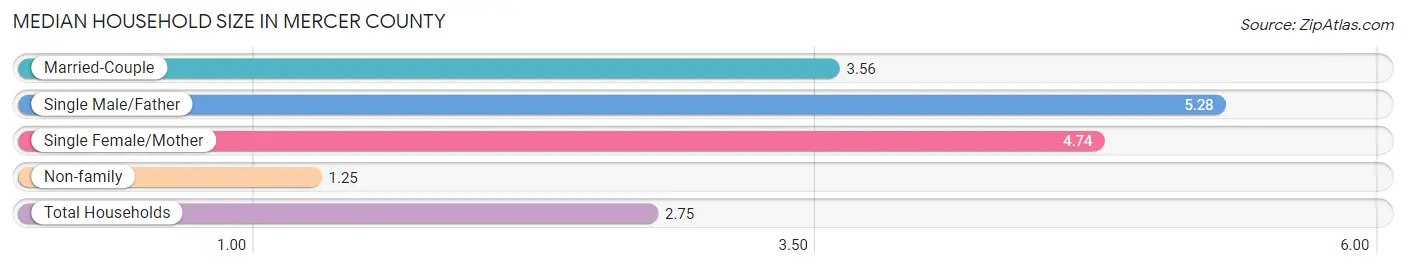
| Household Type | # Households | Household Size |
| Married-Couple | 639 (51.0%) | 3.56 |
| Single Male/Father | 47 (3.7%) | 5.28 |
| Single Female/Mother | 61 (4.9%) | 4.74 |
| Non-family | 506 (40.4%) | 1.25 |
| Total Households | 1,253 (100.0%) | 2.75 |
Household Size by Marriage Status in Mercer County
Out of a total of 1,253 households in Mercer County, 747 (59.6%) are family households, while 506 (40.4%) are nonfamily households. The most numerous type of family households are 2-person households, comprising 444, and the most common type of nonfamily households are 1-person households, comprising 421.
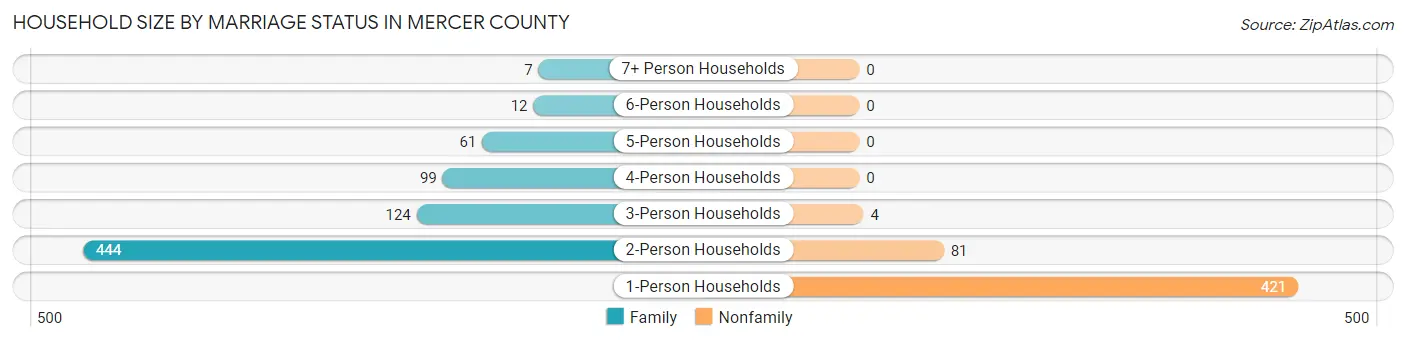
| Household Size | Family Households | Nonfamily Households |
| 1-Person Households | - | 421 (33.6%) |
| 2-Person Households | 444 (35.4%) | 81 (6.5%) |
| 3-Person Households | 124 (9.9%) | 4 (0.3%) |
| 4-Person Households | 99 (7.9%) | 0 (0.0%) |
| 5-Person Households | 61 (4.9%) | 0 (0.0%) |
| 6-Person Households | 12 (1.0%) | 0 (0.0%) |
| 7+ Person Households | 7 (0.6%) | 0 (0.0%) |
| Total | 747 (59.6%) | 506 (40.4%) |
Female Fertility in Mercer County
Fertility by Age in Mercer County
Average fertility rate in Mercer County is 77.0 births per 1,000 women. Women in the age bracket of 15 to 19 years have the highest fertility rate with 129.0 births per 1,000 women. Women in the age bracket of 20 to 34 years acount for 44.2% of all women with births.
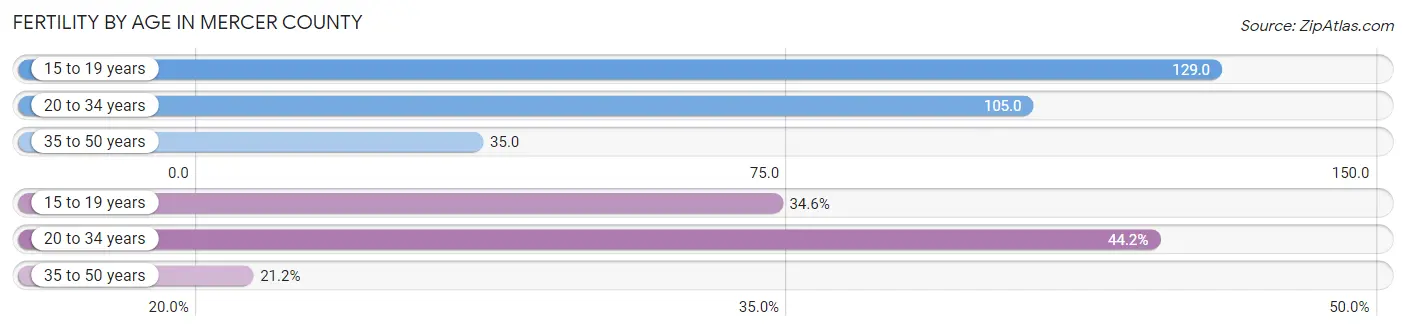
| Age Bracket | Women with Births | Births / 1,000 Women |
| 15 to 19 years | 18 (34.6%) | 129.0 |
| 20 to 34 years | 23 (44.2%) | 105.0 |
| 35 to 50 years | 11 (21.1%) | 35.0 |
| Total | 52 (100.0%) | 77.0 |
Fertility by Age by Marriage Status in Mercer County
44.2% of women with births (52) in Mercer County are married. The highest percentage of unmarried women with births falls into 15 to 19 years age bracket with 100.0% of them unmarried at the time of birth, while the lowest percentage of unmarried women with births belong to 20 to 34 years age bracket with 0.0% of them unmarried.
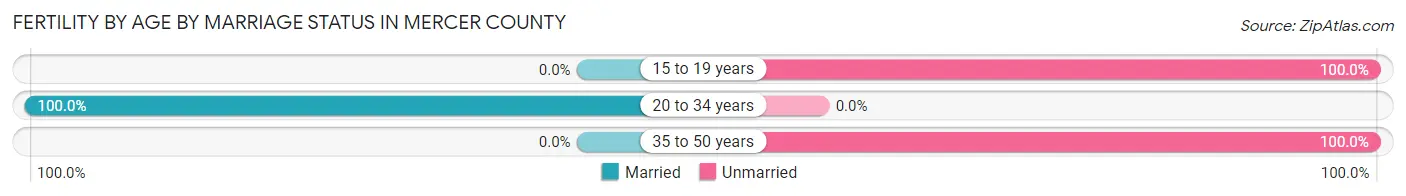
| Age Bracket | Married | Unmarried |
| 15 to 19 years | 0 (0.0%) | 18 (100.0%) |
| 20 to 34 years | 23 (100.0%) | 0 (0.0%) |
| 35 to 50 years | 0 (0.0%) | 11 (100.0%) |
| Total | 23 (44.2%) | 29 (55.8%) |
Fertility by Education in Mercer County
Average fertility rate in Mercer County is 77.0 births per 1,000 women. Women with the education attainment of college or associate's degree have the highest fertility rate of 124.0 births per 1,000 women, while women with the education attainment of less than high school have the lowest fertility at 24.0 births per 1,000 women. Women with the education attainment of college or associate's degree represent 44.2% of all women with births.
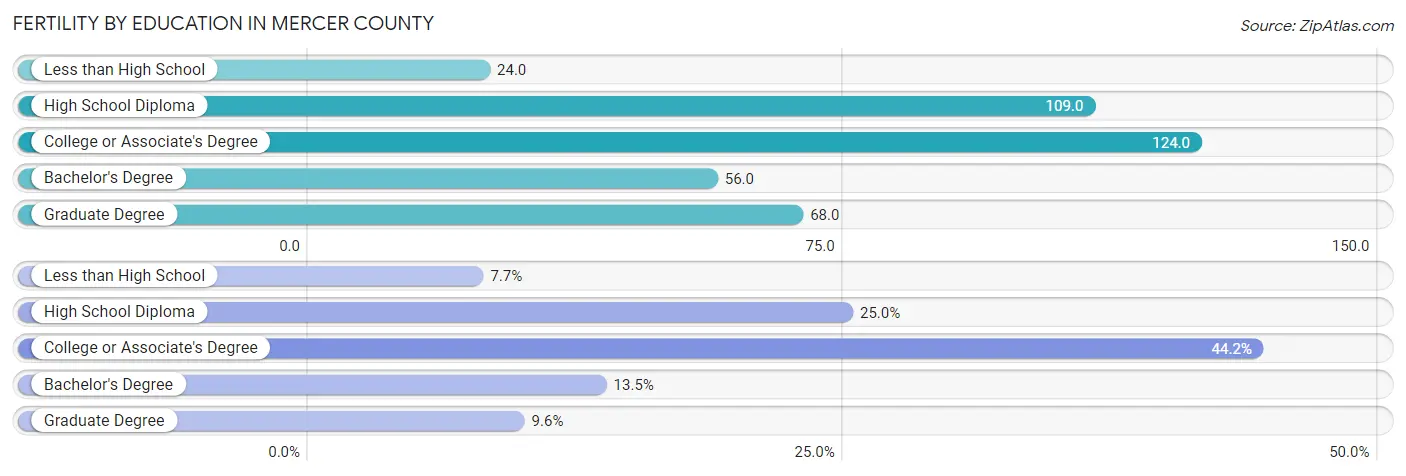
| Educational Attainment | Women with Births | Births / 1,000 Women |
| Less than High School | 4 (7.7%) | 24.0 |
| High School Diploma | 13 (25.0%) | 109.0 |
| College or Associate's Degree | 23 (44.2%) | 124.0 |
| Bachelor's Degree | 7 (13.5%) | 56.0 |
| Graduate Degree | 5 (9.6%) | 68.0 |
| Total | 52 (100.0%) | 77.0 |
Fertility by Education by Marriage Status in Mercer County
55.8% of women with births in Mercer County are unmarried. Women with the educational attainment of less than high school are most likely to be married with 100.0% of them married at childbirth, while women with the educational attainment of high school diploma are least likely to be married with 84.6% of them unmarried at childbirth.
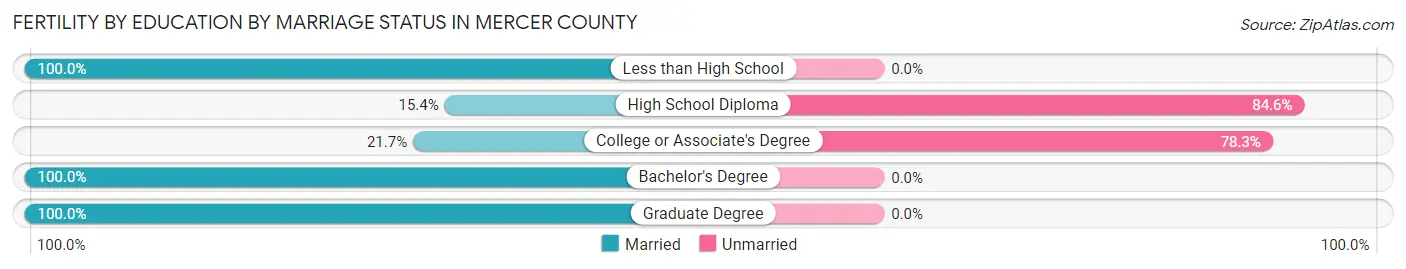
| Educational Attainment | Married | Unmarried |
| Less than High School | 4 (100.0%) | 0 (0.0%) |
| High School Diploma | 2 (15.4%) | 11 (84.6%) |
| College or Associate's Degree | 5 (21.7%) | 18 (78.3%) |
| Bachelor's Degree | 7 (100.0%) | 0 (0.0%) |
| Graduate Degree | 5 (100.0%) | 0 (0.0%) |
| Total | 23 (44.2%) | 29 (55.8%) |
Employment Characteristics in Mercer County
Employment by Class of Employer in Mercer County
Among the 1,484 employed individuals in Mercer County, private company employees (932 | 62.8%), self-employed (not incorporated) (215 | 14.5%), and not-for-profit organizations (118 | 8.0%) make up the most common classes of employment.
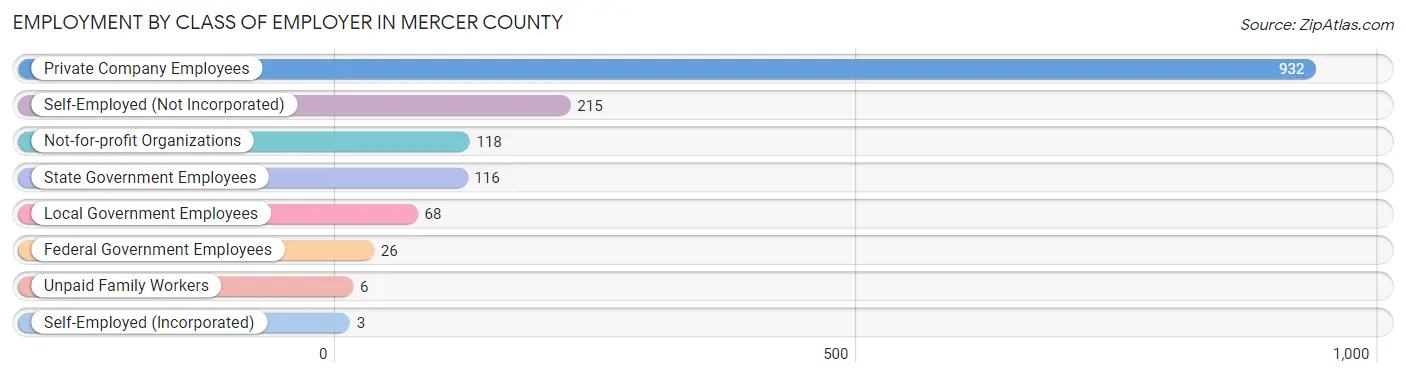
| Employer Class | # Employees | % Employees |
| Private Company Employees | 932 | 62.8% |
| Self-Employed (Incorporated) | 3 | 0.2% |
| Self-Employed (Not Incorporated) | 215 | 14.5% |
| Not-for-profit Organizations | 118 | 8.0% |
| Local Government Employees | 68 | 4.6% |
| State Government Employees | 116 | 7.8% |
| Federal Government Employees | 26 | 1.8% |
| Unpaid Family Workers | 6 | 0.4% |
| Total | 1,484 | 100.0% |
Employment Status by Age in Mercer County
According to the labor force statistics for Mercer County, out of the total population over 16 years of age (2,705), 57.2% or 1,547 individuals are in the labor force, with 2.9% or 45 of them unemployed. The age group with the highest labor force participation rate is 45 to 54 years, with 95.9% or 374 individuals in the labor force. Within the labor force, the 30 to 34 years age range has the highest percentage of unemployed individuals, with 19.1% or 22 of them being unemployed.
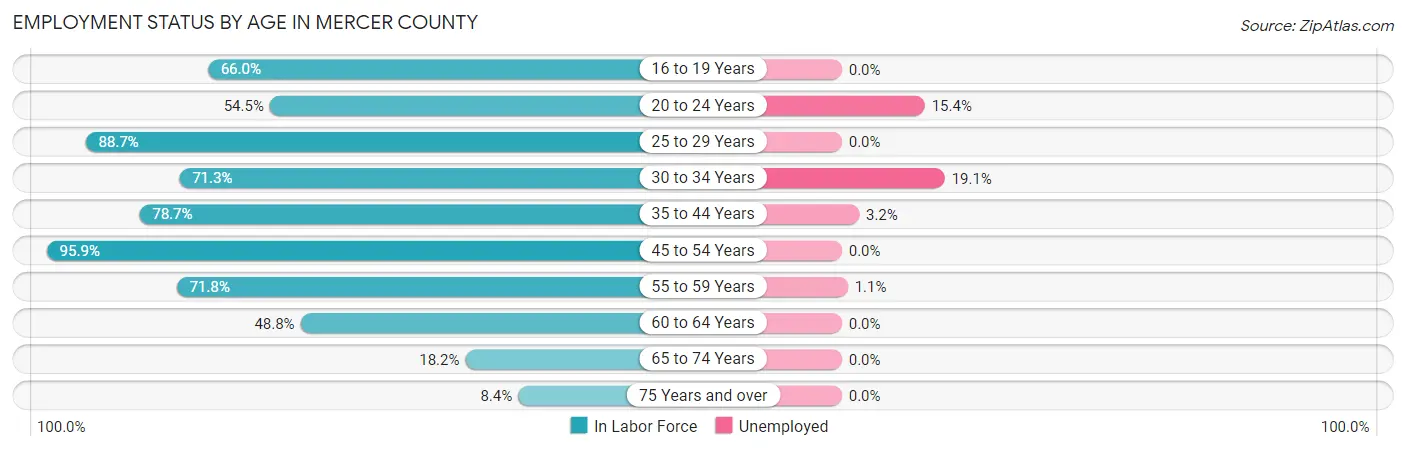
| Age Bracket | In Labor Force | Unemployed |
| 16 to 19 Years | 99 (66.0%) | 0 (0.0%) |
| 20 to 24 Years | 78 (54.5%) | 12 (15.4%) |
| 25 to 29 Years | 172 (88.7%) | 0 (0.0%) |
| 30 to 34 Years | 117 (71.3%) | 22 (19.1%) |
| 35 to 44 Years | 285 (78.7%) | 9 (3.2%) |
| 45 to 54 Years | 374 (95.9%) | 0 (0.0%) |
| 55 to 59 Years | 176 (71.8%) | 2 (1.1%) |
| 60 to 64 Years | 140 (48.8%) | 0 (0.0%) |
| 65 to 74 Years | 75 (18.2%) | 0 (0.0%) |
| 75 Years and over | 30 (8.4%) | 0 (0.0%) |
| Total | 1,547 (57.2%) | 45 (2.9%) |
Employment Status by Educational Attainment in Mercer County
According to labor force statistics for Mercer County, 77.0% of individuals (1,264) out of the total population between 25 and 64 years of age (1,642) are in the labor force, with 2.6% or 33 of them being unemployed. The group with the highest labor force participation rate are those with the educational attainment of bachelor's degree or higher, with 90.5% or 371 individuals in the labor force. Within the labor force, individuals with less than high school education have the highest percentage of unemployment, with 11.1% or 5 of them being unemployed.
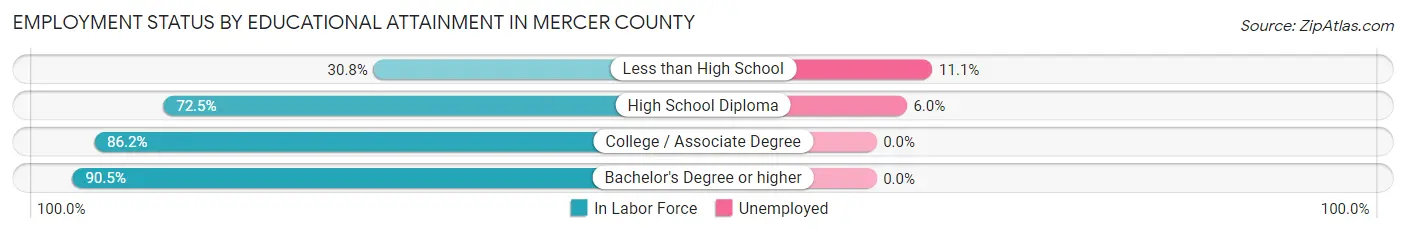
| Educational Attainment | In Labor Force | Unemployed |
| Less than High School | 45 (30.8%) | 16 (11.1%) |
| High School Diploma | 467 (72.5%) | 39 (6.0%) |
| College / Associate Degree | 381 (86.2%) | 0 (0.0%) |
| Bachelor's Degree or higher | 371 (90.5%) | 0 (0.0%) |
| Total | 1,264 (77.0%) | 43 (2.6%) |
Employment Occupations by Sex in Mercer County
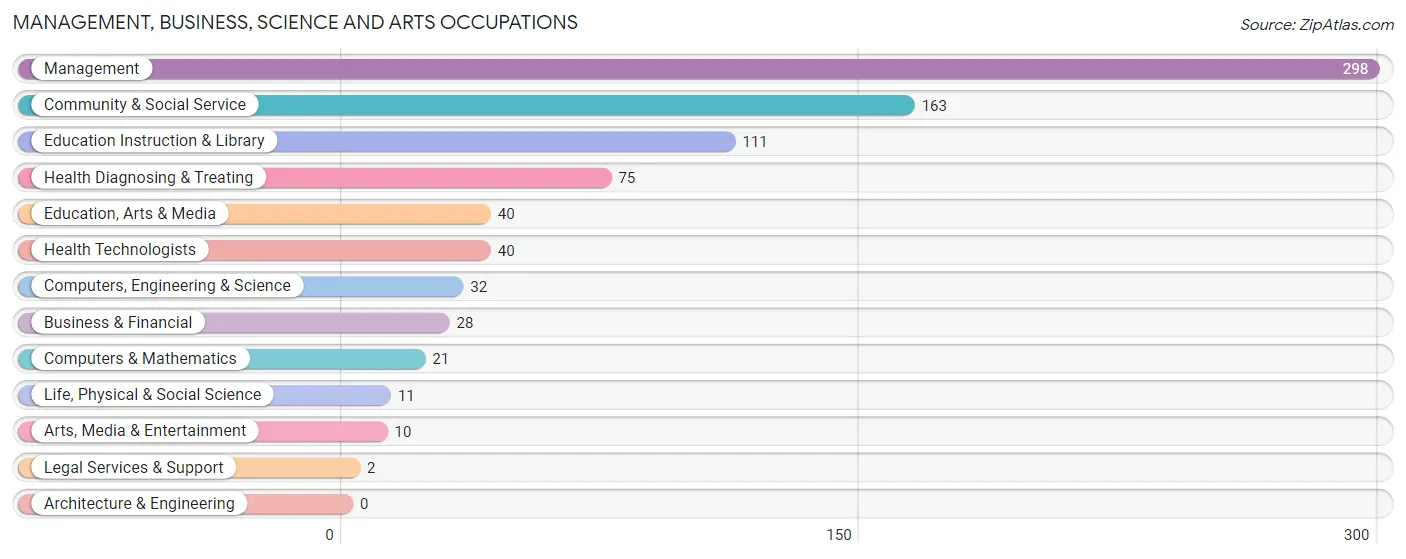
Management, Business, Science and Arts Occupations
The most common Management, Business, Science and Arts occupations in Mercer County are Management (298 | 20.0%), Community & Social Service (163 | 10.9%), Education Instruction & Library (111 | 7.4%), Health Diagnosing & Treating (75 | 5.0%), and Education, Arts & Media (40 | 2.7%).
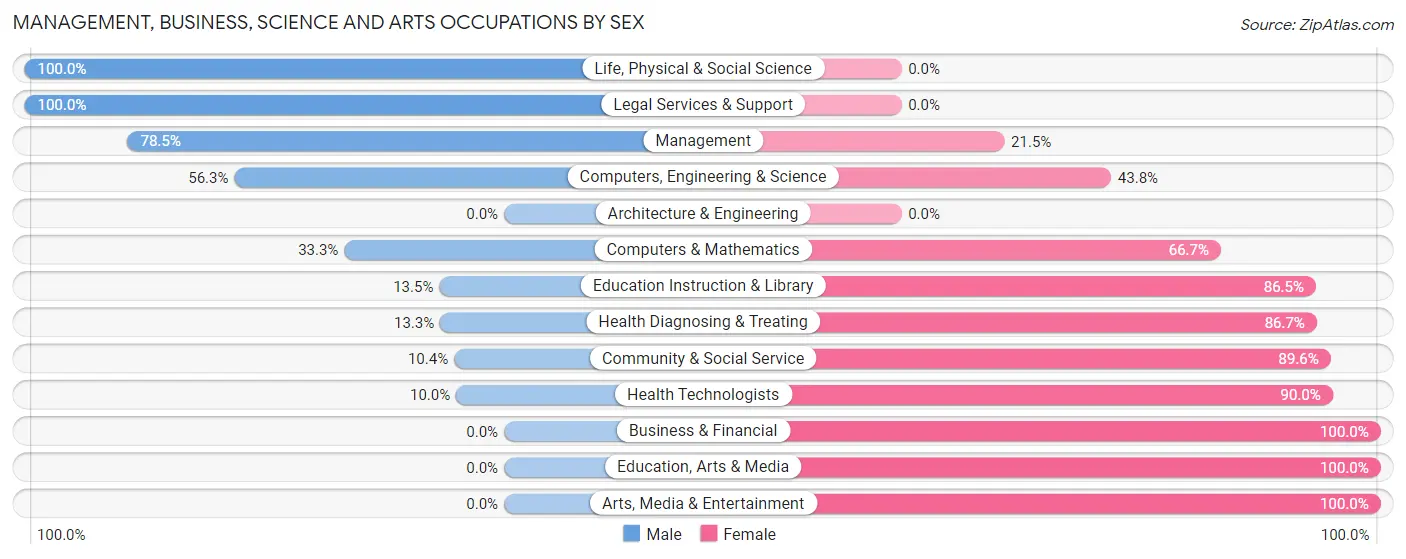
Management, Business, Science and Arts Occupations by Sex
Within the Management, Business, Science and Arts occupations in Mercer County, the most male-oriented occupations are Life, Physical & Social Science (100.0%), Legal Services & Support (100.0%), and Management (78.5%), while the most female-oriented occupations are Business & Financial (100.0%), Education, Arts & Media (100.0%), and Arts, Media & Entertainment (100.0%).
| Occupation | Male | Female |
| Management | 234 (78.5%) | 64 (21.5%) |
| Business & Financial | 0 (0.0%) | 28 (100.0%) |
| Computers, Engineering & Science | 18 (56.2%) | 14 (43.8%) |
| Computers & Mathematics | 7 (33.3%) | 14 (66.7%) |
| Architecture & Engineering | 0 (0.0%) | 0 (0.0%) |
| Life, Physical & Social Science | 11 (100.0%) | 0 (0.0%) |
| Community & Social Service | 17 (10.4%) | 146 (89.6%) |
| Education, Arts & Media | 0 (0.0%) | 40 (100.0%) |
| Legal Services & Support | 2 (100.0%) | 0 (0.0%) |
| Education Instruction & Library | 15 (13.5%) | 96 (86.5%) |
| Arts, Media & Entertainment | 0 (0.0%) | 10 (100.0%) |
| Health Diagnosing & Treating | 10 (13.3%) | 65 (86.7%) |
| Health Technologists | 4 (10.0%) | 36 (90.0%) |
| Total (Category) | 279 (46.8%) | 317 (53.2%) |
| Total (Overall) | 713 (47.8%) | 779 (52.2%) |
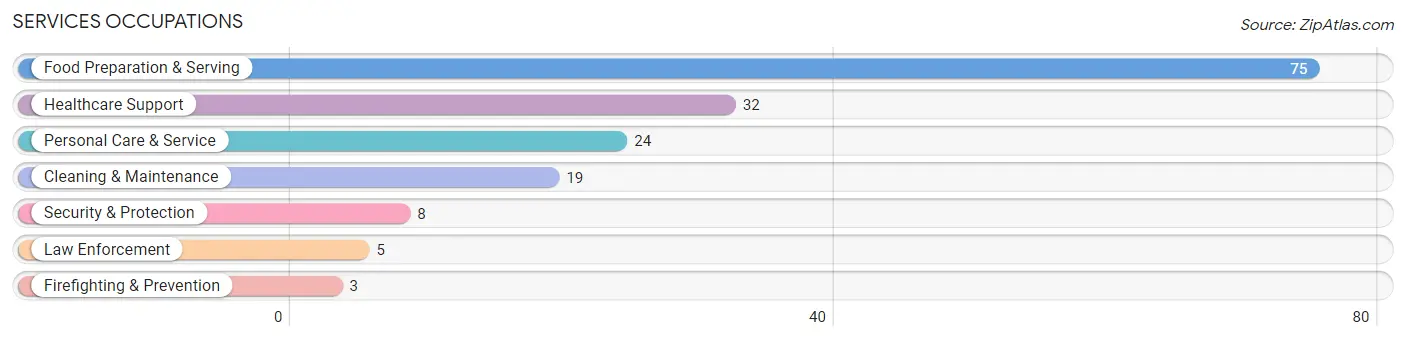
Services Occupations
The most common Services occupations in Mercer County are Food Preparation & Serving (75 | 5.0%), Healthcare Support (32 | 2.1%), Personal Care & Service (24 | 1.6%), Cleaning & Maintenance (19 | 1.3%), and Security & Protection (8 | 0.5%).
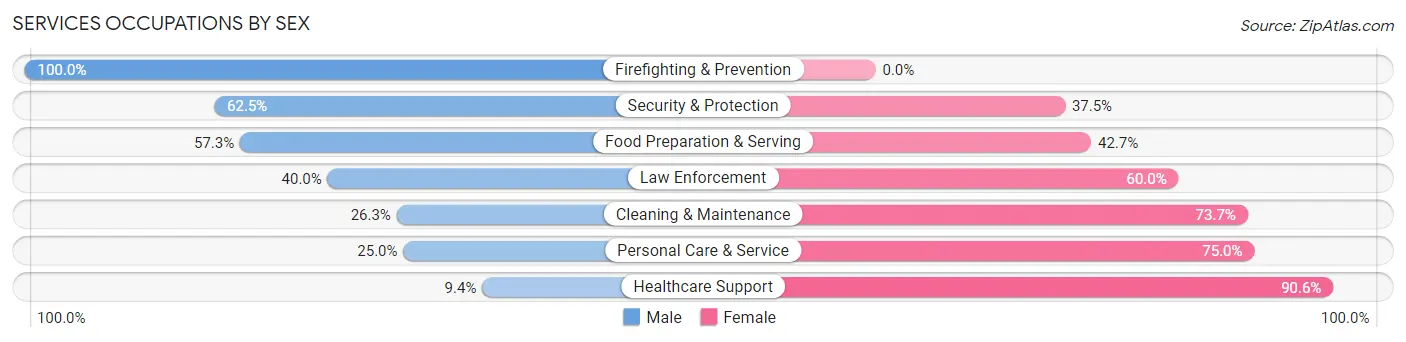
Services Occupations by Sex
Within the Services occupations in Mercer County, the most male-oriented occupations are Firefighting & Prevention (100.0%), Security & Protection (62.5%), and Food Preparation & Serving (57.3%), while the most female-oriented occupations are Healthcare Support (90.6%), Personal Care & Service (75.0%), and Cleaning & Maintenance (73.7%).
| Occupation | Male | Female |
| Healthcare Support | 3 (9.4%) | 29 (90.6%) |
| Security & Protection | 5 (62.5%) | 3 (37.5%) |
| Firefighting & Prevention | 3 (100.0%) | 0 (0.0%) |
| Law Enforcement | 2 (40.0%) | 3 (60.0%) |
| Food Preparation & Serving | 43 (57.3%) | 32 (42.7%) |
| Cleaning & Maintenance | 5 (26.3%) | 14 (73.7%) |
| Personal Care & Service | 6 (25.0%) | 18 (75.0%) |
| Total (Category) | 62 (39.2%) | 96 (60.8%) |
| Total (Overall) | 713 (47.8%) | 779 (52.2%) |
Sales and Office Occupations
The most common Sales and Office occupations in Mercer County are Sales & Related (131 | 8.8%), and Office & Administration (109 | 7.3%).
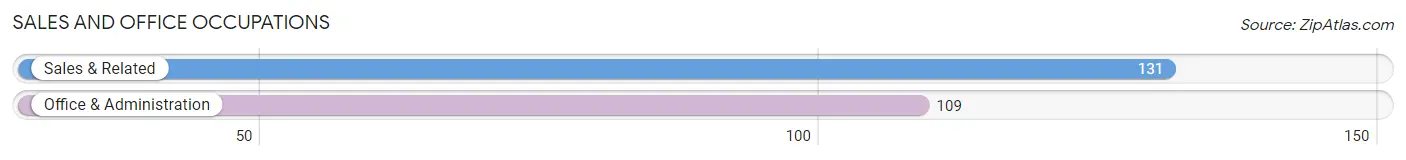
Sales and Office Occupations by Sex
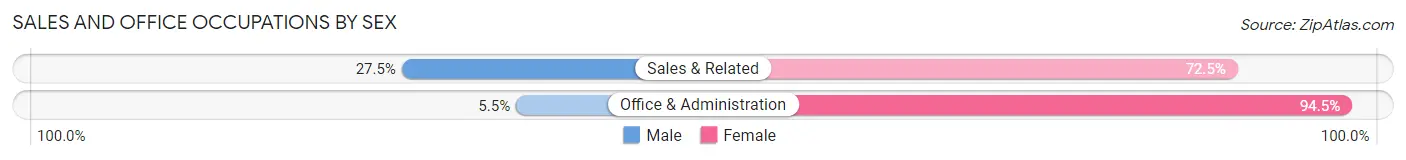
| Occupation | Male | Female |
| Sales & Related | 36 (27.5%) | 95 (72.5%) |
| Office & Administration | 6 (5.5%) | 103 (94.5%) |
| Total (Category) | 42 (17.5%) | 198 (82.5%) |
| Total (Overall) | 713 (47.8%) | 779 (52.2%) |
Natural Resources, Construction and Maintenance Occupations
The most common Natural Resources, Construction and Maintenance occupations in Mercer County are Farming, Fishing & Forestry (124 | 8.3%), Installation, Maintenance & Repair (41 | 2.8%), and Construction & Extraction (35 | 2.4%).
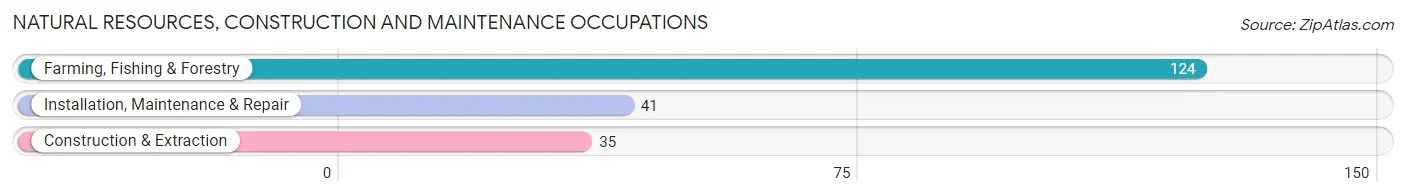
Natural Resources, Construction and Maintenance Occupations by Sex
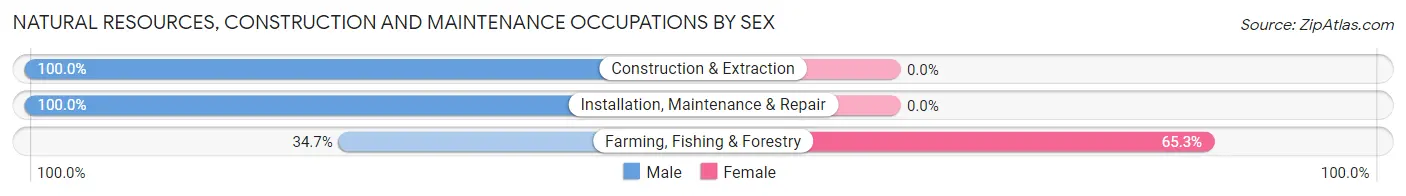
| Occupation | Male | Female |
| Farming, Fishing & Forestry | 43 (34.7%) | 81 (65.3%) |
| Construction & Extraction | 35 (100.0%) | 0 (0.0%) |
| Installation, Maintenance & Repair | 41 (100.0%) | 0 (0.0%) |
| Total (Category) | 119 (59.5%) | 81 (40.5%) |
| Total (Overall) | 713 (47.8%) | 779 (52.2%) |
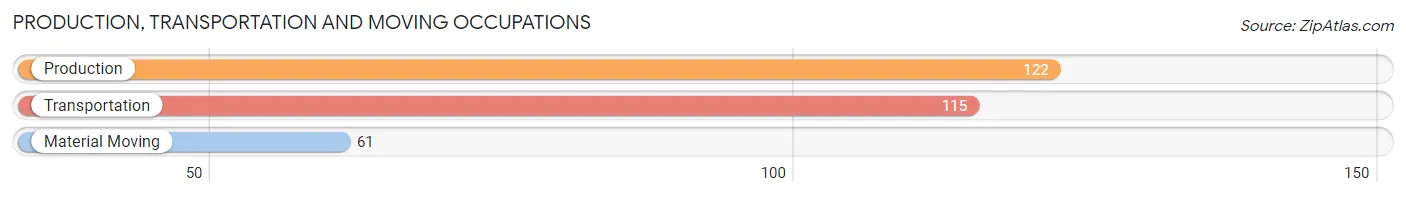
Production, Transportation and Moving Occupations
The most common Production, Transportation and Moving occupations in Mercer County are Production (122 | 8.2%), Transportation (115 | 7.7%), and Material Moving (61 | 4.1%).
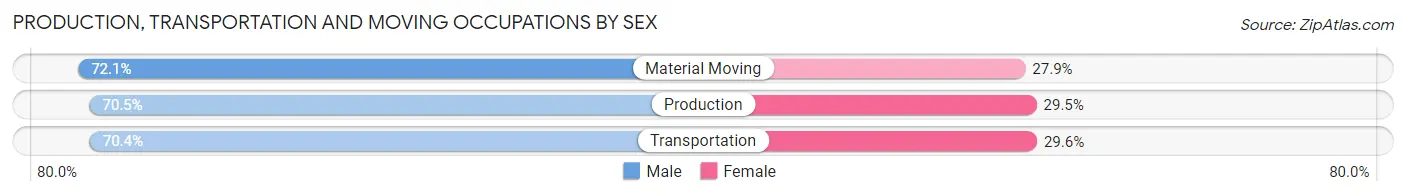
Production, Transportation and Moving Occupations by Sex
| Occupation | Male | Female |
| Production | 86 (70.5%) | 36 (29.5%) |
| Transportation | 81 (70.4%) | 34 (29.6%) |
| Material Moving | 44 (72.1%) | 17 (27.9%) |
| Total (Category) | 211 (70.8%) | 87 (29.2%) |
| Total (Overall) | 713 (47.8%) | 779 (52.2%) |
Employment Industries by Sex in Mercer County
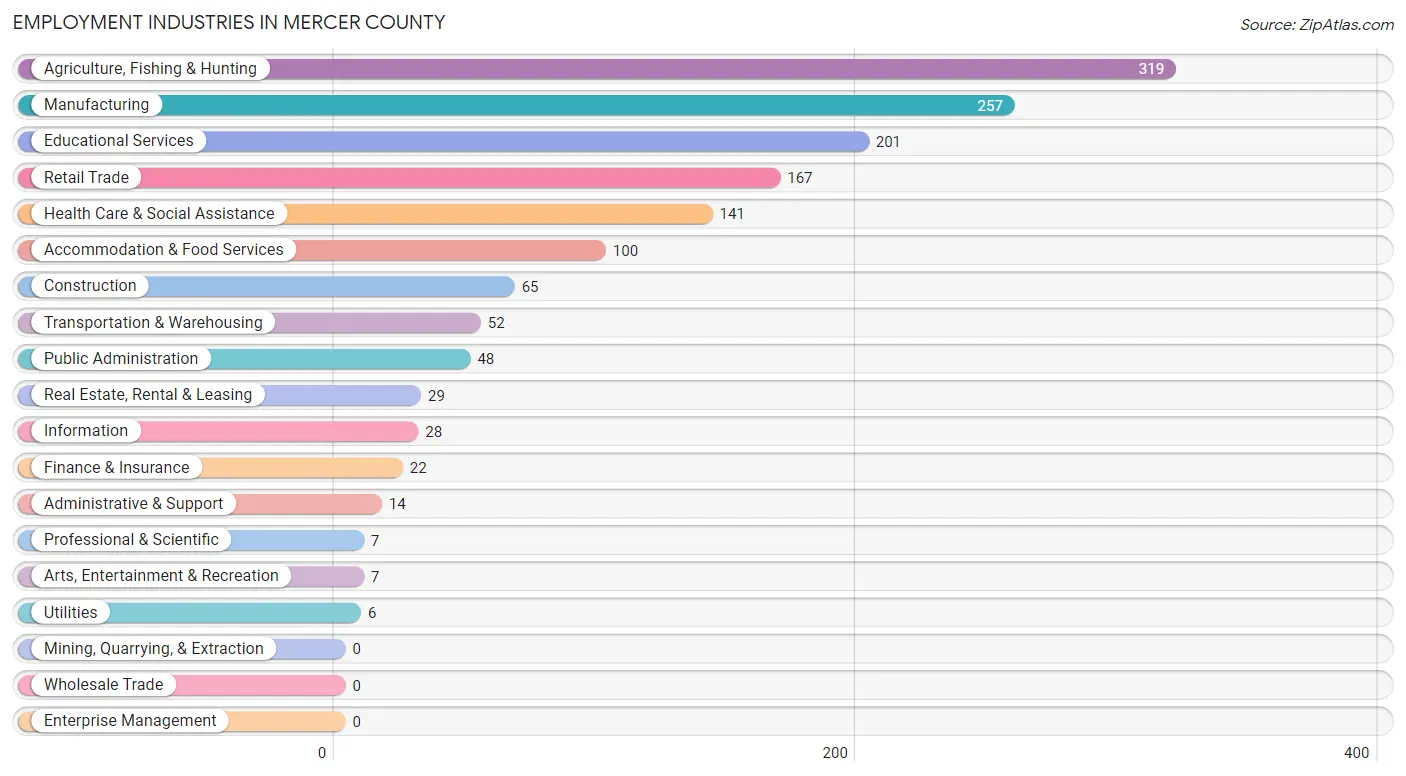
Employment Industries in Mercer County
The major employment industries in Mercer County include Agriculture, Fishing & Hunting (319 | 21.4%), Manufacturing (257 | 17.2%), Educational Services (201 | 13.5%), Retail Trade (167 | 11.2%), and Health Care & Social Assistance (141 | 9.5%).
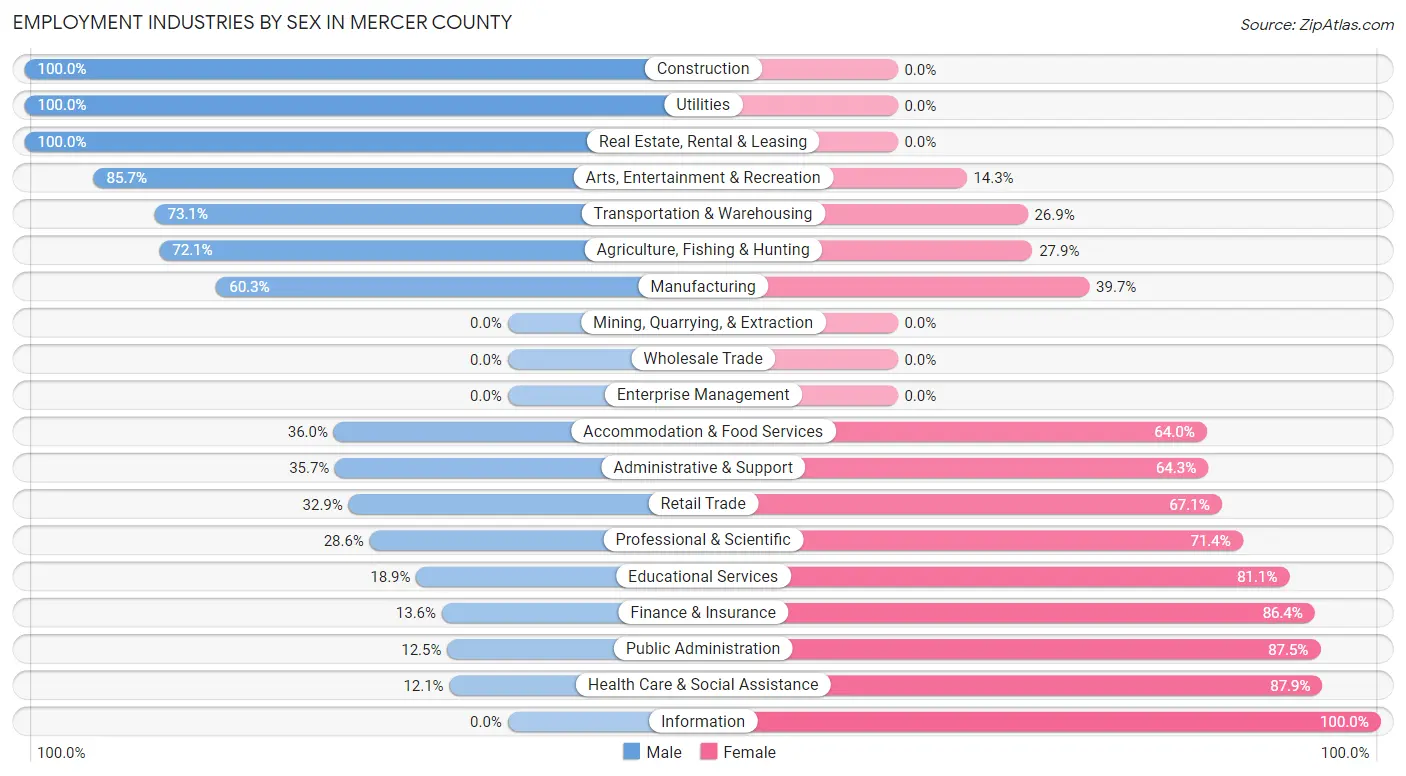
Employment Industries by Sex in Mercer County
The Mercer County industries that see more men than women are Construction (100.0%), Utilities (100.0%), and Real Estate, Rental & Leasing (100.0%), whereas the industries that tend to have a higher number of women are Information (100.0%), Health Care & Social Assistance (87.9%), and Public Administration (87.5%).
| Industry | Male | Female |
| Agriculture, Fishing & Hunting | 230 (72.1%) | 89 (27.9%) |
| Mining, Quarrying, & Extraction | 0 (0.0%) | 0 (0.0%) |
| Construction | 65 (100.0%) | 0 (0.0%) |
| Manufacturing | 155 (60.3%) | 102 (39.7%) |
| Wholesale Trade | 0 (0.0%) | 0 (0.0%) |
| Retail Trade | 55 (32.9%) | 112 (67.1%) |
| Transportation & Warehousing | 38 (73.1%) | 14 (26.9%) |
| Utilities | 6 (100.0%) | 0 (0.0%) |
| Information | 0 (0.0%) | 28 (100.0%) |
| Finance & Insurance | 3 (13.6%) | 19 (86.4%) |
| Real Estate, Rental & Leasing | 29 (100.0%) | 0 (0.0%) |
| Professional & Scientific | 2 (28.6%) | 5 (71.4%) |
| Enterprise Management | 0 (0.0%) | 0 (0.0%) |
| Administrative & Support | 5 (35.7%) | 9 (64.3%) |
| Educational Services | 38 (18.9%) | 163 (81.1%) |
| Health Care & Social Assistance | 17 (12.1%) | 124 (87.9%) |
| Arts, Entertainment & Recreation | 6 (85.7%) | 1 (14.3%) |
| Accommodation & Food Services | 36 (36.0%) | 64 (64.0%) |
| Public Administration | 6 (12.5%) | 42 (87.5%) |
| Total | 713 (47.8%) | 779 (52.2%) |
Education in Mercer County
School Enrollment in Mercer County
The most common levels of schooling among the 764 students in Mercer County are elementary school (211 | 27.6%), middle school (191 | 25.0%), and high school (186 | 24.3%).
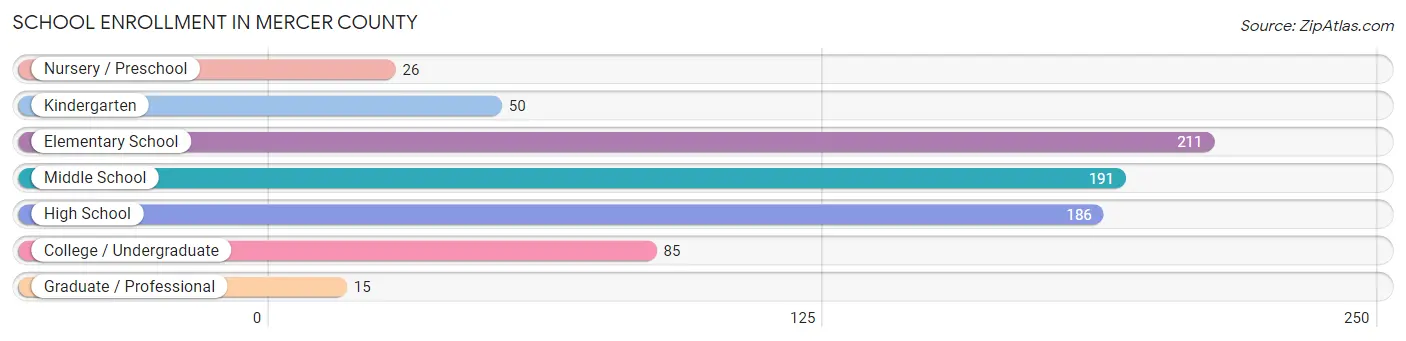
| School Level | # Students | % Students |
| Nursery / Preschool | 26 | 3.4% |
| Kindergarten | 50 | 6.5% |
| Elementary School | 211 | 27.6% |
| Middle School | 191 | 25.0% |
| High School | 186 | 24.3% |
| College / Undergraduate | 85 | 11.1% |
| Graduate / Professional | 15 | 2.0% |
| Total | 764 | 100.0% |
School Enrollment by Age by Funding Source in Mercer County
Out of a total of 764 students who are enrolled in schools in Mercer County, 148 (19.4%) attend a private institution, while the remaining 616 (80.6%) are enrolled in public schools. The age group of 35 years and over has the highest likelihood of being enrolled in private schools, with 6 (60.0% in the age bracket) enrolled. Conversely, the age group of 18 to 19 year olds has the lowest likelihood of being enrolled in a private school, with 94 (100.0% in the age bracket) attending a public institution.
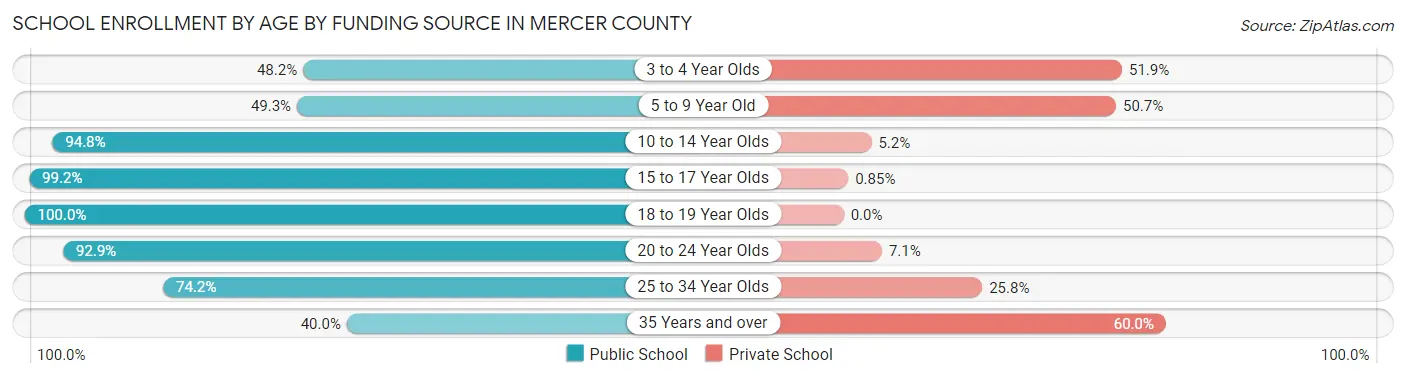
| Age Bracket | Public School | Private School |
| 3 to 4 Year Olds | 13 (48.1%) | 14 (51.8%) |
| 5 to 9 Year Old | 101 (49.3%) | 104 (50.7%) |
| 10 to 14 Year Olds | 238 (94.8%) | 13 (5.2%) |
| 15 to 17 Year Olds | 117 (99.2%) | 1 (0.9%) |
| 18 to 19 Year Olds | 94 (100.0%) | 0 (0.0%) |
| 20 to 24 Year Olds | 26 (92.9%) | 2 (7.1%) |
| 25 to 34 Year Olds | 23 (74.2%) | 8 (25.8%) |
| 35 Years and over | 4 (40.0%) | 6 (60.0%) |
| Total | 616 (80.6%) | 148 (19.4%) |
Educational Attainment by Field of Study in Mercer County
Education (143 | 27.9%), bio, nature & agricultural (122 | 23.8%), social sciences (50 | 9.8%), business (50 | 9.8%), and science & technology (30 | 5.9%) are the most common fields of study among 512 individuals in Mercer County who have obtained a bachelor's degree or higher.
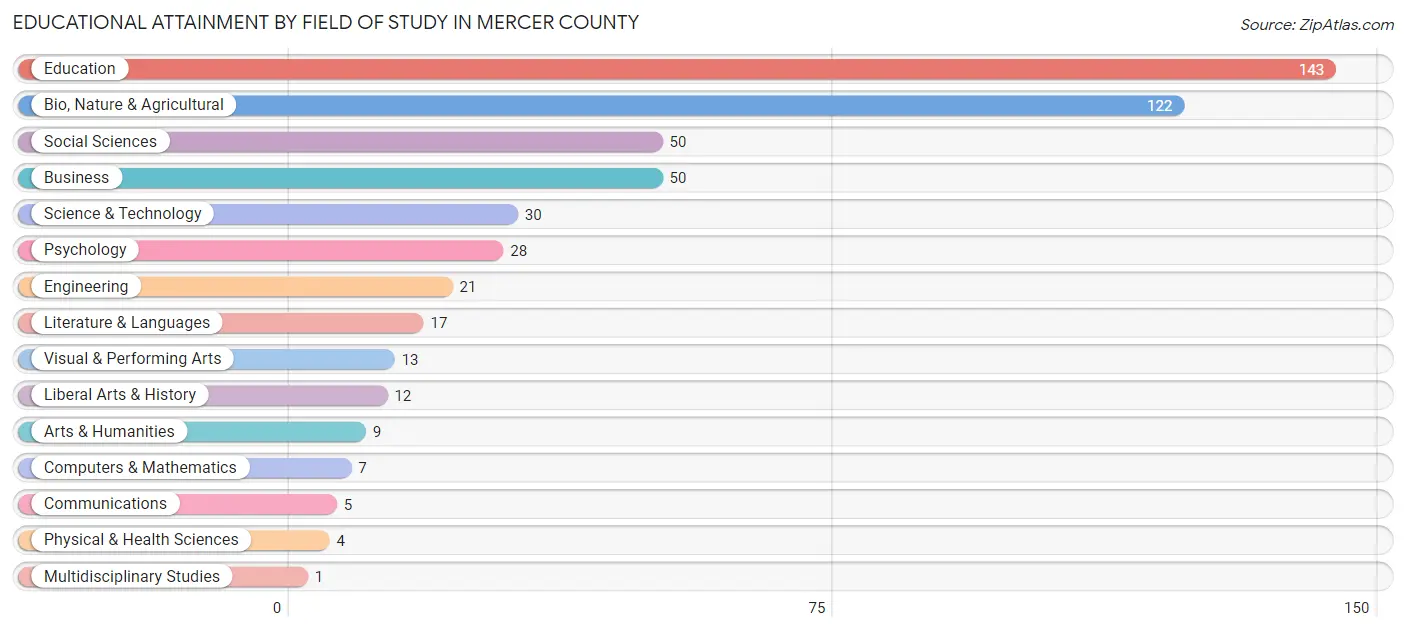
| Field of Study | # Graduates | % Graduates |
| Computers & Mathematics | 7 | 1.4% |
| Bio, Nature & Agricultural | 122 | 23.8% |
| Physical & Health Sciences | 4 | 0.8% |
| Psychology | 28 | 5.5% |
| Social Sciences | 50 | 9.8% |
| Engineering | 21 | 4.1% |
| Multidisciplinary Studies | 1 | 0.2% |
| Science & Technology | 30 | 5.9% |
| Business | 50 | 9.8% |
| Education | 143 | 27.9% |
| Literature & Languages | 17 | 3.3% |
| Liberal Arts & History | 12 | 2.3% |
| Visual & Performing Arts | 13 | 2.5% |
| Communications | 5 | 1.0% |
| Arts & Humanities | 9 | 1.8% |
| Total | 512 | 100.0% |
Transportation & Commute in Mercer County
Vehicle Availability by Sex in Mercer County
The most prevalent vehicle ownership categories in Mercer County are males with 3 vehicles (272, accounting for 38.5%) and females with 3 vehicles (271, making up 35.0%).
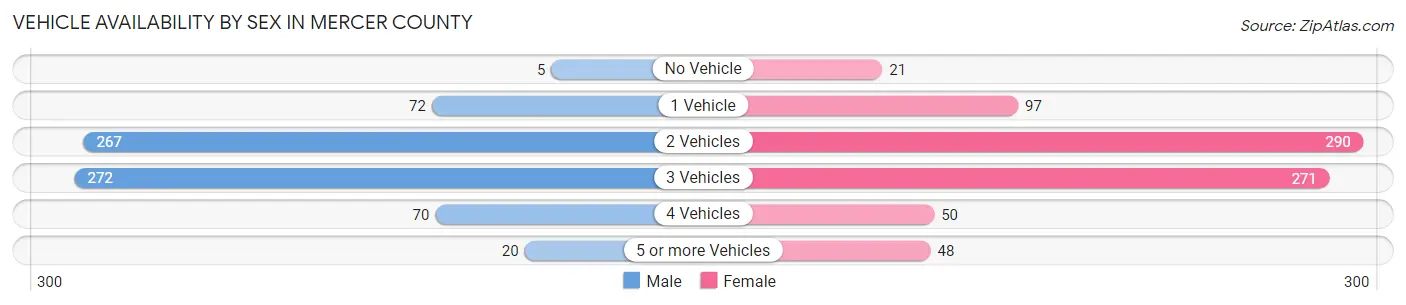
| Vehicles Available | Male | Female |
| No Vehicle | 5 (0.7%) | 21 (2.7%) |
| 1 Vehicle | 72 (10.2%) | 97 (12.5%) |
| 2 Vehicles | 267 (37.8%) | 290 (37.3%) |
| 3 Vehicles | 272 (38.5%) | 271 (34.9%) |
| 4 Vehicles | 70 (9.9%) | 50 (6.4%) |
| 5 or more Vehicles | 20 (2.8%) | 48 (6.2%) |
| Total | 706 (100.0%) | 777 (100.0%) |
Commute Time in Mercer County
The most frequently occuring commute durations in Mercer County are 10 to 14 minutes (309 commuters, 24.0%), 5 to 9 minutes (169 commuters, 13.1%), and 20 to 24 minutes (145 commuters, 11.3%).
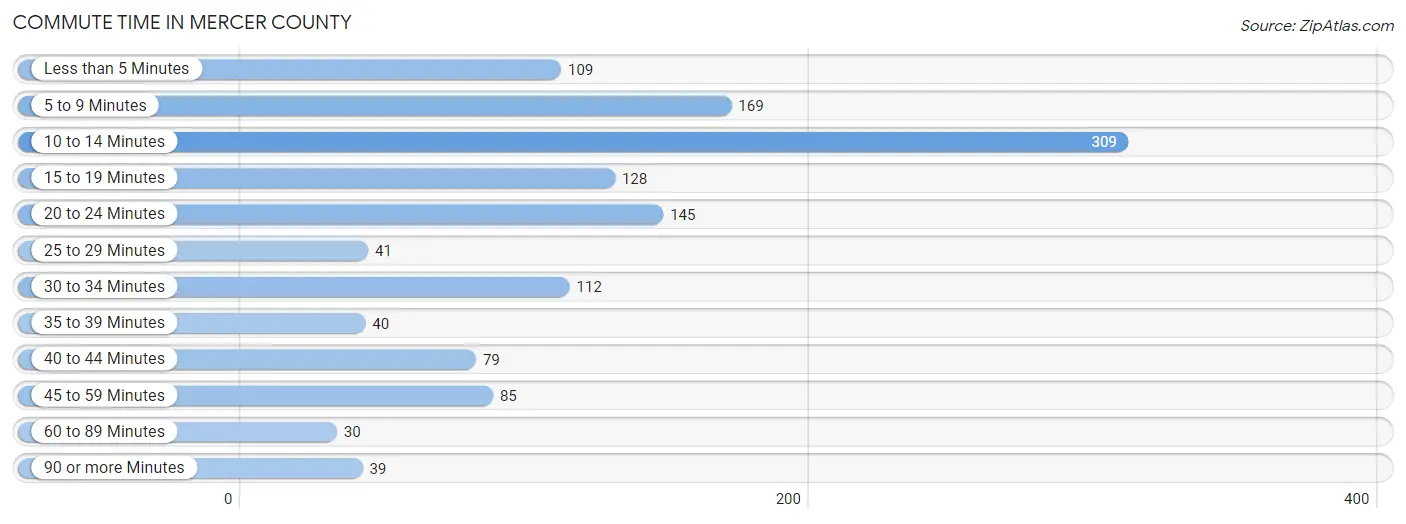
| Commute Time | # Commuters | % Commuters |
| Less than 5 Minutes | 109 | 8.5% |
| 5 to 9 Minutes | 169 | 13.1% |
| 10 to 14 Minutes | 309 | 24.0% |
| 15 to 19 Minutes | 128 | 10.0% |
| 20 to 24 Minutes | 145 | 11.3% |
| 25 to 29 Minutes | 41 | 3.2% |
| 30 to 34 Minutes | 112 | 8.7% |
| 35 to 39 Minutes | 40 | 3.1% |
| 40 to 44 Minutes | 79 | 6.1% |
| 45 to 59 Minutes | 85 | 6.6% |
| 60 to 89 Minutes | 30 | 2.3% |
| 90 or more Minutes | 39 | 3.0% |
Commute Time by Sex in Mercer County
The most common commute times in Mercer County are 5 to 9 minutes (113 commuters, 19.8%) for males and 10 to 14 minutes (203 commuters, 28.3%) for females.
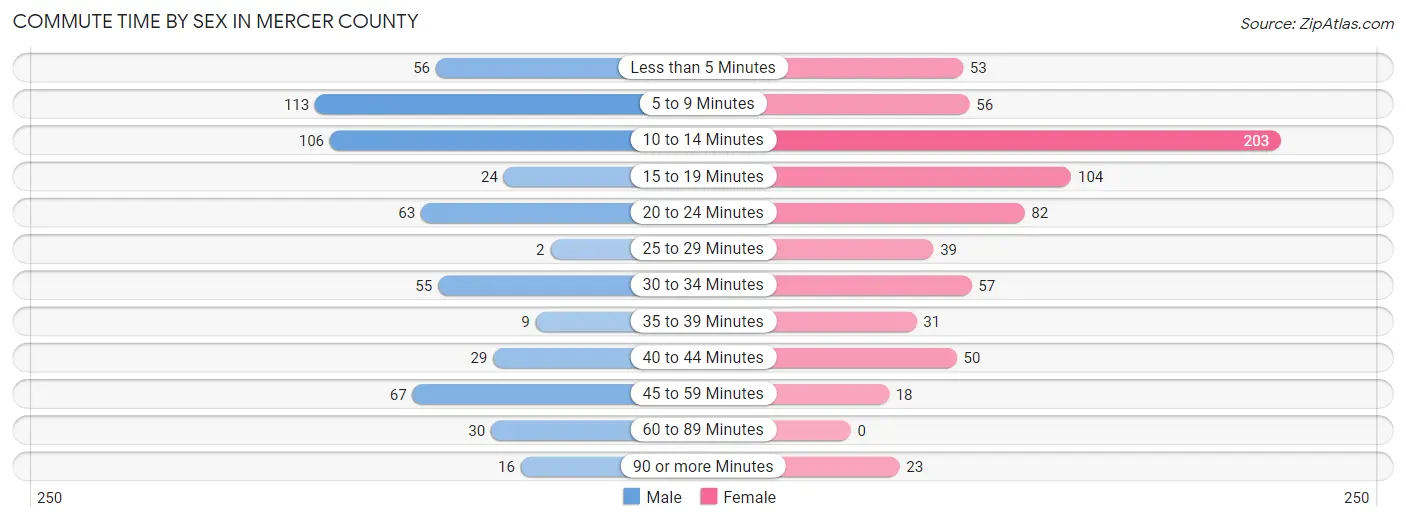
| Commute Time | Male | Female |
| Less than 5 Minutes | 56 (9.8%) | 53 (7.4%) |
| 5 to 9 Minutes | 113 (19.8%) | 56 (7.8%) |
| 10 to 14 Minutes | 106 (18.6%) | 203 (28.3%) |
| 15 to 19 Minutes | 24 (4.2%) | 104 (14.5%) |
| 20 to 24 Minutes | 63 (11.1%) | 82 (11.5%) |
| 25 to 29 Minutes | 2 (0.4%) | 39 (5.4%) |
| 30 to 34 Minutes | 55 (9.7%) | 57 (8.0%) |
| 35 to 39 Minutes | 9 (1.6%) | 31 (4.3%) |
| 40 to 44 Minutes | 29 (5.1%) | 50 (7.0%) |
| 45 to 59 Minutes | 67 (11.7%) | 18 (2.5%) |
| 60 to 89 Minutes | 30 (5.3%) | 0 (0.0%) |
| 90 or more Minutes | 16 (2.8%) | 23 (3.2%) |
Time of Departure to Work by Sex in Mercer County
The most frequent times of departure to work in Mercer County are 5:30 AM to 5:59 AM (111, 19.5%) for males and 7:00 AM to 7:29 AM (177, 24.7%) for females.
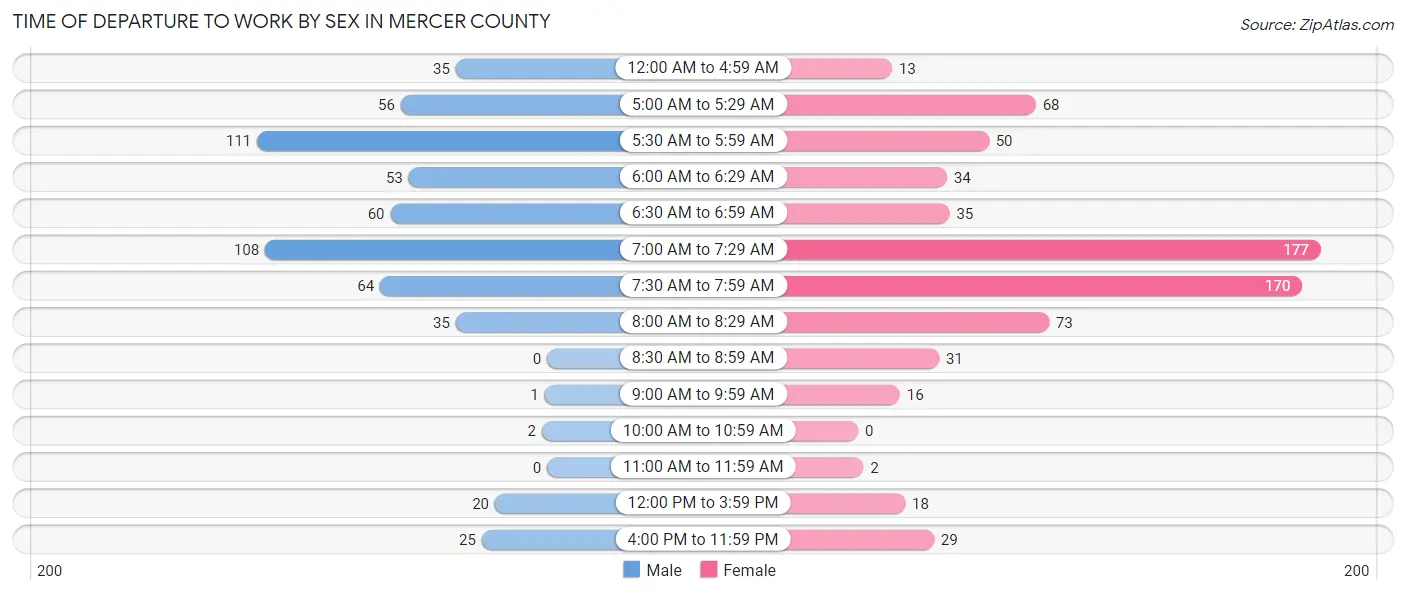
| Time of Departure | Male | Female |
| 12:00 AM to 4:59 AM | 35 (6.1%) | 13 (1.8%) |
| 5:00 AM to 5:29 AM | 56 (9.8%) | 68 (9.5%) |
| 5:30 AM to 5:59 AM | 111 (19.5%) | 50 (7.0%) |
| 6:00 AM to 6:29 AM | 53 (9.3%) | 34 (4.8%) |
| 6:30 AM to 6:59 AM | 60 (10.5%) | 35 (4.9%) |
| 7:00 AM to 7:29 AM | 108 (19.0%) | 177 (24.7%) |
| 7:30 AM to 7:59 AM | 64 (11.2%) | 170 (23.7%) |
| 8:00 AM to 8:29 AM | 35 (6.1%) | 73 (10.2%) |
| 8:30 AM to 8:59 AM | 0 (0.0%) | 31 (4.3%) |
| 9:00 AM to 9:59 AM | 1 (0.2%) | 16 (2.2%) |
| 10:00 AM to 10:59 AM | 2 (0.4%) | 0 (0.0%) |
| 11:00 AM to 11:59 AM | 0 (0.0%) | 2 (0.3%) |
| 12:00 PM to 3:59 PM | 20 (3.5%) | 18 (2.5%) |
| 4:00 PM to 11:59 PM | 25 (4.4%) | 29 (4.1%) |
| Total | 570 (100.0%) | 716 (100.0%) |
Housing Occupancy in Mercer County
Occupancy by Ownership in Mercer County
Of the total 1,253 dwellings in Mercer County, owner-occupied units account for 994 (79.3%), while renter-occupied units make up 259 (20.7%).
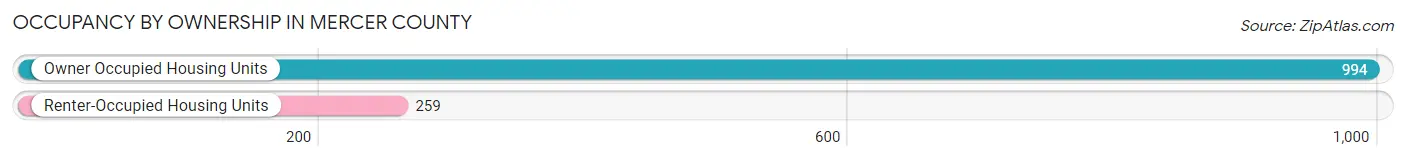
| Occupancy | # Housing Units | % Housing Units |
| Owner Occupied Housing Units | 994 | 79.3% |
| Renter-Occupied Housing Units | 259 | 20.7% |
| Total Occupied Housing Units | 1,253 | 100.0% |
Occupancy by Household Size in Mercer County
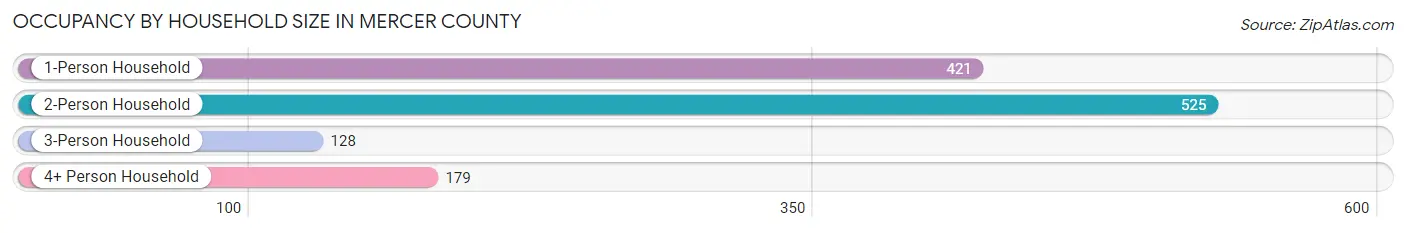
| Household Size | # Housing Units | % Housing Units |
| 1-Person Household | 421 | 33.6% |
| 2-Person Household | 525 | 41.9% |
| 3-Person Household | 128 | 10.2% |
| 4+ Person Household | 179 | 14.3% |
| Total Housing Units | 1,253 | 100.0% |
Occupancy by Ownership by Household Size in Mercer County
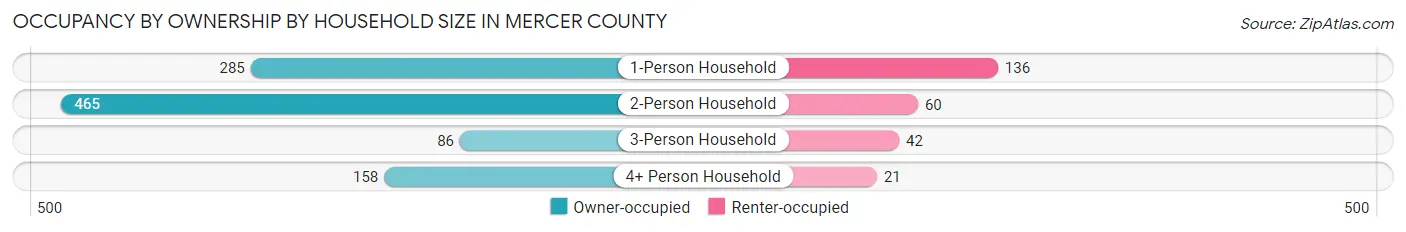
| Household Size | Owner-occupied | Renter-occupied |
| 1-Person Household | 285 (67.7%) | 136 (32.3%) |
| 2-Person Household | 465 (88.6%) | 60 (11.4%) |
| 3-Person Household | 86 (67.2%) | 42 (32.8%) |
| 4+ Person Household | 158 (88.3%) | 21 (11.7%) |
| Total Housing Units | 994 (79.3%) | 259 (20.7%) |
Occupancy by Educational Attainment in Mercer County
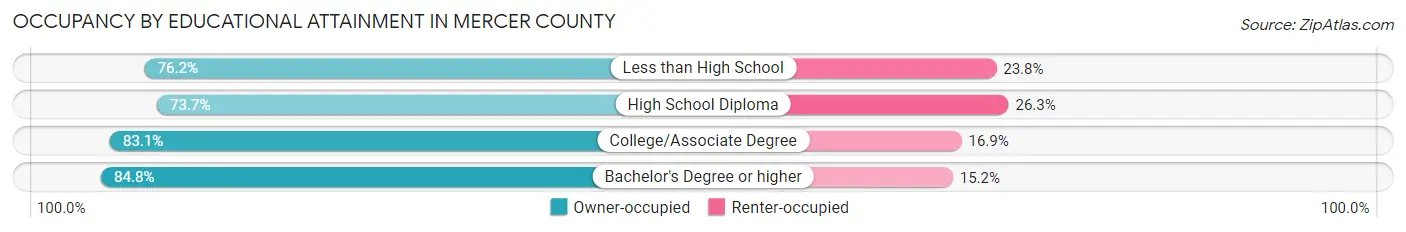
| Household Size | Owner-occupied | Renter-occupied |
| Less than High School | 80 (76.2%) | 25 (23.8%) |
| High School Diploma | 351 (73.7%) | 125 (26.3%) |
| College/Associate Degree | 334 (83.1%) | 68 (16.9%) |
| Bachelor's Degree or higher | 229 (84.8%) | 41 (15.2%) |
Occupancy by Age of Householder in Mercer County
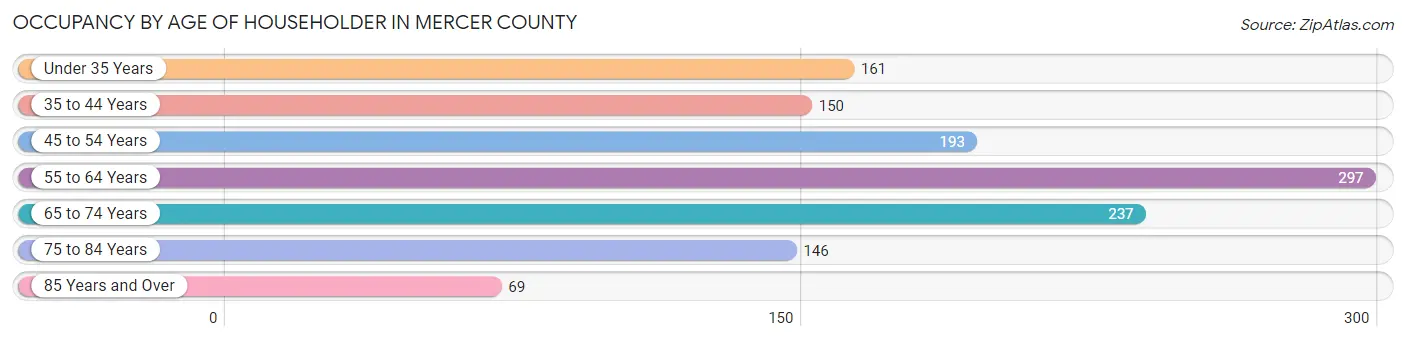
| Age Bracket | # Households | % Households |
| Under 35 Years | 161 | 12.9% |
| 35 to 44 Years | 150 | 12.0% |
| 45 to 54 Years | 193 | 15.4% |
| 55 to 64 Years | 297 | 23.7% |
| 65 to 74 Years | 237 | 18.9% |
| 75 to 84 Years | 146 | 11.7% |
| 85 Years and Over | 69 | 5.5% |
| Total | 1,253 | 100.0% |
Housing Finances in Mercer County
Median Income by Occupancy in Mercer County
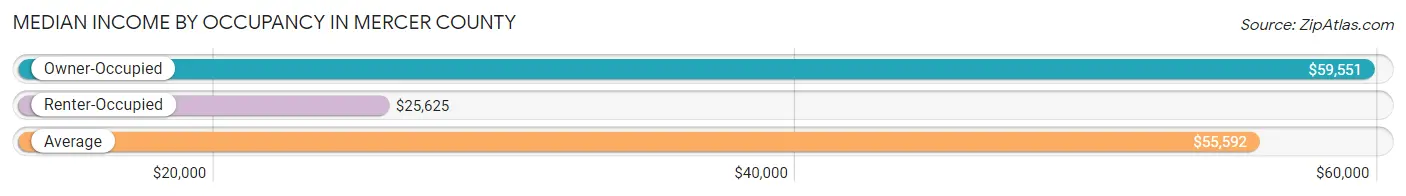
| Occupancy Type | # Households | Median Income |
| Owner-Occupied | 994 (79.3%) | $59,551 |
| Renter-Occupied | 259 (20.7%) | $25,625 |
| Average | 1,253 (100.0%) | $55,592 |
Occupancy by Householder Income Bracket in Mercer County
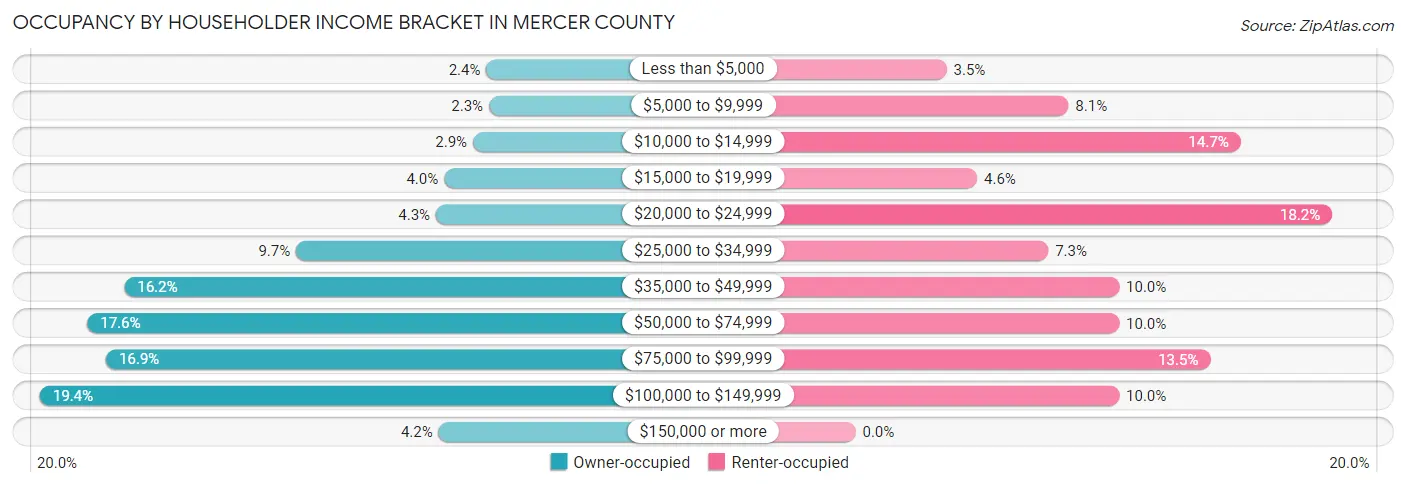
| Income Bracket | Owner-occupied | Renter-occupied |
| Less than $5,000 | 24 (2.4%) | 9 (3.5%) |
| $5,000 to $9,999 | 23 (2.3%) | 21 (8.1%) |
| $10,000 to $14,999 | 29 (2.9%) | 38 (14.7%) |
| $15,000 to $19,999 | 40 (4.0%) | 12 (4.6%) |
| $20,000 to $24,999 | 43 (4.3%) | 47 (18.1%) |
| $25,000 to $34,999 | 96 (9.7%) | 19 (7.3%) |
| $35,000 to $49,999 | 161 (16.2%) | 26 (10.0%) |
| $50,000 to $74,999 | 175 (17.6%) | 26 (10.0%) |
| $75,000 to $99,999 | 168 (16.9%) | 35 (13.5%) |
| $100,000 to $149,999 | 193 (19.4%) | 26 (10.0%) |
| $150,000 or more | 42 (4.2%) | 0 (0.0%) |
| Total | 994 (100.0%) | 259 (100.0%) |
Monthly Housing Cost Tiers in Mercer County
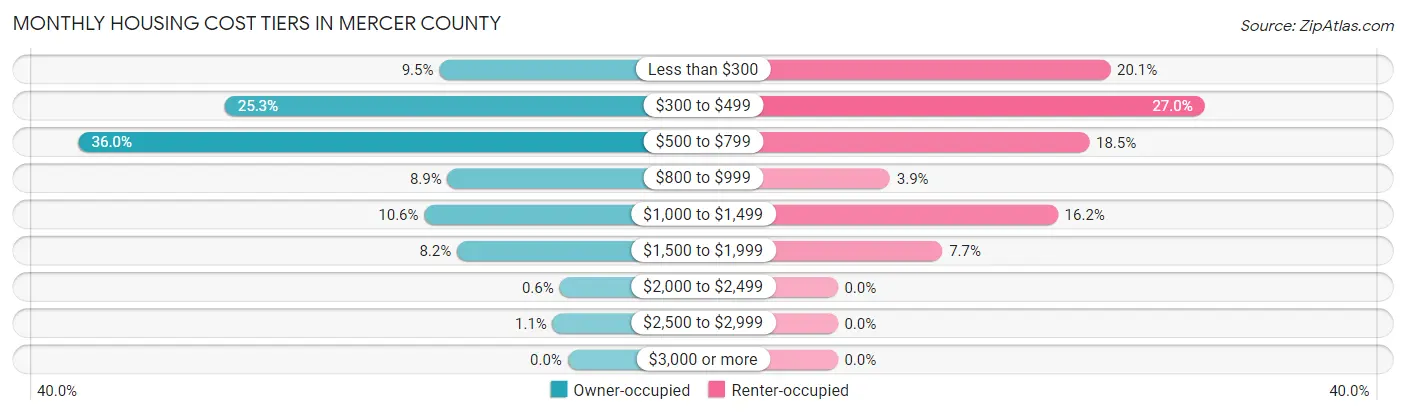
| Monthly Cost | Owner-occupied | Renter-occupied |
| Less than $300 | 94 (9.5%) | 52 (20.1%) |
| $300 to $499 | 251 (25.3%) | 70 (27.0%) |
| $500 to $799 | 358 (36.0%) | 48 (18.5%) |
| $800 to $999 | 88 (8.8%) | 10 (3.9%) |
| $1,000 to $1,499 | 105 (10.6%) | 42 (16.2%) |
| $1,500 to $1,999 | 81 (8.2%) | 20 (7.7%) |
| $2,000 to $2,499 | 6 (0.6%) | 0 (0.0%) |
| $2,500 to $2,999 | 11 (1.1%) | 0 (0.0%) |
| $3,000 or more | 0 (0.0%) | 0 (0.0%) |
| Total | 994 (100.0%) | 259 (100.0%) |
Physical Housing Characteristics in Mercer County
Housing Structures in Mercer County

| Structure Type | # Housing Units | % Housing Units |
| Single Unit, Detached | 1,054 | 84.1% |
| Single Unit, Attached | 14 | 1.1% |
| 2 Unit Apartments | 4 | 0.3% |
| 3 or 4 Unit Apartments | 56 | 4.5% |
| 5 to 9 Unit Apartments | 0 | 0.0% |
| 10 or more Apartments | 82 | 6.5% |
| Mobile Home / Other | 43 | 3.4% |
| Total | 1,253 | 100.0% |
Housing Structures by Occupancy in Mercer County
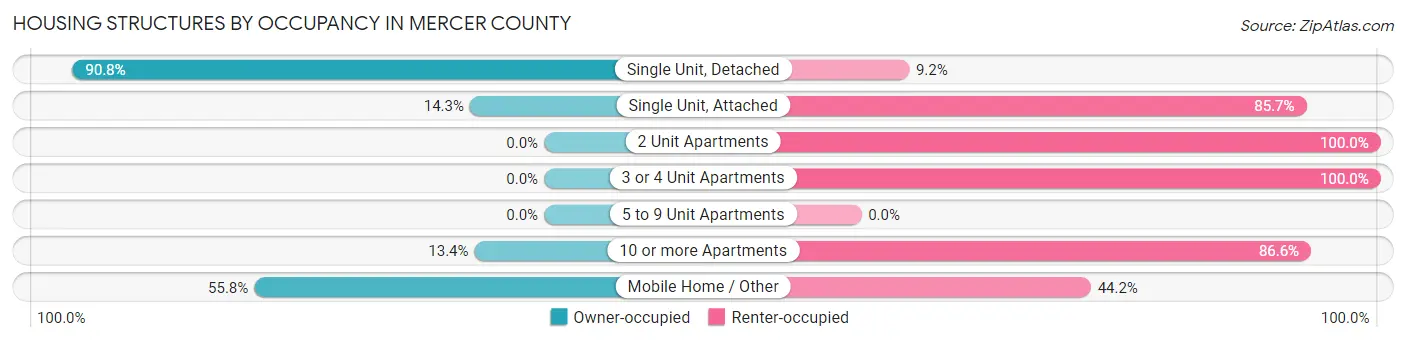
| Structure Type | Owner-occupied | Renter-occupied |
| Single Unit, Detached | 957 (90.8%) | 97 (9.2%) |
| Single Unit, Attached | 2 (14.3%) | 12 (85.7%) |
| 2 Unit Apartments | 0 (0.0%) | 4 (100.0%) |
| 3 or 4 Unit Apartments | 0 (0.0%) | 56 (100.0%) |
| 5 to 9 Unit Apartments | 0 (0.0%) | 0 (0.0%) |
| 10 or more Apartments | 11 (13.4%) | 71 (86.6%) |
| Mobile Home / Other | 24 (55.8%) | 19 (44.2%) |
| Total | 994 (79.3%) | 259 (20.7%) |
Housing Structures by Number of Rooms in Mercer County
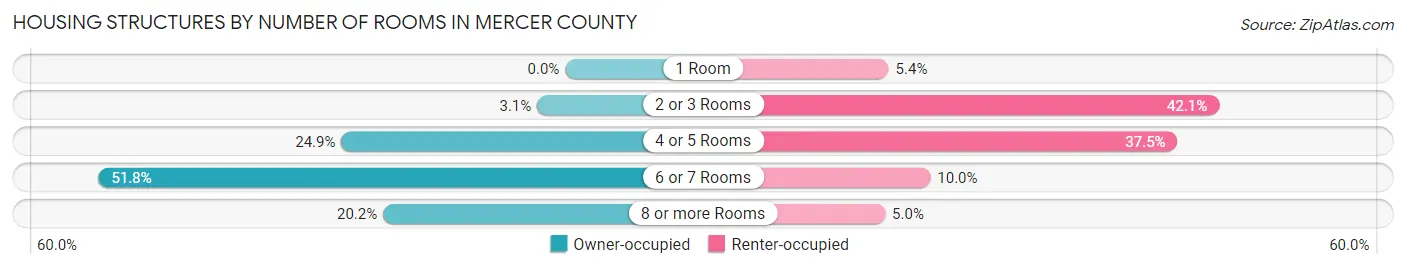
| Number of Rooms | Owner-occupied | Renter-occupied |
| 1 Room | 0 (0.0%) | 14 (5.4%) |
| 2 or 3 Rooms | 31 (3.1%) | 109 (42.1%) |
| 4 or 5 Rooms | 247 (24.8%) | 97 (37.4%) |
| 6 or 7 Rooms | 515 (51.8%) | 26 (10.0%) |
| 8 or more Rooms | 201 (20.2%) | 13 (5.0%) |
| Total | 994 (100.0%) | 259 (100.0%) |
Housing Structure by Heating Type in Mercer County
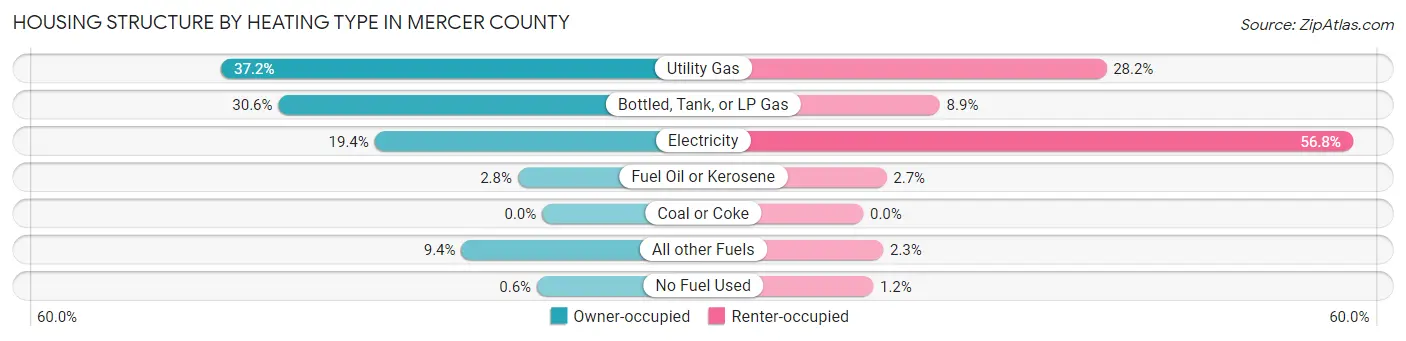
| Heating Type | Owner-occupied | Renter-occupied |
| Utility Gas | 370 (37.2%) | 73 (28.2%) |
| Bottled, Tank, or LP Gas | 304 (30.6%) | 23 (8.9%) |
| Electricity | 193 (19.4%) | 147 (56.8%) |
| Fuel Oil or Kerosene | 28 (2.8%) | 7 (2.7%) |
| Coal or Coke | 0 (0.0%) | 0 (0.0%) |
| All other Fuels | 93 (9.4%) | 6 (2.3%) |
| No Fuel Used | 6 (0.6%) | 3 (1.2%) |
| Total | 994 (100.0%) | 259 (100.0%) |
Household Vehicle Usage in Mercer County
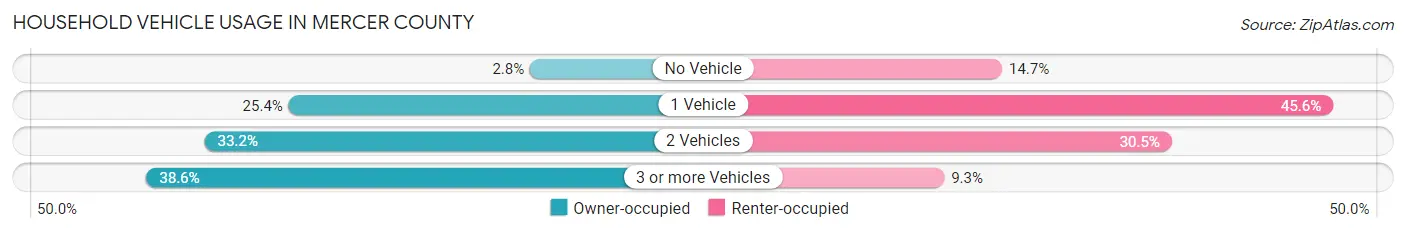
| Vehicles per Household | Owner-occupied | Renter-occupied |
| No Vehicle | 28 (2.8%) | 38 (14.7%) |
| 1 Vehicle | 252 (25.4%) | 118 (45.6%) |
| 2 Vehicles | 330 (33.2%) | 79 (30.5%) |
| 3 or more Vehicles | 384 (38.6%) | 24 (9.3%) |
| Total | 994 (100.0%) | 259 (100.0%) |
Real Estate & Mortgages in Mercer County
Real Estate and Mortgage Overview in Mercer County
| Characteristic | Without Mortgage | With Mortgage |
| Housing Units | 594 | 400 |
| Median Property Value | $104,900 | $104,600 |
| Median Household Income | $58,158 | $21 |
| Monthly Housing Costs | $472 | $0 |
| Real Estate Taxes | $865 | $4 |
Property Value by Mortgage Status in Mercer County
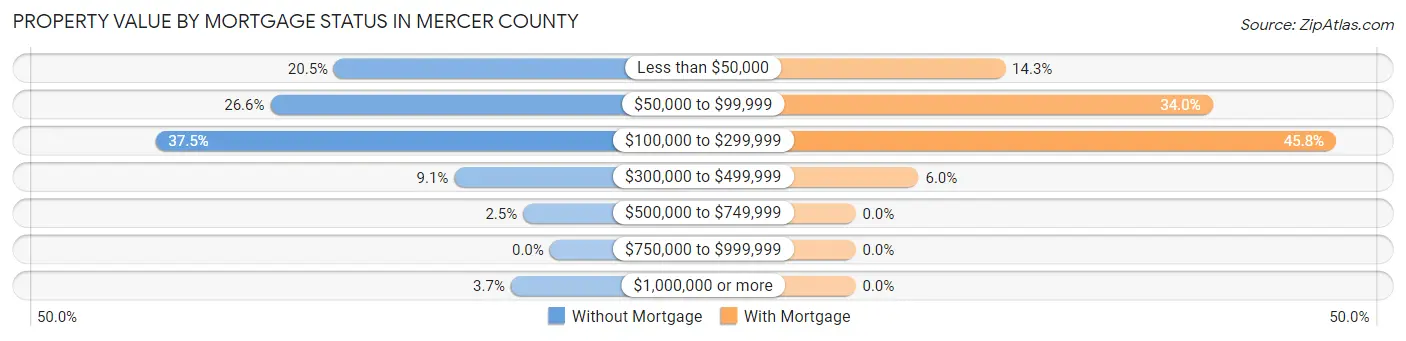
| Property Value | Without Mortgage | With Mortgage |
| Less than $50,000 | 122 (20.5%) | 57 (14.2%) |
| $50,000 to $99,999 | 158 (26.6%) | 136 (34.0%) |
| $100,000 to $299,999 | 223 (37.5%) | 183 (45.8%) |
| $300,000 to $499,999 | 54 (9.1%) | 24 (6.0%) |
| $500,000 to $749,999 | 15 (2.5%) | 0 (0.0%) |
| $750,000 to $999,999 | 0 (0.0%) | 0 (0.0%) |
| $1,000,000 or more | 22 (3.7%) | 0 (0.0%) |
| Total | 594 (100.0%) | 400 (100.0%) |
Household Income by Mortgage Status in Mercer County
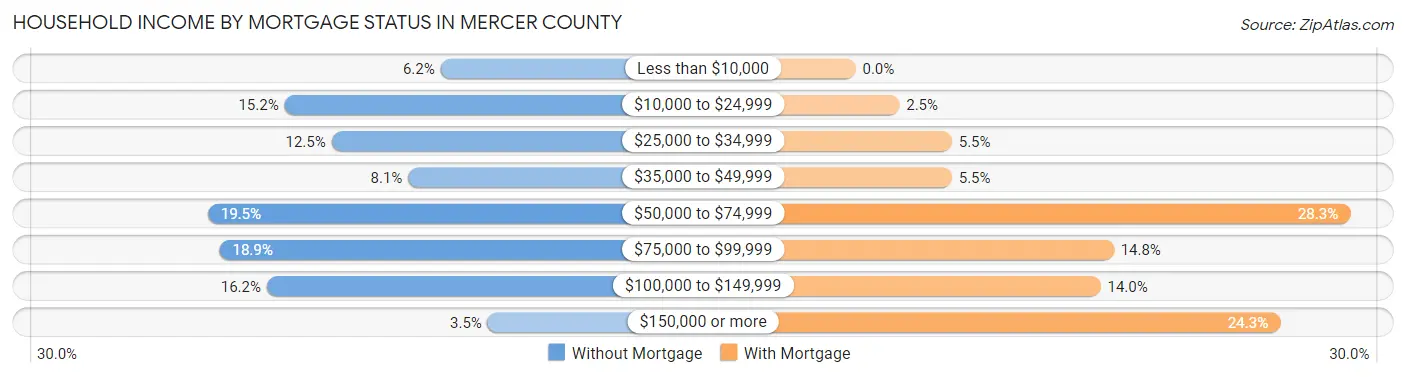
| Household Income | Without Mortgage | With Mortgage |
| Less than $10,000 | 37 (6.2%) | 0 (0.0%) |
| $10,000 to $24,999 | 90 (15.1%) | 10 (2.5%) |
| $25,000 to $34,999 | 74 (12.5%) | 22 (5.5%) |
| $35,000 to $49,999 | 48 (8.1%) | 22 (5.5%) |
| $50,000 to $74,999 | 116 (19.5%) | 113 (28.2%) |
| $75,000 to $99,999 | 112 (18.9%) | 59 (14.7%) |
| $100,000 to $149,999 | 96 (16.2%) | 56 (14.0%) |
| $150,000 or more | 21 (3.5%) | 97 (24.2%) |
| Total | 594 (100.0%) | 400 (100.0%) |
Property Value to Household Income Ratio in Mercer County
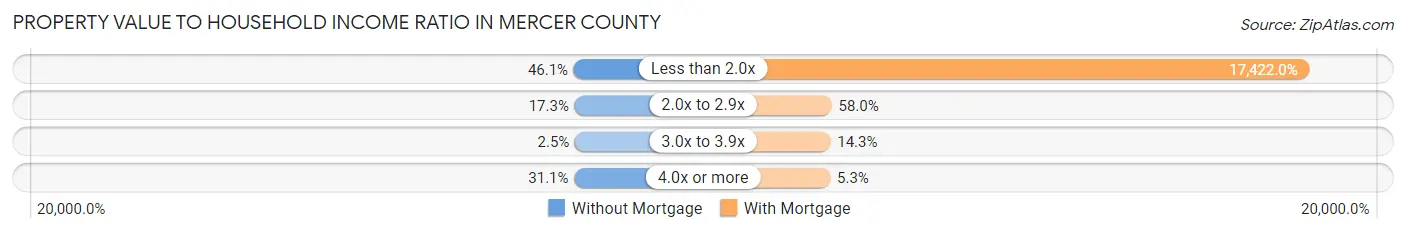
| Value-to-Income Ratio | Without Mortgage | With Mortgage |
| Less than 2.0x | 274 (46.1%) | 69,688 (17,422.0%) |
| 2.0x to 2.9x | 103 (17.3%) | 232 (58.0%) |
| 3.0x to 3.9x | 15 (2.5%) | 57 (14.2%) |
| 4.0x or more | 185 (31.1%) | 21 (5.2%) |
| Total | 594 (100.0%) | 400 (100.0%) |
Real Estate Taxes by Mortgage Status in Mercer County
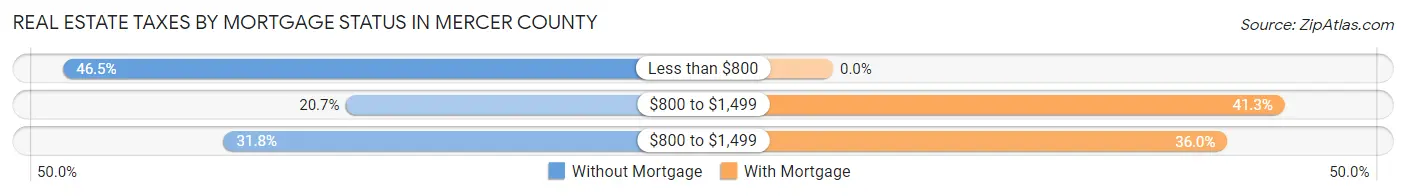
| Property Taxes | Without Mortgage | With Mortgage |
| Less than $800 | 276 (46.5%) | 0 (0.0%) |
| $800 to $1,499 | 123 (20.7%) | 165 (41.2%) |
| $800 to $1,499 | 189 (31.8%) | 144 (36.0%) |
| Total | 594 (100.0%) | 400 (100.0%) |
Health & Disability in Mercer County
Health Insurance Coverage by Age in Mercer County
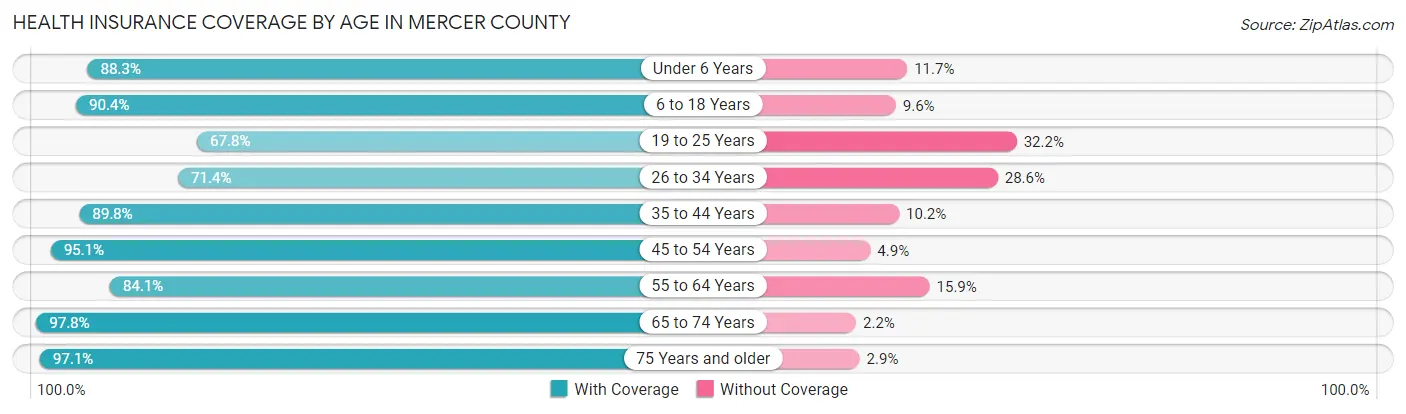
| Age Bracket | With Coverage | Without Coverage |
| Under 6 Years | 263 (88.3%) | 35 (11.7%) |
| 6 to 18 Years | 536 (90.4%) | 57 (9.6%) |
| 19 to 25 Years | 154 (67.8%) | 73 (32.2%) |
| 26 to 34 Years | 232 (71.4%) | 93 (28.6%) |
| 35 to 44 Years | 325 (89.8%) | 37 (10.2%) |
| 45 to 54 Years | 371 (95.1%) | 19 (4.9%) |
| 55 to 64 Years | 444 (84.1%) | 84 (15.9%) |
| 65 to 74 Years | 400 (97.8%) | 9 (2.2%) |
| 75 Years and older | 306 (97.1%) | 9 (2.9%) |
| Total | 3,031 (87.9%) | 416 (12.1%) |
Health Insurance Coverage by Citizenship Status in Mercer County
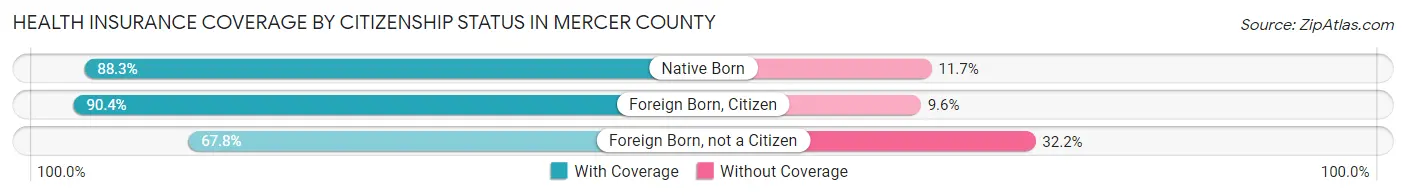
| Citizenship Status | With Coverage | Without Coverage |
| Native Born | 263 (88.3%) | 35 (11.7%) |
| Foreign Born, Citizen | 536 (90.4%) | 57 (9.6%) |
| Foreign Born, not a Citizen | 154 (67.8%) | 73 (32.2%) |
Health Insurance Coverage by Household Income in Mercer County
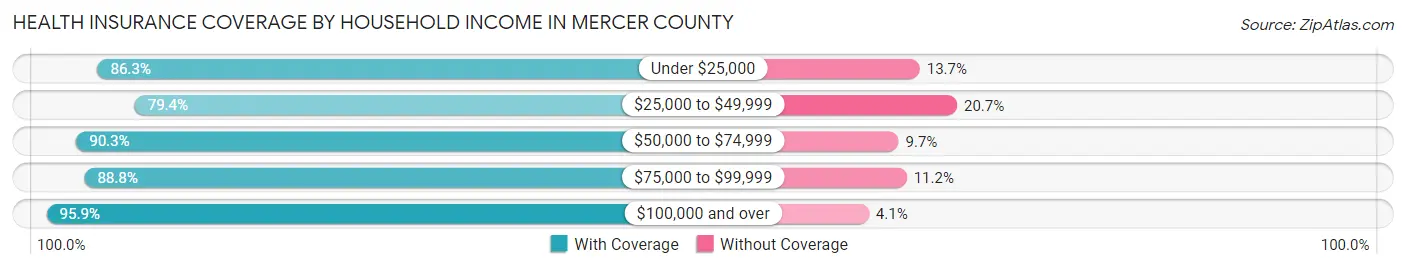
| Household Income | With Coverage | Without Coverage |
| Under $25,000 | 429 (86.3%) | 68 (13.7%) |
| $25,000 to $49,999 | 707 (79.3%) | 184 (20.6%) |
| $50,000 to $74,999 | 484 (90.3%) | 52 (9.7%) |
| $75,000 to $99,999 | 569 (88.8%) | 72 (11.2%) |
| $100,000 and over | 834 (95.9%) | 36 (4.1%) |
Public vs Private Health Insurance Coverage by Age in Mercer County
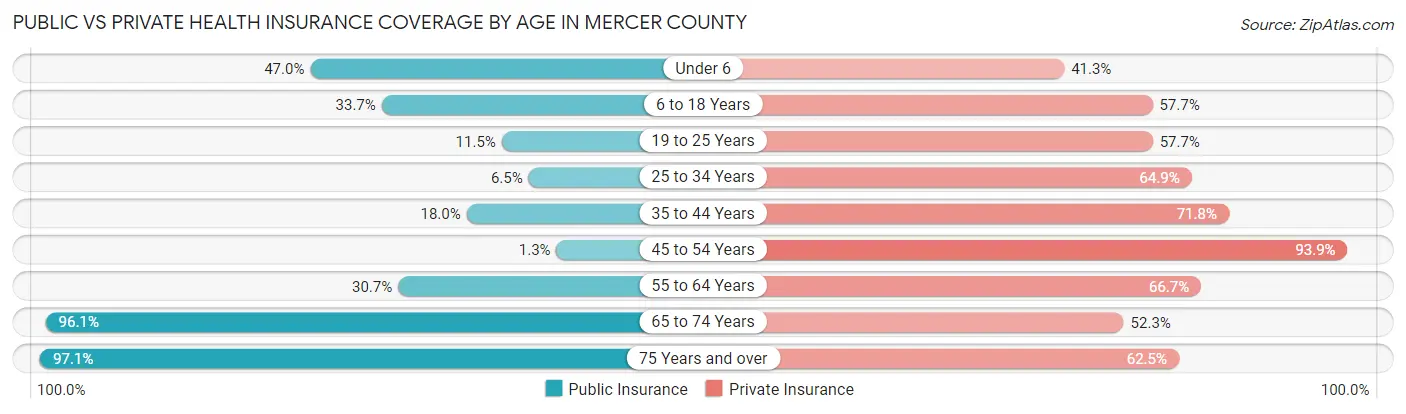
| Age Bracket | Public Insurance | Private Insurance |
| Under 6 | 140 (47.0%) | 123 (41.3%) |
| 6 to 18 Years | 200 (33.7%) | 342 (57.7%) |
| 19 to 25 Years | 26 (11.5%) | 131 (57.7%) |
| 25 to 34 Years | 21 (6.5%) | 211 (64.9%) |
| 35 to 44 Years | 65 (18.0%) | 260 (71.8%) |
| 45 to 54 Years | 5 (1.3%) | 366 (93.9%) |
| 55 to 64 Years | 162 (30.7%) | 352 (66.7%) |
| 65 to 74 Years | 393 (96.1%) | 214 (52.3%) |
| 75 Years and over | 306 (97.1%) | 197 (62.5%) |
| Total | 1,318 (38.2%) | 2,196 (63.7%) |
Disability Status by Sex by Age in Mercer County
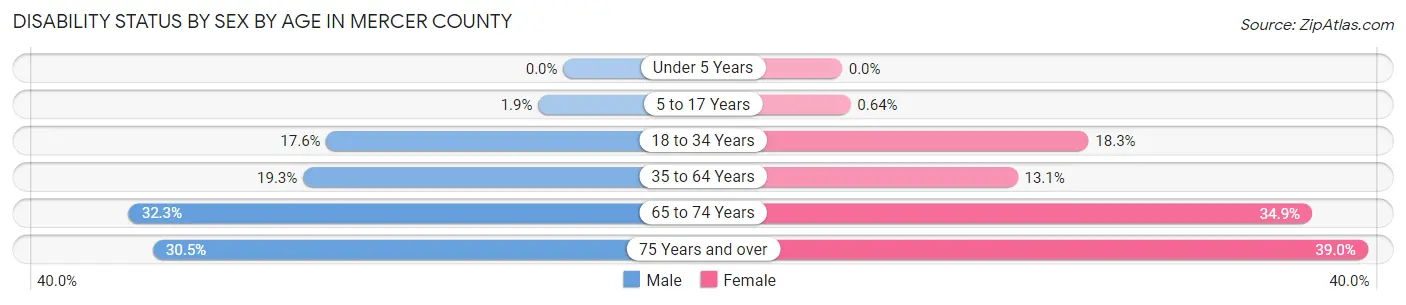
| Age Bracket | Male | Female |
| Under 5 Years | 0 (0.0%) | 0 (0.0%) |
| 5 to 17 Years | 5 (1.9%) | 2 (0.6%) |
| 18 to 34 Years | 54 (17.6%) | 54 (18.3%) |
| 35 to 64 Years | 120 (19.3%) | 86 (13.1%) |
| 65 to 74 Years | 70 (32.3%) | 67 (34.9%) |
| 75 Years and over | 39 (30.5%) | 73 (39.0%) |
Disability Class by Sex by Age in Mercer County
Disability Class: Hearing Difficulty
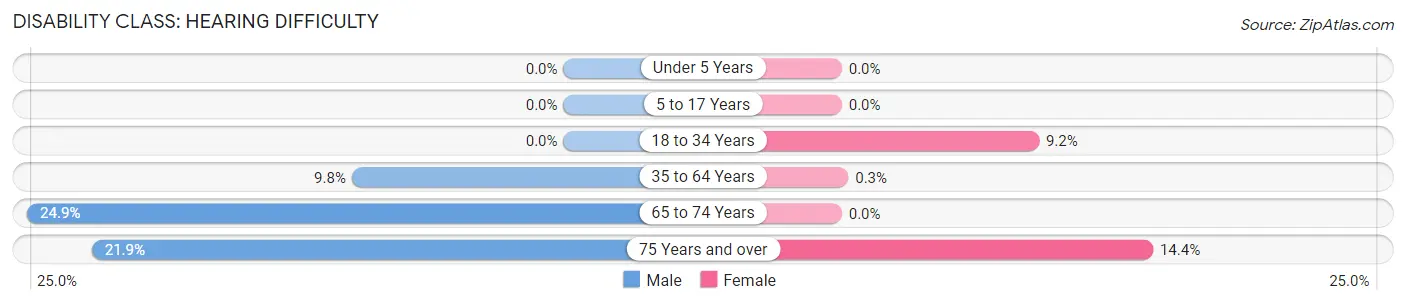
| Age Bracket | Male | Female |
| Under 5 Years | 0 (0.0%) | 0 (0.0%) |
| 5 to 17 Years | 0 (0.0%) | 0 (0.0%) |
| 18 to 34 Years | 0 (0.0%) | 27 (9.1%) |
| 35 to 64 Years | 61 (9.8%) | 2 (0.3%) |
| 65 to 74 Years | 54 (24.9%) | 0 (0.0%) |
| 75 Years and over | 28 (21.9%) | 27 (14.4%) |
Disability Class: Vision Difficulty
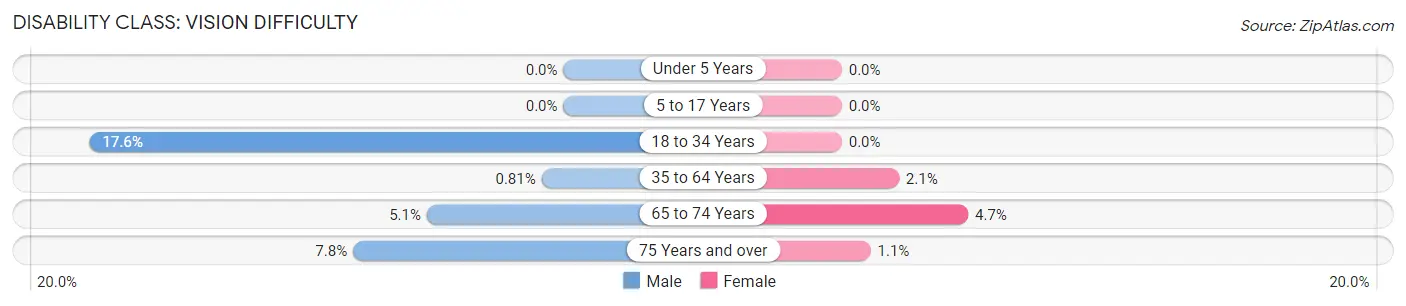
| Age Bracket | Male | Female |
| Under 5 Years | 0 (0.0%) | 0 (0.0%) |
| 5 to 17 Years | 0 (0.0%) | 0 (0.0%) |
| 18 to 34 Years | 54 (17.6%) | 0 (0.0%) |
| 35 to 64 Years | 5 (0.8%) | 14 (2.1%) |
| 65 to 74 Years | 11 (5.1%) | 9 (4.7%) |
| 75 Years and over | 10 (7.8%) | 2 (1.1%) |
Disability Class: Cognitive Difficulty
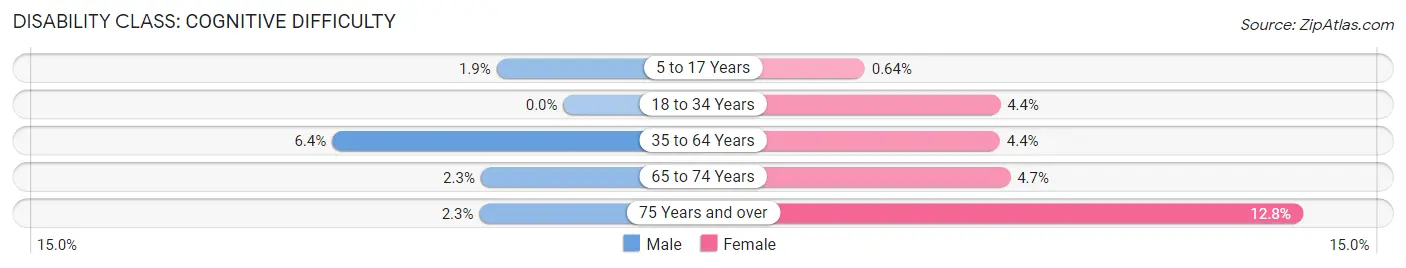
| Age Bracket | Male | Female |
| 5 to 17 Years | 5 (1.9%) | 2 (0.6%) |
| 18 to 34 Years | 0 (0.0%) | 13 (4.4%) |
| 35 to 64 Years | 40 (6.4%) | 29 (4.4%) |
| 65 to 74 Years | 5 (2.3%) | 9 (4.7%) |
| 75 Years and over | 3 (2.3%) | 24 (12.8%) |
Disability Class: Ambulatory Difficulty
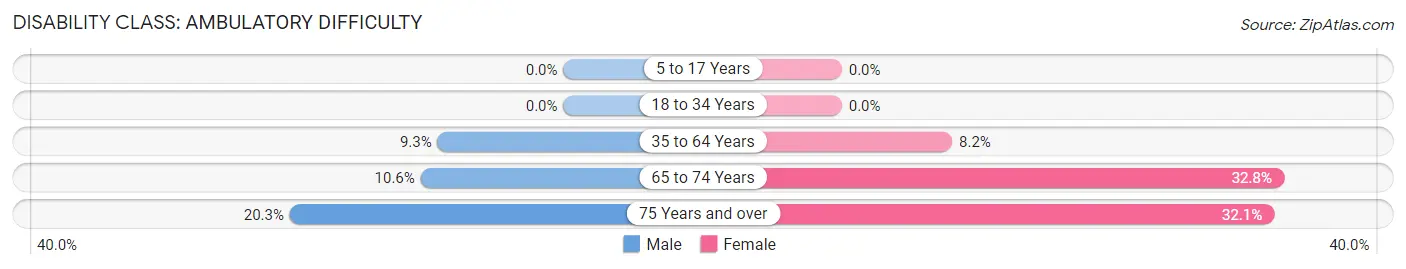
| Age Bracket | Male | Female |
| 5 to 17 Years | 0 (0.0%) | 0 (0.0%) |
| 18 to 34 Years | 0 (0.0%) | 0 (0.0%) |
| 35 to 64 Years | 58 (9.3%) | 54 (8.2%) |
| 65 to 74 Years | 23 (10.6%) | 63 (32.8%) |
| 75 Years and over | 26 (20.3%) | 60 (32.1%) |
Disability Class: Self-Care Difficulty
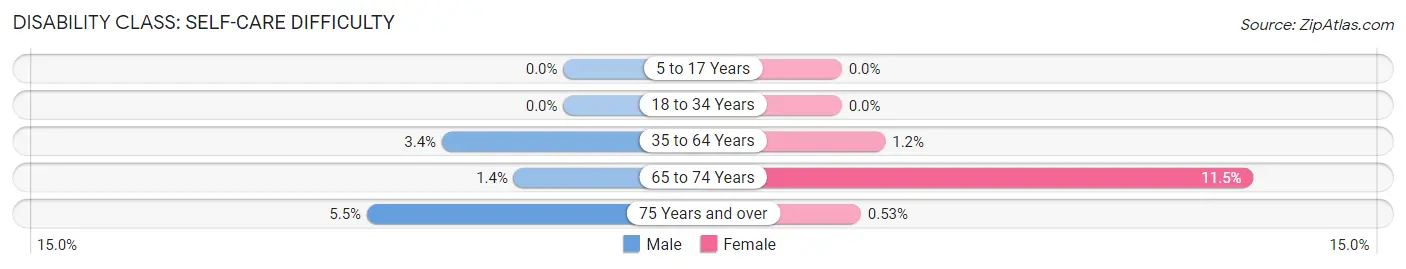
| Age Bracket | Male | Female |
| 5 to 17 Years | 0 (0.0%) | 0 (0.0%) |
| 18 to 34 Years | 0 (0.0%) | 0 (0.0%) |
| 35 to 64 Years | 21 (3.4%) | 8 (1.2%) |
| 65 to 74 Years | 3 (1.4%) | 22 (11.5%) |
| 75 Years and over | 7 (5.5%) | 1 (0.5%) |
Technology Access in Mercer County
Computing Device Access in Mercer County
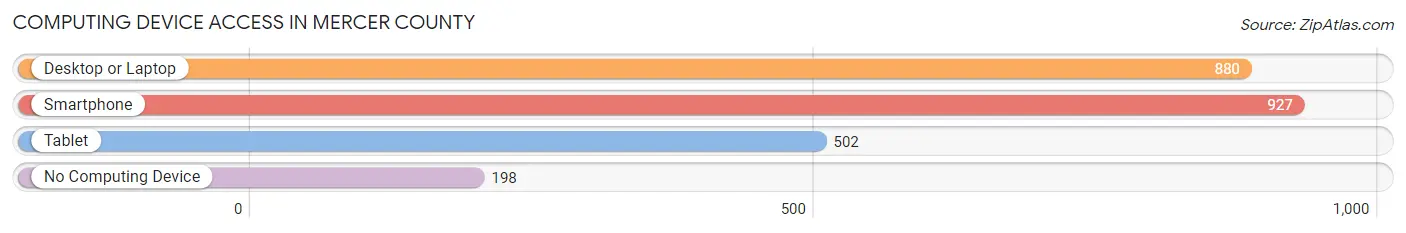
| Device Type | # Households | % Households |
| Desktop or Laptop | 880 | 70.2% |
| Smartphone | 927 | 74.0% |
| Tablet | 502 | 40.1% |
| No Computing Device | 198 | 15.8% |
| Total | 1,253 | 100.0% |
Internet Access in Mercer County
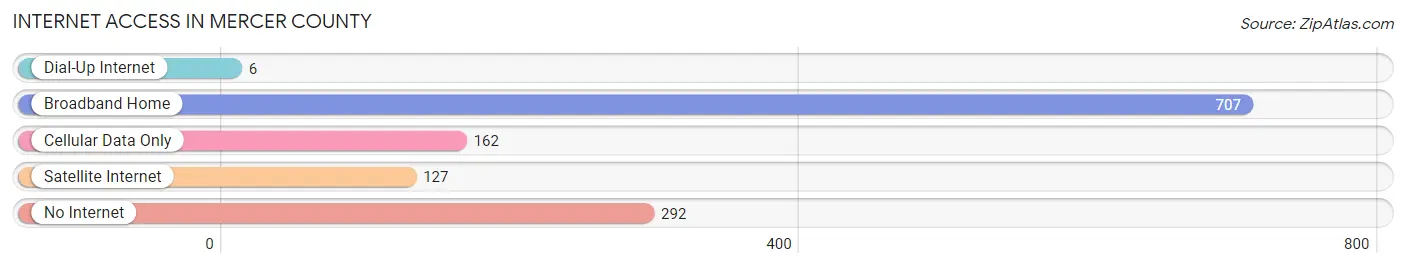
| Internet Type | # Households | % Households |
| Dial-Up Internet | 6 | 0.5% |
| Broadband Home | 707 | 56.4% |
| Cellular Data Only | 162 | 12.9% |
| Satellite Internet | 127 | 10.1% |
| No Internet | 292 | 23.3% |
| Total | 1,253 | 100.0% |
Mercer County Summary
Mercer County is located in the northern part of Missouri, in the United States. It is bordered by Grundy County to the north, Harrison County to the east, Sullivan County to the south, and Putnam County to the west. The county seat is Princeton, and the largest city is Princeton. The county was organized in 1845 and named after General Hugh Mercer, a Revolutionary War hero.
Geography
Mercer County covers an area of 576 square miles, of which 575 square miles is land and 1 square mile is water. The county is located in the Ozark Plateau region of Missouri, and is characterized by rolling hills and valleys. The highest point in the county is located in the northwest corner, at an elevation of 1,068 feet. The county is drained by the North Fabius River, which flows through the center of the county.
The climate of Mercer County is humid continental, with hot, humid summers and cold, dry winters. The average annual temperature is 54°F, and the average annual precipitation is 39 inches.
Demographics
As of the 2010 census, there were 8,476 people, 3,521 households, and 2,395 families living in Mercer County. The population density was 14.7 people per square mile. The racial makeup of the county was 97.3% White, 0.3% African American, 0.3% Native American, 0.2% Asian, 0.1% Pacific Islander, 0.6% from other races, and 1.2% from two or more races. Hispanic or Latino of any race were 1.7% of the population.
The median income for a household in the county was $37,945, and the median income for a family was $45,945. The per capita income for the county was $18,945. About 11.3% of families and 14.2% of the population were below the poverty line, including 18.2% of those under age 18 and 11.2% of those age 65 or over.
Economy
The economy of Mercer County is largely based on agriculture. The county is home to a variety of crops, including corn, soybeans, wheat, hay, and oats. Livestock production is also important, with beef cattle, dairy cattle, and hogs being the most common.
The county is also home to several manufacturing companies, including a furniture factory, a plastics factory, and a metal fabrication plant. Tourism is also an important part of the economy, with several state parks and recreational areas located in the county.
Mercer County is served by two school districts, the Princeton R-V School District and the Mercer County R-III School District. The county also has several private schools, including a Catholic school and a Christian school.
Mercer County is served by two hospitals, the Princeton Regional Medical Center and the Mercer County Hospital. The county also has several nursing homes and assisted living facilities.
Mercer County is served by several major highways, including Interstate 35, U.S. Route 65, and Missouri Route 6. The county is also served by several local airports, including the Princeton Municipal Airport and the Mercer County Airport.
Mercer County is a rural county with a strong agricultural base. The county is home to a variety of businesses, including manufacturing, tourism, and healthcare. The county is served by several major highways and airports, and is home to two school districts and several private schools.
Common Questions
What is Per Capita Income in Mercer County?
Per Capita income in Mercer County is $26,850.
What is the Median Family Income in Mercer County?
Median Family Income in Mercer County is $76,875.
What is the Median Household income in Mercer County?
Median Household Income in Mercer County is $55,592.
What is Income or Wage Gap in Mercer County?
Income or Wage Gap in Mercer County is 2.8%.
Women in Mercer County earn 97.2 cents for every dollar earned by a man.
What is Inequality or Gini Index in Mercer County?
Inequality or Gini Index in Mercer County is 0.41.
What is the Total Population of Mercer County?
Total Population of Mercer County is 3,517.
What is the Total Male Population of Mercer County?
Total Male Population of Mercer County is 1,726.
What is the Total Female Population of Mercer County?
Total Female Population of Mercer County is 1,791.
What is the Ratio of Males per 100 Females in Mercer County?
There are 96.37 Males per 100 Females in Mercer County.
What is the Ratio of Females per 100 Males in Mercer County?
There are 103.77 Females per 100 Males in Mercer County.
What is the Median Population Age in Mercer County?
Median Population Age in Mercer County is 41.7 Years.
What is the Average Family Size in Mercer County
Average Family Size in Mercer County is 3.7 People.
What is the Average Household Size in Mercer County
Average Household Size in Mercer County is 2.8 People.
How Large is the Labor Force in Mercer County?
There are 1,547 People in the Labor Forcein in Mercer County.
What is the Percentage of People in the Labor Force in Mercer County?
57.2% of People are in the Labor Force in Mercer County.
What is the Unemployment Rate in Mercer County?
Unemployment Rate in Mercer County is 2.9%.