McDonald County, MO Map & Demographics
McDonald County Map
McDonald County Overview
$23,210
PER CAPITA INCOME
$53,431
AVG FAMILY INCOME
$46,494
AVG HOUSEHOLD INCOME
26.4%
WAGE / INCOME GAP [ % ]
73.6¢/ $1
WAGE / INCOME GAP [ $ ]
$11,257
FAMILY INCOME DEFICIT
0.43
INEQUALITY / GINI INDEX
23,381
TOTAL POPULATION
11,840
MALE POPULATION
11,541
FEMALE POPULATION
102.59
MALES / 100 FEMALES
97.47
FEMALES / 100 MALES
38.2
MEDIAN AGE
3.3
AVG FAMILY SIZE
2.8
AVG HOUSEHOLD SIZE
10,252
LABOR FORCE [ PEOPLE ]
56.3%
PERCENT IN LABOR FORCE
5.9%
UNEMPLOYMENT RATE
McDonald County Area Codes
Income in McDonald County
Income Overview in McDonald County
Per Capita Income in McDonald County is $23,210, while median incomes of families and households are $53,431 and $46,494 respectively.
| Characteristic | Number | Measure |
| Per Capita Income | 23,381 | $23,210 |
| Median Family Income | 5,880 | $53,431 |
| Mean Family Income | 5,880 | $67,289 |
| Median Household Income | 8,399 | $46,494 |
| Mean Household Income | 8,399 | $61,956 |
| Income Deficit | 5,880 | $11,257 |
| Wage / Income Gap (%) | 23,381 | 26.42% |
| Wage / Income Gap ($) | 23,381 | 73.58¢ per $1 |
| Gini / Inequality Index | 23,381 | 0.43 |
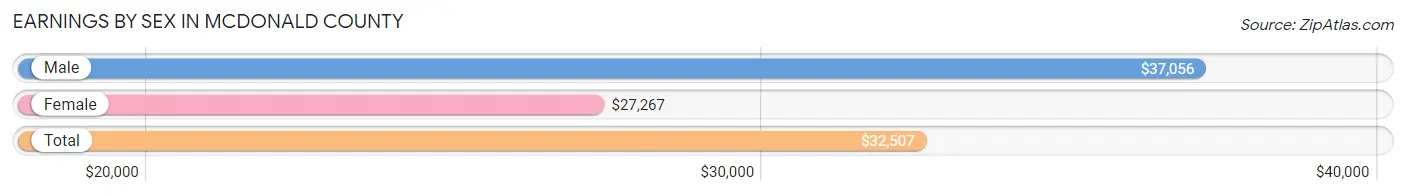
Earnings by Sex in McDonald County
Average Earnings in McDonald County are $32,507, $37,056 for men and $27,267 for women, a difference of 26.4%.
| Sex | Number | Average Earnings |
| Male | 6,038 (56.5%) | $37,056 |
| Female | 4,643 (43.5%) | $27,267 |
| Total | 10,681 (100.0%) | $32,507 |
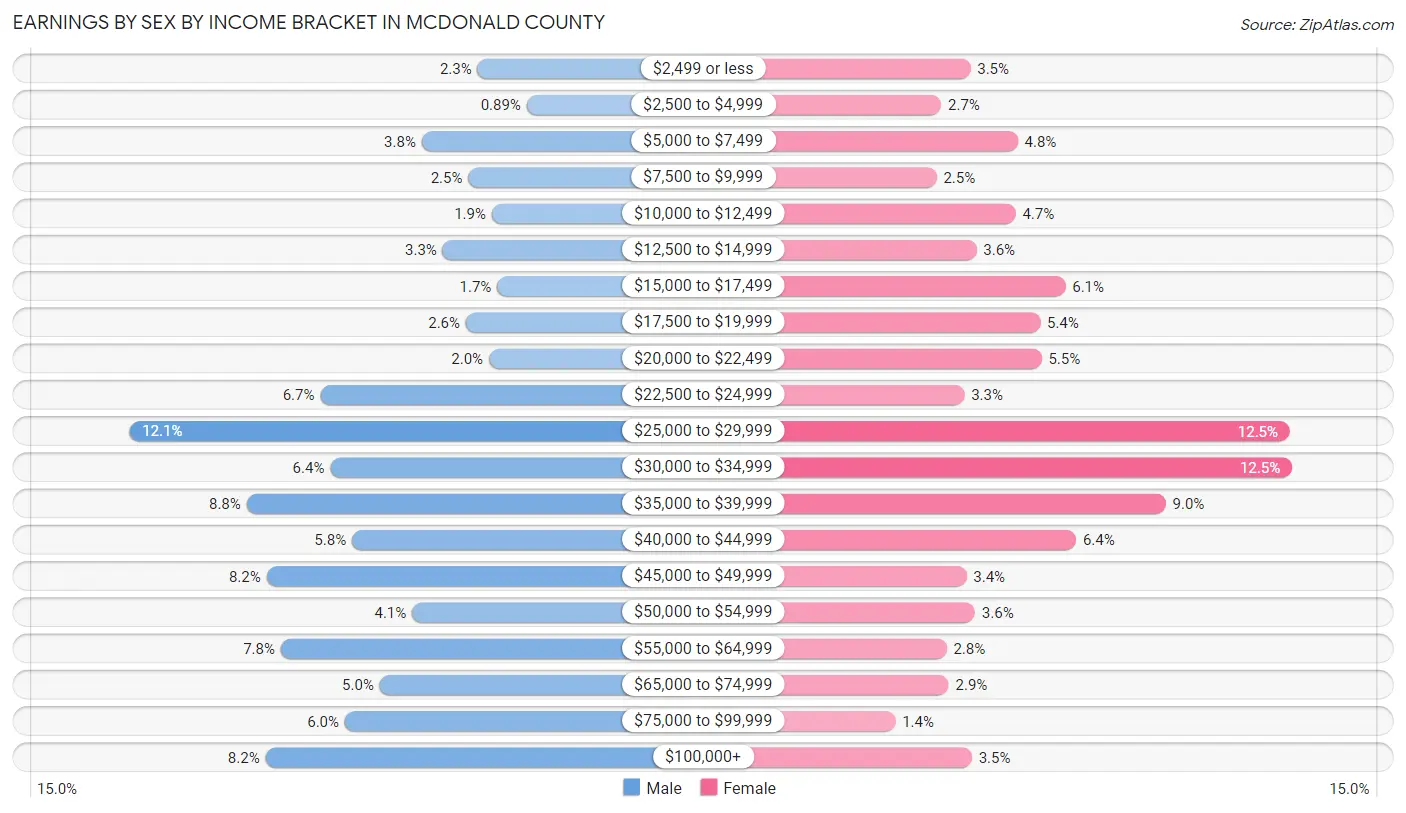
Earnings by Sex by Income Bracket in McDonald County
The most common earnings brackets in McDonald County are $25,000 to $29,999 for men (728 | 12.1%) and $30,000 to $34,999 for women (581 | 12.5%).
| Income | Male | Female |
| $2,499 or less | 137 (2.3%) | 161 (3.5%) |
| $2,500 to $4,999 | 54 (0.9%) | 123 (2.6%) |
| $5,000 to $7,499 | 232 (3.8%) | 223 (4.8%) |
| $7,500 to $9,999 | 153 (2.5%) | 117 (2.5%) |
| $10,000 to $12,499 | 113 (1.9%) | 220 (4.7%) |
| $12,500 to $14,999 | 196 (3.3%) | 169 (3.6%) |
| $15,000 to $17,499 | 104 (1.7%) | 285 (6.1%) |
| $17,500 to $19,999 | 157 (2.6%) | 252 (5.4%) |
| $20,000 to $22,499 | 118 (1.9%) | 254 (5.5%) |
| $22,500 to $24,999 | 404 (6.7%) | 153 (3.3%) |
| $25,000 to $29,999 | 728 (12.1%) | 578 (12.4%) |
| $30,000 to $34,999 | 387 (6.4%) | 581 (12.5%) |
| $35,000 to $39,999 | 529 (8.8%) | 416 (9.0%) |
| $40,000 to $44,999 | 350 (5.8%) | 299 (6.4%) |
| $45,000 to $49,999 | 495 (8.2%) | 156 (3.4%) |
| $50,000 to $54,999 | 248 (4.1%) | 167 (3.6%) |
| $55,000 to $64,999 | 471 (7.8%) | 130 (2.8%) |
| $65,000 to $74,999 | 303 (5.0%) | 133 (2.9%) |
| $75,000 to $99,999 | 362 (6.0%) | 63 (1.4%) |
| $100,000+ | 497 (8.2%) | 163 (3.5%) |
| Total | 6,038 (100.0%) | 4,643 (100.0%) |
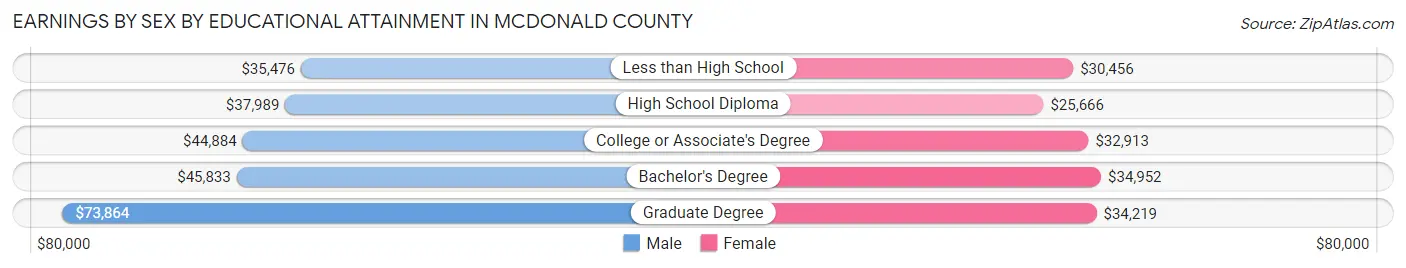
Earnings by Sex by Educational Attainment in McDonald County
Average earnings in McDonald County are $39,293 for men and $30,296 for women, a difference of 22.9%. Men with an educational attainment of graduate degree enjoy the highest average annual earnings of $73,864, while those with less than high school education earn the least with $35,476. Women with an educational attainment of bachelor's degree earn the most with the average annual earnings of $34,952, while those with high school diploma education have the smallest earnings of $25,666.
| Educational Attainment | Male Income | Female Income |
| Less than High School | $35,476 | $30,456 |
| High School Diploma | $37,989 | $25,666 |
| College or Associate's Degree | $44,884 | $32,913 |
| Bachelor's Degree | $45,833 | $34,952 |
| Graduate Degree | $73,864 | $34,219 |
| Total | $39,293 | $30,296 |
Family Income in McDonald County
Family Income Brackets in McDonald County
According to the McDonald County family income data, there are 1,170 families falling into the $50,000 to $74,999 income range, which is the most common income bracket and makes up 19.9% of all families. Conversely, the $200,000+ income bracket is the least frequent group with only 100 families (1.7%) belonging to this category.
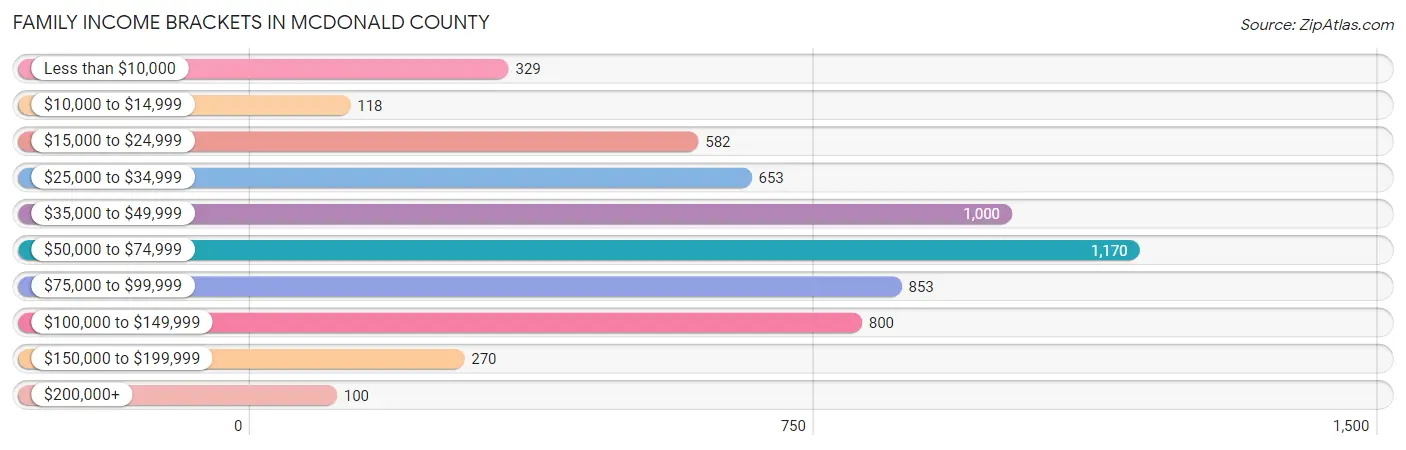
| Income Bracket | # Families | % Families |
| Less than $10,000 | 329 | 5.6% |
| $10,000 to $14,999 | 118 | 2.0% |
| $15,000 to $24,999 | 582 | 9.9% |
| $25,000 to $34,999 | 653 | 11.1% |
| $35,000 to $49,999 | 1,000 | 17.0% |
| $50,000 to $74,999 | 1,170 | 19.9% |
| $75,000 to $99,999 | 853 | 14.5% |
| $100,000 to $149,999 | 800 | 13.6% |
| $150,000 to $199,999 | 270 | 4.6% |
| $200,000+ | 100 | 1.7% |
Family Income by Famaliy Size in McDonald County
7+ person families (215 | 3.7%) account for the highest median family income in McDonald County with $96,215 per family, while 2-person families (2,758 | 46.9%) have the highest median income of $22,786 per family member.
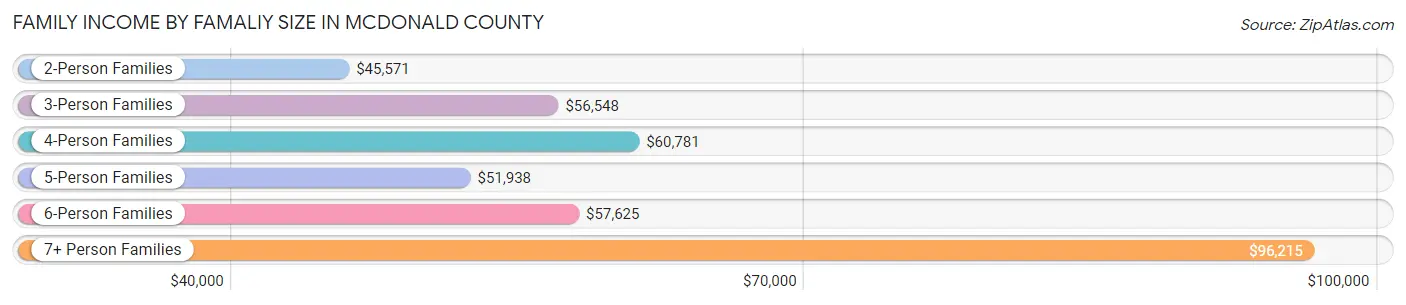
| Income Bracket | # Families | Median Income |
| 2-Person Families | 2,758 (46.9%) | $45,571 |
| 3-Person Families | 1,204 (20.5%) | $56,548 |
| 4-Person Families | 943 (16.0%) | $60,781 |
| 5-Person Families | 433 (7.4%) | $51,938 |
| 6-Person Families | 327 (5.6%) | $57,625 |
| 7+ Person Families | 215 (3.7%) | $96,215 |
| Total | 5,880 (100.0%) | $53,431 |
Family Income by Number of Earners in McDonald County
The median family income in McDonald County is $53,431, with families comprising 3+ earners (467) having the highest median family income of $91,250, while families with no earners (1,180) have the lowest median family income of $25,580, accounting for 7.9% and 20.1% of families, respectively.
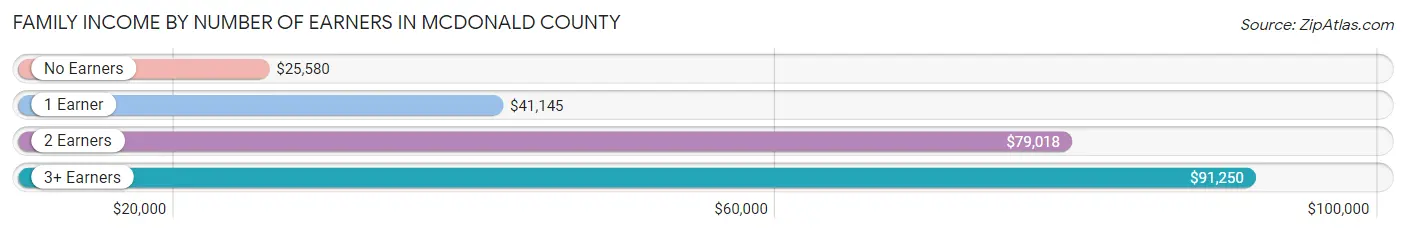
| Number of Earners | # Families | Median Income |
| No Earners | 1,180 (20.1%) | $25,580 |
| 1 Earner | 2,204 (37.5%) | $41,145 |
| 2 Earners | 2,029 (34.5%) | $79,018 |
| 3+ Earners | 467 (7.9%) | $91,250 |
| Total | 5,880 (100.0%) | $53,431 |
Household Income in McDonald County
Household Income Brackets in McDonald County
With 1,445 households falling in the category, the $50,000 to $74,999 income range is the most frequent in McDonald County, accounting for 17.2% of all households. In contrast, only 134 households (1.6%) fall into the $200,000+ income bracket, making it the least populous group.
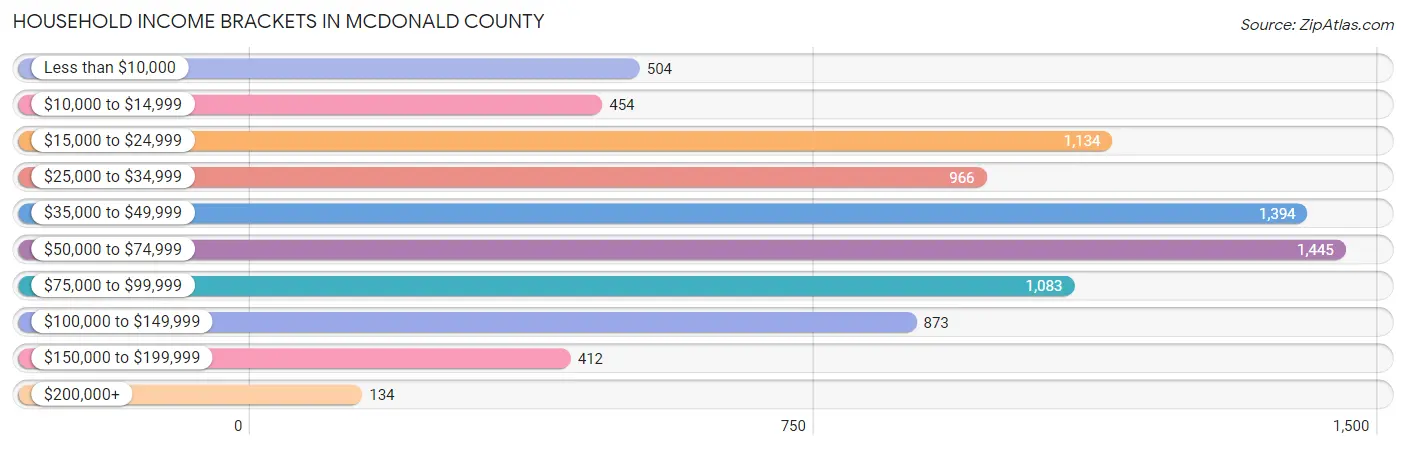
| Income Bracket | # Households | % Households |
| Less than $10,000 | 504 | 6.0% |
| $10,000 to $14,999 | 454 | 5.4% |
| $15,000 to $24,999 | 1,134 | 13.5% |
| $25,000 to $34,999 | 966 | 11.5% |
| $35,000 to $49,999 | 1,394 | 16.6% |
| $50,000 to $74,999 | 1,445 | 17.2% |
| $75,000 to $99,999 | 1,083 | 12.9% |
| $100,000 to $149,999 | 873 | 10.4% |
| $150,000 to $199,999 | 412 | 4.9% |
| $200,000+ | 134 | 1.6% |
Household Income by Householder Age in McDonald County
The median household income in McDonald County is $46,494, with the highest median household income of $62,926 found in the 45 to 64 years age bracket for the primary householder. A total of 3,369 households (40.1%) fall into this category. Meanwhile, the 65+ years age bracket for the primary householder has the lowest median household income of $31,628, with 1,999 households (23.8%) in this group.
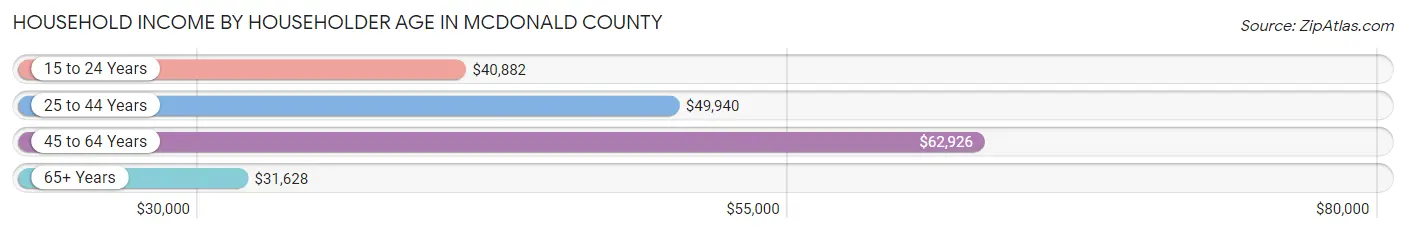
| Income Bracket | # Households | Median Income |
| 15 to 24 Years | 260 (3.1%) | $40,882 |
| 25 to 44 Years | 2,771 (33.0%) | $49,940 |
| 45 to 64 Years | 3,369 (40.1%) | $62,926 |
| 65+ Years | 1,999 (23.8%) | $31,628 |
| Total | 8,399 (100.0%) | $46,494 |
Poverty in McDonald County
Income Below Poverty by Sex and Age in McDonald County
With 16.6% poverty level for males and 17.3% for females among the residents of McDonald County, 15 year old males and 15 year old females are the most vulnerable to poverty, with 131 males (54.6%) and 48 females (40.7%) in their respective age groups living below the poverty level.
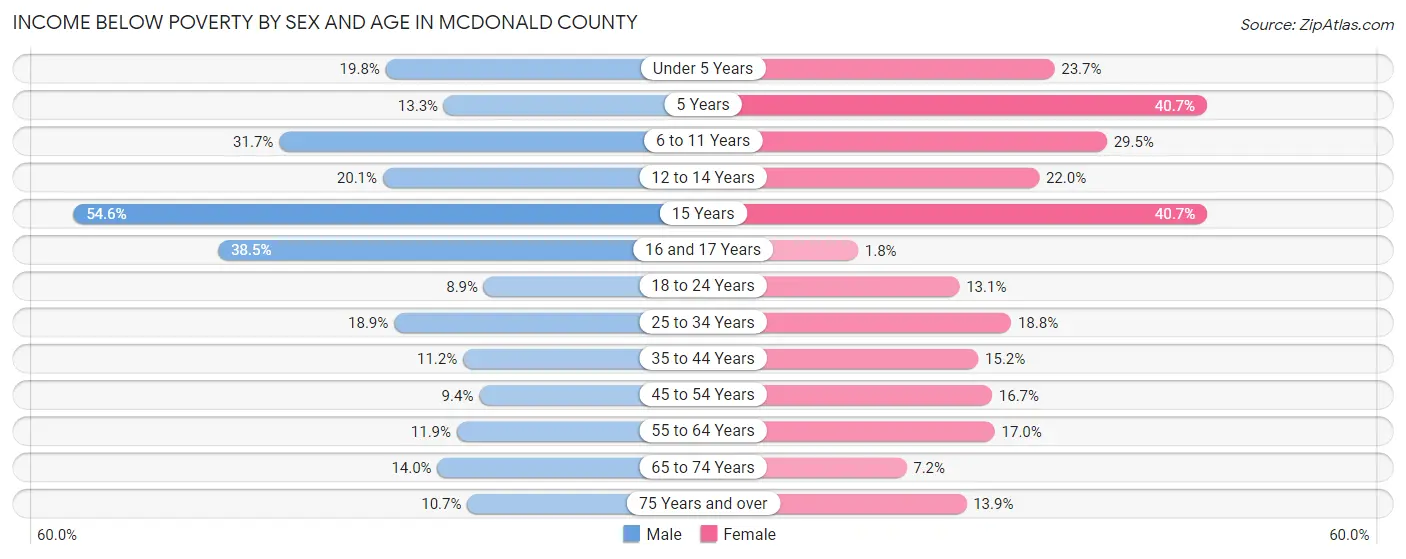
| Age Bracket | Male | Female |
| Under 5 Years | 148 (19.8%) | 174 (23.7%) |
| 5 Years | 29 (13.3%) | 50 (40.6%) |
| 6 to 11 Years | 276 (31.7%) | 290 (29.5%) |
| 12 to 14 Years | 117 (20.1%) | 94 (22.0%) |
| 15 Years | 131 (54.6%) | 48 (40.7%) |
| 16 and 17 Years | 175 (38.5%) | 6 (1.8%) |
| 18 to 24 Years | 84 (8.8%) | 116 (13.1%) |
| 25 to 34 Years | 279 (18.9%) | 262 (18.8%) |
| 35 to 44 Years | 164 (11.2%) | 210 (15.2%) |
| 45 to 54 Years | 139 (9.4%) | 248 (16.7%) |
| 55 to 64 Years | 188 (11.9%) | 291 (17.0%) |
| 65 to 74 Years | 153 (14.0%) | 78 (7.2%) |
| 75 Years and over | 60 (10.7%) | 102 (13.9%) |
| Total | 1,943 (16.6%) | 1,969 (17.3%) |
Income Above Poverty by Sex and Age in McDonald County
According to the poverty statistics in McDonald County, males aged 18 to 24 years and females aged 16 and 17 years are the age groups that are most secure financially, with 91.1% of males and 98.2% of females in these age groups living above the poverty line.
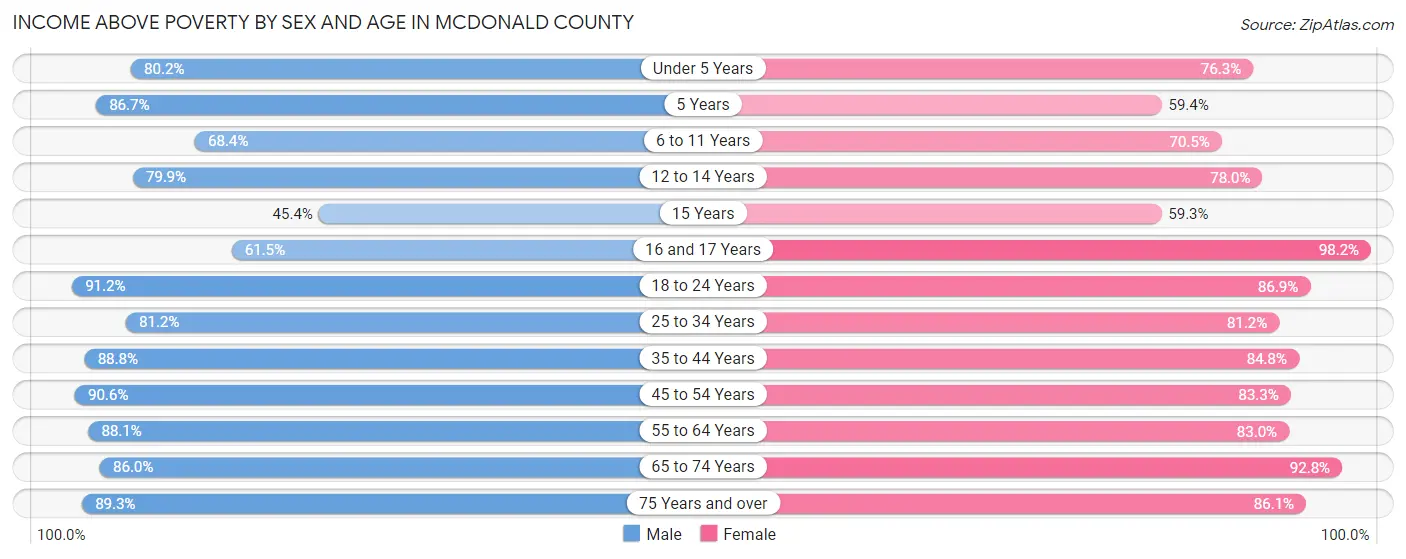
| Age Bracket | Male | Female |
| Under 5 Years | 600 (80.2%) | 561 (76.3%) |
| 5 Years | 189 (86.7%) | 73 (59.4%) |
| 6 to 11 Years | 596 (68.3%) | 693 (70.5%) |
| 12 to 14 Years | 465 (79.9%) | 334 (78.0%) |
| 15 Years | 109 (45.4%) | 70 (59.3%) |
| 16 and 17 Years | 280 (61.5%) | 330 (98.2%) |
| 18 to 24 Years | 865 (91.1%) | 771 (86.9%) |
| 25 to 34 Years | 1,201 (81.1%) | 1,129 (81.2%) |
| 35 to 44 Years | 1,304 (88.8%) | 1,173 (84.8%) |
| 45 to 54 Years | 1,344 (90.6%) | 1,236 (83.3%) |
| 55 to 64 Years | 1,397 (88.1%) | 1,419 (83.0%) |
| 65 to 74 Years | 938 (86.0%) | 1,008 (92.8%) |
| 75 Years and over | 501 (89.3%) | 634 (86.1%) |
| Total | 9,789 (83.4%) | 9,431 (82.7%) |
Income Below Poverty Among Married-Couple Families in McDonald County
The poverty statistics for married-couple families in McDonald County show that 10.1% or 460 of the total 4,558 families live below the poverty line. Families with 3 or 4 children have the highest poverty rate of 28.3%, comprising of 175 families. On the other hand, families with 1 or 2 children have the lowest poverty rate of 5.4%, which includes 63 families.
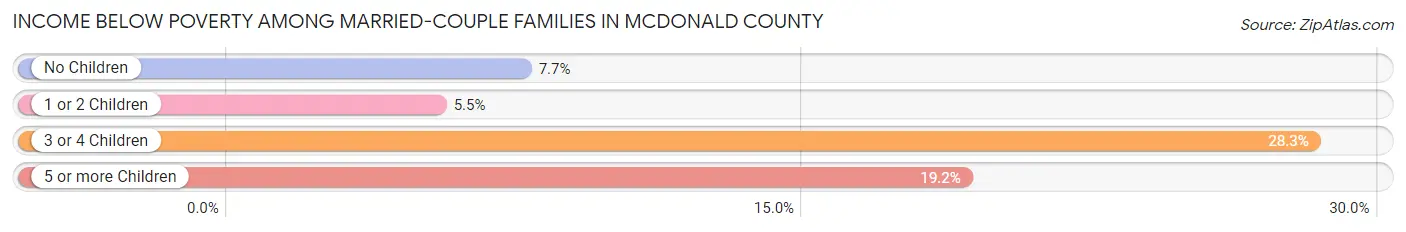
| Children | Above Poverty | Below Poverty |
| No Children | 2,503 (92.3%) | 208 (7.7%) |
| 1 or 2 Children | 1,092 (94.6%) | 63 (5.4%) |
| 3 or 4 Children | 444 (71.7%) | 175 (28.3%) |
| 5 or more Children | 59 (80.8%) | 14 (19.2%) |
| Total | 4,098 (89.9%) | 460 (10.1%) |
Income Below Poverty Among Single-Parent Households in McDonald County
According to the poverty data in McDonald County, 9.7% or 47 single-father households and 39.5% or 331 single-mother households are living below the poverty line. Among single-father households, those with 3 or 4 children have the highest poverty rate, with 27 households (43.5%) experiencing poverty. Likewise, among single-mother households, those with 5 or more children have the highest poverty rate, with 14 households (100.0%) falling below the poverty line.
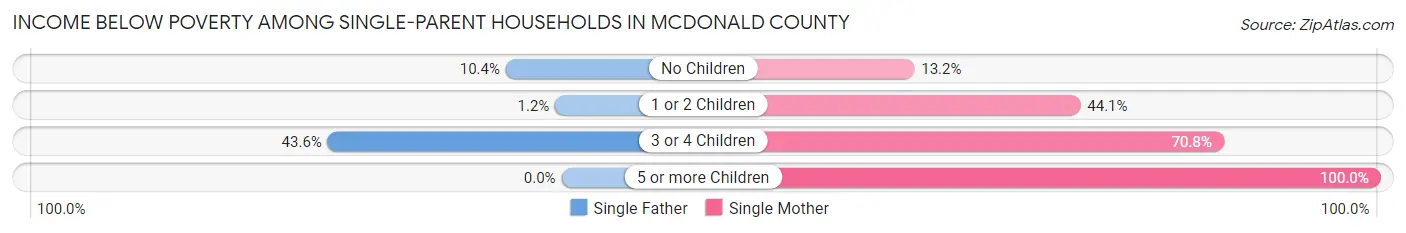
| Children | Single Father | Single Mother |
| No Children | 17 (10.4%) | 30 (13.2%) |
| 1 or 2 Children | 3 (1.2%) | 224 (44.1%) |
| 3 or 4 Children | 27 (43.5%) | 63 (70.8%) |
| 5 or more Children | 0 (0.0%) | 14 (100.0%) |
| Total | 47 (9.7%) | 331 (39.5%) |
Income Below Poverty Among Married-Couple vs Single-Parent Households in McDonald County
The poverty data for McDonald County shows that 460 of the married-couple family households (10.1%) and 378 of the single-parent households (28.6%) are living below the poverty level. Within the married-couple family households, those with 3 or 4 children have the highest poverty rate, with 175 households (28.3%) falling below the poverty line. Among the single-parent households, those with 5 or more children have the highest poverty rate, with 14 household (100.0%) living below poverty.
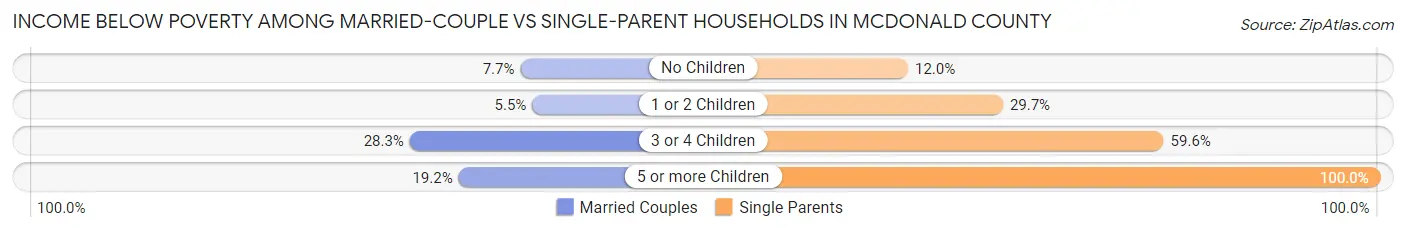
| Children | Married-Couple Families | Single-Parent Households |
| No Children | 208 (7.7%) | 47 (12.0%) |
| 1 or 2 Children | 63 (5.4%) | 227 (29.7%) |
| 3 or 4 Children | 175 (28.3%) | 90 (59.6%) |
| 5 or more Children | 14 (19.2%) | 14 (100.0%) |
| Total | 460 (10.1%) | 378 (28.6%) |
Race in McDonald County
The most populous races in McDonald County are White / Caucasian (17,738 | 75.9%), Two or more Races (3,133 | 13.4%), and Hispanic or Latino (2,712 | 11.6%).
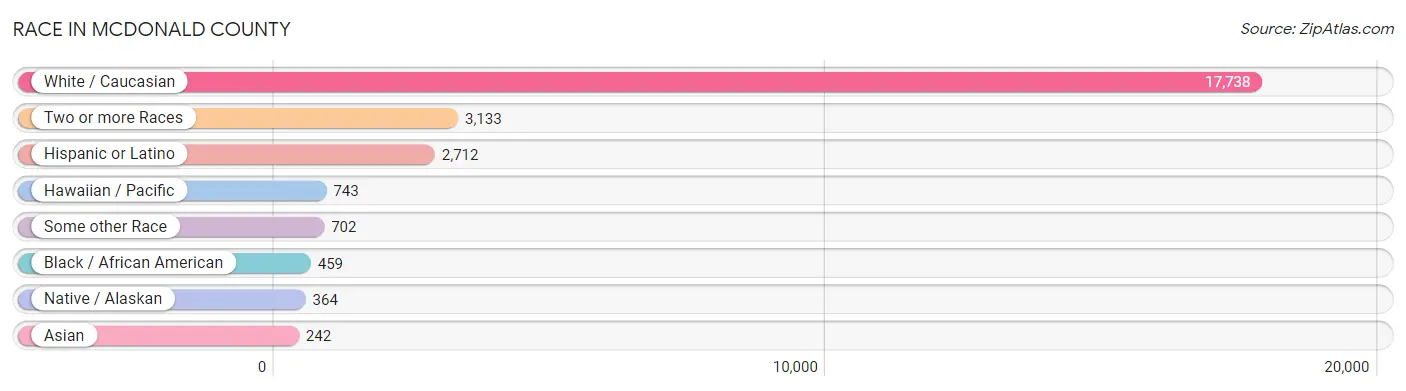
| Race | # Population | % Population |
| Asian | 242 | 1.0% |
| Black / African American | 459 | 2.0% |
| Hawaiian / Pacific | 743 | 3.2% |
| Hispanic or Latino | 2,712 | 11.6% |
| Native / Alaskan | 364 | 1.6% |
| White / Caucasian | 17,738 | 75.9% |
| Two or more Races | 3,133 | 13.4% |
| Some other Race | 702 | 3.0% |
| Total | 23,381 | 100.0% |
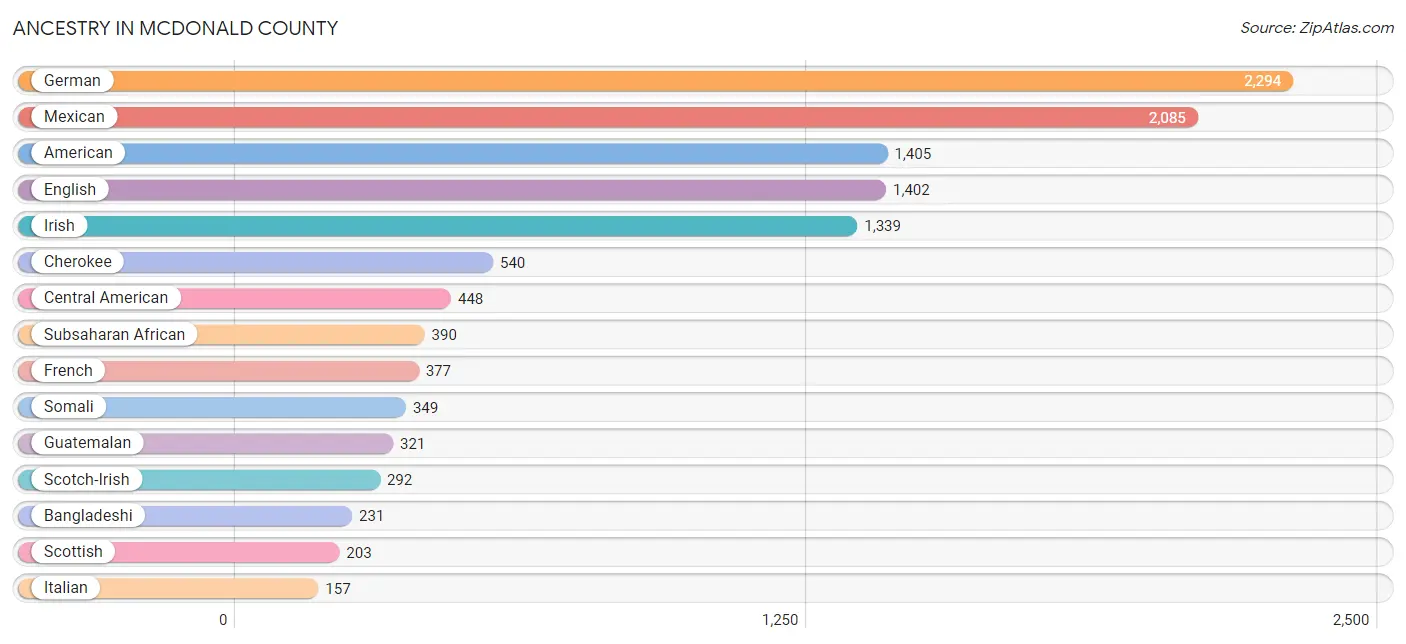
Ancestry in McDonald County
The most populous ancestries reported in McDonald County are German (2,294 | 9.8%), Mexican (2,085 | 8.9%), American (1,405 | 6.0%), English (1,402 | 6.0%), and Irish (1,339 | 5.7%), together accounting for 36.5% of all McDonald County residents.
| Ancestry | # Population | % Population |
| African | 24 | 0.1% |
| American | 1,405 | 6.0% |
| Apache | 1 | 0.0% |
| Arab | 4 | 0.0% |
| Armenian | 17 | 0.1% |
| Austrian | 2 | 0.0% |
| Bangladeshi | 231 | 1.0% |
| Belgian | 2 | 0.0% |
| Bhutanese | 21 | 0.1% |
| Blackfeet | 94 | 0.4% |
| Bolivian | 2 | 0.0% |
| British | 61 | 0.3% |
| Bulgarian | 8 | 0.0% |
| Burmese | 17 | 0.1% |
| Cajun | 34 | 0.2% |
| Central American | 448 | 1.9% |
| Central American Indian | 14 | 0.1% |
| Cherokee | 540 | 2.3% |
| Chilean | 9 | 0.0% |
| Choctaw | 96 | 0.4% |
| Creek | 3 | 0.0% |
| Cuban | 3 | 0.0% |
| Czech | 51 | 0.2% |
| Czechoslovakian | 23 | 0.1% |
| Danish | 113 | 0.5% |
| Dutch | 155 | 0.7% |
| Dutch West Indian | 9 | 0.0% |
| Eastern European | 10 | 0.0% |
| Egyptian | 4 | 0.0% |
| English | 1,402 | 6.0% |
| European | 126 | 0.5% |
| Fijian | 28 | 0.1% |
| French | 377 | 1.6% |
| French Canadian | 41 | 0.2% |
| German | 2,294 | 9.8% |
| Guamanian / Chamorro | 7 | 0.0% |
| Guatemalan | 321 | 1.4% |
| Honduran | 91 | 0.4% |
| Icelander | 26 | 0.1% |
| Indonesian | 69 | 0.3% |
| Irish | 1,339 | 5.7% |
| Iroquois | 7 | 0.0% |
| Italian | 157 | 0.7% |
| Jamaican | 1 | 0.0% |
| Kiowa | 1 | 0.0% |
| Lithuanian | 35 | 0.2% |
| Mexican | 2,085 | 8.9% |
| Northern European | 12 | 0.1% |
| Norwegian | 122 | 0.5% |
| Osage | 3 | 0.0% |
| Ottawa | 12 | 0.1% |
| Pakistani | 59 | 0.3% |
| Polish | 89 | 0.4% |
| Portuguese | 12 | 0.1% |
| Russian | 99 | 0.4% |
| Salvadoran | 36 | 0.2% |
| Scandinavian | 51 | 0.2% |
| Scotch-Irish | 292 | 1.3% |
| Scottish | 203 | 0.9% |
| Sioux | 121 | 0.5% |
| Somali | 349 | 1.5% |
| South American | 29 | 0.1% |
| Spanish | 25 | 0.1% |
| Sri Lankan | 62 | 0.3% |
| Subsaharan African | 390 | 1.7% |
| Sudanese | 17 | 0.1% |
| Swedish | 136 | 0.6% |
| Swiss | 86 | 0.4% |
| Ukrainian | 8 | 0.0% |
| Welsh | 30 | 0.1% |
| West Indian | 3 | 0.0% | View All 71 Rows |
Immigrants in McDonald County
The most numerous immigrant groups reported in McDonald County came from Latin America (1,216 | 5.2%), Central America (1,204 | 5.1%), Mexico (897 | 3.8%), Oceania (674 | 2.9%), and Micronesia (646 | 2.8%), together accounting for 19.8% of all McDonald County residents.
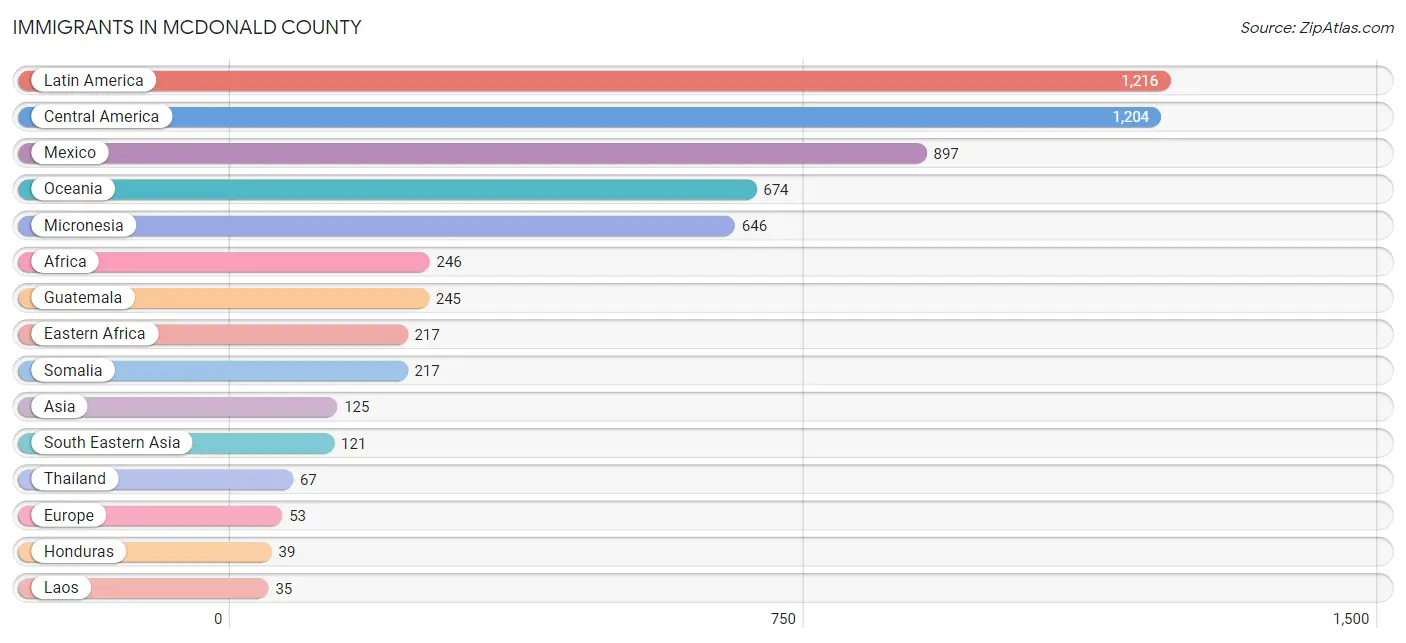
| Immigration Origin | # Population | % Population |
| Africa | 246 | 1.1% |
| Asia | 125 | 0.5% |
| Bulgaria | 8 | 0.0% |
| Canada | 7 | 0.0% |
| Caribbean | 3 | 0.0% |
| Central America | 1,204 | 5.1% |
| Chile | 9 | 0.0% |
| Dominica | 3 | 0.0% |
| Eastern Africa | 217 | 0.9% |
| Eastern Asia | 4 | 0.0% |
| Eastern Europe | 8 | 0.0% |
| El Salvador | 23 | 0.1% |
| England | 29 | 0.1% |
| Europe | 53 | 0.2% |
| Germany | 16 | 0.1% |
| Guatemala | 245 | 1.1% |
| Honduras | 39 | 0.2% |
| Korea | 4 | 0.0% |
| Laos | 35 | 0.2% |
| Latin America | 1,216 | 5.2% |
| Mexico | 897 | 3.8% |
| Micronesia | 646 | 2.8% |
| Northern Africa | 17 | 0.1% |
| Northern Europe | 29 | 0.1% |
| Oceania | 674 | 2.9% |
| Somalia | 217 | 0.9% |
| South America | 9 | 0.0% |
| South Eastern Asia | 121 | 0.5% |
| Sudan | 17 | 0.1% |
| Thailand | 67 | 0.3% |
| Vietnam | 9 | 0.0% |
| Western Europe | 16 | 0.1% | View All 32 Rows |
Sex and Age in McDonald County
Sex and Age in McDonald County
The most populous age groups in McDonald County are 15 to 19 Years (968 | 8.2%) for men and 60 to 64 Years (902 | 7.8%) for women.
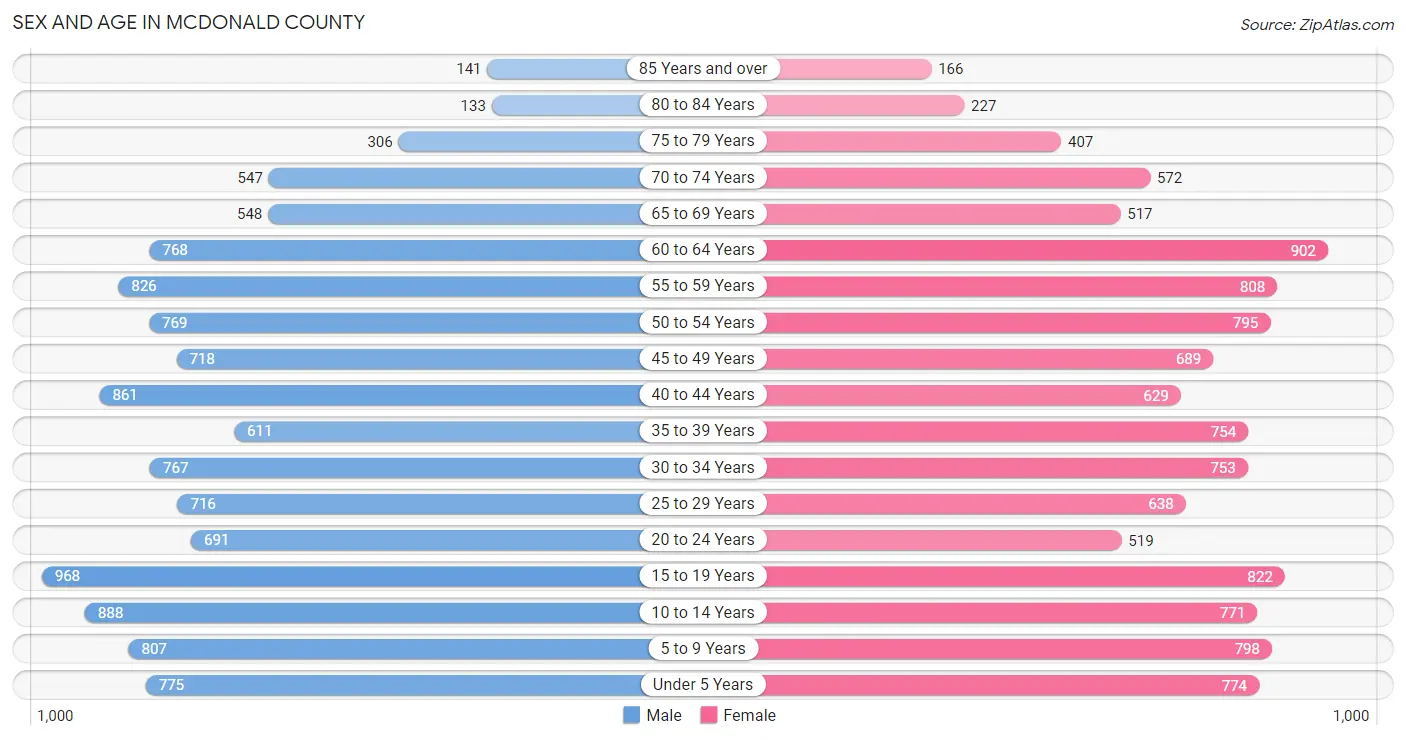
| Age Bracket | Male | Female |
| Under 5 Years | 775 (6.6%) | 774 (6.7%) |
| 5 to 9 Years | 807 (6.8%) | 798 (6.9%) |
| 10 to 14 Years | 888 (7.5%) | 771 (6.7%) |
| 15 to 19 Years | 968 (8.2%) | 822 (7.1%) |
| 20 to 24 Years | 691 (5.8%) | 519 (4.5%) |
| 25 to 29 Years | 716 (6.0%) | 638 (5.5%) |
| 30 to 34 Years | 767 (6.5%) | 753 (6.5%) |
| 35 to 39 Years | 611 (5.2%) | 754 (6.5%) |
| 40 to 44 Years | 861 (7.3%) | 629 (5.4%) |
| 45 to 49 Years | 718 (6.1%) | 689 (6.0%) |
| 50 to 54 Years | 769 (6.5%) | 795 (6.9%) |
| 55 to 59 Years | 826 (7.0%) | 808 (7.0%) |
| 60 to 64 Years | 768 (6.5%) | 902 (7.8%) |
| 65 to 69 Years | 548 (4.6%) | 517 (4.5%) |
| 70 to 74 Years | 547 (4.6%) | 572 (5.0%) |
| 75 to 79 Years | 306 (2.6%) | 407 (3.5%) |
| 80 to 84 Years | 133 (1.1%) | 227 (2.0%) |
| 85 Years and over | 141 (1.2%) | 166 (1.4%) |
| Total | 11,840 (100.0%) | 11,541 (100.0%) |
Families and Households in McDonald County
Median Family Size in McDonald County
The median family size in McDonald County is 3.27 persons per family, with married-couple families (4,558 | 77.5%) accounting for the largest median family size of 3.3 persons per family. On the other hand, single male/father families (483 | 8.2%) represent the smallest median family size with 3.10 persons per family.
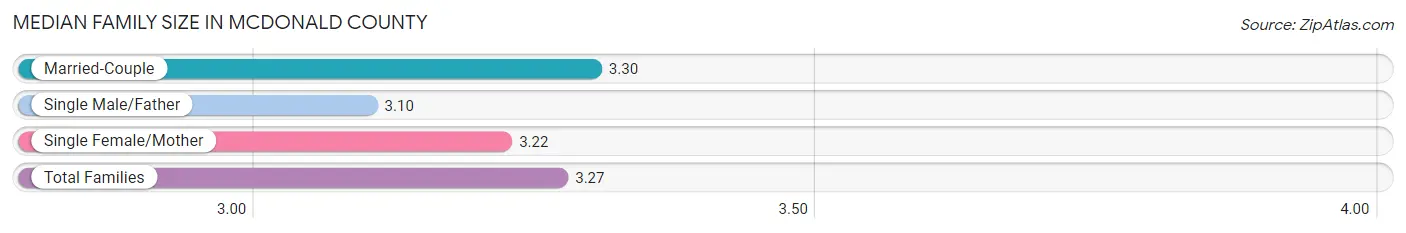
| Family Type | # Families | Family Size |
| Married-Couple | 4,558 (77.5%) | 3.30 |
| Single Male/Father | 483 (8.2%) | 3.10 |
| Single Female/Mother | 839 (14.3%) | 3.22 |
| Total Families | 5,880 (100.0%) | 3.27 |
Median Household Size in McDonald County
The median household size in McDonald County is 2.76 persons per household, with single female/mother households (839 | 10.0%) accounting for the largest median household size of 3.75 persons per household. non-family households (2,519 | 30.0%) represent the smallest median household size with 1.28 persons per household.
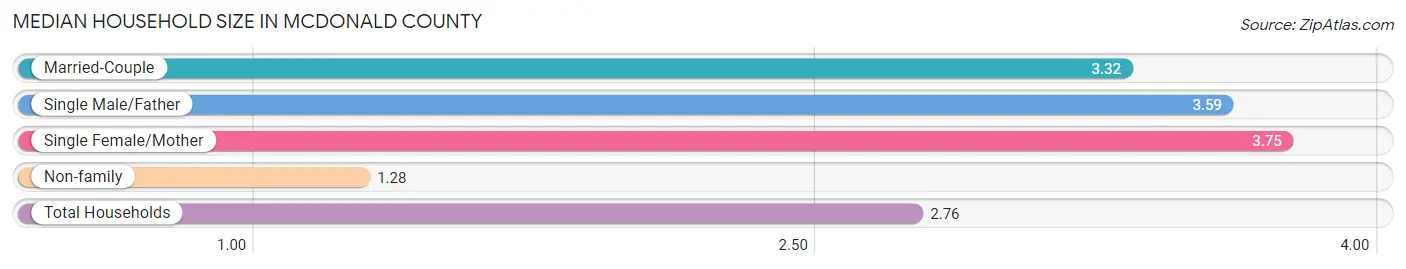
| Household Type | # Households | Household Size |
| Married-Couple | 4,558 (54.3%) | 3.32 |
| Single Male/Father | 483 (5.8%) | 3.59 |
| Single Female/Mother | 839 (10.0%) | 3.75 |
| Non-family | 2,519 (30.0%) | 1.28 |
| Total Households | 8,399 (100.0%) | 2.76 |
Household Size by Marriage Status in McDonald County
Out of a total of 8,399 households in McDonald County, 5,880 (70.0%) are family households, while 2,519 (30.0%) are nonfamily households. The most numerous type of family households are 2-person households, comprising 2,515, and the most common type of nonfamily households are 1-person households, comprising 1,975.
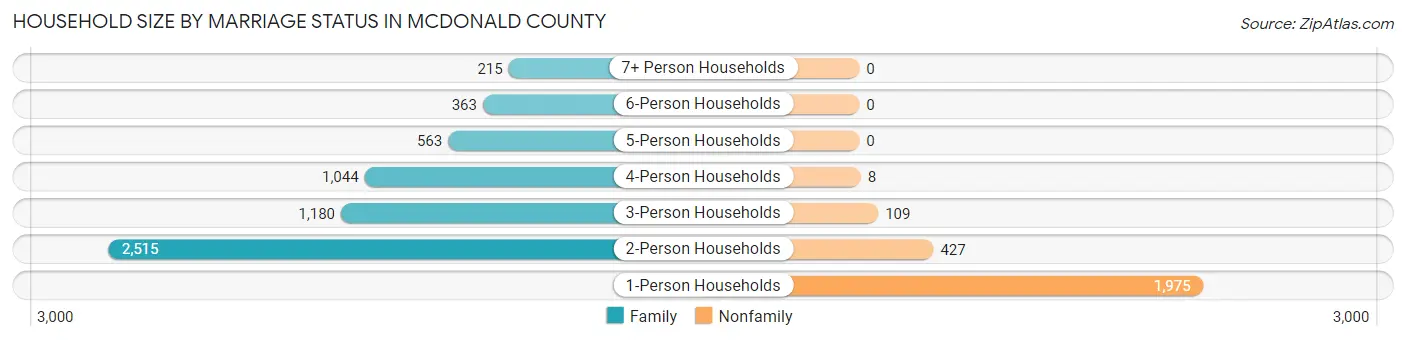
| Household Size | Family Households | Nonfamily Households |
| 1-Person Households | - | 1,975 (23.5%) |
| 2-Person Households | 2,515 (29.9%) | 427 (5.1%) |
| 3-Person Households | 1,180 (14.1%) | 109 (1.3%) |
| 4-Person Households | 1,044 (12.4%) | 8 (0.1%) |
| 5-Person Households | 563 (6.7%) | 0 (0.0%) |
| 6-Person Households | 363 (4.3%) | 0 (0.0%) |
| 7+ Person Households | 215 (2.6%) | 0 (0.0%) |
| Total | 5,880 (70.0%) | 2,519 (30.0%) |
Female Fertility in McDonald County
Fertility by Age in McDonald County
Average fertility rate in McDonald County is 42.0 births per 1,000 women. Women in the age bracket of 20 to 34 years have the highest fertility rate with 68.0 births per 1,000 women. Women in the age bracket of 20 to 34 years acount for 63.4% of all women with births.
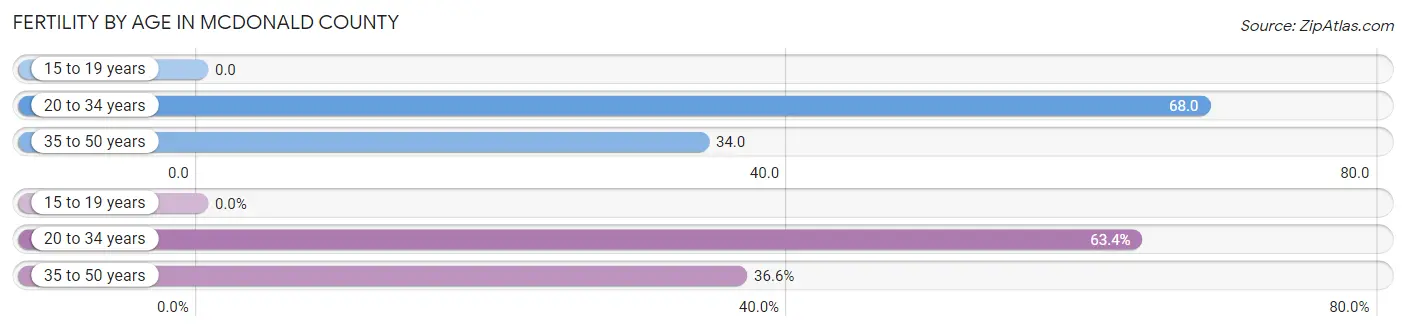
| Age Bracket | Women with Births | Births / 1,000 Women |
| 15 to 19 years | 0 (0.0%) | 0.0 |
| 20 to 34 years | 130 (63.4%) | 68.0 |
| 35 to 50 years | 75 (36.6%) | 34.0 |
| Total | 205 (100.0%) | 42.0 |
Fertility by Age by Marriage Status in McDonald County
82.9% of women with births (205) in McDonald County are married. The highest percentage of unmarried women with births falls into 20 to 34 years age bracket with 22.3% of them unmarried at the time of birth, while the lowest percentage of unmarried women with births belong to 35 to 50 years age bracket with 8.0% of them unmarried.
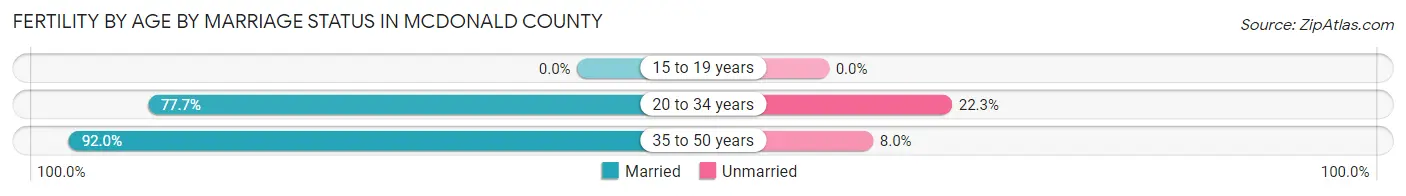
| Age Bracket | Married | Unmarried |
| 15 to 19 years | 0 (0.0%) | 0 (0.0%) |
| 20 to 34 years | 101 (77.7%) | 29 (22.3%) |
| 35 to 50 years | 69 (92.0%) | 6 (8.0%) |
| Total | 170 (82.9%) | 35 (17.1%) |
Fertility by Education in McDonald County
Average fertility rate in McDonald County is 42.0 births per 1,000 women. Women with the education attainment of graduate degree have the highest fertility rate of 71.0 births per 1,000 women, while women with the education attainment of high school diploma have the lowest fertility at 20.0 births per 1,000 women. Women with the education attainment of less than high school represent 34.6% of all women with births.
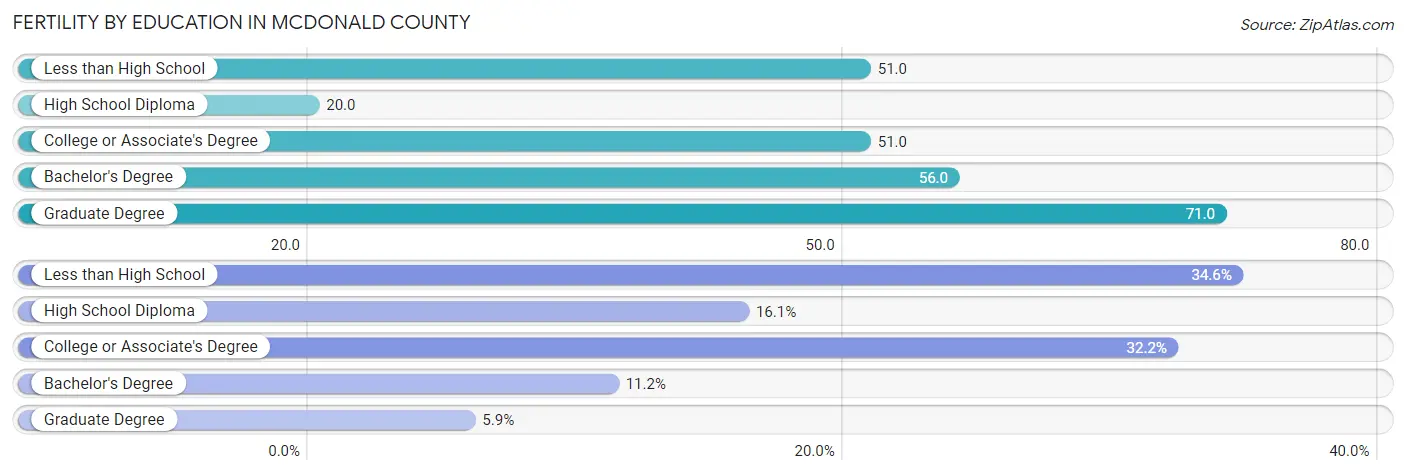
| Educational Attainment | Women with Births | Births / 1,000 Women |
| Less than High School | 71 (34.6%) | 51.0 |
| High School Diploma | 33 (16.1%) | 20.0 |
| College or Associate's Degree | 66 (32.2%) | 51.0 |
| Bachelor's Degree | 23 (11.2%) | 56.0 |
| Graduate Degree | 12 (5.9%) | 71.0 |
| Total | 205 (100.0%) | 42.0 |
Fertility by Education by Marriage Status in McDonald County
17.1% of women with births in McDonald County are unmarried. Women with the educational attainment of college or associate's degree are most likely to be married with 100.0% of them married at childbirth, while women with the educational attainment of high school diploma are least likely to be married with 42.4% of them unmarried at childbirth.
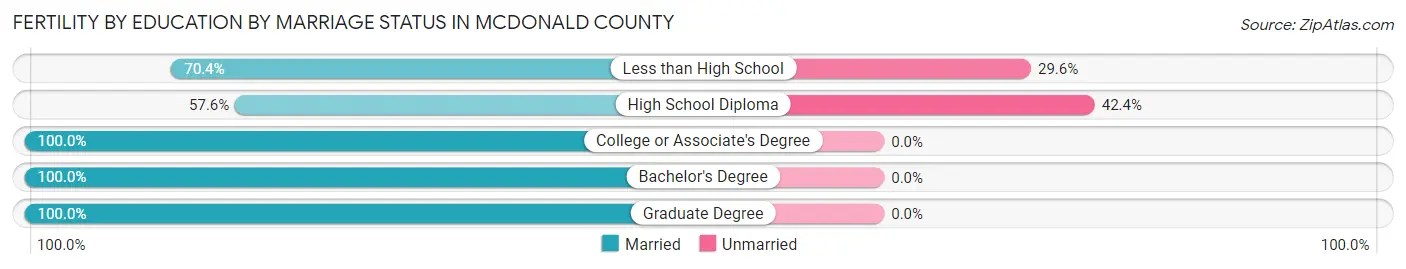
| Educational Attainment | Married | Unmarried |
| Less than High School | 50 (70.4%) | 21 (29.6%) |
| High School Diploma | 19 (57.6%) | 14 (42.4%) |
| College or Associate's Degree | 66 (100.0%) | 0 (0.0%) |
| Bachelor's Degree | 23 (100.0%) | 0 (0.0%) |
| Graduate Degree | 12 (100.0%) | 0 (0.0%) |
| Total | 170 (82.9%) | 35 (17.1%) |
Employment Characteristics in McDonald County
Employment by Class of Employer in McDonald County
Among the 9,528 employed individuals in McDonald County, private company employees (7,066 | 74.2%), self-employed (not incorporated) (860 | 9.0%), and not-for-profit organizations (783 | 8.2%) make up the most common classes of employment.
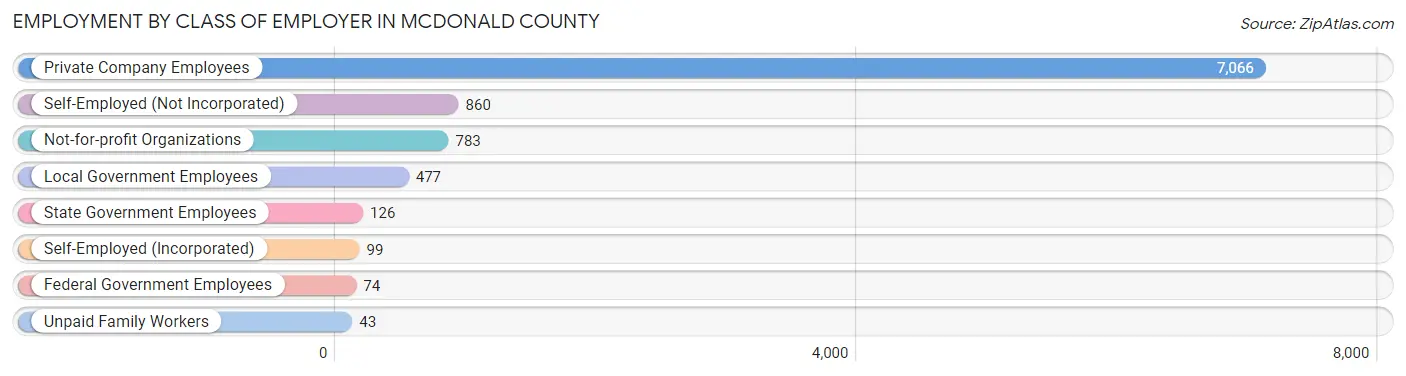
| Employer Class | # Employees | % Employees |
| Private Company Employees | 7,066 | 74.2% |
| Self-Employed (Incorporated) | 99 | 1.0% |
| Self-Employed (Not Incorporated) | 860 | 9.0% |
| Not-for-profit Organizations | 783 | 8.2% |
| Local Government Employees | 477 | 5.0% |
| State Government Employees | 126 | 1.3% |
| Federal Government Employees | 74 | 0.8% |
| Unpaid Family Workers | 43 | 0.4% |
| Total | 9,528 | 100.0% |
Employment Status by Age in McDonald County
According to the labor force statistics for McDonald County, out of the total population over 16 years of age (18,209), 56.3% or 10,252 individuals are in the labor force, with 5.9% or 605 of them unemployed. The age group with the highest labor force participation rate is 25 to 29 years, with 77.5% or 1,049 individuals in the labor force. Within the labor force, the 65 to 74 years age range has the highest percentage of unemployed individuals, with 15.6% or 92 of them being unemployed.
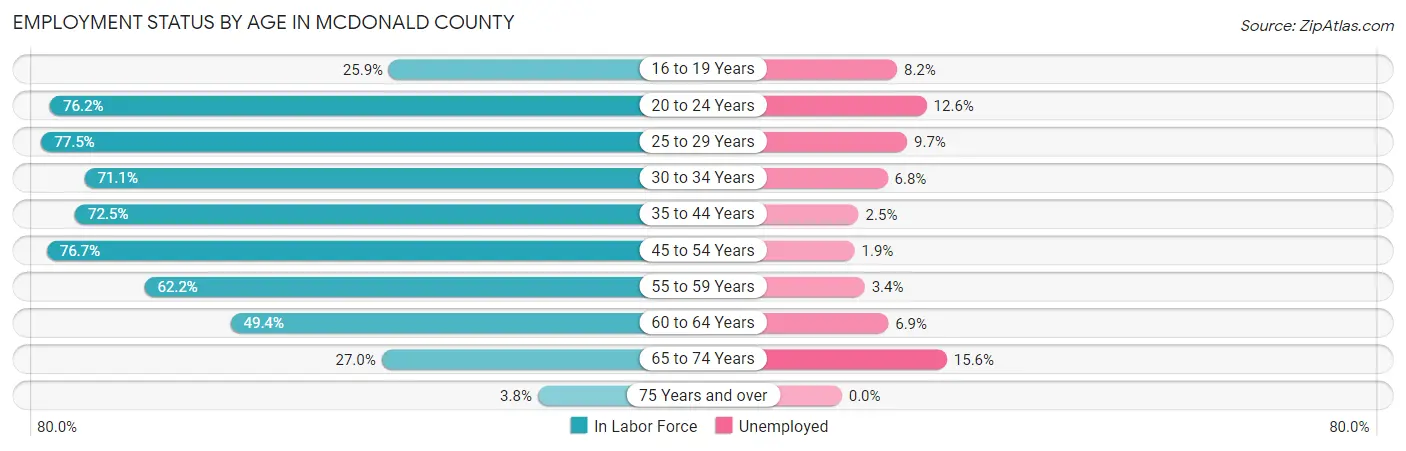
| Age Bracket | In Labor Force | Unemployed |
| 16 to 19 Years | 371 (25.9%) | 30 (8.2%) |
| 20 to 24 Years | 922 (76.2%) | 116 (12.6%) |
| 25 to 29 Years | 1,049 (77.5%) | 102 (9.7%) |
| 30 to 34 Years | 1,081 (71.1%) | 74 (6.8%) |
| 35 to 44 Years | 2,070 (72.5%) | 52 (2.5%) |
| 45 to 54 Years | 2,279 (76.7%) | 43 (1.9%) |
| 55 to 59 Years | 1,016 (62.2%) | 35 (3.4%) |
| 60 to 64 Years | 825 (49.4%) | 57 (6.9%) |
| 65 to 74 Years | 590 (27.0%) | 92 (15.6%) |
| 75 Years and over | 52 (3.8%) | 0 (0.0%) |
| Total | 10,252 (56.3%) | 605 (5.9%) |
Employment Status by Educational Attainment in McDonald County
According to labor force statistics for McDonald County, 69.3% of individuals (8,319) out of the total population between 25 and 64 years of age (12,004) are in the labor force, with 4.4% or 366 of them being unemployed. The group with the highest labor force participation rate are those with the educational attainment of bachelor's degree or higher, with 82.8% or 998 individuals in the labor force. Within the labor force, individuals with less than high school education have the highest percentage of unemployment, with 9.6% or 143 of them being unemployed.
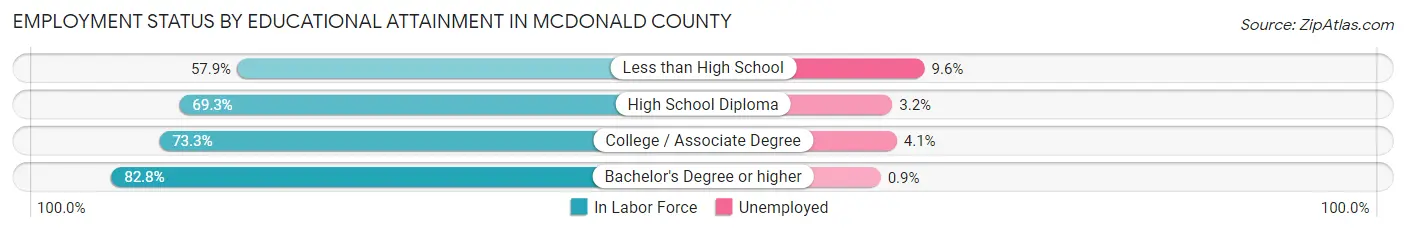
| Educational Attainment | In Labor Force | Unemployed |
| Less than High School | 1,489 (57.9%) | 247 (9.6%) |
| High School Diploma | 3,409 (69.3%) | 157 (3.2%) |
| College / Associate Degree | 2,425 (73.3%) | 136 (4.1%) |
| Bachelor's Degree or higher | 998 (82.8%) | 11 (0.9%) |
| Total | 8,319 (69.3%) | 528 (4.4%) |
Employment Occupations by Sex in McDonald County
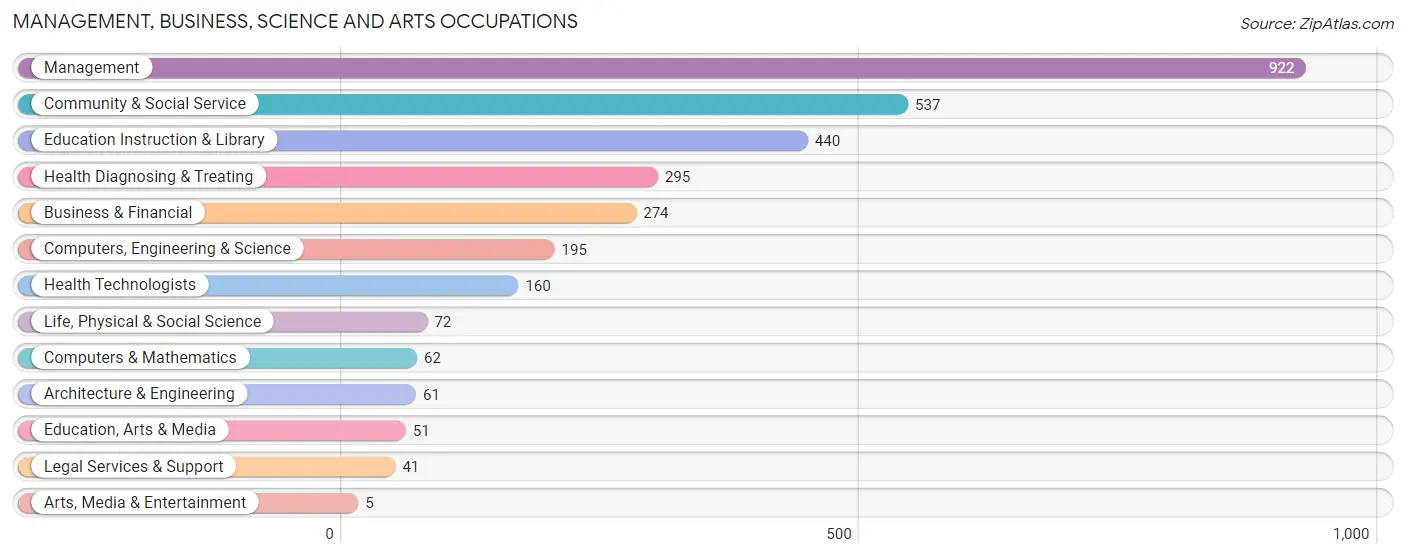
Management, Business, Science and Arts Occupations
The most common Management, Business, Science and Arts occupations in McDonald County are Management (922 | 9.6%), Community & Social Service (537 | 5.6%), Education Instruction & Library (440 | 4.6%), Health Diagnosing & Treating (295 | 3.1%), and Business & Financial (274 | 2.9%).
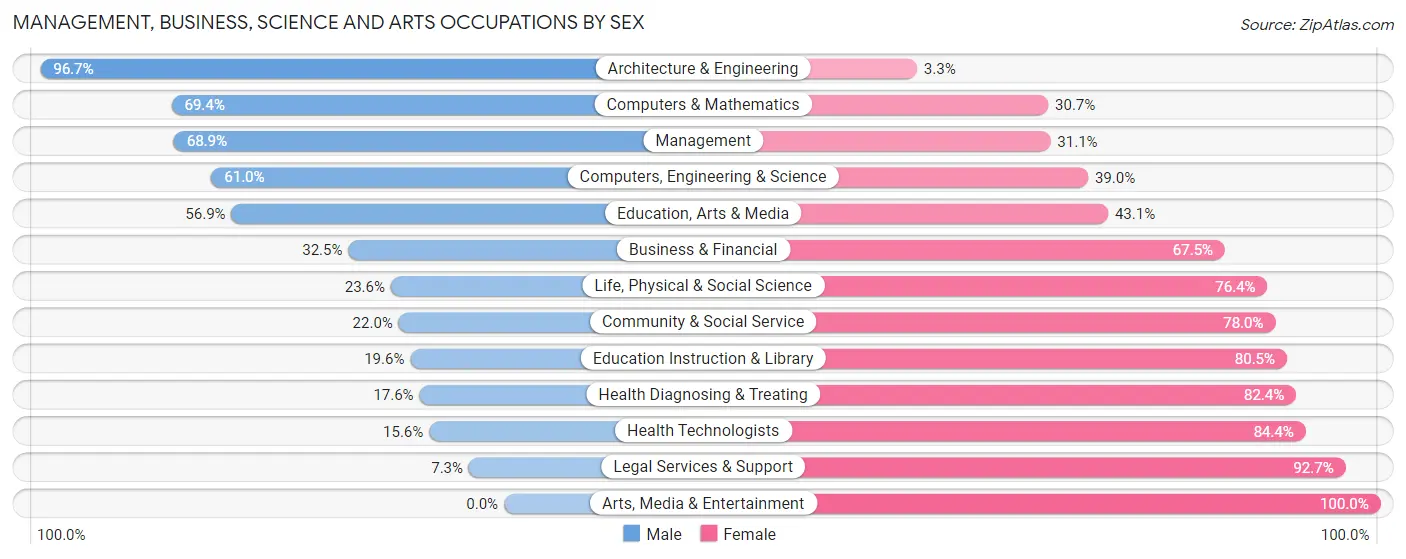
Management, Business, Science and Arts Occupations by Sex
Within the Management, Business, Science and Arts occupations in McDonald County, the most male-oriented occupations are Architecture & Engineering (96.7%), Computers & Mathematics (69.4%), and Management (68.9%), while the most female-oriented occupations are Arts, Media & Entertainment (100.0%), Legal Services & Support (92.7%), and Health Technologists (84.4%).
| Occupation | Male | Female |
| Management | 635 (68.9%) | 287 (31.1%) |
| Business & Financial | 89 (32.5%) | 185 (67.5%) |
| Computers, Engineering & Science | 119 (61.0%) | 76 (39.0%) |
| Computers & Mathematics | 43 (69.4%) | 19 (30.6%) |
| Architecture & Engineering | 59 (96.7%) | 2 (3.3%) |
| Life, Physical & Social Science | 17 (23.6%) | 55 (76.4%) |
| Community & Social Service | 118 (22.0%) | 419 (78.0%) |
| Education, Arts & Media | 29 (56.9%) | 22 (43.1%) |
| Legal Services & Support | 3 (7.3%) | 38 (92.7%) |
| Education Instruction & Library | 86 (19.6%) | 354 (80.4%) |
| Arts, Media & Entertainment | 0 (0.0%) | 5 (100.0%) |
| Health Diagnosing & Treating | 52 (17.6%) | 243 (82.4%) |
| Health Technologists | 25 (15.6%) | 135 (84.4%) |
| Total (Category) | 1,013 (45.6%) | 1,210 (54.4%) |
| Total (Overall) | 5,359 (55.7%) | 4,269 (44.3%) |
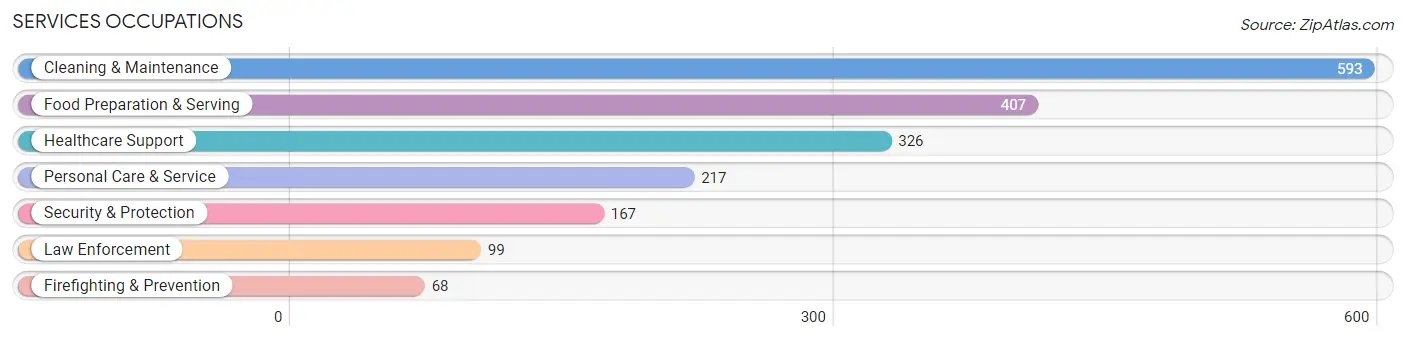
Services Occupations
The most common Services occupations in McDonald County are Cleaning & Maintenance (593 | 6.2%), Food Preparation & Serving (407 | 4.2%), Healthcare Support (326 | 3.4%), Personal Care & Service (217 | 2.2%), and Security & Protection (167 | 1.7%).
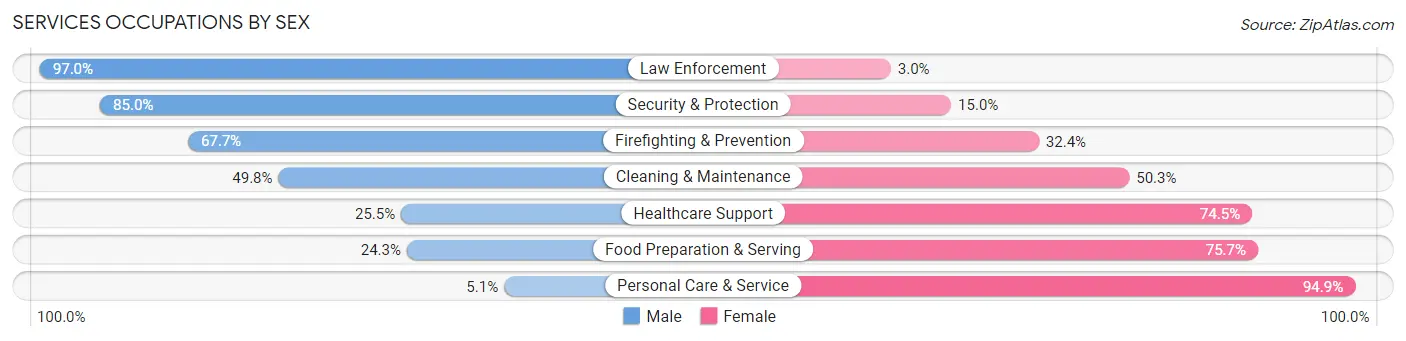
Services Occupations by Sex
Within the Services occupations in McDonald County, the most male-oriented occupations are Law Enforcement (97.0%), Security & Protection (85.0%), and Firefighting & Prevention (67.6%), while the most female-oriented occupations are Personal Care & Service (94.9%), Food Preparation & Serving (75.7%), and Healthcare Support (74.5%).
| Occupation | Male | Female |
| Healthcare Support | 83 (25.5%) | 243 (74.5%) |
| Security & Protection | 142 (85.0%) | 25 (15.0%) |
| Firefighting & Prevention | 46 (67.6%) | 22 (32.4%) |
| Law Enforcement | 96 (97.0%) | 3 (3.0%) |
| Food Preparation & Serving | 99 (24.3%) | 308 (75.7%) |
| Cleaning & Maintenance | 295 (49.7%) | 298 (50.2%) |
| Personal Care & Service | 11 (5.1%) | 206 (94.9%) |
| Total (Category) | 630 (36.8%) | 1,080 (63.2%) |
| Total (Overall) | 5,359 (55.7%) | 4,269 (44.3%) |
Sales and Office Occupations
The most common Sales and Office occupations in McDonald County are Sales & Related (1,015 | 10.5%), and Office & Administration (785 | 8.2%).

Sales and Office Occupations by Sex
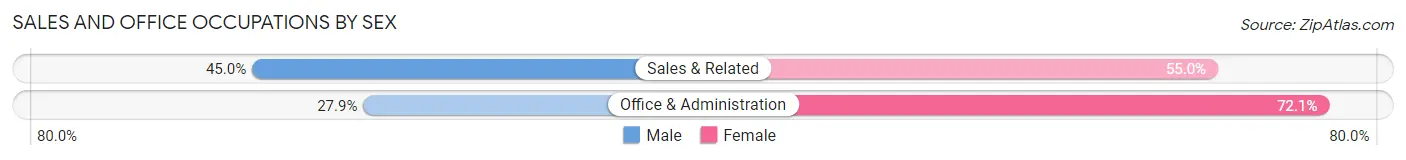
| Occupation | Male | Female |
| Sales & Related | 457 (45.0%) | 558 (55.0%) |
| Office & Administration | 219 (27.9%) | 566 (72.1%) |
| Total (Category) | 676 (37.6%) | 1,124 (62.4%) |
| Total (Overall) | 5,359 (55.7%) | 4,269 (44.3%) |
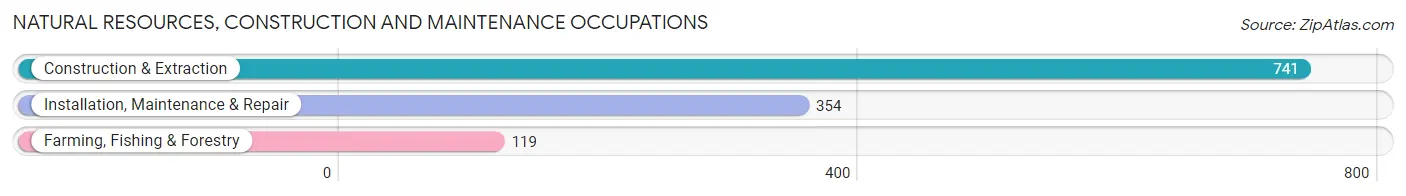
Natural Resources, Construction and Maintenance Occupations
The most common Natural Resources, Construction and Maintenance occupations in McDonald County are Construction & Extraction (741 | 7.7%), Installation, Maintenance & Repair (354 | 3.7%), and Farming, Fishing & Forestry (119 | 1.2%).
Natural Resources, Construction and Maintenance Occupations by Sex
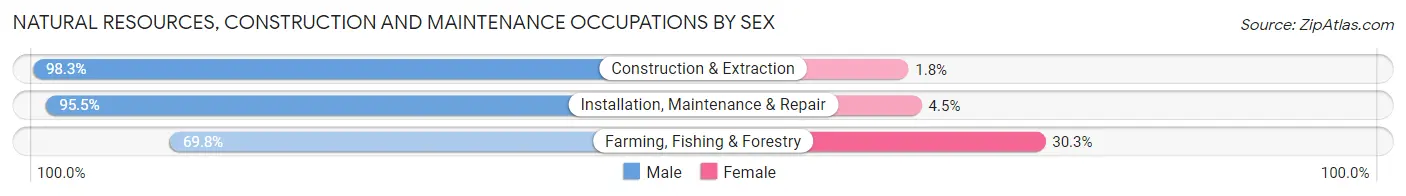
| Occupation | Male | Female |
| Farming, Fishing & Forestry | 83 (69.8%) | 36 (30.2%) |
| Construction & Extraction | 728 (98.3%) | 13 (1.8%) |
| Installation, Maintenance & Repair | 338 (95.5%) | 16 (4.5%) |
| Total (Category) | 1,149 (94.7%) | 65 (5.3%) |
| Total (Overall) | 5,359 (55.7%) | 4,269 (44.3%) |
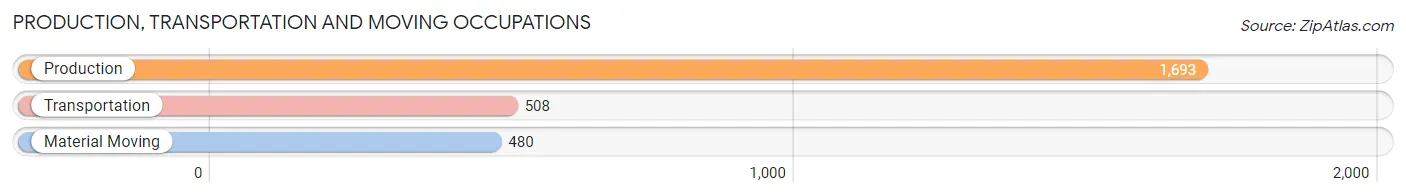
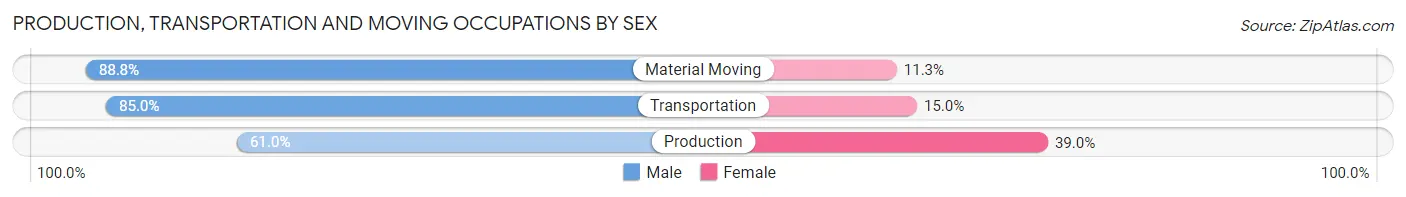
Production, Transportation and Moving Occupations
The most common Production, Transportation and Moving occupations in McDonald County are Production (1,693 | 17.6%), Transportation (508 | 5.3%), and Material Moving (480 | 5.0%).
Production, Transportation and Moving Occupations by Sex
| Occupation | Male | Female |
| Production | 1,033 (61.0%) | 660 (39.0%) |
| Transportation | 432 (85.0%) | 76 (15.0%) |
| Material Moving | 426 (88.7%) | 54 (11.3%) |
| Total (Category) | 1,891 (70.5%) | 790 (29.5%) |
| Total (Overall) | 5,359 (55.7%) | 4,269 (44.3%) |
Employment Industries by Sex in McDonald County
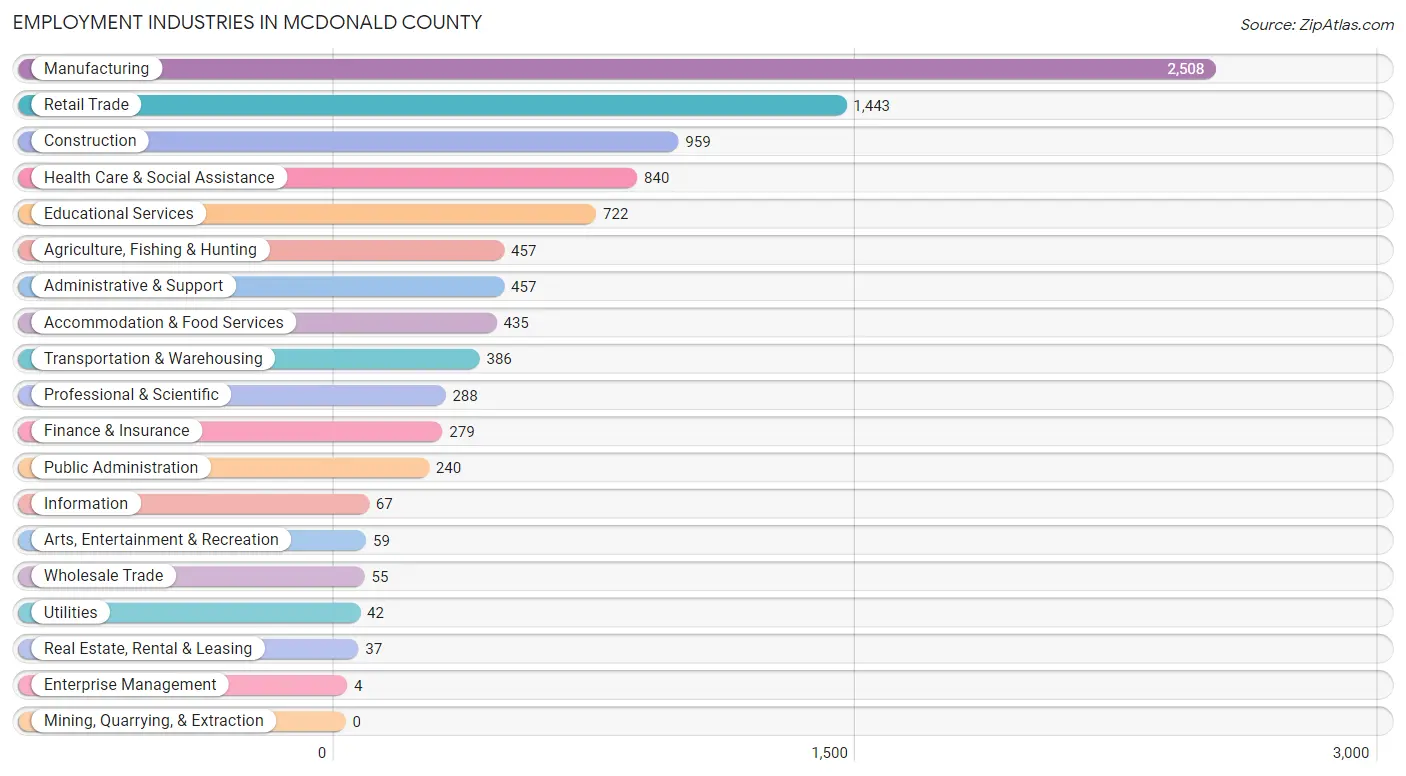
Employment Industries in McDonald County
The major employment industries in McDonald County include Manufacturing (2,508 | 26.1%), Retail Trade (1,443 | 15.0%), Construction (959 | 10.0%), Health Care & Social Assistance (840 | 8.7%), and Educational Services (722 | 7.5%).
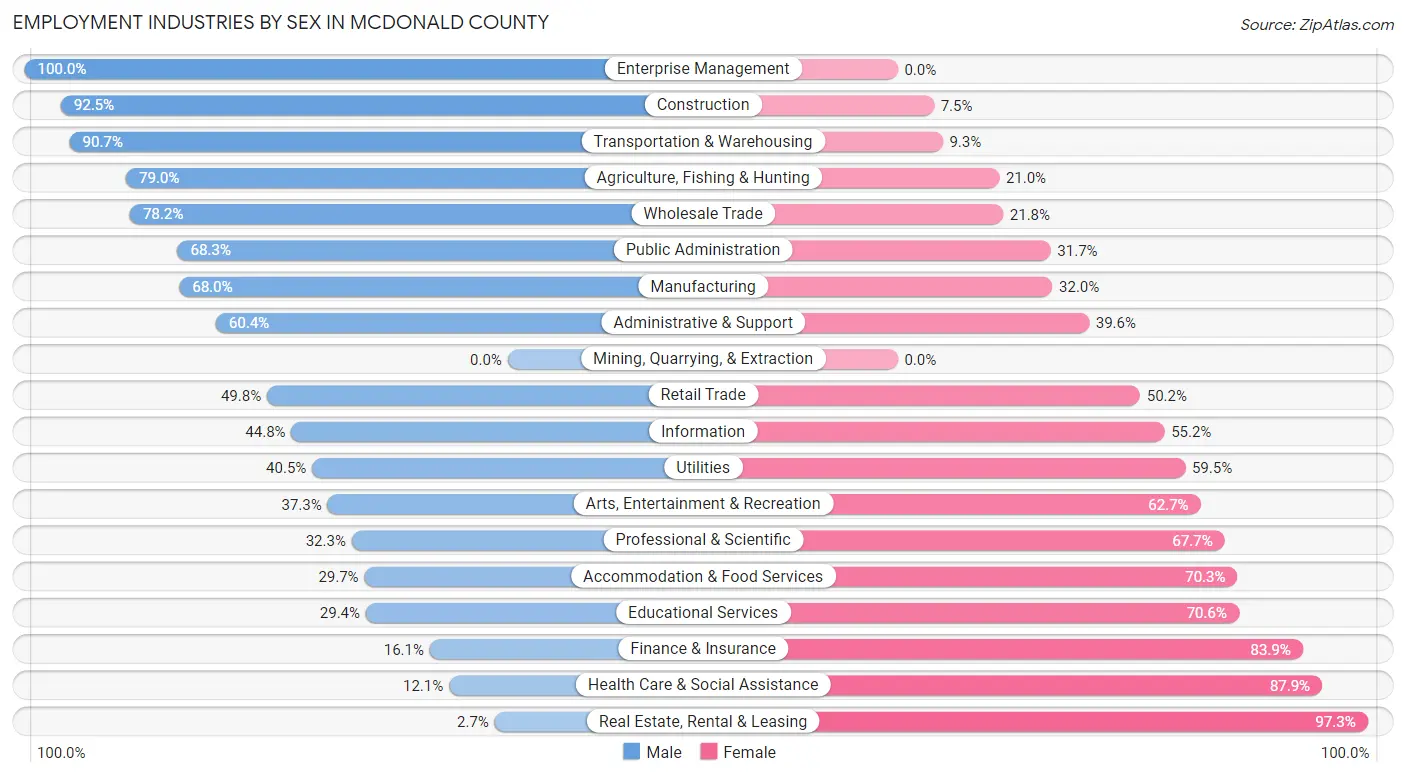
Employment Industries by Sex in McDonald County
The McDonald County industries that see more men than women are Enterprise Management (100.0%), Construction (92.5%), and Transportation & Warehousing (90.7%), whereas the industries that tend to have a higher number of women are Real Estate, Rental & Leasing (97.3%), Health Care & Social Assistance (87.9%), and Finance & Insurance (83.9%).
| Industry | Male | Female |
| Agriculture, Fishing & Hunting | 361 (79.0%) | 96 (21.0%) |
| Mining, Quarrying, & Extraction | 0 (0.0%) | 0 (0.0%) |
| Construction | 887 (92.5%) | 72 (7.5%) |
| Manufacturing | 1,705 (68.0%) | 803 (32.0%) |
| Wholesale Trade | 43 (78.2%) | 12 (21.8%) |
| Retail Trade | 719 (49.8%) | 724 (50.2%) |
| Transportation & Warehousing | 350 (90.7%) | 36 (9.3%) |
| Utilities | 17 (40.5%) | 25 (59.5%) |
| Information | 30 (44.8%) | 37 (55.2%) |
| Finance & Insurance | 45 (16.1%) | 234 (83.9%) |
| Real Estate, Rental & Leasing | 1 (2.7%) | 36 (97.3%) |
| Professional & Scientific | 93 (32.3%) | 195 (67.7%) |
| Enterprise Management | 4 (100.0%) | 0 (0.0%) |
| Administrative & Support | 276 (60.4%) | 181 (39.6%) |
| Educational Services | 212 (29.4%) | 510 (70.6%) |
| Health Care & Social Assistance | 102 (12.1%) | 738 (87.9%) |
| Arts, Entertainment & Recreation | 22 (37.3%) | 37 (62.7%) |
| Accommodation & Food Services | 129 (29.7%) | 306 (70.3%) |
| Public Administration | 164 (68.3%) | 76 (31.7%) |
| Total | 5,359 (55.7%) | 4,269 (44.3%) |
Education in McDonald County
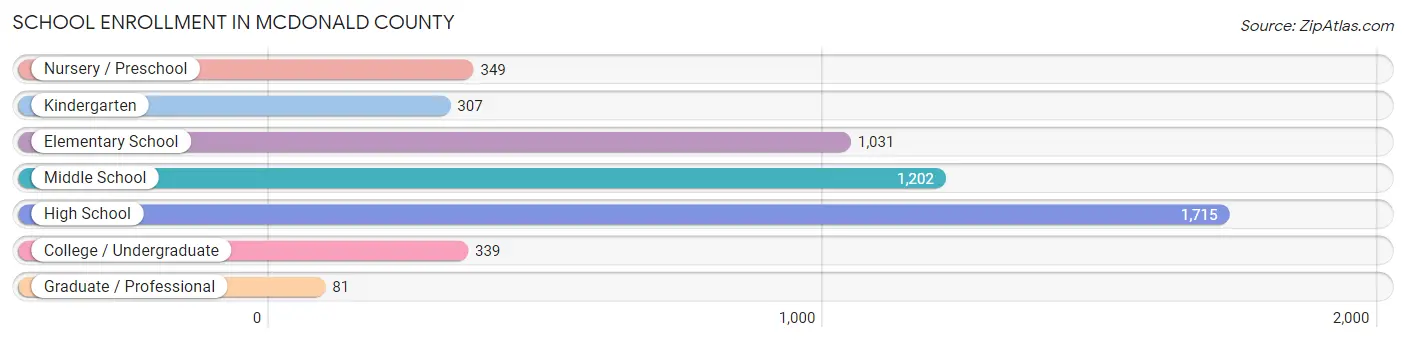
School Enrollment in McDonald County
The most common levels of schooling among the 5,024 students in McDonald County are high school (1,715 | 34.1%), middle school (1,202 | 23.9%), and elementary school (1,031 | 20.5%).
| School Level | # Students | % Students |
| Nursery / Preschool | 349 | 7.0% |
| Kindergarten | 307 | 6.1% |
| Elementary School | 1,031 | 20.5% |
| Middle School | 1,202 | 23.9% |
| High School | 1,715 | 34.1% |
| College / Undergraduate | 339 | 6.8% |
| Graduate / Professional | 81 | 1.6% |
| Total | 5,024 | 100.0% |
School Enrollment by Age by Funding Source in McDonald County
Out of a total of 5,024 students who are enrolled in schools in McDonald County, 281 (5.6%) attend a private institution, while the remaining 4,743 (94.4%) are enrolled in public schools. The age group of 35 years and over has the highest likelihood of being enrolled in private schools, with 49 (36.3% in the age bracket) enrolled. Conversely, the age group of 25 to 34 year olds has the lowest likelihood of being enrolled in a private school, with 121 (100.0% in the age bracket) attending a public institution.
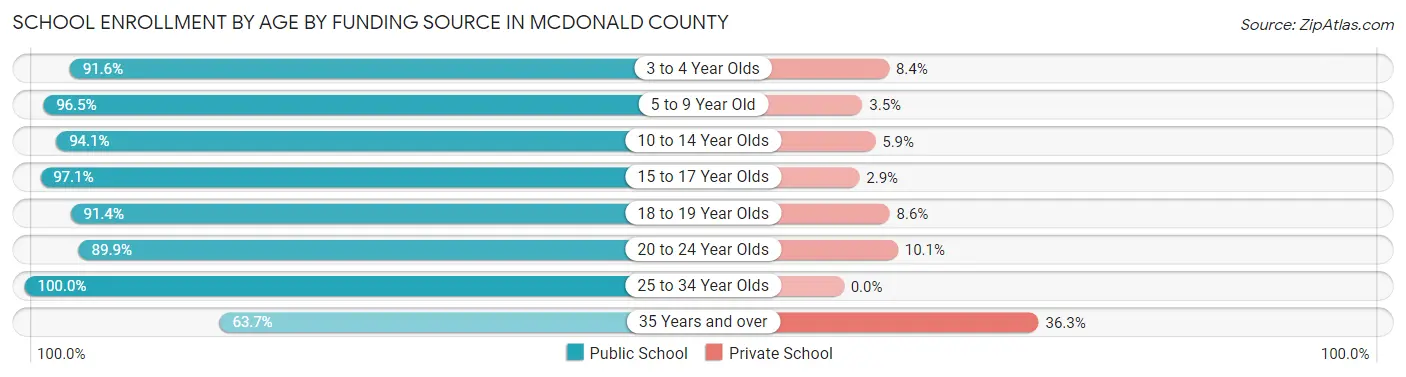
| Age Bracket | Public School | Private School |
| 3 to 4 Year Olds | 239 (91.6%) | 22 (8.4%) |
| 5 to 9 Year Old | 1,304 (96.5%) | 47 (3.5%) |
| 10 to 14 Year Olds | 1,551 (94.1%) | 97 (5.9%) |
| 15 to 17 Year Olds | 1,099 (97.1%) | 33 (2.9%) |
| 18 to 19 Year Olds | 235 (91.4%) | 22 (8.6%) |
| 20 to 24 Year Olds | 107 (89.9%) | 12 (10.1%) |
| 25 to 34 Year Olds | 121 (100.0%) | 0 (0.0%) |
| 35 Years and over | 86 (63.7%) | 49 (36.3%) |
| Total | 4,743 (94.4%) | 281 (5.6%) |
Educational Attainment by Field of Study in McDonald County
Education (488 | 24.8%), business (361 | 18.4%), science & technology (306 | 15.6%), bio, nature & agricultural (225 | 11.4%), and liberal arts & history (110 | 5.6%) are the most common fields of study among 1,966 individuals in McDonald County who have obtained a bachelor's degree or higher.
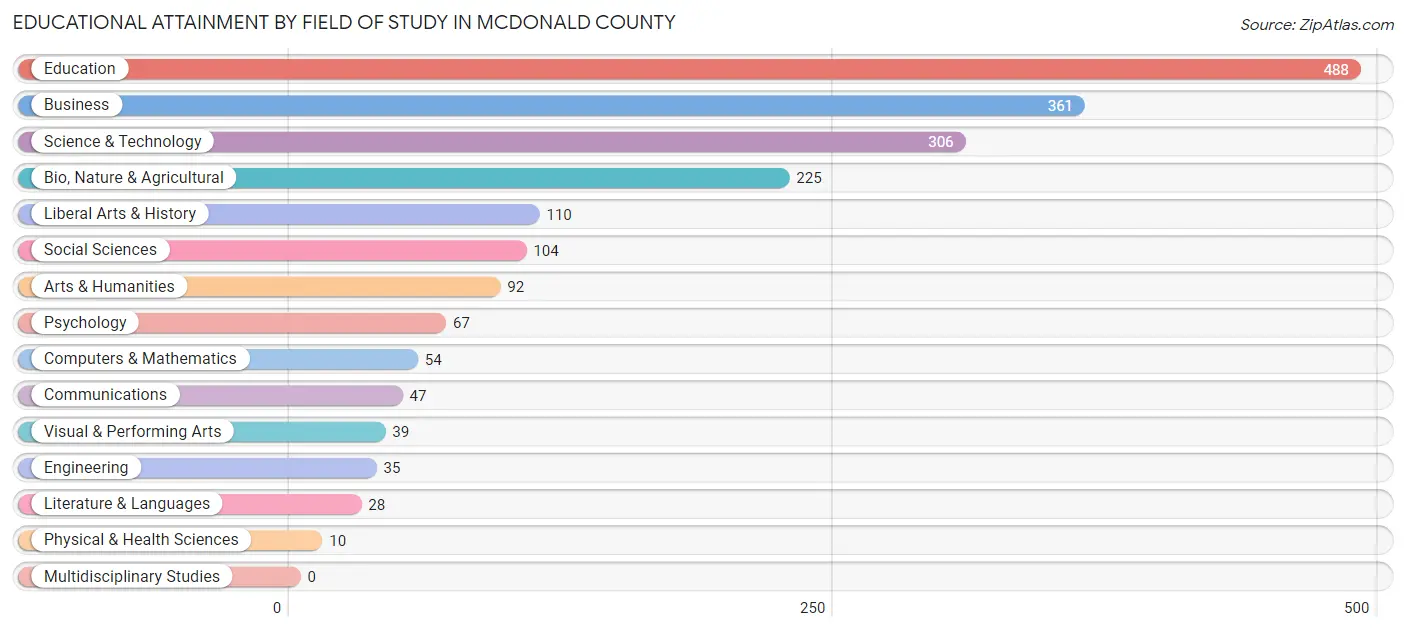
| Field of Study | # Graduates | % Graduates |
| Computers & Mathematics | 54 | 2.8% |
| Bio, Nature & Agricultural | 225 | 11.4% |
| Physical & Health Sciences | 10 | 0.5% |
| Psychology | 67 | 3.4% |
| Social Sciences | 104 | 5.3% |
| Engineering | 35 | 1.8% |
| Multidisciplinary Studies | 0 | 0.0% |
| Science & Technology | 306 | 15.6% |
| Business | 361 | 18.4% |
| Education | 488 | 24.8% |
| Literature & Languages | 28 | 1.4% |
| Liberal Arts & History | 110 | 5.6% |
| Visual & Performing Arts | 39 | 2.0% |
| Communications | 47 | 2.4% |
| Arts & Humanities | 92 | 4.7% |
| Total | 1,966 | 100.0% |
Transportation & Commute in McDonald County
Vehicle Availability by Sex in McDonald County
The most prevalent vehicle ownership categories in McDonald County are males with 2 vehicles (1,667, accounting for 31.3%) and females with 2 vehicles (1,301, making up 39.6%).
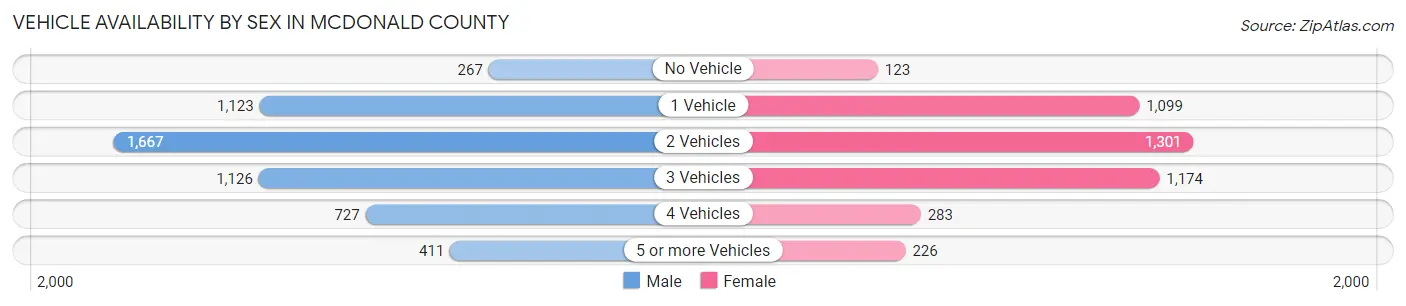
| Vehicles Available | Male | Female |
| No Vehicle | 267 (5.0%) | 123 (2.9%) |
| 1 Vehicle | 1,123 (21.1%) | 1,099 (26.1%) |
| 2 Vehicles | 1,667 (31.3%) | 1,301 (30.9%) |
| 3 Vehicles | 1,126 (21.2%) | 1,174 (27.9%) |
| 4 Vehicles | 727 (13.7%) | 283 (6.7%) |
| 5 or more Vehicles | 411 (7.7%) | 226 (5.4%) |
| Total | 5,321 (100.0%) | 4,206 (100.0%) |
Commute Time in McDonald County
The most frequently occuring commute durations in McDonald County are 20 to 24 minutes (1,469 commuters, 16.8%), 30 to 34 minutes (1,254 commuters, 14.3%), and 5 to 9 minutes (1,088 commuters, 12.4%).
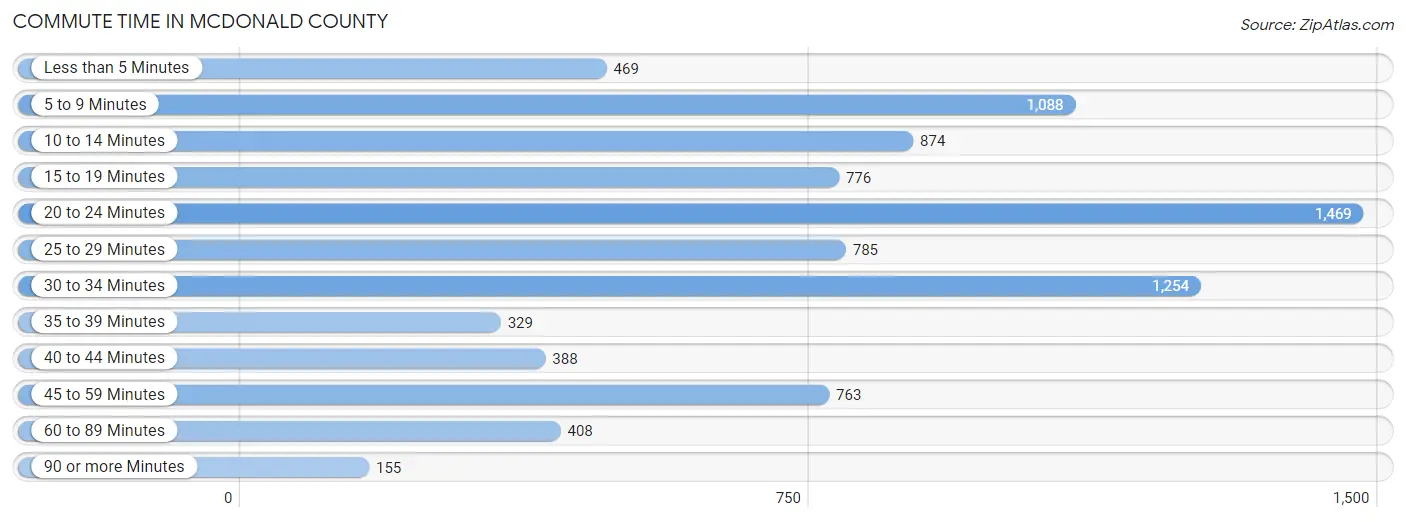
| Commute Time | # Commuters | % Commuters |
| Less than 5 Minutes | 469 | 5.4% |
| 5 to 9 Minutes | 1,088 | 12.4% |
| 10 to 14 Minutes | 874 | 10.0% |
| 15 to 19 Minutes | 776 | 8.9% |
| 20 to 24 Minutes | 1,469 | 16.8% |
| 25 to 29 Minutes | 785 | 9.0% |
| 30 to 34 Minutes | 1,254 | 14.3% |
| 35 to 39 Minutes | 329 | 3.8% |
| 40 to 44 Minutes | 388 | 4.4% |
| 45 to 59 Minutes | 763 | 8.7% |
| 60 to 89 Minutes | 408 | 4.7% |
| 90 or more Minutes | 155 | 1.8% |
Commute Time by Sex in McDonald County
The most common commute times in McDonald County are 20 to 24 minutes (795 commuters, 15.9%) for males and 20 to 24 minutes (674 commuters, 18.0%) for females.
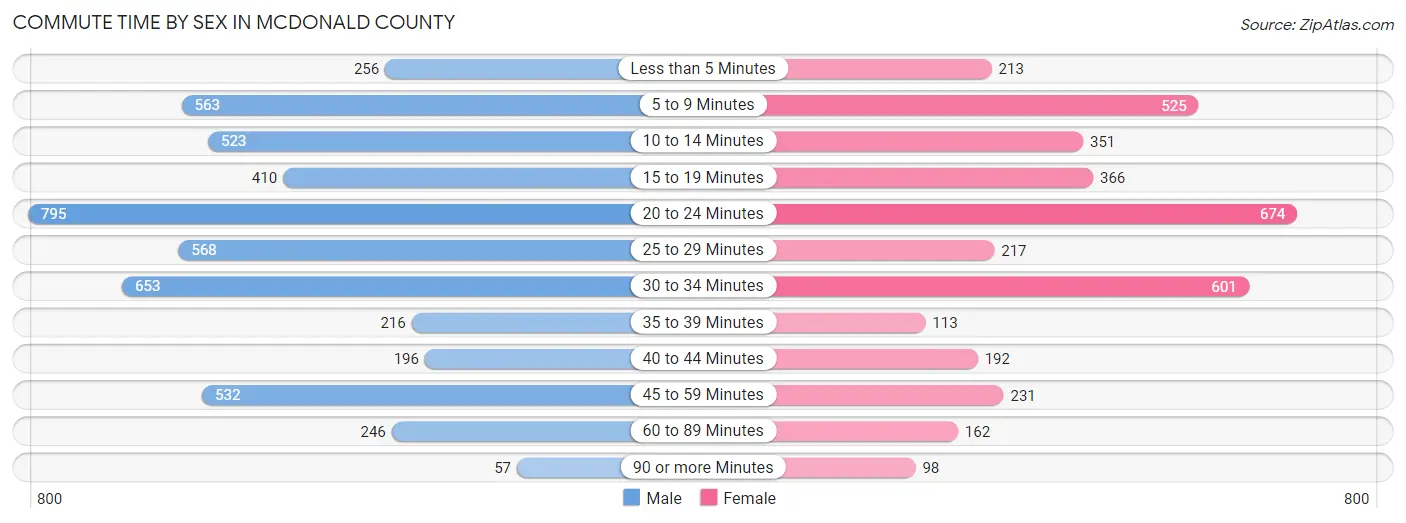
| Commute Time | Male | Female |
| Less than 5 Minutes | 256 (5.1%) | 213 (5.7%) |
| 5 to 9 Minutes | 563 (11.2%) | 525 (14.0%) |
| 10 to 14 Minutes | 523 (10.4%) | 351 (9.4%) |
| 15 to 19 Minutes | 410 (8.2%) | 366 (9.8%) |
| 20 to 24 Minutes | 795 (15.9%) | 674 (18.0%) |
| 25 to 29 Minutes | 568 (11.3%) | 217 (5.8%) |
| 30 to 34 Minutes | 653 (13.0%) | 601 (16.1%) |
| 35 to 39 Minutes | 216 (4.3%) | 113 (3.0%) |
| 40 to 44 Minutes | 196 (3.9%) | 192 (5.1%) |
| 45 to 59 Minutes | 532 (10.6%) | 231 (6.2%) |
| 60 to 89 Minutes | 246 (4.9%) | 162 (4.3%) |
| 90 or more Minutes | 57 (1.1%) | 98 (2.6%) |
Time of Departure to Work by Sex in McDonald County
The most frequent times of departure to work in McDonald County are 7:00 AM to 7:29 AM (963, 19.2%) for males and 7:00 AM to 7:29 AM (816, 21.8%) for females.

| Time of Departure | Male | Female |
| 12:00 AM to 4:59 AM | 559 (11.2%) | 222 (5.9%) |
| 5:00 AM to 5:29 AM | 196 (3.9%) | 170 (4.5%) |
| 5:30 AM to 5:59 AM | 218 (4.3%) | 152 (4.1%) |
| 6:00 AM to 6:29 AM | 729 (14.5%) | 339 (9.1%) |
| 6:30 AM to 6:59 AM | 536 (10.7%) | 371 (9.9%) |
| 7:00 AM to 7:29 AM | 963 (19.2%) | 816 (21.8%) |
| 7:30 AM to 7:59 AM | 236 (4.7%) | 384 (10.3%) |
| 8:00 AM to 8:29 AM | 390 (7.8%) | 668 (17.8%) |
| 8:30 AM to 8:59 AM | 45 (0.9%) | 46 (1.2%) |
| 9:00 AM to 9:59 AM | 90 (1.8%) | 76 (2.0%) |
| 10:00 AM to 10:59 AM | 65 (1.3%) | 68 (1.8%) |
| 11:00 AM to 11:59 AM | 54 (1.1%) | 27 (0.7%) |
| 12:00 PM to 3:59 PM | 556 (11.1%) | 236 (6.3%) |
| 4:00 PM to 11:59 PM | 378 (7.5%) | 168 (4.5%) |
| Total | 5,015 (100.0%) | 3,743 (100.0%) |
Housing Occupancy in McDonald County
Occupancy by Ownership in McDonald County
Of the total 8,399 dwellings in McDonald County, owner-occupied units account for 5,598 (66.6%), while renter-occupied units make up 2,801 (33.4%).
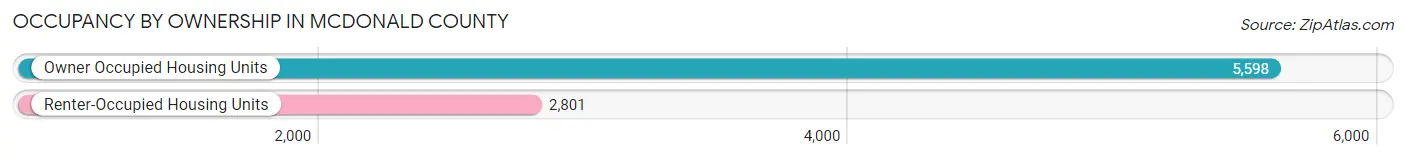
| Occupancy | # Housing Units | % Housing Units |
| Owner Occupied Housing Units | 5,598 | 66.6% |
| Renter-Occupied Housing Units | 2,801 | 33.4% |
| Total Occupied Housing Units | 8,399 | 100.0% |
Occupancy by Household Size in McDonald County
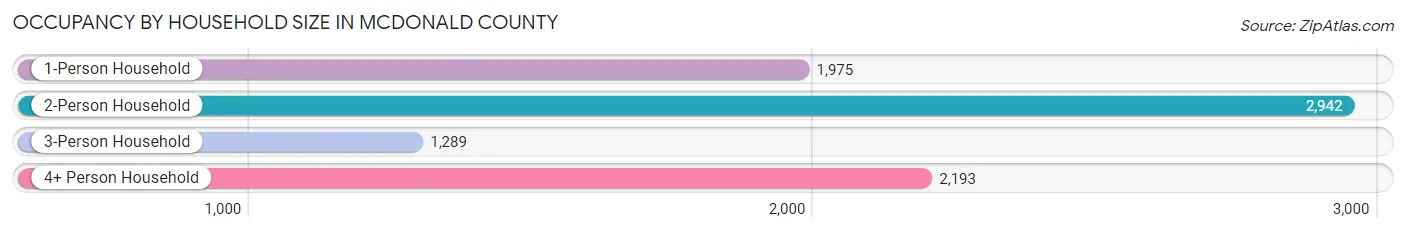
| Household Size | # Housing Units | % Housing Units |
| 1-Person Household | 1,975 | 23.5% |
| 2-Person Household | 2,942 | 35.0% |
| 3-Person Household | 1,289 | 15.3% |
| 4+ Person Household | 2,193 | 26.1% |
| Total Housing Units | 8,399 | 100.0% |
Occupancy by Ownership by Household Size in McDonald County
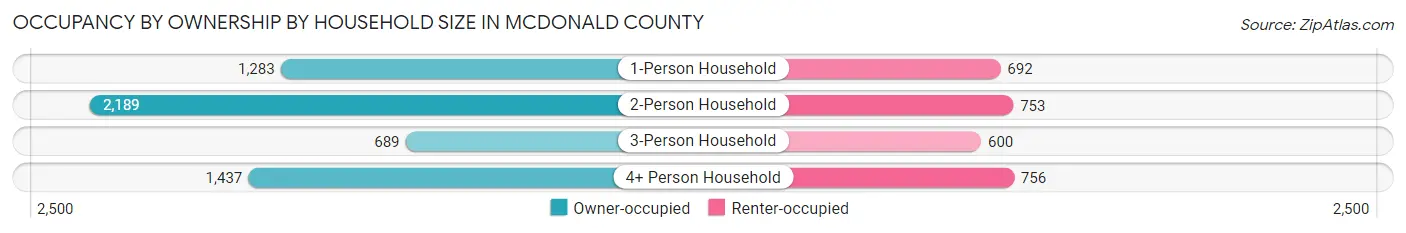
| Household Size | Owner-occupied | Renter-occupied |
| 1-Person Household | 1,283 (65.0%) | 692 (35.0%) |
| 2-Person Household | 2,189 (74.4%) | 753 (25.6%) |
| 3-Person Household | 689 (53.4%) | 600 (46.6%) |
| 4+ Person Household | 1,437 (65.5%) | 756 (34.5%) |
| Total Housing Units | 5,598 (66.6%) | 2,801 (33.4%) |
Occupancy by Educational Attainment in McDonald County
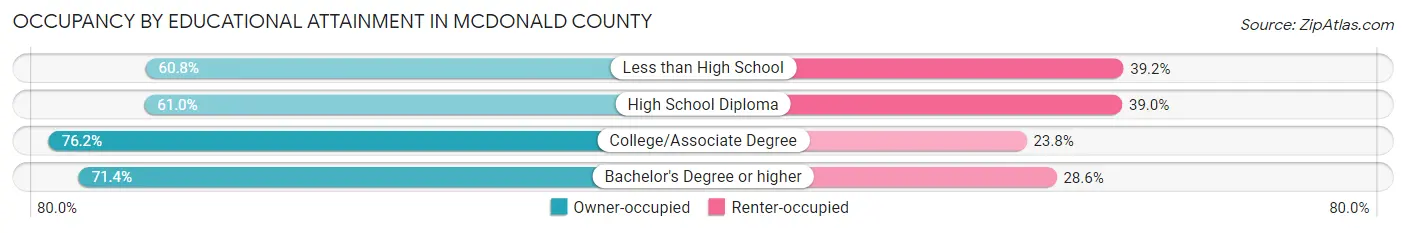
| Household Size | Owner-occupied | Renter-occupied |
| Less than High School | 943 (60.8%) | 608 (39.2%) |
| High School Diploma | 2,055 (61.0%) | 1,314 (39.0%) |
| College/Associate Degree | 1,856 (76.2%) | 581 (23.8%) |
| Bachelor's Degree or higher | 744 (71.4%) | 298 (28.6%) |
Occupancy by Age of Householder in McDonald County
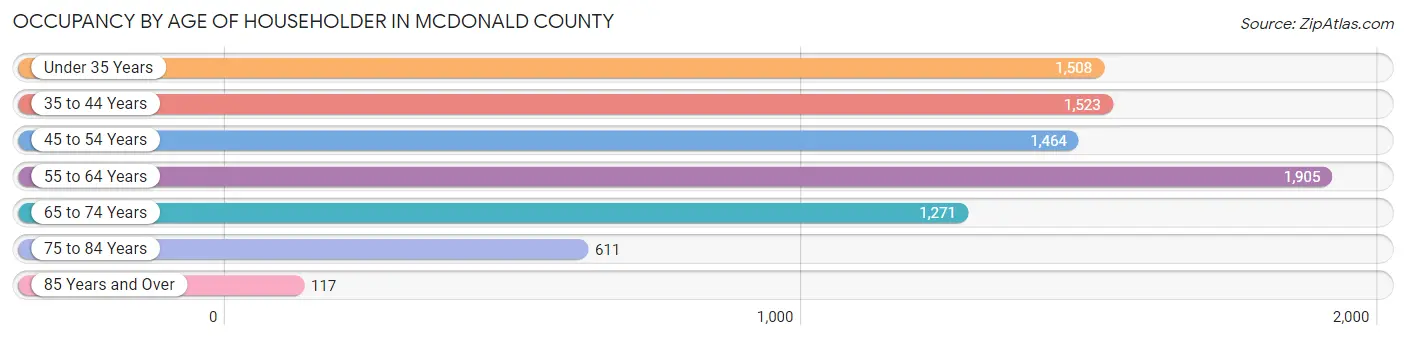
| Age Bracket | # Households | % Households |
| Under 35 Years | 1,508 | 17.9% |
| 35 to 44 Years | 1,523 | 18.1% |
| 45 to 54 Years | 1,464 | 17.4% |
| 55 to 64 Years | 1,905 | 22.7% |
| 65 to 74 Years | 1,271 | 15.1% |
| 75 to 84 Years | 611 | 7.3% |
| 85 Years and Over | 117 | 1.4% |
| Total | 8,399 | 100.0% |
Housing Finances in McDonald County
Median Income by Occupancy in McDonald County
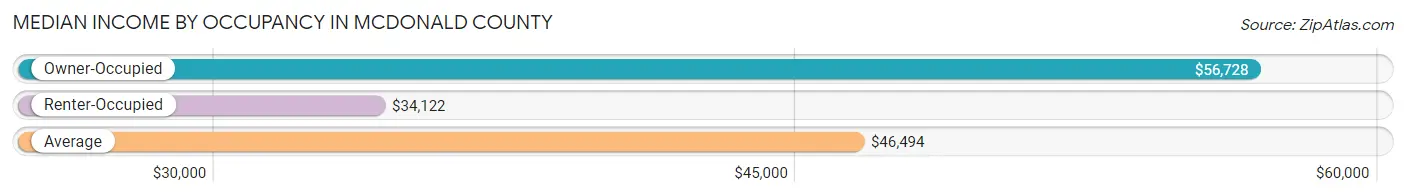
| Occupancy Type | # Households | Median Income |
| Owner-Occupied | 5,598 (66.6%) | $56,728 |
| Renter-Occupied | 2,801 (33.4%) | $34,122 |
| Average | 8,399 (100.0%) | $46,494 |
Occupancy by Householder Income Bracket in McDonald County
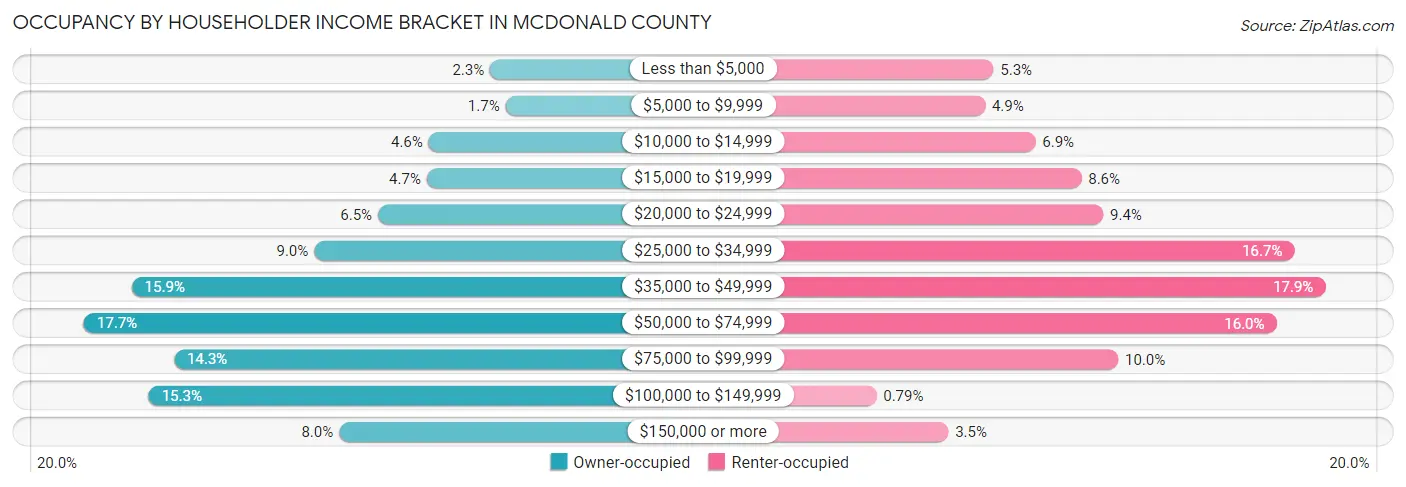
| Income Bracket | Owner-occupied | Renter-occupied |
| Less than $5,000 | 127 (2.3%) | 147 (5.2%) |
| $5,000 to $9,999 | 94 (1.7%) | 138 (4.9%) |
| $10,000 to $14,999 | 258 (4.6%) | 192 (6.9%) |
| $15,000 to $19,999 | 262 (4.7%) | 241 (8.6%) |
| $20,000 to $24,999 | 366 (6.5%) | 264 (9.4%) |
| $25,000 to $34,999 | 502 (9.0%) | 468 (16.7%) |
| $35,000 to $49,999 | 891 (15.9%) | 501 (17.9%) |
| $50,000 to $74,999 | 993 (17.7%) | 449 (16.0%) |
| $75,000 to $99,999 | 801 (14.3%) | 280 (10.0%) |
| $100,000 to $149,999 | 855 (15.3%) | 22 (0.8%) |
| $150,000 or more | 449 (8.0%) | 99 (3.5%) |
| Total | 5,598 (100.0%) | 2,801 (100.0%) |
Monthly Housing Cost Tiers in McDonald County
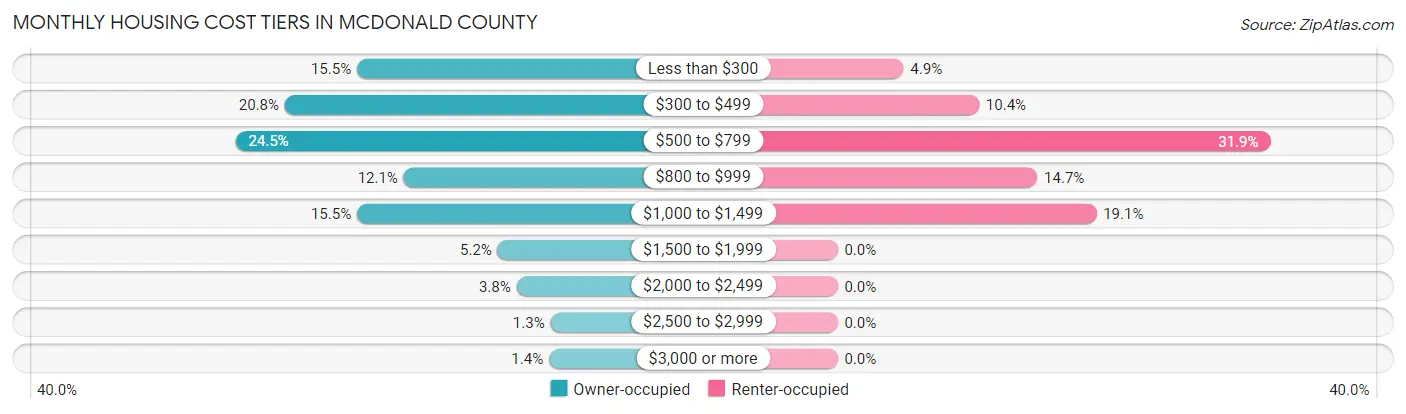
| Monthly Cost | Owner-occupied | Renter-occupied |
| Less than $300 | 869 (15.5%) | 136 (4.9%) |
| $300 to $499 | 1,166 (20.8%) | 292 (10.4%) |
| $500 to $799 | 1,370 (24.5%) | 893 (31.9%) |
| $800 to $999 | 676 (12.1%) | 412 (14.7%) |
| $1,000 to $1,499 | 869 (15.5%) | 534 (19.1%) |
| $1,500 to $1,999 | 289 (5.2%) | 0 (0.0%) |
| $2,000 to $2,499 | 211 (3.8%) | 0 (0.0%) |
| $2,500 to $2,999 | 71 (1.3%) | 0 (0.0%) |
| $3,000 or more | 77 (1.4%) | 0 (0.0%) |
| Total | 5,598 (100.0%) | 2,801 (100.0%) |
Physical Housing Characteristics in McDonald County
Housing Structures in McDonald County
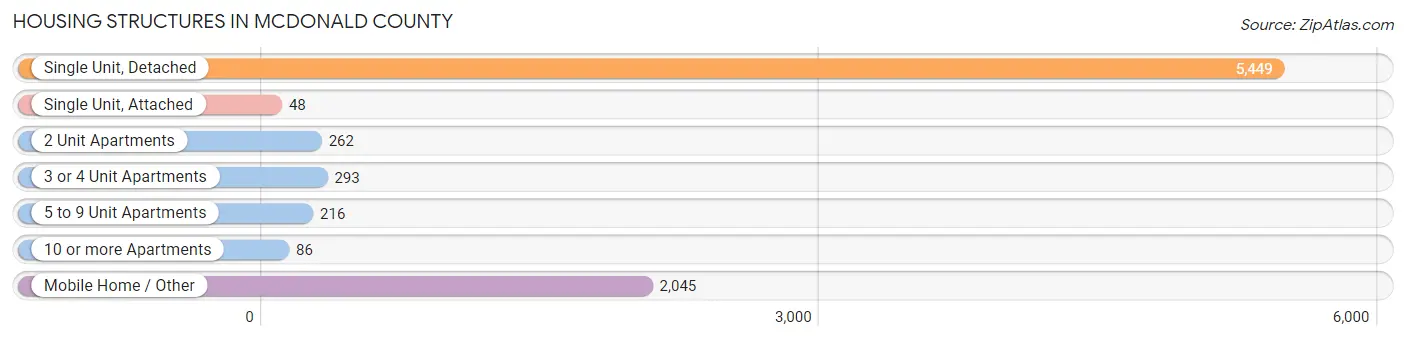
| Structure Type | # Housing Units | % Housing Units |
| Single Unit, Detached | 5,449 | 64.9% |
| Single Unit, Attached | 48 | 0.6% |
| 2 Unit Apartments | 262 | 3.1% |
| 3 or 4 Unit Apartments | 293 | 3.5% |
| 5 to 9 Unit Apartments | 216 | 2.6% |
| 10 or more Apartments | 86 | 1.0% |
| Mobile Home / Other | 2,045 | 24.3% |
| Total | 8,399 | 100.0% |
Housing Structures by Occupancy in McDonald County
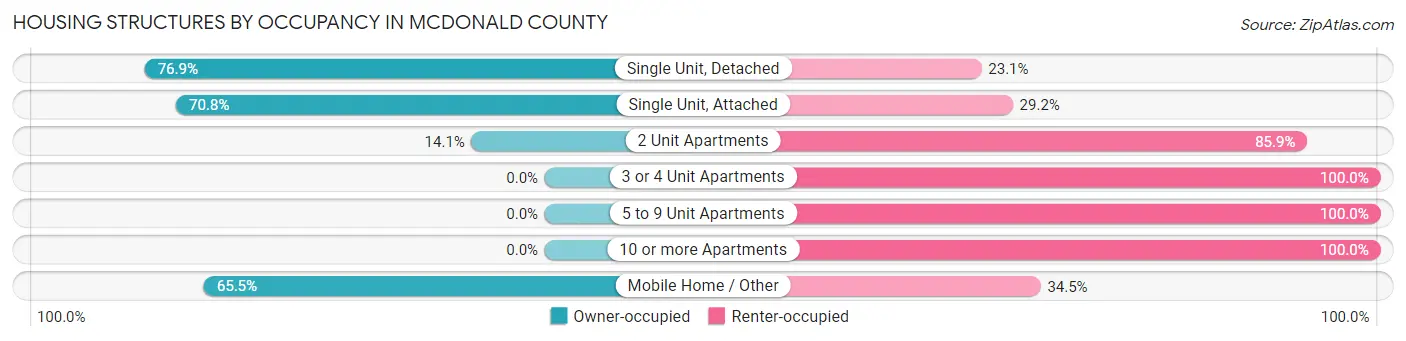
| Structure Type | Owner-occupied | Renter-occupied |
| Single Unit, Detached | 4,188 (76.9%) | 1,261 (23.1%) |
| Single Unit, Attached | 34 (70.8%) | 14 (29.2%) |
| 2 Unit Apartments | 37 (14.1%) | 225 (85.9%) |
| 3 or 4 Unit Apartments | 0 (0.0%) | 293 (100.0%) |
| 5 to 9 Unit Apartments | 0 (0.0%) | 216 (100.0%) |
| 10 or more Apartments | 0 (0.0%) | 86 (100.0%) |
| Mobile Home / Other | 1,339 (65.5%) | 706 (34.5%) |
| Total | 5,598 (66.6%) | 2,801 (33.4%) |
Housing Structures by Number of Rooms in McDonald County
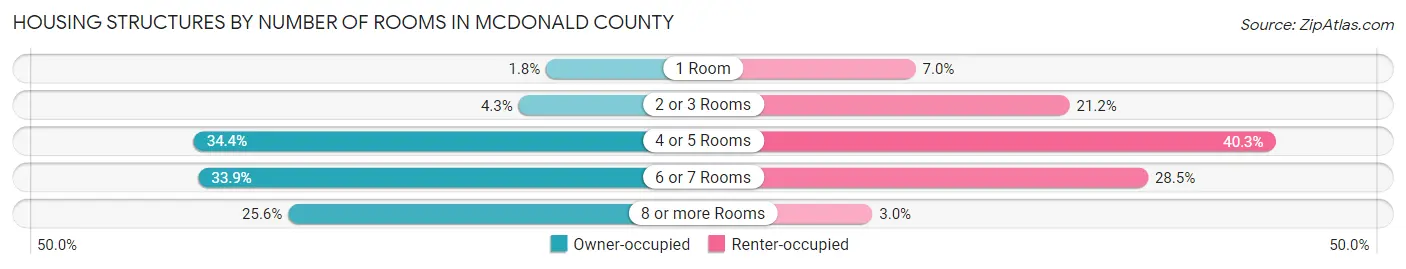
| Number of Rooms | Owner-occupied | Renter-occupied |
| 1 Room | 99 (1.8%) | 196 (7.0%) |
| 2 or 3 Rooms | 242 (4.3%) | 595 (21.2%) |
| 4 or 5 Rooms | 1,923 (34.4%) | 1,128 (40.3%) |
| 6 or 7 Rooms | 1,899 (33.9%) | 798 (28.5%) |
| 8 or more Rooms | 1,435 (25.6%) | 84 (3.0%) |
| Total | 5,598 (100.0%) | 2,801 (100.0%) |
Housing Structure by Heating Type in McDonald County
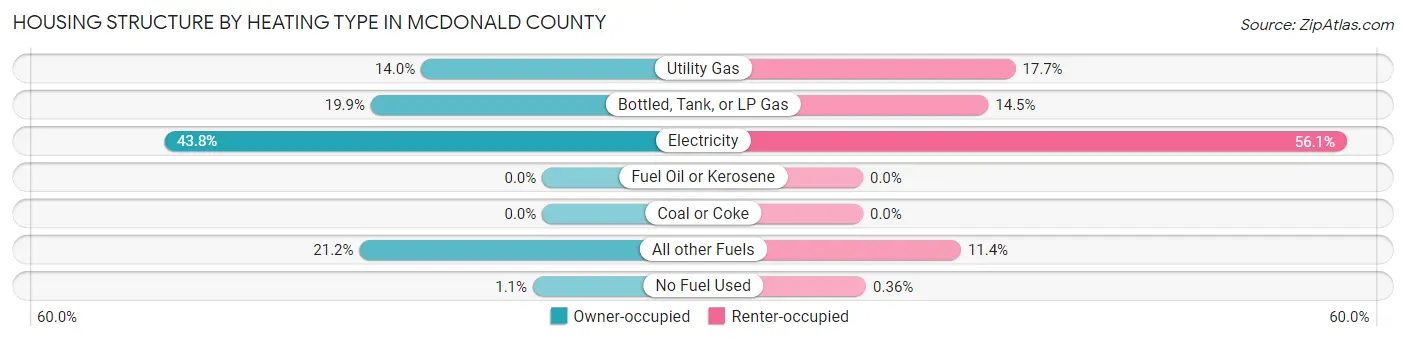
| Heating Type | Owner-occupied | Renter-occupied |
| Utility Gas | 786 (14.0%) | 495 (17.7%) |
| Bottled, Tank, or LP Gas | 1,112 (19.9%) | 407 (14.5%) |
| Electricity | 2,454 (43.8%) | 1,571 (56.1%) |
| Fuel Oil or Kerosene | 0 (0.0%) | 0 (0.0%) |
| Coal or Coke | 0 (0.0%) | 0 (0.0%) |
| All other Fuels | 1,186 (21.2%) | 318 (11.4%) |
| No Fuel Used | 60 (1.1%) | 10 (0.4%) |
| Total | 5,598 (100.0%) | 2,801 (100.0%) |
Household Vehicle Usage in McDonald County
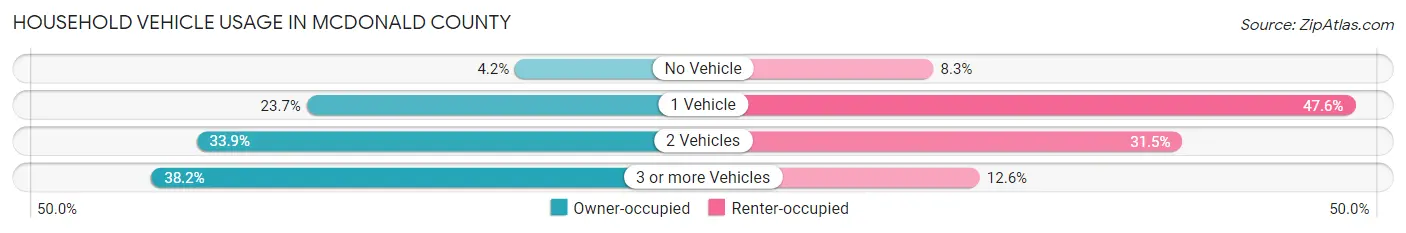
| Vehicles per Household | Owner-occupied | Renter-occupied |
| No Vehicle | 236 (4.2%) | 232 (8.3%) |
| 1 Vehicle | 1,325 (23.7%) | 1,334 (47.6%) |
| 2 Vehicles | 1,900 (33.9%) | 882 (31.5%) |
| 3 or more Vehicles | 2,137 (38.2%) | 353 (12.6%) |
| Total | 5,598 (100.0%) | 2,801 (100.0%) |
Real Estate & Mortgages in McDonald County
Real Estate and Mortgage Overview in McDonald County
| Characteristic | Without Mortgage | With Mortgage |
| Housing Units | 2,823 | 2,775 |
| Median Property Value | $114,900 | $119,900 |
| Median Household Income | $43,309 | $293 |
| Monthly Housing Costs | $367 | $76 |
| Real Estate Taxes | $590 | $46 |
Property Value by Mortgage Status in McDonald County
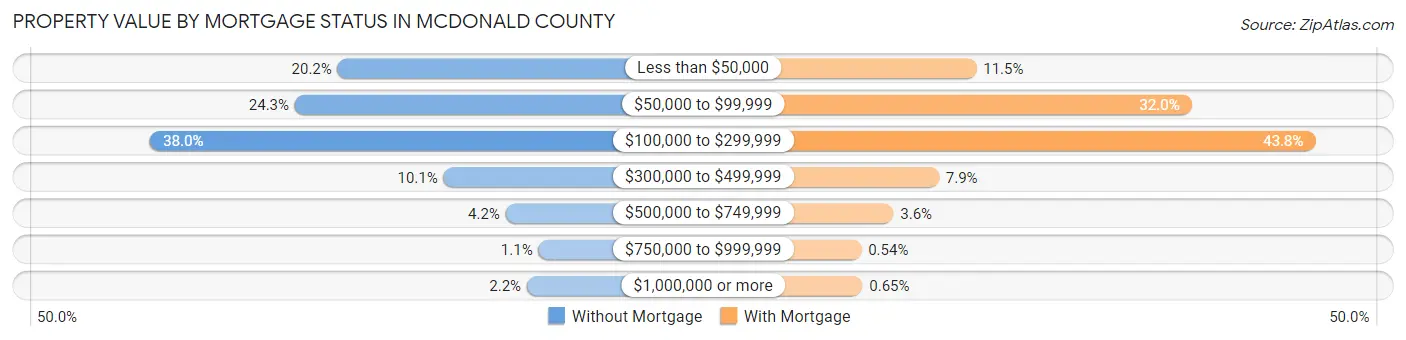
| Property Value | Without Mortgage | With Mortgage |
| Less than $50,000 | 570 (20.2%) | 319 (11.5%) |
| $50,000 to $99,999 | 685 (24.3%) | 888 (32.0%) |
| $100,000 to $299,999 | 1,074 (38.0%) | 1,215 (43.8%) |
| $300,000 to $499,999 | 285 (10.1%) | 220 (7.9%) |
| $500,000 to $749,999 | 118 (4.2%) | 100 (3.6%) |
| $750,000 to $999,999 | 30 (1.1%) | 15 (0.5%) |
| $1,000,000 or more | 61 (2.2%) | 18 (0.6%) |
| Total | 2,823 (100.0%) | 2,775 (100.0%) |
Household Income by Mortgage Status in McDonald County
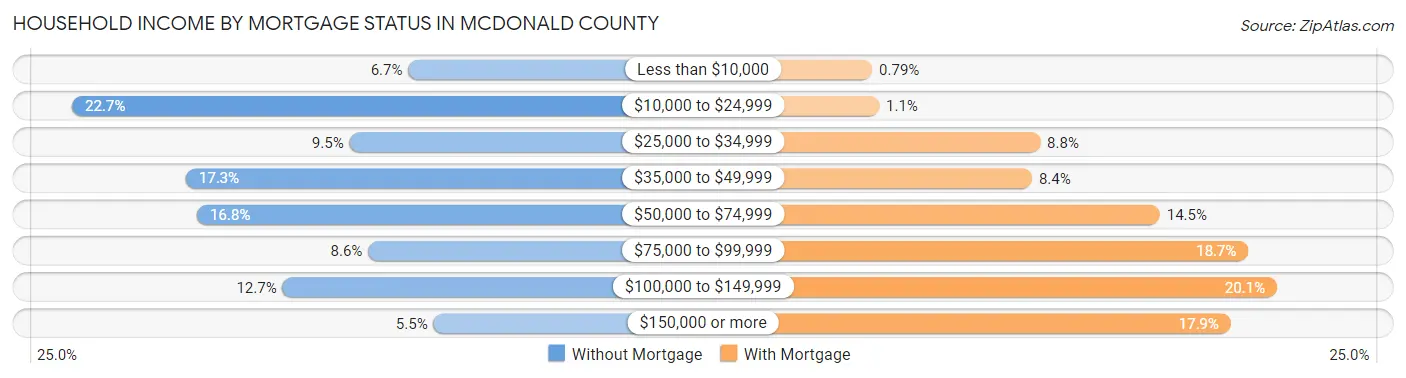
| Household Income | Without Mortgage | With Mortgage |
| Less than $10,000 | 190 (6.7%) | 22 (0.8%) |
| $10,000 to $24,999 | 642 (22.7%) | 31 (1.1%) |
| $25,000 to $34,999 | 269 (9.5%) | 244 (8.8%) |
| $35,000 to $49,999 | 489 (17.3%) | 233 (8.4%) |
| $50,000 to $74,999 | 474 (16.8%) | 402 (14.5%) |
| $75,000 to $99,999 | 244 (8.6%) | 519 (18.7%) |
| $100,000 to $149,999 | 359 (12.7%) | 557 (20.1%) |
| $150,000 or more | 156 (5.5%) | 496 (17.9%) |
| Total | 2,823 (100.0%) | 2,775 (100.0%) |
Property Value to Household Income Ratio in McDonald County
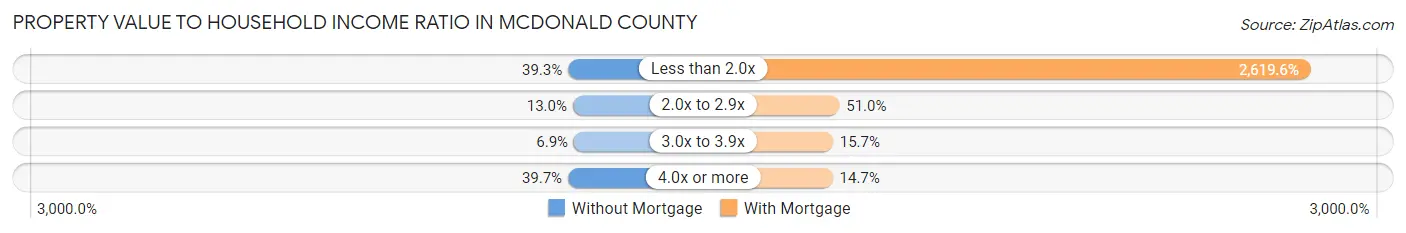
| Value-to-Income Ratio | Without Mortgage | With Mortgage |
| Less than 2.0x | 1,108 (39.3%) | 72,694 (2,619.6%) |
| 2.0x to 2.9x | 368 (13.0%) | 1,416 (51.0%) |
| 3.0x to 3.9x | 196 (6.9%) | 435 (15.7%) |
| 4.0x or more | 1,122 (39.7%) | 409 (14.7%) |
| Total | 2,823 (100.0%) | 2,775 (100.0%) |
Real Estate Taxes by Mortgage Status in McDonald County
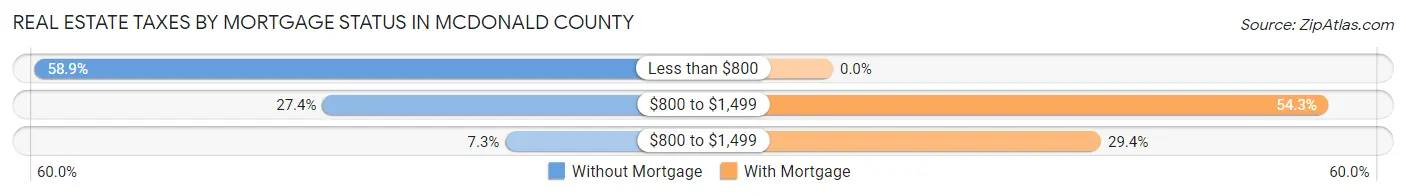
| Property Taxes | Without Mortgage | With Mortgage |
| Less than $800 | 1,663 (58.9%) | 0 (0.0%) |
| $800 to $1,499 | 773 (27.4%) | 1,507 (54.3%) |
| $800 to $1,499 | 207 (7.3%) | 815 (29.4%) |
| Total | 2,823 (100.0%) | 2,775 (100.0%) |
Health & Disability in McDonald County
Health Insurance Coverage by Age in McDonald County
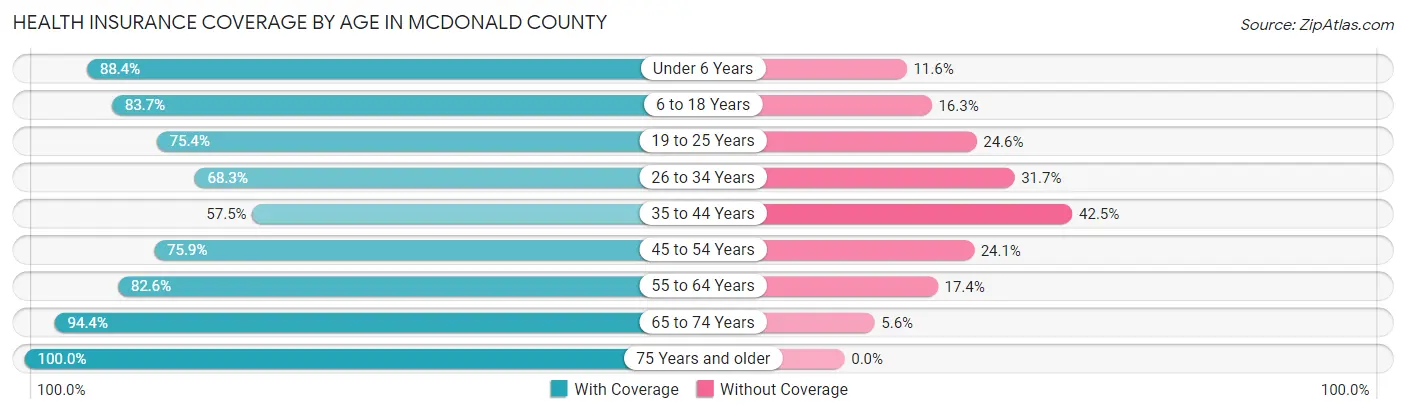
| Age Bracket | With Coverage | Without Coverage |
| Under 6 Years | 1,677 (88.4%) | 220 (11.6%) |
| 6 to 18 Years | 3,704 (83.7%) | 719 (16.3%) |
| 19 to 25 Years | 1,341 (75.4%) | 438 (24.6%) |
| 26 to 34 Years | 1,750 (68.3%) | 812 (31.7%) |
| 35 to 44 Years | 1,640 (57.5%) | 1,211 (42.5%) |
| 45 to 54 Years | 2,233 (75.9%) | 710 (24.1%) |
| 55 to 64 Years | 2,722 (82.6%) | 573 (17.4%) |
| 65 to 74 Years | 2,055 (94.4%) | 122 (5.6%) |
| 75 Years and older | 1,297 (100.0%) | 0 (0.0%) |
| Total | 18,419 (79.3%) | 4,805 (20.7%) |
Health Insurance Coverage by Citizenship Status in McDonald County
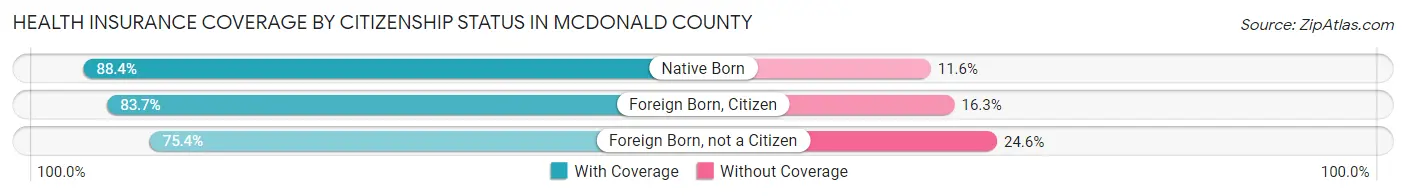
| Citizenship Status | With Coverage | Without Coverage |
| Native Born | 1,677 (88.4%) | 220 (11.6%) |
| Foreign Born, Citizen | 3,704 (83.7%) | 719 (16.3%) |
| Foreign Born, not a Citizen | 1,341 (75.4%) | 438 (24.6%) |
Health Insurance Coverage by Household Income in McDonald County
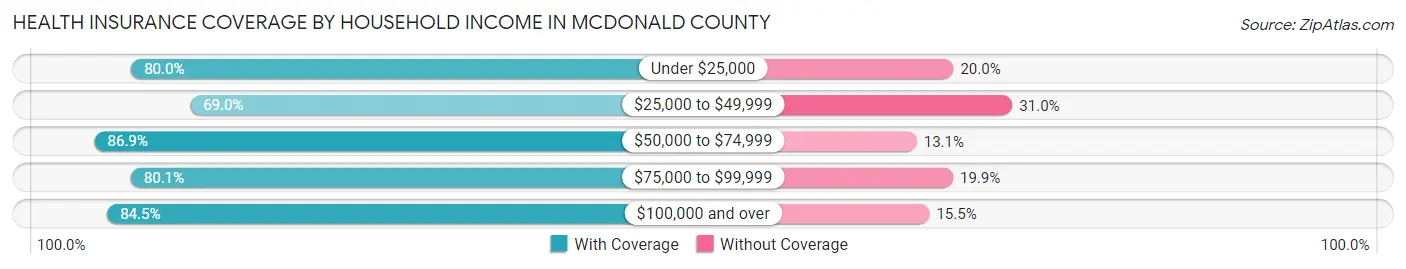
| Household Income | With Coverage | Without Coverage |
| Under $25,000 | 3,141 (80.0%) | 785 (20.0%) |
| $25,000 to $49,999 | 4,261 (69.0%) | 1,917 (31.0%) |
| $50,000 to $74,999 | 3,577 (86.9%) | 540 (13.1%) |
| $75,000 to $99,999 | 3,114 (80.1%) | 774 (19.9%) |
| $100,000 and over | 4,298 (84.5%) | 788 (15.5%) |
Public vs Private Health Insurance Coverage by Age in McDonald County
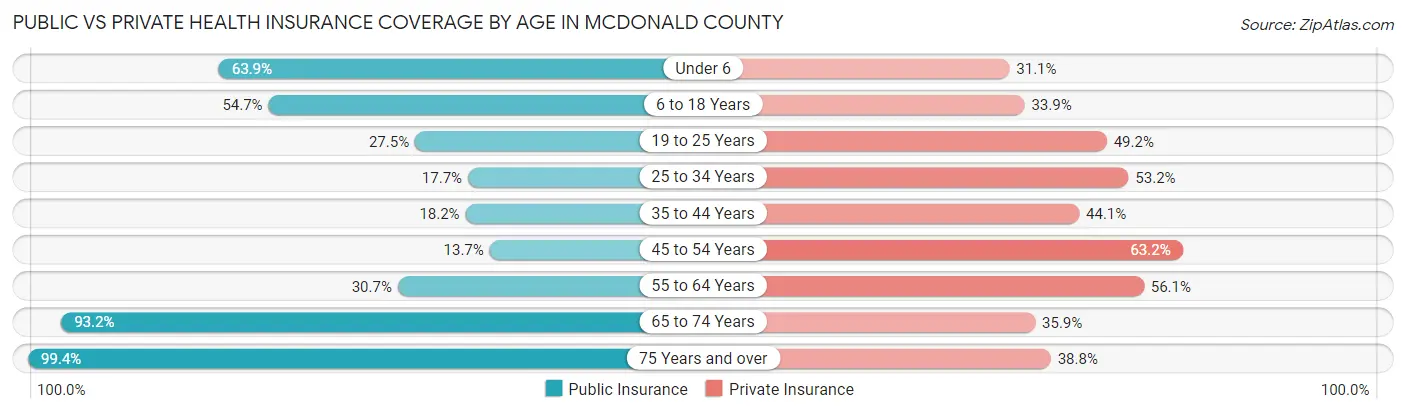
| Age Bracket | Public Insurance | Private Insurance |
| Under 6 | 1,213 (63.9%) | 590 (31.1%) |
| 6 to 18 Years | 2,421 (54.7%) | 1,500 (33.9%) |
| 19 to 25 Years | 490 (27.5%) | 875 (49.2%) |
| 25 to 34 Years | 454 (17.7%) | 1,363 (53.2%) |
| 35 to 44 Years | 518 (18.2%) | 1,256 (44.1%) |
| 45 to 54 Years | 403 (13.7%) | 1,861 (63.2%) |
| 55 to 64 Years | 1,013 (30.7%) | 1,847 (56.0%) |
| 65 to 74 Years | 2,029 (93.2%) | 781 (35.9%) |
| 75 Years and over | 1,289 (99.4%) | 503 (38.8%) |
| Total | 9,830 (42.3%) | 10,576 (45.5%) |
Disability Status by Sex by Age in McDonald County
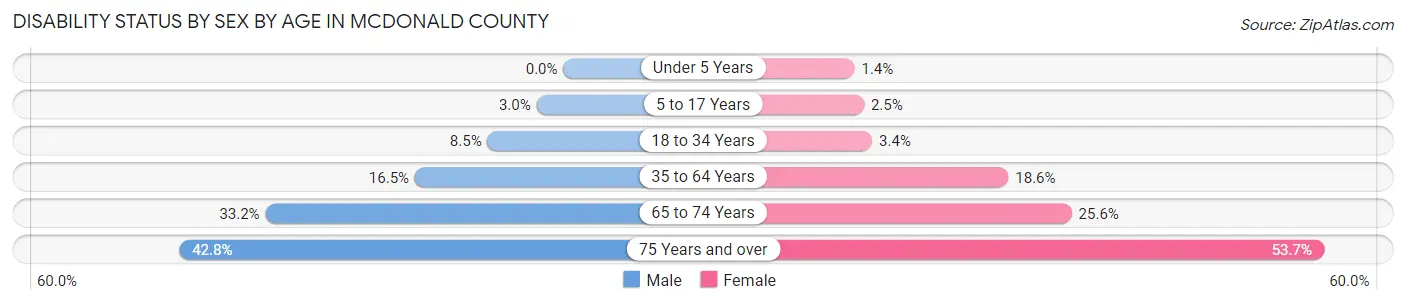
| Age Bracket | Male | Female |
| Under 5 Years | 0 (0.0%) | 11 (1.4%) |
| 5 to 17 Years | 71 (3.0%) | 50 (2.5%) |
| 18 to 34 Years | 205 (8.5%) | 77 (3.4%) |
| 35 to 64 Years | 746 (16.5%) | 849 (18.5%) |
| 65 to 74 Years | 362 (33.2%) | 278 (25.6%) |
| 75 Years and over | 240 (42.8%) | 395 (53.7%) |
Disability Class by Sex by Age in McDonald County
Disability Class: Hearing Difficulty
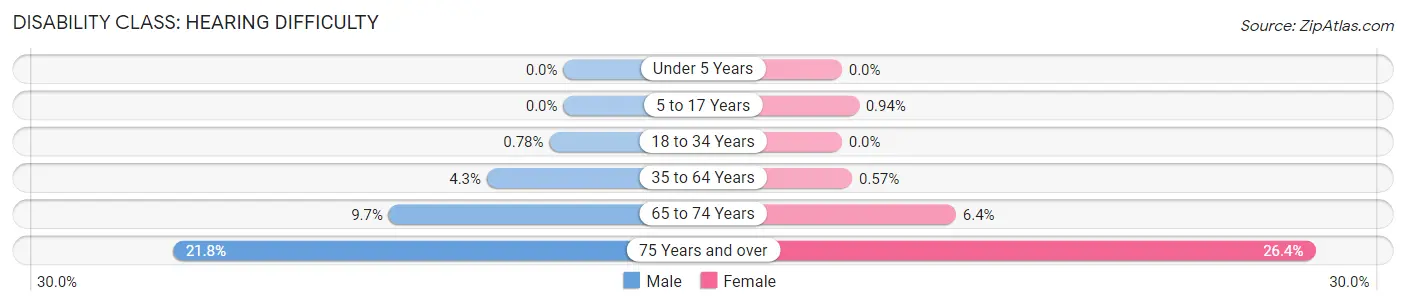
| Age Bracket | Male | Female |
| Under 5 Years | 0 (0.0%) | 0 (0.0%) |
| 5 to 17 Years | 0 (0.0%) | 19 (0.9%) |
| 18 to 34 Years | 19 (0.8%) | 0 (0.0%) |
| 35 to 64 Years | 192 (4.3%) | 26 (0.6%) |
| 65 to 74 Years | 106 (9.7%) | 69 (6.4%) |
| 75 Years and over | 122 (21.7%) | 194 (26.4%) |
Disability Class: Vision Difficulty
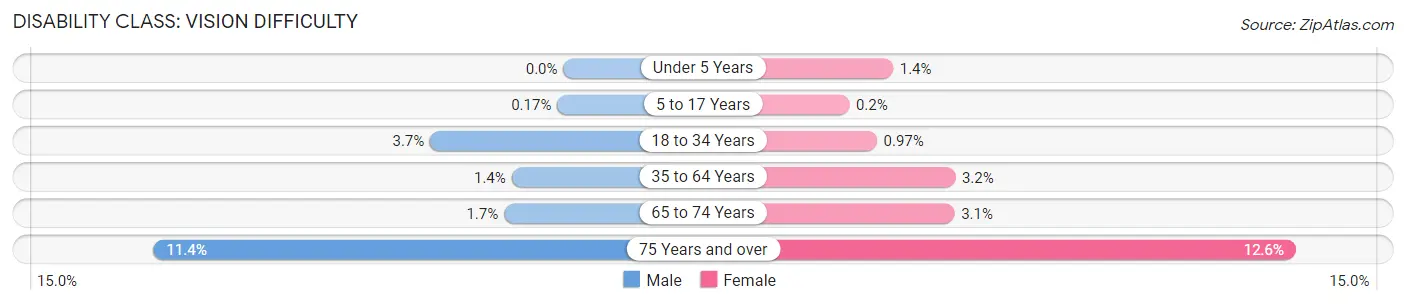
| Age Bracket | Male | Female |
| Under 5 Years | 0 (0.0%) | 11 (1.4%) |
| 5 to 17 Years | 4 (0.2%) | 4 (0.2%) |
| 18 to 34 Years | 90 (3.7%) | 22 (1.0%) |
| 35 to 64 Years | 65 (1.4%) | 144 (3.2%) |
| 65 to 74 Years | 18 (1.7%) | 34 (3.1%) |
| 75 Years and over | 64 (11.4%) | 93 (12.6%) |
Disability Class: Cognitive Difficulty
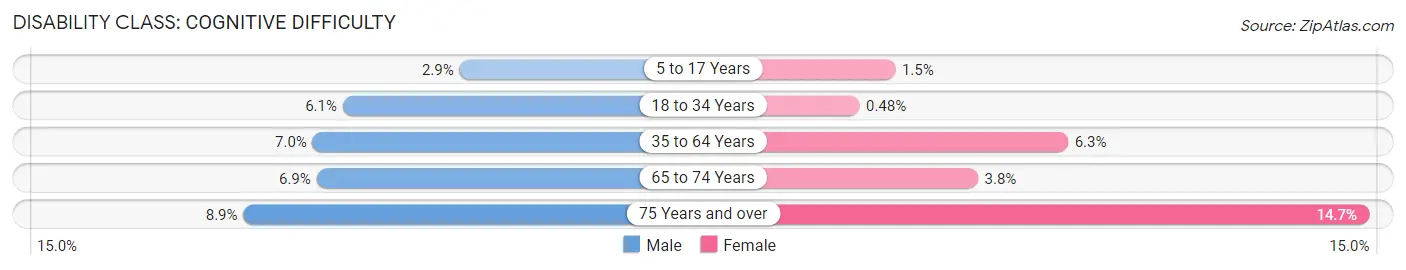
| Age Bracket | Male | Female |
| 5 to 17 Years | 69 (2.9%) | 30 (1.5%) |
| 18 to 34 Years | 149 (6.1%) | 11 (0.5%) |
| 35 to 64 Years | 315 (7.0%) | 288 (6.3%) |
| 65 to 74 Years | 75 (6.9%) | 41 (3.8%) |
| 75 Years and over | 50 (8.9%) | 108 (14.7%) |
Disability Class: Ambulatory Difficulty
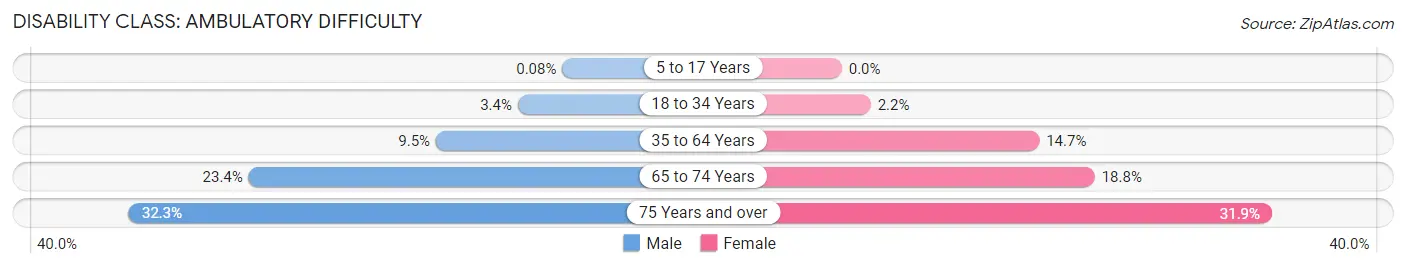
| Age Bracket | Male | Female |
| 5 to 17 Years | 2 (0.1%) | 0 (0.0%) |
| 18 to 34 Years | 82 (3.4%) | 49 (2.1%) |
| 35 to 64 Years | 427 (9.5%) | 671 (14.7%) |
| 65 to 74 Years | 255 (23.4%) | 204 (18.8%) |
| 75 Years and over | 181 (32.3%) | 235 (31.9%) |
Disability Class: Self-Care Difficulty
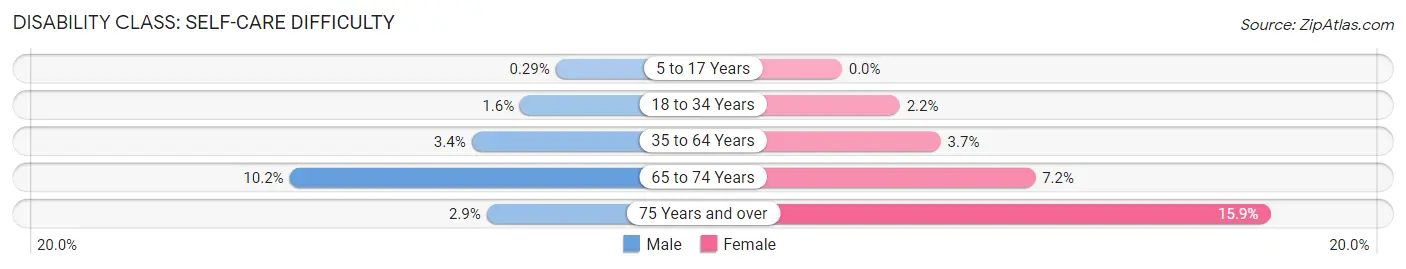
| Age Bracket | Male | Female |
| 5 to 17 Years | 7 (0.3%) | 0 (0.0%) |
| 18 to 34 Years | 39 (1.6%) | 49 (2.1%) |
| 35 to 64 Years | 154 (3.4%) | 168 (3.7%) |
| 65 to 74 Years | 111 (10.2%) | 78 (7.2%) |
| 75 Years and over | 16 (2.9%) | 117 (15.9%) |
Technology Access in McDonald County
Computing Device Access in McDonald County
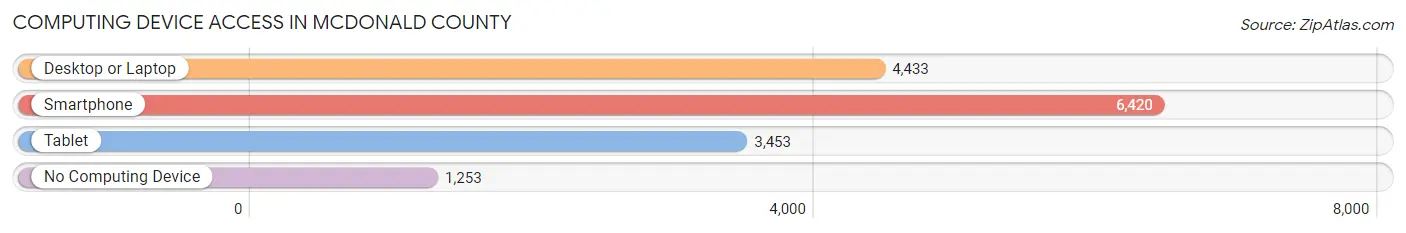
| Device Type | # Households | % Households |
| Desktop or Laptop | 4,433 | 52.8% |
| Smartphone | 6,420 | 76.4% |
| Tablet | 3,453 | 41.1% |
| No Computing Device | 1,253 | 14.9% |
| Total | 8,399 | 100.0% |
Internet Access in McDonald County
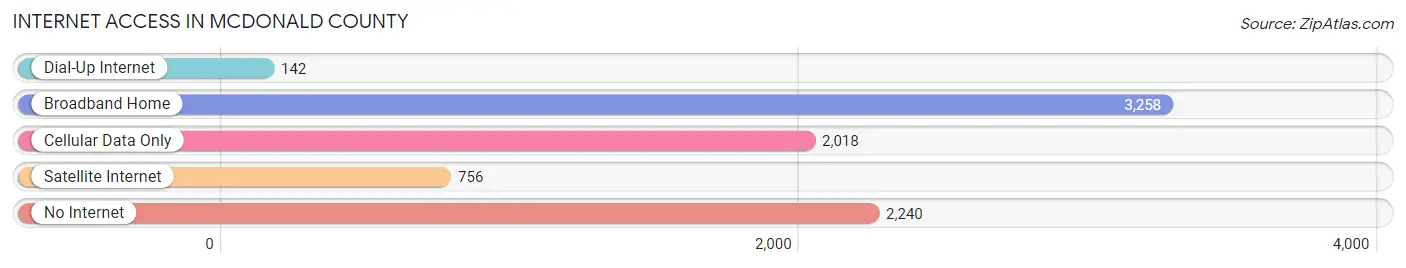
| Internet Type | # Households | % Households |
| Dial-Up Internet | 142 | 1.7% |
| Broadband Home | 3,258 | 38.8% |
| Cellular Data Only | 2,018 | 24.0% |
| Satellite Internet | 756 | 9.0% |
| No Internet | 2,240 | 26.7% |
| Total | 8,399 | 100.0% |
McDonald County Summary
McDonald County is located in the southwestern corner of Missouri, and is bordered by Arkansas to the south and Oklahoma to the west. The county was established in 1849 and named after Alexander McDonald, a prominent early settler. The county seat is Pineville, and the largest city is Anderson. As of the 2010 census, the population was 23,083.
History
McDonald County was established in 1849 and named after Alexander McDonald, a prominent early settler. The county was originally part of the Cherokee Nation, and the area was home to several Native American tribes, including the Osage, Quapaw, and Caddo. The first white settlers arrived in the area in the early 1800s, and the county was officially organized in 1849.
The county was largely agricultural in its early years, with cotton, corn, and wheat being the main crops. The county also had a thriving timber industry, and the area was home to several sawmills and gristmills. The county was also home to several coal mines, and the area was a major producer of coal until the early 1900s.
Geography
McDonald County is located in the southwestern corner of Missouri, and is bordered by Arkansas to the south and Oklahoma to the west. The county covers an area of 576 square miles, and is mostly rural and agricultural. The county is located in the Ozark Plateau region of Missouri, and is characterized by rolling hills and valleys. The county is home to several rivers and streams, including the Elk River, the Buffalo River, and the Neosho River.
Economy
The economy of McDonald County is largely based on agriculture and tourism. The county is home to several large farms, and the main crops grown in the area are corn, soybeans, wheat, and hay. The county is also home to several wineries and vineyards, and the area is a popular destination for wine enthusiasts.
The county is also home to several manufacturing companies, including a furniture factory, a plastics factory, and a metal fabrication plant. The county is also home to several retail stores, restaurants, and other businesses.
Demographics
As of the 2010 census, the population of McDonald County was 23,083. The population is largely white (94.3%), with small percentages of African American (2.2%), Native American (1.2%), Asian (0.4%), and other races (1.9%). The median household income in the county is $37,945, and the median age is 41.7 years.
Conclusion
McDonald County is a rural county located in the southwestern corner of Missouri. The county was established in 1849 and named after Alexander McDonald, a prominent early settler. The county is largely agricultural, with corn, soybeans, wheat, and hay being the main crops. The county is also home to several manufacturing companies, retail stores, restaurants, and other businesses. As of the 2010 census, the population of McDonald County was 23,083.
Common Questions
What is Per Capita Income in McDonald County?
Per Capita income in McDonald County is $23,210.
What is the Median Family Income in McDonald County?
Median Family Income in McDonald County is $53,431.
What is the Median Household income in McDonald County?
Median Household Income in McDonald County is $46,494.
What is Income or Wage Gap in McDonald County?
Income or Wage Gap in McDonald County is 26.4%.
Women in McDonald County earn 73.6 cents for every dollar earned by a man.
What is Family Income Deficit in McDonald County?
Family Income Deficit in McDonald County is $11,257.
Families that are below poverty line in McDonald County earn $11,257 less on average than the poverty threshold level.
What is Inequality or Gini Index in McDonald County?
Inequality or Gini Index in McDonald County is 0.43.
What is the Total Population of McDonald County?
Total Population of McDonald County is 23,381.
What is the Total Male Population of McDonald County?
Total Male Population of McDonald County is 11,840.
What is the Total Female Population of McDonald County?
Total Female Population of McDonald County is 11,541.
What is the Ratio of Males per 100 Females in McDonald County?
There are 102.59 Males per 100 Females in McDonald County.
What is the Ratio of Females per 100 Males in McDonald County?
There are 97.47 Females per 100 Males in McDonald County.
What is the Median Population Age in McDonald County?
Median Population Age in McDonald County is 38.2 Years.
What is the Average Family Size in McDonald County
Average Family Size in McDonald County is 3.3 People.
What is the Average Household Size in McDonald County
Average Household Size in McDonald County is 2.8 People.
How Large is the Labor Force in McDonald County?
There are 10,252 People in the Labor Forcein in McDonald County.
What is the Percentage of People in the Labor Force in McDonald County?
56.3% of People are in the Labor Force in McDonald County.
What is the Unemployment Rate in McDonald County?
Unemployment Rate in McDonald County is 5.9%.