Linn County, MO Map & Demographics
Linn County Map
Linn County Overview
$32,065
PER CAPITA INCOME
$69,750
AVG FAMILY INCOME
$58,435
AVG HOUSEHOLD INCOME
30.1%
WAGE / INCOME GAP [ % ]
69.9¢/ $1
WAGE / INCOME GAP [ $ ]
$13,222
FAMILY INCOME DEFICIT
0.45
INEQUALITY / GINI INDEX
11,892
TOTAL POPULATION
5,823
MALE POPULATION
6,069
FEMALE POPULATION
95.95
MALES / 100 FEMALES
104.22
FEMALES / 100 MALES
42.0
MEDIAN AGE
3.0
AVG FAMILY SIZE
2.5
AVG HOUSEHOLD SIZE
5,682
LABOR FORCE [ PEOPLE ]
59.7%
PERCENT IN LABOR FORCE
2.8%
UNEMPLOYMENT RATE
Linn County Area Codes
Income in Linn County
Income Overview in Linn County
Per Capita Income in Linn County is $32,065, while median incomes of families and households are $69,750 and $58,435 respectively.
| Characteristic | Number | Measure |
| Per Capita Income | 11,892 | $32,065 |
| Median Family Income | 3,245 | $69,750 |
| Mean Family Income | 3,245 | $89,056 |
| Median Household Income | 4,773 | $58,435 |
| Mean Household Income | 4,773 | $79,427 |
| Income Deficit | 3,245 | $13,222 |
| Wage / Income Gap (%) | 11,892 | 30.07% |
| Wage / Income Gap ($) | 11,892 | 69.93¢ per $1 |
| Gini / Inequality Index | 11,892 | 0.45 |
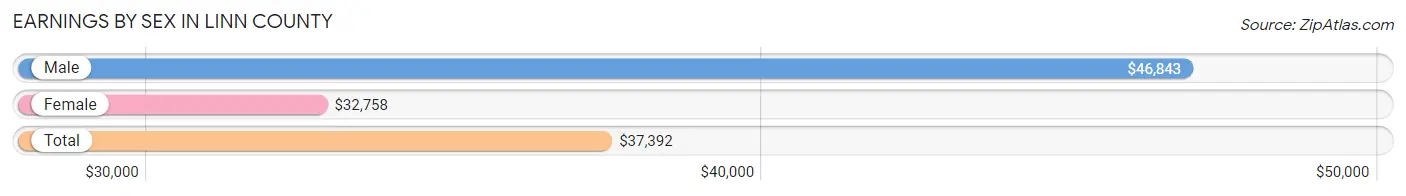
Earnings by Sex in Linn County
Average Earnings in Linn County are $37,392, $46,843 for men and $32,758 for women, a difference of 30.1%.
| Sex | Number | Average Earnings |
| Male | 3,094 (52.8%) | $46,843 |
| Female | 2,760 (47.1%) | $32,758 |
| Total | 5,854 (100.0%) | $37,392 |
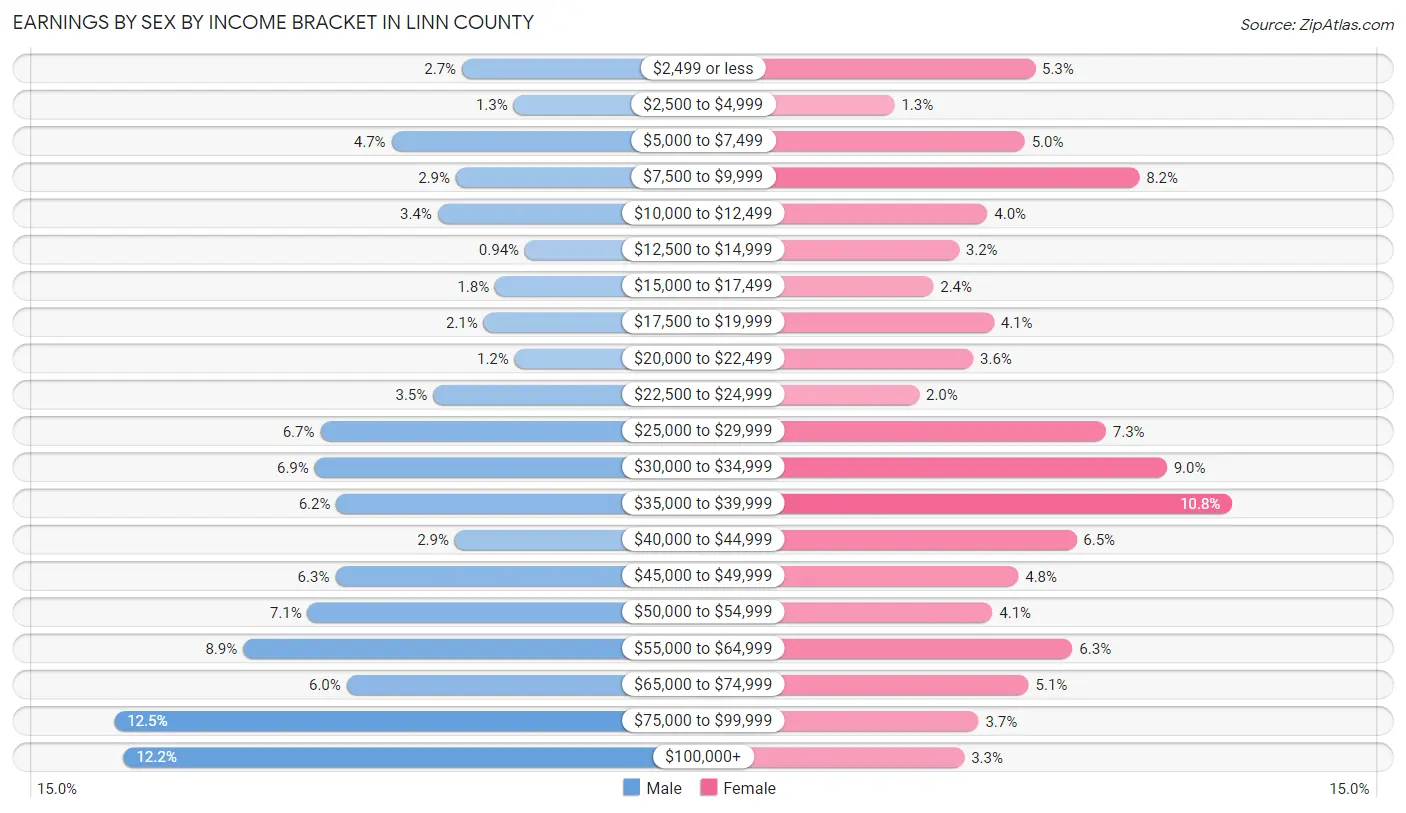
Earnings by Sex by Income Bracket in Linn County
The most common earnings brackets in Linn County are $75,000 to $99,999 for men (386 | 12.5%) and $35,000 to $39,999 for women (299 | 10.8%).
| Income | Male | Female |
| $2,499 or less | 84 (2.7%) | 146 (5.3%) |
| $2,500 to $4,999 | 39 (1.3%) | 37 (1.3%) |
| $5,000 to $7,499 | 145 (4.7%) | 138 (5.0%) |
| $7,500 to $9,999 | 89 (2.9%) | 227 (8.2%) |
| $10,000 to $12,499 | 105 (3.4%) | 109 (4.0%) |
| $12,500 to $14,999 | 29 (0.9%) | 87 (3.2%) |
| $15,000 to $17,499 | 55 (1.8%) | 67 (2.4%) |
| $17,500 to $19,999 | 65 (2.1%) | 114 (4.1%) |
| $20,000 to $22,499 | 38 (1.2%) | 98 (3.5%) |
| $22,500 to $24,999 | 109 (3.5%) | 56 (2.0%) |
| $25,000 to $29,999 | 207 (6.7%) | 201 (7.3%) |
| $30,000 to $34,999 | 212 (6.9%) | 248 (9.0%) |
| $35,000 to $39,999 | 193 (6.2%) | 299 (10.8%) |
| $40,000 to $44,999 | 90 (2.9%) | 178 (6.5%) |
| $45,000 to $49,999 | 194 (6.3%) | 133 (4.8%) |
| $50,000 to $54,999 | 218 (7.0%) | 113 (4.1%) |
| $55,000 to $64,999 | 274 (8.9%) | 175 (6.3%) |
| $65,000 to $74,999 | 184 (5.9%) | 141 (5.1%) |
| $75,000 to $99,999 | 386 (12.5%) | 102 (3.7%) |
| $100,000+ | 378 (12.2%) | 91 (3.3%) |
| Total | 3,094 (100.0%) | 2,760 (100.0%) |
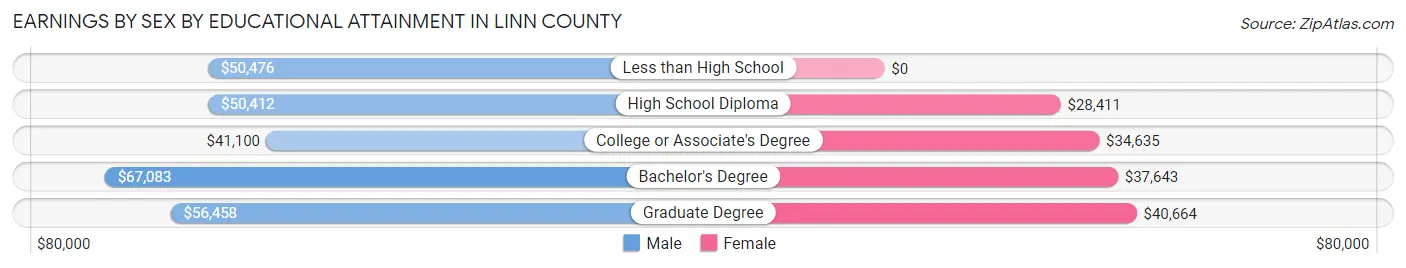
Earnings by Sex by Educational Attainment in Linn County
Average earnings in Linn County are $50,709 for men and $34,391 for women, a difference of 32.2%. Men with an educational attainment of bachelor's degree enjoy the highest average annual earnings of $67,083, while those with college or associate's degree education earn the least with $41,100. Women with an educational attainment of graduate degree earn the most with the average annual earnings of $40,664, while those with high school diploma education have the smallest earnings of $28,411.
| Educational Attainment | Male Income | Female Income |
| Less than High School | $50,476 | $0 |
| High School Diploma | $50,412 | $28,411 |
| College or Associate's Degree | $41,100 | $34,635 |
| Bachelor's Degree | $67,083 | $37,643 |
| Graduate Degree | $56,458 | $40,664 |
| Total | $50,709 | $34,391 |
Family Income in Linn County
Family Income Brackets in Linn County
According to the Linn County family income data, there are 597 families falling into the $50,000 to $74,999 income range, which is the most common income bracket and makes up 18.4% of all families. Conversely, the $10,000 to $14,999 income bracket is the least frequent group with only 58 families (1.8%) belonging to this category.
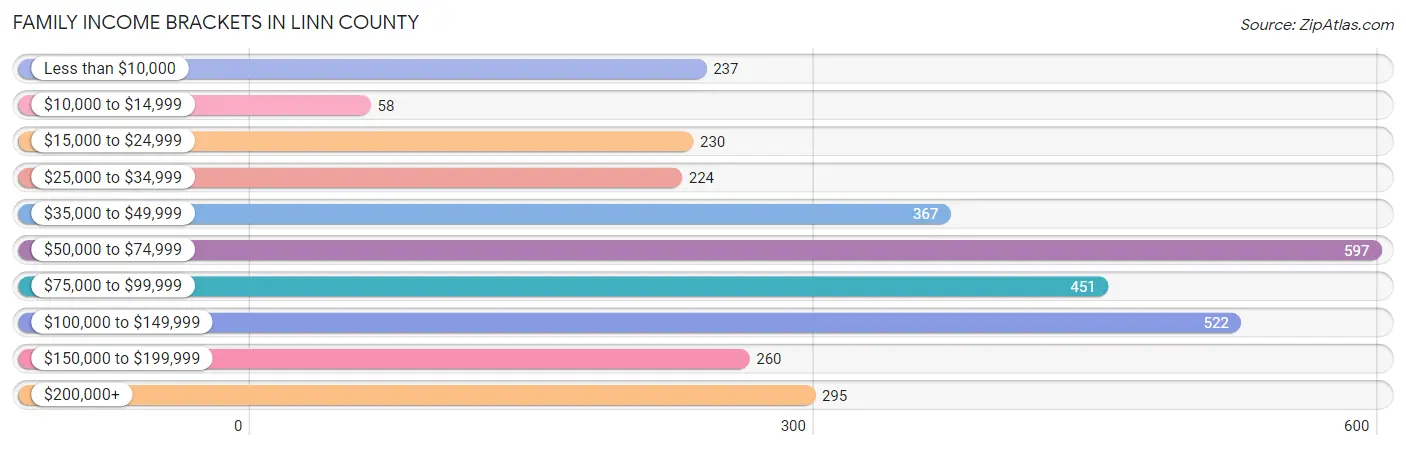
| Income Bracket | # Families | % Families |
| Less than $10,000 | 237 | 7.3% |
| $10,000 to $14,999 | 58 | 1.8% |
| $15,000 to $24,999 | 230 | 7.1% |
| $25,000 to $34,999 | 224 | 6.9% |
| $35,000 to $49,999 | 367 | 11.3% |
| $50,000 to $74,999 | 597 | 18.4% |
| $75,000 to $99,999 | 451 | 13.9% |
| $100,000 to $149,999 | 522 | 16.1% |
| $150,000 to $199,999 | 260 | 8.0% |
| $200,000+ | 295 | 9.1% |
Family Income by Famaliy Size in Linn County
7+ person families (39 | 1.2%) account for the highest median family income in Linn County with $243,221 per family, while 7+ person families (39 | 1.2%) have the highest median income of $34,746 per family member.
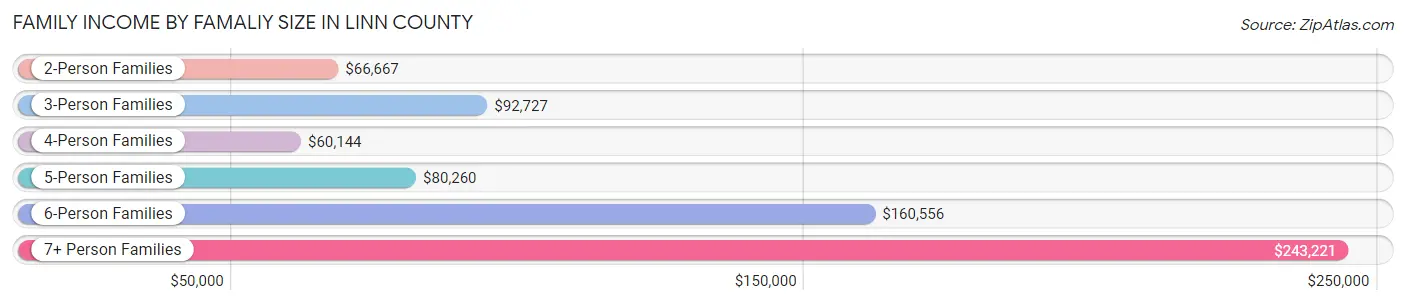
| Income Bracket | # Families | Median Income |
| 2-Person Families | 1,754 (54.0%) | $66,667 |
| 3-Person Families | 526 (16.2%) | $92,727 |
| 4-Person Families | 563 (17.3%) | $60,144 |
| 5-Person Families | 301 (9.3%) | $80,260 |
| 6-Person Families | 62 (1.9%) | $160,556 |
| 7+ Person Families | 39 (1.2%) | $243,221 |
| Total | 3,245 (100.0%) | $69,750 |
Family Income by Number of Earners in Linn County
The median family income in Linn County is $69,750, with families comprising 3+ earners (225) having the highest median family income of $134,688, while families with no earners (787) have the lowest median family income of $40,240, accounting for 6.9% and 24.2% of families, respectively.
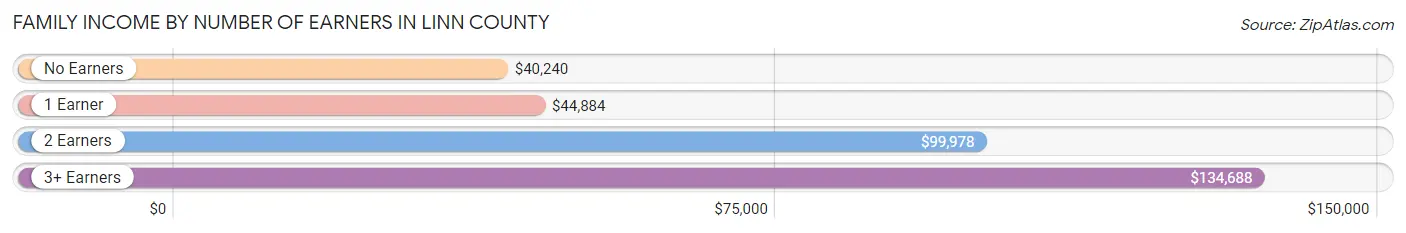
| Number of Earners | # Families | Median Income |
| No Earners | 787 (24.2%) | $40,240 |
| 1 Earner | 860 (26.5%) | $44,884 |
| 2 Earners | 1,373 (42.3%) | $99,978 |
| 3+ Earners | 225 (6.9%) | $134,688 |
| Total | 3,245 (100.0%) | $69,750 |
Household Income in Linn County
Household Income Brackets in Linn County
With 921 households falling in the category, the $50,000 to $74,999 income range is the most frequent in Linn County, accounting for 19.3% of all households. In contrast, only 158 households (3.3%) fall into the $10,000 to $14,999 income bracket, making it the least populous group.
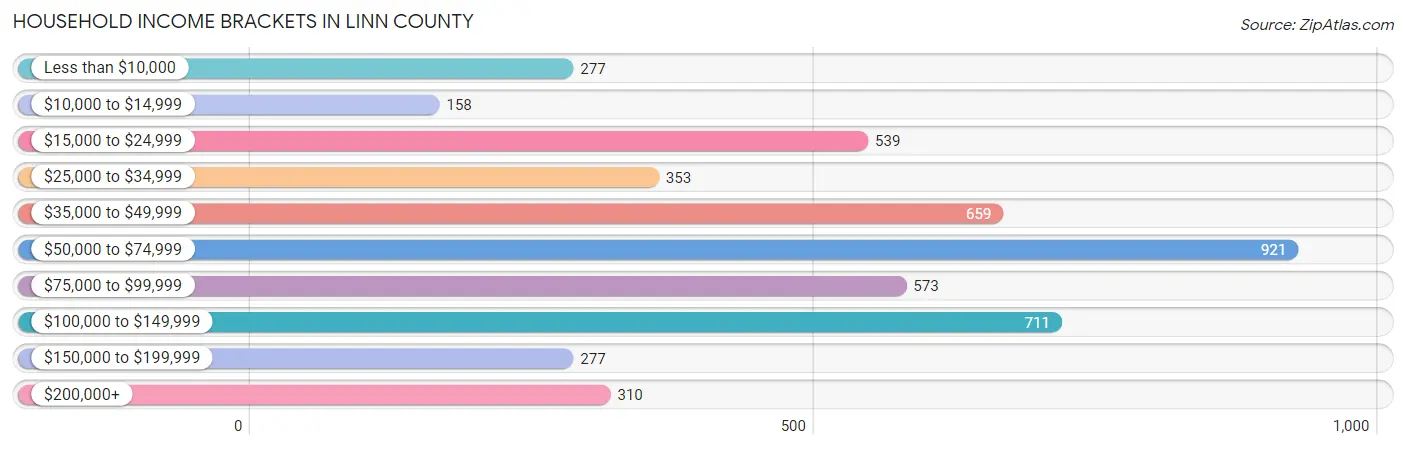
| Income Bracket | # Households | % Households |
| Less than $10,000 | 277 | 5.8% |
| $10,000 to $14,999 | 158 | 3.3% |
| $15,000 to $24,999 | 539 | 11.3% |
| $25,000 to $34,999 | 353 | 7.4% |
| $35,000 to $49,999 | 659 | 13.8% |
| $50,000 to $74,999 | 921 | 19.3% |
| $75,000 to $99,999 | 573 | 12.0% |
| $100,000 to $149,999 | 711 | 14.9% |
| $150,000 to $199,999 | 277 | 5.8% |
| $200,000+ | 310 | 6.5% |
Household Income by Householder Age in Linn County
The median household income in Linn County is $58,435, with the highest median household income of $71,188 found in the 25 to 44 years age bracket for the primary householder. A total of 1,189 households (24.9%) fall into this category. Meanwhile, the 15 to 24 years age bracket for the primary householder has the lowest median household income of $0, with 216 households (4.5%) in this group.
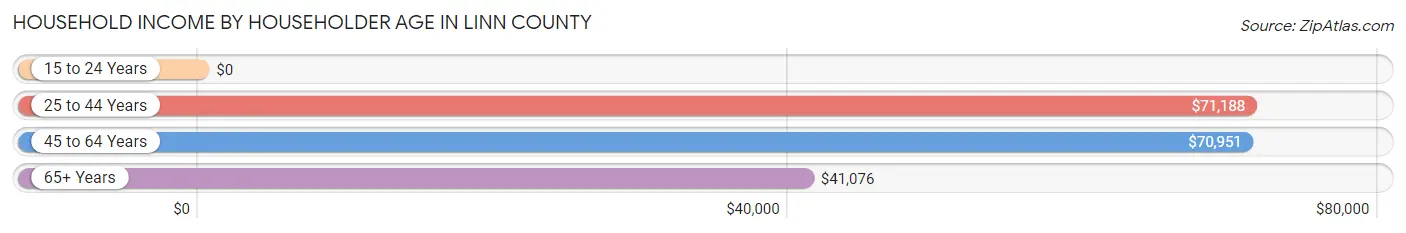
| Income Bracket | # Households | Median Income |
| 15 to 24 Years | 216 (4.5%) | $0 |
| 25 to 44 Years | 1,189 (24.9%) | $71,188 |
| 45 to 64 Years | 1,789 (37.5%) | $70,951 |
| 65+ Years | 1,579 (33.1%) | $41,076 |
| Total | 4,773 (100.0%) | $58,435 |
Poverty in Linn County
Income Below Poverty by Sex and Age in Linn County
With 15.4% poverty level for males and 18.1% for females among the residents of Linn County, under 5 year old males and 5 year old females are the most vulnerable to poverty, with 184 males (51.8%) and 69 females (55.2%) in their respective age groups living below the poverty level.
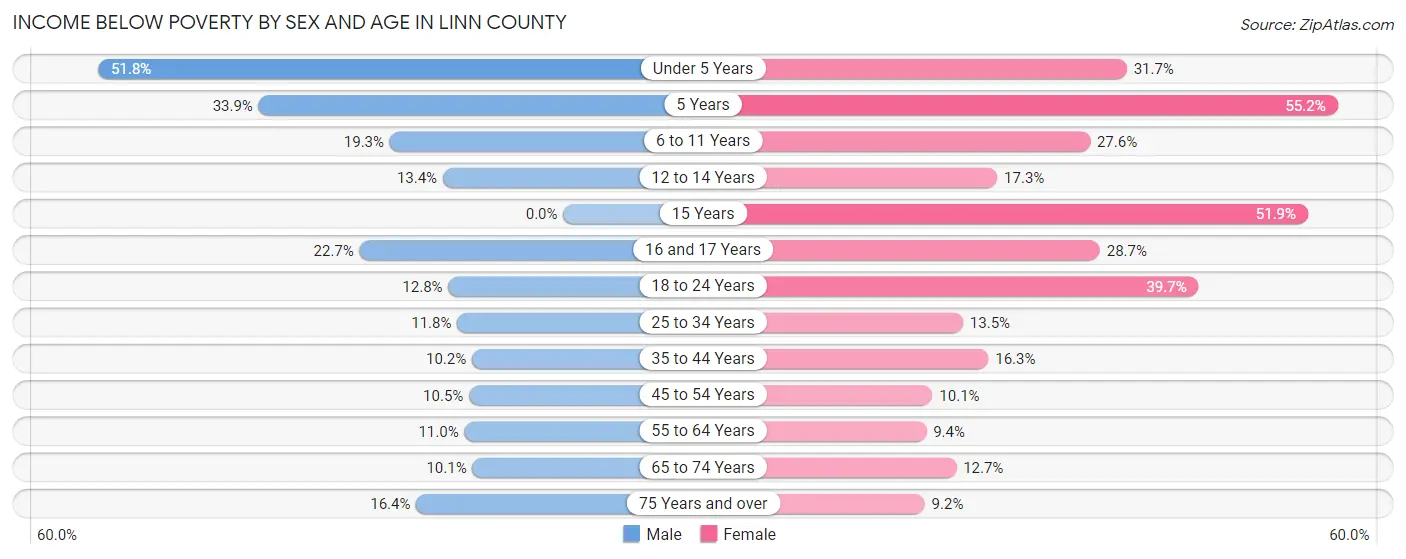
| Age Bracket | Male | Female |
| Under 5 Years | 184 (51.8%) | 112 (31.7%) |
| 5 Years | 19 (33.9%) | 69 (55.2%) |
| 6 to 11 Years | 96 (19.3%) | 89 (27.6%) |
| 12 to 14 Years | 35 (13.4%) | 50 (17.3%) |
| 15 Years | 0 (0.0%) | 41 (51.9%) |
| 16 and 17 Years | 54 (22.7%) | 52 (28.7%) |
| 18 to 24 Years | 63 (12.8%) | 170 (39.7%) |
| 25 to 34 Years | 75 (11.8%) | 85 (13.5%) |
| 35 to 44 Years | 67 (10.2%) | 111 (16.3%) |
| 45 to 54 Years | 70 (10.5%) | 64 (10.1%) |
| 55 to 64 Years | 88 (11.0%) | 84 (9.4%) |
| 65 to 74 Years | 67 (10.1%) | 99 (12.7%) |
| 75 Years and over | 67 (16.4%) | 54 (9.2%) |
| Total | 885 (15.4%) | 1,080 (18.1%) |
Income Above Poverty by Sex and Age in Linn County
According to the poverty statistics in Linn County, males aged 15 years and females aged 75 years and over are the age groups that are most secure financially, with 100.0% of males and 90.8% of females in these age groups living above the poverty line.
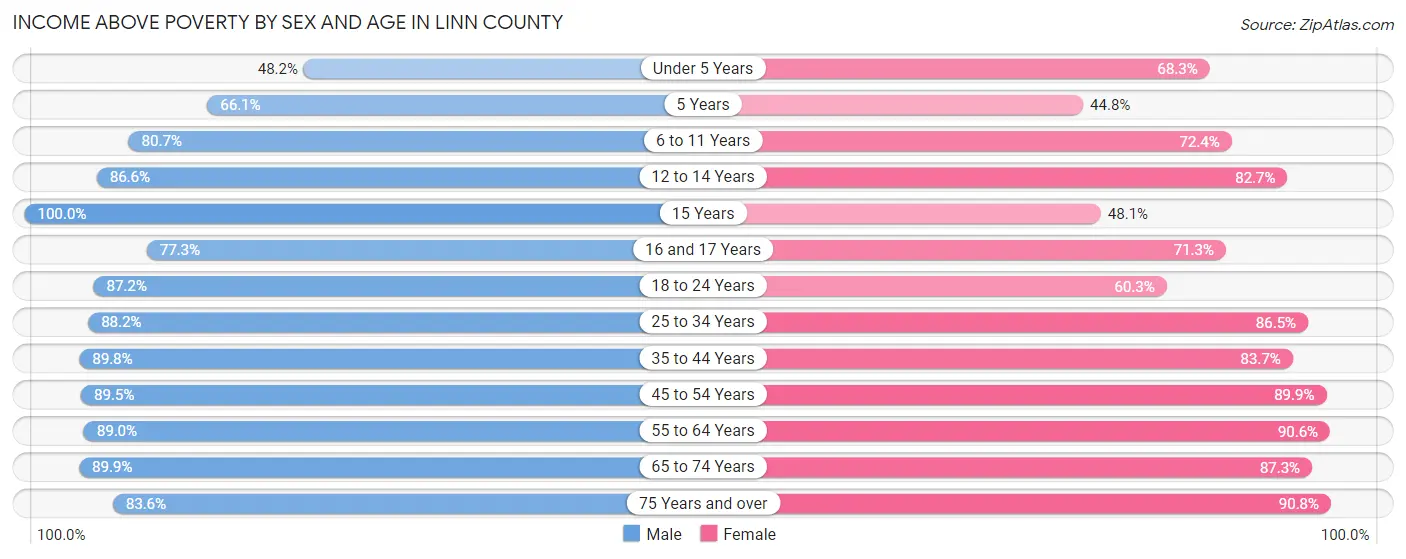
| Age Bracket | Male | Female |
| Under 5 Years | 171 (48.2%) | 241 (68.3%) |
| 5 Years | 37 (66.1%) | 56 (44.8%) |
| 6 to 11 Years | 401 (80.7%) | 233 (72.4%) |
| 12 to 14 Years | 226 (86.6%) | 239 (82.7%) |
| 15 Years | 28 (100.0%) | 38 (48.1%) |
| 16 and 17 Years | 184 (77.3%) | 129 (71.3%) |
| 18 to 24 Years | 429 (87.2%) | 258 (60.3%) |
| 25 to 34 Years | 560 (88.2%) | 545 (86.5%) |
| 35 to 44 Years | 592 (89.8%) | 569 (83.7%) |
| 45 to 54 Years | 597 (89.5%) | 570 (89.9%) |
| 55 to 64 Years | 711 (89.0%) | 810 (90.6%) |
| 65 to 74 Years | 595 (89.9%) | 678 (87.3%) |
| 75 Years and over | 342 (83.6%) | 531 (90.8%) |
| Total | 4,873 (84.6%) | 4,897 (81.9%) |
Income Below Poverty Among Married-Couple Families in Linn County
The poverty statistics for married-couple families in Linn County show that 9.7% or 252 of the total 2,598 families live below the poverty line. Families with 3 or 4 children have the highest poverty rate of 15.3%, comprising of 42 families. On the other hand, families with 5 or more children have the lowest poverty rate of 0.0%, which includes 0 families.
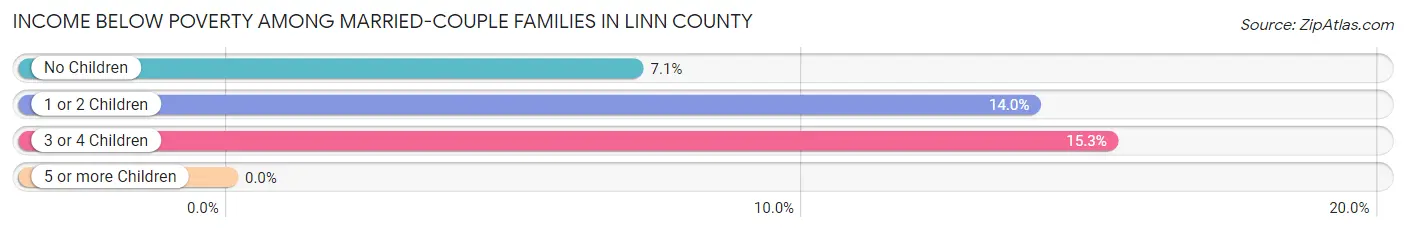
| Children | Above Poverty | Below Poverty |
| No Children | 1,541 (92.9%) | 117 (7.1%) |
| 1 or 2 Children | 572 (86.0%) | 93 (14.0%) |
| 3 or 4 Children | 232 (84.7%) | 42 (15.3%) |
| 5 or more Children | 1 (100.0%) | 0 (0.0%) |
| Total | 2,346 (90.3%) | 252 (9.7%) |
Income Below Poverty Among Single-Parent Households in Linn County
According to the poverty data in Linn County, 24.7% or 49 single-father households and 40.8% or 183 single-mother households are living below the poverty line. Among single-father households, those with 5 or more children have the highest poverty rate, with 8 households (100.0%) experiencing poverty. Likewise, among single-mother households, those with 3 or 4 children have the highest poverty rate, with 99 households (92.5%) falling below the poverty line.
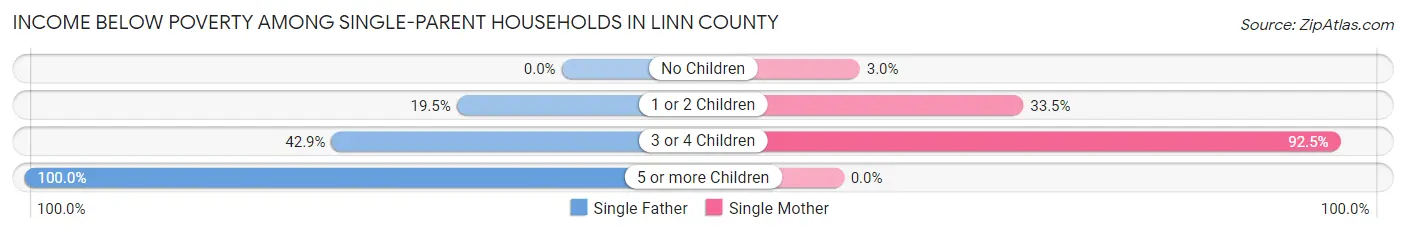
| Children | Single Father | Single Mother |
| No Children | 0 (0.0%) | 3 (3.0%) |
| 1 or 2 Children | 17 (19.5%) | 81 (33.5%) |
| 3 or 4 Children | 24 (42.9%) | 99 (92.5%) |
| 5 or more Children | 8 (100.0%) | 0 (0.0%) |
| Total | 49 (24.7%) | 183 (40.8%) |
Income Below Poverty Among Married-Couple vs Single-Parent Households in Linn County
The poverty data for Linn County shows that 252 of the married-couple family households (9.7%) and 232 of the single-parent households (35.9%) are living below the poverty level. Within the married-couple family households, those with 3 or 4 children have the highest poverty rate, with 42 households (15.3%) falling below the poverty line. Among the single-parent households, those with 5 or more children have the highest poverty rate, with 8 household (100.0%) living below poverty.
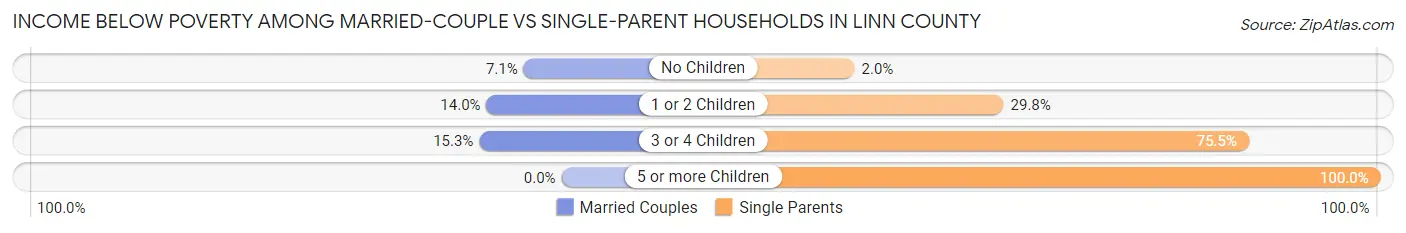
| Children | Married-Couple Families | Single-Parent Households |
| No Children | 117 (7.1%) | 3 (2.0%) |
| 1 or 2 Children | 93 (14.0%) | 98 (29.8%) |
| 3 or 4 Children | 42 (15.3%) | 123 (75.5%) |
| 5 or more Children | 0 (0.0%) | 8 (100.0%) |
| Total | 252 (9.7%) | 232 (35.9%) |
Race in Linn County
The most populous races in Linn County are White / Caucasian (11,438 | 96.2%), Hispanic or Latino (340 | 2.9%), and Two or more Races (253 | 2.1%).
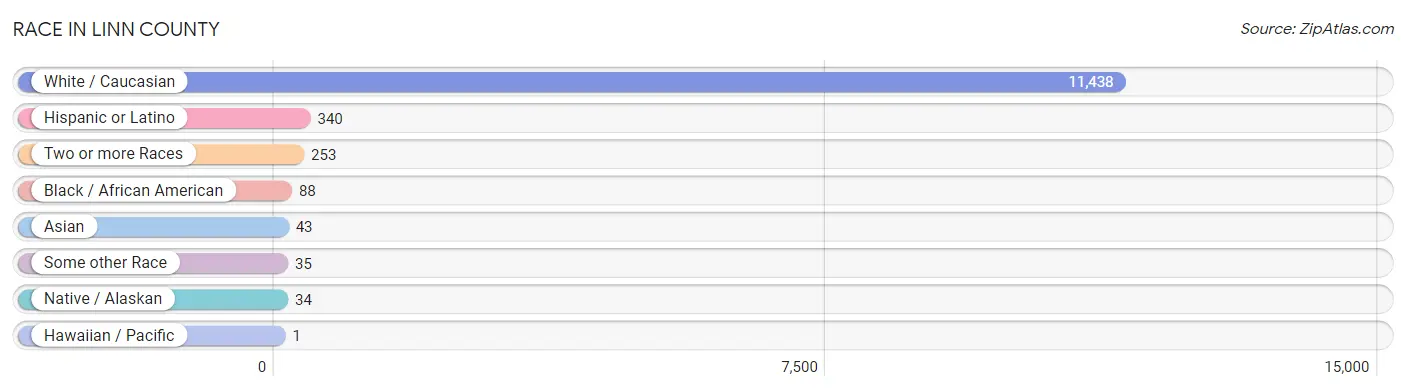
| Race | # Population | % Population |
| Asian | 43 | 0.4% |
| Black / African American | 88 | 0.7% |
| Hawaiian / Pacific | 1 | 0.0% |
| Hispanic or Latino | 340 | 2.9% |
| Native / Alaskan | 34 | 0.3% |
| White / Caucasian | 11,438 | 96.2% |
| Two or more Races | 253 | 2.1% |
| Some other Race | 35 | 0.3% |
| Total | 11,892 | 100.0% |
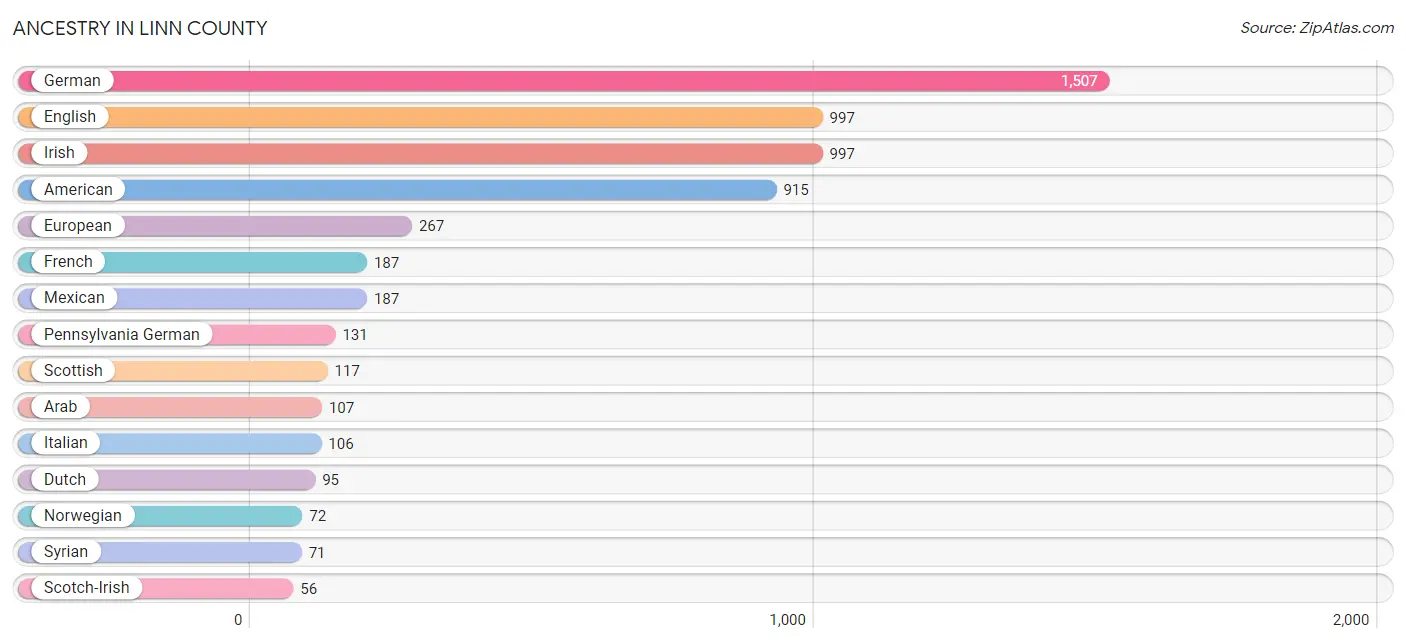
Ancestry in Linn County
The most populous ancestries reported in Linn County are German (1,507 | 12.7%), English (997 | 8.4%), Irish (997 | 8.4%), American (915 | 7.7%), and European (267 | 2.2%), together accounting for 39.4% of all Linn County residents.
| Ancestry | # Population | % Population |
| African | 3 | 0.0% |
| American | 915 | 7.7% |
| Arab | 107 | 0.9% |
| Austrian | 4 | 0.0% |
| Bhutanese | 7 | 0.1% |
| Blackfeet | 10 | 0.1% |
| British | 54 | 0.4% |
| Canadian | 1 | 0.0% |
| Celtic | 1 | 0.0% |
| Cherokee | 25 | 0.2% |
| Chippewa | 1 | 0.0% |
| Colombian | 29 | 0.2% |
| Croatian | 7 | 0.1% |
| Cuban | 5 | 0.0% |
| Czech | 17 | 0.1% |
| Czechoslovakian | 9 | 0.1% |
| Danish | 17 | 0.1% |
| Dutch | 95 | 0.8% |
| English | 997 | 8.4% |
| European | 267 | 2.2% |
| French | 187 | 1.6% |
| French Canadian | 12 | 0.1% |
| German | 1,507 | 12.7% |
| Hungarian | 12 | 0.1% |
| Iraqi | 36 | 0.3% |
| Irish | 997 | 8.4% |
| Iroquois | 2 | 0.0% |
| Italian | 106 | 0.9% |
| Korean | 18 | 0.2% |
| Laotian | 22 | 0.2% |
| Lithuanian | 7 | 0.1% |
| Malaysian | 2 | 0.0% |
| Mexican | 187 | 1.6% |
| Native Hawaiian | 2 | 0.0% |
| Navajo | 1 | 0.0% |
| Northern European | 2 | 0.0% |
| Norwegian | 72 | 0.6% |
| Pennsylvania German | 131 | 1.1% |
| Polish | 33 | 0.3% |
| Potawatomi | 1 | 0.0% |
| Puerto Rican | 27 | 0.2% |
| Russian | 11 | 0.1% |
| Scandinavian | 39 | 0.3% |
| Scotch-Irish | 56 | 0.5% |
| Scottish | 117 | 1.0% |
| Sioux | 24 | 0.2% |
| Slavic | 2 | 0.0% |
| Slovak | 2 | 0.0% |
| South American | 29 | 0.2% |
| Spaniard | 2 | 0.0% |
| Spanish | 7 | 0.1% |
| Sri Lankan | 12 | 0.1% |
| Subsaharan African | 3 | 0.0% |
| Swedish | 50 | 0.4% |
| Swiss | 20 | 0.2% |
| Syrian | 71 | 0.6% |
| Welsh | 45 | 0.4% | View All 57 Rows |
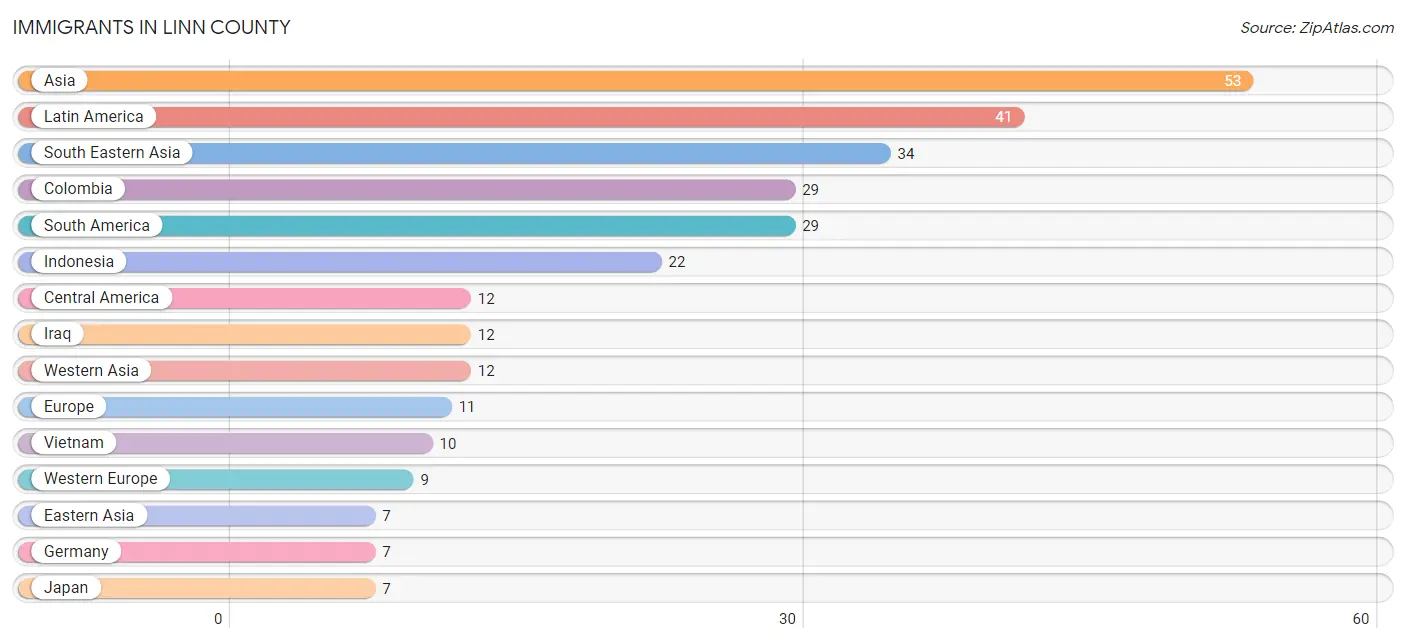
Immigrants in Linn County
The most numerous immigrant groups reported in Linn County came from Asia (53 | 0.4%), Latin America (41 | 0.3%), South Eastern Asia (34 | 0.3%), Colombia (29 | 0.2%), and South America (29 | 0.2%), together accounting for 1.6% of all Linn County residents.
| Immigration Origin | # Population | % Population |
| Asia | 53 | 0.4% |
| Canada | 1 | 0.0% |
| Central America | 12 | 0.1% |
| Colombia | 29 | 0.2% |
| Eastern Asia | 7 | 0.1% |
| El Salvador | 4 | 0.0% |
| England | 2 | 0.0% |
| Europe | 11 | 0.1% |
| France | 2 | 0.0% |
| Germany | 7 | 0.1% |
| Guatemala | 3 | 0.0% |
| Indonesia | 22 | 0.2% |
| Iraq | 12 | 0.1% |
| Japan | 7 | 0.1% |
| Laos | 1 | 0.0% |
| Latin America | 41 | 0.3% |
| Mexico | 5 | 0.0% |
| Micronesia | 1 | 0.0% |
| Northern Europe | 2 | 0.0% |
| Oceania | 1 | 0.0% |
| South America | 29 | 0.2% |
| South Eastern Asia | 34 | 0.3% |
| Thailand | 1 | 0.0% |
| Vietnam | 10 | 0.1% |
| Western Asia | 12 | 0.1% |
| Western Europe | 9 | 0.1% | View All 26 Rows |
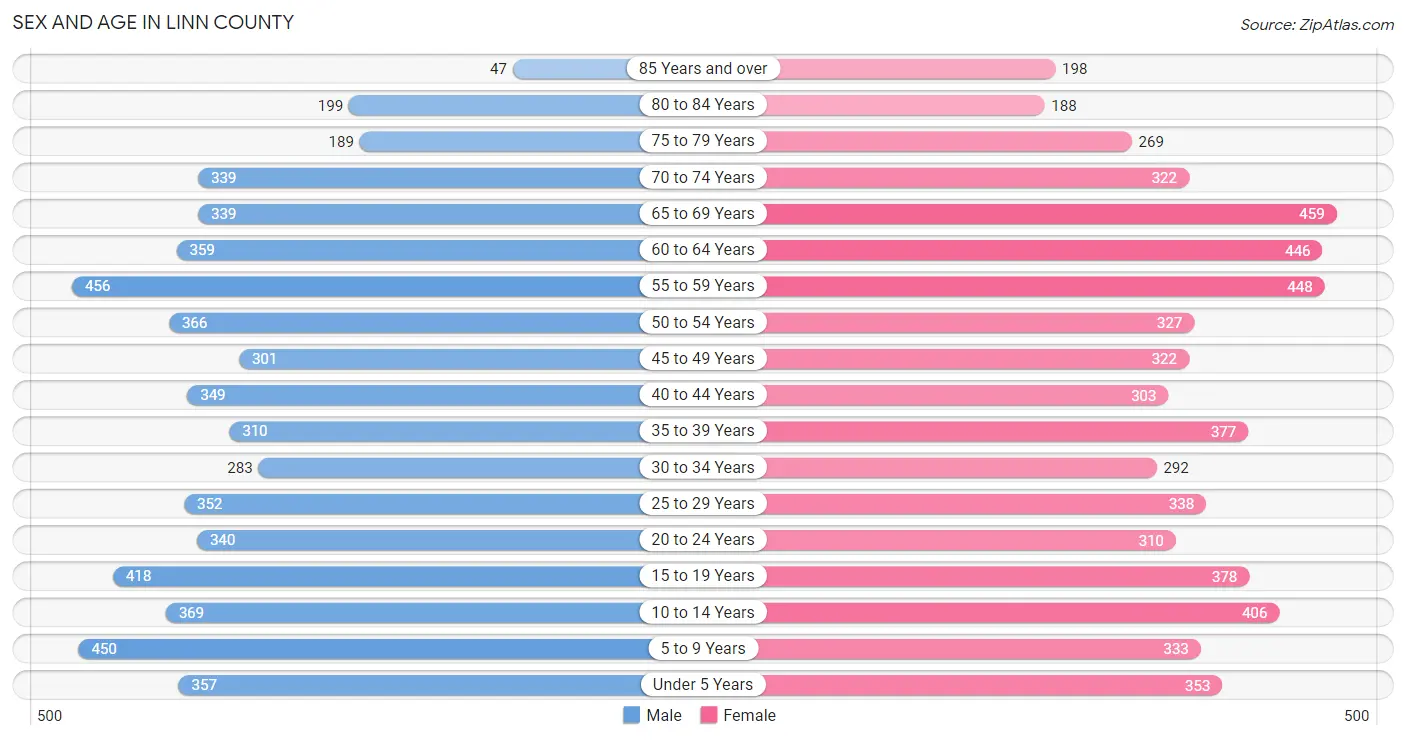
Sex and Age in Linn County
Sex and Age in Linn County
The most populous age groups in Linn County are 55 to 59 Years (456 | 7.8%) for men and 65 to 69 Years (459 | 7.6%) for women.
| Age Bracket | Male | Female |
| Under 5 Years | 357 (6.1%) | 353 (5.8%) |
| 5 to 9 Years | 450 (7.7%) | 333 (5.5%) |
| 10 to 14 Years | 369 (6.3%) | 406 (6.7%) |
| 15 to 19 Years | 418 (7.2%) | 378 (6.2%) |
| 20 to 24 Years | 340 (5.8%) | 310 (5.1%) |
| 25 to 29 Years | 352 (6.0%) | 338 (5.6%) |
| 30 to 34 Years | 283 (4.9%) | 292 (4.8%) |
| 35 to 39 Years | 310 (5.3%) | 377 (6.2%) |
| 40 to 44 Years | 349 (6.0%) | 303 (5.0%) |
| 45 to 49 Years | 301 (5.2%) | 322 (5.3%) |
| 50 to 54 Years | 366 (6.3%) | 327 (5.4%) |
| 55 to 59 Years | 456 (7.8%) | 448 (7.4%) |
| 60 to 64 Years | 359 (6.2%) | 446 (7.3%) |
| 65 to 69 Years | 339 (5.8%) | 459 (7.6%) |
| 70 to 74 Years | 339 (5.8%) | 322 (5.3%) |
| 75 to 79 Years | 189 (3.3%) | 269 (4.4%) |
| 80 to 84 Years | 199 (3.4%) | 188 (3.1%) |
| 85 Years and over | 47 (0.8%) | 198 (3.3%) |
| Total | 5,823 (100.0%) | 6,069 (100.0%) |
Families and Households in Linn County
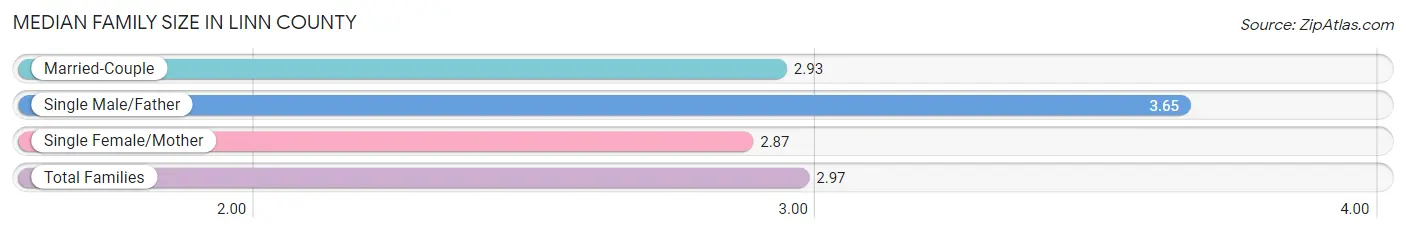
Median Family Size in Linn County
The median family size in Linn County is 2.97 persons per family, with single male/father families (198 | 6.1%) accounting for the largest median family size of 3.65 persons per family. On the other hand, single female/mother families (449 | 13.8%) represent the smallest median family size with 2.87 persons per family.
| Family Type | # Families | Family Size |
| Married-Couple | 2,598 (80.1%) | 2.93 |
| Single Male/Father | 198 (6.1%) | 3.65 |
| Single Female/Mother | 449 (13.8%) | 2.87 |
| Total Families | 3,245 (100.0%) | 2.97 |
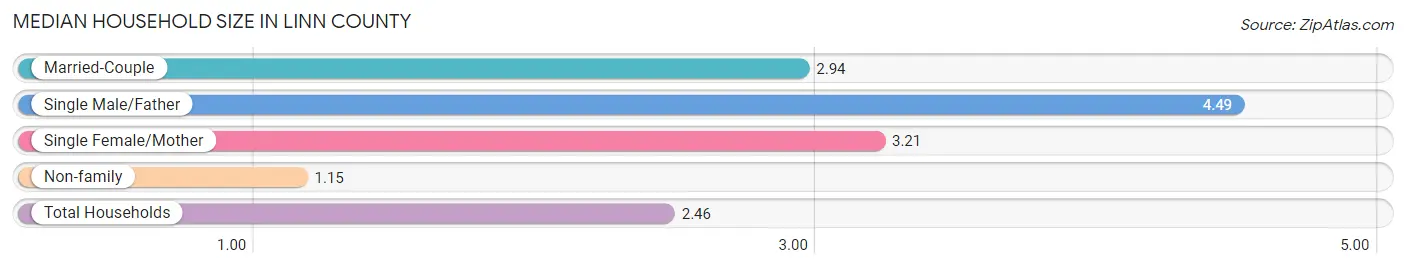
Median Household Size in Linn County
The median household size in Linn County is 2.46 persons per household, with single male/father households (198 | 4.2%) accounting for the largest median household size of 4.49 persons per household. non-family households (1,528 | 32.0%) represent the smallest median household size with 1.15 persons per household.
| Household Type | # Households | Household Size |
| Married-Couple | 2,598 (54.4%) | 2.94 |
| Single Male/Father | 198 (4.2%) | 4.49 |
| Single Female/Mother | 449 (9.4%) | 3.21 |
| Non-family | 1,528 (32.0%) | 1.15 |
| Total Households | 4,773 (100.0%) | 2.46 |
Household Size by Marriage Status in Linn County
Out of a total of 4,773 households in Linn County, 3,245 (68.0%) are family households, while 1,528 (32.0%) are nonfamily households. The most numerous type of family households are 2-person households, comprising 1,649, and the most common type of nonfamily households are 1-person households, comprising 1,344.
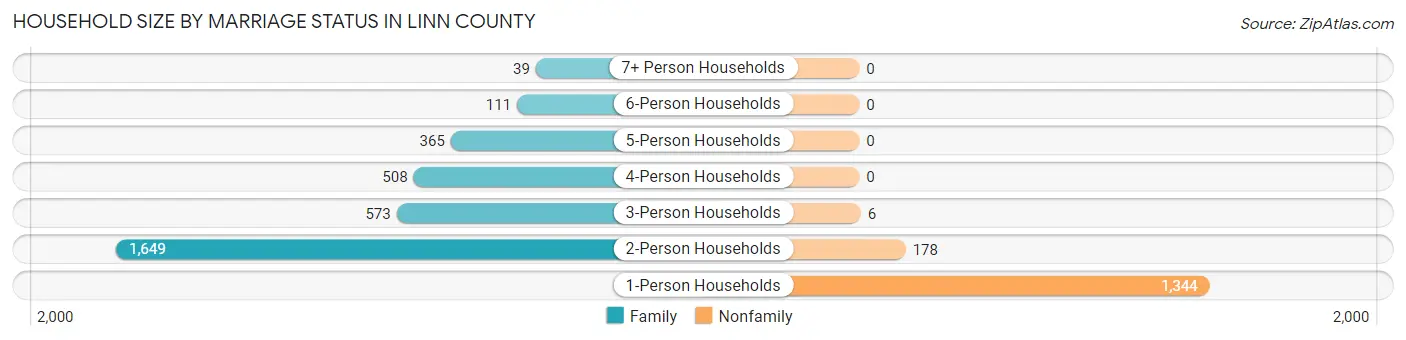
| Household Size | Family Households | Nonfamily Households |
| 1-Person Households | - | 1,344 (28.2%) |
| 2-Person Households | 1,649 (34.5%) | 178 (3.7%) |
| 3-Person Households | 573 (12.0%) | 6 (0.1%) |
| 4-Person Households | 508 (10.6%) | 0 (0.0%) |
| 5-Person Households | 365 (7.6%) | 0 (0.0%) |
| 6-Person Households | 111 (2.3%) | 0 (0.0%) |
| 7+ Person Households | 39 (0.8%) | 0 (0.0%) |
| Total | 3,245 (68.0%) | 1,528 (32.0%) |
Female Fertility in Linn County
Fertility by Age in Linn County
Average fertility rate in Linn County is 51.0 births per 1,000 women. Women in the age bracket of 20 to 34 years have the highest fertility rate with 88.0 births per 1,000 women. Women in the age bracket of 20 to 34 years acount for 69.2% of all women with births.
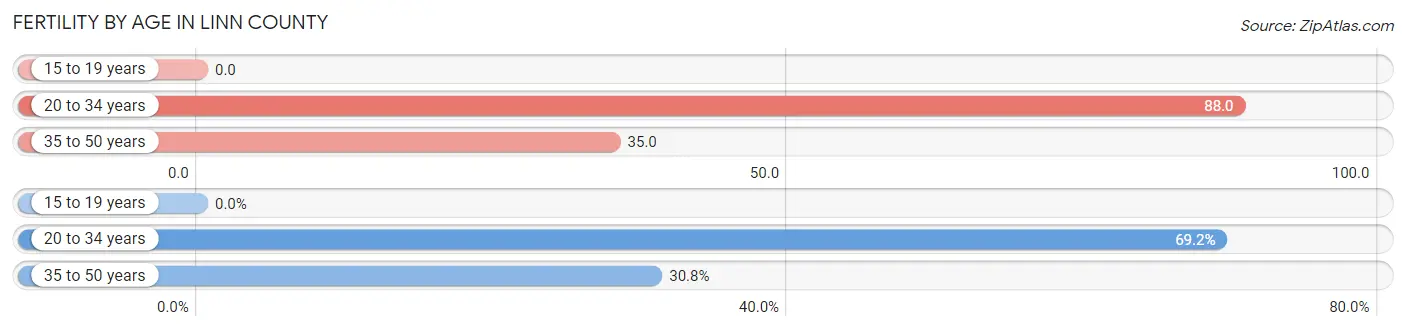
| Age Bracket | Women with Births | Births / 1,000 Women |
| 15 to 19 years | 0 (0.0%) | 0.0 |
| 20 to 34 years | 83 (69.2%) | 88.0 |
| 35 to 50 years | 37 (30.8%) | 35.0 |
| Total | 120 (100.0%) | 51.0 |
Fertility by Age by Marriage Status in Linn County
81.7% of women with births (120) in Linn County are married. The highest percentage of unmarried women with births falls into 35 to 50 years age bracket with 51.3% of them unmarried at the time of birth, while the lowest percentage of unmarried women with births belong to 20 to 34 years age bracket with 3.6% of them unmarried.
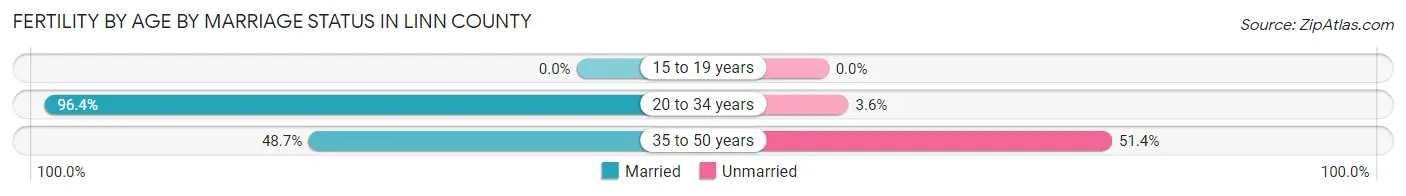
| Age Bracket | Married | Unmarried |
| 15 to 19 years | 0 (0.0%) | 0 (0.0%) |
| 20 to 34 years | 80 (96.4%) | 3 (3.6%) |
| 35 to 50 years | 18 (48.6%) | 19 (51.3%) |
| Total | 98 (81.7%) | 22 (18.3%) |
Fertility by Education in Linn County
Average fertility rate in Linn County is 51.0 births per 1,000 women. Women with the education attainment of graduate degree have the highest fertility rate of 182.0 births per 1,000 women, while women with the education attainment of less than high school have the lowest fertility at 19.0 births per 1,000 women. Women with the education attainment of graduate degree represent 35.0% of all women with births.
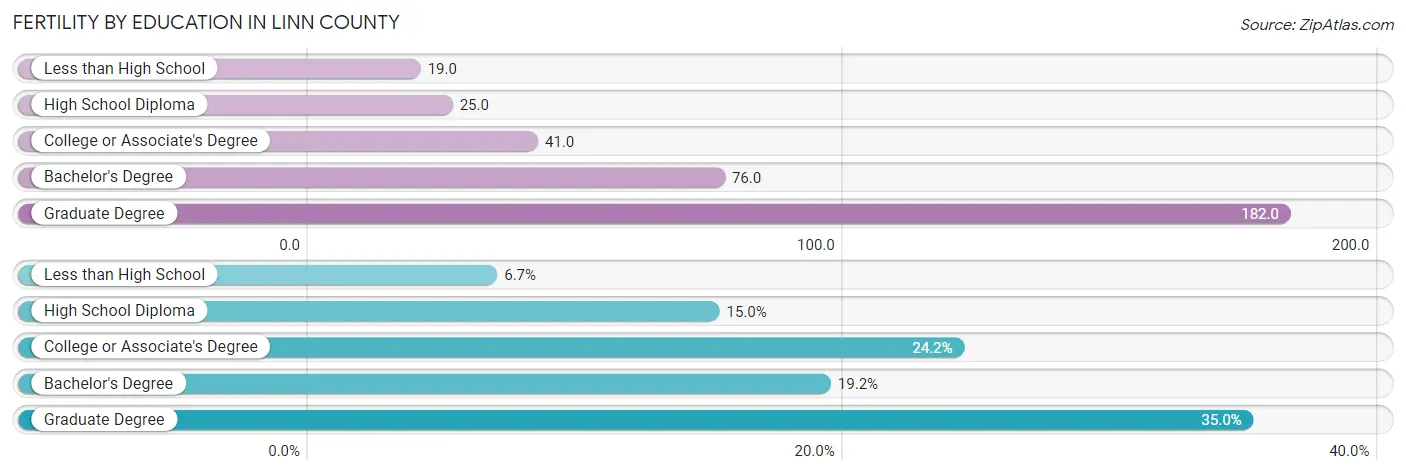
| Educational Attainment | Women with Births | Births / 1,000 Women |
| Less than High School | 8 (6.7%) | 19.0 |
| High School Diploma | 18 (15.0%) | 25.0 |
| College or Associate's Degree | 29 (24.2%) | 41.0 |
| Bachelor's Degree | 23 (19.2%) | 76.0 |
| Graduate Degree | 42 (35.0%) | 182.0 |
| Total | 120 (100.0%) | 51.0 |
Fertility by Education by Marriage Status in Linn County
18.3% of women with births in Linn County are unmarried. Women with the educational attainment of less than high school are most likely to be married with 100.0% of them married at childbirth, while women with the educational attainment of high school diploma are least likely to be married with 66.7% of them unmarried at childbirth.
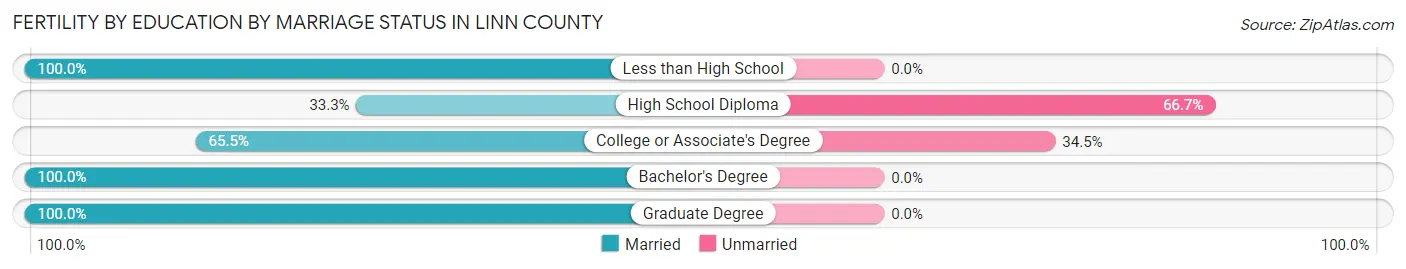
| Educational Attainment | Married | Unmarried |
| Less than High School | 8 (100.0%) | 0 (0.0%) |
| High School Diploma | 6 (33.3%) | 12 (66.7%) |
| College or Associate's Degree | 19 (65.5%) | 10 (34.5%) |
| Bachelor's Degree | 23 (100.0%) | 0 (0.0%) |
| Graduate Degree | 42 (100.0%) | 0 (0.0%) |
| Total | 98 (81.7%) | 22 (18.3%) |
Employment Characteristics in Linn County
Employment by Class of Employer in Linn County
Among the 5,457 employed individuals in Linn County, private company employees (3,176 | 58.2%), self-employed (not incorporated) (558 | 10.2%), and local government employees (495 | 9.1%) make up the most common classes of employment.
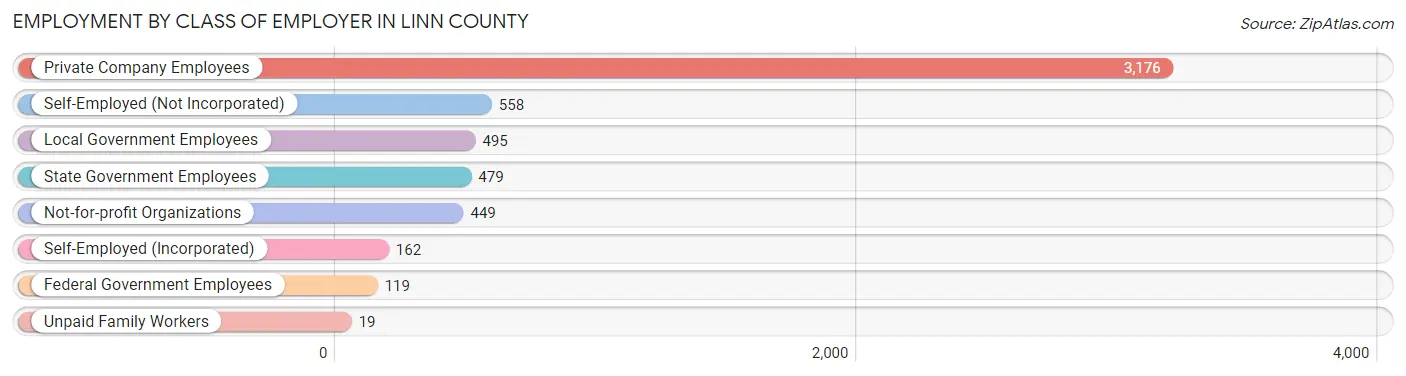
| Employer Class | # Employees | % Employees |
| Private Company Employees | 3,176 | 58.2% |
| Self-Employed (Incorporated) | 162 | 3.0% |
| Self-Employed (Not Incorporated) | 558 | 10.2% |
| Not-for-profit Organizations | 449 | 8.2% |
| Local Government Employees | 495 | 9.1% |
| State Government Employees | 479 | 8.8% |
| Federal Government Employees | 119 | 2.2% |
| Unpaid Family Workers | 19 | 0.4% |
| Total | 5,457 | 100.0% |
Employment Status by Age in Linn County
According to the labor force statistics for Linn County, out of the total population over 16 years of age (9,517), 59.7% or 5,682 individuals are in the labor force, with 2.8% or 159 of them unemployed. The age group with the highest labor force participation rate is 35 to 44 years, with 91.2% or 1,221 individuals in the labor force. Within the labor force, the 16 to 19 years age range has the highest percentage of unemployed individuals, with 9.6% or 26 of them being unemployed.
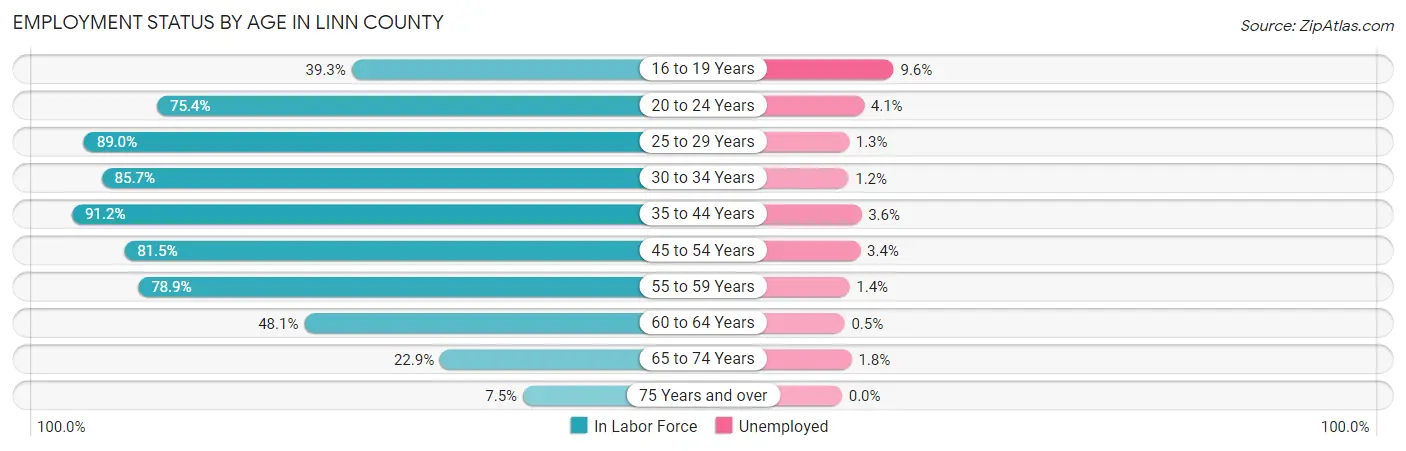
| Age Bracket | In Labor Force | Unemployed |
| 16 to 19 Years | 271 (39.3%) | 26 (9.6%) |
| 20 to 24 Years | 490 (75.4%) | 20 (4.1%) |
| 25 to 29 Years | 614 (89.0%) | 8 (1.3%) |
| 30 to 34 Years | 493 (85.7%) | 6 (1.2%) |
| 35 to 44 Years | 1,221 (91.2%) | 44 (3.6%) |
| 45 to 54 Years | 1,073 (81.5%) | 36 (3.4%) |
| 55 to 59 Years | 713 (78.9%) | 10 (1.4%) |
| 60 to 64 Years | 387 (48.1%) | 2 (0.5%) |
| 65 to 74 Years | 334 (22.9%) | 6 (1.8%) |
| 75 Years and over | 82 (7.5%) | 0 (0.0%) |
| Total | 5,682 (59.7%) | 159 (2.8%) |
Employment Status by Educational Attainment in Linn County
According to labor force statistics for Linn County, 80.0% of individuals (4,503) out of the total population between 25 and 64 years of age (5,629) are in the labor force, with 2.4% or 108 of them being unemployed. The group with the highest labor force participation rate are those with the educational attainment of bachelor's degree or higher, with 89.1% or 1,095 individuals in the labor force. Within the labor force, individuals with high school diploma education have the highest percentage of unemployment, with 3.7% or 69 of them being unemployed.
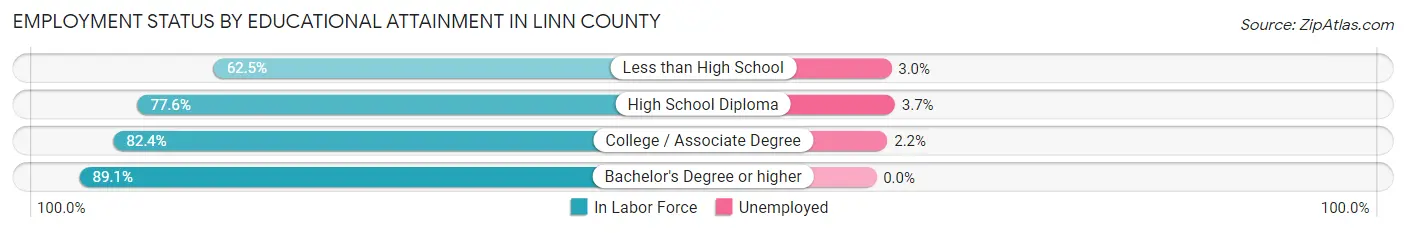
| Educational Attainment | In Labor Force | Unemployed |
| Less than High School | 330 (62.5%) | 16 (3.0%) |
| High School Diploma | 1,864 (77.6%) | 89 (3.7%) |
| College / Associate Degree | 1,211 (82.4%) | 32 (2.2%) |
| Bachelor's Degree or higher | 1,095 (89.1%) | 0 (0.0%) |
| Total | 4,503 (80.0%) | 135 (2.4%) |
Employment Occupations by Sex in Linn County
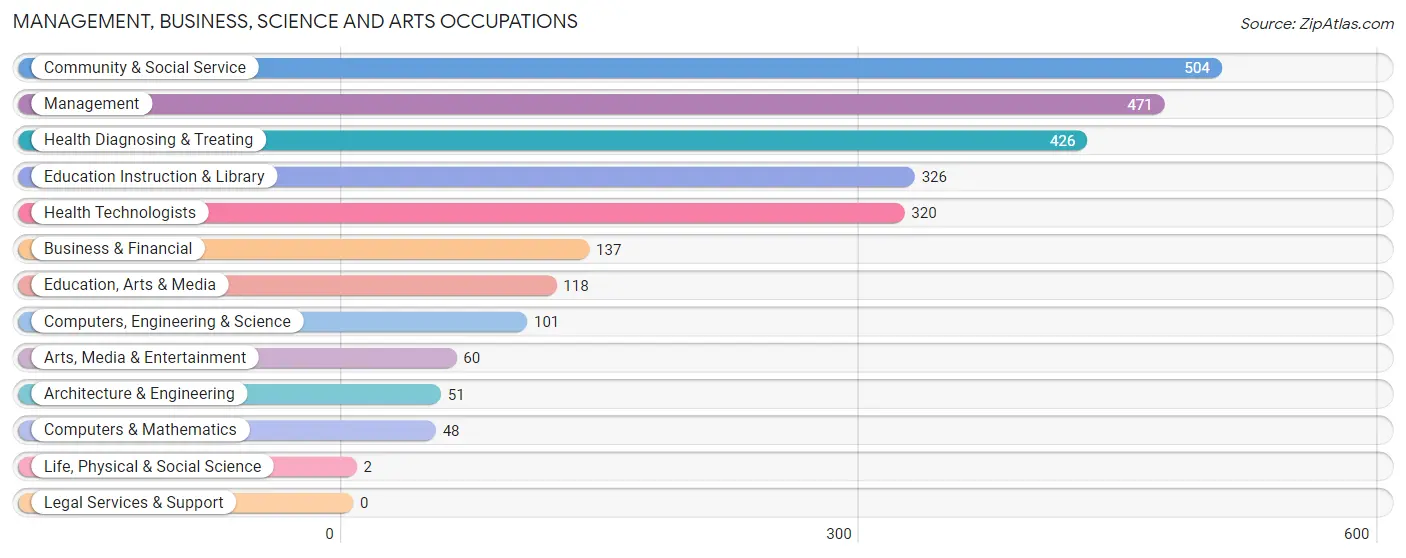
Management, Business, Science and Arts Occupations
The most common Management, Business, Science and Arts occupations in Linn County are Community & Social Service (504 | 9.1%), Management (471 | 8.5%), Health Diagnosing & Treating (426 | 7.7%), Education Instruction & Library (326 | 5.9%), and Health Technologists (320 | 5.8%).
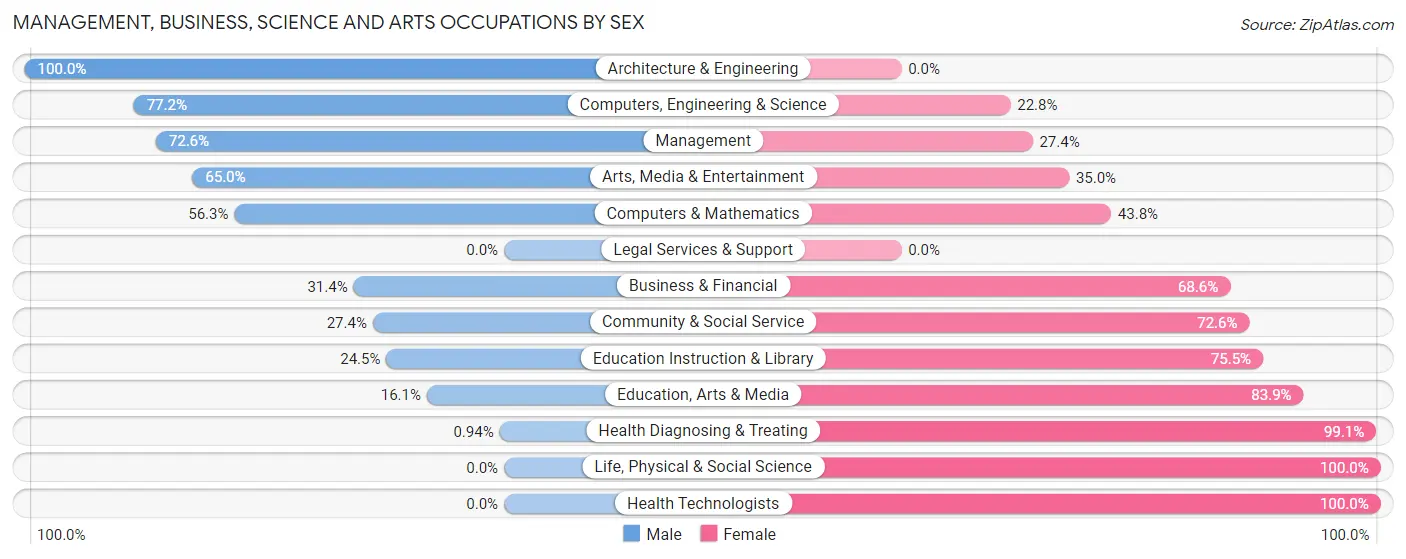
Management, Business, Science and Arts Occupations by Sex
Within the Management, Business, Science and Arts occupations in Linn County, the most male-oriented occupations are Architecture & Engineering (100.0%), Computers, Engineering & Science (77.2%), and Management (72.6%), while the most female-oriented occupations are Life, Physical & Social Science (100.0%), Health Technologists (100.0%), and Health Diagnosing & Treating (99.1%).
| Occupation | Male | Female |
| Management | 342 (72.6%) | 129 (27.4%) |
| Business & Financial | 43 (31.4%) | 94 (68.6%) |
| Computers, Engineering & Science | 78 (77.2%) | 23 (22.8%) |
| Computers & Mathematics | 27 (56.2%) | 21 (43.8%) |
| Architecture & Engineering | 51 (100.0%) | 0 (0.0%) |
| Life, Physical & Social Science | 0 (0.0%) | 2 (100.0%) |
| Community & Social Service | 138 (27.4%) | 366 (72.6%) |
| Education, Arts & Media | 19 (16.1%) | 99 (83.9%) |
| Legal Services & Support | 0 (0.0%) | 0 (0.0%) |
| Education Instruction & Library | 80 (24.5%) | 246 (75.5%) |
| Arts, Media & Entertainment | 39 (65.0%) | 21 (35.0%) |
| Health Diagnosing & Treating | 4 (0.9%) | 422 (99.1%) |
| Health Technologists | 0 (0.0%) | 320 (100.0%) |
| Total (Category) | 605 (36.9%) | 1,034 (63.1%) |
| Total (Overall) | 2,882 (52.3%) | 2,631 (47.7%) |
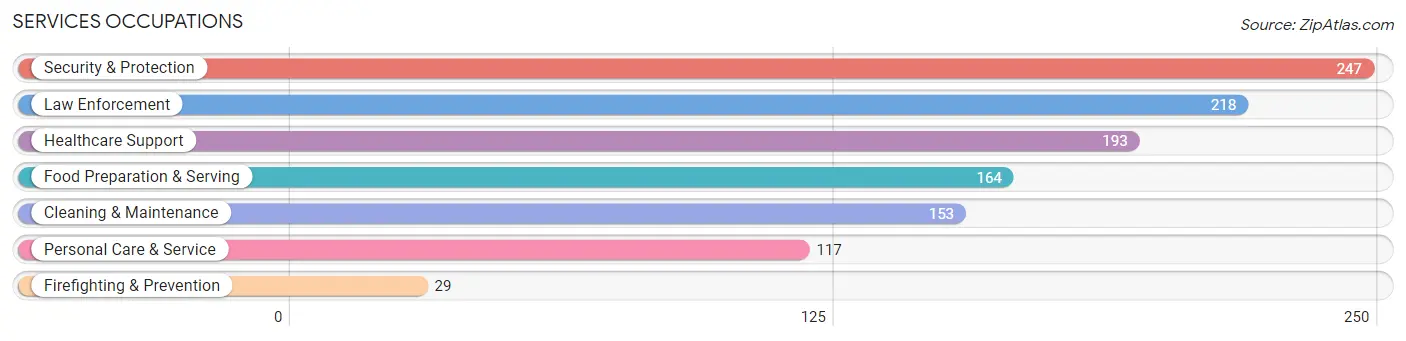
Services Occupations
The most common Services occupations in Linn County are Security & Protection (247 | 4.5%), Law Enforcement (218 | 4.0%), Healthcare Support (193 | 3.5%), Food Preparation & Serving (164 | 3.0%), and Cleaning & Maintenance (153 | 2.8%).
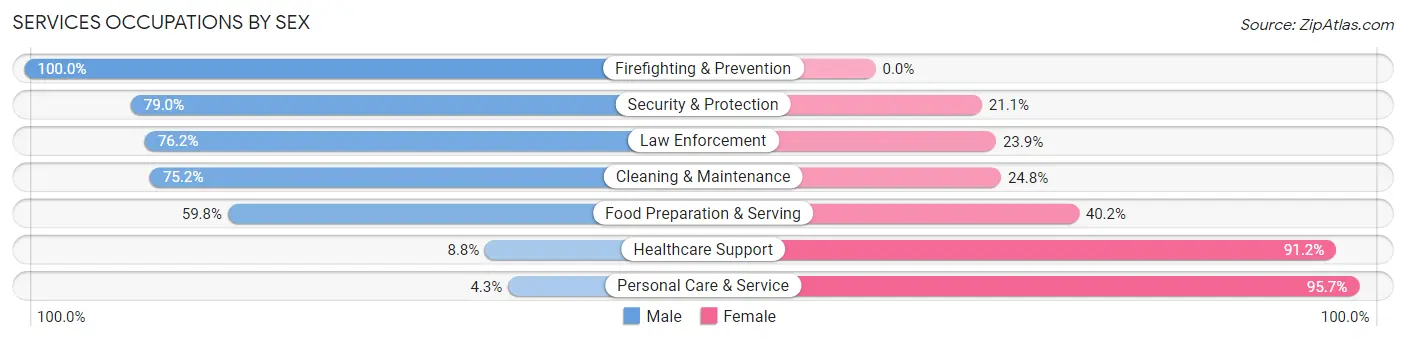
Services Occupations by Sex
Within the Services occupations in Linn County, the most male-oriented occupations are Firefighting & Prevention (100.0%), Security & Protection (78.9%), and Law Enforcement (76.1%), while the most female-oriented occupations are Personal Care & Service (95.7%), Healthcare Support (91.2%), and Food Preparation & Serving (40.2%).
| Occupation | Male | Female |
| Healthcare Support | 17 (8.8%) | 176 (91.2%) |
| Security & Protection | 195 (78.9%) | 52 (21.0%) |
| Firefighting & Prevention | 29 (100.0%) | 0 (0.0%) |
| Law Enforcement | 166 (76.1%) | 52 (23.8%) |
| Food Preparation & Serving | 98 (59.8%) | 66 (40.2%) |
| Cleaning & Maintenance | 115 (75.2%) | 38 (24.8%) |
| Personal Care & Service | 5 (4.3%) | 112 (95.7%) |
| Total (Category) | 430 (49.2%) | 444 (50.8%) |
| Total (Overall) | 2,882 (52.3%) | 2,631 (47.7%) |
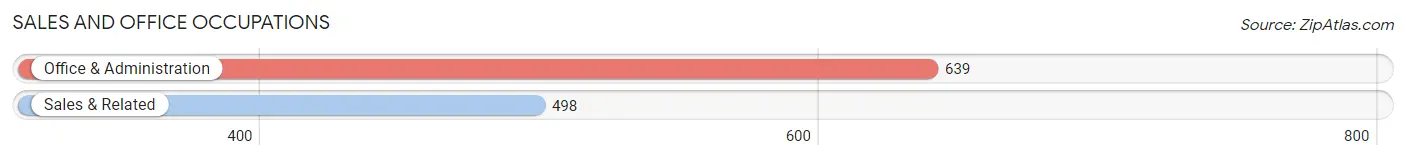
Sales and Office Occupations
The most common Sales and Office occupations in Linn County are Office & Administration (639 | 11.6%), and Sales & Related (498 | 9.0%).
Sales and Office Occupations by Sex
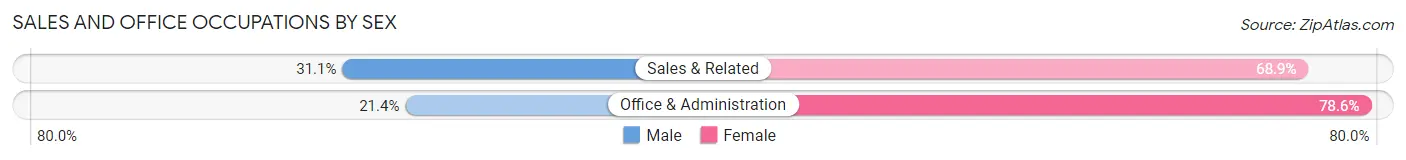
| Occupation | Male | Female |
| Sales & Related | 155 (31.1%) | 343 (68.9%) |
| Office & Administration | 137 (21.4%) | 502 (78.6%) |
| Total (Category) | 292 (25.7%) | 845 (74.3%) |
| Total (Overall) | 2,882 (52.3%) | 2,631 (47.7%) |
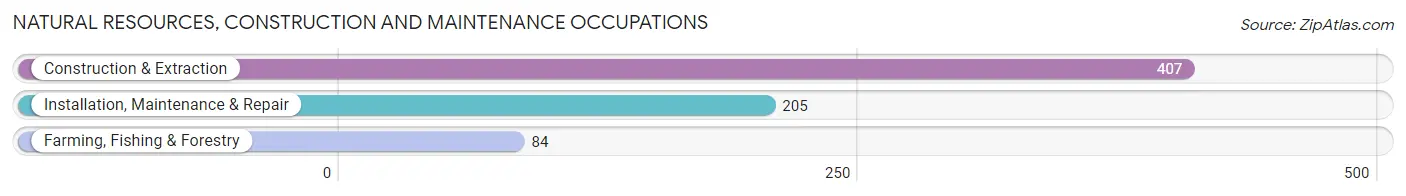
Natural Resources, Construction and Maintenance Occupations
The most common Natural Resources, Construction and Maintenance occupations in Linn County are Construction & Extraction (407 | 7.4%), Installation, Maintenance & Repair (205 | 3.7%), and Farming, Fishing & Forestry (84 | 1.5%).
Natural Resources, Construction and Maintenance Occupations by Sex
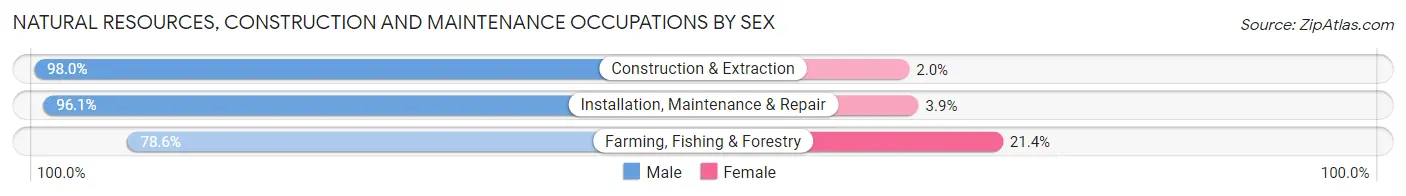
| Occupation | Male | Female |
| Farming, Fishing & Forestry | 66 (78.6%) | 18 (21.4%) |
| Construction & Extraction | 399 (98.0%) | 8 (2.0%) |
| Installation, Maintenance & Repair | 197 (96.1%) | 8 (3.9%) |
| Total (Category) | 662 (95.1%) | 34 (4.9%) |
| Total (Overall) | 2,882 (52.3%) | 2,631 (47.7%) |
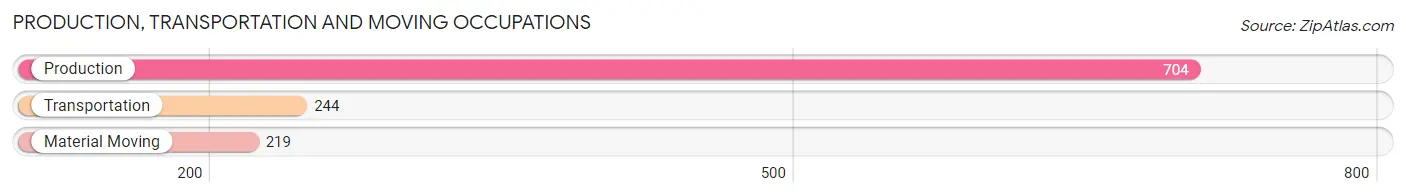
Production, Transportation and Moving Occupations
The most common Production, Transportation and Moving occupations in Linn County are Production (704 | 12.8%), Transportation (244 | 4.4%), and Material Moving (219 | 4.0%).
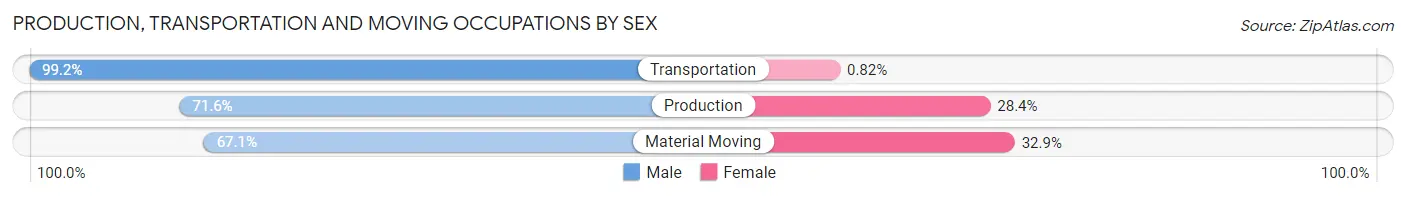
Production, Transportation and Moving Occupations by Sex
| Occupation | Male | Female |
| Production | 504 (71.6%) | 200 (28.4%) |
| Transportation | 242 (99.2%) | 2 (0.8%) |
| Material Moving | 147 (67.1%) | 72 (32.9%) |
| Total (Category) | 893 (76.5%) | 274 (23.5%) |
| Total (Overall) | 2,882 (52.3%) | 2,631 (47.7%) |
Employment Industries by Sex in Linn County
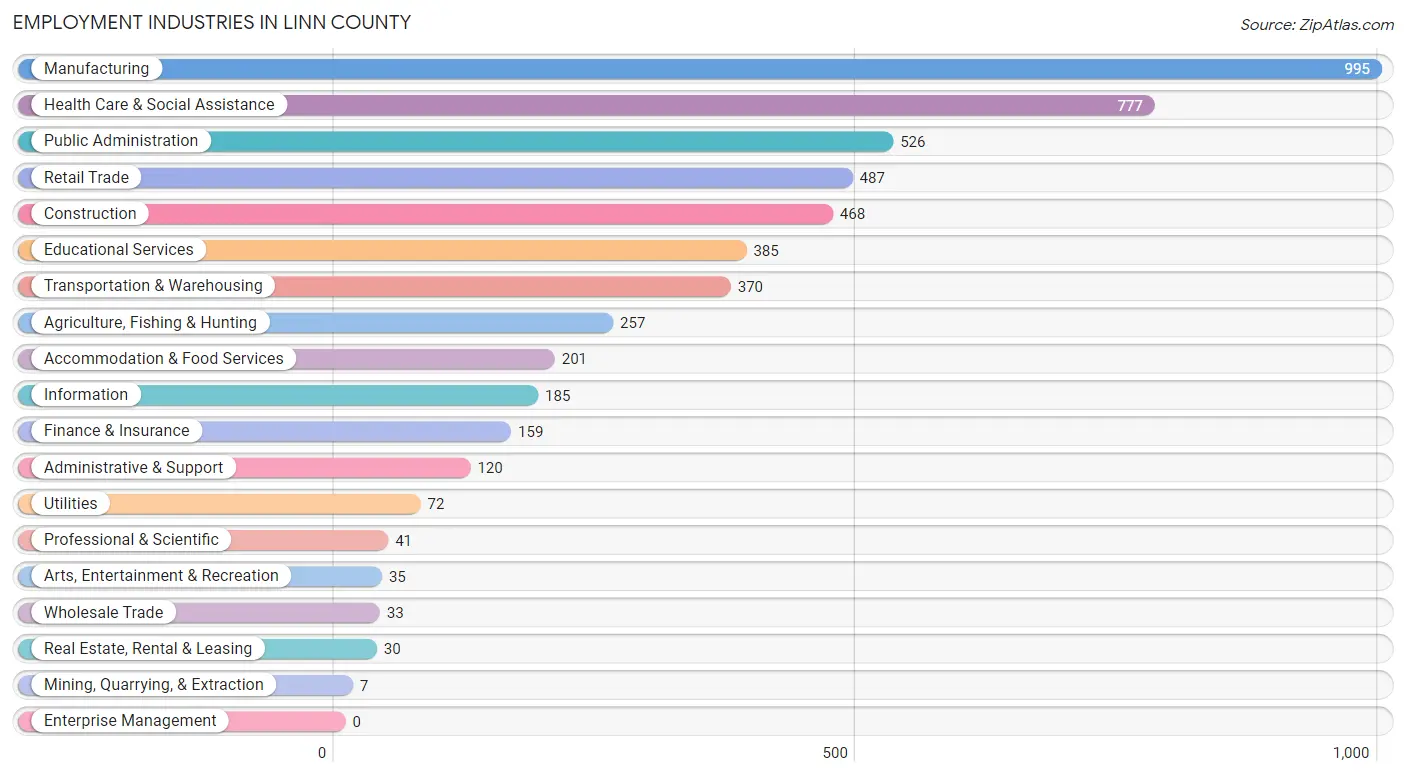
Employment Industries in Linn County
The major employment industries in Linn County include Manufacturing (995 | 18.0%), Health Care & Social Assistance (777 | 14.1%), Public Administration (526 | 9.5%), Retail Trade (487 | 8.8%), and Construction (468 | 8.5%).
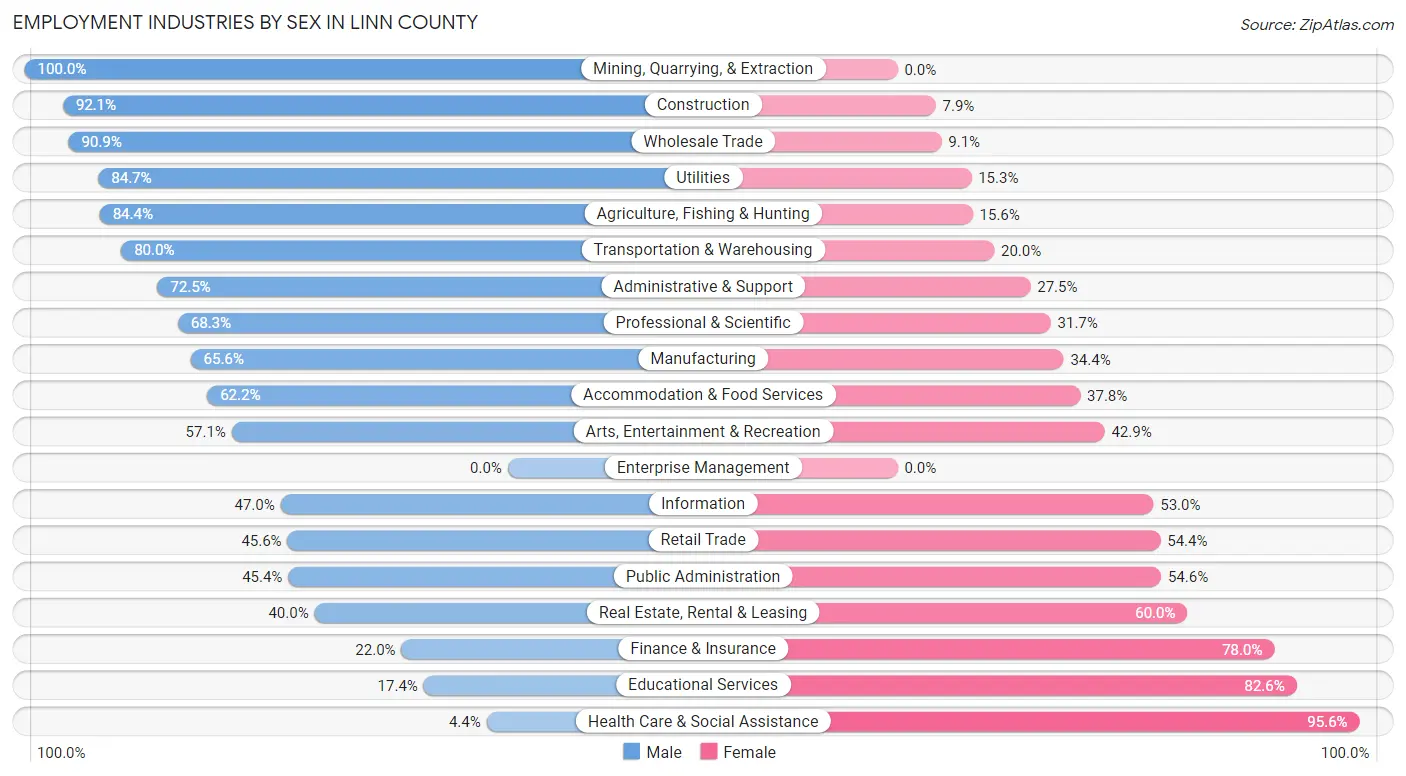
Employment Industries by Sex in Linn County
The Linn County industries that see more men than women are Mining, Quarrying, & Extraction (100.0%), Construction (92.1%), and Wholesale Trade (90.9%), whereas the industries that tend to have a higher number of women are Health Care & Social Assistance (95.6%), Educational Services (82.6%), and Finance & Insurance (78.0%).
| Industry | Male | Female |
| Agriculture, Fishing & Hunting | 217 (84.4%) | 40 (15.6%) |
| Mining, Quarrying, & Extraction | 7 (100.0%) | 0 (0.0%) |
| Construction | 431 (92.1%) | 37 (7.9%) |
| Manufacturing | 653 (65.6%) | 342 (34.4%) |
| Wholesale Trade | 30 (90.9%) | 3 (9.1%) |
| Retail Trade | 222 (45.6%) | 265 (54.4%) |
| Transportation & Warehousing | 296 (80.0%) | 74 (20.0%) |
| Utilities | 61 (84.7%) | 11 (15.3%) |
| Information | 87 (47.0%) | 98 (53.0%) |
| Finance & Insurance | 35 (22.0%) | 124 (78.0%) |
| Real Estate, Rental & Leasing | 12 (40.0%) | 18 (60.0%) |
| Professional & Scientific | 28 (68.3%) | 13 (31.7%) |
| Enterprise Management | 0 (0.0%) | 0 (0.0%) |
| Administrative & Support | 87 (72.5%) | 33 (27.5%) |
| Educational Services | 67 (17.4%) | 318 (82.6%) |
| Health Care & Social Assistance | 34 (4.4%) | 743 (95.6%) |
| Arts, Entertainment & Recreation | 20 (57.1%) | 15 (42.9%) |
| Accommodation & Food Services | 125 (62.2%) | 76 (37.8%) |
| Public Administration | 239 (45.4%) | 287 (54.6%) |
| Total | 2,882 (52.3%) | 2,631 (47.7%) |
Education in Linn County
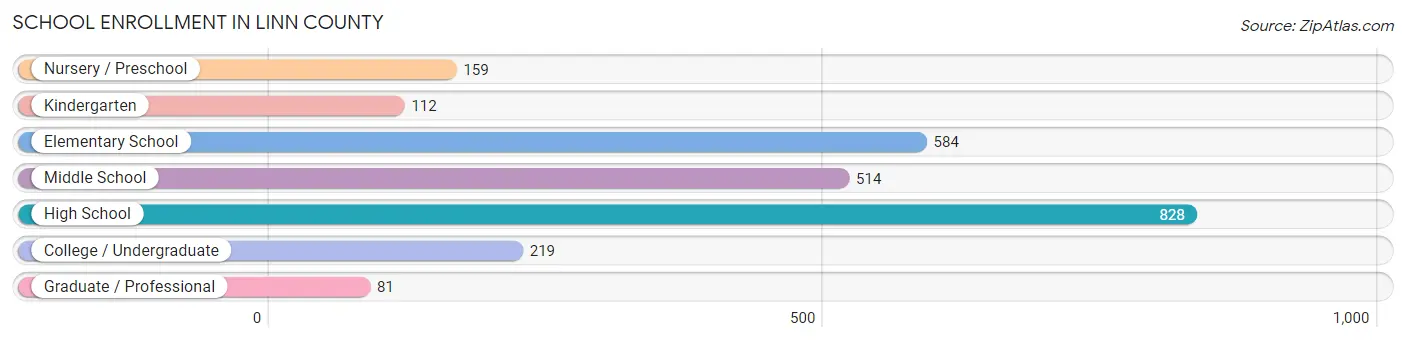
School Enrollment in Linn County
The most common levels of schooling among the 2,497 students in Linn County are high school (828 | 33.2%), elementary school (584 | 23.4%), and middle school (514 | 20.6%).
| School Level | # Students | % Students |
| Nursery / Preschool | 159 | 6.4% |
| Kindergarten | 112 | 4.5% |
| Elementary School | 584 | 23.4% |
| Middle School | 514 | 20.6% |
| High School | 828 | 33.2% |
| College / Undergraduate | 219 | 8.8% |
| Graduate / Professional | 81 | 3.2% |
| Total | 2,497 | 100.0% |
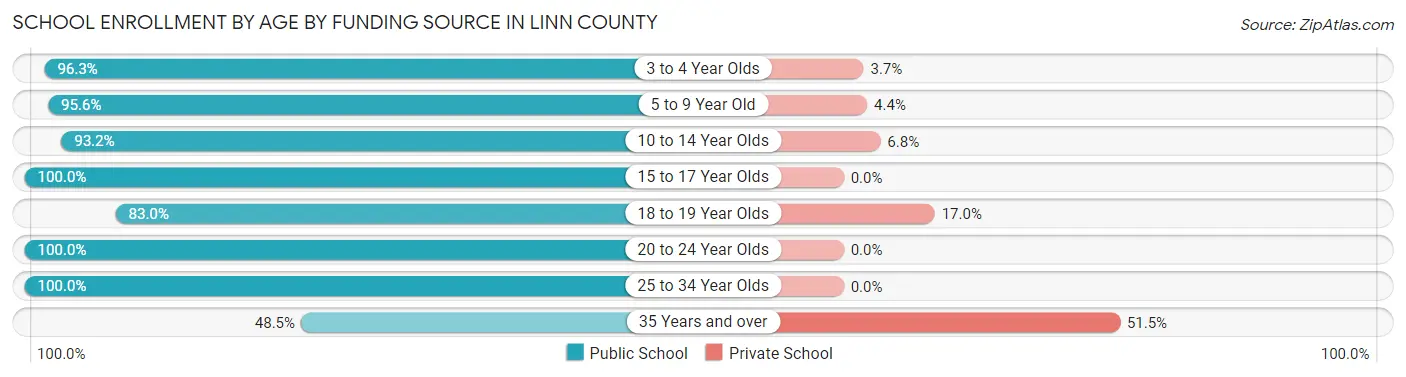
School Enrollment by Age by Funding Source in Linn County
Out of a total of 2,497 students who are enrolled in schools in Linn County, 175 (7.0%) attend a private institution, while the remaining 2,322 (93.0%) are enrolled in public schools. The age group of 35 years and over has the highest likelihood of being enrolled in private schools, with 53 (51.5% in the age bracket) enrolled. Conversely, the age group of 15 to 17 year olds has the lowest likelihood of being enrolled in a private school, with 508 (100.0% in the age bracket) attending a public institution.
| Age Bracket | Public School | Private School |
| 3 to 4 Year Olds | 130 (96.3%) | 5 (3.7%) |
| 5 to 9 Year Old | 701 (95.6%) | 32 (4.4%) |
| 10 to 14 Year Olds | 627 (93.2%) | 46 (6.8%) |
| 15 to 17 Year Olds | 508 (100.0%) | 0 (0.0%) |
| 18 to 19 Year Olds | 191 (83.0%) | 39 (17.0%) |
| 20 to 24 Year Olds | 95 (100.0%) | 0 (0.0%) |
| 25 to 34 Year Olds | 20 (100.0%) | 0 (0.0%) |
| 35 Years and over | 50 (48.5%) | 53 (51.5%) |
| Total | 2,322 (93.0%) | 175 (7.0%) |
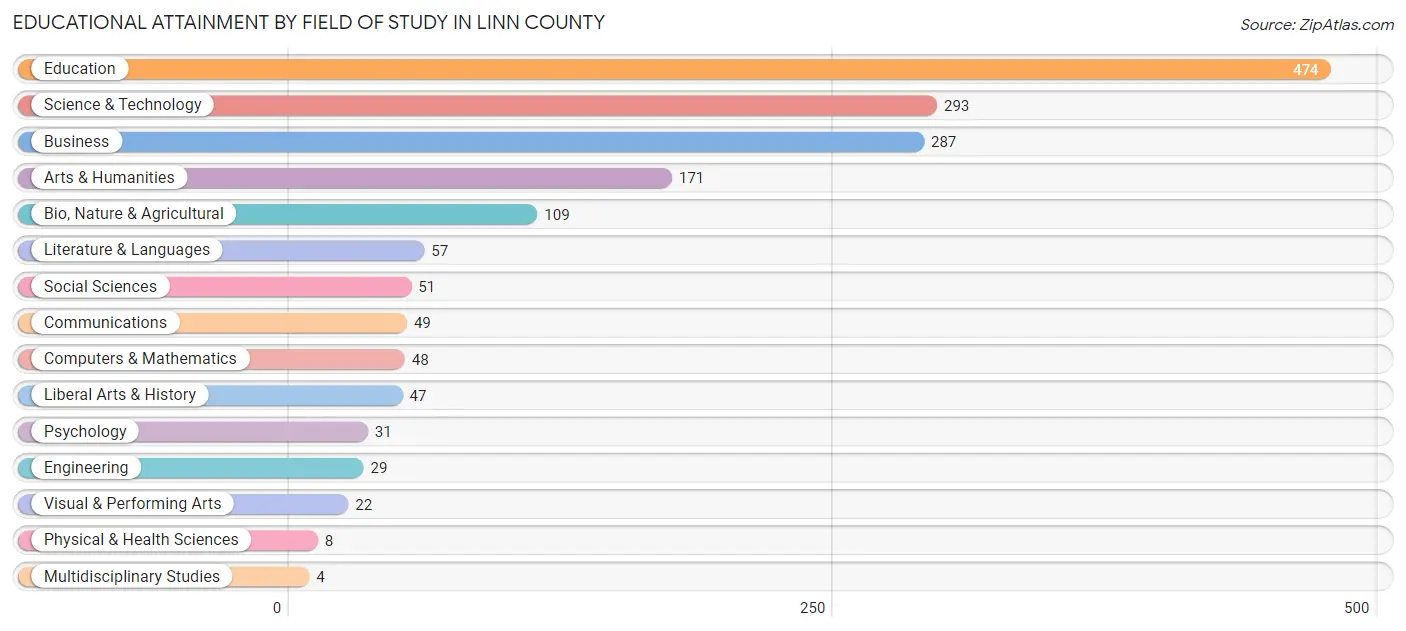
Educational Attainment by Field of Study in Linn County
Education (474 | 28.2%), science & technology (293 | 17.4%), business (287 | 17.1%), arts & humanities (171 | 10.2%), and bio, nature & agricultural (109 | 6.5%) are the most common fields of study among 1,680 individuals in Linn County who have obtained a bachelor's degree or higher.
| Field of Study | # Graduates | % Graduates |
| Computers & Mathematics | 48 | 2.9% |
| Bio, Nature & Agricultural | 109 | 6.5% |
| Physical & Health Sciences | 8 | 0.5% |
| Psychology | 31 | 1.8% |
| Social Sciences | 51 | 3.0% |
| Engineering | 29 | 1.7% |
| Multidisciplinary Studies | 4 | 0.2% |
| Science & Technology | 293 | 17.4% |
| Business | 287 | 17.1% |
| Education | 474 | 28.2% |
| Literature & Languages | 57 | 3.4% |
| Liberal Arts & History | 47 | 2.8% |
| Visual & Performing Arts | 22 | 1.3% |
| Communications | 49 | 2.9% |
| Arts & Humanities | 171 | 10.2% |
| Total | 1,680 | 100.0% |
Transportation & Commute in Linn County
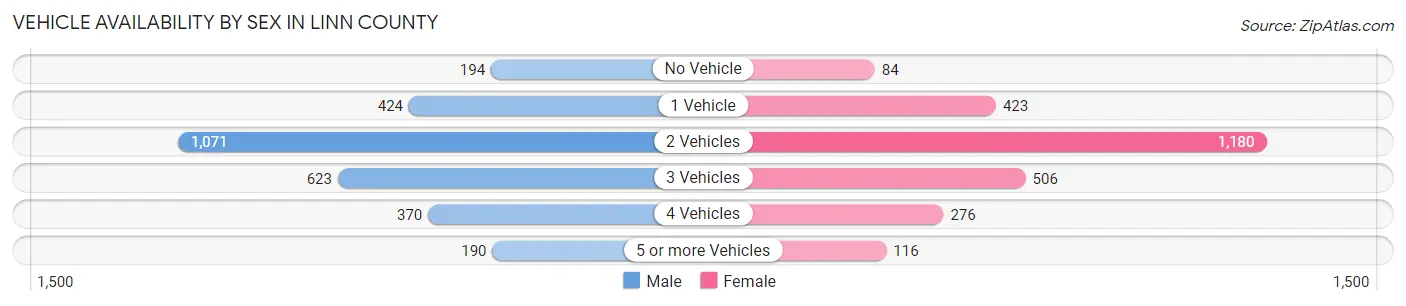
Vehicle Availability by Sex in Linn County
The most prevalent vehicle ownership categories in Linn County are males with 2 vehicles (1,071, accounting for 37.3%) and females with 2 vehicles (1,180, making up 41.4%).
| Vehicles Available | Male | Female |
| No Vehicle | 194 (6.8%) | 84 (3.3%) |
| 1 Vehicle | 424 (14.8%) | 423 (16.4%) |
| 2 Vehicles | 1,071 (37.3%) | 1,180 (45.7%) |
| 3 Vehicles | 623 (21.7%) | 506 (19.6%) |
| 4 Vehicles | 370 (12.9%) | 276 (10.7%) |
| 5 or more Vehicles | 190 (6.6%) | 116 (4.5%) |
| Total | 2,872 (100.0%) | 2,585 (100.0%) |
Commute Time in Linn County
The most frequently occuring commute durations in Linn County are 5 to 9 minutes (1,157 commuters, 22.9%), 15 to 19 minutes (655 commuters, 13.0%), and 30 to 34 minutes (612 commuters, 12.1%).
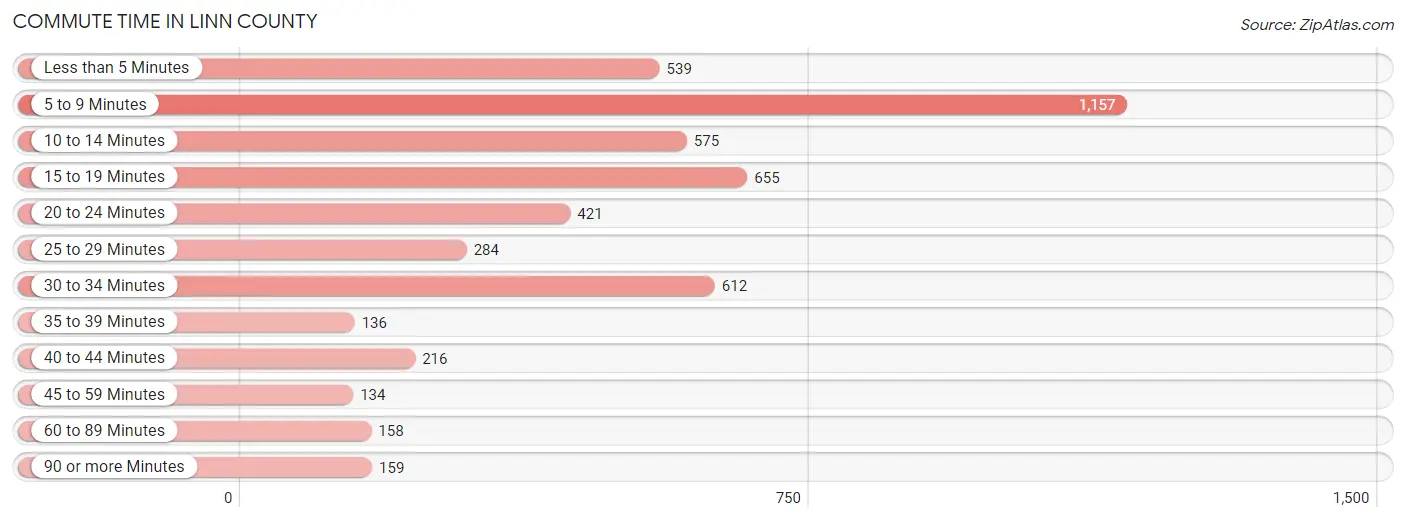
| Commute Time | # Commuters | % Commuters |
| Less than 5 Minutes | 539 | 10.7% |
| 5 to 9 Minutes | 1,157 | 22.9% |
| 10 to 14 Minutes | 575 | 11.4% |
| 15 to 19 Minutes | 655 | 13.0% |
| 20 to 24 Minutes | 421 | 8.3% |
| 25 to 29 Minutes | 284 | 5.6% |
| 30 to 34 Minutes | 612 | 12.1% |
| 35 to 39 Minutes | 136 | 2.7% |
| 40 to 44 Minutes | 216 | 4.3% |
| 45 to 59 Minutes | 134 | 2.7% |
| 60 to 89 Minutes | 158 | 3.1% |
| 90 or more Minutes | 159 | 3.2% |
Commute Time by Sex in Linn County
The most common commute times in Linn County are 5 to 9 minutes (591 commuters, 22.9%) for males and 5 to 9 minutes (566 commuters, 23.0%) for females.
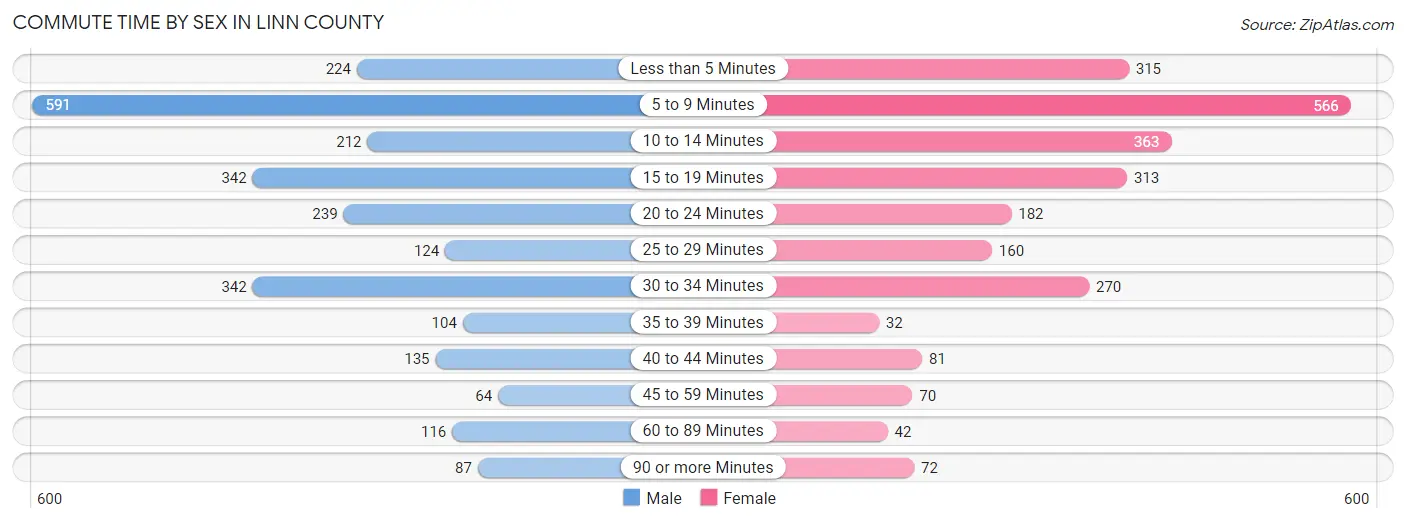
| Commute Time | Male | Female |
| Less than 5 Minutes | 224 (8.7%) | 315 (12.8%) |
| 5 to 9 Minutes | 591 (22.9%) | 566 (23.0%) |
| 10 to 14 Minutes | 212 (8.2%) | 363 (14.7%) |
| 15 to 19 Minutes | 342 (13.3%) | 313 (12.7%) |
| 20 to 24 Minutes | 239 (9.3%) | 182 (7.4%) |
| 25 to 29 Minutes | 124 (4.8%) | 160 (6.5%) |
| 30 to 34 Minutes | 342 (13.3%) | 270 (11.0%) |
| 35 to 39 Minutes | 104 (4.0%) | 32 (1.3%) |
| 40 to 44 Minutes | 135 (5.2%) | 81 (3.3%) |
| 45 to 59 Minutes | 64 (2.5%) | 70 (2.8%) |
| 60 to 89 Minutes | 116 (4.5%) | 42 (1.7%) |
| 90 or more Minutes | 87 (3.4%) | 72 (2.9%) |
Time of Departure to Work by Sex in Linn County
The most frequent times of departure to work in Linn County are 7:00 AM to 7:29 AM (581, 22.5%) for males and 7:00 AM to 7:29 AM (630, 25.6%) for females.
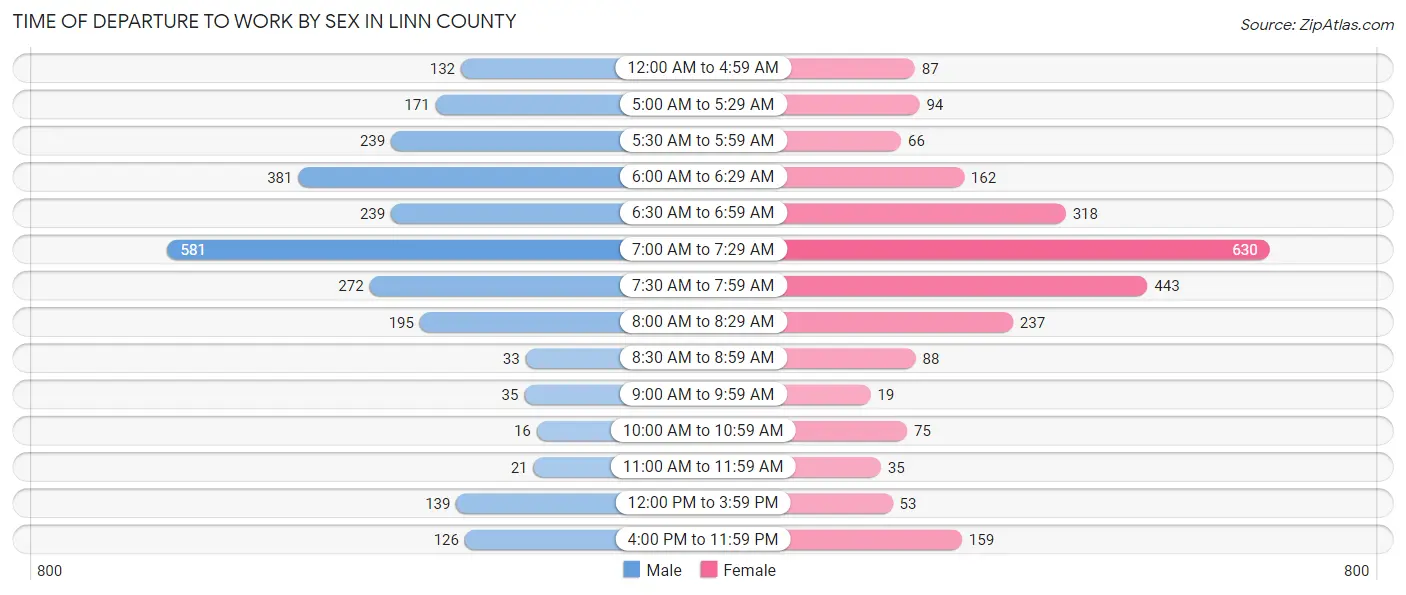
| Time of Departure | Male | Female |
| 12:00 AM to 4:59 AM | 132 (5.1%) | 87 (3.5%) |
| 5:00 AM to 5:29 AM | 171 (6.6%) | 94 (3.8%) |
| 5:30 AM to 5:59 AM | 239 (9.3%) | 66 (2.7%) |
| 6:00 AM to 6:29 AM | 381 (14.8%) | 162 (6.6%) |
| 6:30 AM to 6:59 AM | 239 (9.3%) | 318 (12.9%) |
| 7:00 AM to 7:29 AM | 581 (22.5%) | 630 (25.6%) |
| 7:30 AM to 7:59 AM | 272 (10.5%) | 443 (18.0%) |
| 8:00 AM to 8:29 AM | 195 (7.6%) | 237 (9.6%) |
| 8:30 AM to 8:59 AM | 33 (1.3%) | 88 (3.6%) |
| 9:00 AM to 9:59 AM | 35 (1.4%) | 19 (0.8%) |
| 10:00 AM to 10:59 AM | 16 (0.6%) | 75 (3.0%) |
| 11:00 AM to 11:59 AM | 21 (0.8%) | 35 (1.4%) |
| 12:00 PM to 3:59 PM | 139 (5.4%) | 53 (2.1%) |
| 4:00 PM to 11:59 PM | 126 (4.9%) | 159 (6.5%) |
| Total | 2,580 (100.0%) | 2,466 (100.0%) |
Housing Occupancy in Linn County
Occupancy by Ownership in Linn County
Of the total 4,773 dwellings in Linn County, owner-occupied units account for 3,672 (76.9%), while renter-occupied units make up 1,101 (23.1%).
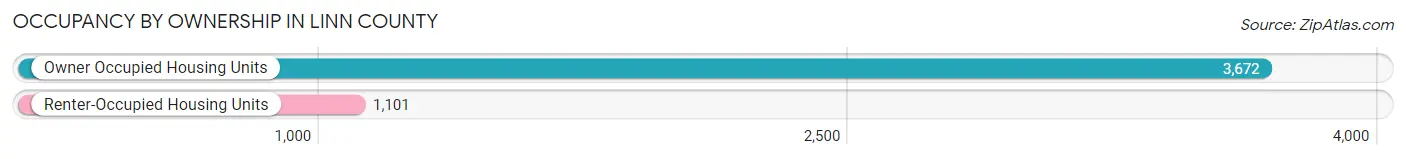
| Occupancy | # Housing Units | % Housing Units |
| Owner Occupied Housing Units | 3,672 | 76.9% |
| Renter-Occupied Housing Units | 1,101 | 23.1% |
| Total Occupied Housing Units | 4,773 | 100.0% |
Occupancy by Household Size in Linn County
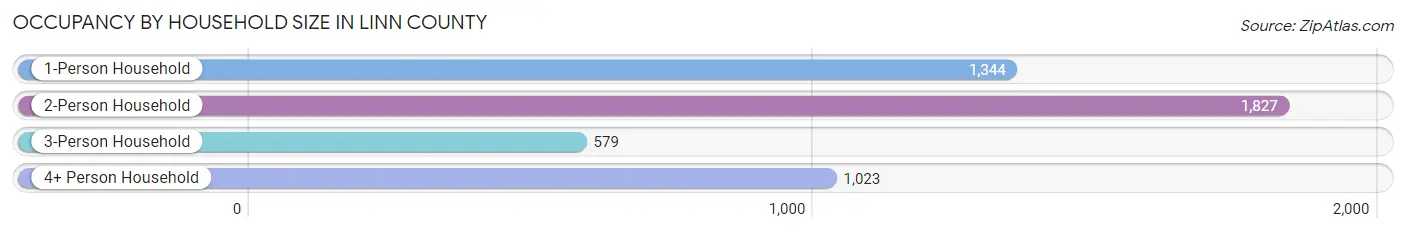
| Household Size | # Housing Units | % Housing Units |
| 1-Person Household | 1,344 | 28.2% |
| 2-Person Household | 1,827 | 38.3% |
| 3-Person Household | 579 | 12.1% |
| 4+ Person Household | 1,023 | 21.4% |
| Total Housing Units | 4,773 | 100.0% |
Occupancy by Ownership by Household Size in Linn County
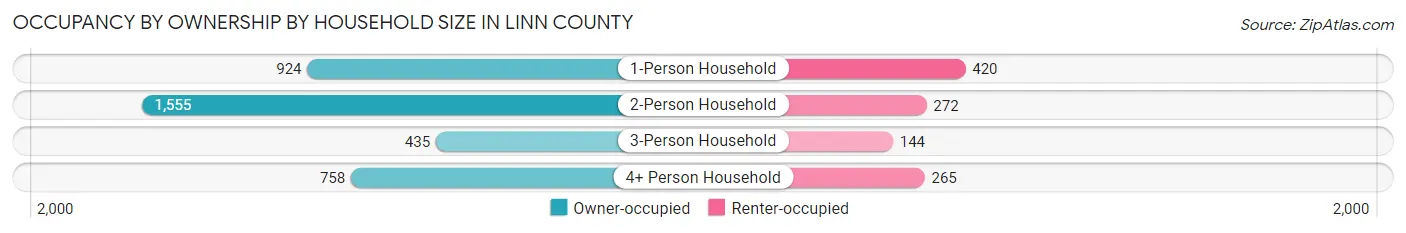
| Household Size | Owner-occupied | Renter-occupied |
| 1-Person Household | 924 (68.8%) | 420 (31.2%) |
| 2-Person Household | 1,555 (85.1%) | 272 (14.9%) |
| 3-Person Household | 435 (75.1%) | 144 (24.9%) |
| 4+ Person Household | 758 (74.1%) | 265 (25.9%) |
| Total Housing Units | 3,672 (76.9%) | 1,101 (23.1%) |
Occupancy by Educational Attainment in Linn County
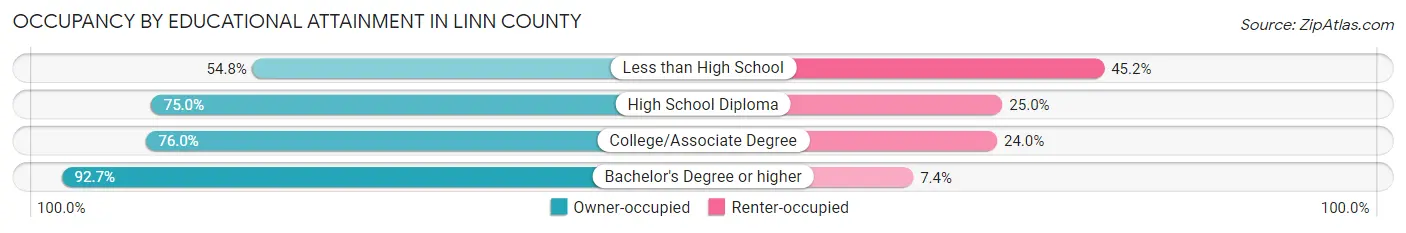
| Household Size | Owner-occupied | Renter-occupied |
| Less than High School | 229 (54.8%) | 189 (45.2%) |
| High School Diploma | 1,713 (75.0%) | 572 (25.0%) |
| College/Associate Degree | 860 (76.0%) | 271 (24.0%) |
| Bachelor's Degree or higher | 870 (92.6%) | 69 (7.3%) |
Occupancy by Age of Householder in Linn County
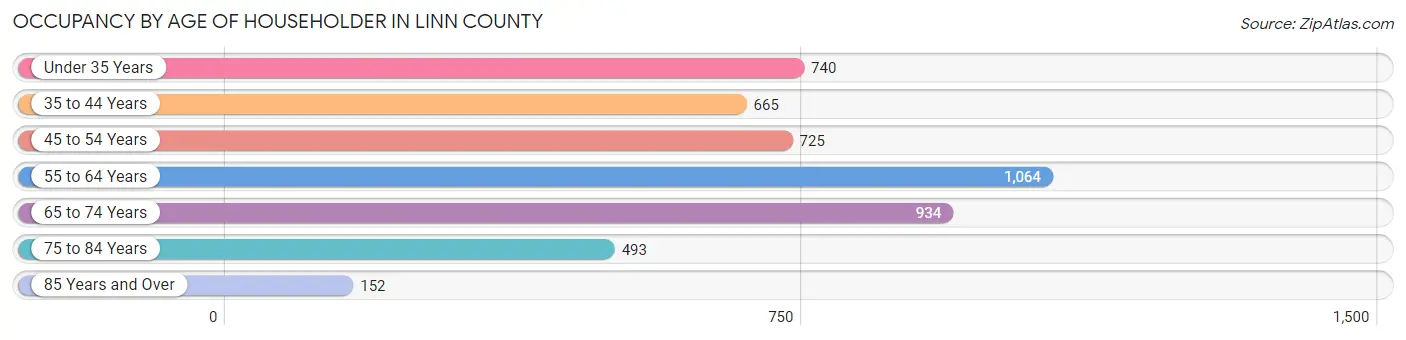
| Age Bracket | # Households | % Households |
| Under 35 Years | 740 | 15.5% |
| 35 to 44 Years | 665 | 13.9% |
| 45 to 54 Years | 725 | 15.2% |
| 55 to 64 Years | 1,064 | 22.3% |
| 65 to 74 Years | 934 | 19.6% |
| 75 to 84 Years | 493 | 10.3% |
| 85 Years and Over | 152 | 3.2% |
| Total | 4,773 | 100.0% |
Housing Finances in Linn County
Median Income by Occupancy in Linn County
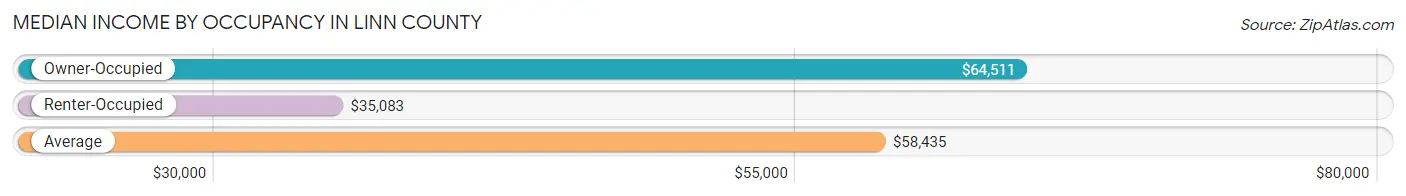
| Occupancy Type | # Households | Median Income |
| Owner-Occupied | 3,672 (76.9%) | $64,511 |
| Renter-Occupied | 1,101 (23.1%) | $35,083 |
| Average | 4,773 (100.0%) | $58,435 |
Occupancy by Householder Income Bracket in Linn County
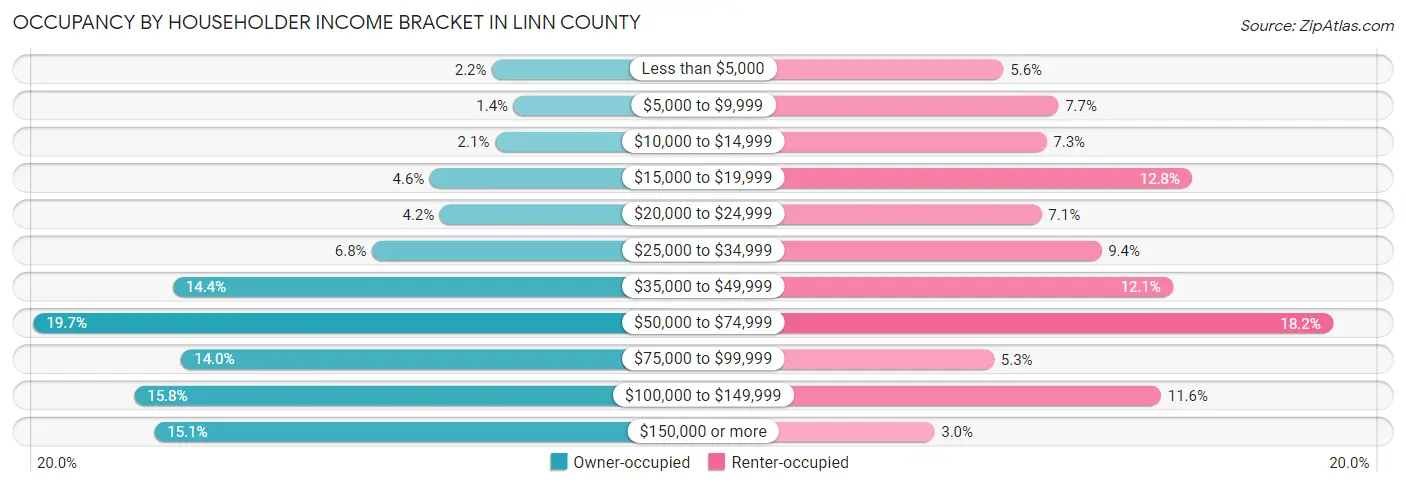
| Income Bracket | Owner-occupied | Renter-occupied |
| Less than $5,000 | 80 (2.2%) | 62 (5.6%) |
| $5,000 to $9,999 | 50 (1.4%) | 85 (7.7%) |
| $10,000 to $14,999 | 76 (2.1%) | 80 (7.3%) |
| $15,000 to $19,999 | 167 (4.5%) | 141 (12.8%) |
| $20,000 to $24,999 | 153 (4.2%) | 78 (7.1%) |
| $25,000 to $34,999 | 248 (6.8%) | 103 (9.4%) |
| $35,000 to $49,999 | 527 (14.3%) | 133 (12.1%) |
| $50,000 to $74,999 | 722 (19.7%) | 200 (18.2%) |
| $75,000 to $99,999 | 515 (14.0%) | 58 (5.3%) |
| $100,000 to $149,999 | 581 (15.8%) | 128 (11.6%) |
| $150,000 or more | 553 (15.1%) | 33 (3.0%) |
| Total | 3,672 (100.0%) | 1,101 (100.0%) |
Monthly Housing Cost Tiers in Linn County
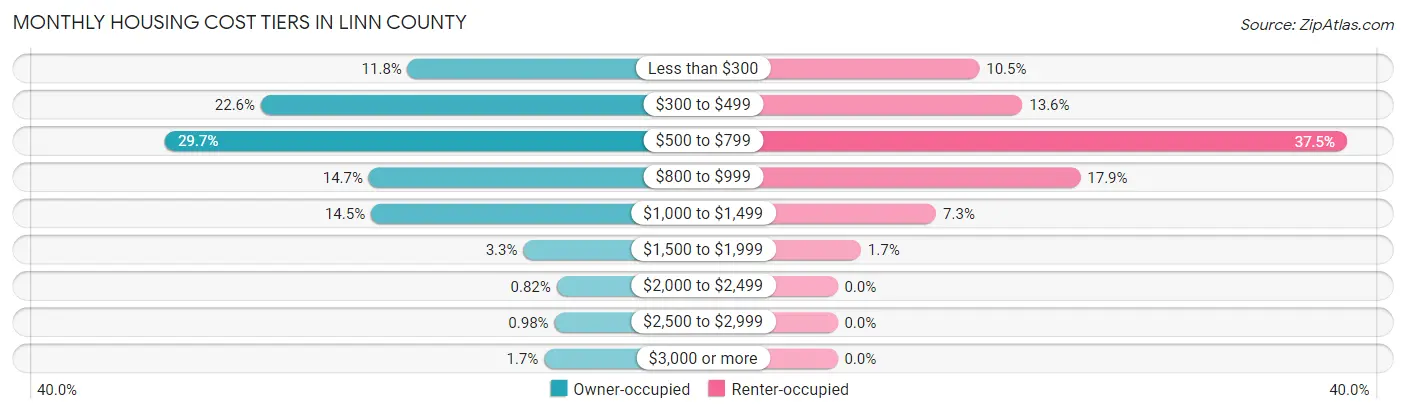
| Monthly Cost | Owner-occupied | Renter-occupied |
| Less than $300 | 433 (11.8%) | 115 (10.4%) |
| $300 to $499 | 830 (22.6%) | 150 (13.6%) |
| $500 to $799 | 1,089 (29.7%) | 413 (37.5%) |
| $800 to $999 | 538 (14.6%) | 197 (17.9%) |
| $1,000 to $1,499 | 532 (14.5%) | 80 (7.3%) |
| $1,500 to $1,999 | 120 (3.3%) | 19 (1.7%) |
| $2,000 to $2,499 | 30 (0.8%) | 0 (0.0%) |
| $2,500 to $2,999 | 36 (1.0%) | 0 (0.0%) |
| $3,000 or more | 64 (1.7%) | 0 (0.0%) |
| Total | 3,672 (100.0%) | 1,101 (100.0%) |
Physical Housing Characteristics in Linn County
Housing Structures in Linn County
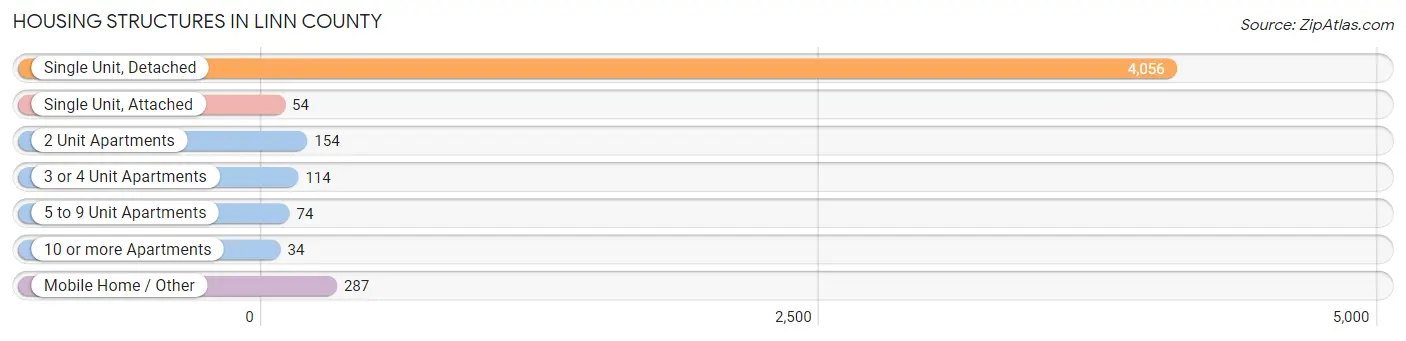
| Structure Type | # Housing Units | % Housing Units |
| Single Unit, Detached | 4,056 | 85.0% |
| Single Unit, Attached | 54 | 1.1% |
| 2 Unit Apartments | 154 | 3.2% |
| 3 or 4 Unit Apartments | 114 | 2.4% |
| 5 to 9 Unit Apartments | 74 | 1.5% |
| 10 or more Apartments | 34 | 0.7% |
| Mobile Home / Other | 287 | 6.0% |
| Total | 4,773 | 100.0% |
Housing Structures by Occupancy in Linn County
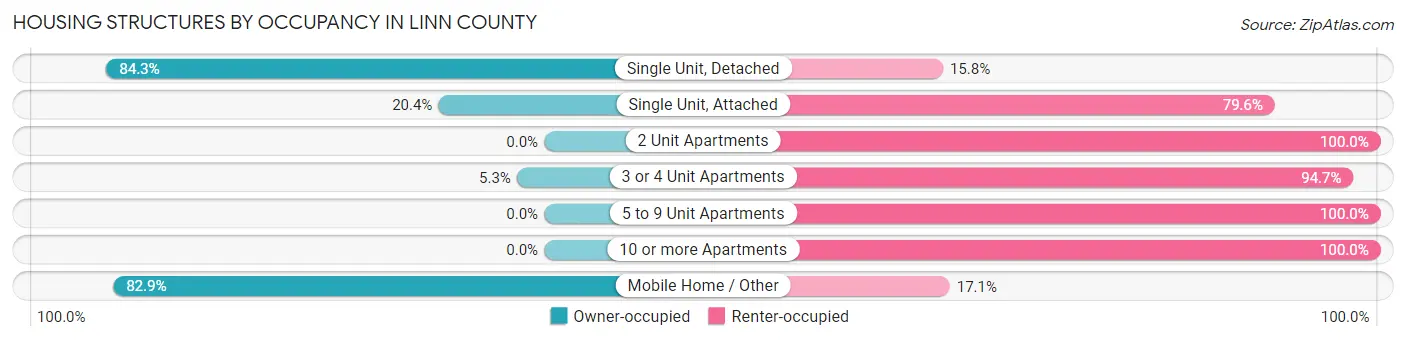
| Structure Type | Owner-occupied | Renter-occupied |
| Single Unit, Detached | 3,417 (84.3%) | 639 (15.8%) |
| Single Unit, Attached | 11 (20.4%) | 43 (79.6%) |
| 2 Unit Apartments | 0 (0.0%) | 154 (100.0%) |
| 3 or 4 Unit Apartments | 6 (5.3%) | 108 (94.7%) |
| 5 to 9 Unit Apartments | 0 (0.0%) | 74 (100.0%) |
| 10 or more Apartments | 0 (0.0%) | 34 (100.0%) |
| Mobile Home / Other | 238 (82.9%) | 49 (17.1%) |
| Total | 3,672 (76.9%) | 1,101 (23.1%) |
Housing Structures by Number of Rooms in Linn County
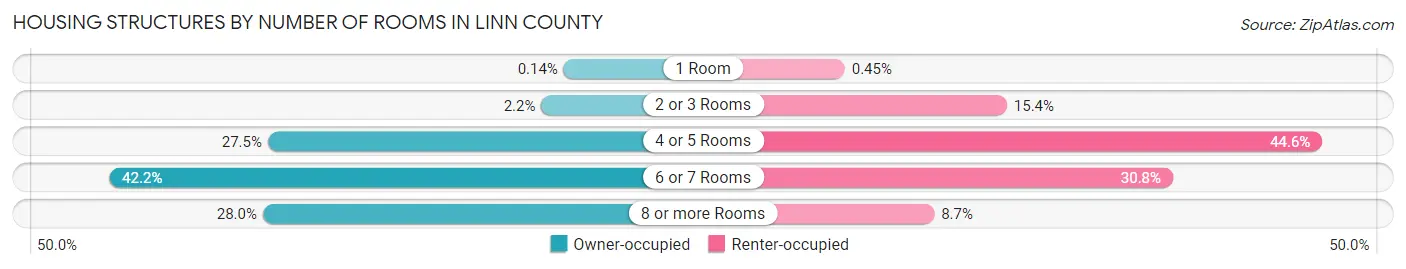
| Number of Rooms | Owner-occupied | Renter-occupied |
| 1 Room | 5 (0.1%) | 5 (0.4%) |
| 2 or 3 Rooms | 81 (2.2%) | 170 (15.4%) |
| 4 or 5 Rooms | 1,010 (27.5%) | 491 (44.6%) |
| 6 or 7 Rooms | 1,549 (42.2%) | 339 (30.8%) |
| 8 or more Rooms | 1,027 (28.0%) | 96 (8.7%) |
| Total | 3,672 (100.0%) | 1,101 (100.0%) |
Housing Structure by Heating Type in Linn County
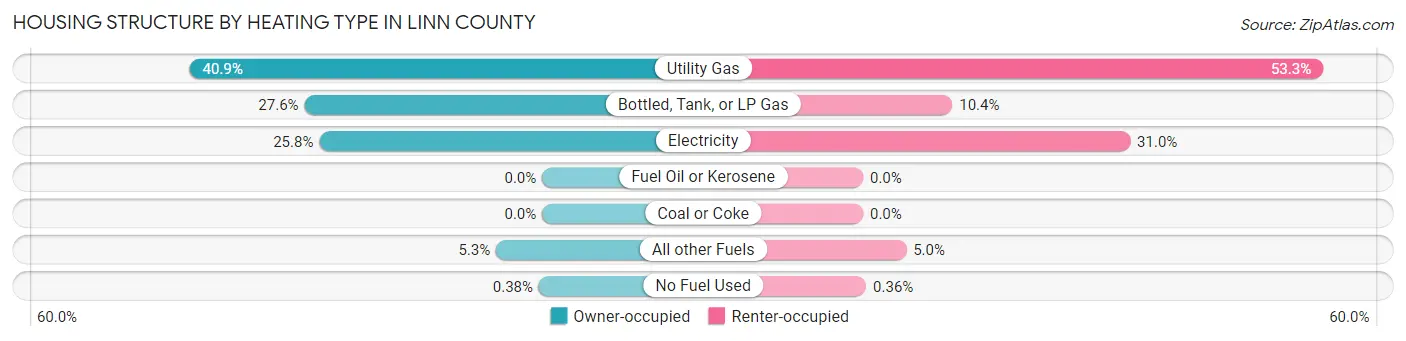
| Heating Type | Owner-occupied | Renter-occupied |
| Utility Gas | 1,501 (40.9%) | 587 (53.3%) |
| Bottled, Tank, or LP Gas | 1,012 (27.6%) | 114 (10.3%) |
| Electricity | 949 (25.8%) | 341 (31.0%) |
| Fuel Oil or Kerosene | 0 (0.0%) | 0 (0.0%) |
| Coal or Coke | 0 (0.0%) | 0 (0.0%) |
| All other Fuels | 196 (5.3%) | 55 (5.0%) |
| No Fuel Used | 14 (0.4%) | 4 (0.4%) |
| Total | 3,672 (100.0%) | 1,101 (100.0%) |
Household Vehicle Usage in Linn County
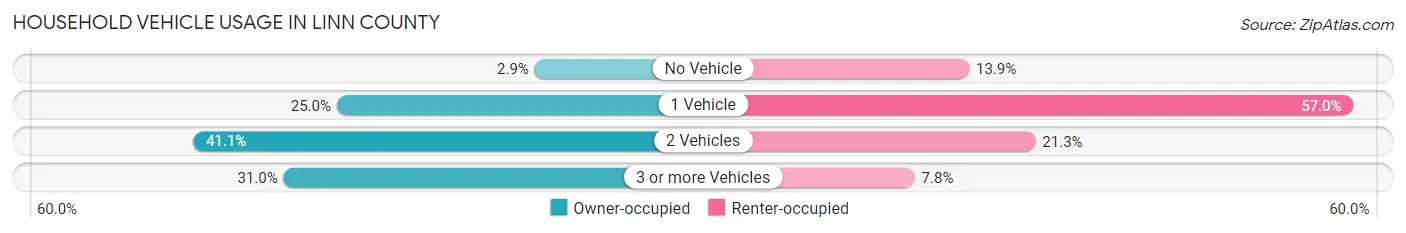
| Vehicles per Household | Owner-occupied | Renter-occupied |
| No Vehicle | 105 (2.9%) | 153 (13.9%) |
| 1 Vehicle | 919 (25.0%) | 627 (57.0%) |
| 2 Vehicles | 1,510 (41.1%) | 235 (21.3%) |
| 3 or more Vehicles | 1,138 (31.0%) | 86 (7.8%) |
| Total | 3,672 (100.0%) | 1,101 (100.0%) |
Real Estate & Mortgages in Linn County
Real Estate and Mortgage Overview in Linn County
| Characteristic | Without Mortgage | With Mortgage |
| Housing Units | 2,064 | 1,608 |
| Median Property Value | $97,700 | $124,000 |
| Median Household Income | $53,607 | $237 |
| Monthly Housing Costs | $450 | $60 |
| Real Estate Taxes | $910 | $20 |
Property Value by Mortgage Status in Linn County
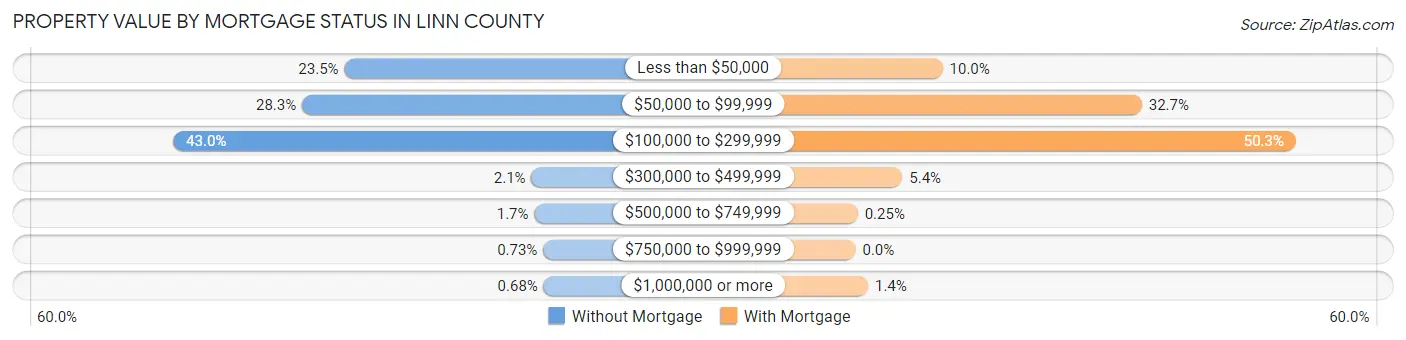
| Property Value | Without Mortgage | With Mortgage |
| Less than $50,000 | 484 (23.4%) | 160 (10.0%) |
| $50,000 to $99,999 | 584 (28.3%) | 526 (32.7%) |
| $100,000 to $299,999 | 888 (43.0%) | 809 (50.3%) |
| $300,000 to $499,999 | 43 (2.1%) | 86 (5.3%) |
| $500,000 to $749,999 | 36 (1.7%) | 4 (0.3%) |
| $750,000 to $999,999 | 15 (0.7%) | 0 (0.0%) |
| $1,000,000 or more | 14 (0.7%) | 23 (1.4%) |
| Total | 2,064 (100.0%) | 1,608 (100.0%) |
Household Income by Mortgage Status in Linn County
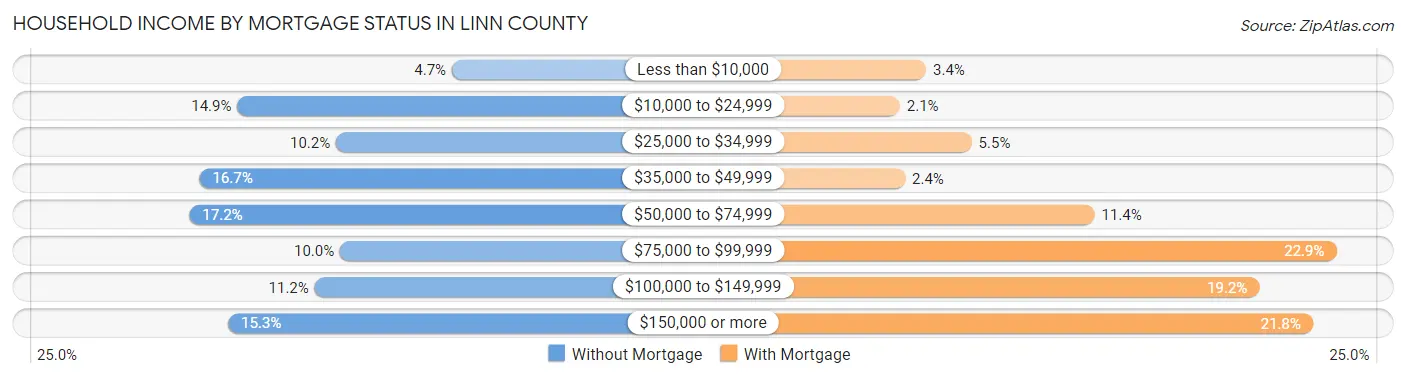
| Household Income | Without Mortgage | With Mortgage |
| Less than $10,000 | 96 (4.6%) | 54 (3.4%) |
| $10,000 to $24,999 | 307 (14.9%) | 34 (2.1%) |
| $25,000 to $34,999 | 210 (10.2%) | 89 (5.5%) |
| $35,000 to $49,999 | 344 (16.7%) | 38 (2.4%) |
| $50,000 to $74,999 | 354 (17.2%) | 183 (11.4%) |
| $75,000 to $99,999 | 206 (10.0%) | 368 (22.9%) |
| $100,000 to $149,999 | 231 (11.2%) | 309 (19.2%) |
| $150,000 or more | 316 (15.3%) | 350 (21.8%) |
| Total | 2,064 (100.0%) | 1,608 (100.0%) |
Property Value to Household Income Ratio in Linn County
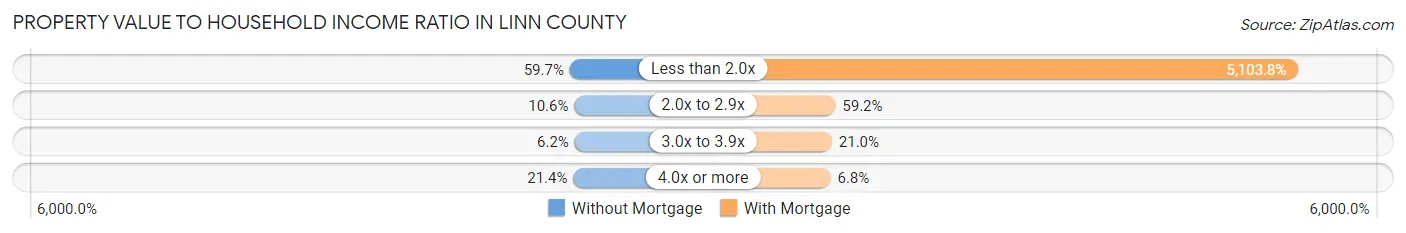
| Value-to-Income Ratio | Without Mortgage | With Mortgage |
| Less than 2.0x | 1,232 (59.7%) | 82,069 (5,103.8%) |
| 2.0x to 2.9x | 219 (10.6%) | 952 (59.2%) |
| 3.0x to 3.9x | 128 (6.2%) | 338 (21.0%) |
| 4.0x or more | 442 (21.4%) | 109 (6.8%) |
| Total | 2,064 (100.0%) | 1,608 (100.0%) |
Real Estate Taxes by Mortgage Status in Linn County
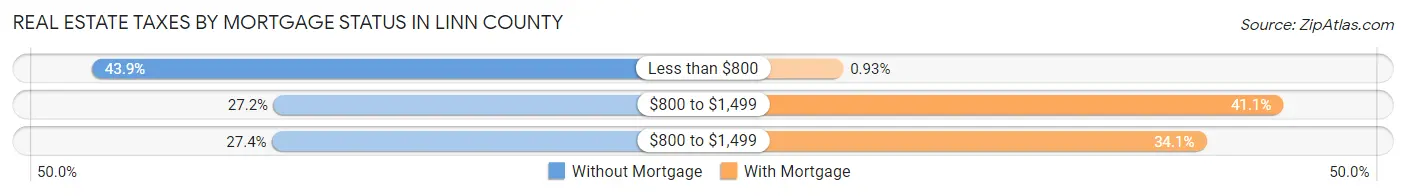
| Property Taxes | Without Mortgage | With Mortgage |
| Less than $800 | 905 (43.9%) | 15 (0.9%) |
| $800 to $1,499 | 562 (27.2%) | 661 (41.1%) |
| $800 to $1,499 | 565 (27.4%) | 548 (34.1%) |
| Total | 2,064 (100.0%) | 1,608 (100.0%) |
Health & Disability in Linn County
Health Insurance Coverage by Age in Linn County
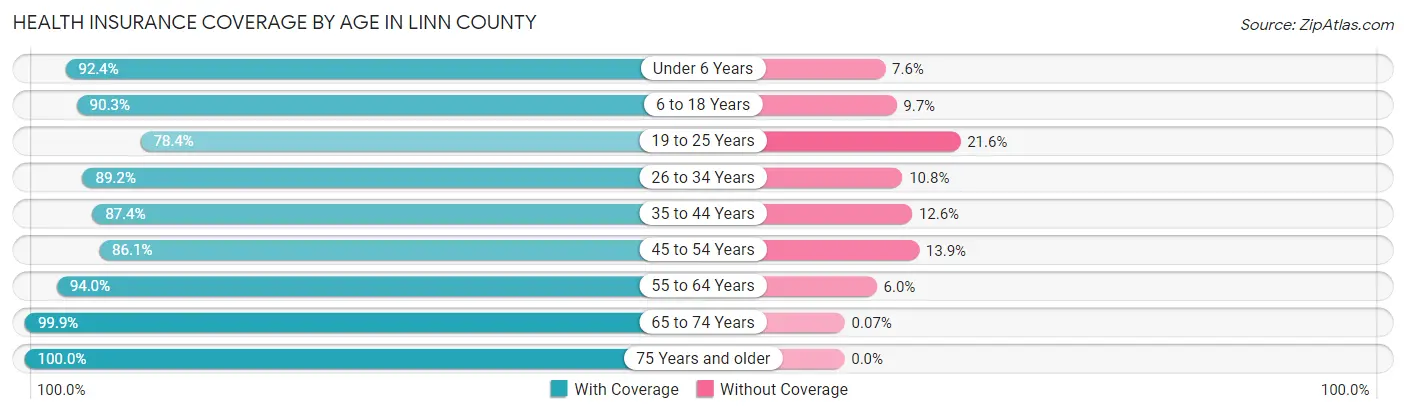
| Age Bracket | With Coverage | Without Coverage |
| Under 6 Years | 826 (92.4%) | 68 (7.6%) |
| 6 to 18 Years | 1,842 (90.3%) | 198 (9.7%) |
| 19 to 25 Years | 682 (78.4%) | 188 (21.6%) |
| 26 to 34 Years | 1,048 (89.2%) | 127 (10.8%) |
| 35 to 44 Years | 1,170 (87.4%) | 169 (12.6%) |
| 45 to 54 Years | 1,114 (86.1%) | 180 (13.9%) |
| 55 to 64 Years | 1,591 (94.0%) | 102 (6.0%) |
| 65 to 74 Years | 1,438 (99.9%) | 1 (0.1%) |
| 75 Years and older | 994 (100.0%) | 0 (0.0%) |
| Total | 10,705 (91.2%) | 1,033 (8.8%) |
Health Insurance Coverage by Citizenship Status in Linn County
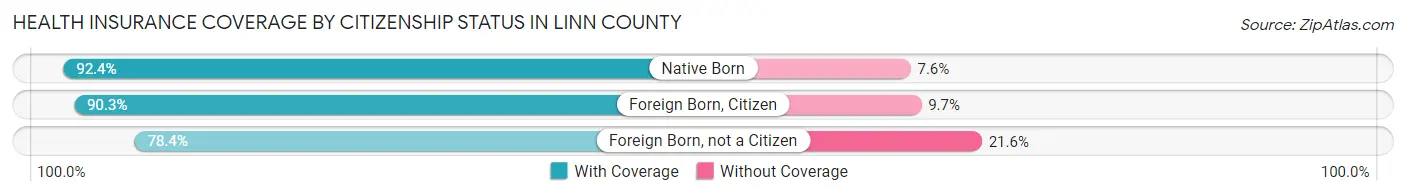
| Citizenship Status | With Coverage | Without Coverage |
| Native Born | 826 (92.4%) | 68 (7.6%) |
| Foreign Born, Citizen | 1,842 (90.3%) | 198 (9.7%) |
| Foreign Born, not a Citizen | 682 (78.4%) | 188 (21.6%) |
Health Insurance Coverage by Household Income in Linn County
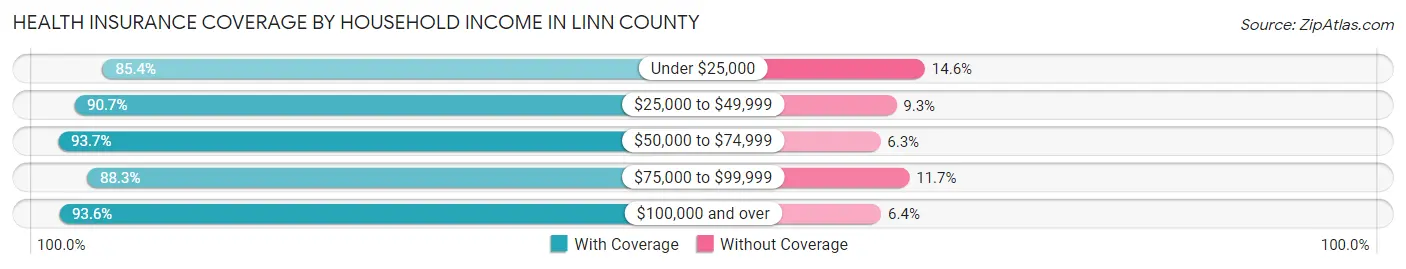
| Household Income | With Coverage | Without Coverage |
| Under $25,000 | 1,447 (85.4%) | 248 (14.6%) |
| $25,000 to $49,999 | 1,819 (90.7%) | 186 (9.3%) |
| $50,000 to $74,999 | 2,164 (93.7%) | 145 (6.3%) |
| $75,000 to $99,999 | 1,440 (88.3%) | 191 (11.7%) |
| $100,000 and over | 3,823 (93.6%) | 263 (6.4%) |
Public vs Private Health Insurance Coverage by Age in Linn County
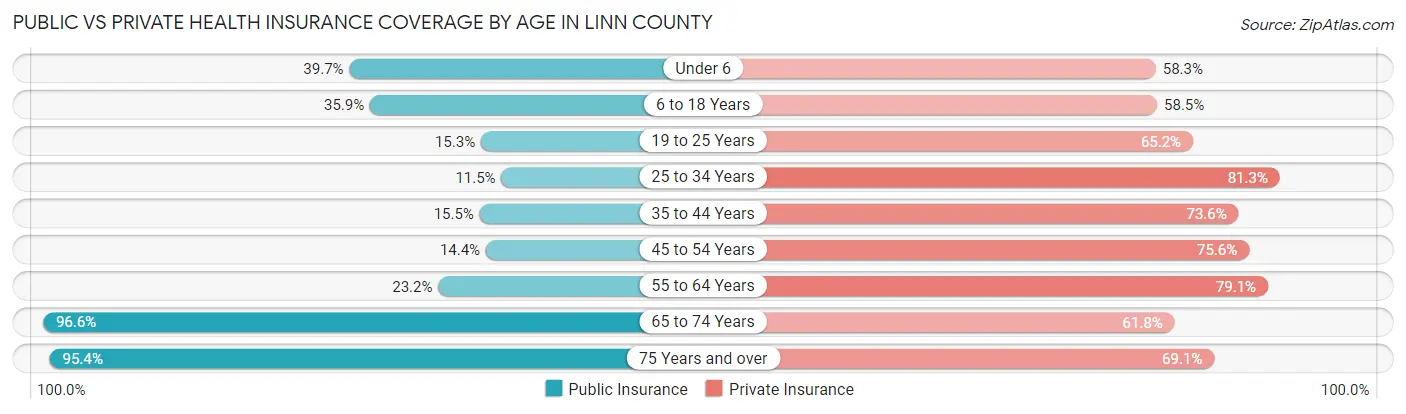
| Age Bracket | Public Insurance | Private Insurance |
| Under 6 | 355 (39.7%) | 521 (58.3%) |
| 6 to 18 Years | 732 (35.9%) | 1,194 (58.5%) |
| 19 to 25 Years | 133 (15.3%) | 567 (65.2%) |
| 25 to 34 Years | 135 (11.5%) | 955 (81.3%) |
| 35 to 44 Years | 208 (15.5%) | 986 (73.6%) |
| 45 to 54 Years | 186 (14.4%) | 978 (75.6%) |
| 55 to 64 Years | 393 (23.2%) | 1,339 (79.1%) |
| 65 to 74 Years | 1,390 (96.6%) | 889 (61.8%) |
| 75 Years and over | 948 (95.4%) | 687 (69.1%) |
| Total | 4,480 (38.2%) | 8,116 (69.1%) |
Disability Status by Sex by Age in Linn County
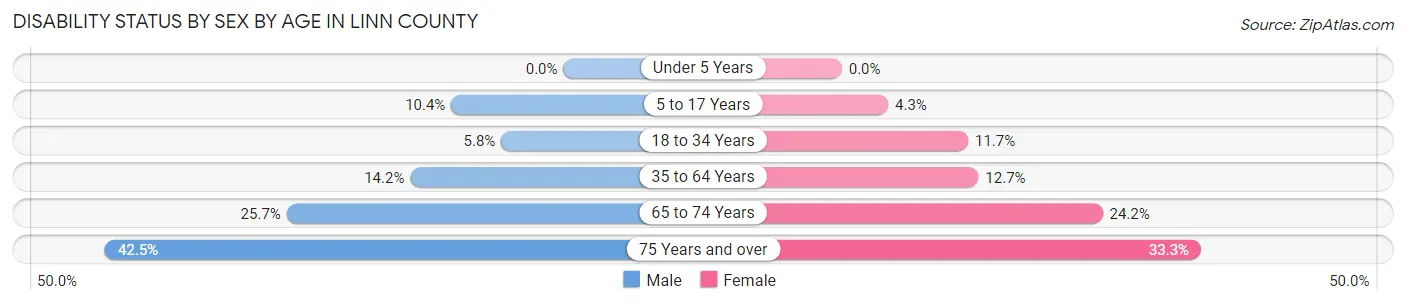
| Age Bracket | Male | Female |
| Under 5 Years | 0 (0.0%) | 0 (0.0%) |
| 5 to 17 Years | 113 (10.4%) | 43 (4.3%) |
| 18 to 34 Years | 65 (5.8%) | 124 (11.7%) |
| 35 to 64 Years | 301 (14.2%) | 280 (12.7%) |
| 65 to 74 Years | 170 (25.7%) | 188 (24.2%) |
| 75 Years and over | 174 (42.5%) | 195 (33.3%) |
Disability Class by Sex by Age in Linn County
Disability Class: Hearing Difficulty
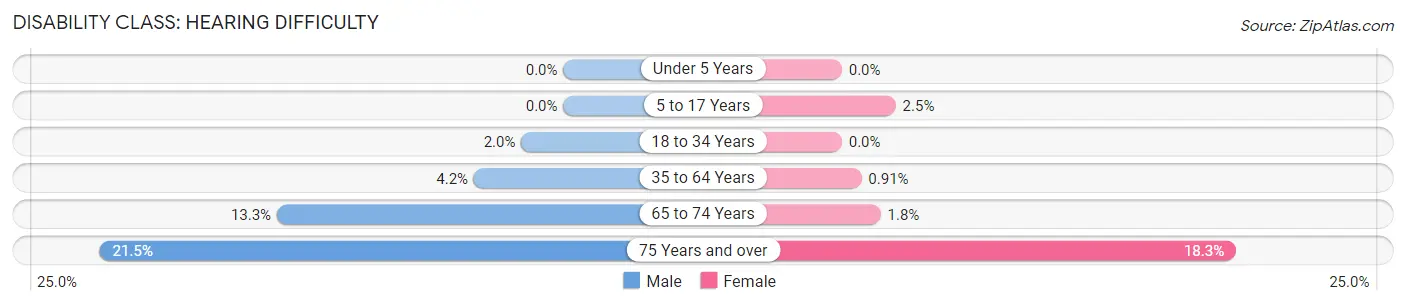
| Age Bracket | Male | Female |
| Under 5 Years | 0 (0.0%) | 0 (0.0%) |
| 5 to 17 Years | 0 (0.0%) | 25 (2.5%) |
| 18 to 34 Years | 22 (1.9%) | 0 (0.0%) |
| 35 to 64 Years | 88 (4.2%) | 20 (0.9%) |
| 65 to 74 Years | 88 (13.3%) | 14 (1.8%) |
| 75 Years and over | 88 (21.5%) | 107 (18.3%) |
Disability Class: Vision Difficulty
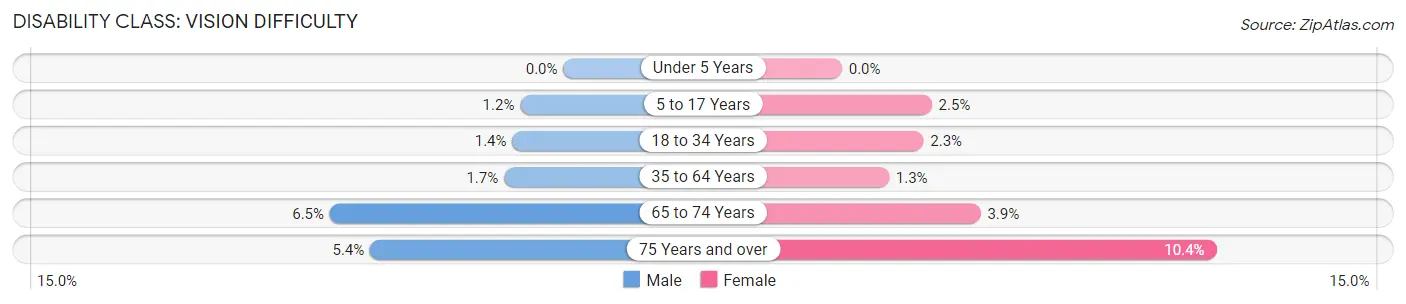
| Age Bracket | Male | Female |
| Under 5 Years | 0 (0.0%) | 0 (0.0%) |
| 5 to 17 Years | 13 (1.2%) | 25 (2.5%) |
| 18 to 34 Years | 16 (1.4%) | 24 (2.3%) |
| 35 to 64 Years | 35 (1.7%) | 29 (1.3%) |
| 65 to 74 Years | 43 (6.5%) | 30 (3.9%) |
| 75 Years and over | 22 (5.4%) | 61 (10.4%) |
Disability Class: Cognitive Difficulty
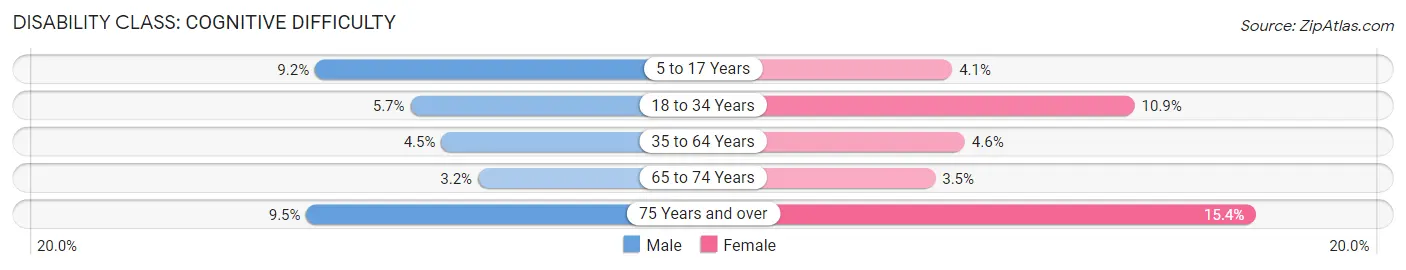
| Age Bracket | Male | Female |
| 5 to 17 Years | 100 (9.2%) | 41 (4.1%) |
| 18 to 34 Years | 64 (5.7%) | 115 (10.9%) |
| 35 to 64 Years | 96 (4.5%) | 101 (4.6%) |
| 65 to 74 Years | 21 (3.2%) | 27 (3.5%) |
| 75 Years and over | 39 (9.5%) | 90 (15.4%) |
Disability Class: Ambulatory Difficulty
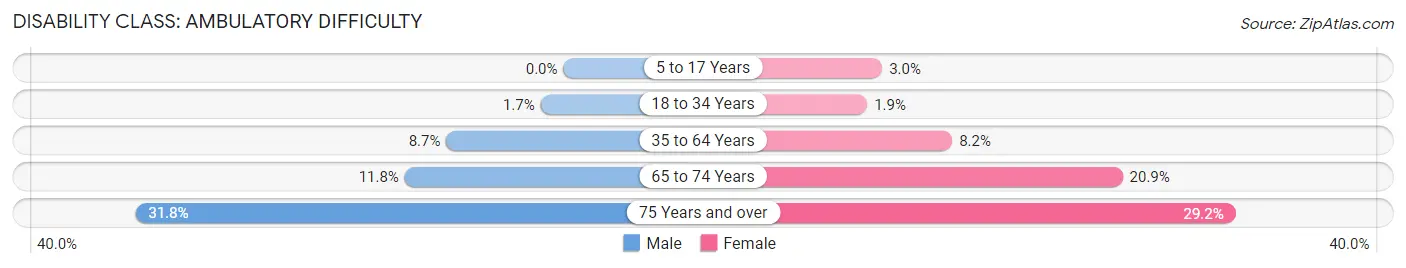
| Age Bracket | Male | Female |
| 5 to 17 Years | 0 (0.0%) | 30 (3.0%) |
| 18 to 34 Years | 19 (1.7%) | 20 (1.9%) |
| 35 to 64 Years | 184 (8.7%) | 181 (8.2%) |
| 65 to 74 Years | 78 (11.8%) | 162 (20.8%) |
| 75 Years and over | 130 (31.8%) | 171 (29.2%) |
Disability Class: Self-Care Difficulty
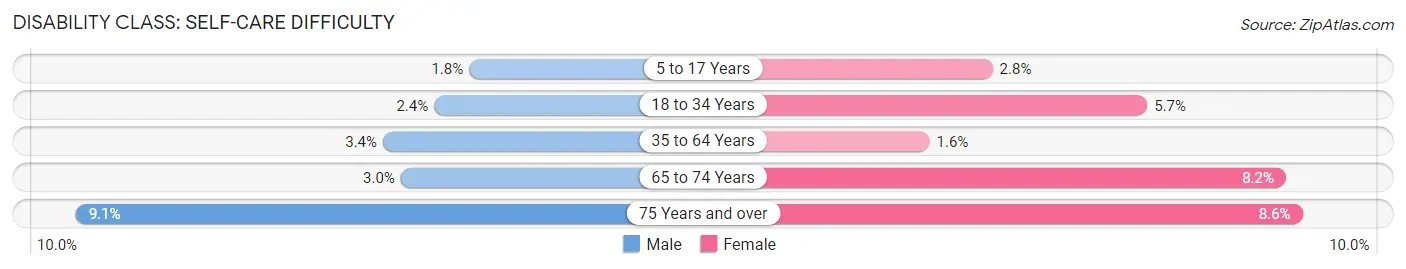
| Age Bracket | Male | Female |
| 5 to 17 Years | 19 (1.8%) | 28 (2.8%) |
| 18 to 34 Years | 27 (2.4%) | 60 (5.7%) |
| 35 to 64 Years | 71 (3.4%) | 36 (1.6%) |
| 65 to 74 Years | 20 (3.0%) | 64 (8.2%) |
| 75 Years and over | 37 (9.0%) | 50 (8.6%) |
Technology Access in Linn County
Computing Device Access in Linn County
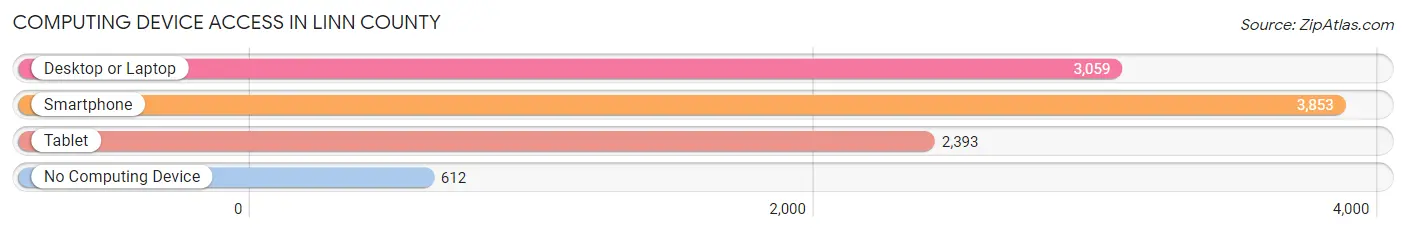
| Device Type | # Households | % Households |
| Desktop or Laptop | 3,059 | 64.1% |
| Smartphone | 3,853 | 80.7% |
| Tablet | 2,393 | 50.1% |
| No Computing Device | 612 | 12.8% |
| Total | 4,773 | 100.0% |
Internet Access in Linn County
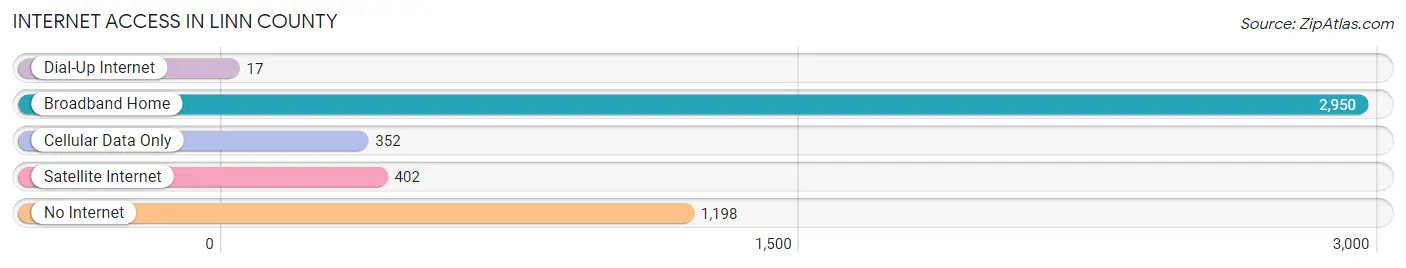
| Internet Type | # Households | % Households |
| Dial-Up Internet | 17 | 0.4% |
| Broadband Home | 2,950 | 61.8% |
| Cellular Data Only | 352 | 7.4% |
| Satellite Internet | 402 | 8.4% |
| No Internet | 1,198 | 25.1% |
| Total | 4,773 | 100.0% |
Linn County Summary
Linn County, Missouri is located in the north-central part of the state, and is bordered by Macon County to the north, Chariton County to the east, Randolph County to the south, and Sullivan County to the west. The county seat is Linneus, and the county was organized in 1837. The county has a total area of 517 square miles, and a population of 12,743 as of the 2010 census.
Geography
Linn County is located in the northern part of the Ozark Plateau, and is characterized by rolling hills and valleys. The county is drained by the Chariton River, which flows through the county from north to south. The county is mostly forested, with oak, hickory, and walnut trees being the most common. The county also has some prairie grasslands, and is home to a variety of wildlife, including deer, turkey, and quail.
History
Linn County was organized in 1837, and was named after Lewis F. Linn, a United States Senator from Missouri. The county was originally part of Chariton County, and was created in order to provide better access to the county seat of Chariton. The county seat was moved to Linneus in 1841, and the county has remained largely rural since then.
Economy
The economy of Linn County is largely based on agriculture, with corn, soybeans, and wheat being the main crops. Livestock production is also important, with cattle, hogs, and poultry being the main animals raised. The county also has some manufacturing, with the main industries being furniture, wood products, and metal products.
Demographics
As of the 2010 census, the population of Linn County was 12,743, with a population density of 25 people per square mile. The median household income was $37,845, and the median family income was $45,845. The county is predominantly white, with 95.3% of the population being white, and the remaining 4.7% being African American, Native American, Asian, and other races. The largest age group is 45-54, making up 22.3% of the population.
Conclusion
Linn County, Missouri is a rural county located in the north-central part of the state. The county is characterized by rolling hills and valleys, and is mostly forested. The economy of the county is largely based on agriculture, with corn, soybeans, and wheat being the main crops. The population of the county is predominantly white, and the median household income is $37,845.
Common Questions
What is Per Capita Income in Linn County?
Per Capita income in Linn County is $32,065.
What is the Median Family Income in Linn County?
Median Family Income in Linn County is $69,750.
What is the Median Household income in Linn County?
Median Household Income in Linn County is $58,435.
What is Income or Wage Gap in Linn County?
Income or Wage Gap in Linn County is 30.1%.
Women in Linn County earn 69.9 cents for every dollar earned by a man.
What is Family Income Deficit in Linn County?
Family Income Deficit in Linn County is $13,222.
Families that are below poverty line in Linn County earn $13,222 less on average than the poverty threshold level.
What is Inequality or Gini Index in Linn County?
Inequality or Gini Index in Linn County is 0.45.
What is the Total Population of Linn County?
Total Population of Linn County is 11,892.
What is the Total Male Population of Linn County?
Total Male Population of Linn County is 5,823.
What is the Total Female Population of Linn County?
Total Female Population of Linn County is 6,069.
What is the Ratio of Males per 100 Females in Linn County?
There are 95.95 Males per 100 Females in Linn County.
What is the Ratio of Females per 100 Males in Linn County?
There are 104.22 Females per 100 Males in Linn County.
What is the Median Population Age in Linn County?
Median Population Age in Linn County is 42.0 Years.
What is the Average Family Size in Linn County
Average Family Size in Linn County is 3.0 People.
What is the Average Household Size in Linn County
Average Household Size in Linn County is 2.5 People.
How Large is the Labor Force in Linn County?
There are 5,682 People in the Labor Forcein in Linn County.
What is the Percentage of People in the Labor Force in Linn County?
59.7% of People are in the Labor Force in Linn County.
What is the Unemployment Rate in Linn County?
Unemployment Rate in Linn County is 2.8%.