Laclede County, MO Map & Demographics
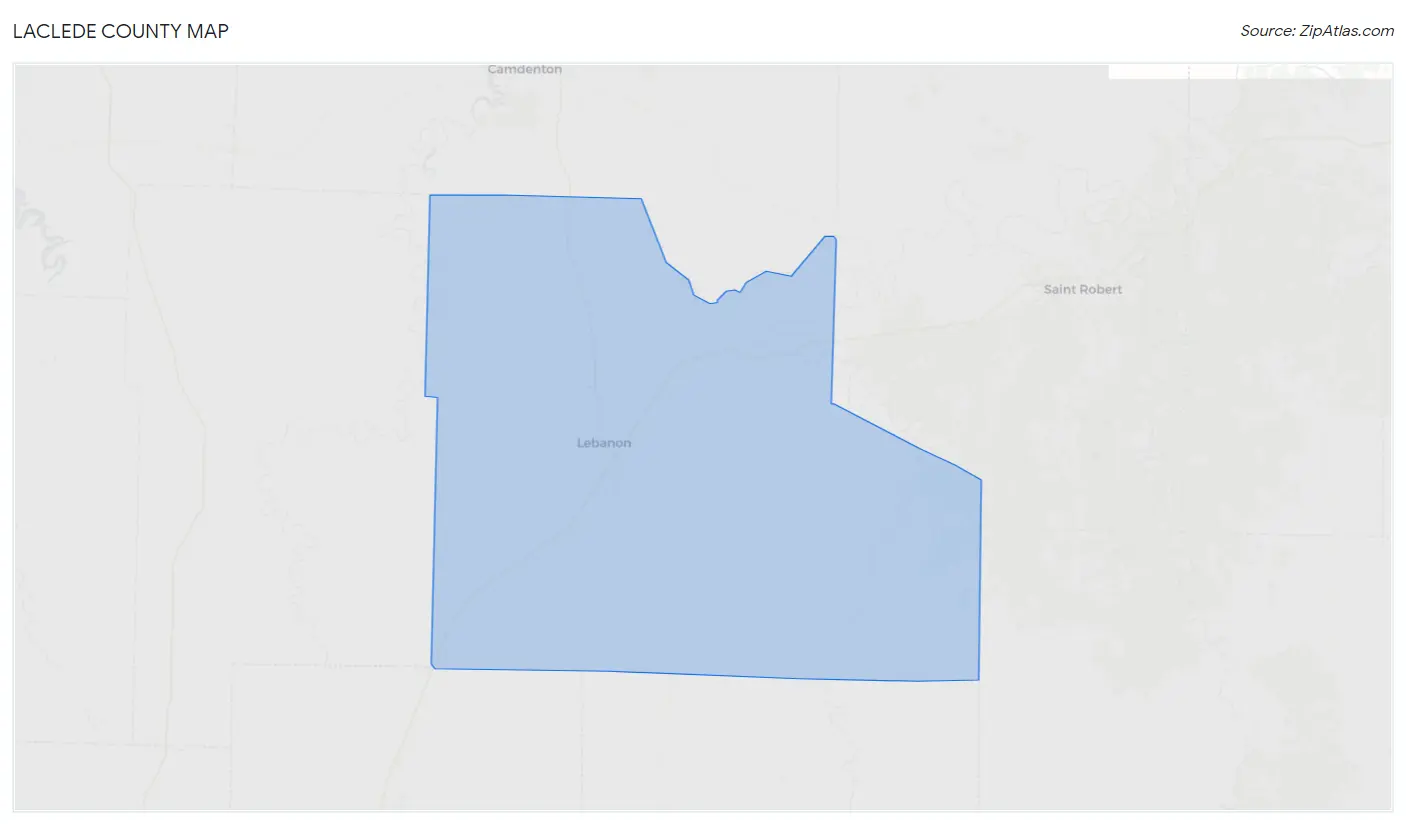
Laclede County Map
Laclede County Overview
$27,790
PER CAPITA INCOME
$60,463
AVG FAMILY INCOME
$49,202
AVG HOUSEHOLD INCOME
28.4%
WAGE / INCOME GAP [ % ]
71.6¢/ $1
WAGE / INCOME GAP [ $ ]
$9,523
FAMILY INCOME DEFICIT
0.45
INEQUALITY / GINI INDEX
36,060
TOTAL POPULATION
18,027
MALE POPULATION
18,033
FEMALE POPULATION
99.97
MALES / 100 FEMALES
100.03
FEMALES / 100 MALES
39.5
MEDIAN AGE
3.0
AVG FAMILY SIZE
2.5
AVG HOUSEHOLD SIZE
16,512
LABOR FORCE [ PEOPLE ]
58.8%
PERCENT IN LABOR FORCE
5.9%
UNEMPLOYMENT RATE
Laclede County Area Codes
Income in Laclede County
Income Overview in Laclede County
Per Capita Income in Laclede County is $27,790, while median incomes of families and households are $60,463 and $49,202 respectively.
| Characteristic | Number | Measure |
| Per Capita Income | 36,060 | $27,790 |
| Median Family Income | 9,767 | $60,463 |
| Mean Family Income | 9,767 | $78,953 |
| Median Household Income | 14,345 | $49,202 |
| Mean Household Income | 14,345 | $68,617 |
| Income Deficit | 9,767 | $9,523 |
| Wage / Income Gap (%) | 36,060 | 28.40% |
| Wage / Income Gap ($) | 36,060 | 71.60¢ per $1 |
| Gini / Inequality Index | 36,060 | 0.45 |
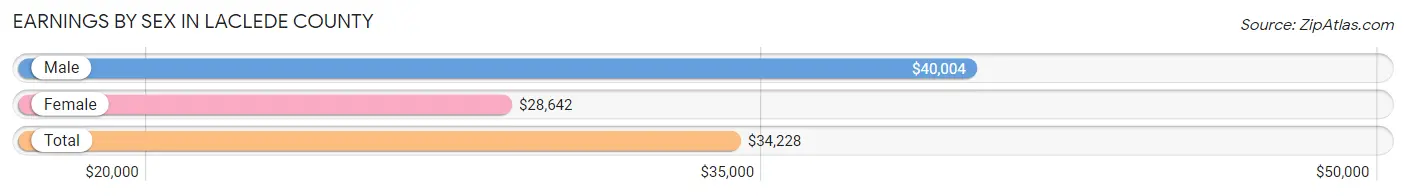
Earnings by Sex in Laclede County
Average Earnings in Laclede County are $34,228, $40,004 for men and $28,642 for women, a difference of 28.4%.
| Sex | Number | Average Earnings |
| Male | 9,394 (55.5%) | $40,004 |
| Female | 7,545 (44.5%) | $28,642 |
| Total | 16,939 (100.0%) | $34,228 |
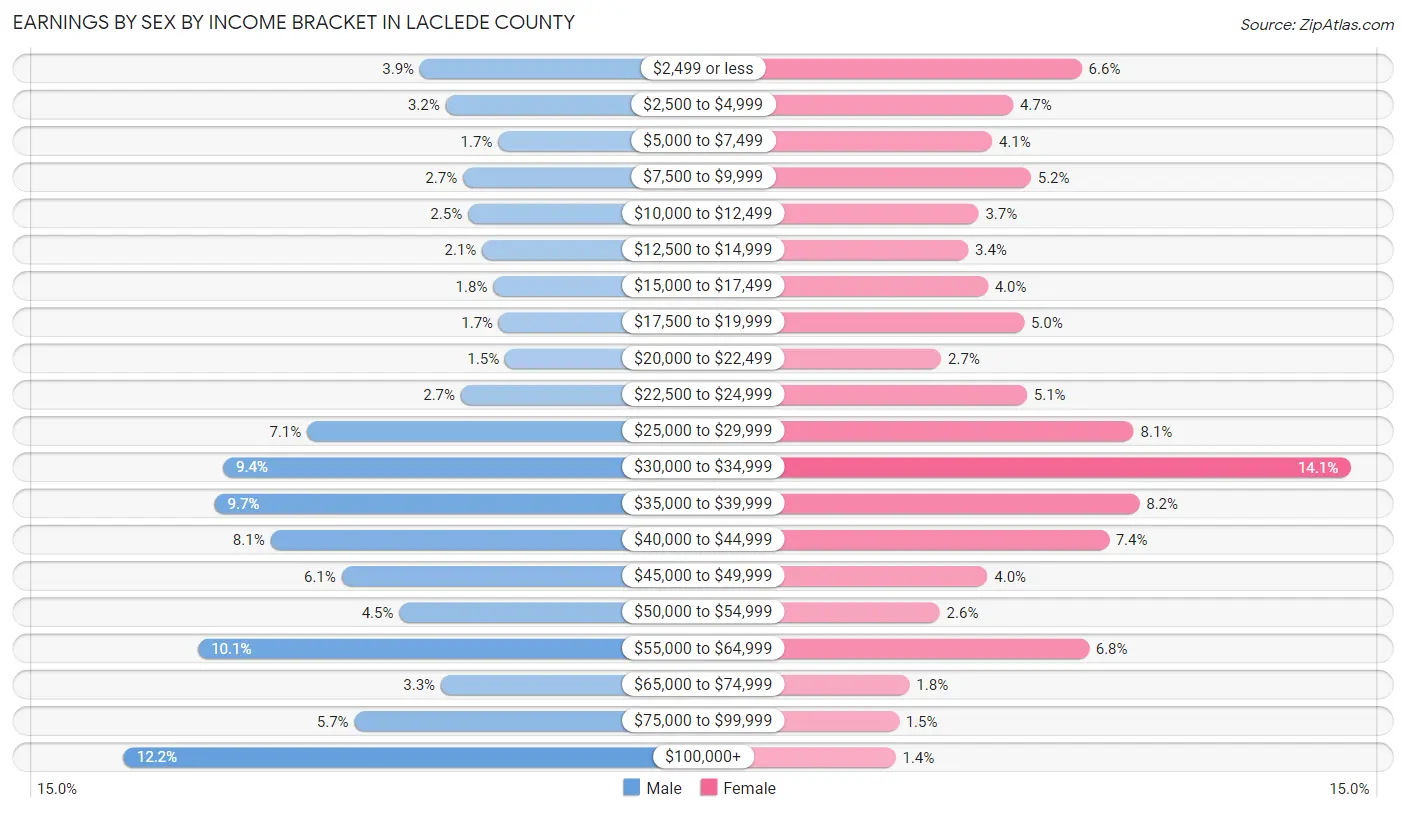
Earnings by Sex by Income Bracket in Laclede County
The most common earnings brackets in Laclede County are $100,000+ for men (1,147 | 12.2%) and $30,000 to $34,999 for women (1,067 | 14.1%).
| Income | Male | Female |
| $2,499 or less | 365 (3.9%) | 498 (6.6%) |
| $2,500 to $4,999 | 298 (3.2%) | 352 (4.7%) |
| $5,000 to $7,499 | 159 (1.7%) | 308 (4.1%) |
| $7,500 to $9,999 | 252 (2.7%) | 390 (5.2%) |
| $10,000 to $12,499 | 239 (2.5%) | 279 (3.7%) |
| $12,500 to $14,999 | 201 (2.1%) | 257 (3.4%) |
| $15,000 to $17,499 | 172 (1.8%) | 299 (4.0%) |
| $17,500 to $19,999 | 157 (1.7%) | 376 (5.0%) |
| $20,000 to $22,499 | 141 (1.5%) | 200 (2.6%) |
| $22,500 to $24,999 | 257 (2.7%) | 382 (5.1%) |
| $25,000 to $29,999 | 663 (7.1%) | 608 (8.1%) |
| $30,000 to $34,999 | 885 (9.4%) | 1,067 (14.1%) |
| $35,000 to $39,999 | 907 (9.7%) | 620 (8.2%) |
| $40,000 to $44,999 | 760 (8.1%) | 555 (7.4%) |
| $45,000 to $49,999 | 572 (6.1%) | 298 (4.0%) |
| $50,000 to $54,999 | 420 (4.5%) | 197 (2.6%) |
| $55,000 to $64,999 | 951 (10.1%) | 513 (6.8%) |
| $65,000 to $74,999 | 310 (3.3%) | 133 (1.8%) |
| $75,000 to $99,999 | 538 (5.7%) | 110 (1.5%) |
| $100,000+ | 1,147 (12.2%) | 103 (1.4%) |
| Total | 9,394 (100.0%) | 7,545 (100.0%) |
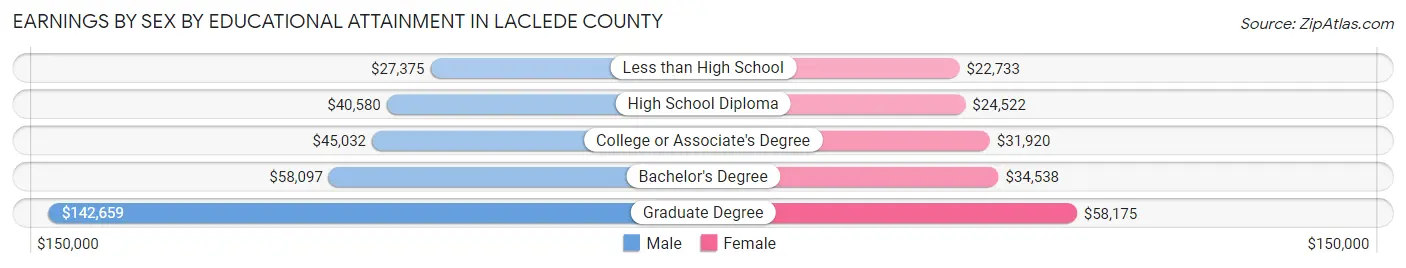
Earnings by Sex by Educational Attainment in Laclede County
Average earnings in Laclede County are $42,724 for men and $30,611 for women, a difference of 28.3%. Men with an educational attainment of graduate degree enjoy the highest average annual earnings of $142,659, while those with less than high school education earn the least with $27,375. Women with an educational attainment of graduate degree earn the most with the average annual earnings of $58,175, while those with less than high school education have the smallest earnings of $22,733.
| Educational Attainment | Male Income | Female Income |
| Less than High School | $27,375 | $22,733 |
| High School Diploma | $40,580 | $24,522 |
| College or Associate's Degree | $45,032 | $31,920 |
| Bachelor's Degree | $58,097 | $34,538 |
| Graduate Degree | $142,659 | $58,175 |
| Total | $42,724 | $30,611 |
Family Income in Laclede County
Family Income Brackets in Laclede County
According to the Laclede County family income data, there are 1,826 families falling into the $35,000 to $49,999 income range, which is the most common income bracket and makes up 18.7% of all families. Conversely, the $10,000 to $14,999 income bracket is the least frequent group with only 225 families (2.3%) belonging to this category.
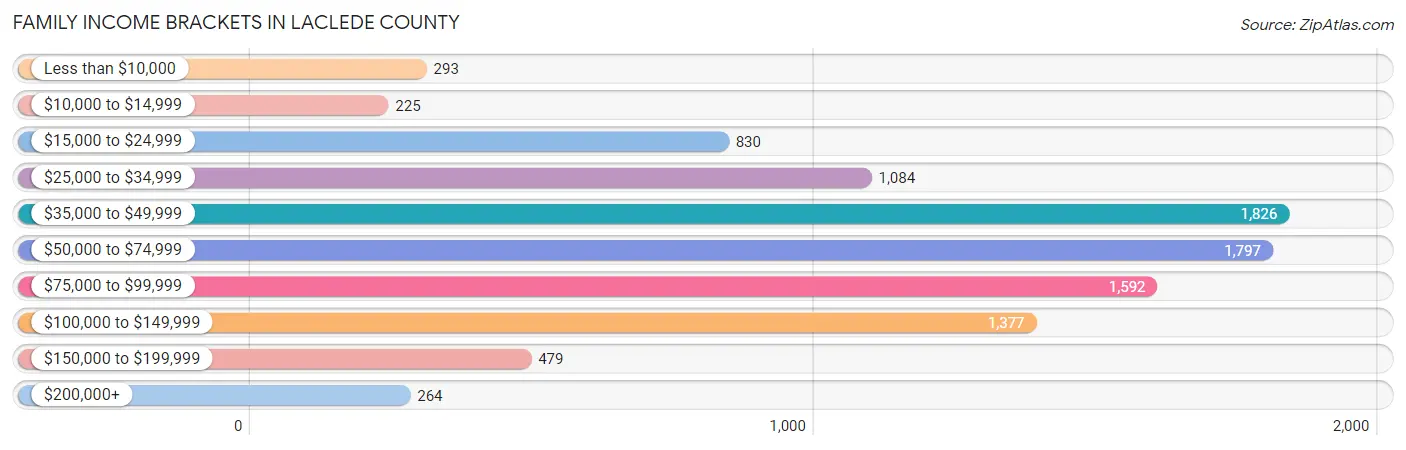
| Income Bracket | # Families | % Families |
| Less than $10,000 | 293 | 3.0% |
| $10,000 to $14,999 | 225 | 2.3% |
| $15,000 to $24,999 | 830 | 8.5% |
| $25,000 to $34,999 | 1,084 | 11.1% |
| $35,000 to $49,999 | 1,826 | 18.7% |
| $50,000 to $74,999 | 1,797 | 18.4% |
| $75,000 to $99,999 | 1,592 | 16.3% |
| $100,000 to $149,999 | 1,377 | 14.1% |
| $150,000 to $199,999 | 479 | 4.9% |
| $200,000+ | 264 | 2.7% |
Family Income by Famaliy Size in Laclede County
5-person families (739 | 7.6%) account for the highest median family income in Laclede County with $82,188 per family, while 2-person families (5,017 | 51.4%) have the highest median income of $24,886 per family member.
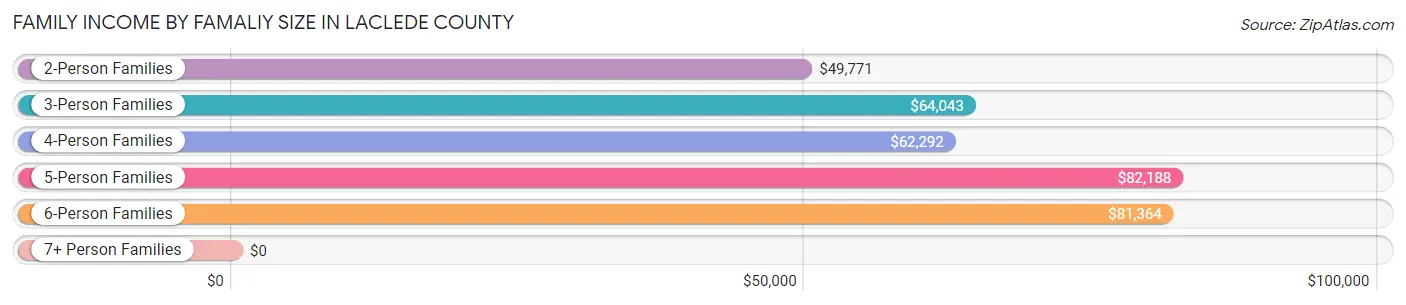
| Income Bracket | # Families | Median Income |
| 2-Person Families | 5,017 (51.4%) | $49,771 |
| 3-Person Families | 1,960 (20.1%) | $64,043 |
| 4-Person Families | 1,518 (15.5%) | $62,292 |
| 5-Person Families | 739 (7.6%) | $82,188 |
| 6-Person Families | 262 (2.7%) | $81,364 |
| 7+ Person Families | 271 (2.8%) | $0 |
| Total | 9,767 (100.0%) | $60,463 |
Family Income by Number of Earners in Laclede County
The median family income in Laclede County is $60,463, with families comprising 3+ earners (712) having the highest median family income of $96,563, while families with no earners (1,942) have the lowest median family income of $34,403, accounting for 7.3% and 19.9% of families, respectively.
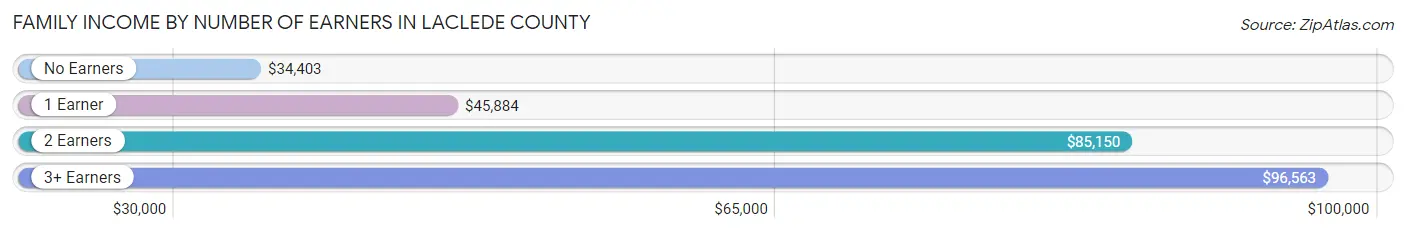
| Number of Earners | # Families | Median Income |
| No Earners | 1,942 (19.9%) | $34,403 |
| 1 Earner | 3,517 (36.0%) | $45,884 |
| 2 Earners | 3,596 (36.8%) | $85,150 |
| 3+ Earners | 712 (7.3%) | $96,563 |
| Total | 9,767 (100.0%) | $60,463 |
Household Income in Laclede County
Household Income Brackets in Laclede County
With 2,625 households falling in the category, the $35,000 to $49,999 income range is the most frequent in Laclede County, accounting for 18.3% of all households. In contrast, only 287 households (2.0%) fall into the $200,000+ income bracket, making it the least populous group.
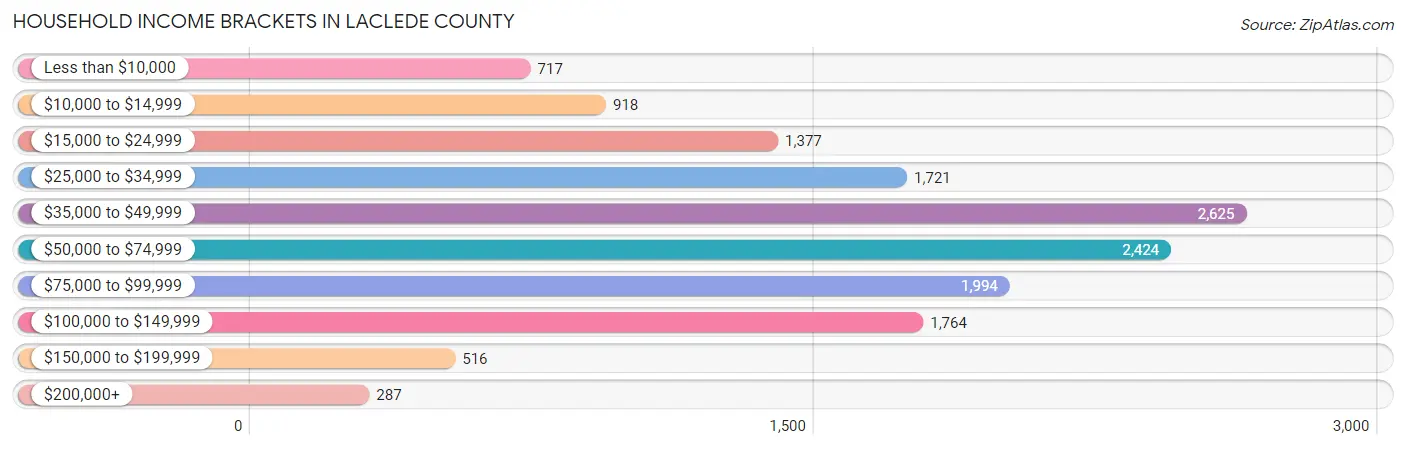
| Income Bracket | # Households | % Households |
| Less than $10,000 | 717 | 5.0% |
| $10,000 to $14,999 | 918 | 6.4% |
| $15,000 to $24,999 | 1,377 | 9.6% |
| $25,000 to $34,999 | 1,721 | 12.0% |
| $35,000 to $49,999 | 2,625 | 18.3% |
| $50,000 to $74,999 | 2,424 | 16.9% |
| $75,000 to $99,999 | 1,994 | 13.9% |
| $100,000 to $149,999 | 1,764 | 12.3% |
| $150,000 to $199,999 | 516 | 3.6% |
| $200,000+ | 287 | 2.0% |
Household Income by Householder Age in Laclede County
The median household income in Laclede County is $49,202, with the highest median household income of $63,379 found in the 25 to 44 years age bracket for the primary householder. A total of 4,266 households (29.7%) fall into this category. Meanwhile, the 65+ years age bracket for the primary householder has the lowest median household income of $34,591, with 4,222 households (29.4%) in this group.
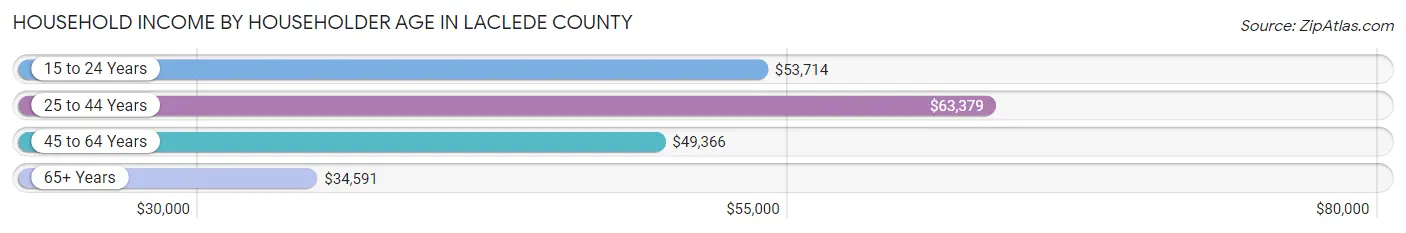
| Income Bracket | # Households | Median Income |
| 15 to 24 Years | 560 (3.9%) | $53,714 |
| 25 to 44 Years | 4,266 (29.7%) | $63,379 |
| 45 to 64 Years | 5,297 (36.9%) | $49,366 |
| 65+ Years | 4,222 (29.4%) | $34,591 |
| Total | 14,345 (100.0%) | $49,202 |
Poverty in Laclede County
Income Below Poverty by Sex and Age in Laclede County
With 14.2% poverty level for males and 20.0% for females among the residents of Laclede County, under 5 year old males and 16 and 17 year old females are the most vulnerable to poverty, with 412 males (32.6%) and 186 females (35.0%) in their respective age groups living below the poverty level.
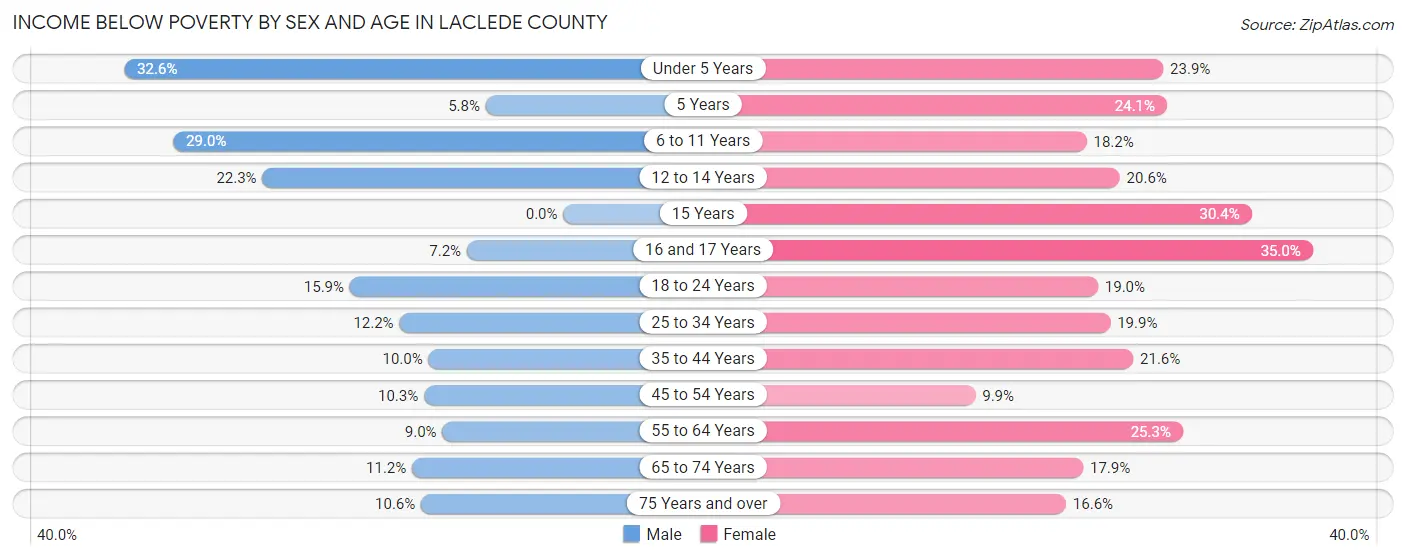
| Age Bracket | Male | Female |
| Under 5 Years | 412 (32.6%) | 266 (23.9%) |
| 5 Years | 11 (5.8%) | 76 (24.1%) |
| 6 to 11 Years | 464 (29.0%) | 220 (18.2%) |
| 12 to 14 Years | 145 (22.3%) | 130 (20.6%) |
| 15 Years | 0 (0.0%) | 94 (30.4%) |
| 16 and 17 Years | 29 (7.2%) | 186 (35.0%) |
| 18 to 24 Years | 234 (15.9%) | 247 (19.0%) |
| 25 to 34 Years | 255 (12.2%) | 410 (19.9%) |
| 35 to 44 Years | 215 (10.0%) | 471 (21.6%) |
| 45 to 54 Years | 227 (10.3%) | 214 (9.9%) |
| 55 to 64 Years | 222 (9.0%) | 615 (25.3%) |
| 65 to 74 Years | 199 (11.2%) | 357 (17.9%) |
| 75 Years and over | 126 (10.6%) | 233 (16.6%) |
| Total | 2,539 (14.2%) | 3,519 (20.0%) |
Income Above Poverty by Sex and Age in Laclede County
According to the poverty statistics in Laclede County, males aged 15 years and females aged 45 to 54 years are the age groups that are most secure financially, with 100.0% of males and 90.1% of females in these age groups living above the poverty line.
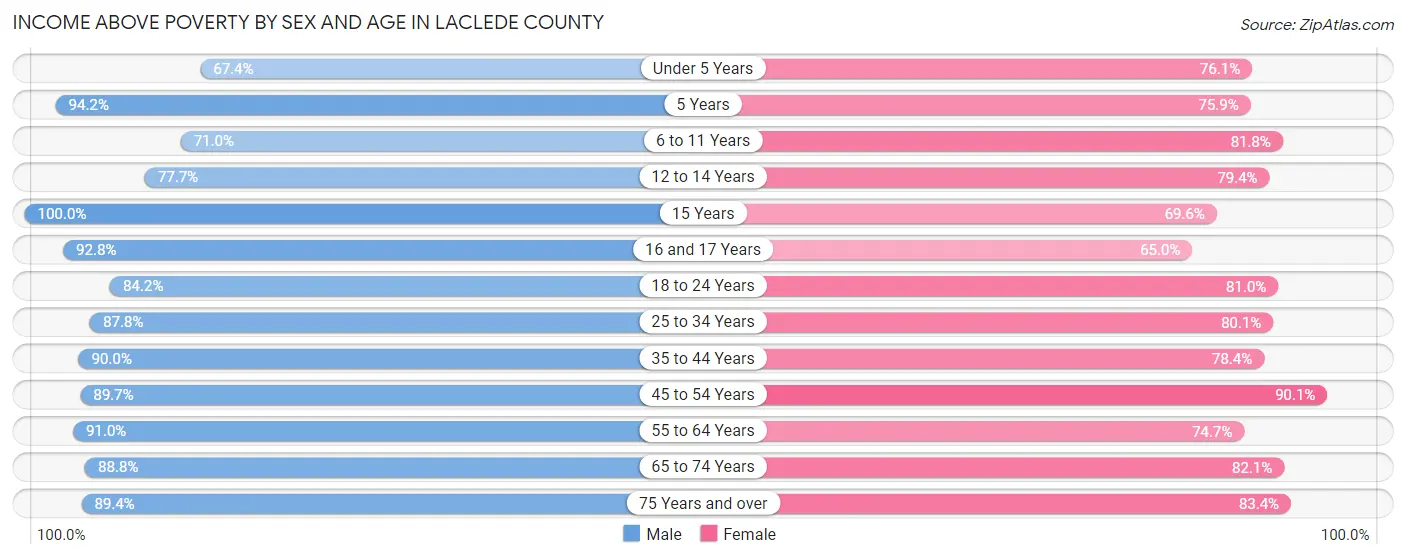
| Age Bracket | Male | Female |
| Under 5 Years | 851 (67.4%) | 849 (76.1%) |
| 5 Years | 180 (94.2%) | 239 (75.9%) |
| 6 to 11 Years | 1,137 (71.0%) | 991 (81.8%) |
| 12 to 14 Years | 504 (77.7%) | 500 (79.4%) |
| 15 Years | 424 (100.0%) | 215 (69.6%) |
| 16 and 17 Years | 376 (92.8%) | 346 (65.0%) |
| 18 to 24 Years | 1,242 (84.2%) | 1,052 (81.0%) |
| 25 to 34 Years | 1,840 (87.8%) | 1,647 (80.1%) |
| 35 to 44 Years | 1,933 (90.0%) | 1,707 (78.4%) |
| 45 to 54 Years | 1,968 (89.7%) | 1,946 (90.1%) |
| 55 to 64 Years | 2,250 (91.0%) | 1,815 (74.7%) |
| 65 to 74 Years | 1,573 (88.8%) | 1,636 (82.1%) |
| 75 Years and over | 1,067 (89.4%) | 1,167 (83.4%) |
| Total | 15,345 (85.8%) | 14,110 (80.0%) |
Income Below Poverty Among Married-Couple Families in Laclede County
The poverty statistics for married-couple families in Laclede County show that 7.4% or 544 of the total 7,342 families live below the poverty line. Families with 5 or more children have the highest poverty rate of 51.2%, comprising of 124 families. On the other hand, families with 3 or 4 children have the lowest poverty rate of 3.7%, which includes 17 families.
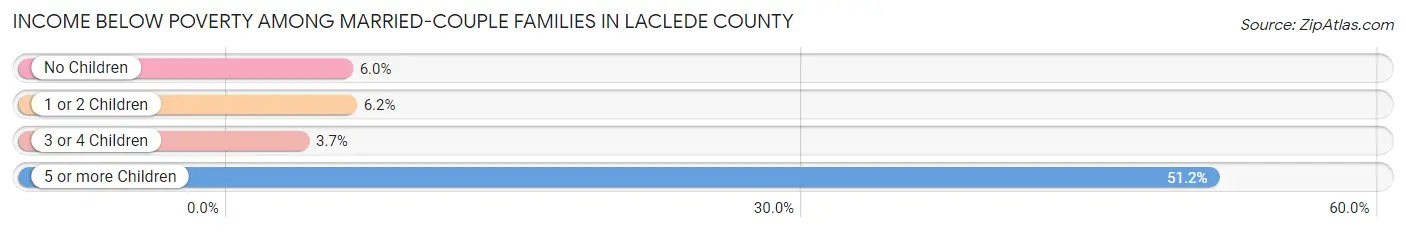
| Children | Above Poverty | Below Poverty |
| No Children | 3,970 (94.0%) | 253 (6.0%) |
| 1 or 2 Children | 2,269 (93.8%) | 150 (6.2%) |
| 3 or 4 Children | 441 (96.3%) | 17 (3.7%) |
| 5 or more Children | 118 (48.8%) | 124 (51.2%) |
| Total | 6,798 (92.6%) | 544 (7.4%) |
Income Below Poverty Among Single-Parent Households in Laclede County
According to the poverty data in Laclede County, 6.5% or 59 single-father households and 32.7% or 495 single-mother households are living below the poverty line. Among single-father households, those with 3 or 4 children have the highest poverty rate, with 11 households (23.9%) experiencing poverty. Likewise, among single-mother households, those with 3 or 4 children have the highest poverty rate, with 201 households (96.6%) falling below the poverty line.
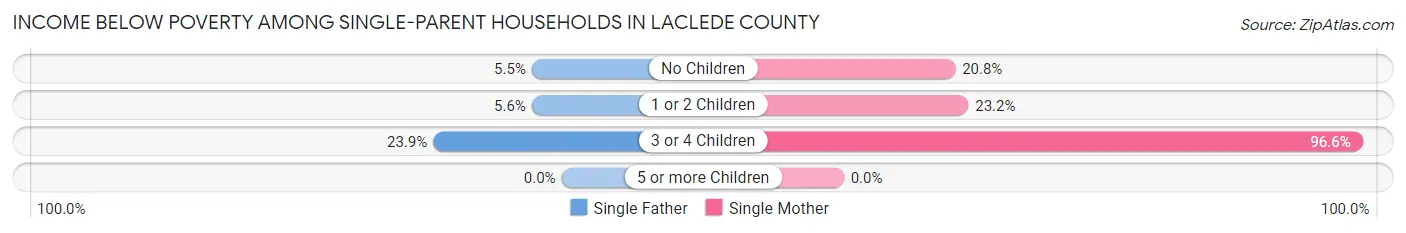
| Children | Single Father | Single Mother |
| No Children | 15 (5.5%) | 76 (20.8%) |
| 1 or 2 Children | 33 (5.6%) | 218 (23.2%) |
| 3 or 4 Children | 11 (23.9%) | 201 (96.6%) |
| 5 or more Children | 0 (0.0%) | 0 (0.0%) |
| Total | 59 (6.5%) | 495 (32.7%) |
Income Below Poverty Among Married-Couple vs Single-Parent Households in Laclede County
The poverty data for Laclede County shows that 544 of the married-couple family households (7.4%) and 554 of the single-parent households (22.9%) are living below the poverty level. Within the married-couple family households, those with 5 or more children have the highest poverty rate, with 124 households (51.2%) falling below the poverty line. Among the single-parent households, those with 3 or 4 children have the highest poverty rate, with 212 household (83.5%) living below poverty.
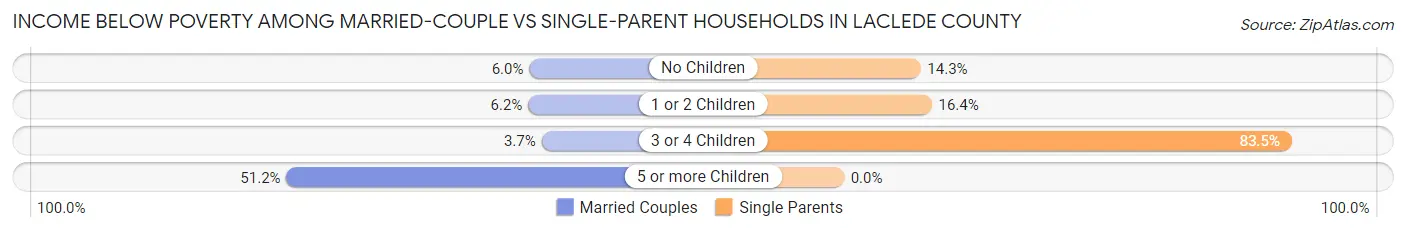
| Children | Married-Couple Families | Single-Parent Households |
| No Children | 253 (6.0%) | 91 (14.3%) |
| 1 or 2 Children | 150 (6.2%) | 251 (16.4%) |
| 3 or 4 Children | 17 (3.7%) | 212 (83.5%) |
| 5 or more Children | 124 (51.2%) | 0 (0.0%) |
| Total | 544 (7.4%) | 554 (22.9%) |
Race in Laclede County
The most populous races in Laclede County are White / Caucasian (33,013 | 91.5%), Two or more Races (1,830 | 5.1%), and Hispanic or Latino (980 | 2.7%).
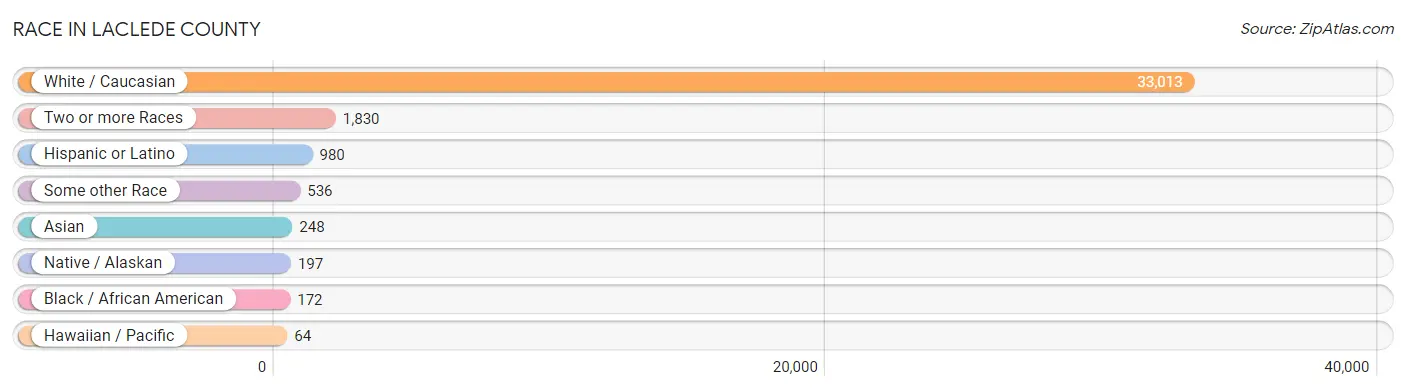
| Race | # Population | % Population |
| Asian | 248 | 0.7% |
| Black / African American | 172 | 0.5% |
| Hawaiian / Pacific | 64 | 0.2% |
| Hispanic or Latino | 980 | 2.7% |
| Native / Alaskan | 197 | 0.5% |
| White / Caucasian | 33,013 | 91.5% |
| Two or more Races | 1,830 | 5.1% |
| Some other Race | 536 | 1.5% |
| Total | 36,060 | 100.0% |
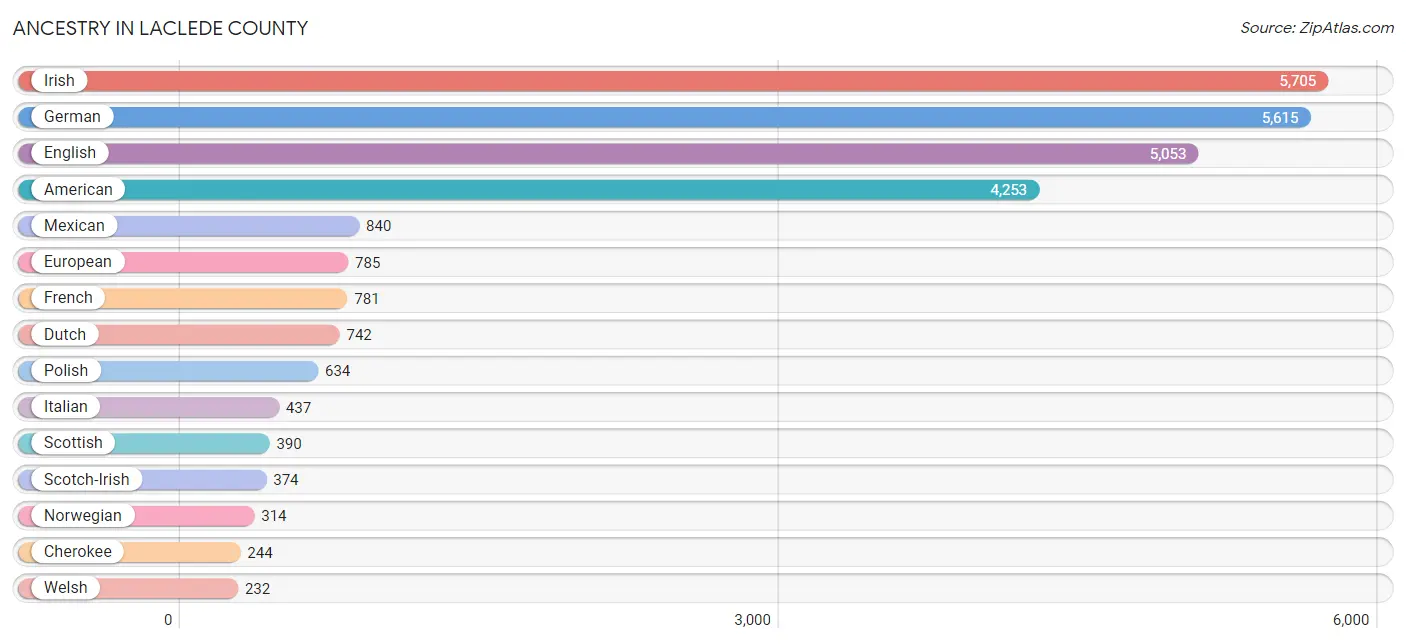
Ancestry in Laclede County
The most populous ancestries reported in Laclede County are Irish (5,705 | 15.8%), German (5,615 | 15.6%), English (5,053 | 14.0%), American (4,253 | 11.8%), and Mexican (840 | 2.3%), together accounting for 59.5% of all Laclede County residents.
| Ancestry | # Population | % Population |
| African | 91 | 0.3% |
| Alaskan Athabascan | 1 | 0.0% |
| Aleut | 1 | 0.0% |
| American | 4,253 | 11.8% |
| Apache | 49 | 0.1% |
| Arab | 122 | 0.3% |
| Australian | 21 | 0.1% |
| Austrian | 10 | 0.0% |
| Bhutanese | 29 | 0.1% |
| Blackfeet | 22 | 0.1% |
| British | 147 | 0.4% |
| Bulgarian | 1 | 0.0% |
| Burmese | 76 | 0.2% |
| Cajun | 10 | 0.0% |
| Canadian | 14 | 0.0% |
| Celtic | 22 | 0.1% |
| Central American | 21 | 0.1% |
| Cherokee | 244 | 0.7% |
| Choctaw | 11 | 0.0% |
| Croatian | 3 | 0.0% |
| Crow | 1 | 0.0% |
| Cuban | 5 | 0.0% |
| Czech | 106 | 0.3% |
| Czechoslovakian | 43 | 0.1% |
| Danish | 30 | 0.1% |
| Dutch | 742 | 2.1% |
| Eastern European | 43 | 0.1% |
| English | 5,053 | 14.0% |
| European | 785 | 2.2% |
| Finnish | 12 | 0.0% |
| French | 781 | 2.2% |
| French Canadian | 101 | 0.3% |
| German | 5,615 | 15.6% |
| Greek | 6 | 0.0% |
| Honduran | 21 | 0.1% |
| Hungarian | 40 | 0.1% |
| Indian (Asian) | 78 | 0.2% |
| Irish | 5,705 | 15.8% |
| Iroquois | 17 | 0.1% |
| Italian | 437 | 1.2% |
| Korean | 164 | 0.4% |
| Macedonian | 18 | 0.1% |
| Mexican | 840 | 2.3% |
| Mexican American Indian | 110 | 0.3% |
| Native Hawaiian | 43 | 0.1% |
| Navajo | 13 | 0.0% |
| Northern European | 37 | 0.1% |
| Norwegian | 314 | 0.9% |
| Osage | 10 | 0.0% |
| Pakistani | 23 | 0.1% |
| Pennsylvania German | 25 | 0.1% |
| Polish | 634 | 1.8% |
| Portuguese | 41 | 0.1% |
| Romanian | 27 | 0.1% |
| Russian | 38 | 0.1% |
| Samoan | 21 | 0.1% |
| Scandinavian | 44 | 0.1% |
| Scotch-Irish | 374 | 1.0% |
| Scottish | 390 | 1.1% |
| Seminole | 10 | 0.0% |
| Slovak | 14 | 0.0% |
| Slovene | 10 | 0.0% |
| Spaniard | 75 | 0.2% |
| Subsaharan African | 91 | 0.3% |
| Swedish | 191 | 0.5% |
| Swiss | 49 | 0.1% |
| Syrian | 122 | 0.3% |
| Ukrainian | 54 | 0.2% |
| Welsh | 232 | 0.6% |
| Yugoslavian | 40 | 0.1% | View All 70 Rows |
Immigrants in Laclede County
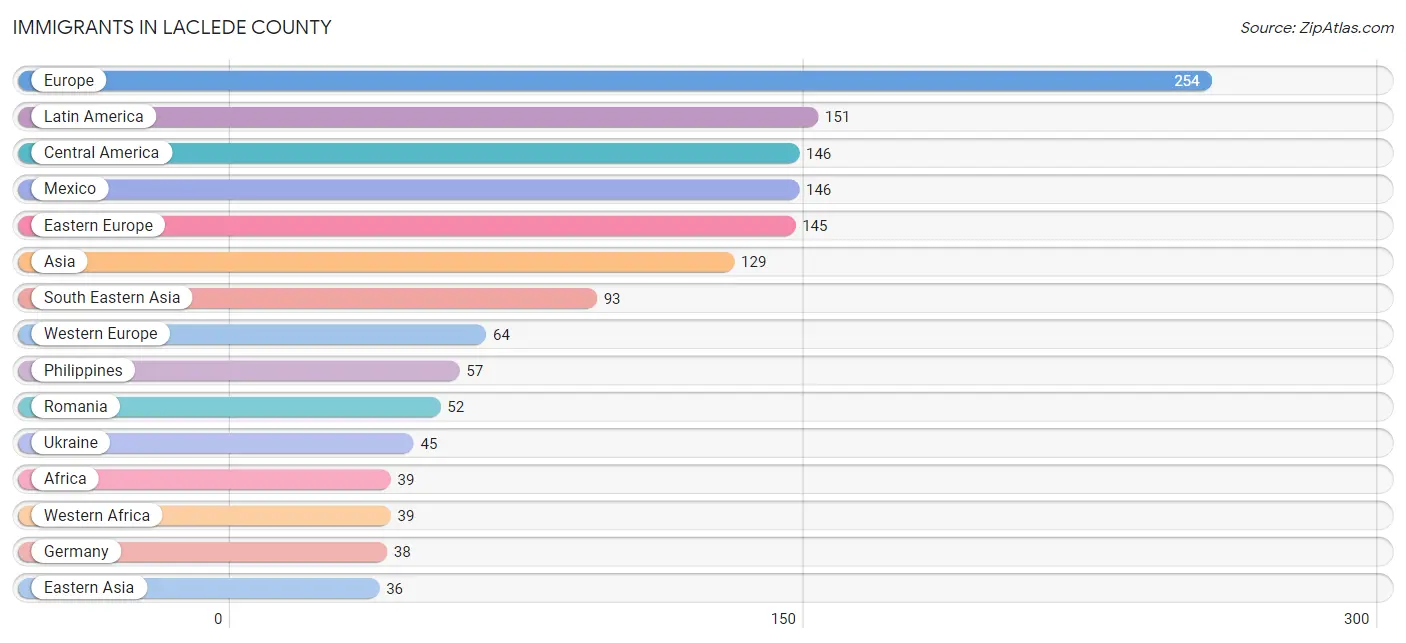
The most numerous immigrant groups reported in Laclede County came from Europe (254 | 0.7%), Latin America (151 | 0.4%), Central America (146 | 0.4%), Mexico (146 | 0.4%), and Eastern Europe (145 | 0.4%), together accounting for 2.3% of all Laclede County residents.
| Immigration Origin | # Population | % Population |
| Africa | 39 | 0.1% |
| Asia | 129 | 0.4% |
| Austria | 10 | 0.0% |
| Bosnia and Herzegovina | 14 | 0.0% |
| Bulgaria | 18 | 0.1% |
| Cambodia | 13 | 0.0% |
| Caribbean | 5 | 0.0% |
| Central America | 146 | 0.4% |
| China | 22 | 0.1% |
| Cuba | 5 | 0.0% |
| Eastern Asia | 36 | 0.1% |
| Eastern Europe | 145 | 0.4% |
| England | 17 | 0.1% |
| Europe | 254 | 0.7% |
| France | 16 | 0.0% |
| Germany | 38 | 0.1% |
| Hong Kong | 6 | 0.0% |
| Japan | 14 | 0.0% |
| Latin America | 151 | 0.4% |
| Mexico | 146 | 0.4% |
| Northern Europe | 17 | 0.1% |
| Philippines | 57 | 0.2% |
| Romania | 52 | 0.1% |
| Russia | 16 | 0.0% |
| South Eastern Asia | 93 | 0.3% |
| Thailand | 23 | 0.1% |
| Ukraine | 45 | 0.1% |
| Western Africa | 39 | 0.1% |
| Western Europe | 64 | 0.2% | View All 29 Rows |
Sex and Age in Laclede County
Sex and Age in Laclede County
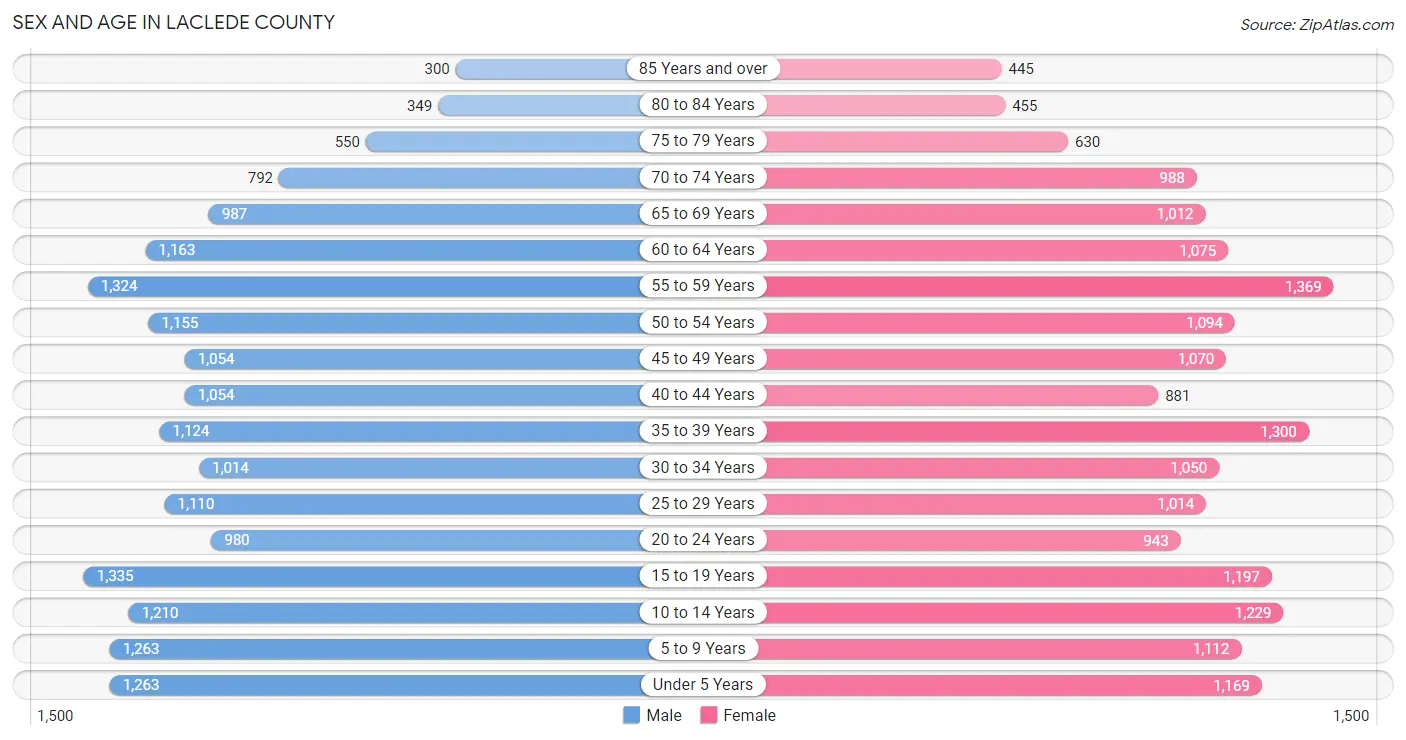
The most populous age groups in Laclede County are 15 to 19 Years (1,335 | 7.4%) for men and 55 to 59 Years (1,369 | 7.6%) for women.
| Age Bracket | Male | Female |
| Under 5 Years | 1,263 (7.0%) | 1,169 (6.5%) |
| 5 to 9 Years | 1,263 (7.0%) | 1,112 (6.2%) |
| 10 to 14 Years | 1,210 (6.7%) | 1,229 (6.8%) |
| 15 to 19 Years | 1,335 (7.4%) | 1,197 (6.6%) |
| 20 to 24 Years | 980 (5.4%) | 943 (5.2%) |
| 25 to 29 Years | 1,110 (6.2%) | 1,014 (5.6%) |
| 30 to 34 Years | 1,014 (5.6%) | 1,050 (5.8%) |
| 35 to 39 Years | 1,124 (6.2%) | 1,300 (7.2%) |
| 40 to 44 Years | 1,054 (5.9%) | 881 (4.9%) |
| 45 to 49 Years | 1,054 (5.9%) | 1,070 (5.9%) |
| 50 to 54 Years | 1,155 (6.4%) | 1,094 (6.1%) |
| 55 to 59 Years | 1,324 (7.3%) | 1,369 (7.6%) |
| 60 to 64 Years | 1,163 (6.5%) | 1,075 (6.0%) |
| 65 to 69 Years | 987 (5.5%) | 1,012 (5.6%) |
| 70 to 74 Years | 792 (4.4%) | 988 (5.5%) |
| 75 to 79 Years | 550 (3.0%) | 630 (3.5%) |
| 80 to 84 Years | 349 (1.9%) | 455 (2.5%) |
| 85 Years and over | 300 (1.7%) | 445 (2.5%) |
| Total | 18,027 (100.0%) | 18,033 (100.0%) |
Families and Households in Laclede County
Median Family Size in Laclede County
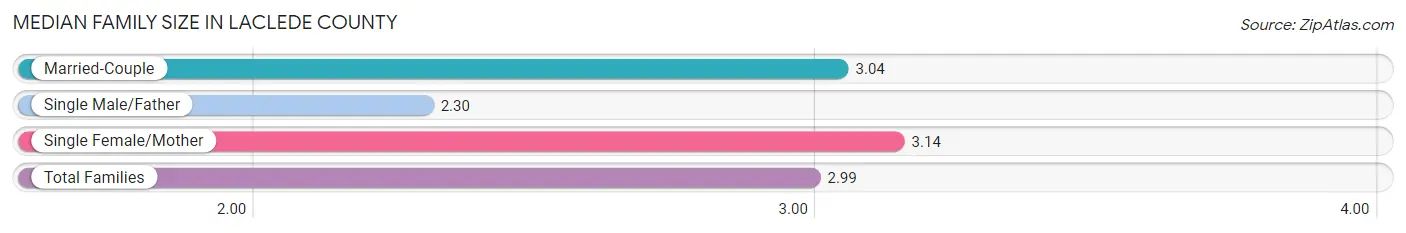
The median family size in Laclede County is 2.99 persons per family, with single female/mother families (1,513 | 15.5%) accounting for the largest median family size of 3.14 persons per family. On the other hand, single male/father families (912 | 9.3%) represent the smallest median family size with 2.30 persons per family.
| Family Type | # Families | Family Size |
| Married-Couple | 7,342 (75.2%) | 3.04 |
| Single Male/Father | 912 (9.3%) | 2.30 |
| Single Female/Mother | 1,513 (15.5%) | 3.14 |
| Total Families | 9,767 (100.0%) | 2.99 |
Median Household Size in Laclede County
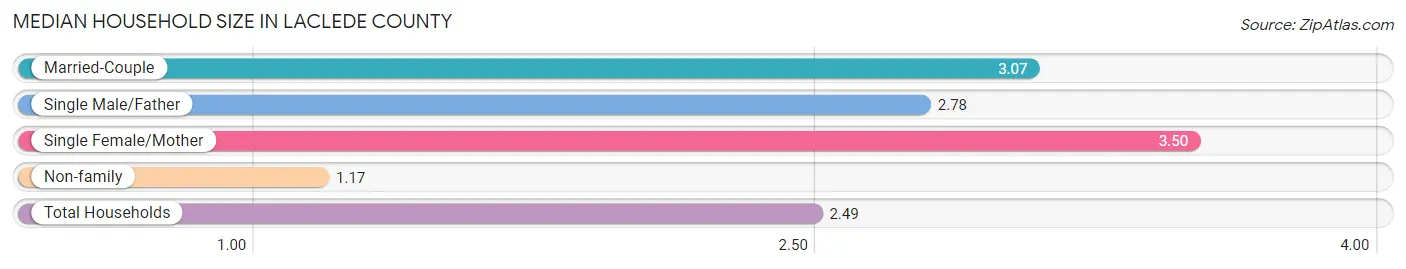
The median household size in Laclede County is 2.49 persons per household, with single female/mother households (1,513 | 10.5%) accounting for the largest median household size of 3.5 persons per household. non-family households (4,578 | 31.9%) represent the smallest median household size with 1.17 persons per household.
| Household Type | # Households | Household Size |
| Married-Couple | 7,342 (51.2%) | 3.07 |
| Single Male/Father | 912 (6.4%) | 2.78 |
| Single Female/Mother | 1,513 (10.5%) | 3.50 |
| Non-family | 4,578 (31.9%) | 1.17 |
| Total Households | 14,345 (100.0%) | 2.49 |
Household Size by Marriage Status in Laclede County
Out of a total of 14,345 households in Laclede County, 9,767 (68.1%) are family households, while 4,578 (31.9%) are nonfamily households. The most numerous type of family households are 2-person households, comprising 4,772, and the most common type of nonfamily households are 1-person households, comprising 3,695.
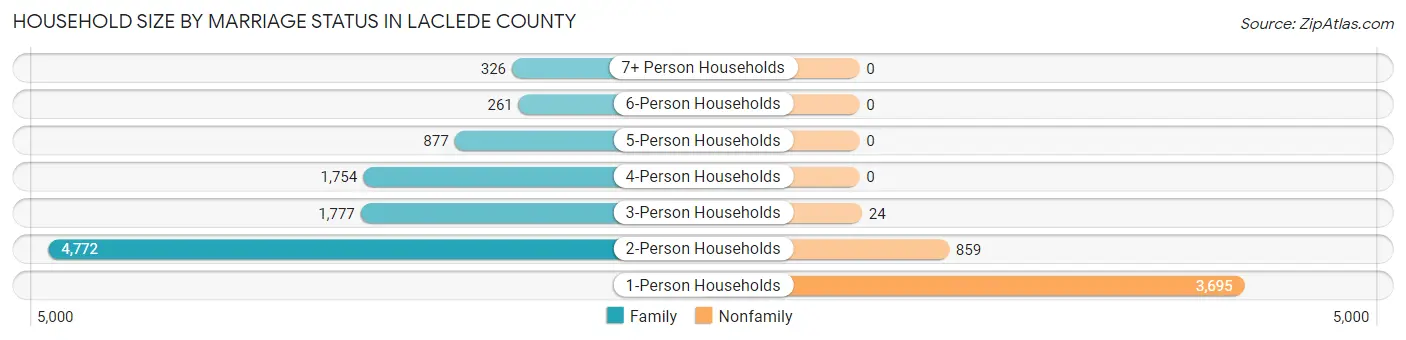
| Household Size | Family Households | Nonfamily Households |
| 1-Person Households | - | 3,695 (25.8%) |
| 2-Person Households | 4,772 (33.3%) | 859 (6.0%) |
| 3-Person Households | 1,777 (12.4%) | 24 (0.2%) |
| 4-Person Households | 1,754 (12.2%) | 0 (0.0%) |
| 5-Person Households | 877 (6.1%) | 0 (0.0%) |
| 6-Person Households | 261 (1.8%) | 0 (0.0%) |
| 7+ Person Households | 326 (2.3%) | 0 (0.0%) |
| Total | 9,767 (68.1%) | 4,578 (31.9%) |
Female Fertility in Laclede County
Fertility by Age in Laclede County
Average fertility rate in Laclede County is 95.0 births per 1,000 women. Women in the age bracket of 20 to 34 years have the highest fertility rate with 173.0 births per 1,000 women. Women in the age bracket of 20 to 34 years acount for 71.1% of all women with births.
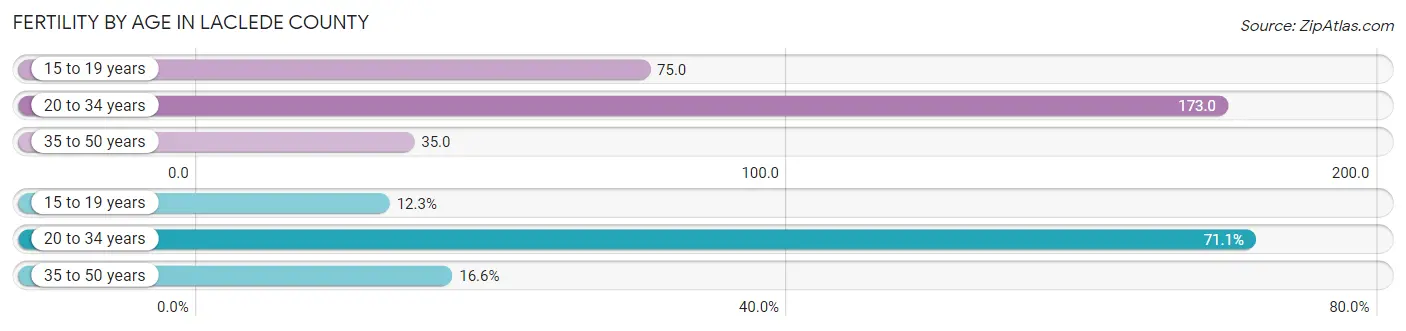
| Age Bracket | Women with Births | Births / 1,000 Women |
| 15 to 19 years | 90 (12.3%) | 75.0 |
| 20 to 34 years | 519 (71.1%) | 173.0 |
| 35 to 50 years | 121 (16.6%) | 35.0 |
| Total | 730 (100.0%) | 95.0 |
Fertility by Age by Marriage Status in Laclede County
69.0% of women with births (730) in Laclede County are married. The highest percentage of unmarried women with births falls into 15 to 19 years age bracket with 100.0% of them unmarried at the time of birth, while the lowest percentage of unmarried women with births belong to 20 to 34 years age bracket with 17.5% of them unmarried.
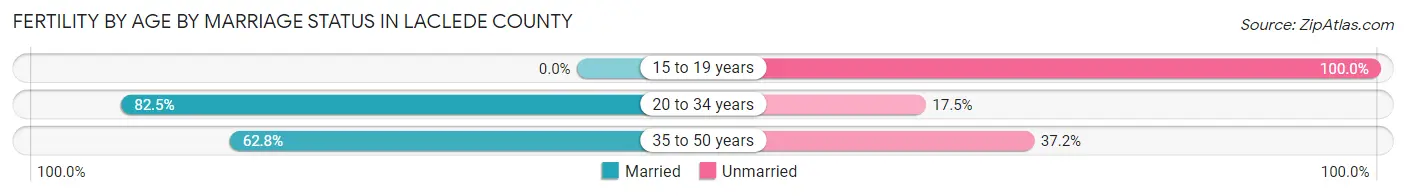
| Age Bracket | Married | Unmarried |
| 15 to 19 years | 0 (0.0%) | 90 (100.0%) |
| 20 to 34 years | 428 (82.5%) | 91 (17.5%) |
| 35 to 50 years | 76 (62.8%) | 45 (37.2%) |
| Total | 504 (69.0%) | 226 (31.0%) |
Fertility by Education in Laclede County
Average fertility rate in Laclede County is 95.0 births per 1,000 women. Women with the education attainment of bachelor's degree have the highest fertility rate of 173.0 births per 1,000 women, while women with the education attainment of graduate degree have the lowest fertility at 4.0 births per 1,000 women. Women with the education attainment of college or associate's degree represent 34.1% of all women with births.
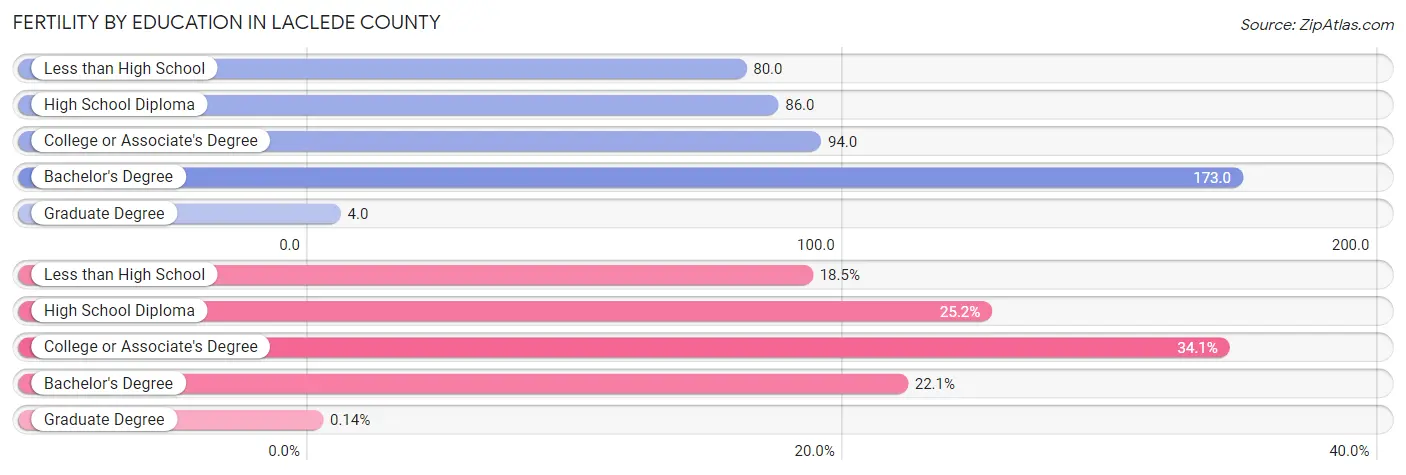
| Educational Attainment | Women with Births | Births / 1,000 Women |
| Less than High School | 135 (18.5%) | 80.0 |
| High School Diploma | 184 (25.2%) | 86.0 |
| College or Associate's Degree | 249 (34.1%) | 94.0 |
| Bachelor's Degree | 161 (22.1%) | 173.0 |
| Graduate Degree | 1 (0.1%) | 4.0 |
| Total | 730 (100.0%) | 95.0 |
Fertility by Education by Marriage Status in Laclede County
31.0% of women with births in Laclede County are unmarried. Women with the educational attainment of bachelor's degree are most likely to be married with 100.0% of them married at childbirth, while women with the educational attainment of high school diploma are least likely to be married with 54.3% of them unmarried at childbirth.
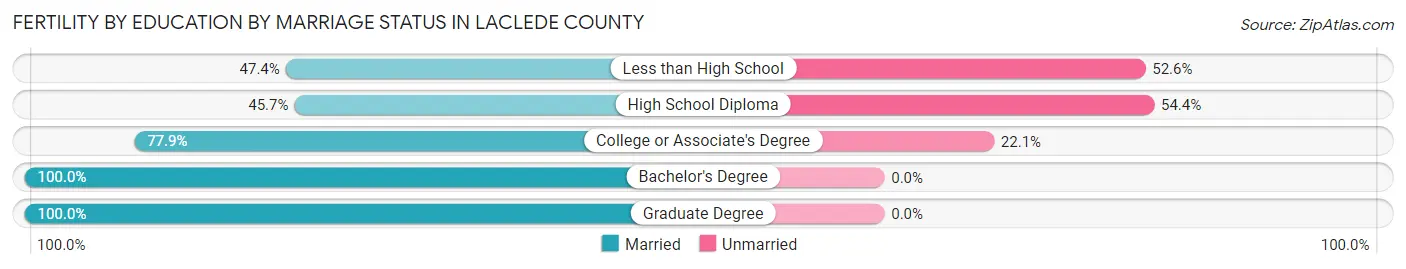
| Educational Attainment | Married | Unmarried |
| Less than High School | 64 (47.4%) | 71 (52.6%) |
| High School Diploma | 84 (45.7%) | 100 (54.3%) |
| College or Associate's Degree | 194 (77.9%) | 55 (22.1%) |
| Bachelor's Degree | 161 (100.0%) | 0 (0.0%) |
| Graduate Degree | 1 (100.0%) | 0 (0.0%) |
| Total | 504 (69.0%) | 226 (31.0%) |
Employment Characteristics in Laclede County
Employment by Class of Employer in Laclede County
Among the 15,409 employed individuals in Laclede County, private company employees (10,745 | 69.7%), not-for-profit organizations (1,192 | 7.7%), and self-employed (not incorporated) (976 | 6.3%) make up the most common classes of employment.
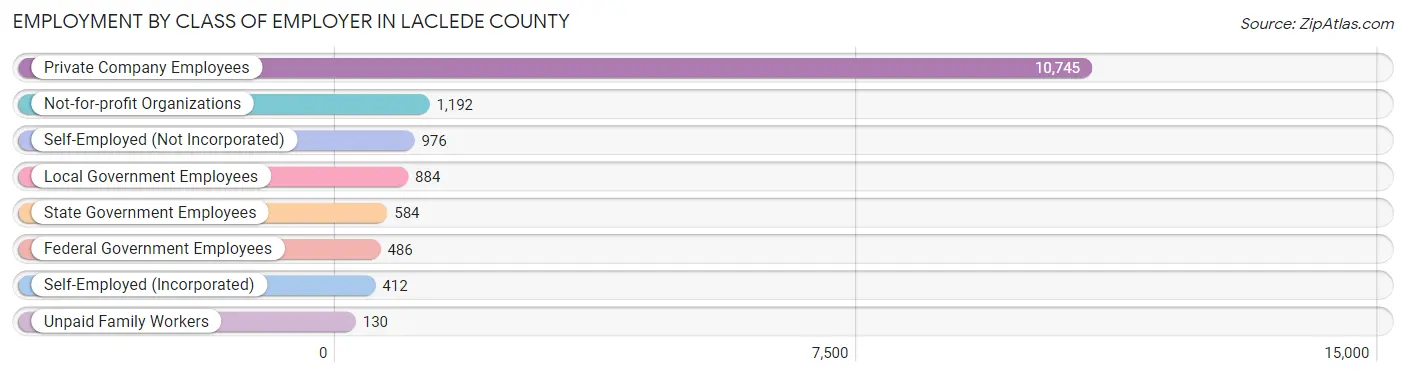
| Employer Class | # Employees | % Employees |
| Private Company Employees | 10,745 | 69.7% |
| Self-Employed (Incorporated) | 412 | 2.7% |
| Self-Employed (Not Incorporated) | 976 | 6.3% |
| Not-for-profit Organizations | 1,192 | 7.7% |
| Local Government Employees | 884 | 5.7% |
| State Government Employees | 584 | 3.8% |
| Federal Government Employees | 486 | 3.2% |
| Unpaid Family Workers | 130 | 0.8% |
| Total | 15,409 | 100.0% |
Employment Status by Age in Laclede County
According to the labor force statistics for Laclede County, out of the total population over 16 years of age (28,081), 58.8% or 16,512 individuals are in the labor force, with 5.9% or 974 of them unemployed. The age group with the highest labor force participation rate is 35 to 44 years, with 82.3% or 3,587 individuals in the labor force. Within the labor force, the 16 to 19 years age range has the highest percentage of unemployed individuals, with 17.7% or 156 of them being unemployed.
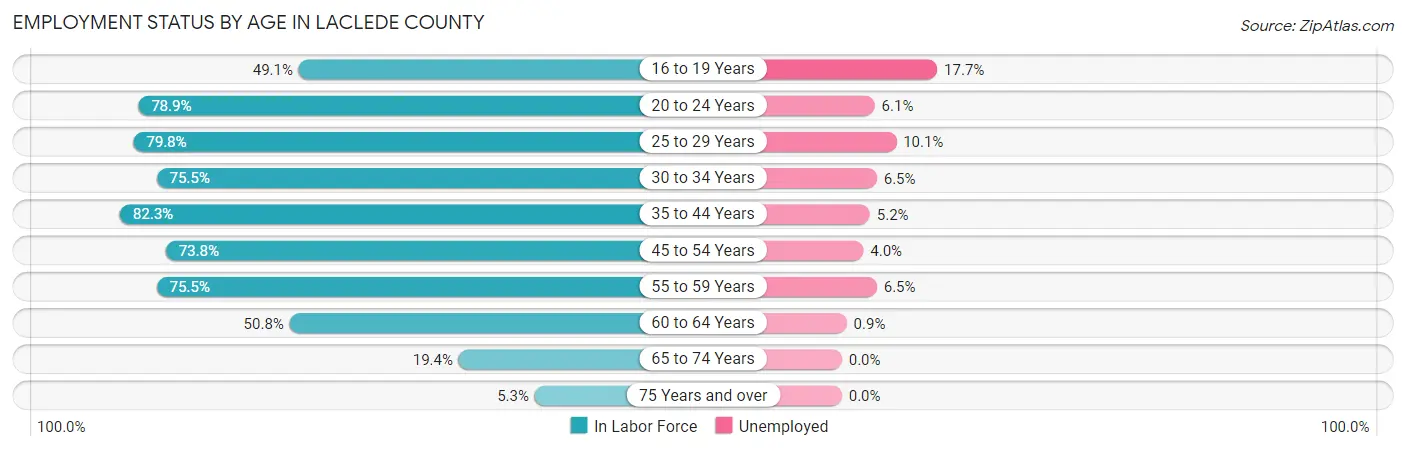
| Age Bracket | In Labor Force | Unemployed |
| 16 to 19 Years | 883 (49.1%) | 156 (17.7%) |
| 20 to 24 Years | 1,517 (78.9%) | 93 (6.1%) |
| 25 to 29 Years | 1,695 (79.8%) | 171 (10.1%) |
| 30 to 34 Years | 1,558 (75.5%) | 101 (6.5%) |
| 35 to 44 Years | 3,587 (82.3%) | 187 (5.2%) |
| 45 to 54 Years | 3,227 (73.8%) | 129 (4.0%) |
| 55 to 59 Years | 2,033 (75.5%) | 132 (6.5%) |
| 60 to 64 Years | 1,137 (50.8%) | 10 (0.9%) |
| 65 to 74 Years | 733 (19.4%) | 0 (0.0%) |
| 75 Years and over | 145 (5.3%) | 0 (0.0%) |
| Total | 16,512 (58.8%) | 974 (5.9%) |
Employment Status by Educational Attainment in Laclede County
According to labor force statistics for Laclede County, 74.1% of individuals (13,228) out of the total population between 25 and 64 years of age (17,851) are in the labor force, with 5.5% or 728 of them being unemployed. The group with the highest labor force participation rate are those with the educational attainment of bachelor's degree or higher, with 82.5% or 2,718 individuals in the labor force. Within the labor force, individuals with less than high school education have the highest percentage of unemployment, with 13.1% or 137 of them being unemployed.
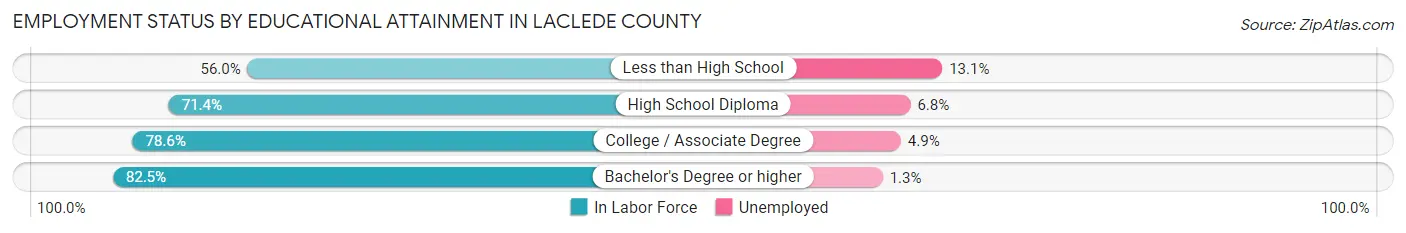
| Educational Attainment | In Labor Force | Unemployed |
| Less than High School | 1,047 (56.0%) | 245 (13.1%) |
| High School Diploma | 4,904 (71.4%) | 467 (6.8%) |
| College / Associate Degree | 4,574 (78.6%) | 285 (4.9%) |
| Bachelor's Degree or higher | 2,718 (82.5%) | 43 (1.3%) |
| Total | 13,228 (74.1%) | 982 (5.5%) |
Employment Occupations by Sex in Laclede County
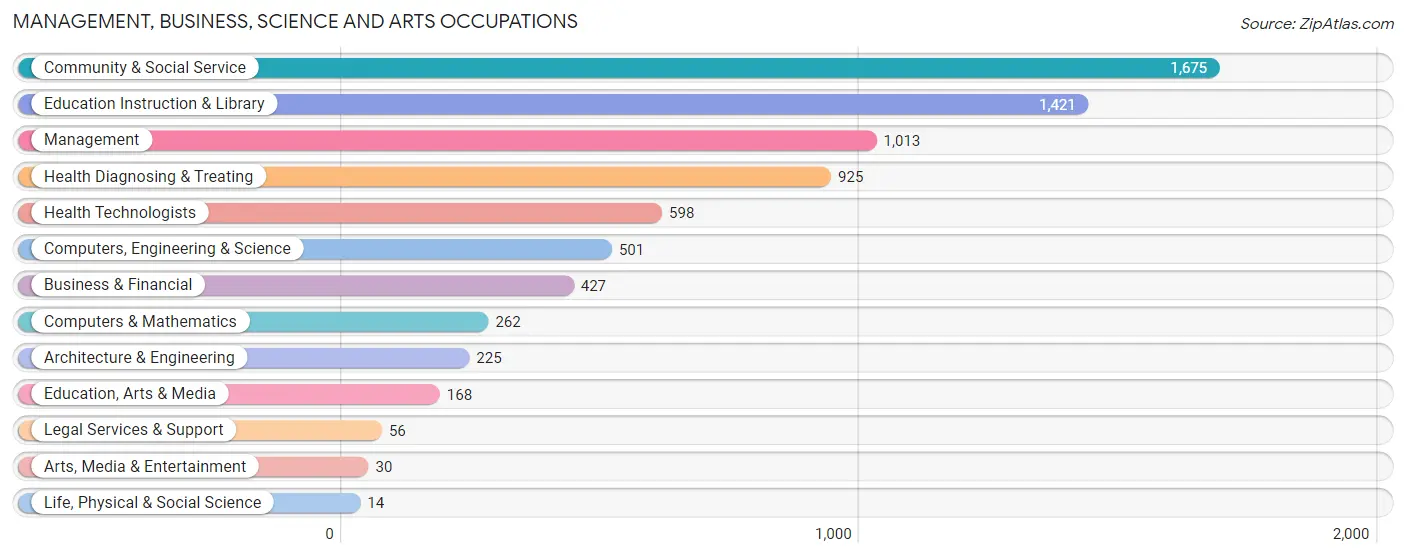
Management, Business, Science and Arts Occupations
The most common Management, Business, Science and Arts occupations in Laclede County are Community & Social Service (1,675 | 10.8%), Education Instruction & Library (1,421 | 9.2%), Management (1,013 | 6.5%), Health Diagnosing & Treating (925 | 6.0%), and Health Technologists (598 | 3.8%).
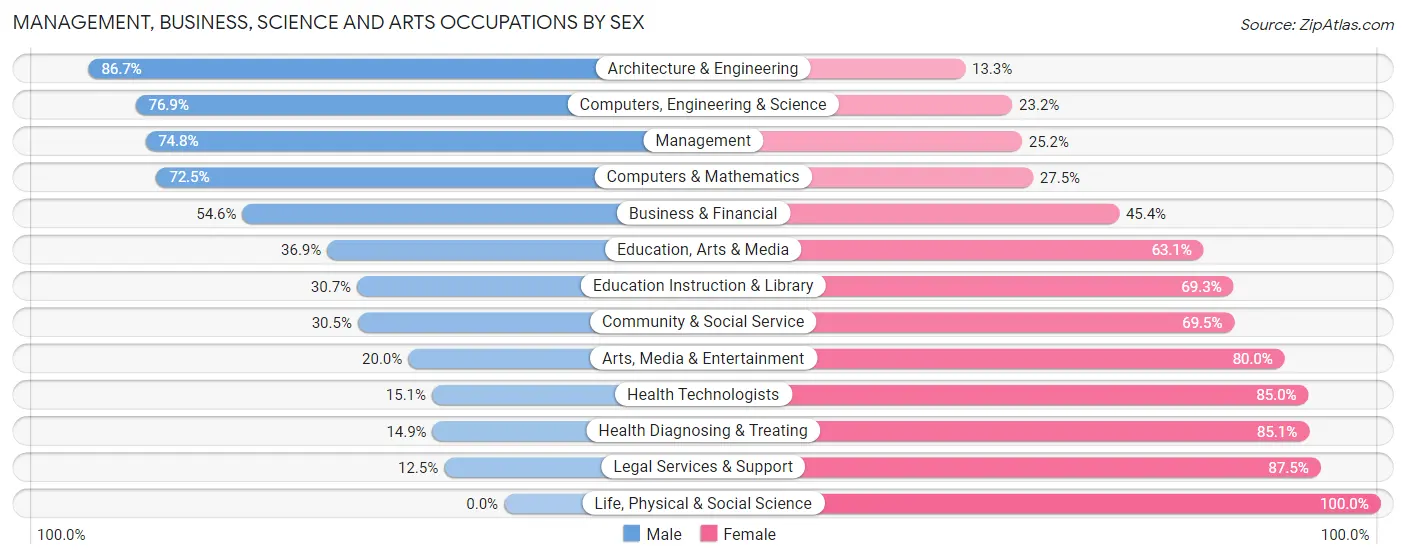
Management, Business, Science and Arts Occupations by Sex
Within the Management, Business, Science and Arts occupations in Laclede County, the most male-oriented occupations are Architecture & Engineering (86.7%), Computers, Engineering & Science (76.8%), and Management (74.8%), while the most female-oriented occupations are Life, Physical & Social Science (100.0%), Legal Services & Support (87.5%), and Health Diagnosing & Treating (85.1%).
| Occupation | Male | Female |
| Management | 758 (74.8%) | 255 (25.2%) |
| Business & Financial | 233 (54.6%) | 194 (45.4%) |
| Computers, Engineering & Science | 385 (76.8%) | 116 (23.2%) |
| Computers & Mathematics | 190 (72.5%) | 72 (27.5%) |
| Architecture & Engineering | 195 (86.7%) | 30 (13.3%) |
| Life, Physical & Social Science | 0 (0.0%) | 14 (100.0%) |
| Community & Social Service | 511 (30.5%) | 1,164 (69.5%) |
| Education, Arts & Media | 62 (36.9%) | 106 (63.1%) |
| Legal Services & Support | 7 (12.5%) | 49 (87.5%) |
| Education Instruction & Library | 436 (30.7%) | 985 (69.3%) |
| Arts, Media & Entertainment | 6 (20.0%) | 24 (80.0%) |
| Health Diagnosing & Treating | 138 (14.9%) | 787 (85.1%) |
| Health Technologists | 90 (15.0%) | 508 (85.0%) |
| Total (Category) | 2,025 (44.6%) | 2,516 (55.4%) |
| Total (Overall) | 8,838 (57.0%) | 6,681 (43.0%) |
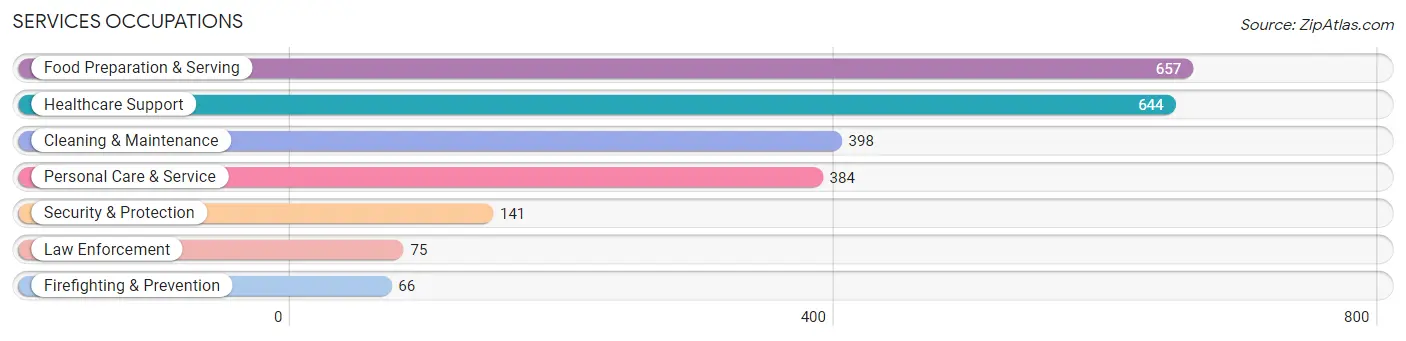
Services Occupations
The most common Services occupations in Laclede County are Food Preparation & Serving (657 | 4.2%), Healthcare Support (644 | 4.2%), Cleaning & Maintenance (398 | 2.6%), Personal Care & Service (384 | 2.5%), and Security & Protection (141 | 0.9%).
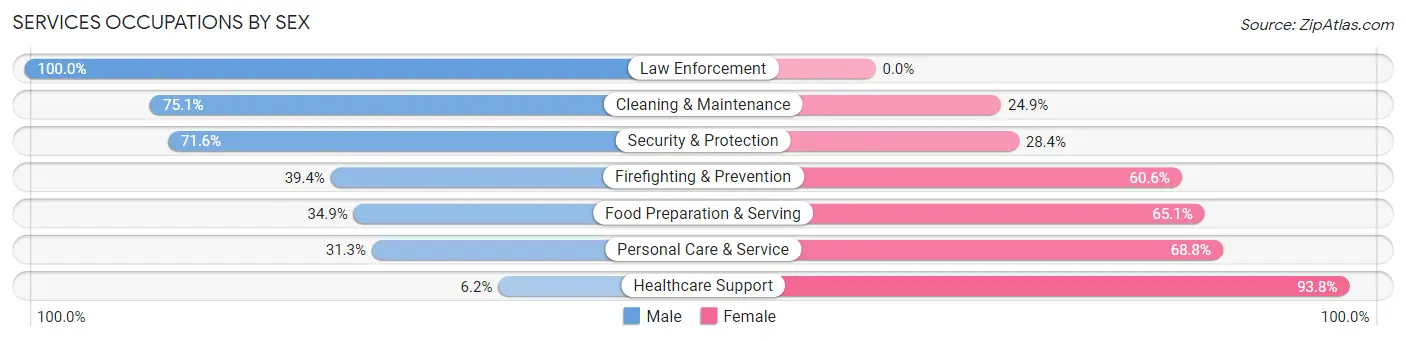
Services Occupations by Sex
Within the Services occupations in Laclede County, the most male-oriented occupations are Law Enforcement (100.0%), Cleaning & Maintenance (75.1%), and Security & Protection (71.6%), while the most female-oriented occupations are Healthcare Support (93.8%), Personal Care & Service (68.8%), and Food Preparation & Serving (65.1%).
| Occupation | Male | Female |
| Healthcare Support | 40 (6.2%) | 604 (93.8%) |
| Security & Protection | 101 (71.6%) | 40 (28.4%) |
| Firefighting & Prevention | 26 (39.4%) | 40 (60.6%) |
| Law Enforcement | 75 (100.0%) | 0 (0.0%) |
| Food Preparation & Serving | 229 (34.9%) | 428 (65.1%) |
| Cleaning & Maintenance | 299 (75.1%) | 99 (24.9%) |
| Personal Care & Service | 120 (31.2%) | 264 (68.8%) |
| Total (Category) | 789 (35.5%) | 1,435 (64.5%) |
| Total (Overall) | 8,838 (57.0%) | 6,681 (43.0%) |
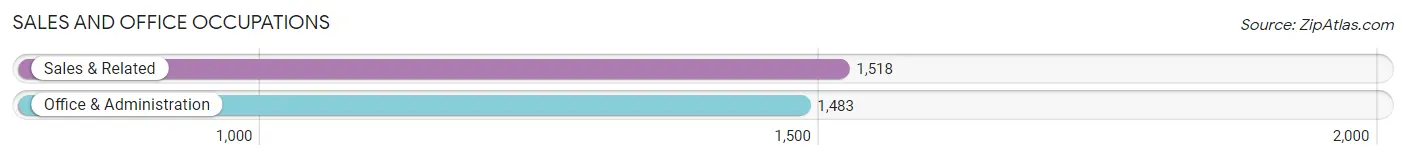
Sales and Office Occupations
The most common Sales and Office occupations in Laclede County are Sales & Related (1,518 | 9.8%), and Office & Administration (1,483 | 9.6%).
Sales and Office Occupations by Sex
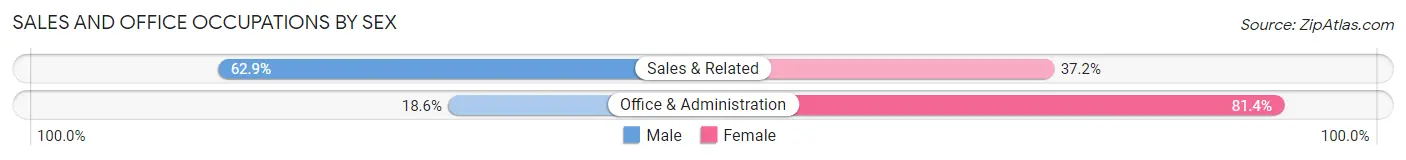
| Occupation | Male | Female |
| Sales & Related | 954 (62.8%) | 564 (37.1%) |
| Office & Administration | 276 (18.6%) | 1,207 (81.4%) |
| Total (Category) | 1,230 (41.0%) | 1,771 (59.0%) |
| Total (Overall) | 8,838 (57.0%) | 6,681 (43.0%) |
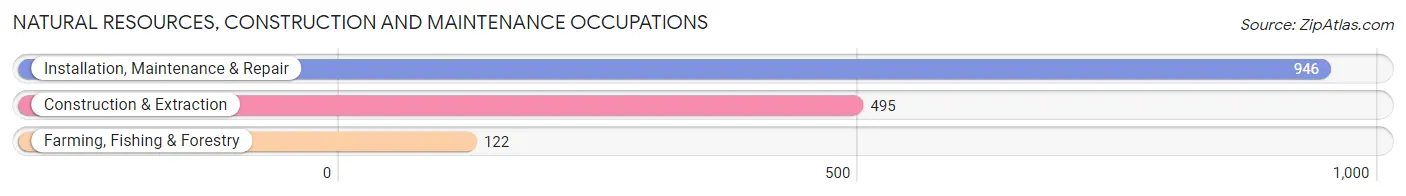
Natural Resources, Construction and Maintenance Occupations
The most common Natural Resources, Construction and Maintenance occupations in Laclede County are Installation, Maintenance & Repair (946 | 6.1%), Construction & Extraction (495 | 3.2%), and Farming, Fishing & Forestry (122 | 0.8%).
Natural Resources, Construction and Maintenance Occupations by Sex
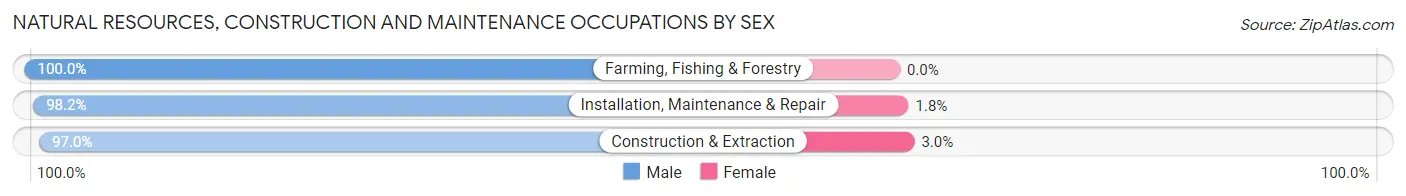
| Occupation | Male | Female |
| Farming, Fishing & Forestry | 122 (100.0%) | 0 (0.0%) |
| Construction & Extraction | 480 (97.0%) | 15 (3.0%) |
| Installation, Maintenance & Repair | 929 (98.2%) | 17 (1.8%) |
| Total (Category) | 1,531 (98.0%) | 32 (2.1%) |
| Total (Overall) | 8,838 (57.0%) | 6,681 (43.0%) |
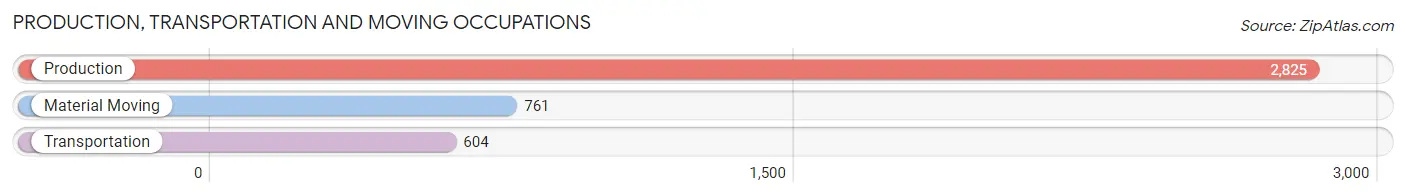
Production, Transportation and Moving Occupations
The most common Production, Transportation and Moving occupations in Laclede County are Production (2,825 | 18.2%), Material Moving (761 | 4.9%), and Transportation (604 | 3.9%).
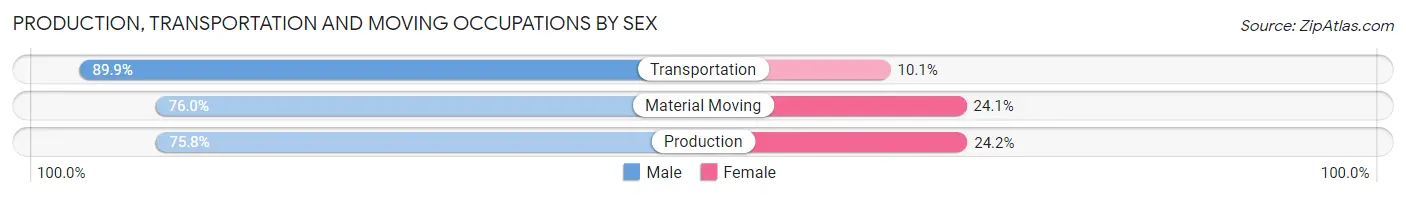
Production, Transportation and Moving Occupations by Sex
| Occupation | Male | Female |
| Production | 2,142 (75.8%) | 683 (24.2%) |
| Transportation | 543 (89.9%) | 61 (10.1%) |
| Material Moving | 578 (75.9%) | 183 (24.0%) |
| Total (Category) | 3,263 (77.9%) | 927 (22.1%) |
| Total (Overall) | 8,838 (57.0%) | 6,681 (43.0%) |
Employment Industries by Sex in Laclede County
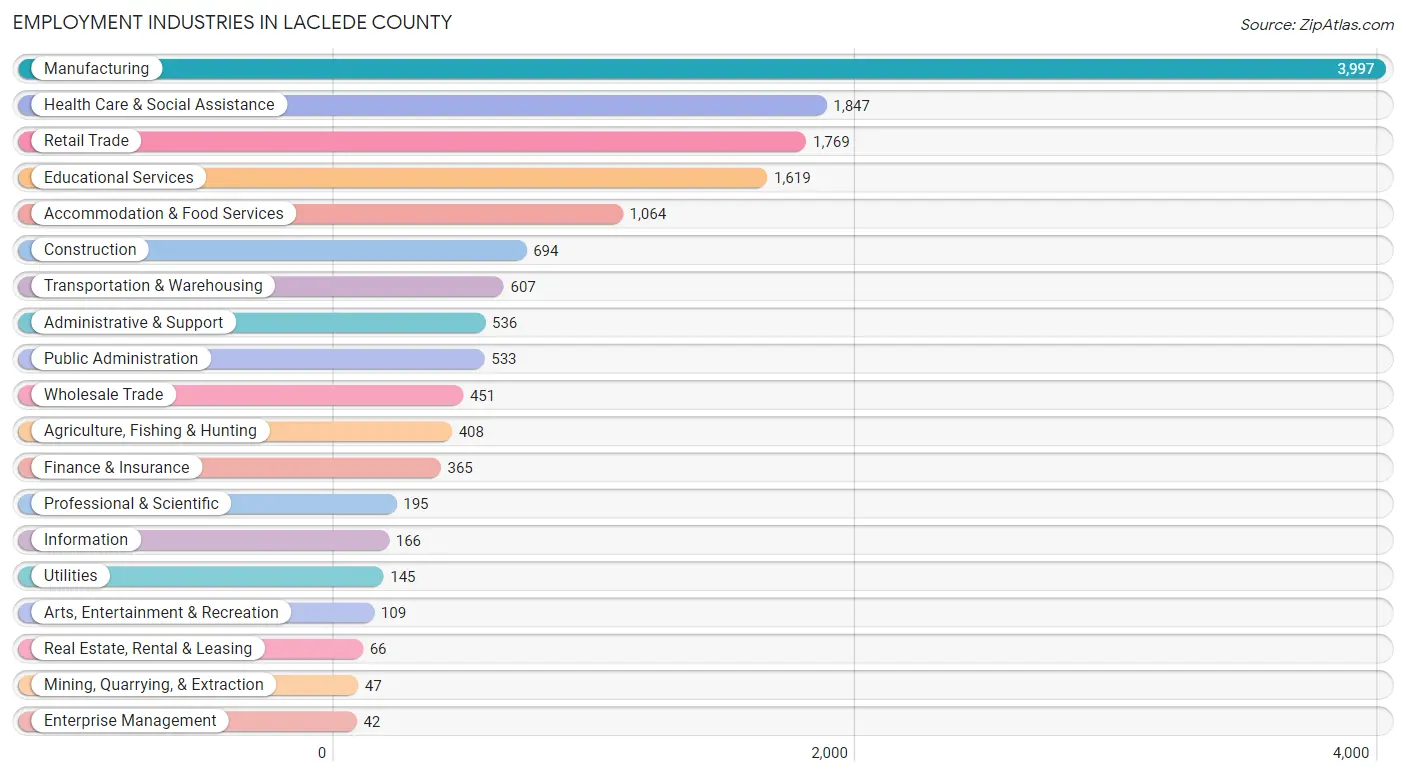
Employment Industries in Laclede County
The major employment industries in Laclede County include Manufacturing (3,997 | 25.8%), Health Care & Social Assistance (1,847 | 11.9%), Retail Trade (1,769 | 11.4%), Educational Services (1,619 | 10.4%), and Accommodation & Food Services (1,064 | 6.9%).
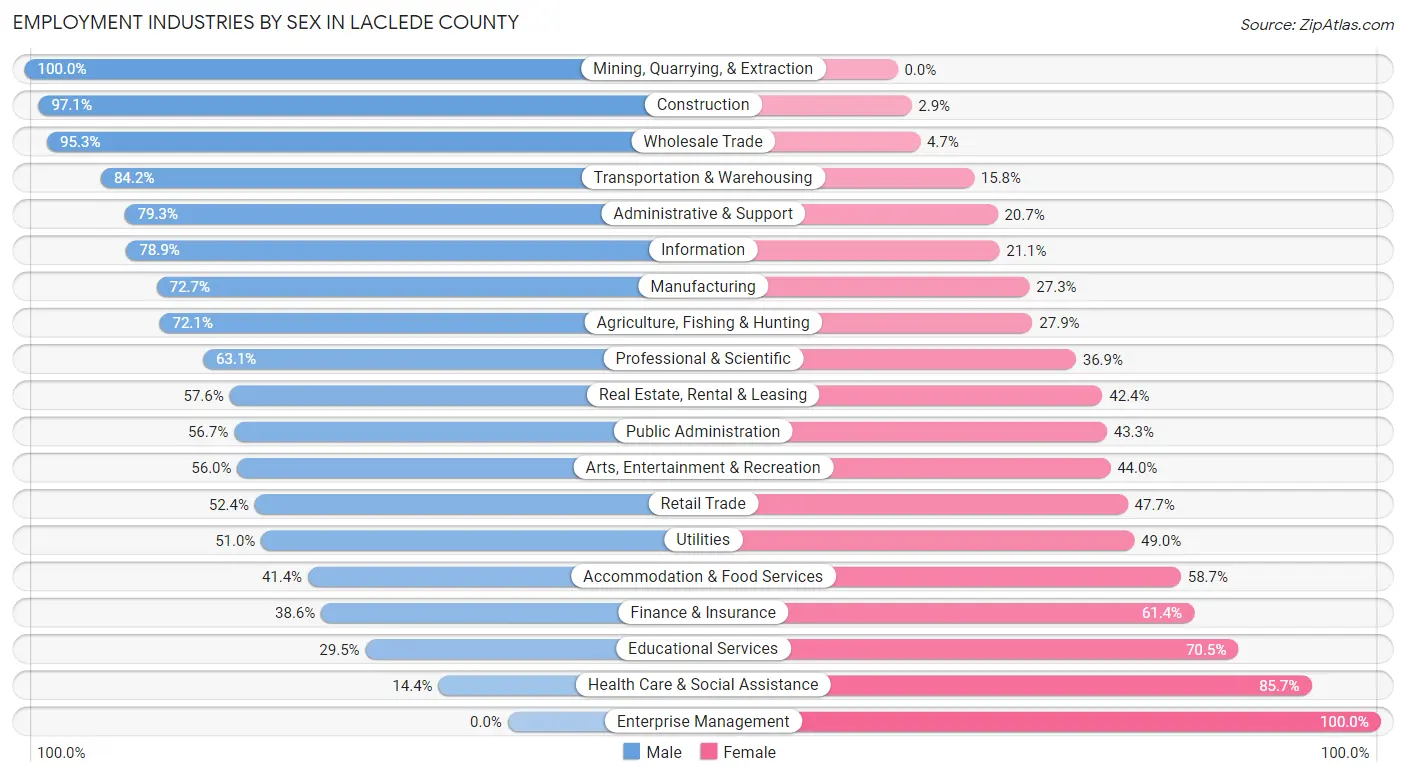
Employment Industries by Sex in Laclede County
The Laclede County industries that see more men than women are Mining, Quarrying, & Extraction (100.0%), Construction (97.1%), and Wholesale Trade (95.3%), whereas the industries that tend to have a higher number of women are Enterprise Management (100.0%), Health Care & Social Assistance (85.7%), and Educational Services (70.5%).
| Industry | Male | Female |
| Agriculture, Fishing & Hunting | 294 (72.1%) | 114 (27.9%) |
| Mining, Quarrying, & Extraction | 47 (100.0%) | 0 (0.0%) |
| Construction | 674 (97.1%) | 20 (2.9%) |
| Manufacturing | 2,905 (72.7%) | 1,092 (27.3%) |
| Wholesale Trade | 430 (95.3%) | 21 (4.7%) |
| Retail Trade | 926 (52.3%) | 843 (47.6%) |
| Transportation & Warehousing | 511 (84.2%) | 96 (15.8%) |
| Utilities | 74 (51.0%) | 71 (49.0%) |
| Information | 131 (78.9%) | 35 (21.1%) |
| Finance & Insurance | 141 (38.6%) | 224 (61.4%) |
| Real Estate, Rental & Leasing | 38 (57.6%) | 28 (42.4%) |
| Professional & Scientific | 123 (63.1%) | 72 (36.9%) |
| Enterprise Management | 0 (0.0%) | 42 (100.0%) |
| Administrative & Support | 425 (79.3%) | 111 (20.7%) |
| Educational Services | 477 (29.5%) | 1,142 (70.5%) |
| Health Care & Social Assistance | 265 (14.3%) | 1,582 (85.7%) |
| Arts, Entertainment & Recreation | 61 (56.0%) | 48 (44.0%) |
| Accommodation & Food Services | 440 (41.3%) | 624 (58.7%) |
| Public Administration | 302 (56.7%) | 231 (43.3%) |
| Total | 8,838 (57.0%) | 6,681 (43.0%) |
Education in Laclede County
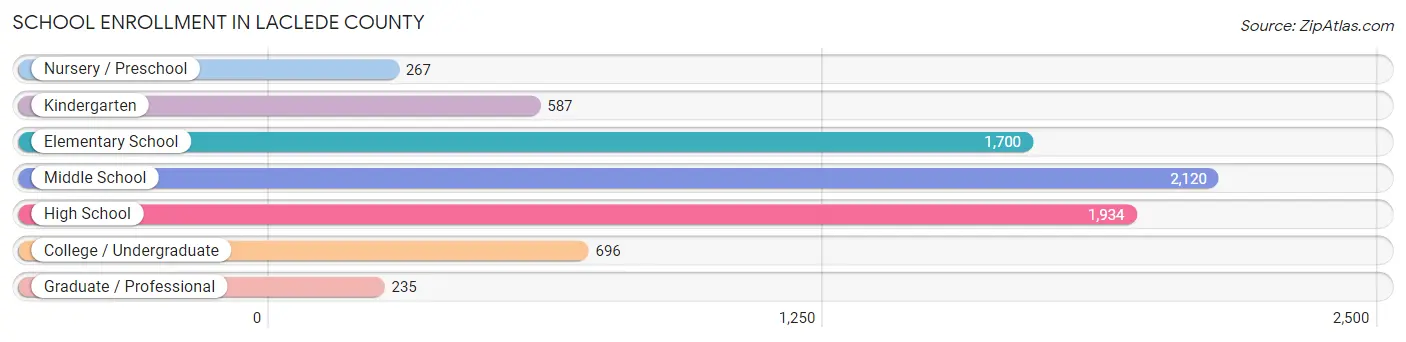
School Enrollment in Laclede County
The most common levels of schooling among the 7,539 students in Laclede County are middle school (2,120 | 28.1%), high school (1,934 | 25.7%), and elementary school (1,700 | 22.6%).
| School Level | # Students | % Students |
| Nursery / Preschool | 267 | 3.5% |
| Kindergarten | 587 | 7.8% |
| Elementary School | 1,700 | 22.6% |
| Middle School | 2,120 | 28.1% |
| High School | 1,934 | 25.7% |
| College / Undergraduate | 696 | 9.2% |
| Graduate / Professional | 235 | 3.1% |
| Total | 7,539 | 100.0% |
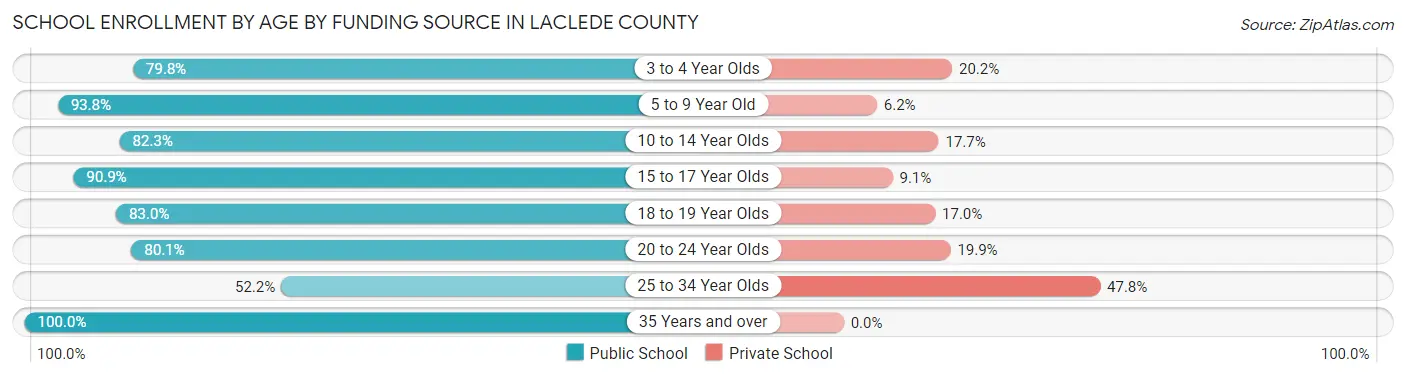
School Enrollment by Age by Funding Source in Laclede County
Out of a total of 7,539 students who are enrolled in schools in Laclede County, 1,033 (13.7%) attend a private institution, while the remaining 6,506 (86.3%) are enrolled in public schools. The age group of 25 to 34 year olds has the highest likelihood of being enrolled in private schools, with 149 (47.8% in the age bracket) enrolled. Conversely, the age group of 35 years and over has the lowest likelihood of being enrolled in a private school, with 166 (100.0% in the age bracket) attending a public institution.
| Age Bracket | Public School | Private School |
| 3 to 4 Year Olds | 178 (79.8%) | 45 (20.2%) |
| 5 to 9 Year Old | 1,973 (93.8%) | 130 (6.2%) |
| 10 to 14 Year Olds | 1,993 (82.3%) | 428 (17.7%) |
| 15 to 17 Year Olds | 1,448 (90.9%) | 145 (9.1%) |
| 18 to 19 Year Olds | 302 (83.0%) | 62 (17.0%) |
| 20 to 24 Year Olds | 286 (80.1%) | 71 (19.9%) |
| 25 to 34 Year Olds | 163 (52.2%) | 149 (47.8%) |
| 35 Years and over | 166 (100.0%) | 0 (0.0%) |
| Total | 6,506 (86.3%) | 1,033 (13.7%) |
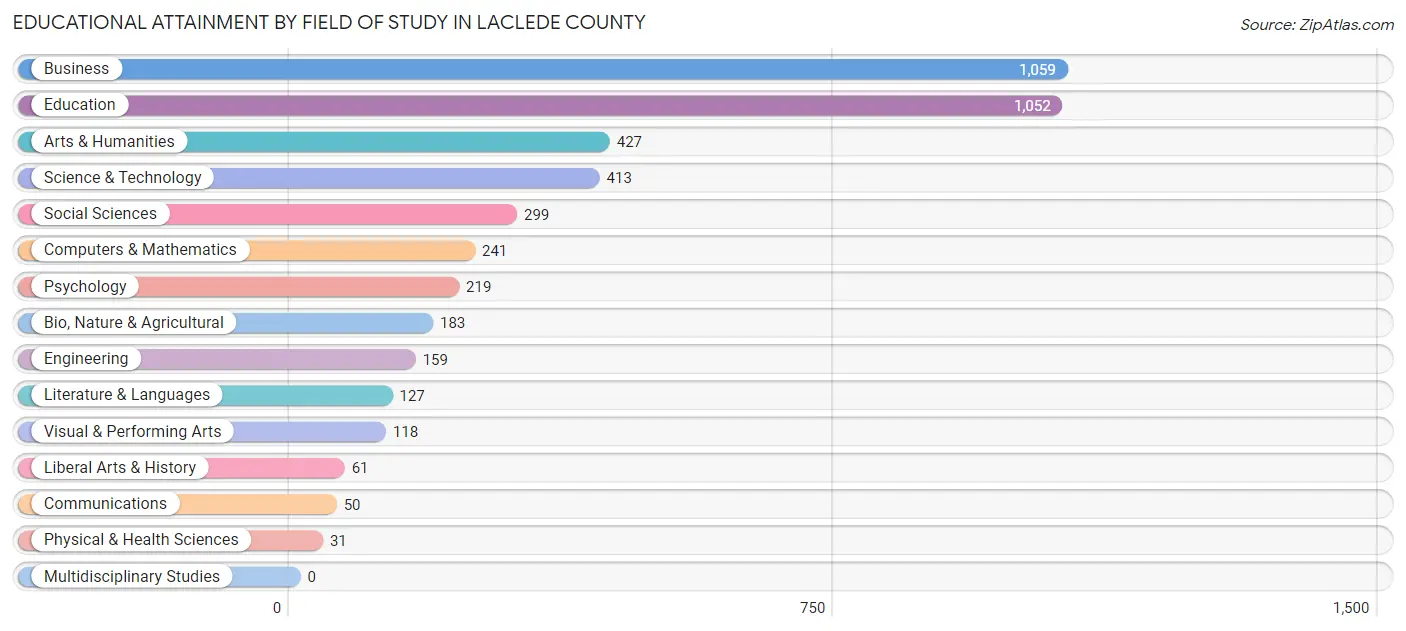
Educational Attainment by Field of Study in Laclede County
Business (1,059 | 23.9%), education (1,052 | 23.7%), arts & humanities (427 | 9.6%), science & technology (413 | 9.3%), and social sciences (299 | 6.7%) are the most common fields of study among 4,439 individuals in Laclede County who have obtained a bachelor's degree or higher.
| Field of Study | # Graduates | % Graduates |
| Computers & Mathematics | 241 | 5.4% |
| Bio, Nature & Agricultural | 183 | 4.1% |
| Physical & Health Sciences | 31 | 0.7% |
| Psychology | 219 | 4.9% |
| Social Sciences | 299 | 6.7% |
| Engineering | 159 | 3.6% |
| Multidisciplinary Studies | 0 | 0.0% |
| Science & Technology | 413 | 9.3% |
| Business | 1,059 | 23.9% |
| Education | 1,052 | 23.7% |
| Literature & Languages | 127 | 2.9% |
| Liberal Arts & History | 61 | 1.4% |
| Visual & Performing Arts | 118 | 2.7% |
| Communications | 50 | 1.1% |
| Arts & Humanities | 427 | 9.6% |
| Total | 4,439 | 100.0% |
Transportation & Commute in Laclede County
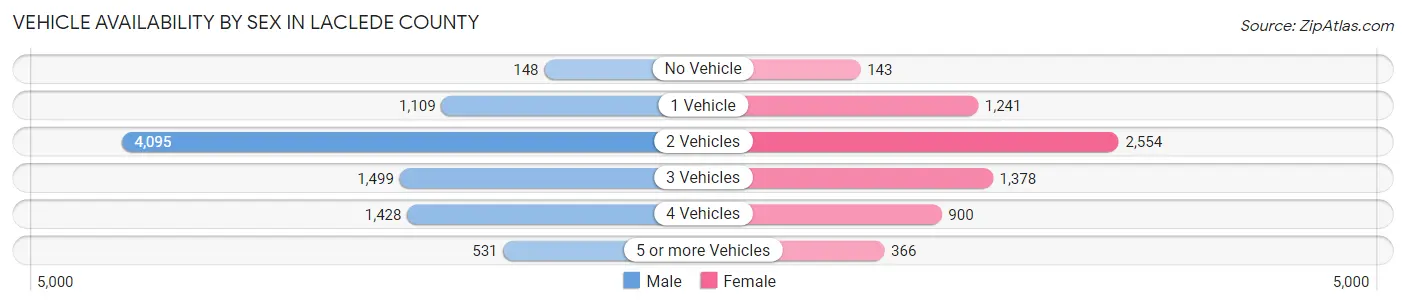
Vehicle Availability by Sex in Laclede County
The most prevalent vehicle ownership categories in Laclede County are males with 2 vehicles (4,095, accounting for 46.5%) and females with 2 vehicles (2,554, making up 62.2%).
| Vehicles Available | Male | Female |
| No Vehicle | 148 (1.7%) | 143 (2.2%) |
| 1 Vehicle | 1,109 (12.6%) | 1,241 (18.9%) |
| 2 Vehicles | 4,095 (46.5%) | 2,554 (38.8%) |
| 3 Vehicles | 1,499 (17.0%) | 1,378 (20.9%) |
| 4 Vehicles | 1,428 (16.2%) | 900 (13.7%) |
| 5 or more Vehicles | 531 (6.0%) | 366 (5.6%) |
| Total | 8,810 (100.0%) | 6,582 (100.0%) |
Commute Time in Laclede County
The most frequently occuring commute durations in Laclede County are 15 to 19 minutes (3,194 commuters, 21.7%), 10 to 14 minutes (2,883 commuters, 19.6%), and 5 to 9 minutes (2,190 commuters, 14.9%).
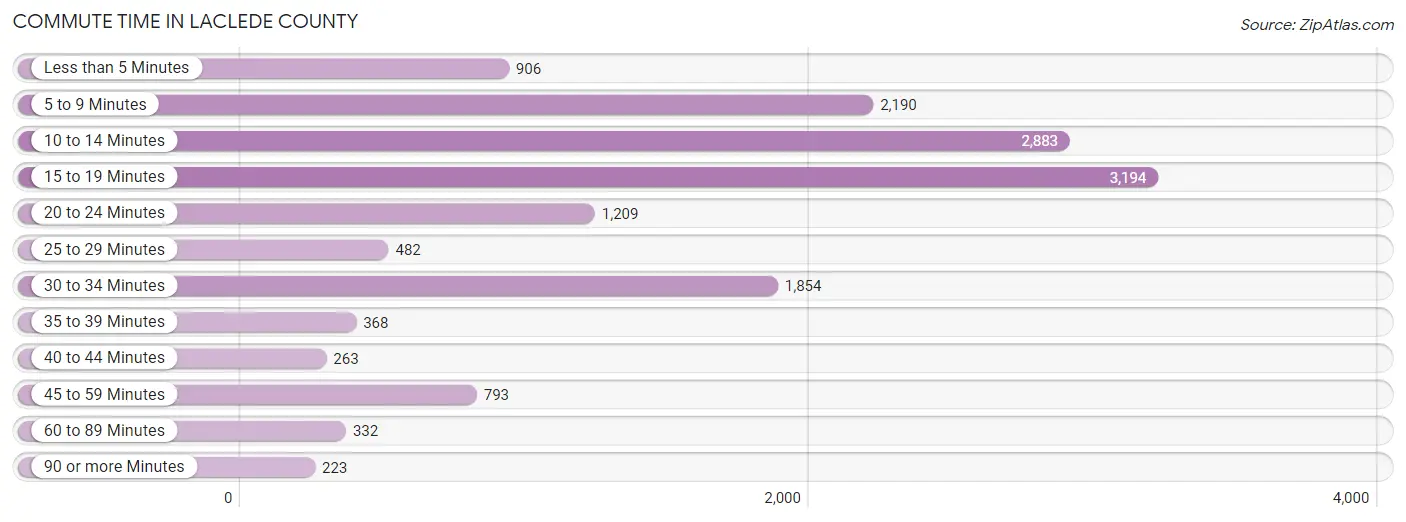
| Commute Time | # Commuters | % Commuters |
| Less than 5 Minutes | 906 | 6.2% |
| 5 to 9 Minutes | 2,190 | 14.9% |
| 10 to 14 Minutes | 2,883 | 19.6% |
| 15 to 19 Minutes | 3,194 | 21.7% |
| 20 to 24 Minutes | 1,209 | 8.2% |
| 25 to 29 Minutes | 482 | 3.3% |
| 30 to 34 Minutes | 1,854 | 12.6% |
| 35 to 39 Minutes | 368 | 2.5% |
| 40 to 44 Minutes | 263 | 1.8% |
| 45 to 59 Minutes | 793 | 5.4% |
| 60 to 89 Minutes | 332 | 2.3% |
| 90 or more Minutes | 223 | 1.5% |
Commute Time by Sex in Laclede County
The most common commute times in Laclede County are 15 to 19 minutes (1,907 commuters, 22.6%) for males and 10 to 14 minutes (1,344 commuters, 21.5%) for females.
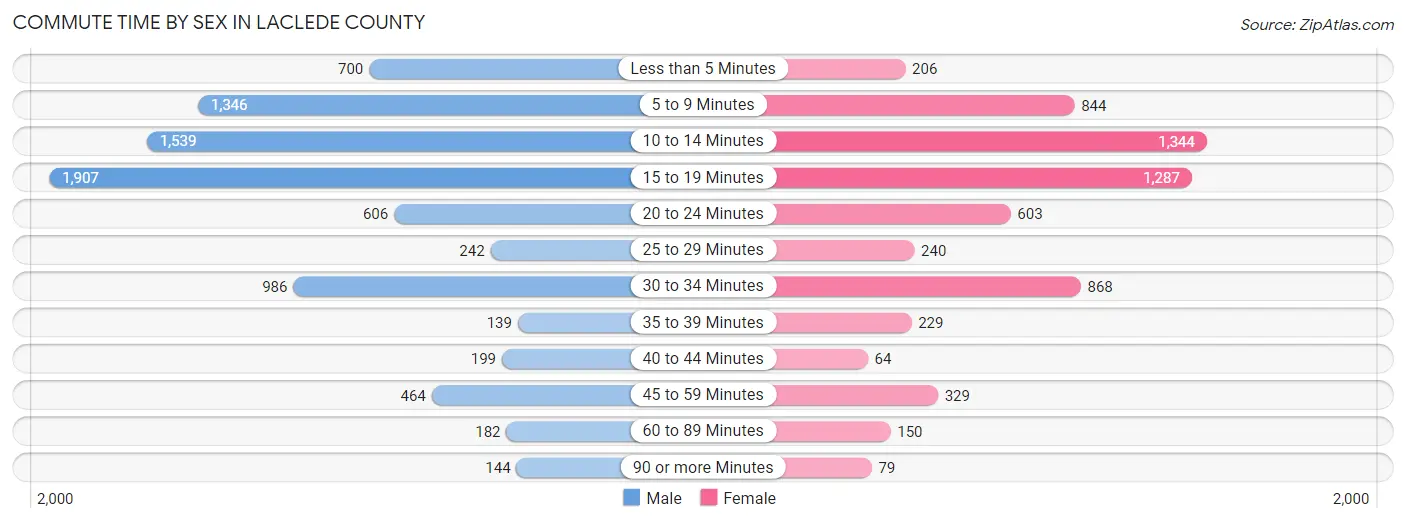
| Commute Time | Male | Female |
| Less than 5 Minutes | 700 (8.3%) | 206 (3.3%) |
| 5 to 9 Minutes | 1,346 (15.9%) | 844 (13.5%) |
| 10 to 14 Minutes | 1,539 (18.2%) | 1,344 (21.5%) |
| 15 to 19 Minutes | 1,907 (22.6%) | 1,287 (20.6%) |
| 20 to 24 Minutes | 606 (7.2%) | 603 (9.7%) |
| 25 to 29 Minutes | 242 (2.9%) | 240 (3.8%) |
| 30 to 34 Minutes | 986 (11.7%) | 868 (13.9%) |
| 35 to 39 Minutes | 139 (1.6%) | 229 (3.7%) |
| 40 to 44 Minutes | 199 (2.4%) | 64 (1.0%) |
| 45 to 59 Minutes | 464 (5.5%) | 329 (5.3%) |
| 60 to 89 Minutes | 182 (2.1%) | 150 (2.4%) |
| 90 or more Minutes | 144 (1.7%) | 79 (1.3%) |
Time of Departure to Work by Sex in Laclede County
The most frequent times of departure to work in Laclede County are 5:30 AM to 5:59 AM (1,499, 17.7%) for males and 7:00 AM to 7:29 AM (1,347, 21.6%) for females.
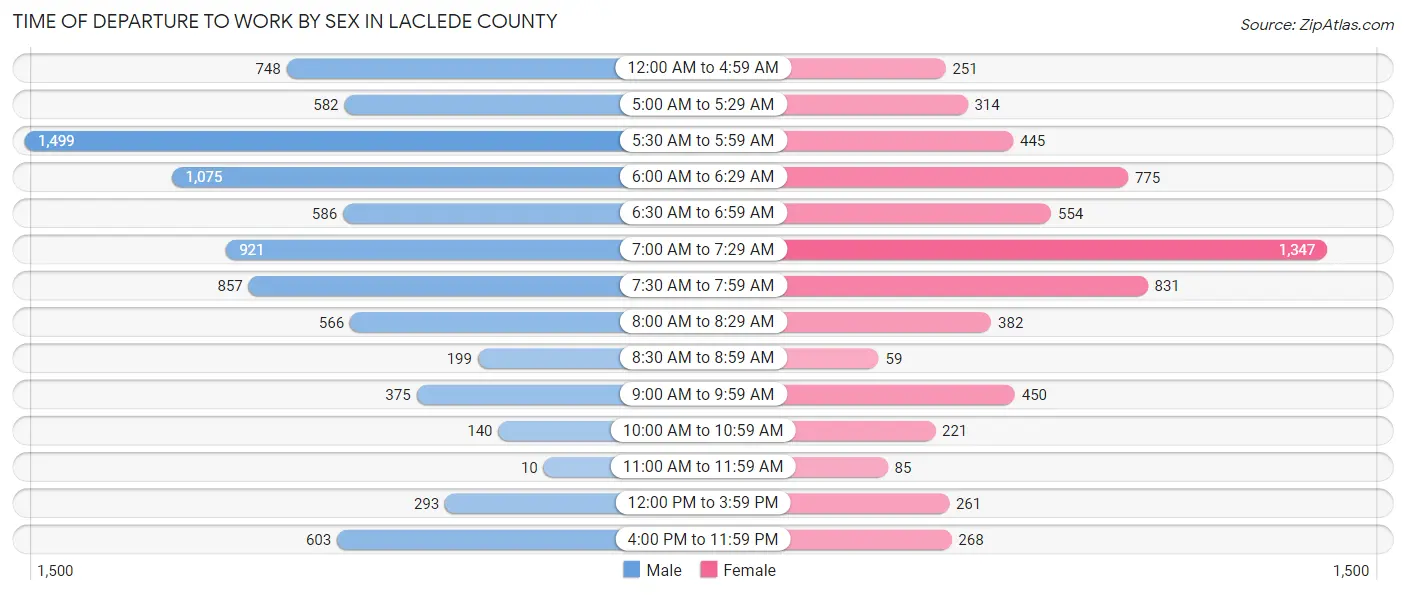
| Time of Departure | Male | Female |
| 12:00 AM to 4:59 AM | 748 (8.8%) | 251 (4.0%) |
| 5:00 AM to 5:29 AM | 582 (6.9%) | 314 (5.0%) |
| 5:30 AM to 5:59 AM | 1,499 (17.7%) | 445 (7.1%) |
| 6:00 AM to 6:29 AM | 1,075 (12.7%) | 775 (12.4%) |
| 6:30 AM to 6:59 AM | 586 (6.9%) | 554 (8.9%) |
| 7:00 AM to 7:29 AM | 921 (10.9%) | 1,347 (21.6%) |
| 7:30 AM to 7:59 AM | 857 (10.1%) | 831 (13.3%) |
| 8:00 AM to 8:29 AM | 566 (6.7%) | 382 (6.1%) |
| 8:30 AM to 8:59 AM | 199 (2.4%) | 59 (0.9%) |
| 9:00 AM to 9:59 AM | 375 (4.4%) | 450 (7.2%) |
| 10:00 AM to 10:59 AM | 140 (1.7%) | 221 (3.5%) |
| 11:00 AM to 11:59 AM | 10 (0.1%) | 85 (1.4%) |
| 12:00 PM to 3:59 PM | 293 (3.5%) | 261 (4.2%) |
| 4:00 PM to 11:59 PM | 603 (7.1%) | 268 (4.3%) |
| Total | 8,454 (100.0%) | 6,243 (100.0%) |
Housing Occupancy in Laclede County
Occupancy by Ownership in Laclede County
Of the total 14,345 dwellings in Laclede County, owner-occupied units account for 10,061 (70.1%), while renter-occupied units make up 4,284 (29.9%).
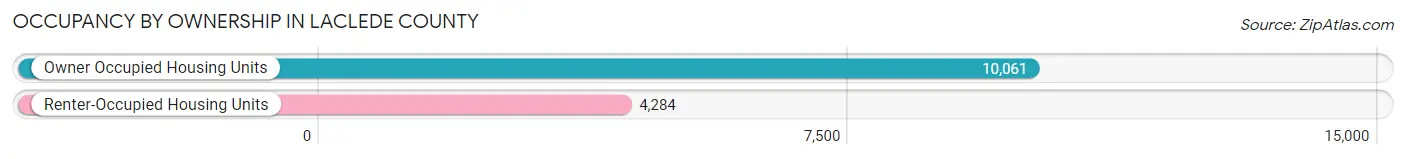
| Occupancy | # Housing Units | % Housing Units |
| Owner Occupied Housing Units | 10,061 | 70.1% |
| Renter-Occupied Housing Units | 4,284 | 29.9% |
| Total Occupied Housing Units | 14,345 | 100.0% |
Occupancy by Household Size in Laclede County
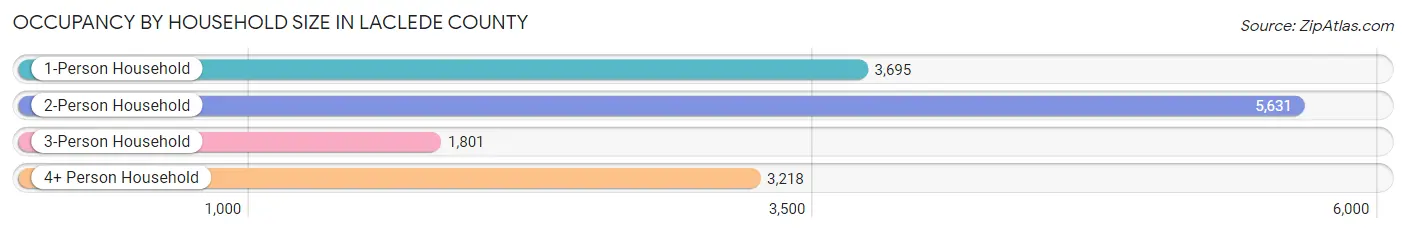
| Household Size | # Housing Units | % Housing Units |
| 1-Person Household | 3,695 | 25.8% |
| 2-Person Household | 5,631 | 39.3% |
| 3-Person Household | 1,801 | 12.6% |
| 4+ Person Household | 3,218 | 22.4% |
| Total Housing Units | 14,345 | 100.0% |
Occupancy by Ownership by Household Size in Laclede County
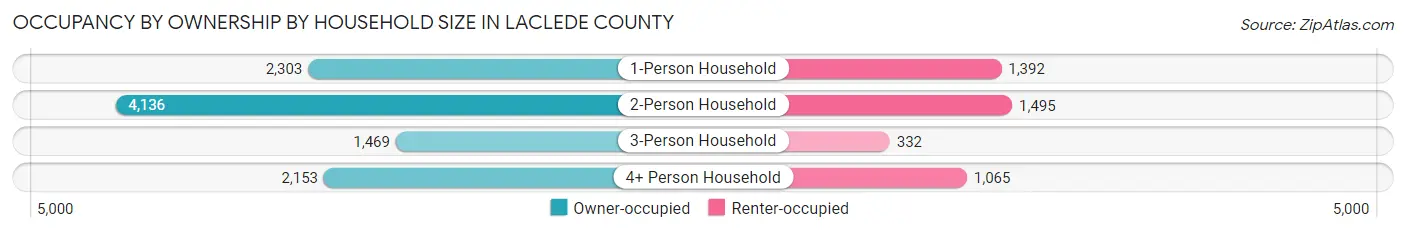
| Household Size | Owner-occupied | Renter-occupied |
| 1-Person Household | 2,303 (62.3%) | 1,392 (37.7%) |
| 2-Person Household | 4,136 (73.5%) | 1,495 (26.6%) |
| 3-Person Household | 1,469 (81.6%) | 332 (18.4%) |
| 4+ Person Household | 2,153 (66.9%) | 1,065 (33.1%) |
| Total Housing Units | 10,061 (70.1%) | 4,284 (29.9%) |
Occupancy by Educational Attainment in Laclede County
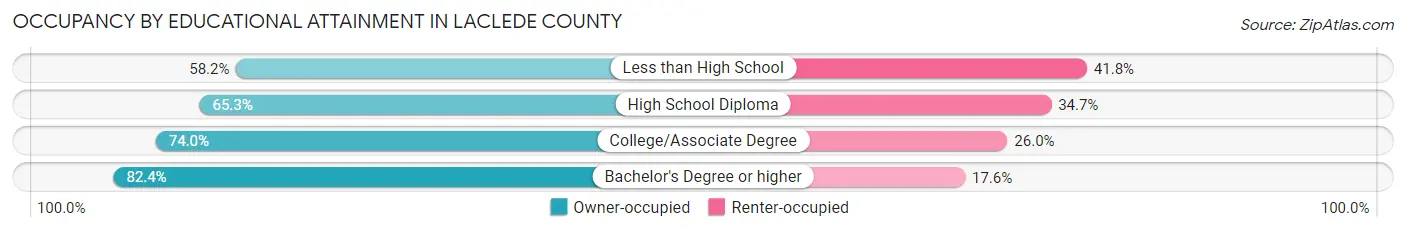
| Household Size | Owner-occupied | Renter-occupied |
| Less than High School | 963 (58.2%) | 691 (41.8%) |
| High School Diploma | 3,717 (65.3%) | 1,975 (34.7%) |
| College/Associate Degree | 3,389 (74.0%) | 1,192 (26.0%) |
| Bachelor's Degree or higher | 1,992 (82.4%) | 426 (17.6%) |
Occupancy by Age of Householder in Laclede County
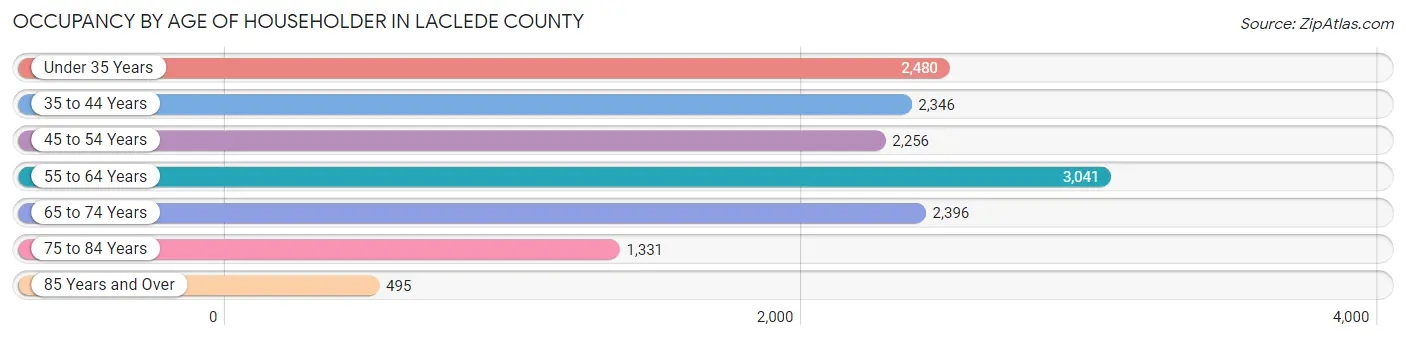
| Age Bracket | # Households | % Households |
| Under 35 Years | 2,480 | 17.3% |
| 35 to 44 Years | 2,346 | 16.4% |
| 45 to 54 Years | 2,256 | 15.7% |
| 55 to 64 Years | 3,041 | 21.2% |
| 65 to 74 Years | 2,396 | 16.7% |
| 75 to 84 Years | 1,331 | 9.3% |
| 85 Years and Over | 495 | 3.5% |
| Total | 14,345 | 100.0% |
Housing Finances in Laclede County
Median Income by Occupancy in Laclede County
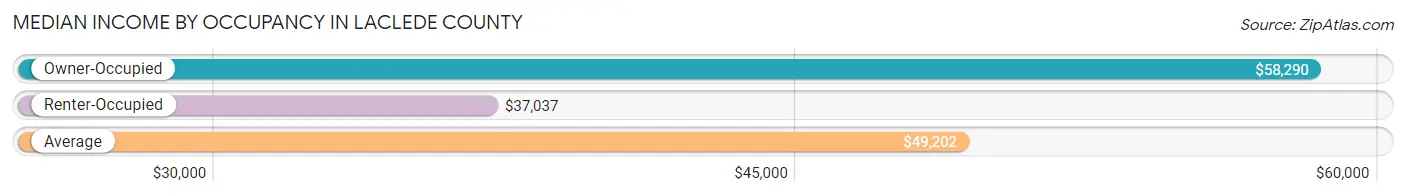
| Occupancy Type | # Households | Median Income |
| Owner-Occupied | 10,061 (70.1%) | $58,290 |
| Renter-Occupied | 4,284 (29.9%) | $37,037 |
| Average | 14,345 (100.0%) | $49,202 |
Occupancy by Householder Income Bracket in Laclede County
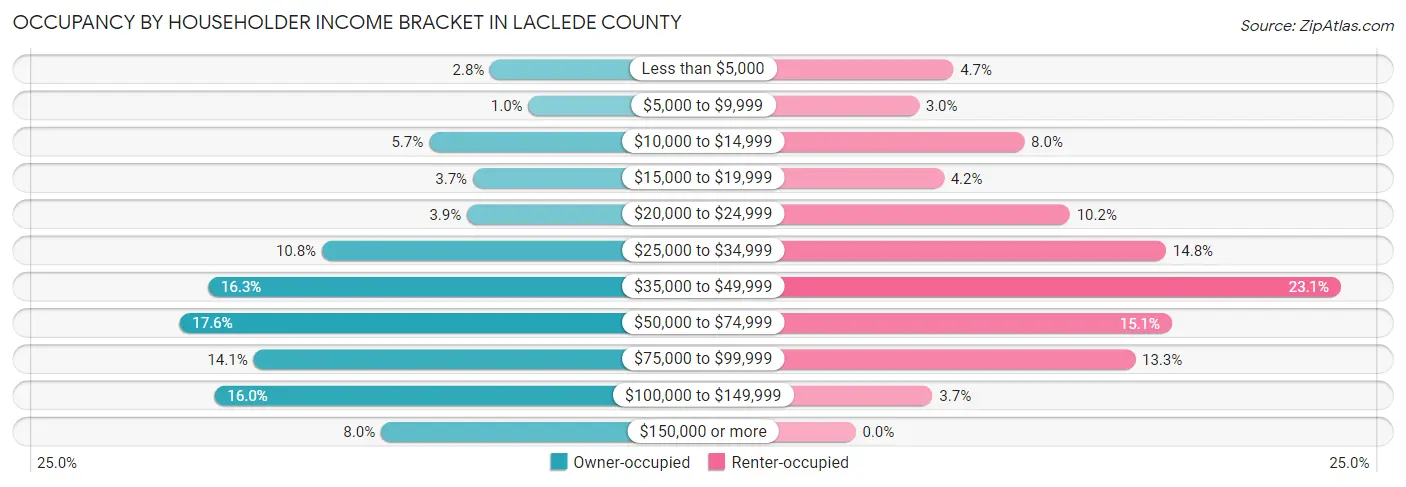
| Income Bracket | Owner-occupied | Renter-occupied |
| Less than $5,000 | 285 (2.8%) | 199 (4.6%) |
| $5,000 to $9,999 | 102 (1.0%) | 129 (3.0%) |
| $10,000 to $14,999 | 577 (5.7%) | 344 (8.0%) |
| $15,000 to $19,999 | 367 (3.6%) | 180 (4.2%) |
| $20,000 to $24,999 | 395 (3.9%) | 437 (10.2%) |
| $25,000 to $34,999 | 1,091 (10.8%) | 633 (14.8%) |
| $35,000 to $49,999 | 1,637 (16.3%) | 990 (23.1%) |
| $50,000 to $74,999 | 1,774 (17.6%) | 645 (15.1%) |
| $75,000 to $99,999 | 1,419 (14.1%) | 570 (13.3%) |
| $100,000 to $149,999 | 1,606 (16.0%) | 157 (3.7%) |
| $150,000 or more | 808 (8.0%) | 0 (0.0%) |
| Total | 10,061 (100.0%) | 4,284 (100.0%) |
Monthly Housing Cost Tiers in Laclede County
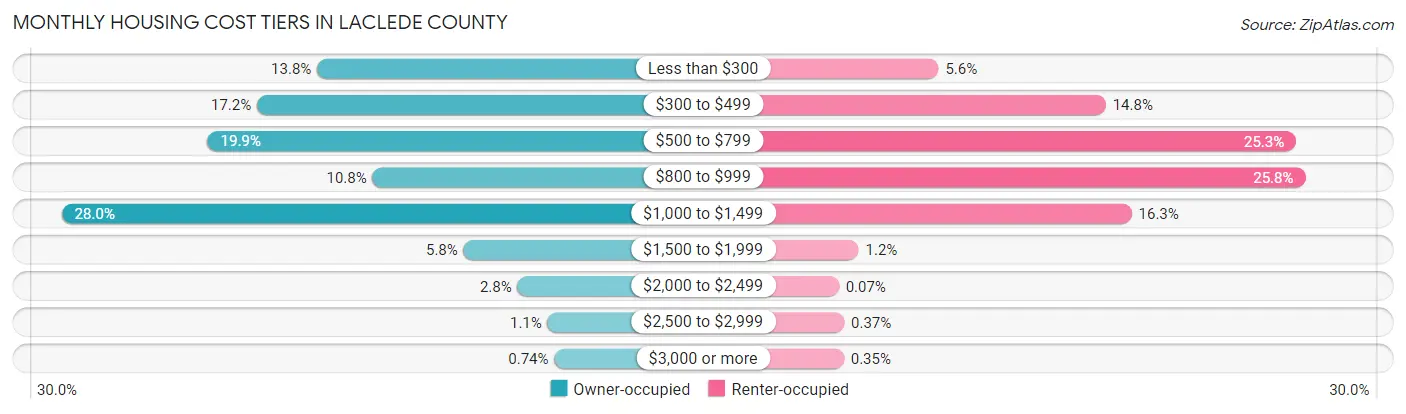
| Monthly Cost | Owner-occupied | Renter-occupied |
| Less than $300 | 1,392 (13.8%) | 239 (5.6%) |
| $300 to $499 | 1,726 (17.2%) | 635 (14.8%) |
| $500 to $799 | 2,001 (19.9%) | 1,085 (25.3%) |
| $800 to $999 | 1,085 (10.8%) | 1,107 (25.8%) |
| $1,000 to $1,499 | 2,813 (28.0%) | 696 (16.3%) |
| $1,500 to $1,999 | 579 (5.8%) | 50 (1.2%) |
| $2,000 to $2,499 | 279 (2.8%) | 3 (0.1%) |
| $2,500 to $2,999 | 112 (1.1%) | 16 (0.4%) |
| $3,000 or more | 74 (0.7%) | 15 (0.4%) |
| Total | 10,061 (100.0%) | 4,284 (100.0%) |
Physical Housing Characteristics in Laclede County
Housing Structures in Laclede County
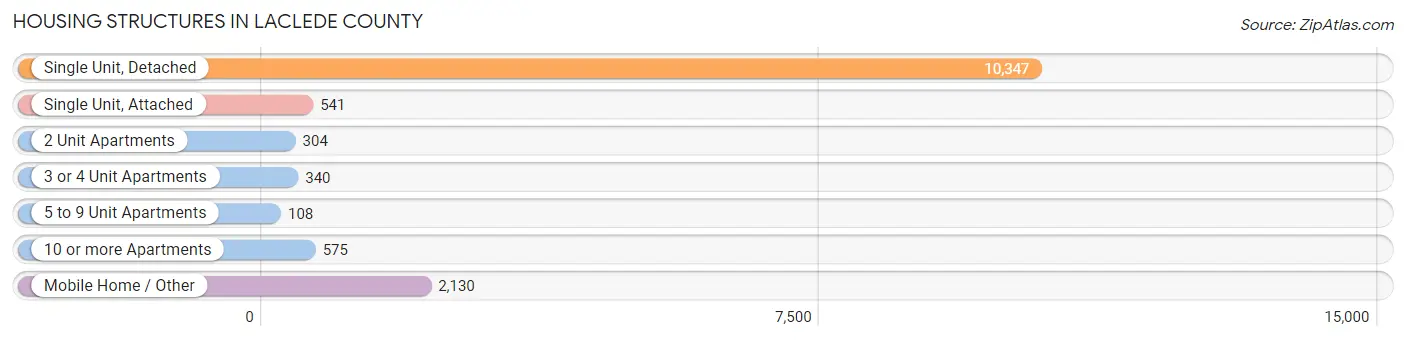
| Structure Type | # Housing Units | % Housing Units |
| Single Unit, Detached | 10,347 | 72.1% |
| Single Unit, Attached | 541 | 3.8% |
| 2 Unit Apartments | 304 | 2.1% |
| 3 or 4 Unit Apartments | 340 | 2.4% |
| 5 to 9 Unit Apartments | 108 | 0.7% |
| 10 or more Apartments | 575 | 4.0% |
| Mobile Home / Other | 2,130 | 14.8% |
| Total | 14,345 | 100.0% |
Housing Structures by Occupancy in Laclede County
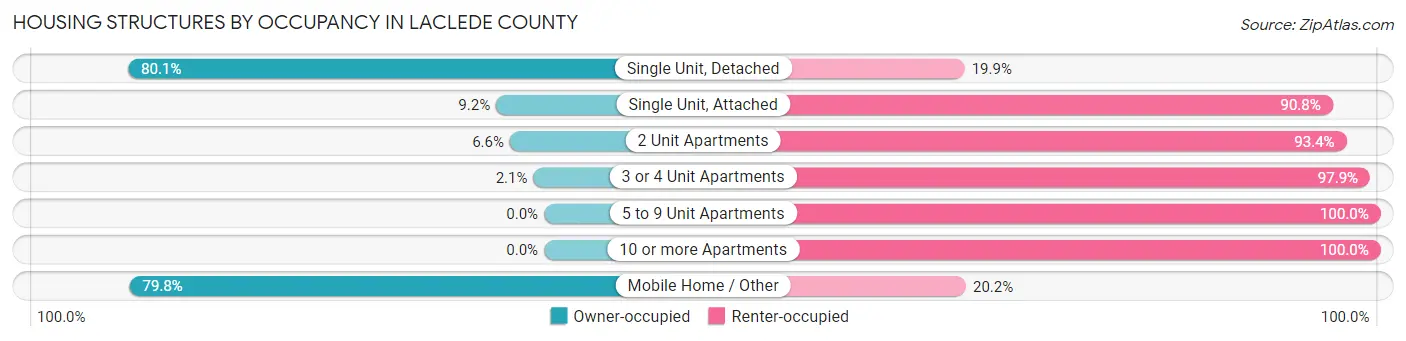
| Structure Type | Owner-occupied | Renter-occupied |
| Single Unit, Detached | 8,284 (80.1%) | 2,063 (19.9%) |
| Single Unit, Attached | 50 (9.2%) | 491 (90.8%) |
| 2 Unit Apartments | 20 (6.6%) | 284 (93.4%) |
| 3 or 4 Unit Apartments | 7 (2.1%) | 333 (97.9%) |
| 5 to 9 Unit Apartments | 0 (0.0%) | 108 (100.0%) |
| 10 or more Apartments | 0 (0.0%) | 575 (100.0%) |
| Mobile Home / Other | 1,700 (79.8%) | 430 (20.2%) |
| Total | 10,061 (70.1%) | 4,284 (29.9%) |
Housing Structures by Number of Rooms in Laclede County
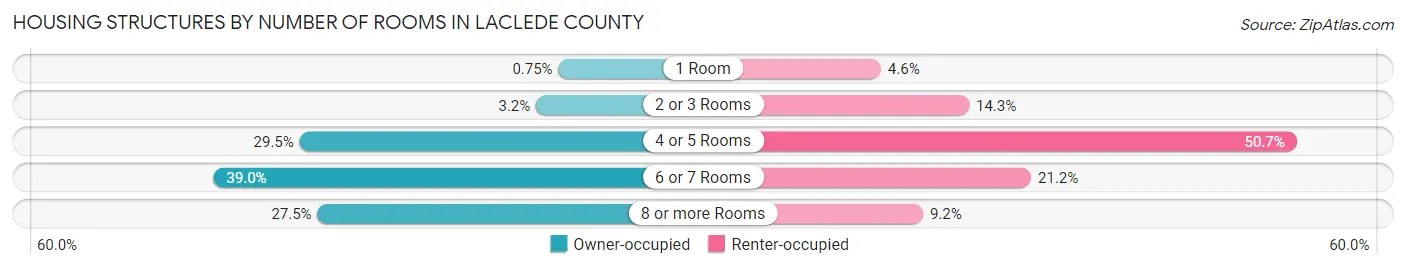
| Number of Rooms | Owner-occupied | Renter-occupied |
| 1 Room | 75 (0.7%) | 195 (4.5%) |
| 2 or 3 Rooms | 325 (3.2%) | 614 (14.3%) |
| 4 or 5 Rooms | 2,966 (29.5%) | 2,171 (50.7%) |
| 6 or 7 Rooms | 3,928 (39.0%) | 909 (21.2%) |
| 8 or more Rooms | 2,767 (27.5%) | 395 (9.2%) |
| Total | 10,061 (100.0%) | 4,284 (100.0%) |
Housing Structure by Heating Type in Laclede County
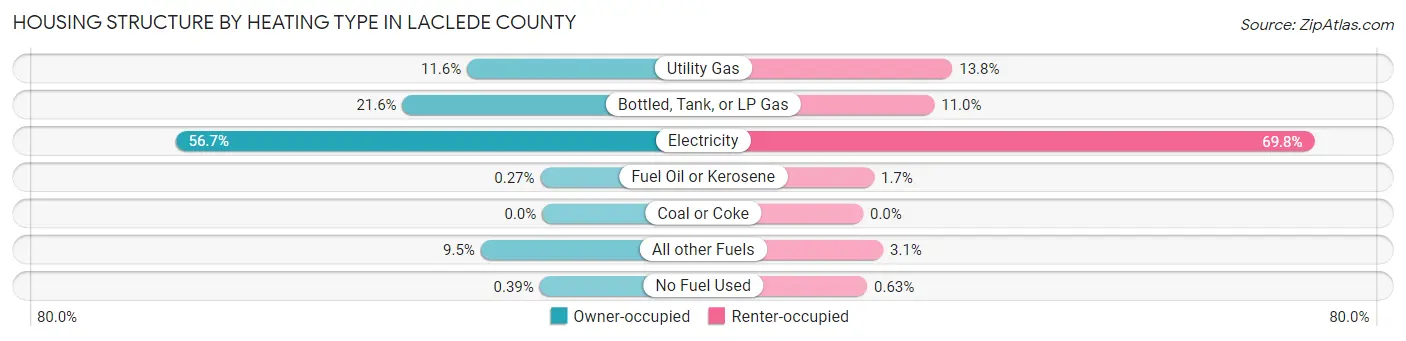
| Heating Type | Owner-occupied | Renter-occupied |
| Utility Gas | 1,167 (11.6%) | 591 (13.8%) |
| Bottled, Tank, or LP Gas | 2,172 (21.6%) | 472 (11.0%) |
| Electricity | 5,701 (56.7%) | 2,988 (69.8%) |
| Fuel Oil or Kerosene | 27 (0.3%) | 73 (1.7%) |
| Coal or Coke | 0 (0.0%) | 0 (0.0%) |
| All other Fuels | 955 (9.5%) | 133 (3.1%) |
| No Fuel Used | 39 (0.4%) | 27 (0.6%) |
| Total | 10,061 (100.0%) | 4,284 (100.0%) |
Household Vehicle Usage in Laclede County
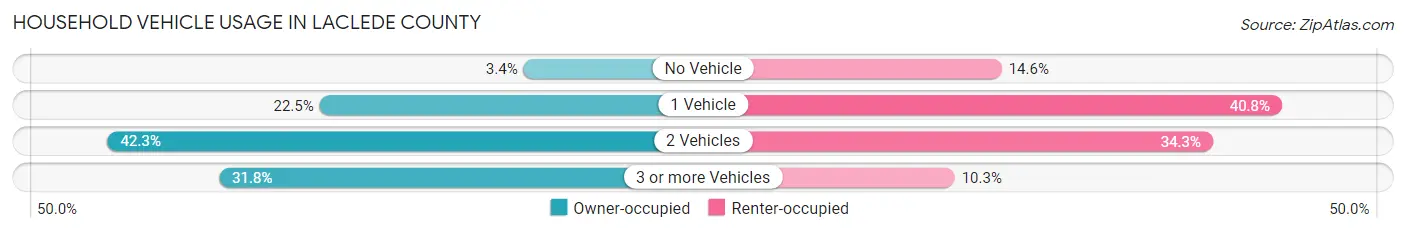
| Vehicles per Household | Owner-occupied | Renter-occupied |
| No Vehicle | 345 (3.4%) | 627 (14.6%) |
| 1 Vehicle | 2,261 (22.5%) | 1,747 (40.8%) |
| 2 Vehicles | 4,252 (42.3%) | 1,471 (34.3%) |
| 3 or more Vehicles | 3,203 (31.8%) | 439 (10.2%) |
| Total | 10,061 (100.0%) | 4,284 (100.0%) |
Real Estate & Mortgages in Laclede County
Real Estate and Mortgage Overview in Laclede County
| Characteristic | Without Mortgage | With Mortgage |
| Housing Units | 4,388 | 5,673 |
| Median Property Value | $115,000 | $162,700 |
| Median Household Income | $40,136 | $590 |
| Monthly Housing Costs | $390 | $74 |
| Real Estate Taxes | $839 | $96 |
Property Value by Mortgage Status in Laclede County
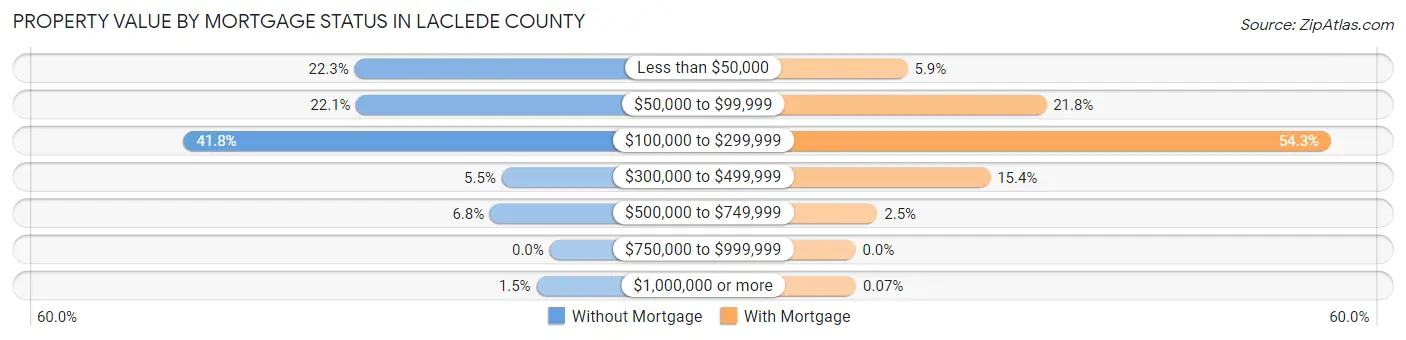
| Property Value | Without Mortgage | With Mortgage |
| Less than $50,000 | 978 (22.3%) | 337 (5.9%) |
| $50,000 to $99,999 | 969 (22.1%) | 1,236 (21.8%) |
| $100,000 to $299,999 | 1,836 (41.8%) | 3,082 (54.3%) |
| $300,000 to $499,999 | 240 (5.5%) | 873 (15.4%) |
| $500,000 to $749,999 | 299 (6.8%) | 141 (2.5%) |
| $750,000 to $999,999 | 0 (0.0%) | 0 (0.0%) |
| $1,000,000 or more | 66 (1.5%) | 4 (0.1%) |
| Total | 4,388 (100.0%) | 5,673 (100.0%) |
Household Income by Mortgage Status in Laclede County
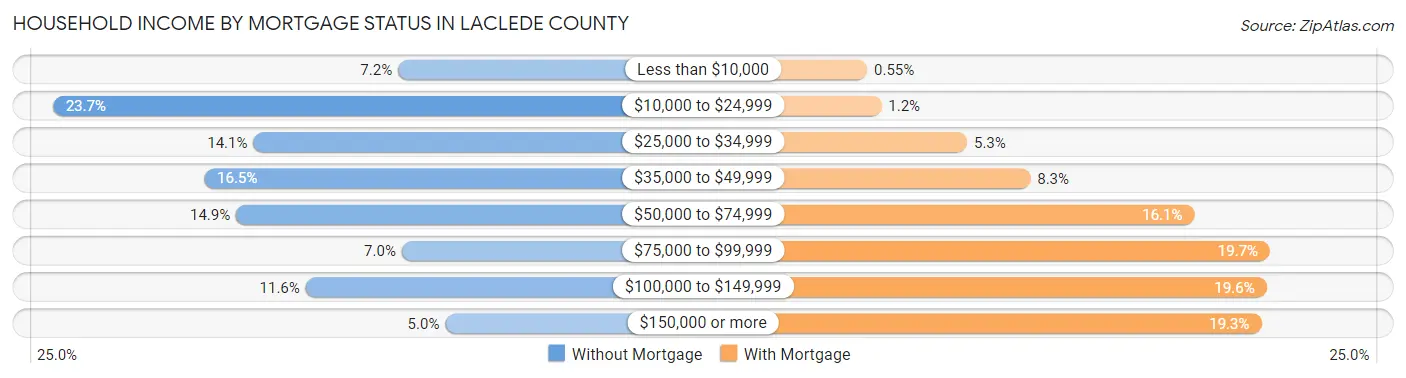
| Household Income | Without Mortgage | With Mortgage |
| Less than $10,000 | 317 (7.2%) | 31 (0.5%) |
| $10,000 to $24,999 | 1,038 (23.7%) | 70 (1.2%) |
| $25,000 to $34,999 | 619 (14.1%) | 301 (5.3%) |
| $35,000 to $49,999 | 722 (16.5%) | 472 (8.3%) |
| $50,000 to $74,999 | 655 (14.9%) | 915 (16.1%) |
| $75,000 to $99,999 | 309 (7.0%) | 1,119 (19.7%) |
| $100,000 to $149,999 | 510 (11.6%) | 1,110 (19.6%) |
| $150,000 or more | 218 (5.0%) | 1,096 (19.3%) |
| Total | 4,388 (100.0%) | 5,673 (100.0%) |
Property Value to Household Income Ratio in Laclede County
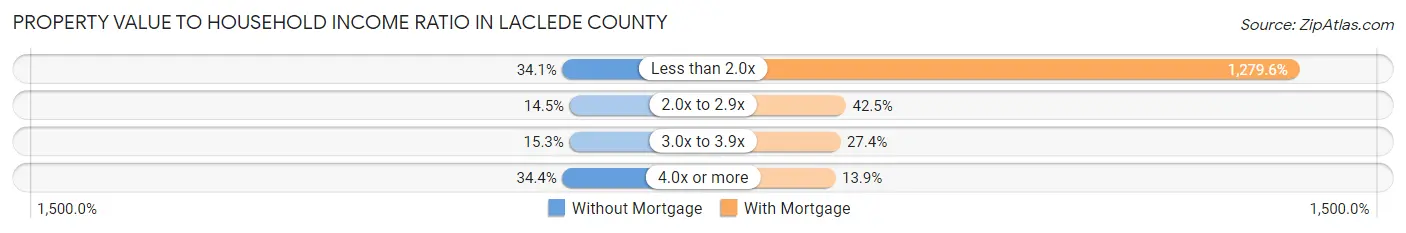
| Value-to-Income Ratio | Without Mortgage | With Mortgage |
| Less than 2.0x | 1,498 (34.1%) | 72,589 (1,279.6%) |
| 2.0x to 2.9x | 634 (14.4%) | 2,409 (42.5%) |
| 3.0x to 3.9x | 672 (15.3%) | 1,554 (27.4%) |
| 4.0x or more | 1,510 (34.4%) | 786 (13.9%) |
| Total | 4,388 (100.0%) | 5,673 (100.0%) |
Real Estate Taxes by Mortgage Status in Laclede County
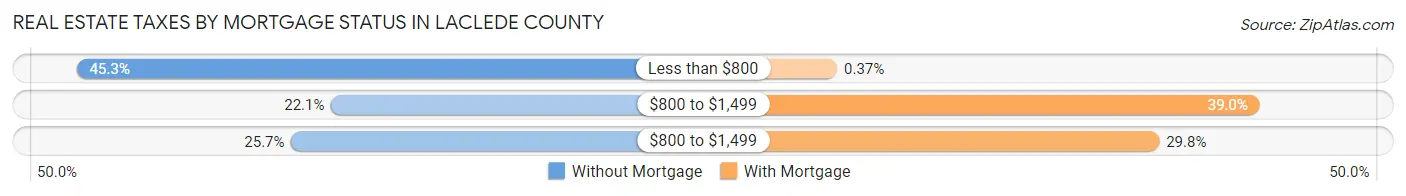
| Property Taxes | Without Mortgage | With Mortgage |
| Less than $800 | 1,986 (45.3%) | 21 (0.4%) |
| $800 to $1,499 | 969 (22.1%) | 2,211 (39.0%) |
| $800 to $1,499 | 1,129 (25.7%) | 1,690 (29.8%) |
| Total | 4,388 (100.0%) | 5,673 (100.0%) |
Health & Disability in Laclede County
Health Insurance Coverage by Age in Laclede County
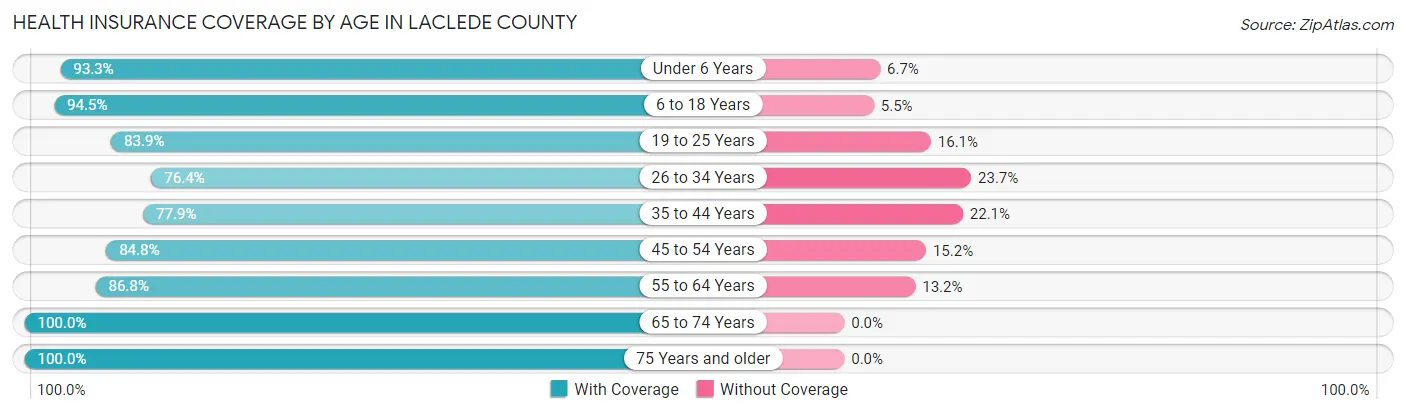
| Age Bracket | With Coverage | Without Coverage |
| Under 6 Years | 2,742 (93.3%) | 196 (6.7%) |
| 6 to 18 Years | 6,203 (94.5%) | 362 (5.5%) |
| 19 to 25 Years | 2,094 (83.9%) | 403 (16.1%) |
| 26 to 34 Years | 2,934 (76.3%) | 909 (23.6%) |
| 35 to 44 Years | 3,357 (77.9%) | 953 (22.1%) |
| 45 to 54 Years | 3,691 (84.8%) | 663 (15.2%) |
| 55 to 64 Years | 4,253 (86.8%) | 649 (13.2%) |
| 65 to 74 Years | 3,765 (100.0%) | 0 (0.0%) |
| 75 Years and older | 2,593 (100.0%) | 0 (0.0%) |
| Total | 31,632 (88.4%) | 4,135 (11.6%) |
Health Insurance Coverage by Citizenship Status in Laclede County
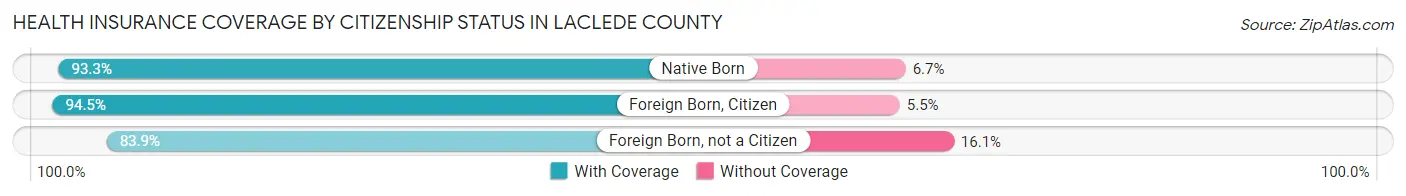
| Citizenship Status | With Coverage | Without Coverage |
| Native Born | 2,742 (93.3%) | 196 (6.7%) |
| Foreign Born, Citizen | 6,203 (94.5%) | 362 (5.5%) |
| Foreign Born, not a Citizen | 2,094 (83.9%) | 403 (16.1%) |
Health Insurance Coverage by Household Income in Laclede County
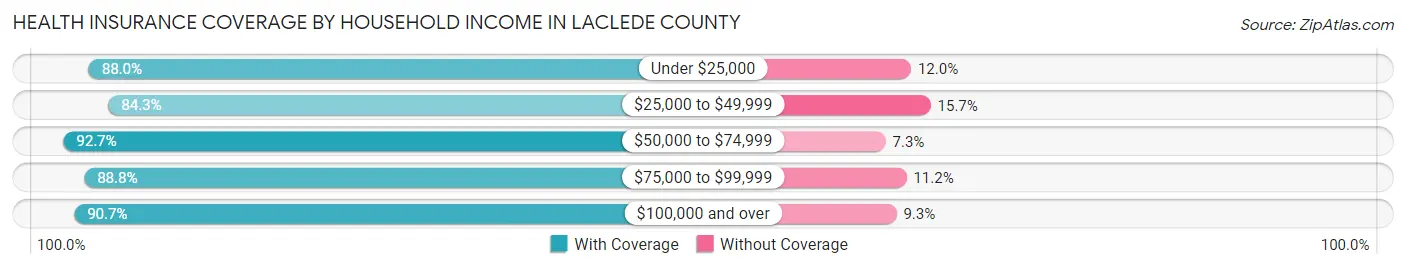
| Household Income | With Coverage | Without Coverage |
| Under $25,000 | 4,586 (88.0%) | 627 (12.0%) |
| $25,000 to $49,999 | 9,055 (84.3%) | 1,686 (15.7%) |
| $50,000 to $74,999 | 5,777 (92.7%) | 453 (7.3%) |
| $75,000 to $99,999 | 5,250 (88.8%) | 661 (11.2%) |
| $100,000 and over | 6,906 (90.7%) | 708 (9.3%) |
Public vs Private Health Insurance Coverage by Age in Laclede County
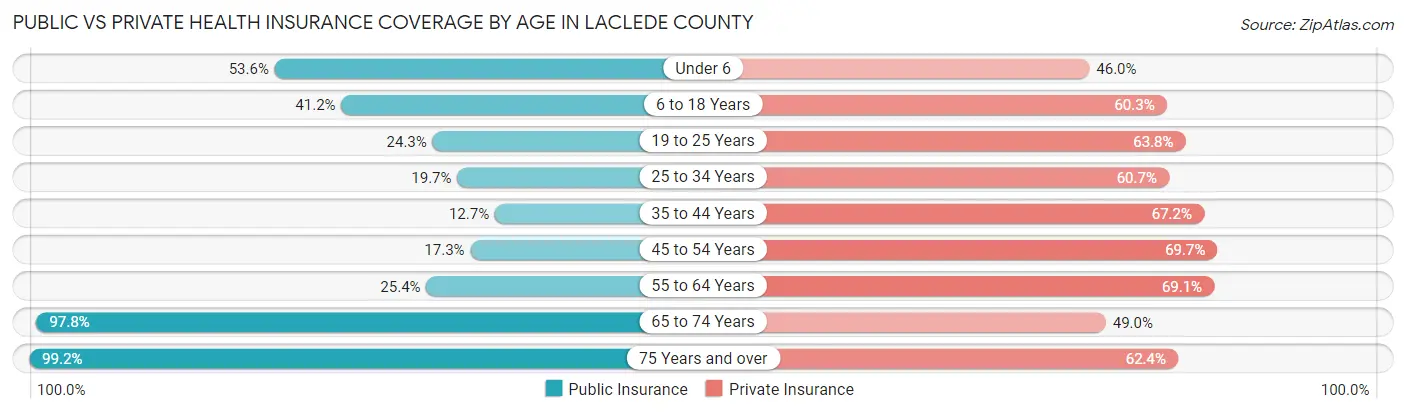
| Age Bracket | Public Insurance | Private Insurance |
| Under 6 | 1,574 (53.6%) | 1,350 (46.0%) |
| 6 to 18 Years | 2,705 (41.2%) | 3,956 (60.3%) |
| 19 to 25 Years | 606 (24.3%) | 1,592 (63.8%) |
| 25 to 34 Years | 756 (19.7%) | 2,332 (60.7%) |
| 35 to 44 Years | 547 (12.7%) | 2,896 (67.2%) |
| 45 to 54 Years | 751 (17.2%) | 3,034 (69.7%) |
| 55 to 64 Years | 1,246 (25.4%) | 3,386 (69.1%) |
| 65 to 74 Years | 3,682 (97.8%) | 1,845 (49.0%) |
| 75 Years and over | 2,571 (99.2%) | 1,617 (62.4%) |
| Total | 14,438 (40.4%) | 22,008 (61.5%) |
Disability Status by Sex by Age in Laclede County
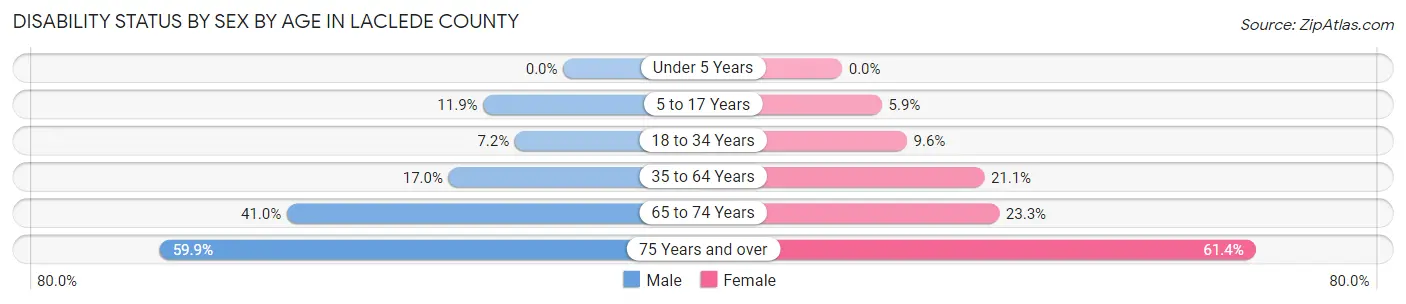
| Age Bracket | Male | Female |
| Under 5 Years | 0 (0.0%) | 0 (0.0%) |
| 5 to 17 Years | 392 (11.9%) | 188 (5.9%) |
| 18 to 34 Years | 256 (7.2%) | 323 (9.6%) |
| 35 to 64 Years | 1,156 (17.0%) | 1,429 (21.1%) |
| 65 to 74 Years | 727 (41.0%) | 465 (23.3%) |
| 75 Years and over | 715 (59.9%) | 860 (61.4%) |
Disability Class by Sex by Age in Laclede County
Disability Class: Hearing Difficulty
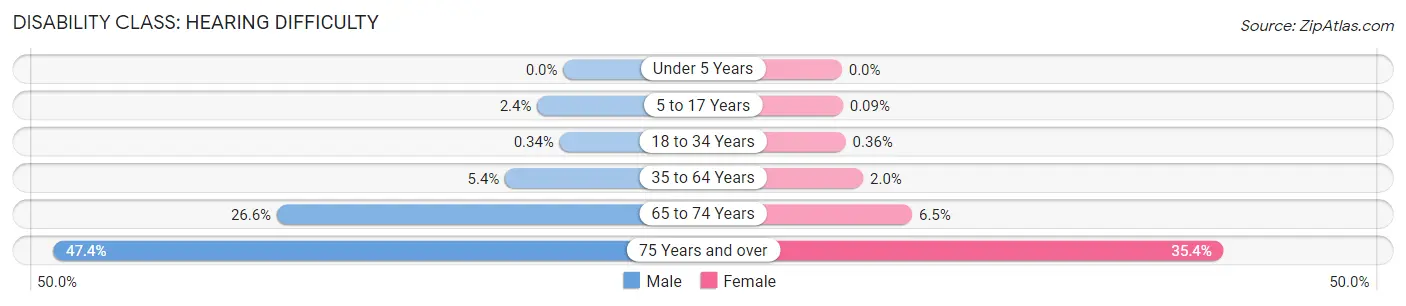
| Age Bracket | Male | Female |
| Under 5 Years | 0 (0.0%) | 0 (0.0%) |
| 5 to 17 Years | 80 (2.4%) | 3 (0.1%) |
| 18 to 34 Years | 12 (0.3%) | 12 (0.4%) |
| 35 to 64 Years | 367 (5.4%) | 134 (2.0%) |
| 65 to 74 Years | 471 (26.6%) | 130 (6.5%) |
| 75 Years and over | 565 (47.4%) | 496 (35.4%) |
Disability Class: Vision Difficulty
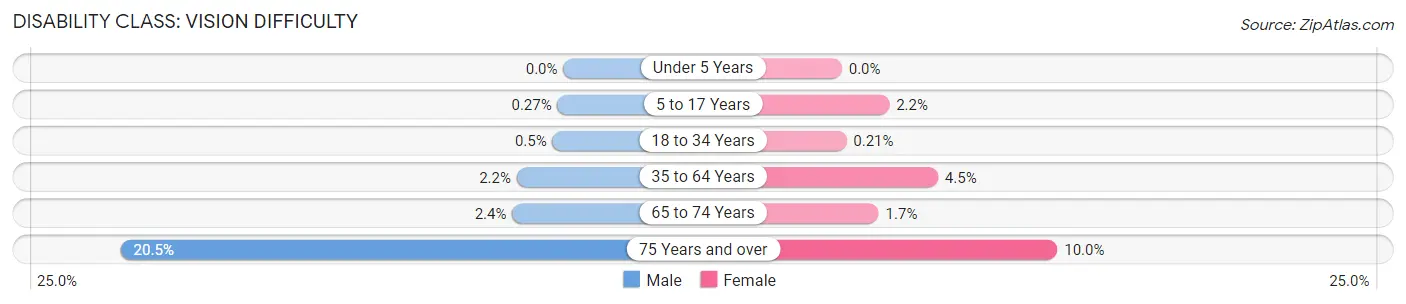
| Age Bracket | Male | Female |
| Under 5 Years | 0 (0.0%) | 0 (0.0%) |
| 5 to 17 Years | 9 (0.3%) | 70 (2.2%) |
| 18 to 34 Years | 18 (0.5%) | 7 (0.2%) |
| 35 to 64 Years | 147 (2.2%) | 302 (4.5%) |
| 65 to 74 Years | 42 (2.4%) | 34 (1.7%) |
| 75 Years and over | 245 (20.5%) | 140 (10.0%) |
Disability Class: Cognitive Difficulty
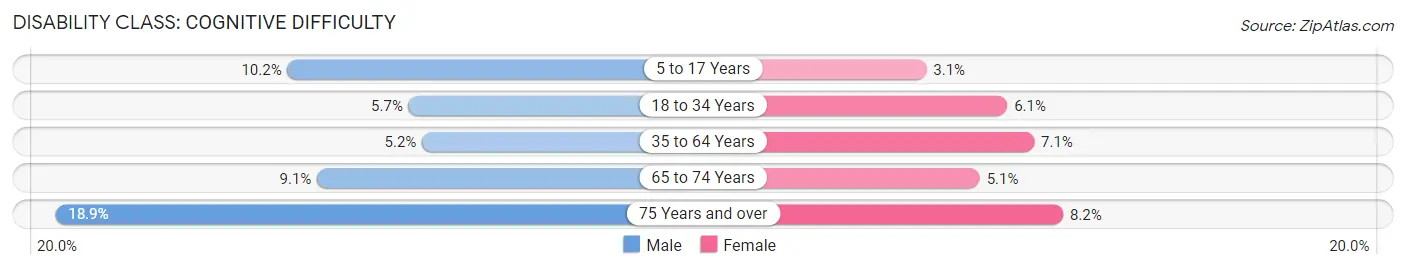
| Age Bracket | Male | Female |
| 5 to 17 Years | 338 (10.2%) | 100 (3.1%) |
| 18 to 34 Years | 205 (5.7%) | 206 (6.1%) |
| 35 to 64 Years | 356 (5.2%) | 483 (7.1%) |
| 65 to 74 Years | 162 (9.1%) | 102 (5.1%) |
| 75 Years and over | 225 (18.9%) | 115 (8.2%) |
Disability Class: Ambulatory Difficulty
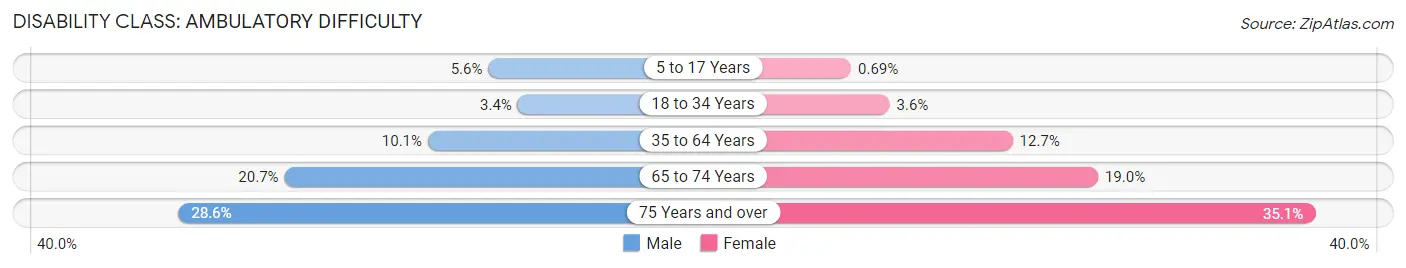
| Age Bracket | Male | Female |
| 5 to 17 Years | 184 (5.6%) | 22 (0.7%) |
| 18 to 34 Years | 121 (3.4%) | 119 (3.5%) |
| 35 to 64 Years | 684 (10.1%) | 858 (12.7%) |
| 65 to 74 Years | 367 (20.7%) | 379 (19.0%) |
| 75 Years and over | 341 (28.6%) | 492 (35.1%) |
Disability Class: Self-Care Difficulty
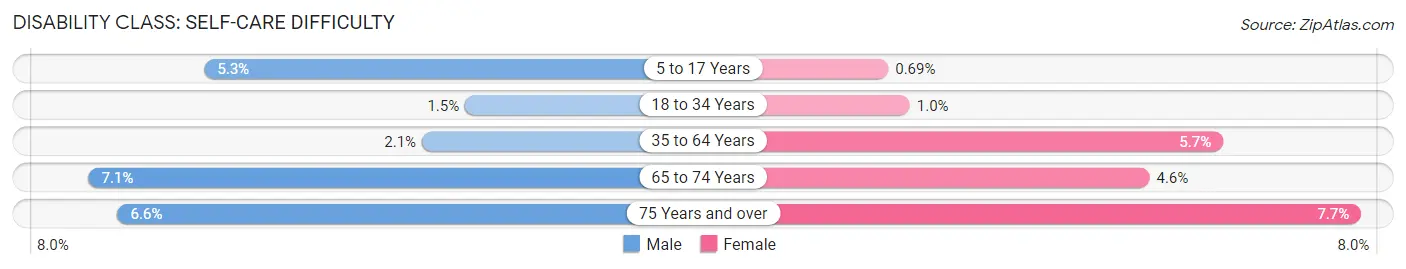
| Age Bracket | Male | Female |
| 5 to 17 Years | 176 (5.3%) | 22 (0.7%) |
| 18 to 34 Years | 52 (1.5%) | 34 (1.0%) |
| 35 to 64 Years | 143 (2.1%) | 383 (5.7%) |
| 65 to 74 Years | 125 (7.0%) | 91 (4.6%) |
| 75 Years and over | 79 (6.6%) | 108 (7.7%) |
Technology Access in Laclede County
Computing Device Access in Laclede County
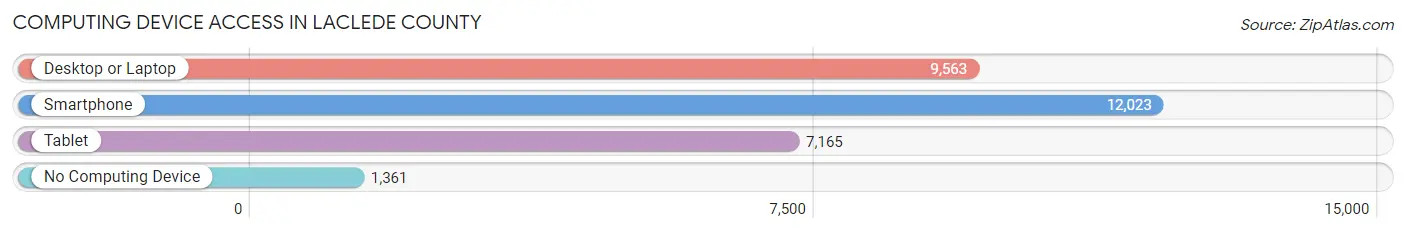
| Device Type | # Households | % Households |
| Desktop or Laptop | 9,563 | 66.7% |
| Smartphone | 12,023 | 83.8% |
| Tablet | 7,165 | 49.9% |
| No Computing Device | 1,361 | 9.5% |
| Total | 14,345 | 100.0% |
Internet Access in Laclede County
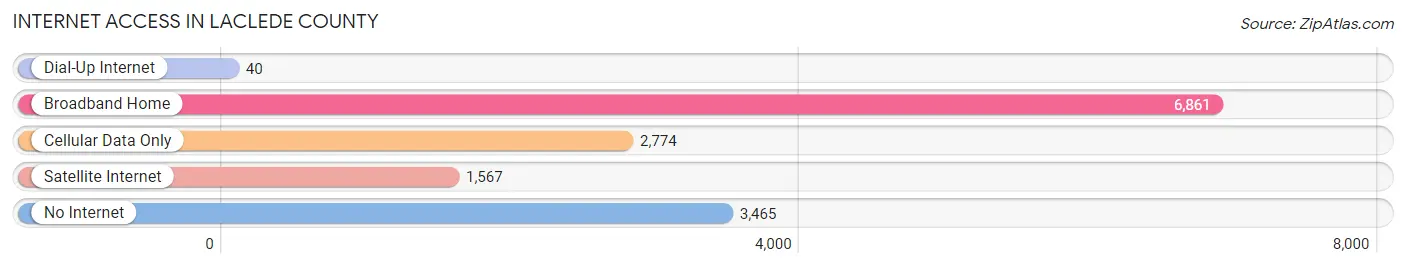
| Internet Type | # Households | % Households |
| Dial-Up Internet | 40 | 0.3% |
| Broadband Home | 6,861 | 47.8% |
| Cellular Data Only | 2,774 | 19.3% |
| Satellite Internet | 1,567 | 10.9% |
| No Internet | 3,465 | 24.1% |
| Total | 14,345 | 100.0% |
Laclede County Summary
Laclede County is located in the southwestern corner of Missouri, and is bordered by Camden, Dallas, Webster, Wright, Texas, and Pulaski counties. The county seat is Lebanon, and the county was named after Pierre Laclede, the founder of St. Louis. The county has a total area of 576 square miles, and a population of 35,571 as of the 2010 census.
Geography
Laclede County is located in the Ozark Plateau region of Missouri, and is characterized by rolling hills and valleys. The county is drained by the Gasconade River, which flows through the county from north to south. The county is also home to several small lakes, including Lake of the Ozarks, Lake Taneycomo, and Lake Springfield. The highest point in the county is located in the northern part of the county, near the town of Conway, and is 1,092 feet above sea level.
The county is mostly rural, with the majority of the population living in small towns and villages. The largest city in the county is Lebanon, with a population of 14,174 as of the 2010 census. Other cities in the county include Conway, Phillipsburg, and Stoutland.
Economy
The economy of Laclede County is largely based on agriculture and manufacturing. The county is home to several large farms, and is a major producer of beef, pork, and poultry. The county is also home to several large manufacturing plants, including a Tyson Foods plant in Lebanon, and a ConAgra Foods plant in Phillipsburg.
The county is also home to several tourist attractions, including the Lake of the Ozarks State Park, the Mark Twain National Forest, and the Ozark National Scenic Riverways. Tourism is a major source of income for the county, and is responsible for creating thousands of jobs.
Demographics
As of the 2010 census, the population of Laclede County was 35,571, with a population density of 61.7 people per square mile. The racial makeup of the county was 95.2% White, 1.3% African American, 0.4% Native American, 0.3% Asian, 0.1% Pacific Islander, 1.2% from other races, and 1.5% from two or more races. Hispanic or Latino of any race were 3.2% of the population.
The median income for a household in the county was $37,845, and the median income for a family was $45,945. The per capita income for the county was $19,845. About 13.2% of families and 16.7% of the population were below the poverty line, including 22.2% of those under age 18 and 11.2% of those age 65 or over.
Conclusion
Laclede County is a rural county located in the southwestern corner of Missouri. The county is characterized by rolling hills and valleys, and is home to several small lakes. The economy of the county is largely based on agriculture and manufacturing, and tourism is also a major source of income. The population of the county is 35,571, with a median income of $37,845.
Common Questions
What is Per Capita Income in Laclede County?
Per Capita income in Laclede County is $27,790.
What is the Median Family Income in Laclede County?
Median Family Income in Laclede County is $60,463.
What is the Median Household income in Laclede County?
Median Household Income in Laclede County is $49,202.
What is Income or Wage Gap in Laclede County?
Income or Wage Gap in Laclede County is 28.4%.
Women in Laclede County earn 71.6 cents for every dollar earned by a man.
What is Family Income Deficit in Laclede County?
Family Income Deficit in Laclede County is $9,523.
Families that are below poverty line in Laclede County earn $9,523 less on average than the poverty threshold level.
What is Inequality or Gini Index in Laclede County?
Inequality or Gini Index in Laclede County is 0.45.
What is the Total Population of Laclede County?
Total Population of Laclede County is 36,060.
What is the Total Male Population of Laclede County?
Total Male Population of Laclede County is 18,027.
What is the Total Female Population of Laclede County?
Total Female Population of Laclede County is 18,033.
What is the Ratio of Males per 100 Females in Laclede County?
There are 99.97 Males per 100 Females in Laclede County.
What is the Ratio of Females per 100 Males in Laclede County?
There are 100.03 Females per 100 Males in Laclede County.
What is the Median Population Age in Laclede County?
Median Population Age in Laclede County is 39.5 Years.
What is the Average Family Size in Laclede County
Average Family Size in Laclede County is 3.0 People.
What is the Average Household Size in Laclede County
Average Household Size in Laclede County is 2.5 People.
How Large is the Labor Force in Laclede County?
There are 16,512 People in the Labor Forcein in Laclede County.
What is the Percentage of People in the Labor Force in Laclede County?
58.8% of People are in the Labor Force in Laclede County.
What is the Unemployment Rate in Laclede County?
Unemployment Rate in Laclede County is 5.9%.