Knox County, MO Map & Demographics
Knox County Map
Knox County Overview
$22,902
PER CAPITA INCOME
$70,469
AVG FAMILY INCOME
$49,167
AVG HOUSEHOLD INCOME
47.1%
WAGE / INCOME GAP [ % ]
52.9¢/ $1
WAGE / INCOME GAP [ $ ]
$11,729
FAMILY INCOME DEFICIT
0.44
INEQUALITY / GINI INDEX
3,772
TOTAL POPULATION
1,899
MALE POPULATION
1,873
FEMALE POPULATION
101.39
MALES / 100 FEMALES
98.63
FEMALES / 100 MALES
41.9
MEDIAN AGE
4.4
AVG FAMILY SIZE
3.2
AVG HOUSEHOLD SIZE
1,673
LABOR FORCE [ PEOPLE ]
55.6%
PERCENT IN LABOR FORCE
2.1%
UNEMPLOYMENT RATE
Knox County Area Codes
Income in Knox County
Income Overview in Knox County
Per Capita Income in Knox County is $22,902, while median incomes of families and households are $70,469 and $49,167 respectively.
| Characteristic | Number | Measure |
| Per Capita Income | 3,772 | $22,902 |
| Median Family Income | 714 | $70,469 |
| Mean Family Income | 714 | $83,498 |
| Median Household Income | 1,154 | $49,167 |
| Mean Household Income | 1,154 | $63,736 |
| Income Deficit | 714 | $11,729 |
| Wage / Income Gap (%) | 3,772 | 47.12% |
| Wage / Income Gap ($) | 3,772 | 52.88¢ per $1 |
| Gini / Inequality Index | 3,772 | 0.44 |
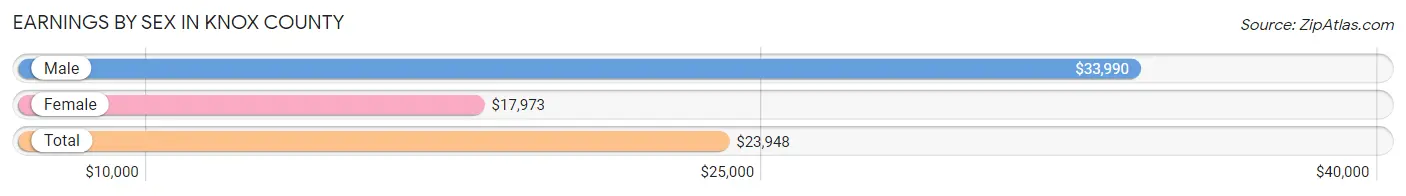
Earnings by Sex in Knox County
Average Earnings in Knox County are $23,948, $33,990 for men and $17,973 for women, a difference of 47.1%.
| Sex | Number | Average Earnings |
| Male | 1,059 (55.8%) | $33,990 |
| Female | 838 (44.2%) | $17,973 |
| Total | 1,897 (100.0%) | $23,948 |
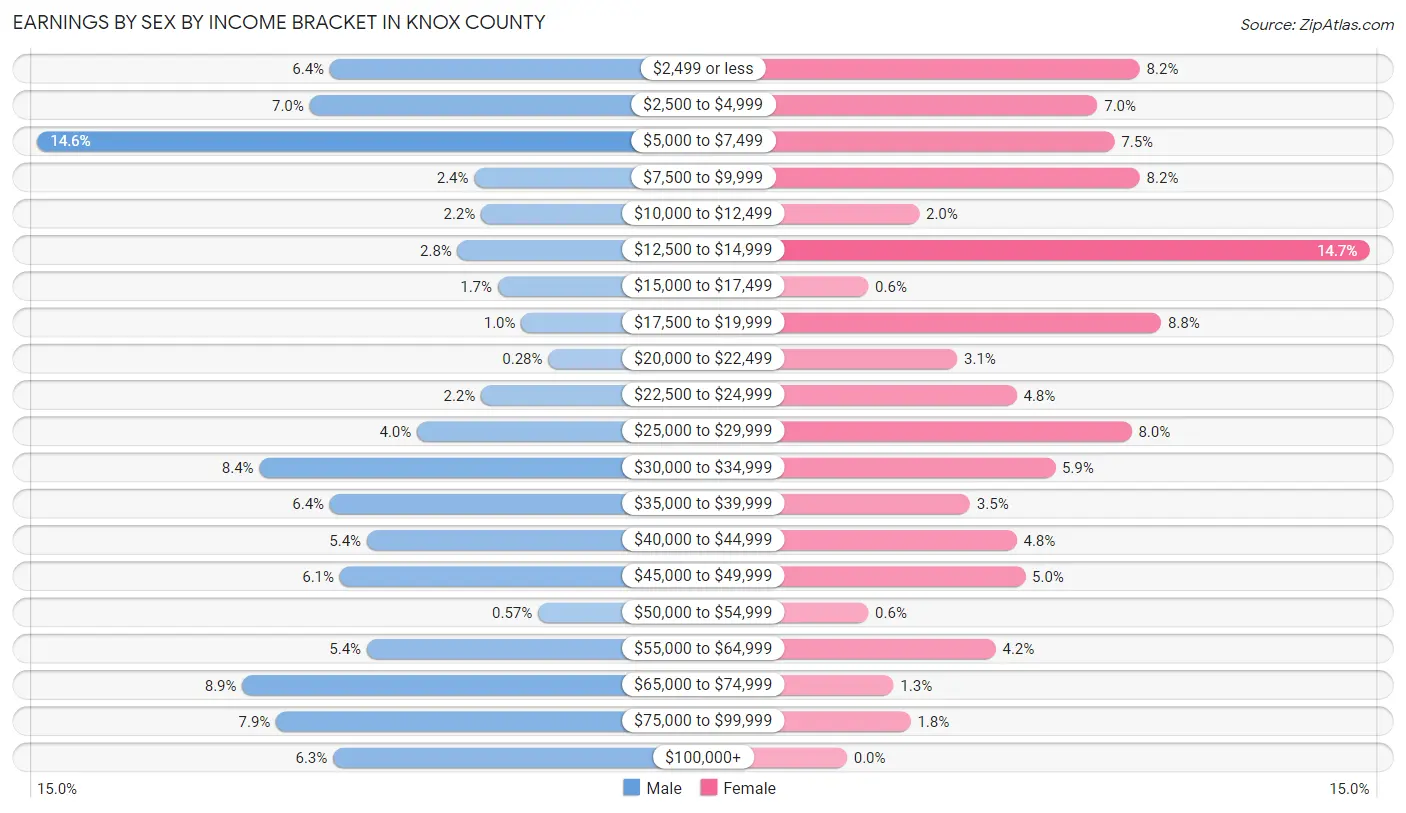
Earnings by Sex by Income Bracket in Knox County
The most common earnings brackets in Knox County are $5,000 to $7,499 for men (155 | 14.6%) and $12,500 to $14,999 for women (123 | 14.7%).
| Income | Male | Female |
| $2,499 or less | 68 (6.4%) | 69 (8.2%) |
| $2,500 to $4,999 | 74 (7.0%) | 59 (7.0%) |
| $5,000 to $7,499 | 155 (14.6%) | 63 (7.5%) |
| $7,500 to $9,999 | 25 (2.4%) | 69 (8.2%) |
| $10,000 to $12,499 | 23 (2.2%) | 17 (2.0%) |
| $12,500 to $14,999 | 30 (2.8%) | 123 (14.7%) |
| $15,000 to $17,499 | 18 (1.7%) | 5 (0.6%) |
| $17,500 to $19,999 | 11 (1.0%) | 74 (8.8%) |
| $20,000 to $22,499 | 3 (0.3%) | 26 (3.1%) |
| $22,500 to $24,999 | 23 (2.2%) | 40 (4.8%) |
| $25,000 to $29,999 | 42 (4.0%) | 67 (8.0%) |
| $30,000 to $34,999 | 89 (8.4%) | 49 (5.9%) |
| $35,000 to $39,999 | 68 (6.4%) | 29 (3.5%) |
| $40,000 to $44,999 | 57 (5.4%) | 40 (4.8%) |
| $45,000 to $49,999 | 65 (6.1%) | 42 (5.0%) |
| $50,000 to $54,999 | 6 (0.6%) | 5 (0.6%) |
| $55,000 to $64,999 | 57 (5.4%) | 35 (4.2%) |
| $65,000 to $74,999 | 94 (8.9%) | 11 (1.3%) |
| $75,000 to $99,999 | 84 (7.9%) | 15 (1.8%) |
| $100,000+ | 67 (6.3%) | 0 (0.0%) |
| Total | 1,059 (100.0%) | 838 (100.0%) |
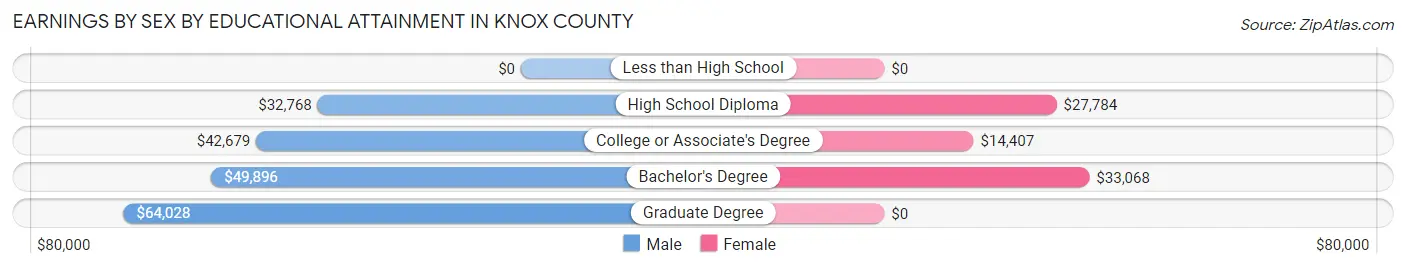
Earnings by Sex by Educational Attainment in Knox County
Average earnings in Knox County are $34,853 for men and $21,202 for women, a difference of 39.2%. Men with an educational attainment of graduate degree enjoy the highest average annual earnings of $64,028, while those with high school diploma education earn the least with $32,768. Women with an educational attainment of bachelor's degree earn the most with the average annual earnings of $33,068, while those with college or associate's degree education have the smallest earnings of $14,407.
| Educational Attainment | Male Income | Female Income |
| Less than High School | - | - |
| High School Diploma | $32,768 | $27,784 |
| College or Associate's Degree | $42,679 | $14,407 |
| Bachelor's Degree | $49,896 | $33,068 |
| Graduate Degree | $64,028 | $0 |
| Total | $34,853 | $21,202 |
Family Income in Knox County
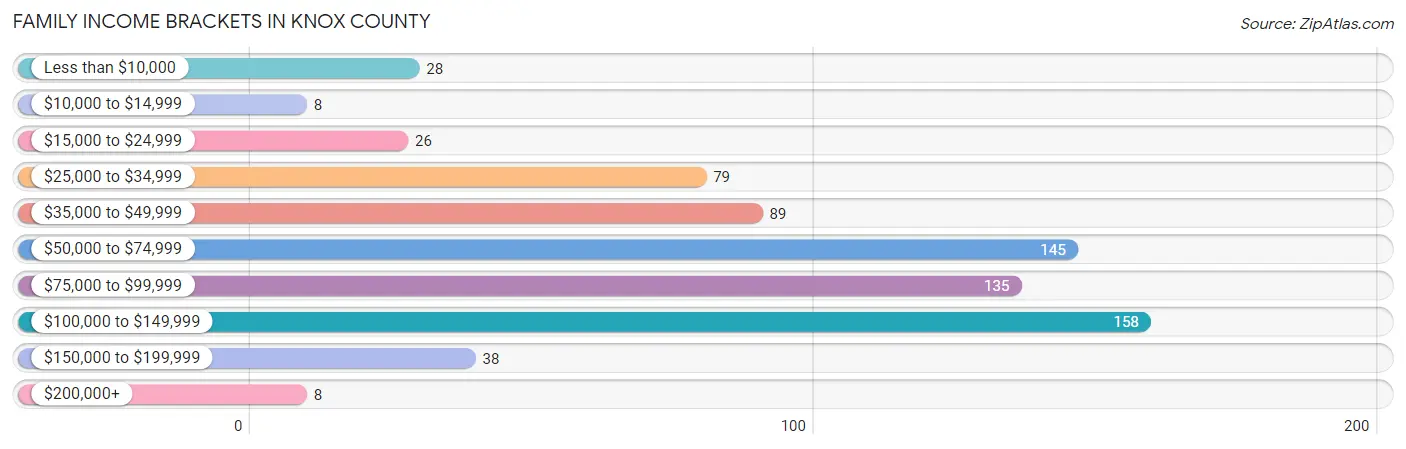
Family Income Brackets in Knox County
According to the Knox County family income data, there are 158 families falling into the $100,000 to $149,999 income range, which is the most common income bracket and makes up 22.1% of all families. Conversely, the $10,000 to $14,999 income bracket is the least frequent group with only 8 families (1.1%) belonging to this category.
| Income Bracket | # Families | % Families |
| Less than $10,000 | 28 | 3.9% |
| $10,000 to $14,999 | 8 | 1.1% |
| $15,000 to $24,999 | 26 | 3.6% |
| $25,000 to $34,999 | 79 | 11.1% |
| $35,000 to $49,999 | 89 | 12.5% |
| $50,000 to $74,999 | 145 | 20.3% |
| $75,000 to $99,999 | 135 | 18.9% |
| $100,000 to $149,999 | 158 | 22.1% |
| $150,000 to $199,999 | 38 | 5.3% |
| $200,000+ | 8 | 1.1% |
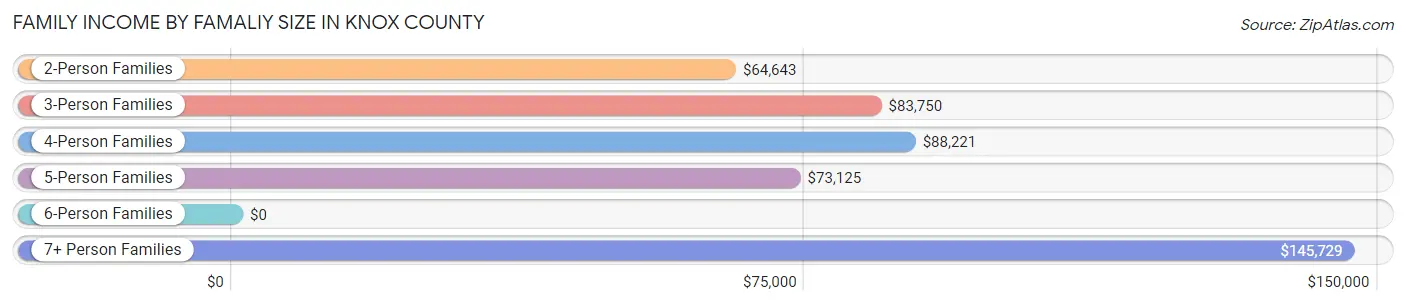
Family Income by Famaliy Size in Knox County
7+ person families (51 | 7.1%) account for the highest median family income in Knox County with $145,729 per family, while 2-person families (406 | 56.9%) have the highest median income of $32,322 per family member.
| Income Bracket | # Families | Median Income |
| 2-Person Families | 406 (56.9%) | $64,643 |
| 3-Person Families | 97 (13.6%) | $83,750 |
| 4-Person Families | 143 (20.0%) | $88,221 |
| 5-Person Families | 8 (1.1%) | $73,125 |
| 6-Person Families | 9 (1.3%) | $0 |
| 7+ Person Families | 51 (7.1%) | $145,729 |
| Total | 714 (100.0%) | $70,469 |
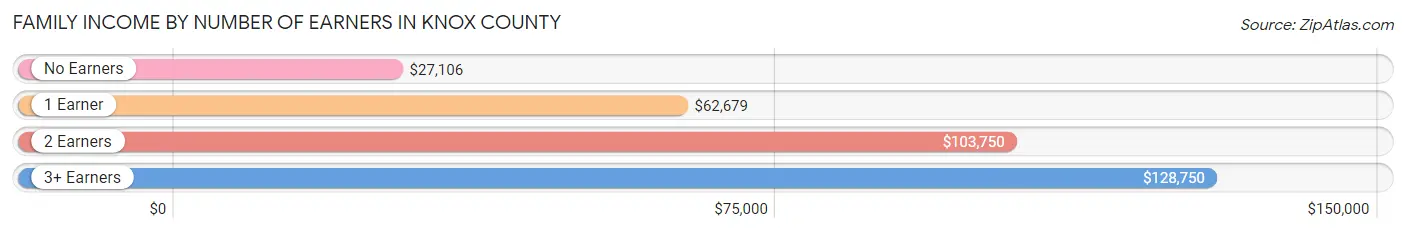
Family Income by Number of Earners in Knox County
The median family income in Knox County is $70,469, with families comprising 3+ earners (124) having the highest median family income of $128,750, while families with no earners (147) have the lowest median family income of $27,106, accounting for 17.4% and 20.6% of families, respectively.
| Number of Earners | # Families | Median Income |
| No Earners | 147 (20.6%) | $27,106 |
| 1 Earner | 213 (29.8%) | $62,679 |
| 2 Earners | 230 (32.2%) | $103,750 |
| 3+ Earners | 124 (17.4%) | $128,750 |
| Total | 714 (100.0%) | $70,469 |
Household Income in Knox County
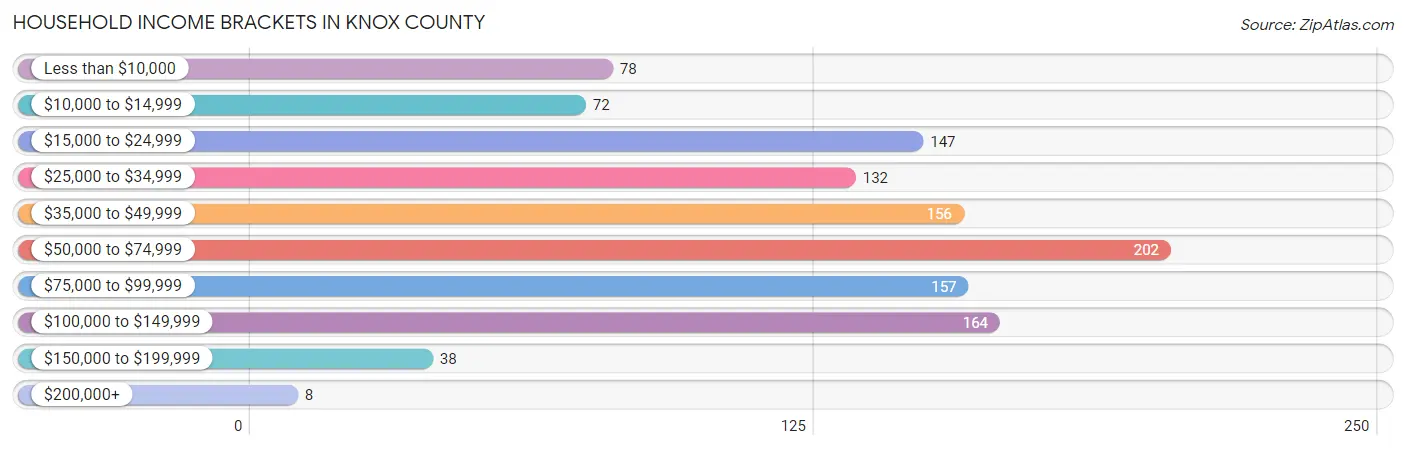
Household Income Brackets in Knox County
With 202 households falling in the category, the $50,000 to $74,999 income range is the most frequent in Knox County, accounting for 17.5% of all households. In contrast, only 8 households (0.7%) fall into the $200,000+ income bracket, making it the least populous group.
| Income Bracket | # Households | % Households |
| Less than $10,000 | 78 | 6.8% |
| $10,000 to $14,999 | 72 | 6.2% |
| $15,000 to $24,999 | 147 | 12.7% |
| $25,000 to $34,999 | 132 | 11.4% |
| $35,000 to $49,999 | 156 | 13.5% |
| $50,000 to $74,999 | 202 | 17.5% |
| $75,000 to $99,999 | 157 | 13.6% |
| $100,000 to $149,999 | 164 | 14.2% |
| $150,000 to $199,999 | 38 | 3.3% |
| $200,000+ | 8 | 0.7% |
Household Income by Householder Age in Knox County
The median household income in Knox County is $49,167, with the highest median household income of $72,500 found in the 45 to 64 years age bracket for the primary householder. A total of 436 households (37.8%) fall into this category. Meanwhile, the 15 to 24 years age bracket for the primary householder has the lowest median household income of $29,286, with 20 households (1.7%) in this group.
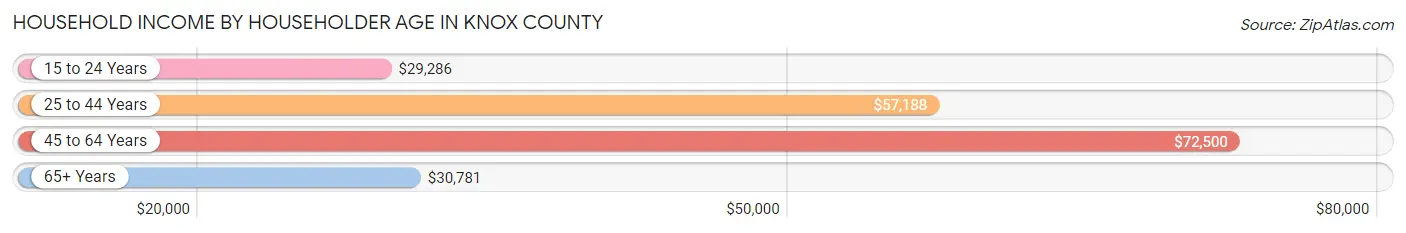
| Income Bracket | # Households | Median Income |
| 15 to 24 Years | 20 (1.7%) | $29,286 |
| 25 to 44 Years | 205 (17.8%) | $57,188 |
| 45 to 64 Years | 436 (37.8%) | $72,500 |
| 65+ Years | 493 (42.7%) | $30,781 |
| Total | 1,154 (100.0%) | $49,167 |
Poverty in Knox County
Income Below Poverty by Sex and Age in Knox County
With 12.9% poverty level for males and 12.5% for females among the residents of Knox County, 5 year old males and 15 year old females are the most vulnerable to poverty, with 6 males (60.0%) and 6 females (40.0%) in their respective age groups living below the poverty level.
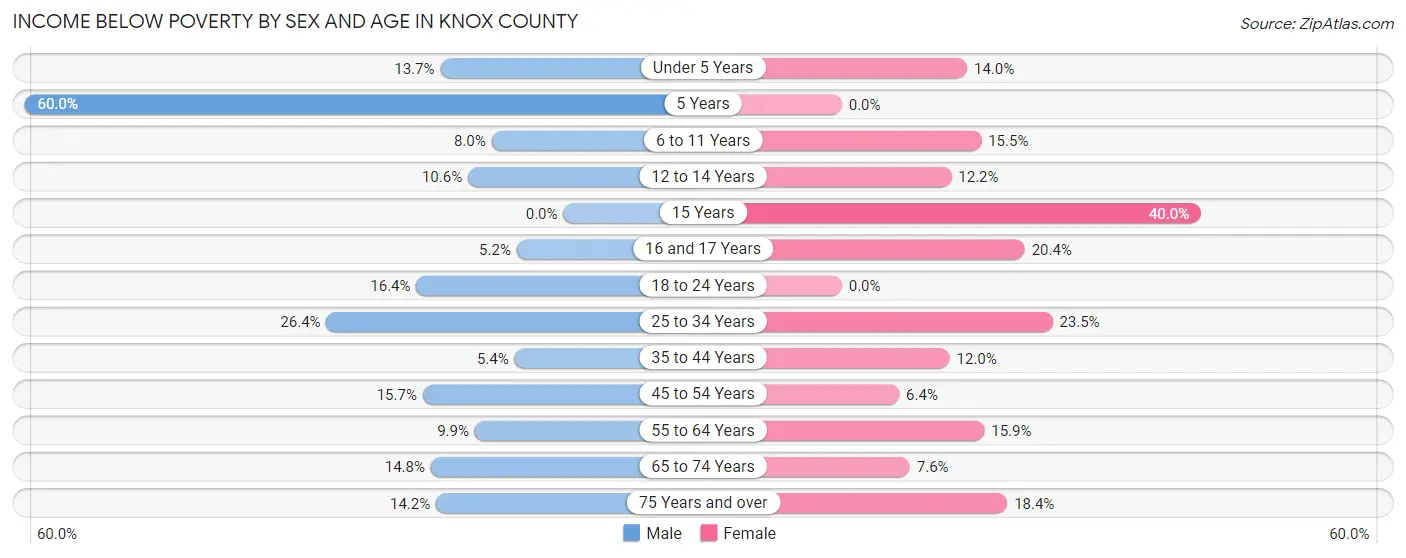
| Age Bracket | Male | Female |
| Under 5 Years | 20 (13.7%) | 18 (14.0%) |
| 5 Years | 6 (60.0%) | 0 (0.0%) |
| 6 to 11 Years | 10 (8.0%) | 16 (15.5%) |
| 12 to 14 Years | 12 (10.6%) | 10 (12.2%) |
| 15 Years | 0 (0.0%) | 6 (40.0%) |
| 16 and 17 Years | 4 (5.2%) | 11 (20.4%) |
| 18 to 24 Years | 28 (16.4%) | 0 (0.0%) |
| 25 to 34 Years | 38 (26.4%) | 38 (23.5%) |
| 35 to 44 Years | 13 (5.4%) | 24 (12.0%) |
| 45 to 54 Years | 31 (15.7%) | 14 (6.4%) |
| 55 to 64 Years | 29 (9.9%) | 40 (15.9%) |
| 65 to 74 Years | 31 (14.8%) | 16 (7.6%) |
| 75 Years and over | 20 (14.2%) | 35 (18.4%) |
| Total | 242 (12.9%) | 228 (12.5%) |
Income Above Poverty by Sex and Age in Knox County
According to the poverty statistics in Knox County, males aged 15 years and females aged 5 years are the age groups that are most secure financially, with 100.0% of males and 100.0% of females in these age groups living above the poverty line.
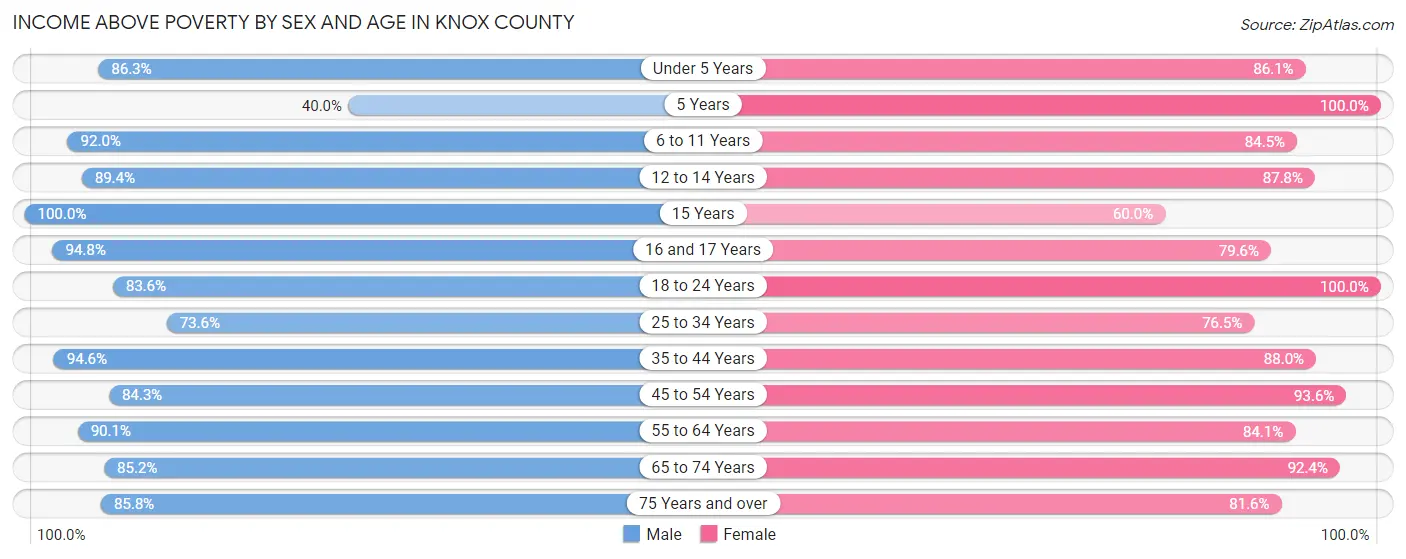
| Age Bracket | Male | Female |
| Under 5 Years | 126 (86.3%) | 111 (86.1%) |
| 5 Years | 4 (40.0%) | 15 (100.0%) |
| 6 to 11 Years | 115 (92.0%) | 87 (84.5%) |
| 12 to 14 Years | 101 (89.4%) | 72 (87.8%) |
| 15 Years | 13 (100.0%) | 9 (60.0%) |
| 16 and 17 Years | 73 (94.8%) | 43 (79.6%) |
| 18 to 24 Years | 143 (83.6%) | 195 (100.0%) |
| 25 to 34 Years | 106 (73.6%) | 124 (76.5%) |
| 35 to 44 Years | 226 (94.6%) | 176 (88.0%) |
| 45 to 54 Years | 167 (84.3%) | 205 (93.6%) |
| 55 to 64 Years | 265 (90.1%) | 212 (84.1%) |
| 65 to 74 Years | 179 (85.2%) | 195 (92.4%) |
| 75 Years and over | 121 (85.8%) | 155 (81.6%) |
| Total | 1,639 (87.1%) | 1,599 (87.5%) |
Income Below Poverty Among Married-Couple Families in Knox County
The poverty statistics for married-couple families in Knox County show that 5.1% or 32 of the total 626 families live below the poverty line. Families with 3 or 4 children have the highest poverty rate of 23.5%, comprising of 4 families. On the other hand, families with 1 or 2 children have the lowest poverty rate of 0.8%, which includes 1 families.
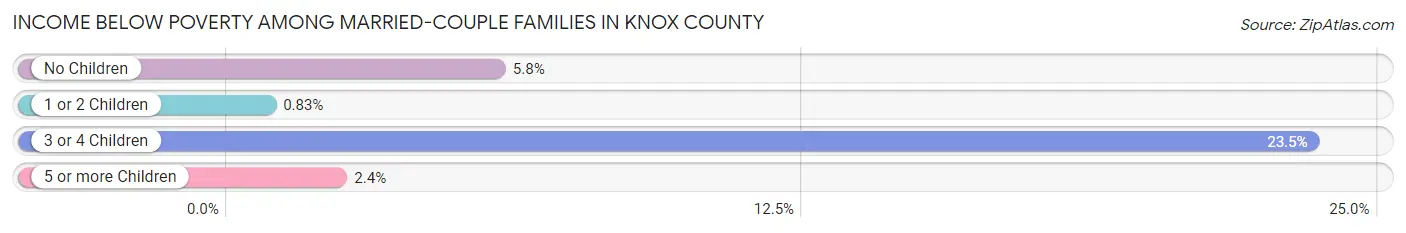
| Children | Above Poverty | Below Poverty |
| No Children | 420 (94.2%) | 26 (5.8%) |
| 1 or 2 Children | 120 (99.2%) | 1 (0.8%) |
| 3 or 4 Children | 13 (76.5%) | 4 (23.5%) |
| 5 or more Children | 41 (97.6%) | 1 (2.4%) |
| Total | 594 (94.9%) | 32 (5.1%) |
Income Below Poverty Among Single-Parent Households in Knox County
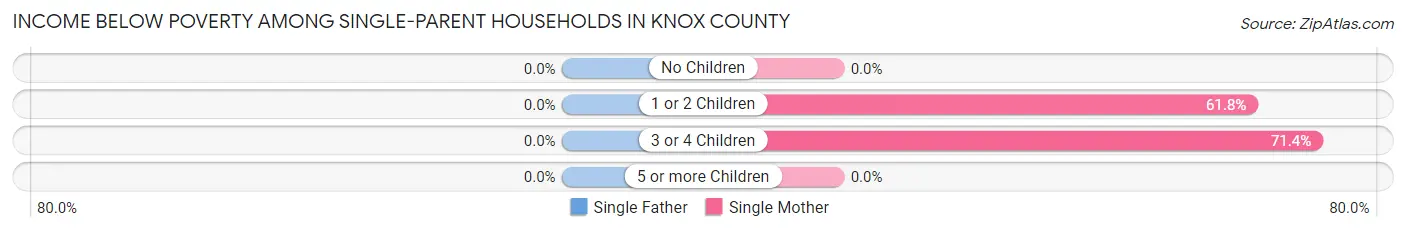
| Children | Single Father | Single Mother |
| No Children | 0 (0.0%) | 0 (0.0%) |
| 1 or 2 Children | 0 (0.0%) | 21 (61.8%) |
| 3 or 4 Children | 0 (0.0%) | 5 (71.4%) |
| 5 or more Children | 0 (0.0%) | 0 (0.0%) |
| Total | 0 (0.0%) | 26 (41.9%) |
Income Below Poverty Among Married-Couple vs Single-Parent Households in Knox County
The poverty data for Knox County shows that 32 of the married-couple family households (5.1%) and 26 of the single-parent households (29.5%) are living below the poverty level. Within the married-couple family households, those with 3 or 4 children have the highest poverty rate, with 4 households (23.5%) falling below the poverty line. Among the single-parent households, those with 3 or 4 children have the highest poverty rate, with 5 household (71.4%) living below poverty.
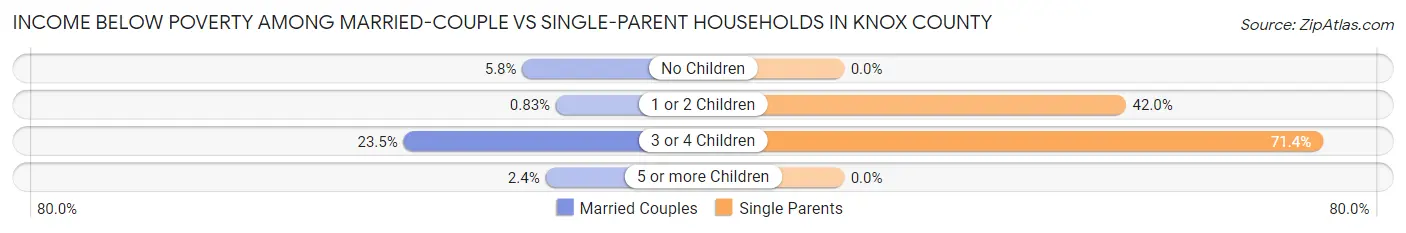
| Children | Married-Couple Families | Single-Parent Households |
| No Children | 26 (5.8%) | 0 (0.0%) |
| 1 or 2 Children | 1 (0.8%) | 21 (42.0%) |
| 3 or 4 Children | 4 (23.5%) | 5 (71.4%) |
| 5 or more Children | 1 (2.4%) | 0 (0.0%) |
| Total | 32 (5.1%) | 26 (29.5%) |
Race in Knox County
The most populous races in Knox County are White / Caucasian (3,546 | 94.0%), Two or more Races (92 | 2.4%), and Asian (73 | 1.9%).
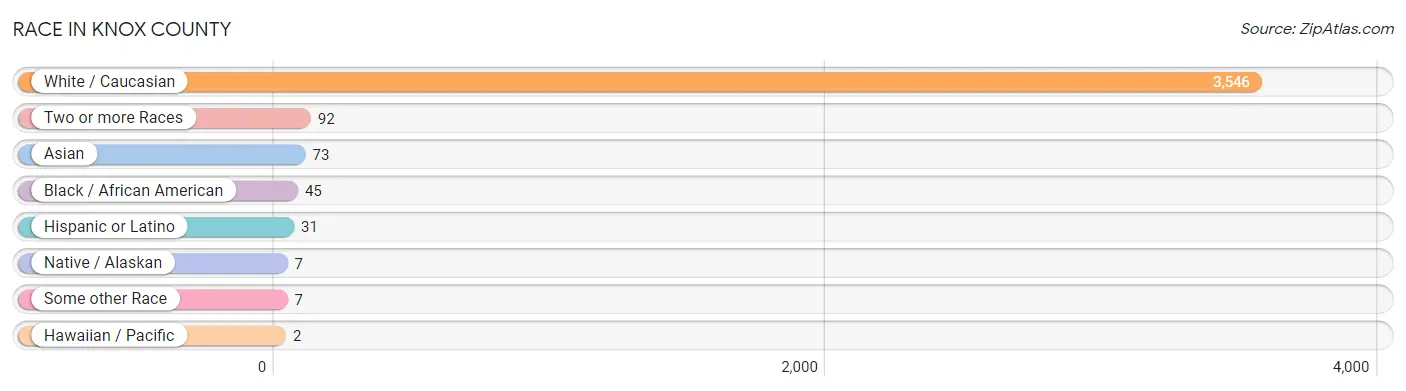
| Race | # Population | % Population |
| Asian | 73 | 1.9% |
| Black / African American | 45 | 1.2% |
| Hawaiian / Pacific | 2 | 0.1% |
| Hispanic or Latino | 31 | 0.8% |
| Native / Alaskan | 7 | 0.2% |
| White / Caucasian | 3,546 | 94.0% |
| Two or more Races | 92 | 2.4% |
| Some other Race | 7 | 0.2% |
| Total | 3,772 | 100.0% |
Ancestry in Knox County
The most populous ancestries reported in Knox County are German (962 | 25.5%), English (485 | 12.9%), American (323 | 8.6%), European (199 | 5.3%), and Irish (168 | 4.4%), together accounting for 56.7% of all Knox County residents.
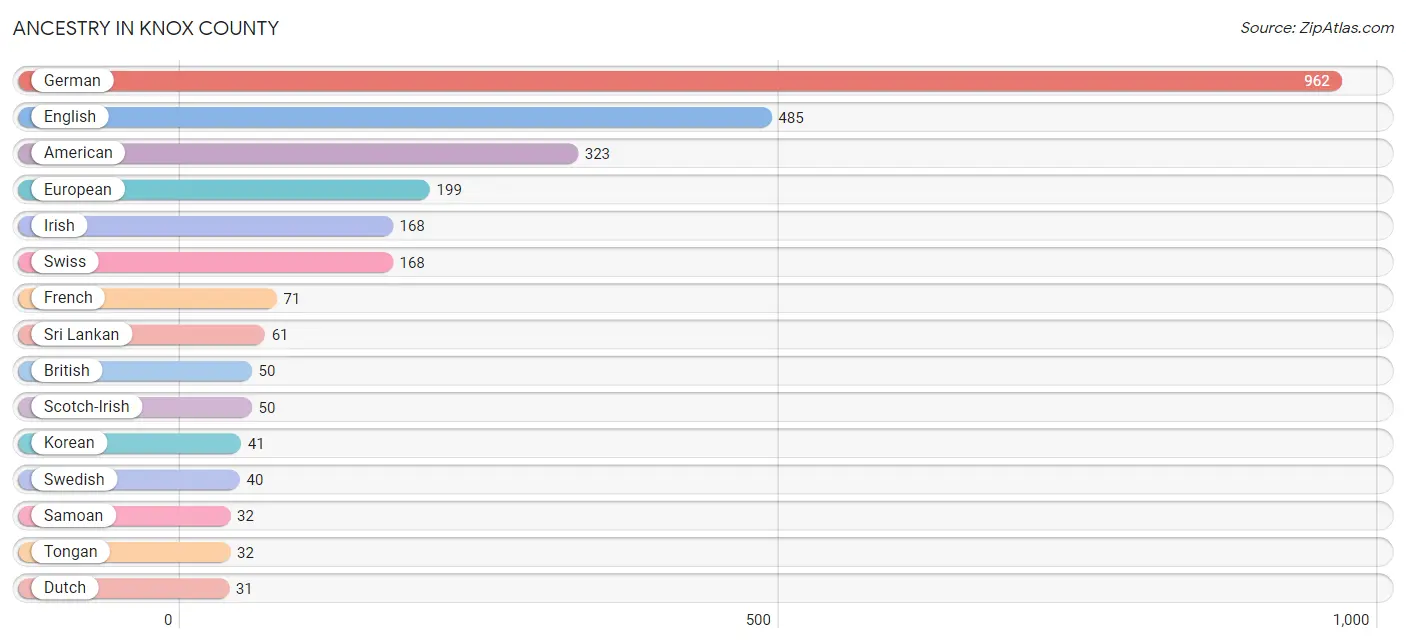
| Ancestry | # Population | % Population |
| African | 3 | 0.1% |
| American | 323 | 8.6% |
| Bangladeshi | 1 | 0.0% |
| British | 50 | 1.3% |
| Central American | 30 | 0.8% |
| Cherokee | 6 | 0.2% |
| Dutch | 31 | 0.8% |
| English | 485 | 12.9% |
| European | 199 | 5.3% |
| French | 71 | 1.9% |
| German | 962 | 25.5% |
| Honduran | 30 | 0.8% |
| Hungarian | 2 | 0.1% |
| Irish | 168 | 4.4% |
| Italian | 25 | 0.7% |
| Korean | 41 | 1.1% |
| Nigerian | 6 | 0.2% |
| Norwegian | 6 | 0.2% |
| Samoan | 32 | 0.9% |
| Scandinavian | 17 | 0.4% |
| Scotch-Irish | 50 | 1.3% |
| Scottish | 10 | 0.3% |
| Slovak | 3 | 0.1% |
| Sri Lankan | 61 | 1.6% |
| Subsaharan African | 11 | 0.3% |
| Swedish | 40 | 1.1% |
| Swiss | 168 | 4.4% |
| Tongan | 32 | 0.9% |
| Ukrainian | 1 | 0.0% |
| Welsh | 7 | 0.2% | View All 30 Rows |
Immigrants in Knox County
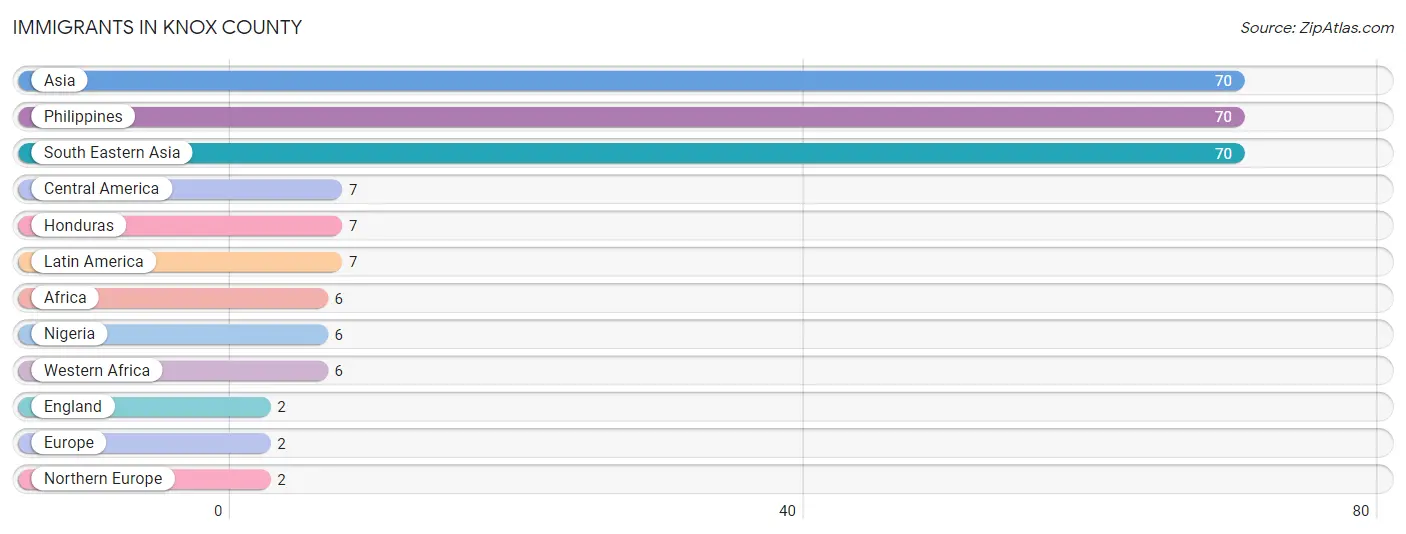
The most numerous immigrant groups reported in Knox County came from Asia (70 | 1.9%), Philippines (70 | 1.9%), South Eastern Asia (70 | 1.9%), Central America (7 | 0.2%), and Honduras (7 | 0.2%), together accounting for 6.0% of all Knox County residents.
| Immigration Origin | # Population | % Population |
| Africa | 6 | 0.2% |
| Asia | 70 | 1.9% |
| Central America | 7 | 0.2% |
| England | 2 | 0.1% |
| Europe | 2 | 0.1% |
| Honduras | 7 | 0.2% |
| Latin America | 7 | 0.2% |
| Nigeria | 6 | 0.2% |
| Northern Europe | 2 | 0.1% |
| Philippines | 70 | 1.9% |
| South Eastern Asia | 70 | 1.9% |
| Western Africa | 6 | 0.2% | View All 12 Rows |
Sex and Age in Knox County
Sex and Age in Knox County
The most populous age groups in Knox County are 60 to 64 Years (192 | 10.1%) for men and 15 to 19 Years (168 | 9.0%) for women.
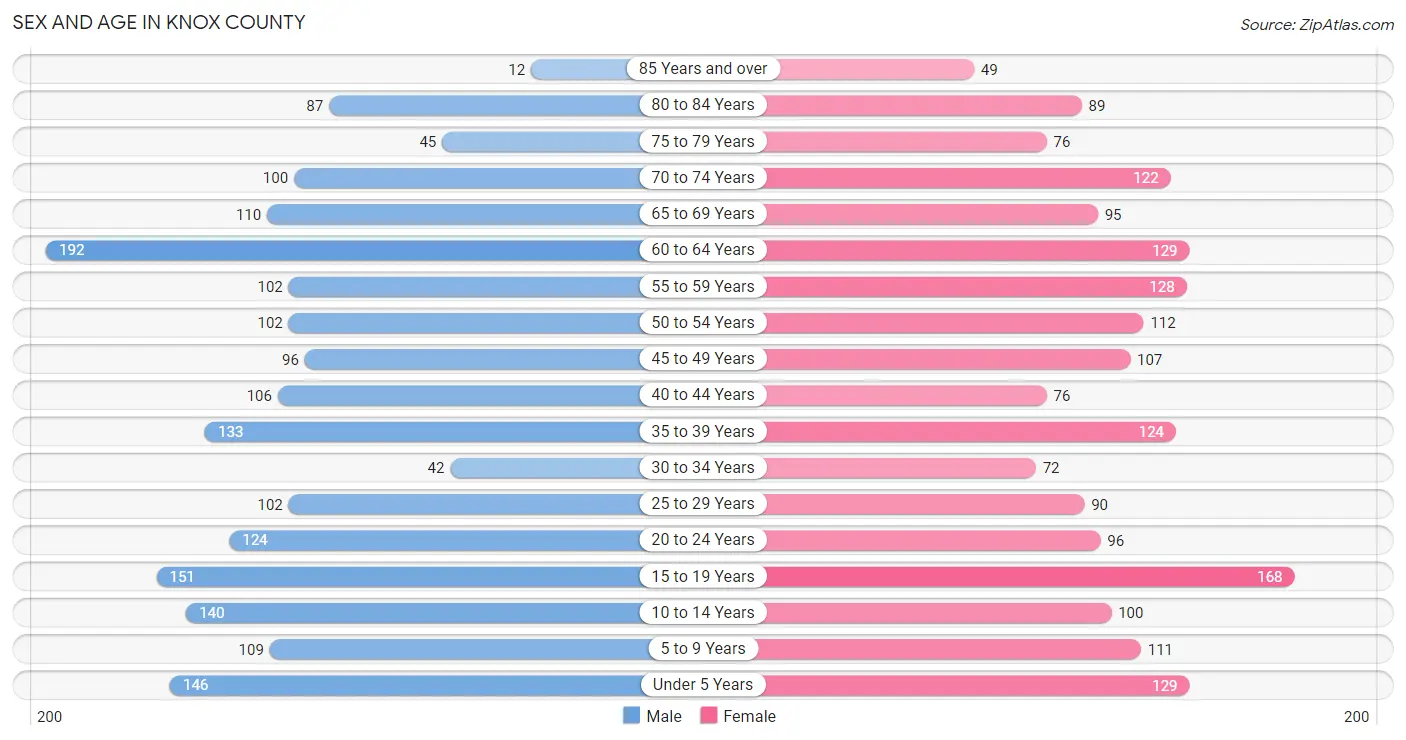
| Age Bracket | Male | Female |
| Under 5 Years | 146 (7.7%) | 129 (6.9%) |
| 5 to 9 Years | 109 (5.7%) | 111 (5.9%) |
| 10 to 14 Years | 140 (7.4%) | 100 (5.3%) |
| 15 to 19 Years | 151 (8.0%) | 168 (9.0%) |
| 20 to 24 Years | 124 (6.5%) | 96 (5.1%) |
| 25 to 29 Years | 102 (5.4%) | 90 (4.8%) |
| 30 to 34 Years | 42 (2.2%) | 72 (3.8%) |
| 35 to 39 Years | 133 (7.0%) | 124 (6.6%) |
| 40 to 44 Years | 106 (5.6%) | 76 (4.1%) |
| 45 to 49 Years | 96 (5.1%) | 107 (5.7%) |
| 50 to 54 Years | 102 (5.4%) | 112 (6.0%) |
| 55 to 59 Years | 102 (5.4%) | 128 (6.8%) |
| 60 to 64 Years | 192 (10.1%) | 129 (6.9%) |
| 65 to 69 Years | 110 (5.8%) | 95 (5.1%) |
| 70 to 74 Years | 100 (5.3%) | 122 (6.5%) |
| 75 to 79 Years | 45 (2.4%) | 76 (4.1%) |
| 80 to 84 Years | 87 (4.6%) | 89 (4.8%) |
| 85 Years and over | 12 (0.6%) | 49 (2.6%) |
| Total | 1,899 (100.0%) | 1,873 (100.0%) |
Families and Households in Knox County
Median Family Size in Knox County
The median family size in Knox County is 4.37 persons per family, with single female/mother families (62 | 8.7%) accounting for the largest median family size of 5.03 persons per family. On the other hand, married-couple families (626 | 87.7%) represent the smallest median family size with 4.31 persons per family.
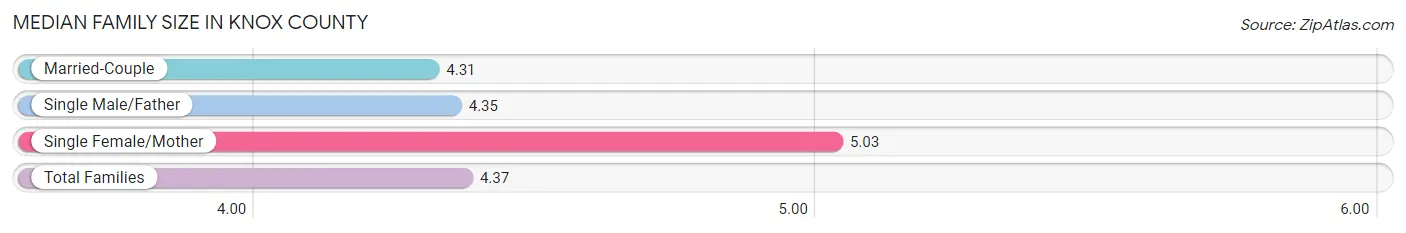
| Family Type | # Families | Family Size |
| Married-Couple | 626 (87.7%) | 4.31 |
| Single Male/Father | 26 (3.6%) | 4.35 |
| Single Female/Mother | 62 (8.7%) | 5.03 |
| Total Families | 714 (100.0%) | 4.37 |
Median Household Size in Knox County
The median household size in Knox County is 3.17 persons per household, with single female/mother households (62 | 5.4%) accounting for the largest median household size of 5.45 persons per household. non-family households (440 | 38.1%) represent the smallest median household size with 1.12 persons per household.
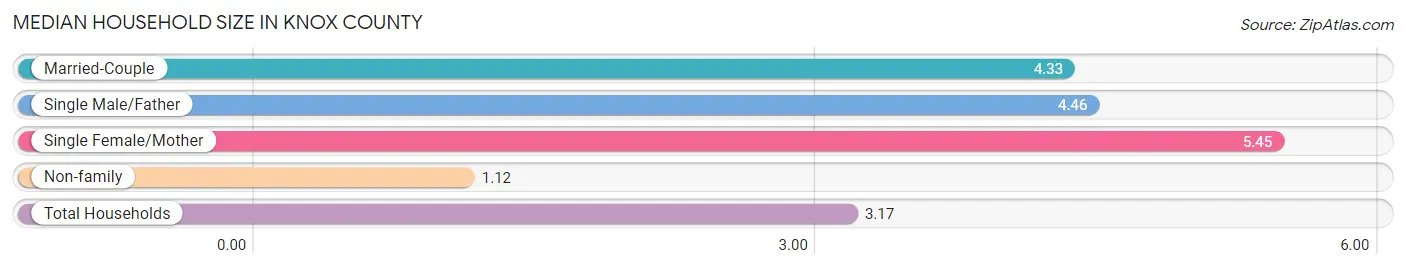
| Household Type | # Households | Household Size |
| Married-Couple | 626 (54.2%) | 4.33 |
| Single Male/Father | 26 (2.2%) | 4.46 |
| Single Female/Mother | 62 (5.4%) | 5.45 |
| Non-family | 440 (38.1%) | 1.12 |
| Total Households | 1,154 (100.0%) | 3.17 |
Household Size by Marriage Status in Knox County
Out of a total of 1,154 households in Knox County, 714 (61.9%) are family households, while 440 (38.1%) are nonfamily households. The most numerous type of family households are 2-person households, comprising 404, and the most common type of nonfamily households are 1-person households, comprising 403.
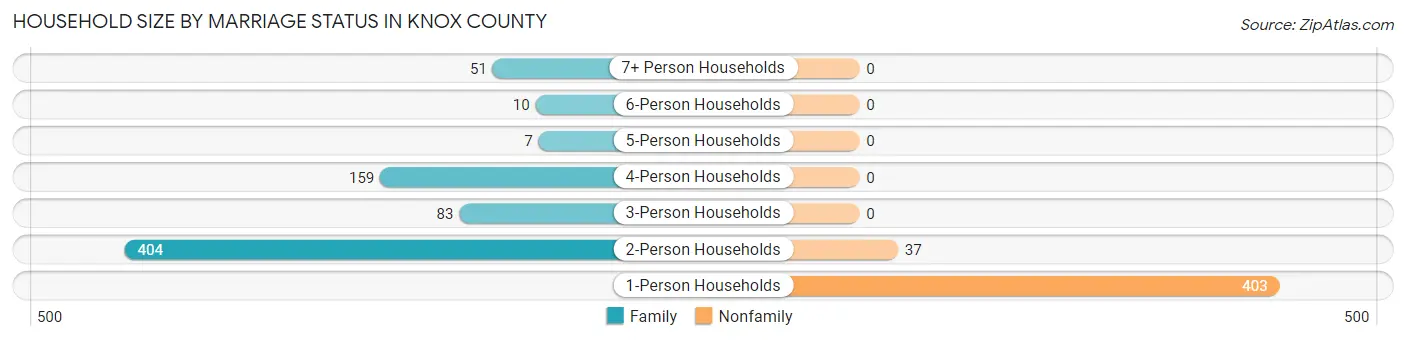
| Household Size | Family Households | Nonfamily Households |
| 1-Person Households | - | 403 (34.9%) |
| 2-Person Households | 404 (35.0%) | 37 (3.2%) |
| 3-Person Households | 83 (7.2%) | 0 (0.0%) |
| 4-Person Households | 159 (13.8%) | 0 (0.0%) |
| 5-Person Households | 7 (0.6%) | 0 (0.0%) |
| 6-Person Households | 10 (0.9%) | 0 (0.0%) |
| 7+ Person Households | 51 (4.4%) | 0 (0.0%) |
| Total | 714 (61.9%) | 440 (38.1%) |
Female Fertility in Knox County
Fertility by Age in Knox County
Average fertility rate in Knox County is 28.0 births per 1,000 women. Women in the age bracket of 20 to 34 years have the highest fertility rate with 58.0 births per 1,000 women. Women in the age bracket of 20 to 34 years acount for 71.4% of all women with births.
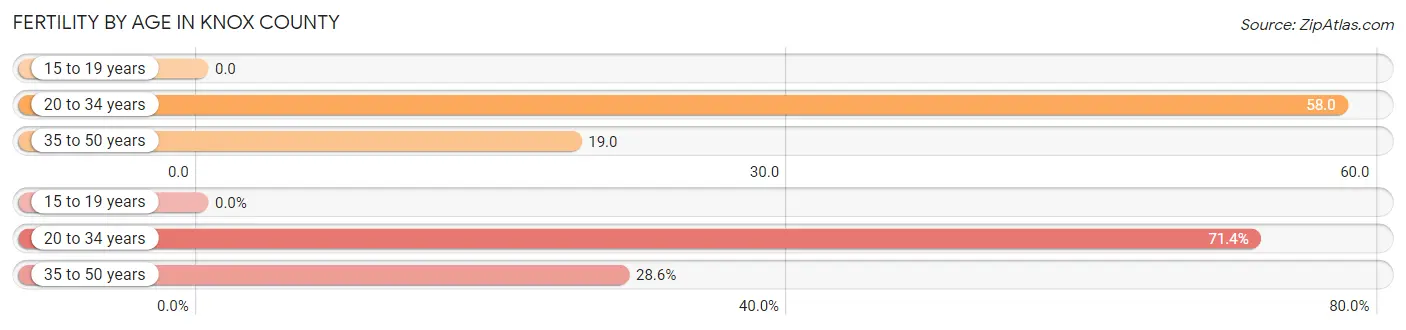
| Age Bracket | Women with Births | Births / 1,000 Women |
| 15 to 19 years | 0 (0.0%) | 0.0 |
| 20 to 34 years | 15 (71.4%) | 58.0 |
| 35 to 50 years | 6 (28.6%) | 19.0 |
| Total | 21 (100.0%) | 28.0 |
Fertility by Age by Marriage Status in Knox County
66.7% of women with births (21) in Knox County are married. The highest percentage of unmarried women with births falls into 20 to 34 years age bracket with 46.7% of them unmarried at the time of birth, while the lowest percentage of unmarried women with births belong to 35 to 50 years age bracket with 0.0% of them unmarried.
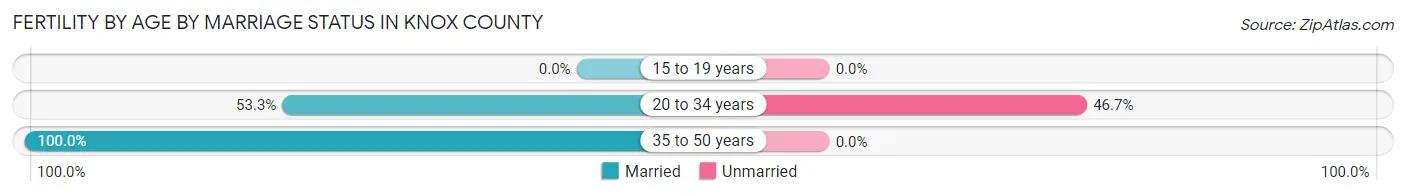
| Age Bracket | Married | Unmarried |
| 15 to 19 years | 0 (0.0%) | 0 (0.0%) |
| 20 to 34 years | 8 (53.3%) | 7 (46.7%) |
| 35 to 50 years | 6 (100.0%) | 0 (0.0%) |
| Total | 14 (66.7%) | 7 (33.3%) |
Fertility by Education in Knox County
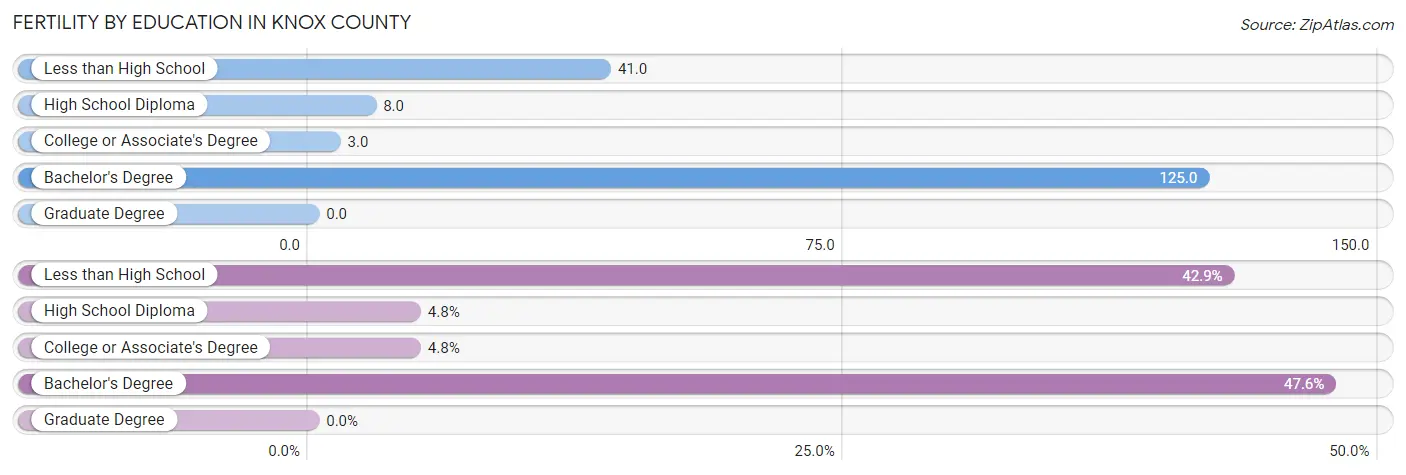
| Educational Attainment | Women with Births | Births / 1,000 Women |
| Less than High School | 9 (42.9%) | 41.0 |
| High School Diploma | 1 (4.8%) | 8.0 |
| College or Associate's Degree | 1 (4.8%) | 3.0 |
| Bachelor's Degree | 10 (47.6%) | 125.0 |
| Graduate Degree | 0 (0.0%) | 0.0 |
| Total | 21 (100.0%) | 28.0 |
Fertility by Education by Marriage Status in Knox County
33.3% of women with births in Knox County are unmarried. Women with the educational attainment of less than high school are most likely to be married with 100.0% of them married at childbirth, while women with the educational attainment of bachelor's degree are least likely to be married with 70.0% of them unmarried at childbirth.
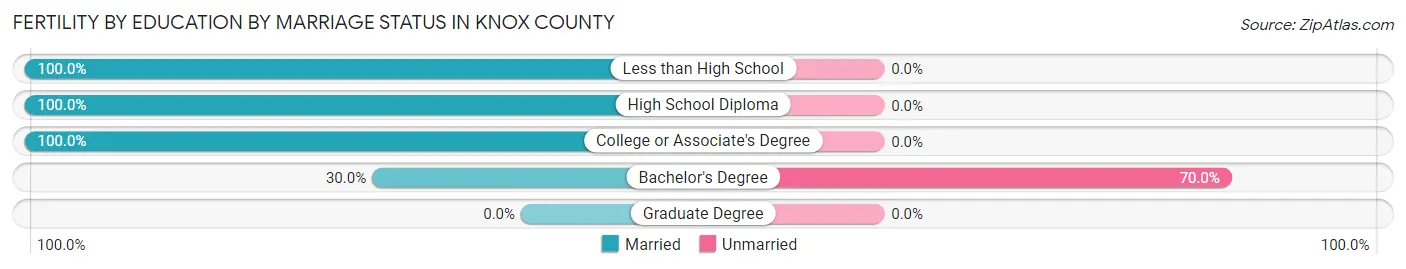
| Educational Attainment | Married | Unmarried |
| Less than High School | 9 (100.0%) | 0 (0.0%) |
| High School Diploma | 1 (100.0%) | 0 (0.0%) |
| College or Associate's Degree | 1 (100.0%) | 0 (0.0%) |
| Bachelor's Degree | 3 (30.0%) | 7 (70.0%) |
| Graduate Degree | 0 (0.0%) | 0 (0.0%) |
| Total | 14 (66.7%) | 7 (33.3%) |
Employment Characteristics in Knox County
Employment by Class of Employer in Knox County
Among the 1,630 employed individuals in Knox County, private company employees (978 | 60.0%), self-employed (not incorporated) (217 | 13.3%), and local government employees (117 | 7.2%) make up the most common classes of employment.
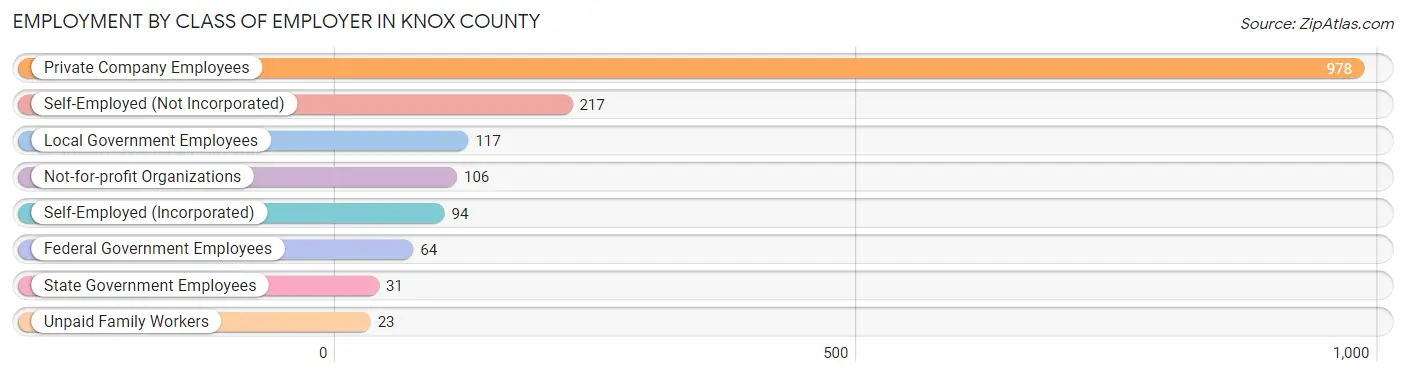
| Employer Class | # Employees | % Employees |
| Private Company Employees | 978 | 60.0% |
| Self-Employed (Incorporated) | 94 | 5.8% |
| Self-Employed (Not Incorporated) | 217 | 13.3% |
| Not-for-profit Organizations | 106 | 6.5% |
| Local Government Employees | 117 | 7.2% |
| State Government Employees | 31 | 1.9% |
| Federal Government Employees | 64 | 3.9% |
| Unpaid Family Workers | 23 | 1.4% |
| Total | 1,630 | 100.0% |
Employment Status by Age in Knox County
According to the labor force statistics for Knox County, out of the total population over 16 years of age (3,009), 55.6% or 1,673 individuals are in the labor force, with 2.1% or 35 of them unemployed. The age group with the highest labor force participation rate is 35 to 44 years, with 92.9% or 408 individuals in the labor force. Within the labor force, the 30 to 34 years age range has the highest percentage of unemployed individuals, with 17.9% or 17 of them being unemployed.
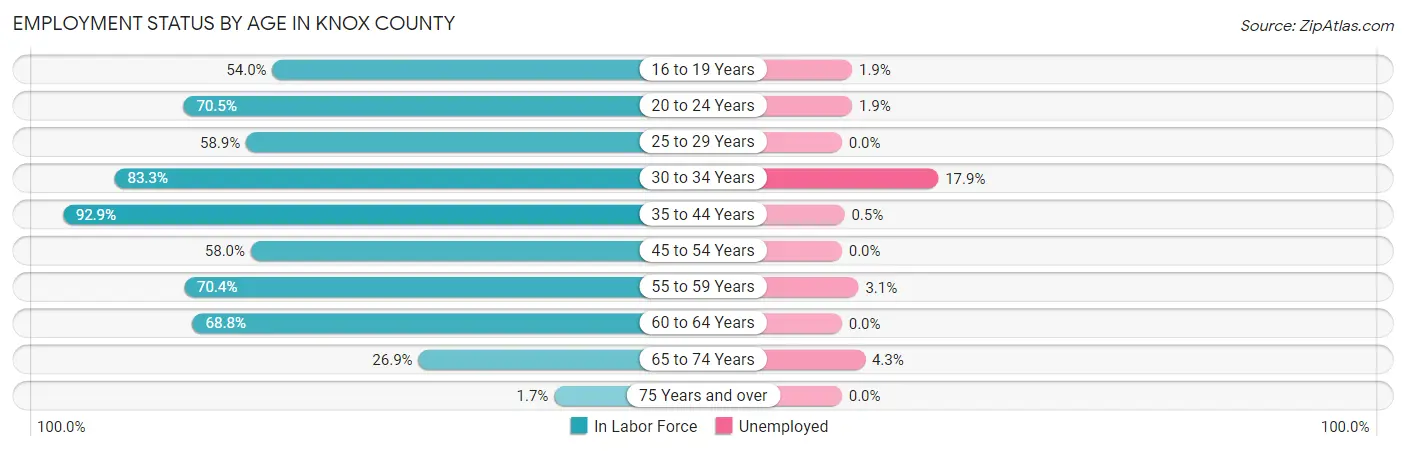
| Age Bracket | In Labor Force | Unemployed |
| 16 to 19 Years | 157 (54.0%) | 3 (1.9%) |
| 20 to 24 Years | 155 (70.5%) | 3 (1.9%) |
| 25 to 29 Years | 113 (58.9%) | 0 (0.0%) |
| 30 to 34 Years | 95 (83.3%) | 17 (17.9%) |
| 35 to 44 Years | 408 (92.9%) | 2 (0.5%) |
| 45 to 54 Years | 242 (58.0%) | 0 (0.0%) |
| 55 to 59 Years | 162 (70.4%) | 5 (3.1%) |
| 60 to 64 Years | 221 (68.8%) | 0 (0.0%) |
| 65 to 74 Years | 115 (26.9%) | 5 (4.3%) |
| 75 Years and over | 6 (1.7%) | 0 (0.0%) |
| Total | 1,673 (55.6%) | 35 (2.1%) |
Employment Status by Educational Attainment in Knox County
According to labor force statistics for Knox County, 72.4% of individuals (1,240) out of the total population between 25 and 64 years of age (1,713) are in the labor force, with 1.9% or 24 of them being unemployed. The group with the highest labor force participation rate are those with the educational attainment of college / associate degree, with 91.5% or 472 individuals in the labor force. Within the labor force, individuals with college / associate degree education have the highest percentage of unemployment, with 3.6% or 17 of them being unemployed.
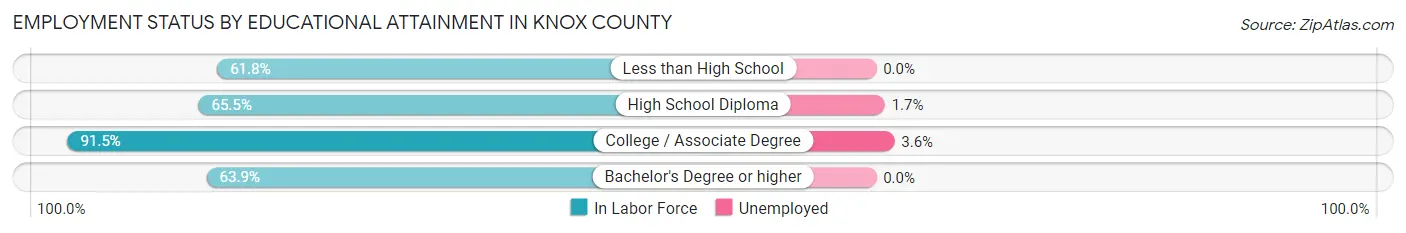
| Educational Attainment | In Labor Force | Unemployed |
| Less than High School | 175 (61.8%) | 0 (0.0%) |
| High School Diploma | 417 (65.5%) | 11 (1.7%) |
| College / Associate Degree | 472 (91.5%) | 19 (3.6%) |
| Bachelor's Degree or higher | 177 (63.9%) | 0 (0.0%) |
| Total | 1,240 (72.4%) | 33 (1.9%) |
Employment Occupations by Sex in Knox County
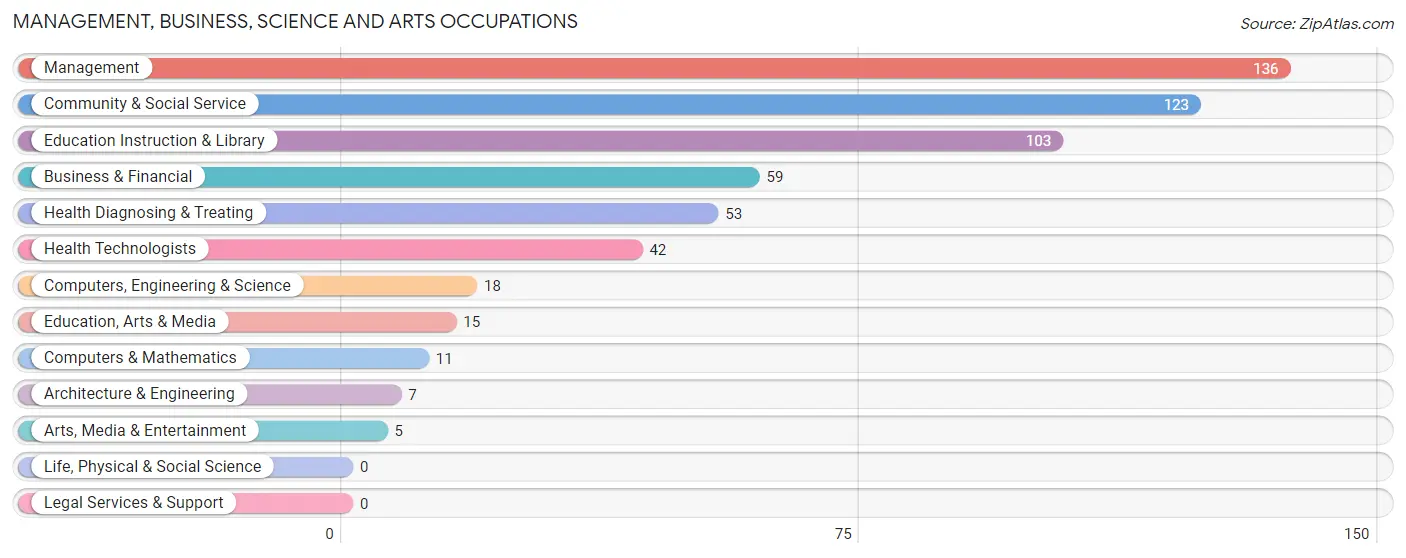
Management, Business, Science and Arts Occupations
The most common Management, Business, Science and Arts occupations in Knox County are Management (136 | 8.3%), Community & Social Service (123 | 7.5%), Education Instruction & Library (103 | 6.3%), Business & Financial (59 | 3.6%), and Health Diagnosing & Treating (53 | 3.2%).
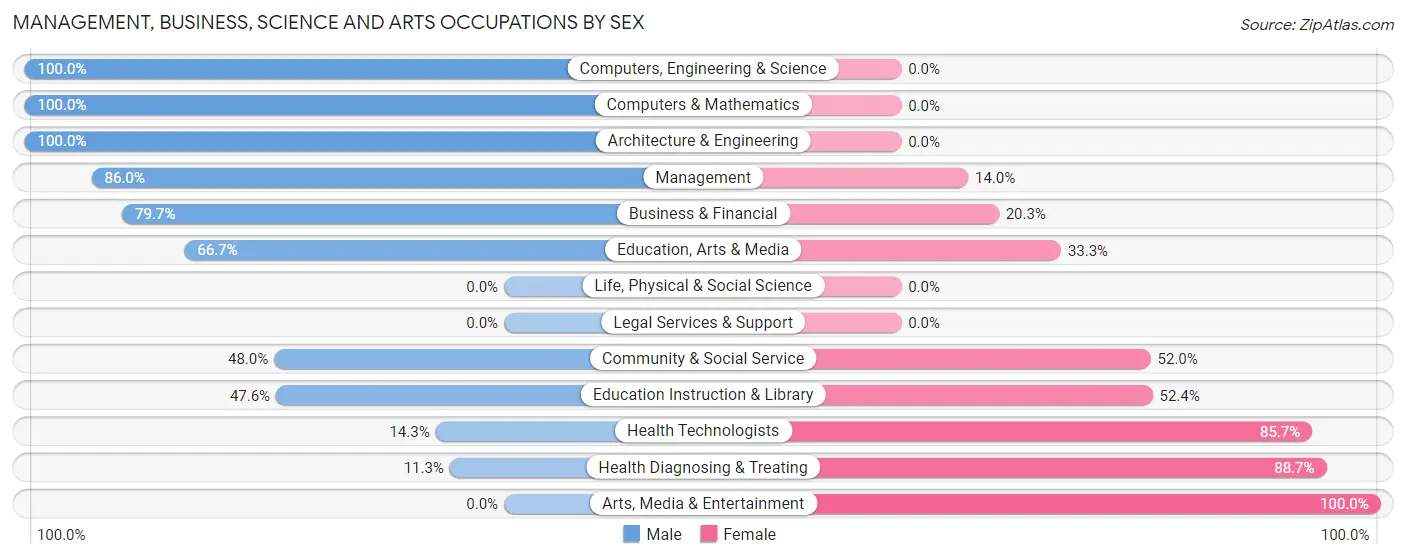
Management, Business, Science and Arts Occupations by Sex
Within the Management, Business, Science and Arts occupations in Knox County, the most male-oriented occupations are Computers, Engineering & Science (100.0%), Computers & Mathematics (100.0%), and Architecture & Engineering (100.0%), while the most female-oriented occupations are Arts, Media & Entertainment (100.0%), Health Diagnosing & Treating (88.7%), and Health Technologists (85.7%).
| Occupation | Male | Female |
| Management | 117 (86.0%) | 19 (14.0%) |
| Business & Financial | 47 (79.7%) | 12 (20.3%) |
| Computers, Engineering & Science | 18 (100.0%) | 0 (0.0%) |
| Computers & Mathematics | 11 (100.0%) | 0 (0.0%) |
| Architecture & Engineering | 7 (100.0%) | 0 (0.0%) |
| Life, Physical & Social Science | 0 (0.0%) | 0 (0.0%) |
| Community & Social Service | 59 (48.0%) | 64 (52.0%) |
| Education, Arts & Media | 10 (66.7%) | 5 (33.3%) |
| Legal Services & Support | 0 (0.0%) | 0 (0.0%) |
| Education Instruction & Library | 49 (47.6%) | 54 (52.4%) |
| Arts, Media & Entertainment | 0 (0.0%) | 5 (100.0%) |
| Health Diagnosing & Treating | 6 (11.3%) | 47 (88.7%) |
| Health Technologists | 6 (14.3%) | 36 (85.7%) |
| Total (Category) | 247 (63.5%) | 142 (36.5%) |
| Total (Overall) | 935 (57.1%) | 704 (42.9%) |
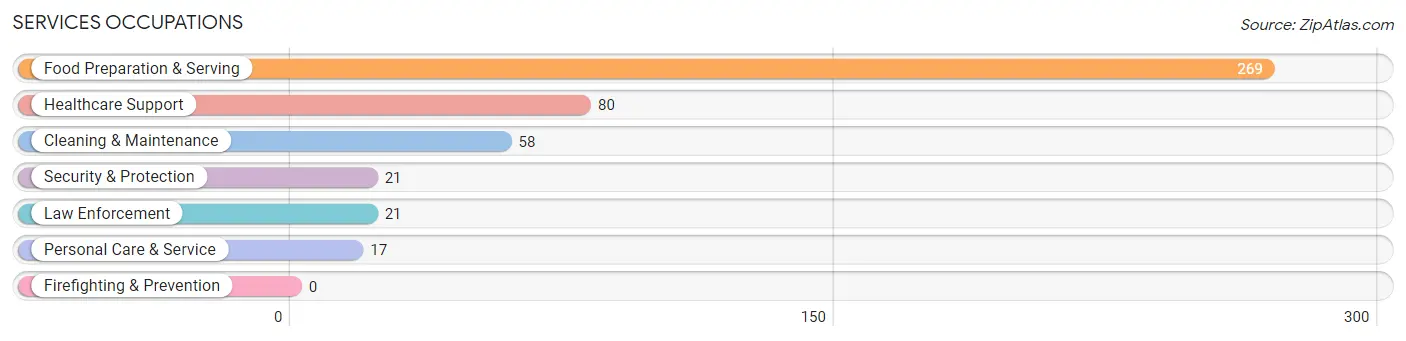
Services Occupations
The most common Services occupations in Knox County are Food Preparation & Serving (269 | 16.4%), Healthcare Support (80 | 4.9%), Cleaning & Maintenance (58 | 3.5%), Security & Protection (21 | 1.3%), and Law Enforcement (21 | 1.3%).
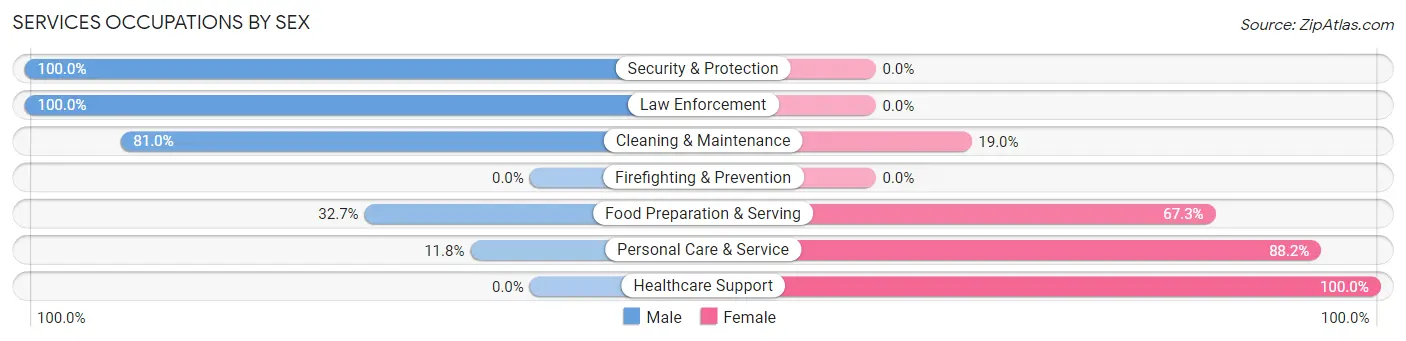
Services Occupations by Sex
Within the Services occupations in Knox County, the most male-oriented occupations are Security & Protection (100.0%), Law Enforcement (100.0%), and Cleaning & Maintenance (81.0%), while the most female-oriented occupations are Healthcare Support (100.0%), Personal Care & Service (88.2%), and Food Preparation & Serving (67.3%).
| Occupation | Male | Female |
| Healthcare Support | 0 (0.0%) | 80 (100.0%) |
| Security & Protection | 21 (100.0%) | 0 (0.0%) |
| Firefighting & Prevention | 0 (0.0%) | 0 (0.0%) |
| Law Enforcement | 21 (100.0%) | 0 (0.0%) |
| Food Preparation & Serving | 88 (32.7%) | 181 (67.3%) |
| Cleaning & Maintenance | 47 (81.0%) | 11 (19.0%) |
| Personal Care & Service | 2 (11.8%) | 15 (88.2%) |
| Total (Category) | 158 (35.5%) | 287 (64.5%) |
| Total (Overall) | 935 (57.1%) | 704 (42.9%) |
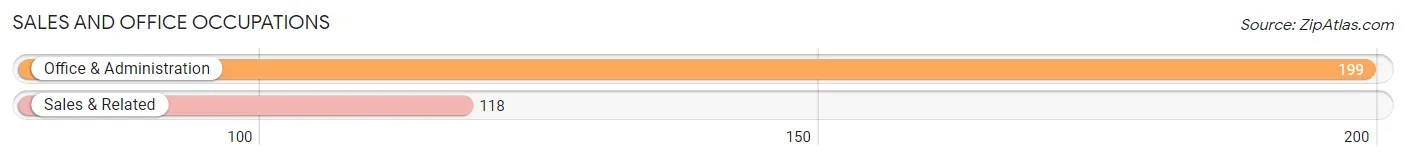
Sales and Office Occupations
The most common Sales and Office occupations in Knox County are Office & Administration (199 | 12.1%), and Sales & Related (118 | 7.2%).
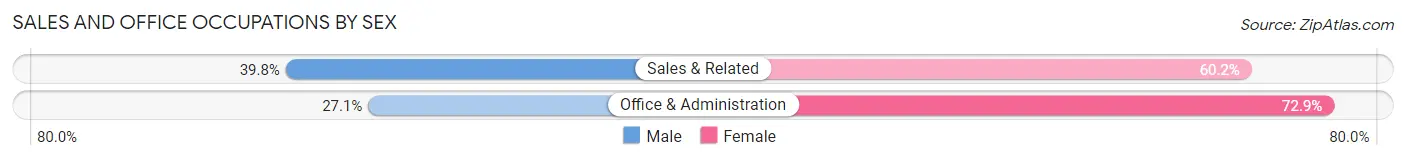
Sales and Office Occupations by Sex
| Occupation | Male | Female |
| Sales & Related | 47 (39.8%) | 71 (60.2%) |
| Office & Administration | 54 (27.1%) | 145 (72.9%) |
| Total (Category) | 101 (31.9%) | 216 (68.1%) |
| Total (Overall) | 935 (57.1%) | 704 (42.9%) |
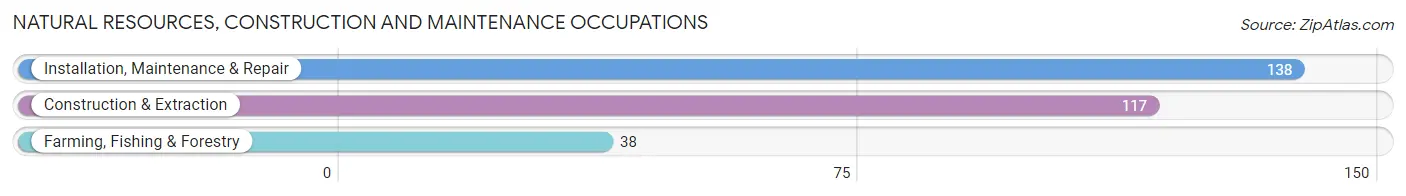
Natural Resources, Construction and Maintenance Occupations
The most common Natural Resources, Construction and Maintenance occupations in Knox County are Installation, Maintenance & Repair (138 | 8.4%), Construction & Extraction (117 | 7.1%), and Farming, Fishing & Forestry (38 | 2.3%).
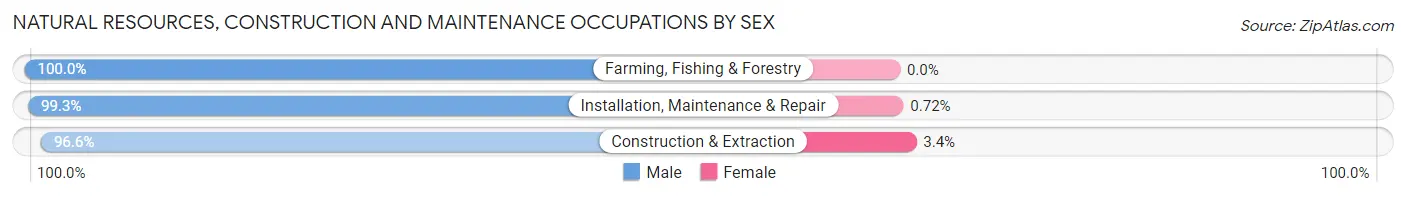
Natural Resources, Construction and Maintenance Occupations by Sex
| Occupation | Male | Female |
| Farming, Fishing & Forestry | 38 (100.0%) | 0 (0.0%) |
| Construction & Extraction | 113 (96.6%) | 4 (3.4%) |
| Installation, Maintenance & Repair | 137 (99.3%) | 1 (0.7%) |
| Total (Category) | 288 (98.3%) | 5 (1.7%) |
| Total (Overall) | 935 (57.1%) | 704 (42.9%) |
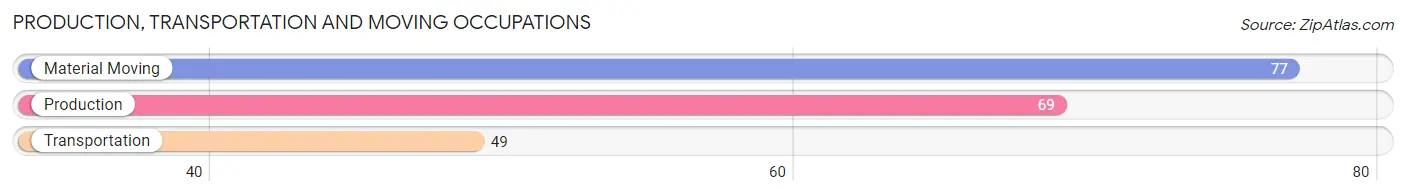
Production, Transportation and Moving Occupations
The most common Production, Transportation and Moving occupations in Knox County are Material Moving (77 | 4.7%), Production (69 | 4.2%), and Transportation (49 | 3.0%).
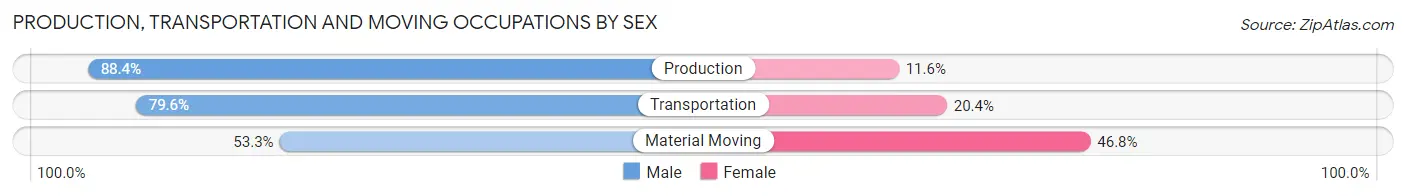
Production, Transportation and Moving Occupations by Sex
| Occupation | Male | Female |
| Production | 61 (88.4%) | 8 (11.6%) |
| Transportation | 39 (79.6%) | 10 (20.4%) |
| Material Moving | 41 (53.2%) | 36 (46.8%) |
| Total (Category) | 141 (72.3%) | 54 (27.7%) |
| Total (Overall) | 935 (57.1%) | 704 (42.9%) |
Employment Industries by Sex in Knox County
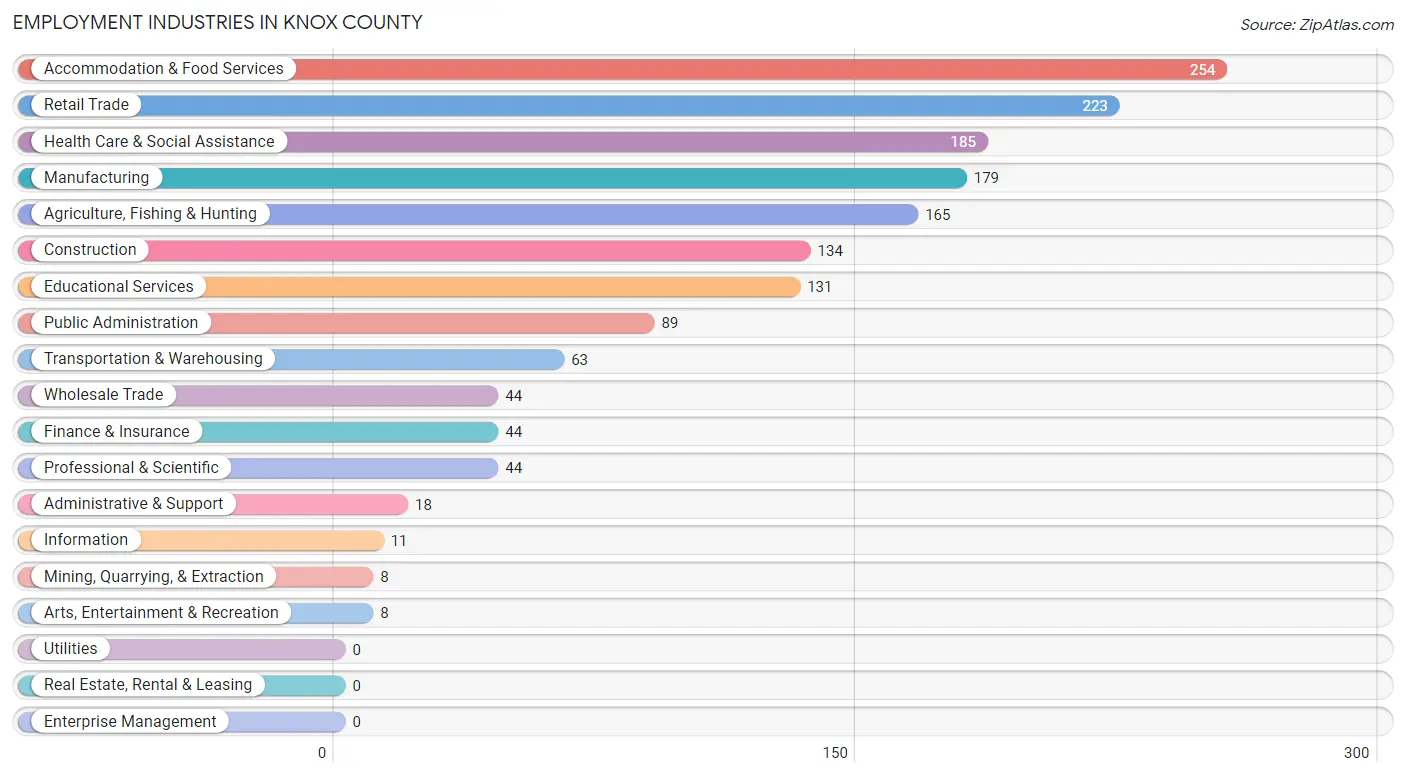
Employment Industries in Knox County
The major employment industries in Knox County include Accommodation & Food Services (254 | 15.5%), Retail Trade (223 | 13.6%), Health Care & Social Assistance (185 | 11.3%), Manufacturing (179 | 10.9%), and Agriculture, Fishing & Hunting (165 | 10.1%).
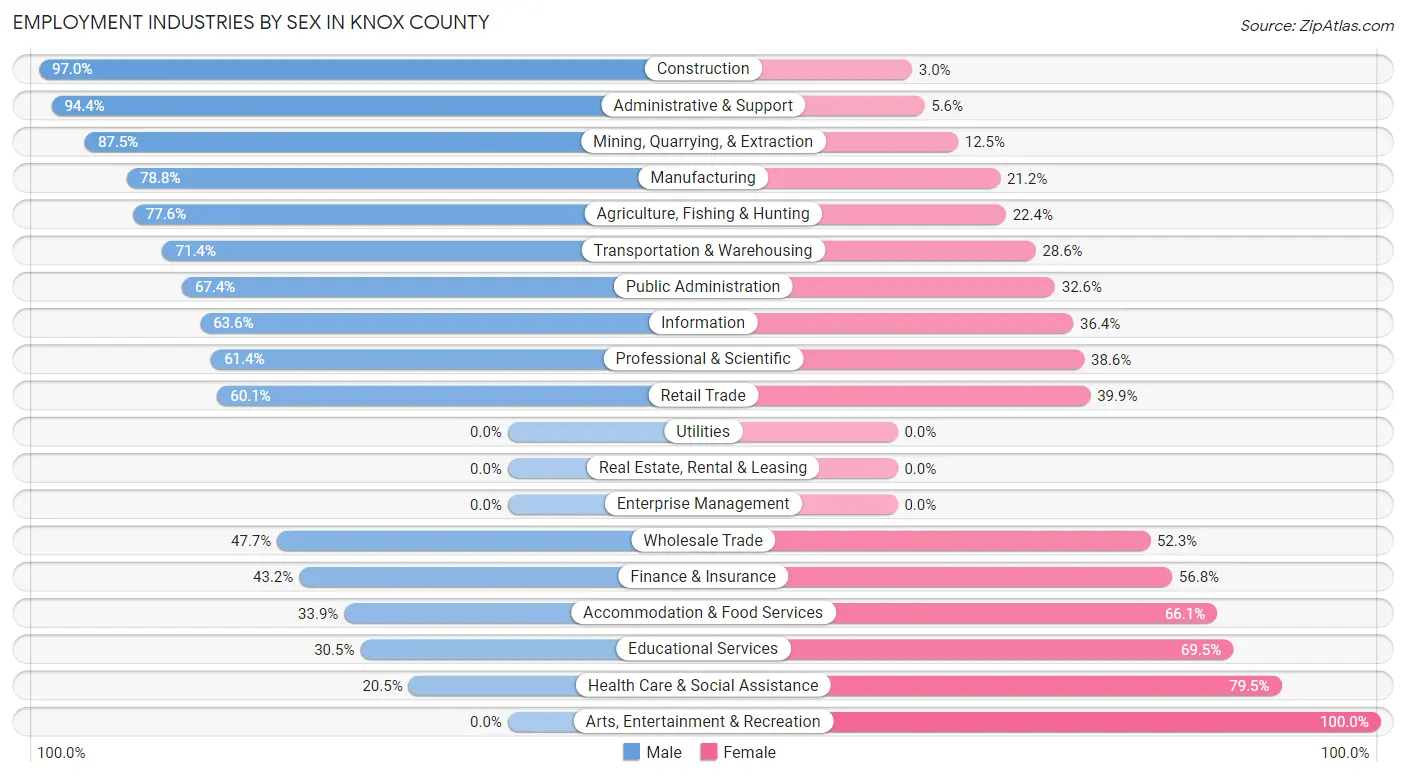
Employment Industries by Sex in Knox County
The Knox County industries that see more men than women are Construction (97.0%), Administrative & Support (94.4%), and Mining, Quarrying, & Extraction (87.5%), whereas the industries that tend to have a higher number of women are Arts, Entertainment & Recreation (100.0%), Health Care & Social Assistance (79.5%), and Educational Services (69.5%).
| Industry | Male | Female |
| Agriculture, Fishing & Hunting | 128 (77.6%) | 37 (22.4%) |
| Mining, Quarrying, & Extraction | 7 (87.5%) | 1 (12.5%) |
| Construction | 130 (97.0%) | 4 (3.0%) |
| Manufacturing | 141 (78.8%) | 38 (21.2%) |
| Wholesale Trade | 21 (47.7%) | 23 (52.3%) |
| Retail Trade | 134 (60.1%) | 89 (39.9%) |
| Transportation & Warehousing | 45 (71.4%) | 18 (28.6%) |
| Utilities | 0 (0.0%) | 0 (0.0%) |
| Information | 7 (63.6%) | 4 (36.4%) |
| Finance & Insurance | 19 (43.2%) | 25 (56.8%) |
| Real Estate, Rental & Leasing | 0 (0.0%) | 0 (0.0%) |
| Professional & Scientific | 27 (61.4%) | 17 (38.6%) |
| Enterprise Management | 0 (0.0%) | 0 (0.0%) |
| Administrative & Support | 17 (94.4%) | 1 (5.6%) |
| Educational Services | 40 (30.5%) | 91 (69.5%) |
| Health Care & Social Assistance | 38 (20.5%) | 147 (79.5%) |
| Arts, Entertainment & Recreation | 0 (0.0%) | 8 (100.0%) |
| Accommodation & Food Services | 86 (33.9%) | 168 (66.1%) |
| Public Administration | 60 (67.4%) | 29 (32.6%) |
| Total | 935 (57.1%) | 704 (42.9%) |
Education in Knox County
School Enrollment in Knox County
The most common levels of schooling among the 670 students in Knox County are middle school (183 | 27.3%), elementary school (160 | 23.9%), and high school (157 | 23.4%).
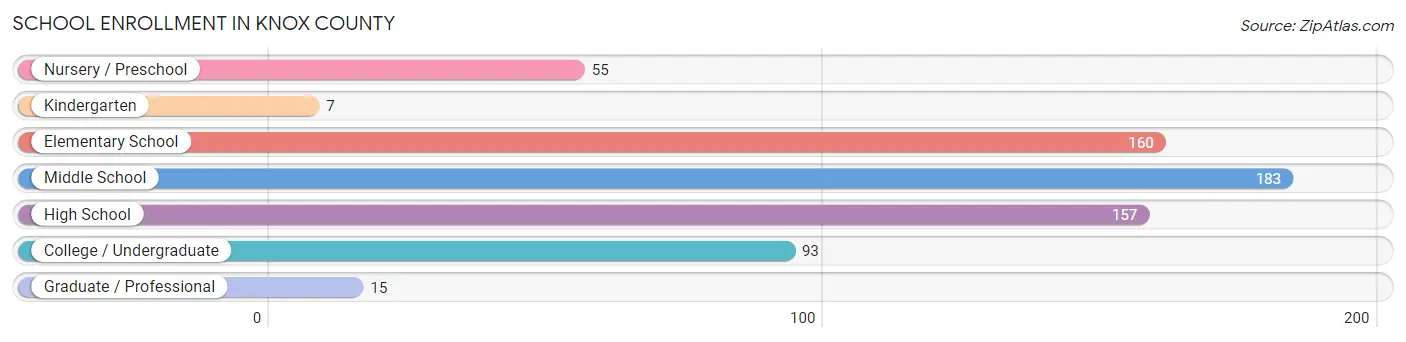
| School Level | # Students | % Students |
| Nursery / Preschool | 55 | 8.2% |
| Kindergarten | 7 | 1.0% |
| Elementary School | 160 | 23.9% |
| Middle School | 183 | 27.3% |
| High School | 157 | 23.4% |
| College / Undergraduate | 93 | 13.9% |
| Graduate / Professional | 15 | 2.2% |
| Total | 670 | 100.0% |
School Enrollment by Age by Funding Source in Knox County
Out of a total of 670 students who are enrolled in schools in Knox County, 201 (30.0%) attend a private institution, while the remaining 469 (70.0%) are enrolled in public schools. The age group of 35 years and over has the highest likelihood of being enrolled in private schools, with 15 (62.5% in the age bracket) enrolled. Conversely, the age group of 15 to 17 year olds has the lowest likelihood of being enrolled in a private school, with 105 (95.5% in the age bracket) attending a public institution.
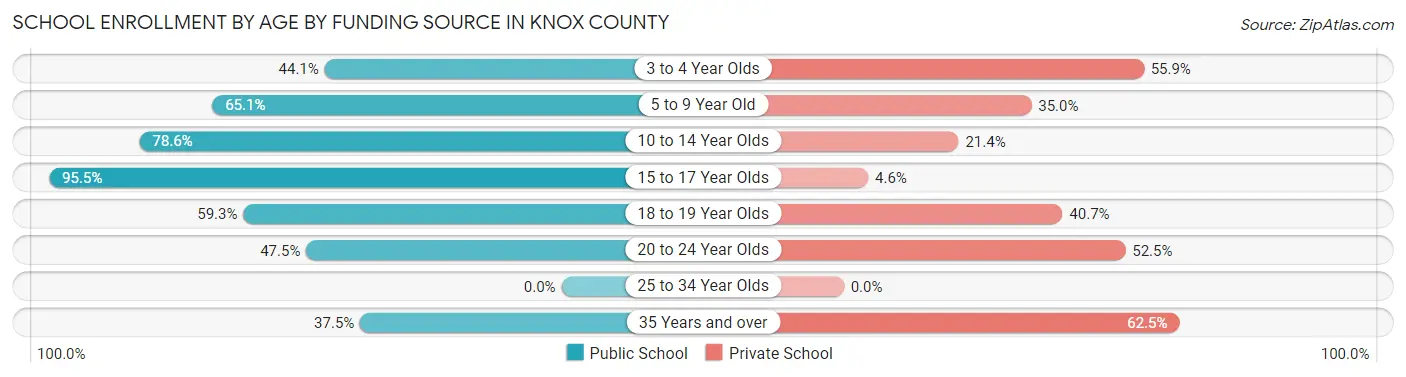
| Age Bracket | Public School | Private School |
| 3 to 4 Year Olds | 15 (44.1%) | 19 (55.9%) |
| 5 to 9 Year Old | 121 (65.0%) | 65 (34.9%) |
| 10 to 14 Year Olds | 158 (78.6%) | 43 (21.4%) |
| 15 to 17 Year Olds | 105 (95.5%) | 5 (4.5%) |
| 18 to 19 Year Olds | 32 (59.3%) | 22 (40.7%) |
| 20 to 24 Year Olds | 29 (47.5%) | 32 (52.5%) |
| 25 to 34 Year Olds | 0 (0.0%) | 0 (0.0%) |
| 35 Years and over | 9 (37.5%) | 15 (62.5%) |
| Total | 469 (70.0%) | 201 (30.0%) |
Educational Attainment by Field of Study in Knox County
Education (122 | 28.8%), arts & humanities (61 | 14.4%), business (57 | 13.5%), social sciences (29 | 6.9%), and liberal arts & history (28 | 6.6%) are the most common fields of study among 423 individuals in Knox County who have obtained a bachelor's degree or higher.
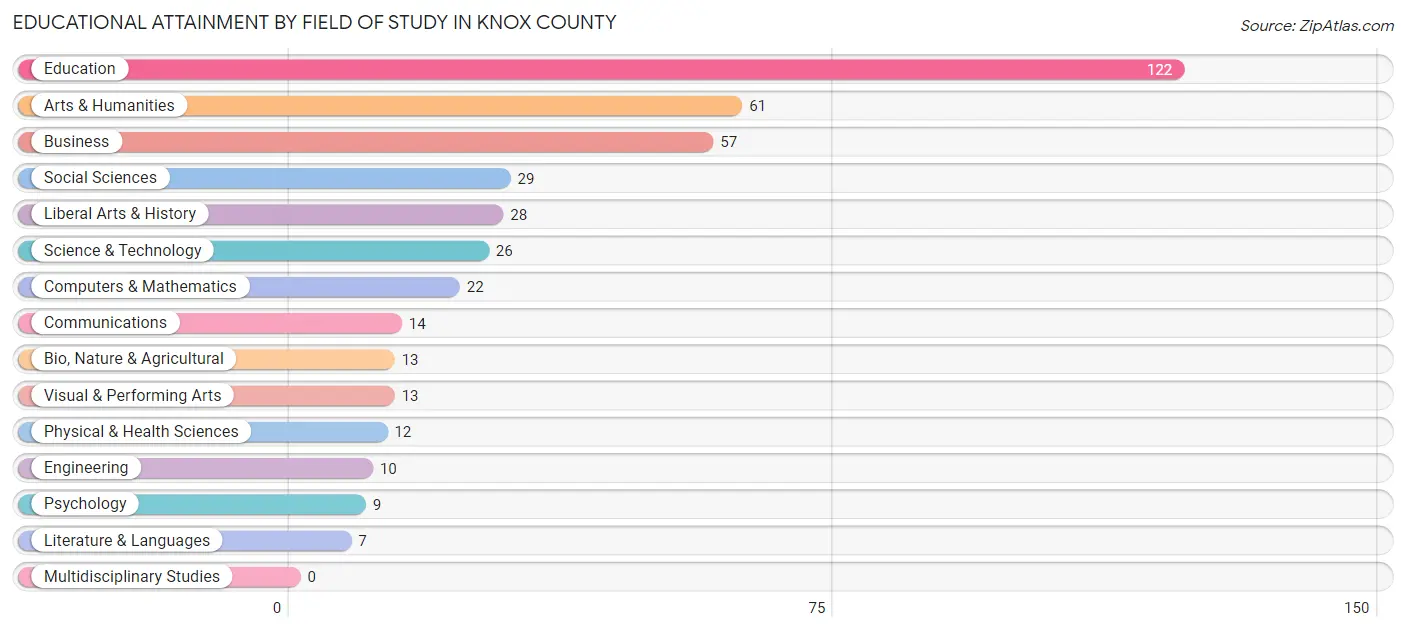
| Field of Study | # Graduates | % Graduates |
| Computers & Mathematics | 22 | 5.2% |
| Bio, Nature & Agricultural | 13 | 3.1% |
| Physical & Health Sciences | 12 | 2.8% |
| Psychology | 9 | 2.1% |
| Social Sciences | 29 | 6.9% |
| Engineering | 10 | 2.4% |
| Multidisciplinary Studies | 0 | 0.0% |
| Science & Technology | 26 | 6.1% |
| Business | 57 | 13.5% |
| Education | 122 | 28.8% |
| Literature & Languages | 7 | 1.7% |
| Liberal Arts & History | 28 | 6.6% |
| Visual & Performing Arts | 13 | 3.1% |
| Communications | 14 | 3.3% |
| Arts & Humanities | 61 | 14.4% |
| Total | 423 | 100.0% |
Transportation & Commute in Knox County
Vehicle Availability by Sex in Knox County
The most prevalent vehicle ownership categories in Knox County are males with 2 vehicles (373, accounting for 40.5%) and females with 2 vehicles (221, making up 53.4%).
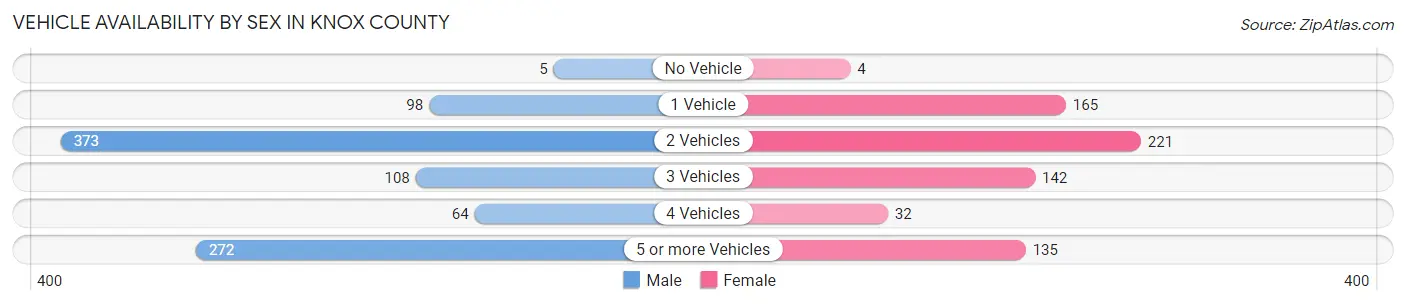
| Vehicles Available | Male | Female |
| No Vehicle | 5 (0.5%) | 4 (0.6%) |
| 1 Vehicle | 98 (10.6%) | 165 (23.6%) |
| 2 Vehicles | 373 (40.5%) | 221 (31.6%) |
| 3 Vehicles | 108 (11.7%) | 142 (20.3%) |
| 4 Vehicles | 64 (7.0%) | 32 (4.6%) |
| 5 or more Vehicles | 272 (29.6%) | 135 (19.3%) |
| Total | 920 (100.0%) | 699 (100.0%) |
Commute Time in Knox County
The most frequently occuring commute durations in Knox County are 10 to 14 minutes (258 commuters, 19.8%), 5 to 9 minutes (176 commuters, 13.5%), and 30 to 34 minutes (175 commuters, 13.4%).
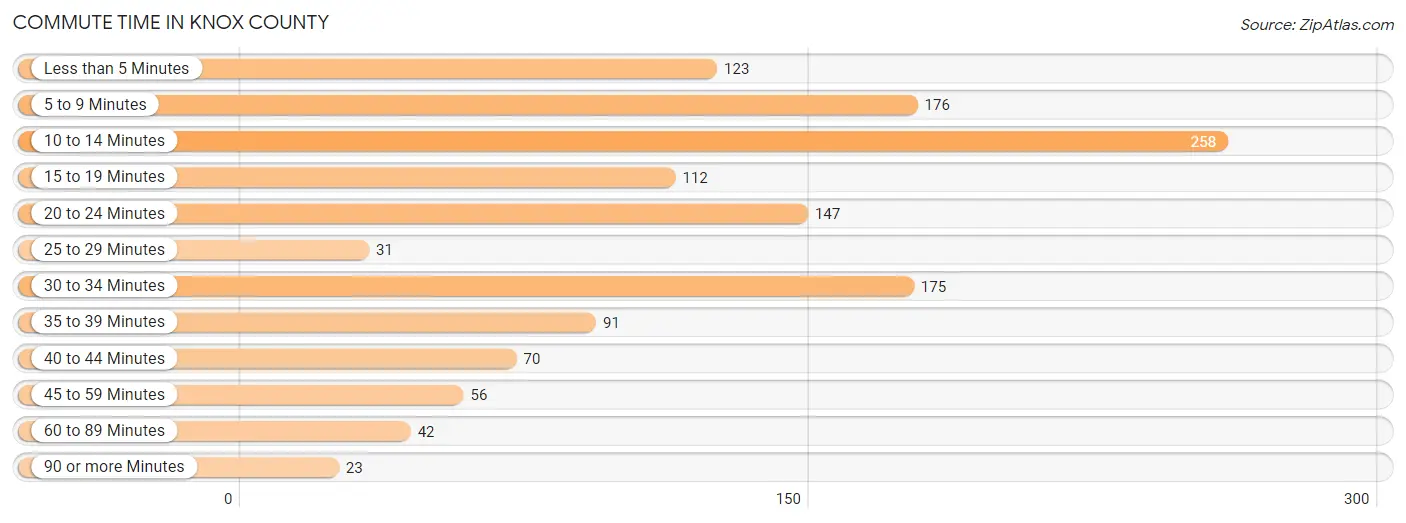
| Commute Time | # Commuters | % Commuters |
| Less than 5 Minutes | 123 | 9.4% |
| 5 to 9 Minutes | 176 | 13.5% |
| 10 to 14 Minutes | 258 | 19.8% |
| 15 to 19 Minutes | 112 | 8.6% |
| 20 to 24 Minutes | 147 | 11.3% |
| 25 to 29 Minutes | 31 | 2.4% |
| 30 to 34 Minutes | 175 | 13.4% |
| 35 to 39 Minutes | 91 | 7.0% |
| 40 to 44 Minutes | 70 | 5.4% |
| 45 to 59 Minutes | 56 | 4.3% |
| 60 to 89 Minutes | 42 | 3.2% |
| 90 or more Minutes | 23 | 1.8% |
Commute Time by Sex in Knox County
The most common commute times in Knox County are 10 to 14 minutes (116 commuters, 17.5%) for males and 10 to 14 minutes (142 commuters, 22.2%) for females.
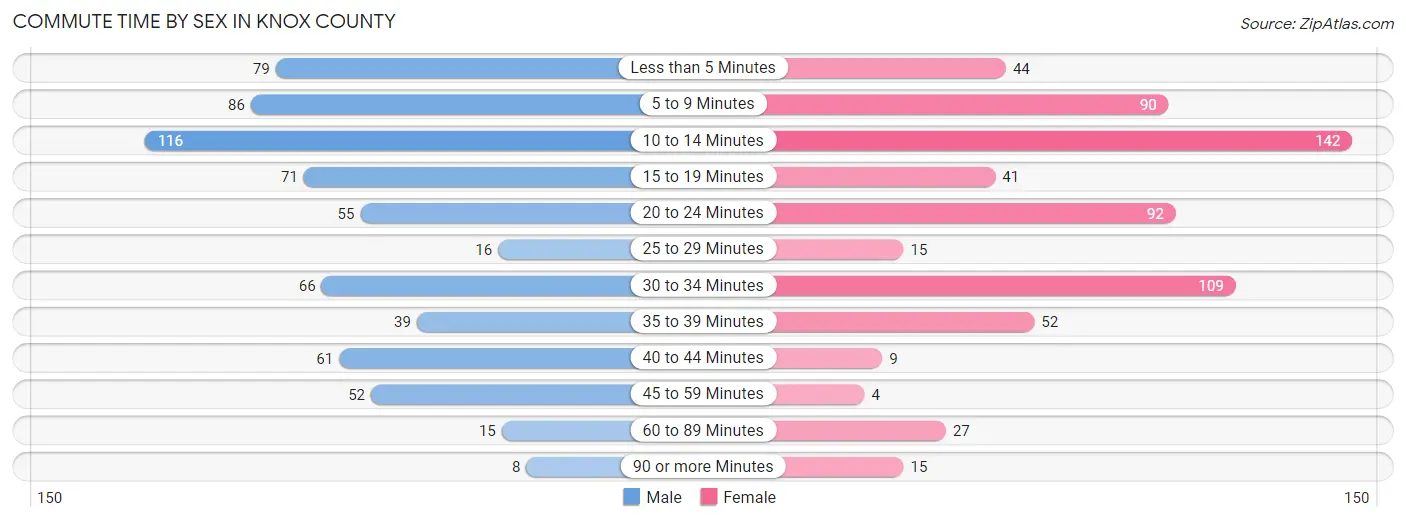
| Commute Time | Male | Female |
| Less than 5 Minutes | 79 (11.9%) | 44 (6.9%) |
| 5 to 9 Minutes | 86 (13.0%) | 90 (14.1%) |
| 10 to 14 Minutes | 116 (17.5%) | 142 (22.2%) |
| 15 to 19 Minutes | 71 (10.7%) | 41 (6.4%) |
| 20 to 24 Minutes | 55 (8.3%) | 92 (14.4%) |
| 25 to 29 Minutes | 16 (2.4%) | 15 (2.3%) |
| 30 to 34 Minutes | 66 (9.9%) | 109 (17.0%) |
| 35 to 39 Minutes | 39 (5.9%) | 52 (8.1%) |
| 40 to 44 Minutes | 61 (9.2%) | 9 (1.4%) |
| 45 to 59 Minutes | 52 (7.8%) | 4 (0.6%) |
| 60 to 89 Minutes | 15 (2.3%) | 27 (4.2%) |
| 90 or more Minutes | 8 (1.2%) | 15 (2.3%) |
Time of Departure to Work by Sex in Knox County
The most frequent times of departure to work in Knox County are 7:00 AM to 7:29 AM (107, 16.1%) for males and 7:30 AM to 7:59 AM (136, 21.2%) for females.
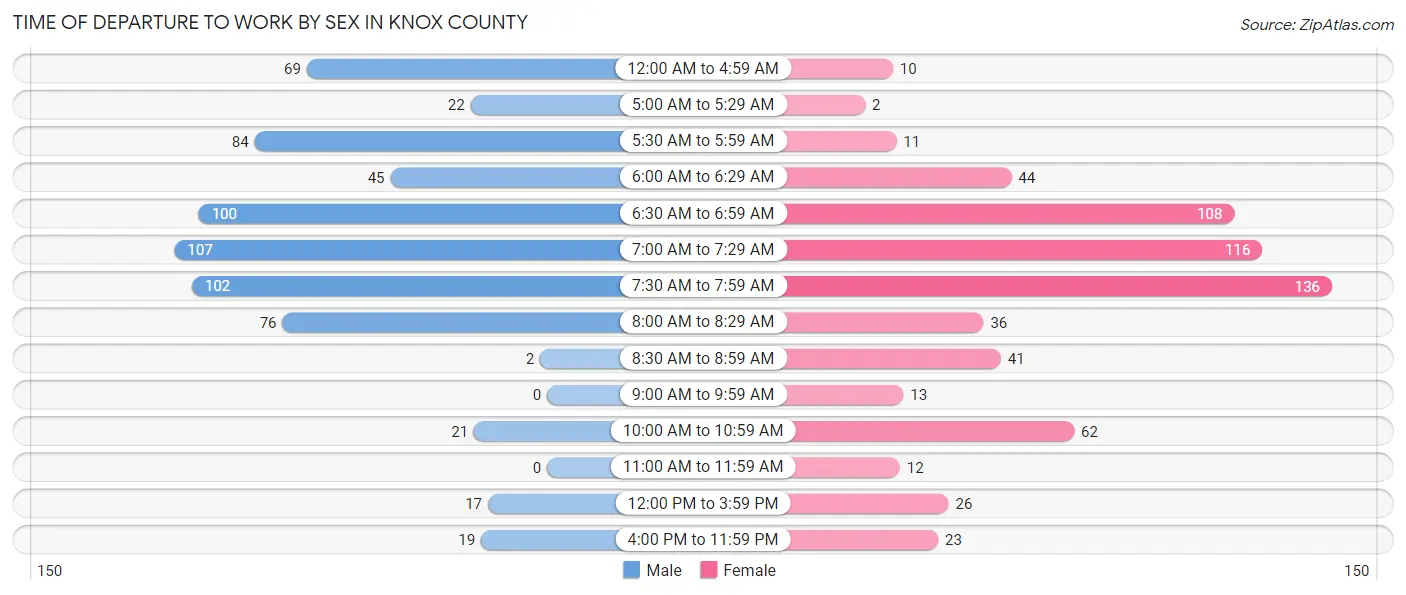
| Time of Departure | Male | Female |
| 12:00 AM to 4:59 AM | 69 (10.4%) | 10 (1.6%) |
| 5:00 AM to 5:29 AM | 22 (3.3%) | 2 (0.3%) |
| 5:30 AM to 5:59 AM | 84 (12.7%) | 11 (1.7%) |
| 6:00 AM to 6:29 AM | 45 (6.8%) | 44 (6.9%) |
| 6:30 AM to 6:59 AM | 100 (15.1%) | 108 (16.9%) |
| 7:00 AM to 7:29 AM | 107 (16.1%) | 116 (18.1%) |
| 7:30 AM to 7:59 AM | 102 (15.4%) | 136 (21.2%) |
| 8:00 AM to 8:29 AM | 76 (11.5%) | 36 (5.6%) |
| 8:30 AM to 8:59 AM | 2 (0.3%) | 41 (6.4%) |
| 9:00 AM to 9:59 AM | 0 (0.0%) | 13 (2.0%) |
| 10:00 AM to 10:59 AM | 21 (3.2%) | 62 (9.7%) |
| 11:00 AM to 11:59 AM | 0 (0.0%) | 12 (1.9%) |
| 12:00 PM to 3:59 PM | 17 (2.6%) | 26 (4.1%) |
| 4:00 PM to 11:59 PM | 19 (2.9%) | 23 (3.6%) |
| Total | 664 (100.0%) | 640 (100.0%) |
Housing Occupancy in Knox County
Occupancy by Ownership in Knox County
Of the total 1,154 dwellings in Knox County, owner-occupied units account for 981 (85.0%), while renter-occupied units make up 173 (15.0%).
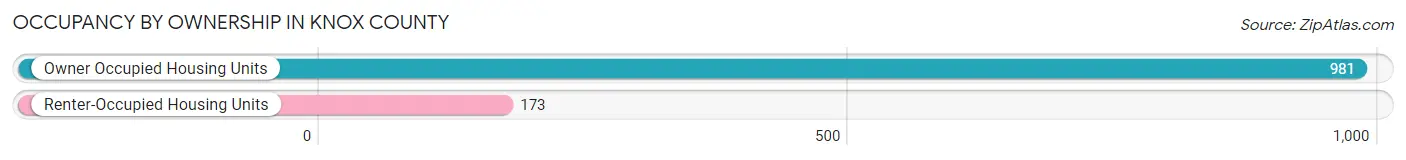
| Occupancy | # Housing Units | % Housing Units |
| Owner Occupied Housing Units | 981 | 85.0% |
| Renter-Occupied Housing Units | 173 | 15.0% |
| Total Occupied Housing Units | 1,154 | 100.0% |
Occupancy by Household Size in Knox County
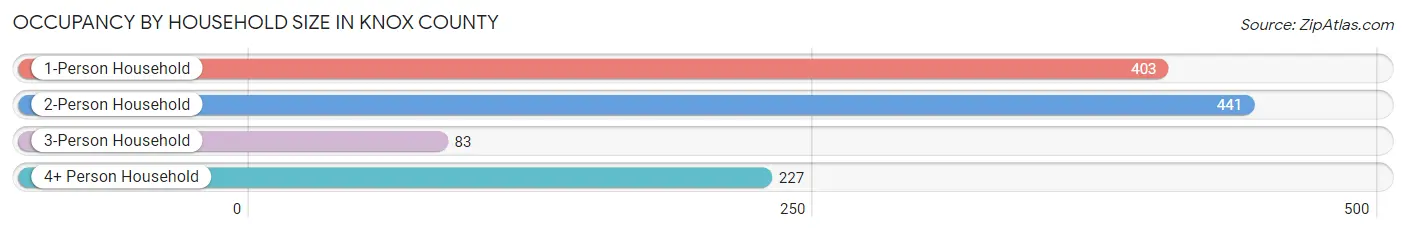
| Household Size | # Housing Units | % Housing Units |
| 1-Person Household | 403 | 34.9% |
| 2-Person Household | 441 | 38.2% |
| 3-Person Household | 83 | 7.2% |
| 4+ Person Household | 227 | 19.7% |
| Total Housing Units | 1,154 | 100.0% |
Occupancy by Ownership by Household Size in Knox County
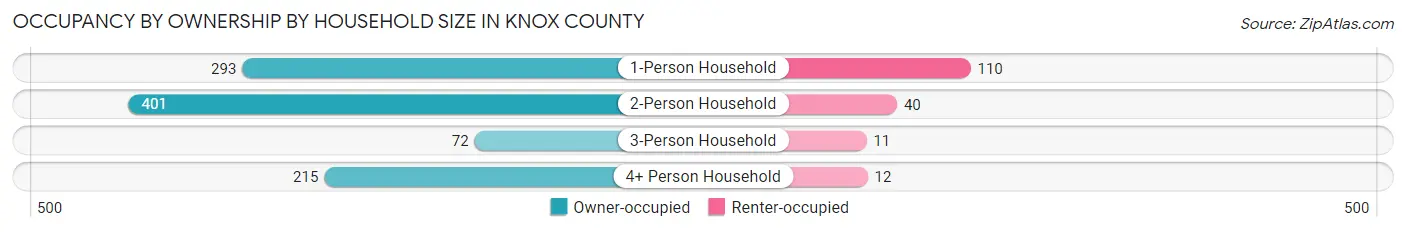
| Household Size | Owner-occupied | Renter-occupied |
| 1-Person Household | 293 (72.7%) | 110 (27.3%) |
| 2-Person Household | 401 (90.9%) | 40 (9.1%) |
| 3-Person Household | 72 (86.8%) | 11 (13.3%) |
| 4+ Person Household | 215 (94.7%) | 12 (5.3%) |
| Total Housing Units | 981 (85.0%) | 173 (15.0%) |
Occupancy by Educational Attainment in Knox County
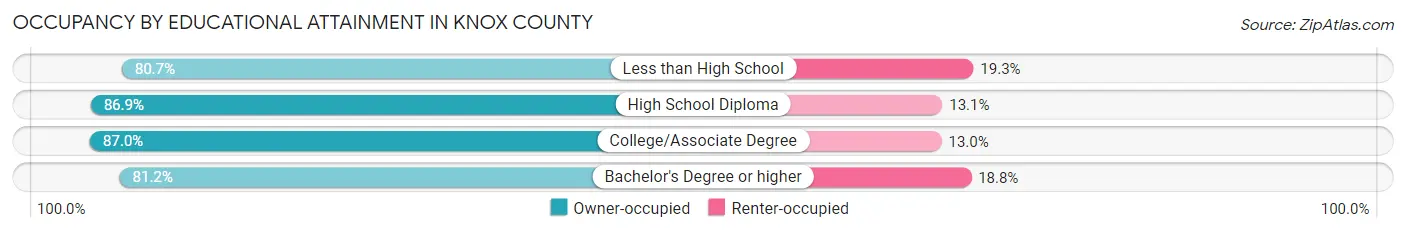
| Household Size | Owner-occupied | Renter-occupied |
| Less than High School | 134 (80.7%) | 32 (19.3%) |
| High School Diploma | 464 (86.9%) | 70 (13.1%) |
| College/Associate Degree | 215 (87.0%) | 32 (13.0%) |
| Bachelor's Degree or higher | 168 (81.2%) | 39 (18.8%) |
Occupancy by Age of Householder in Knox County
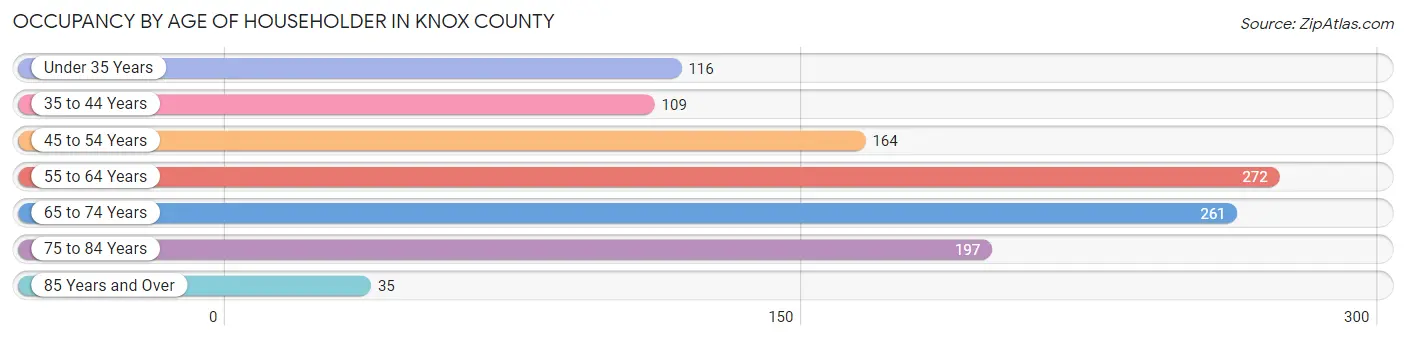
| Age Bracket | # Households | % Households |
| Under 35 Years | 116 | 10.1% |
| 35 to 44 Years | 109 | 9.5% |
| 45 to 54 Years | 164 | 14.2% |
| 55 to 64 Years | 272 | 23.6% |
| 65 to 74 Years | 261 | 22.6% |
| 75 to 84 Years | 197 | 17.1% |
| 85 Years and Over | 35 | 3.0% |
| Total | 1,154 | 100.0% |
Housing Finances in Knox County
Median Income by Occupancy in Knox County
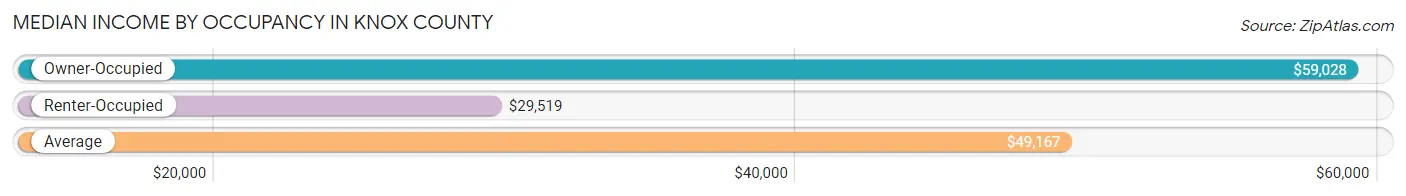
| Occupancy Type | # Households | Median Income |
| Owner-Occupied | 981 (85.0%) | $59,028 |
| Renter-Occupied | 173 (15.0%) | $29,519 |
| Average | 1,154 (100.0%) | $49,167 |
Occupancy by Householder Income Bracket in Knox County
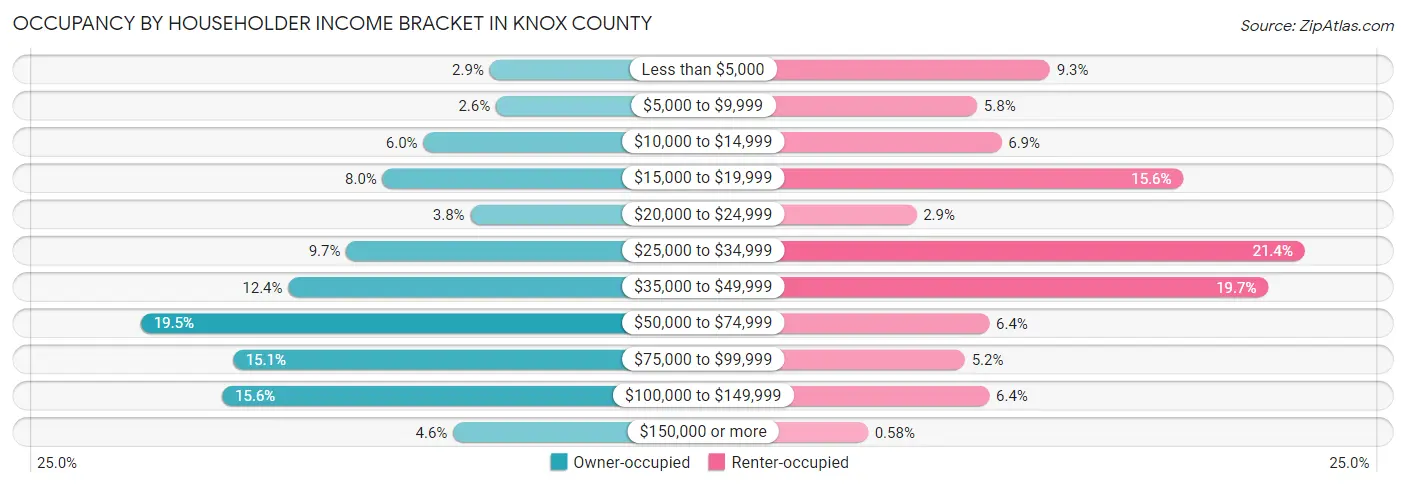
| Income Bracket | Owner-occupied | Renter-occupied |
| Less than $5,000 | 28 (2.9%) | 16 (9.2%) |
| $5,000 to $9,999 | 25 (2.5%) | 10 (5.8%) |
| $10,000 to $14,999 | 59 (6.0%) | 12 (6.9%) |
| $15,000 to $19,999 | 78 (8.0%) | 27 (15.6%) |
| $20,000 to $24,999 | 37 (3.8%) | 5 (2.9%) |
| $25,000 to $34,999 | 95 (9.7%) | 37 (21.4%) |
| $35,000 to $49,999 | 122 (12.4%) | 34 (19.7%) |
| $50,000 to $74,999 | 191 (19.5%) | 11 (6.4%) |
| $75,000 to $99,999 | 148 (15.1%) | 9 (5.2%) |
| $100,000 to $149,999 | 153 (15.6%) | 11 (6.4%) |
| $150,000 or more | 45 (4.6%) | 1 (0.6%) |
| Total | 981 (100.0%) | 173 (100.0%) |
Monthly Housing Cost Tiers in Knox County
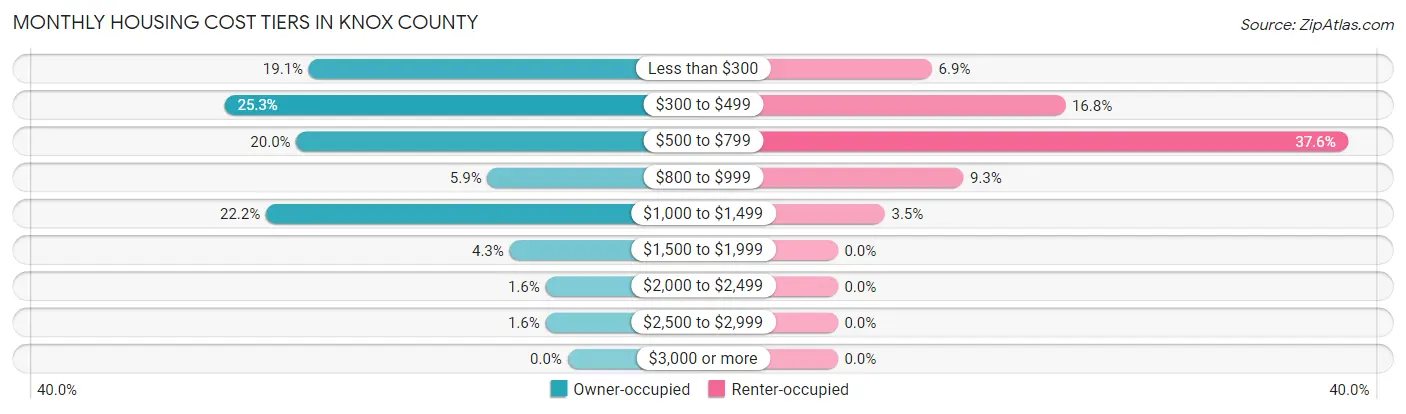
| Monthly Cost | Owner-occupied | Renter-occupied |
| Less than $300 | 187 (19.1%) | 12 (6.9%) |
| $300 to $499 | 248 (25.3%) | 29 (16.8%) |
| $500 to $799 | 196 (20.0%) | 65 (37.6%) |
| $800 to $999 | 58 (5.9%) | 16 (9.2%) |
| $1,000 to $1,499 | 218 (22.2%) | 6 (3.5%) |
| $1,500 to $1,999 | 42 (4.3%) | 0 (0.0%) |
| $2,000 to $2,499 | 16 (1.6%) | 0 (0.0%) |
| $2,500 to $2,999 | 16 (1.6%) | 0 (0.0%) |
| $3,000 or more | 0 (0.0%) | 0 (0.0%) |
| Total | 981 (100.0%) | 173 (100.0%) |
Physical Housing Characteristics in Knox County
Housing Structures in Knox County
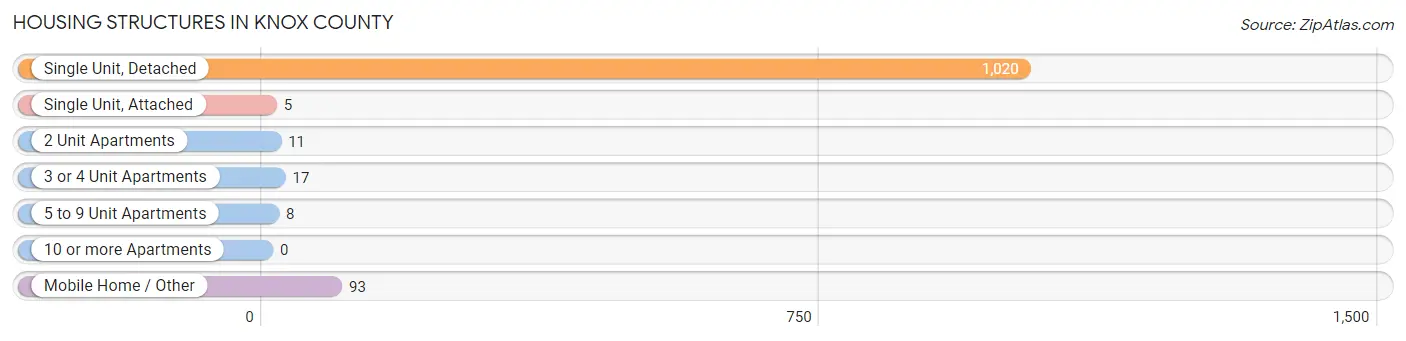
| Structure Type | # Housing Units | % Housing Units |
| Single Unit, Detached | 1,020 | 88.4% |
| Single Unit, Attached | 5 | 0.4% |
| 2 Unit Apartments | 11 | 0.9% |
| 3 or 4 Unit Apartments | 17 | 1.5% |
| 5 to 9 Unit Apartments | 8 | 0.7% |
| 10 or more Apartments | 0 | 0.0% |
| Mobile Home / Other | 93 | 8.1% |
| Total | 1,154 | 100.0% |
Housing Structures by Occupancy in Knox County
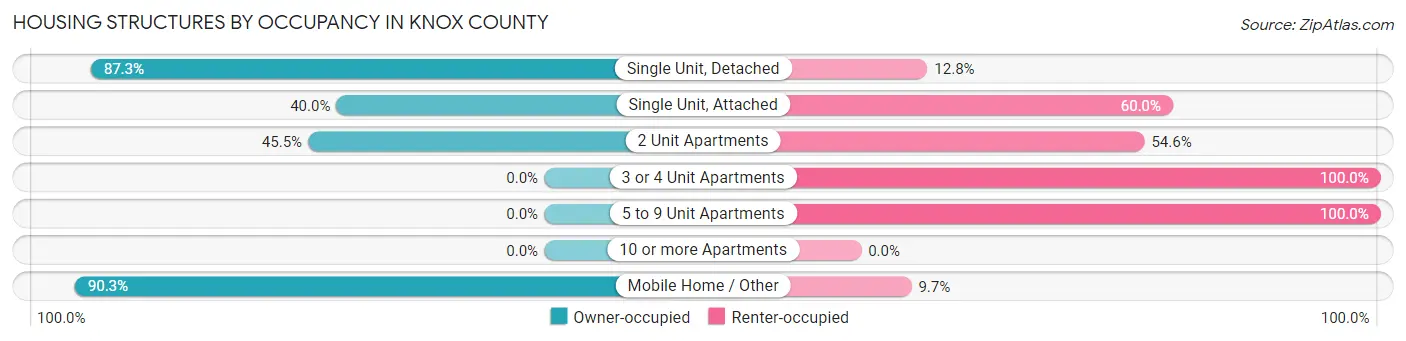
| Structure Type | Owner-occupied | Renter-occupied |
| Single Unit, Detached | 890 (87.3%) | 130 (12.8%) |
| Single Unit, Attached | 2 (40.0%) | 3 (60.0%) |
| 2 Unit Apartments | 5 (45.5%) | 6 (54.5%) |
| 3 or 4 Unit Apartments | 0 (0.0%) | 17 (100.0%) |
| 5 to 9 Unit Apartments | 0 (0.0%) | 8 (100.0%) |
| 10 or more Apartments | 0 (0.0%) | 0 (0.0%) |
| Mobile Home / Other | 84 (90.3%) | 9 (9.7%) |
| Total | 981 (85.0%) | 173 (15.0%) |
Housing Structures by Number of Rooms in Knox County
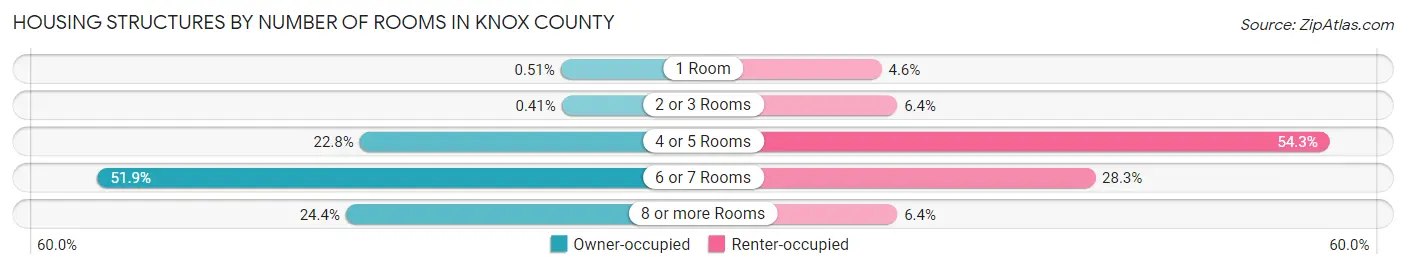
| Number of Rooms | Owner-occupied | Renter-occupied |
| 1 Room | 5 (0.5%) | 8 (4.6%) |
| 2 or 3 Rooms | 4 (0.4%) | 11 (6.4%) |
| 4 or 5 Rooms | 224 (22.8%) | 94 (54.3%) |
| 6 or 7 Rooms | 509 (51.9%) | 49 (28.3%) |
| 8 or more Rooms | 239 (24.4%) | 11 (6.4%) |
| Total | 981 (100.0%) | 173 (100.0%) |
Housing Structure by Heating Type in Knox County
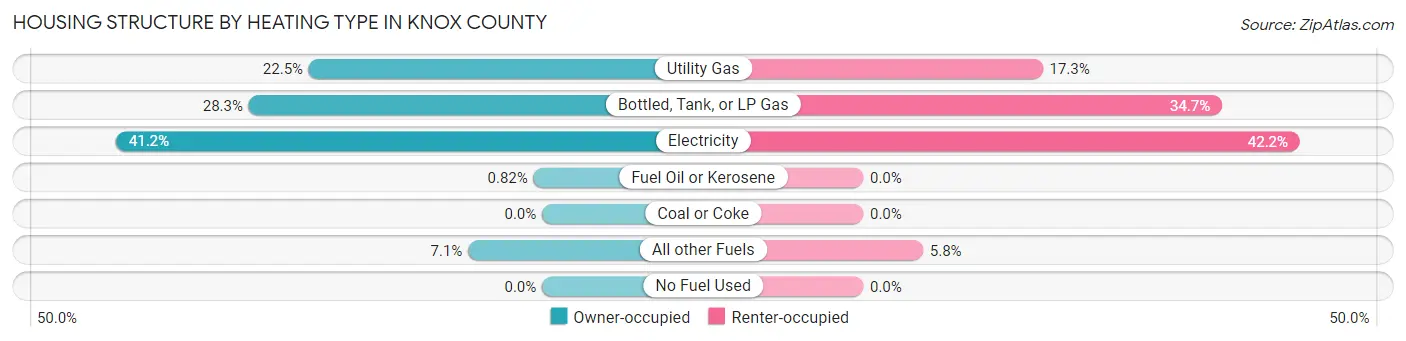
| Heating Type | Owner-occupied | Renter-occupied |
| Utility Gas | 221 (22.5%) | 30 (17.3%) |
| Bottled, Tank, or LP Gas | 278 (28.3%) | 60 (34.7%) |
| Electricity | 404 (41.2%) | 73 (42.2%) |
| Fuel Oil or Kerosene | 8 (0.8%) | 0 (0.0%) |
| Coal or Coke | 0 (0.0%) | 0 (0.0%) |
| All other Fuels | 70 (7.1%) | 10 (5.8%) |
| No Fuel Used | 0 (0.0%) | 0 (0.0%) |
| Total | 981 (100.0%) | 173 (100.0%) |
Household Vehicle Usage in Knox County
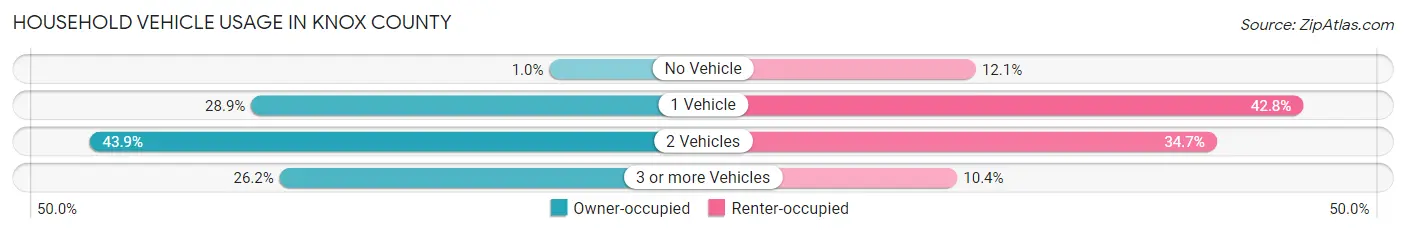
| Vehicles per Household | Owner-occupied | Renter-occupied |
| No Vehicle | 10 (1.0%) | 21 (12.1%) |
| 1 Vehicle | 283 (28.8%) | 74 (42.8%) |
| 2 Vehicles | 431 (43.9%) | 60 (34.7%) |
| 3 or more Vehicles | 257 (26.2%) | 18 (10.4%) |
| Total | 981 (100.0%) | 173 (100.0%) |
Real Estate & Mortgages in Knox County
Real Estate and Mortgage Overview in Knox County
| Characteristic | Without Mortgage | With Mortgage |
| Housing Units | 589 | 392 |
| Median Property Value | $82,000 | $121,100 |
| Median Household Income | $43,942 | $12 |
| Monthly Housing Costs | $389 | $0 |
| Real Estate Taxes | $745 | $19 |
Property Value by Mortgage Status in Knox County
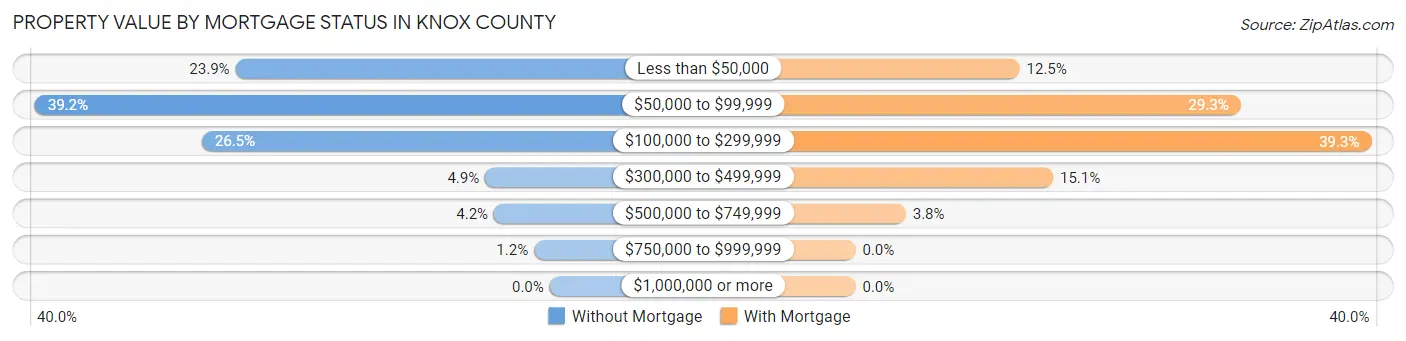
| Property Value | Without Mortgage | With Mortgage |
| Less than $50,000 | 141 (23.9%) | 49 (12.5%) |
| $50,000 to $99,999 | 231 (39.2%) | 115 (29.3%) |
| $100,000 to $299,999 | 156 (26.5%) | 154 (39.3%) |
| $300,000 to $499,999 | 29 (4.9%) | 59 (15.0%) |
| $500,000 to $749,999 | 25 (4.2%) | 15 (3.8%) |
| $750,000 to $999,999 | 7 (1.2%) | 0 (0.0%) |
| $1,000,000 or more | 0 (0.0%) | 0 (0.0%) |
| Total | 589 (100.0%) | 392 (100.0%) |
Household Income by Mortgage Status in Knox County
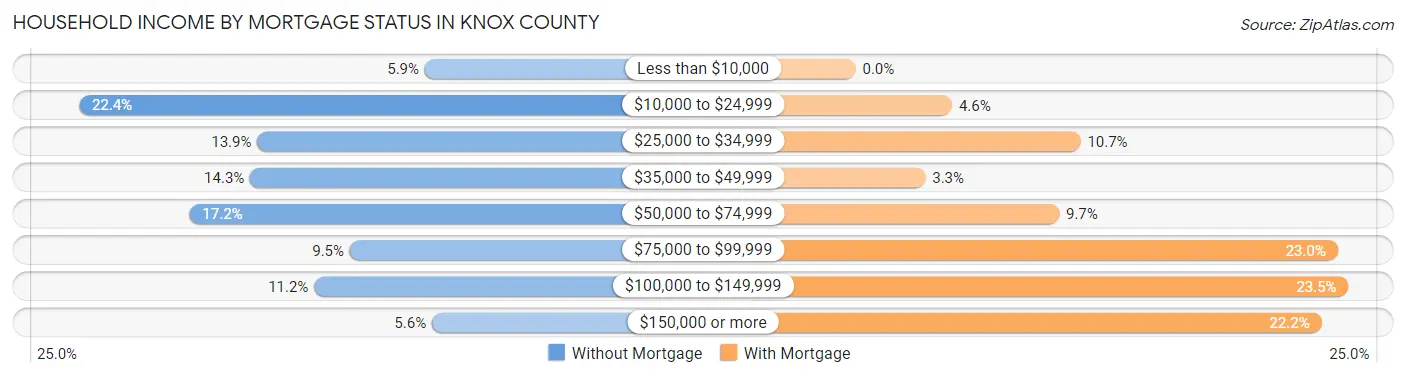
| Household Income | Without Mortgage | With Mortgage |
| Less than $10,000 | 35 (5.9%) | 0 (0.0%) |
| $10,000 to $24,999 | 132 (22.4%) | 18 (4.6%) |
| $25,000 to $34,999 | 82 (13.9%) | 42 (10.7%) |
| $35,000 to $49,999 | 84 (14.3%) | 13 (3.3%) |
| $50,000 to $74,999 | 101 (17.2%) | 38 (9.7%) |
| $75,000 to $99,999 | 56 (9.5%) | 90 (23.0%) |
| $100,000 to $149,999 | 66 (11.2%) | 92 (23.5%) |
| $150,000 or more | 33 (5.6%) | 87 (22.2%) |
| Total | 589 (100.0%) | 392 (100.0%) |
Property Value to Household Income Ratio in Knox County
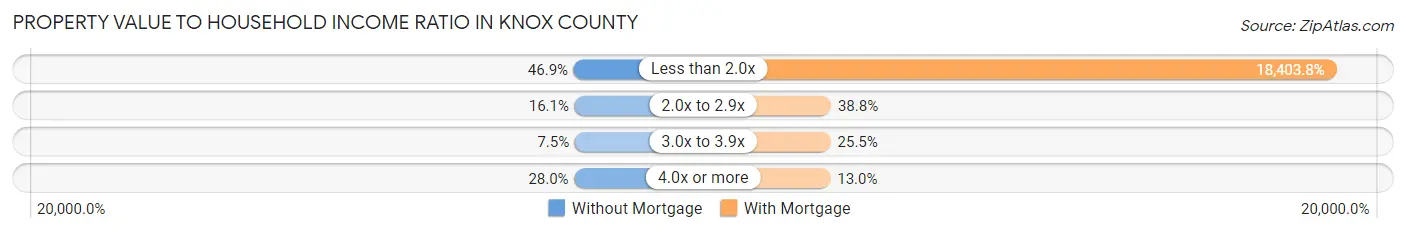
| Value-to-Income Ratio | Without Mortgage | With Mortgage |
| Less than 2.0x | 276 (46.9%) | 72,143 (18,403.8%) |
| 2.0x to 2.9x | 95 (16.1%) | 152 (38.8%) |
| 3.0x to 3.9x | 44 (7.5%) | 100 (25.5%) |
| 4.0x or more | 165 (28.0%) | 51 (13.0%) |
| Total | 589 (100.0%) | 392 (100.0%) |
Real Estate Taxes by Mortgage Status in Knox County
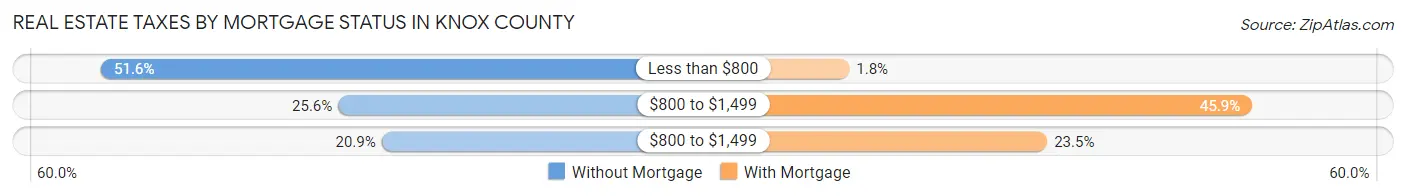
| Property Taxes | Without Mortgage | With Mortgage |
| Less than $800 | 304 (51.6%) | 7 (1.8%) |
| $800 to $1,499 | 151 (25.6%) | 180 (45.9%) |
| $800 to $1,499 | 123 (20.9%) | 92 (23.5%) |
| Total | 589 (100.0%) | 392 (100.0%) |
Health & Disability in Knox County
Health Insurance Coverage by Age in Knox County
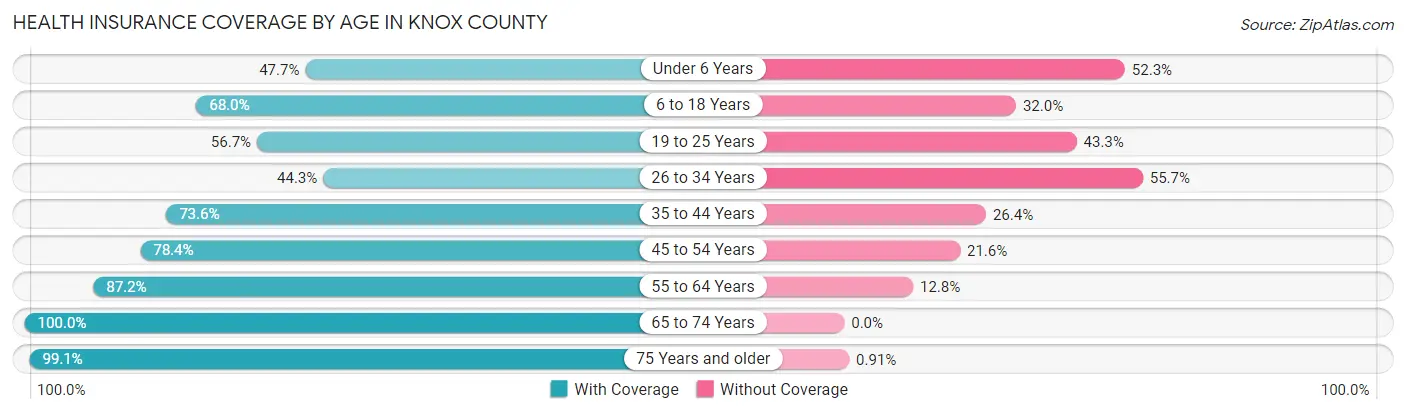
| Age Bracket | With Coverage | Without Coverage |
| Under 6 Years | 143 (47.7%) | 157 (52.3%) |
| 6 to 18 Years | 482 (68.0%) | 227 (32.0%) |
| 19 to 25 Years | 157 (56.7%) | 120 (43.3%) |
| 26 to 34 Years | 129 (44.3%) | 162 (55.7%) |
| 35 to 44 Years | 323 (73.6%) | 116 (26.4%) |
| 45 to 54 Years | 327 (78.4%) | 90 (21.6%) |
| 55 to 64 Years | 476 (87.2%) | 70 (12.8%) |
| 65 to 74 Years | 421 (100.0%) | 0 (0.0%) |
| 75 Years and older | 328 (99.1%) | 3 (0.9%) |
| Total | 2,786 (74.7%) | 945 (25.3%) |
Health Insurance Coverage by Citizenship Status in Knox County
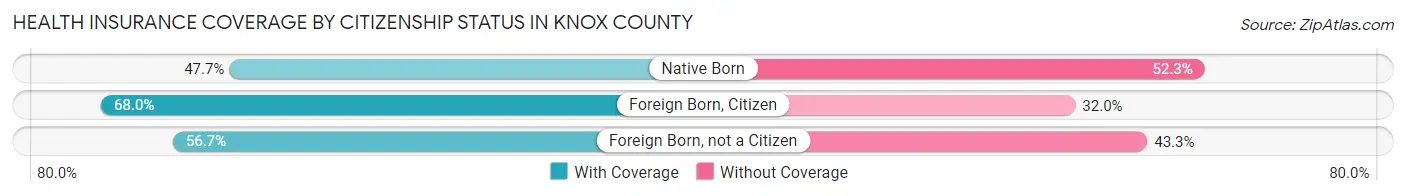
| Citizenship Status | With Coverage | Without Coverage |
| Native Born | 143 (47.7%) | 157 (52.3%) |
| Foreign Born, Citizen | 482 (68.0%) | 227 (32.0%) |
| Foreign Born, not a Citizen | 157 (56.7%) | 120 (43.3%) |
Health Insurance Coverage by Household Income in Knox County
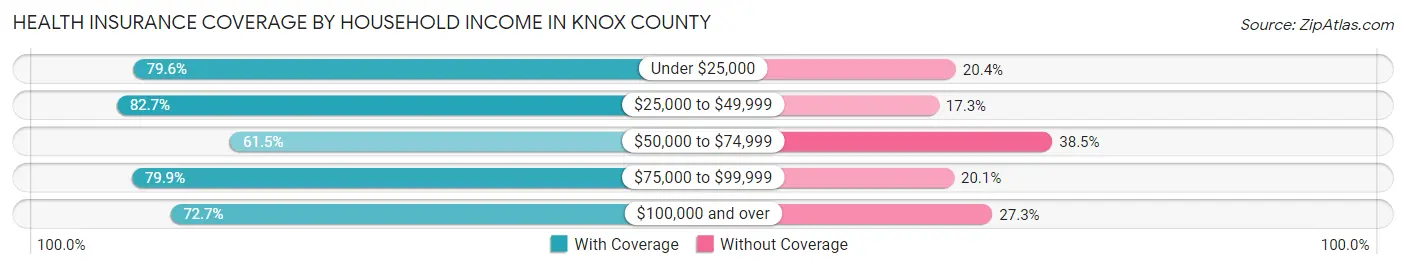
| Household Income | With Coverage | Without Coverage |
| Under $25,000 | 358 (79.6%) | 92 (20.4%) |
| $25,000 to $49,999 | 623 (82.7%) | 130 (17.3%) |
| $50,000 to $74,999 | 447 (61.5%) | 280 (38.5%) |
| $75,000 to $99,999 | 461 (79.9%) | 116 (20.1%) |
| $100,000 and over | 837 (72.7%) | 314 (27.3%) |
Public vs Private Health Insurance Coverage by Age in Knox County
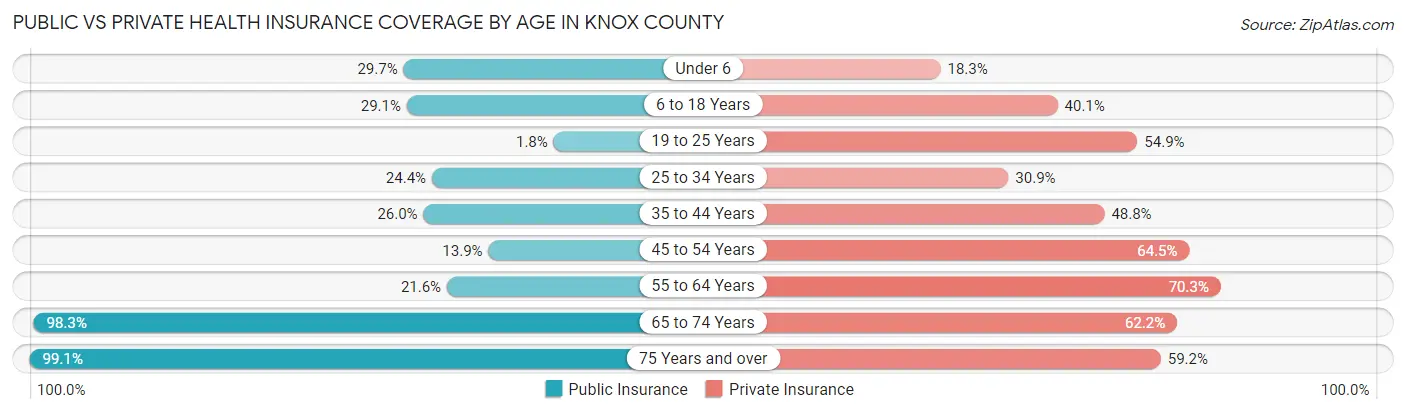
| Age Bracket | Public Insurance | Private Insurance |
| Under 6 | 89 (29.7%) | 55 (18.3%) |
| 6 to 18 Years | 206 (29.1%) | 284 (40.1%) |
| 19 to 25 Years | 5 (1.8%) | 152 (54.9%) |
| 25 to 34 Years | 71 (24.4%) | 90 (30.9%) |
| 35 to 44 Years | 114 (26.0%) | 214 (48.7%) |
| 45 to 54 Years | 58 (13.9%) | 269 (64.5%) |
| 55 to 64 Years | 118 (21.6%) | 384 (70.3%) |
| 65 to 74 Years | 414 (98.3%) | 262 (62.2%) |
| 75 Years and over | 328 (99.1%) | 196 (59.2%) |
| Total | 1,403 (37.6%) | 1,906 (51.1%) |
Disability Status by Sex by Age in Knox County
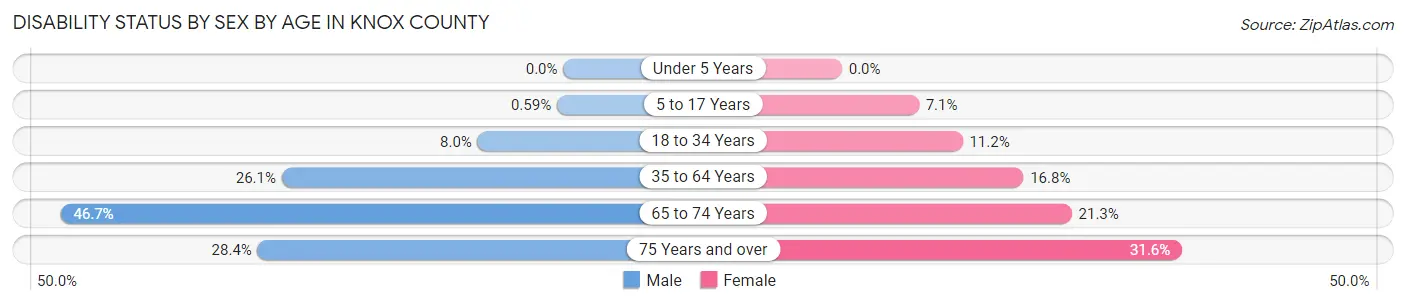
| Age Bracket | Male | Female |
| Under 5 Years | 0 (0.0%) | 0 (0.0%) |
| 5 to 17 Years | 2 (0.6%) | 20 (7.1%) |
| 18 to 34 Years | 26 (8.0%) | 40 (11.2%) |
| 35 to 64 Years | 191 (26.1%) | 113 (16.8%) |
| 65 to 74 Years | 98 (46.7%) | 45 (21.3%) |
| 75 Years and over | 40 (28.4%) | 60 (31.6%) |
Disability Class by Sex by Age in Knox County
Disability Class: Hearing Difficulty
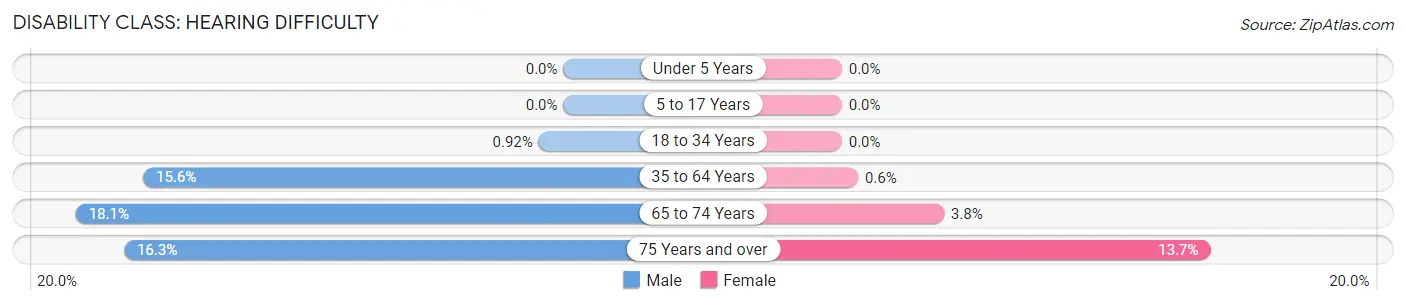
| Age Bracket | Male | Female |
| Under 5 Years | 0 (0.0%) | 0 (0.0%) |
| 5 to 17 Years | 0 (0.0%) | 0 (0.0%) |
| 18 to 34 Years | 3 (0.9%) | 0 (0.0%) |
| 35 to 64 Years | 114 (15.6%) | 4 (0.6%) |
| 65 to 74 Years | 38 (18.1%) | 8 (3.8%) |
| 75 Years and over | 23 (16.3%) | 26 (13.7%) |
Disability Class: Vision Difficulty
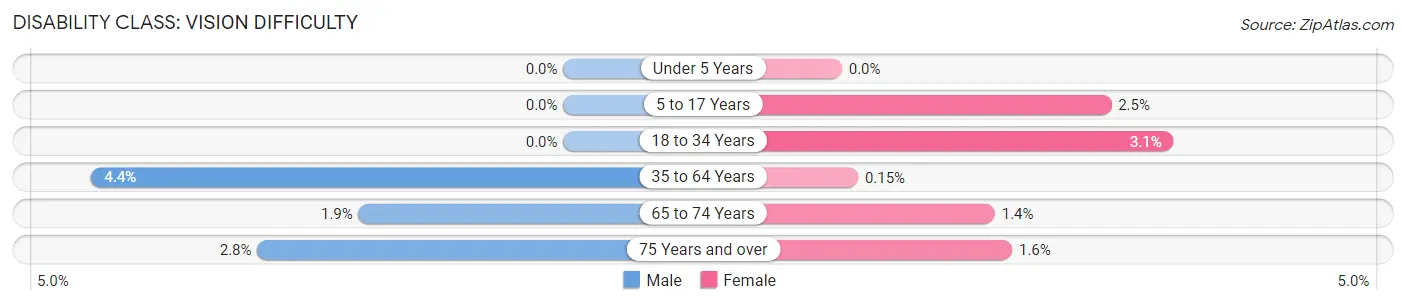
| Age Bracket | Male | Female |
| Under 5 Years | 0 (0.0%) | 0 (0.0%) |
| 5 to 17 Years | 0 (0.0%) | 7 (2.5%) |
| 18 to 34 Years | 0 (0.0%) | 11 (3.1%) |
| 35 to 64 Years | 32 (4.4%) | 1 (0.2%) |
| 65 to 74 Years | 4 (1.9%) | 3 (1.4%) |
| 75 Years and over | 4 (2.8%) | 3 (1.6%) |
Disability Class: Cognitive Difficulty
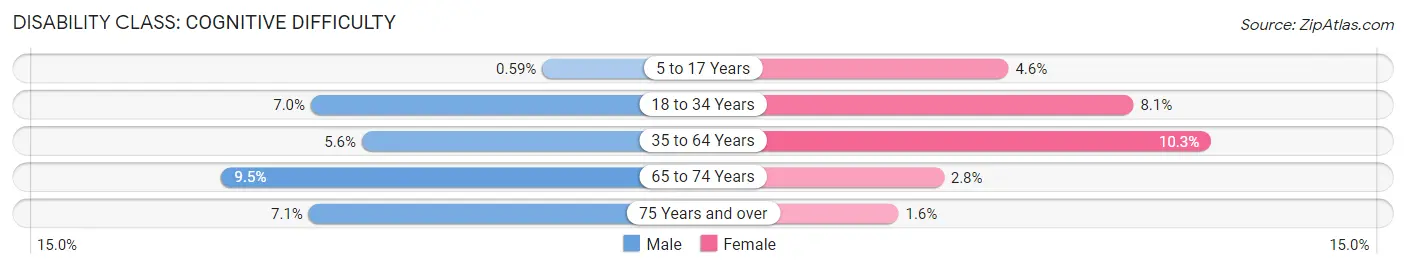
| Age Bracket | Male | Female |
| 5 to 17 Years | 2 (0.6%) | 13 (4.6%) |
| 18 to 34 Years | 23 (7.0%) | 29 (8.1%) |
| 35 to 64 Years | 41 (5.6%) | 69 (10.3%) |
| 65 to 74 Years | 20 (9.5%) | 6 (2.8%) |
| 75 Years and over | 10 (7.1%) | 3 (1.6%) |
Disability Class: Ambulatory Difficulty
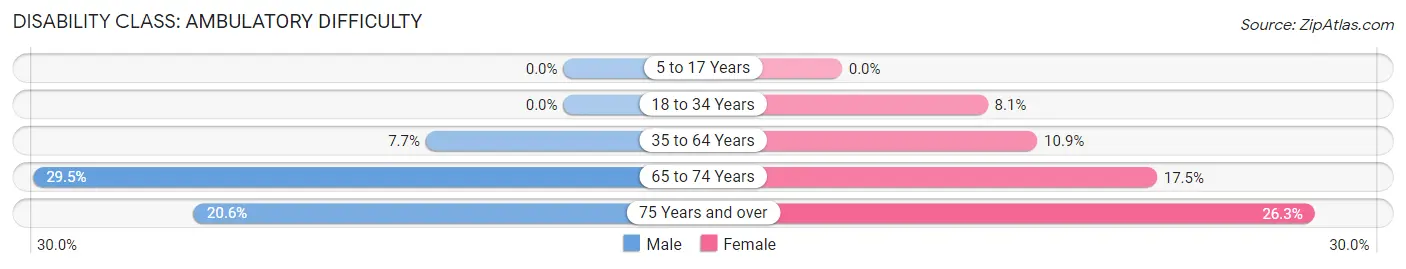
| Age Bracket | Male | Female |
| 5 to 17 Years | 0 (0.0%) | 0 (0.0%) |
| 18 to 34 Years | 0 (0.0%) | 29 (8.1%) |
| 35 to 64 Years | 56 (7.7%) | 73 (10.9%) |
| 65 to 74 Years | 62 (29.5%) | 37 (17.5%) |
| 75 Years and over | 29 (20.6%) | 50 (26.3%) |
Disability Class: Self-Care Difficulty
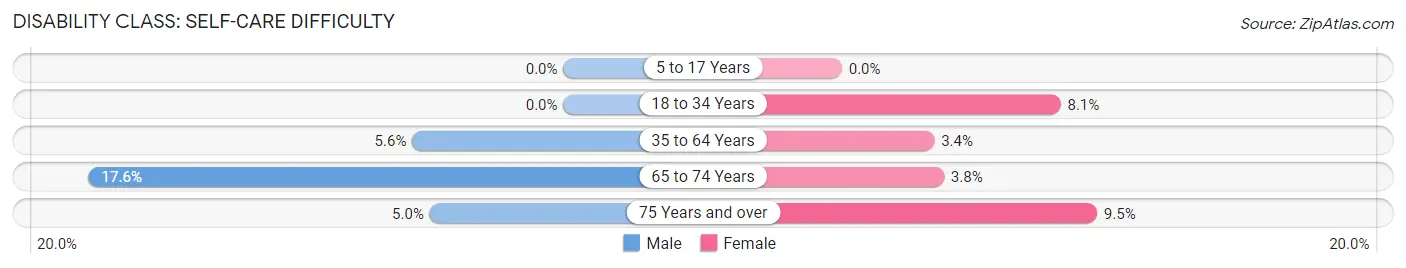
| Age Bracket | Male | Female |
| 5 to 17 Years | 0 (0.0%) | 0 (0.0%) |
| 18 to 34 Years | 0 (0.0%) | 29 (8.1%) |
| 35 to 64 Years | 41 (5.6%) | 23 (3.4%) |
| 65 to 74 Years | 37 (17.6%) | 8 (3.8%) |
| 75 Years and over | 7 (5.0%) | 18 (9.5%) |
Technology Access in Knox County
Computing Device Access in Knox County
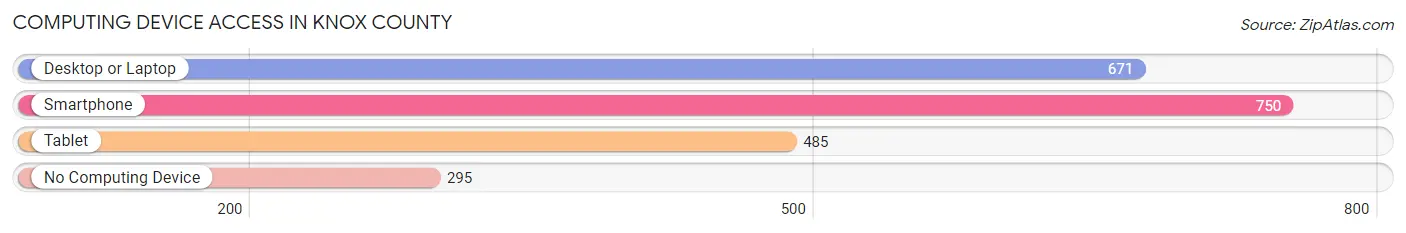
| Device Type | # Households | % Households |
| Desktop or Laptop | 671 | 58.2% |
| Smartphone | 750 | 65.0% |
| Tablet | 485 | 42.0% |
| No Computing Device | 295 | 25.6% |
| Total | 1,154 | 100.0% |
Internet Access in Knox County
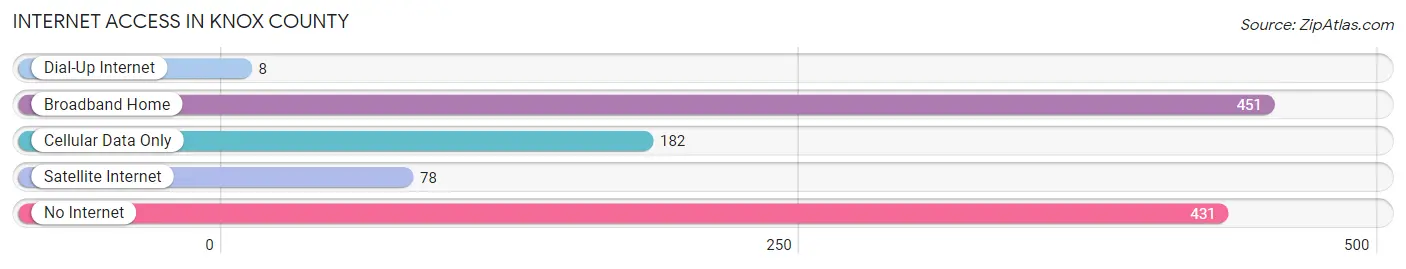
| Internet Type | # Households | % Households |
| Dial-Up Internet | 8 | 0.7% |
| Broadband Home | 451 | 39.1% |
| Cellular Data Only | 182 | 15.8% |
| Satellite Internet | 78 | 6.8% |
| No Internet | 431 | 37.3% |
| Total | 1,154 | 100.0% |
Knox County Summary
Knox County is located in the northeast corner of Missouri, and is bordered by Scotland County to the north, Lewis County to the east, Shelby County to the south, and Adair County to the west. The county seat is Edina, and the county was organized in 1845. The county has a total area of 517 square miles, and a population of 4,919 as of the 2010 census.
Geography
Knox County is located in the northeast corner of Missouri, and is bordered by Scotland County to the north, Lewis County to the east, Shelby County to the south, and Adair County to the west. The county has a total area of 517 square miles, and is mostly rural. The terrain is mostly rolling hills, with some flat areas in the northern part of the county. The highest point in the county is located in the northwest corner, at an elevation of 1,068 feet. The county is drained by the Fabius River, which flows through the center of the county.
History
Knox County was organized in 1845, and was named after Henry Knox, the first Secretary of War under President George Washington. The county was originally part of the Louisiana Purchase, and was part of the Platte Purchase in 1836. The county was originally inhabited by the Osage and Missouri Native American tribes. The first settlers arrived in the county in the early 1800s, and the county was officially organized in 1845.
Economy
The economy of Knox County is largely based on agriculture. The county is home to a variety of crops, including corn, soybeans, wheat, hay, and oats. Livestock production is also important to the economy, with beef cattle, dairy cattle, and hogs being the main types of livestock raised in the county. The county also has a number of small businesses, including retail stores, restaurants, and service providers.
Demographics
As of the 2010 census, there were 4,919 people, 1,945 households, and 1,323 families living in the county. The population density was 9.6 people per square mile. The racial makeup of the county was 97.3% White, 0.7% African American, 0.2% Native American, 0.2% Asian, 0.1% Pacific Islander, 0.3% from other races, and 1.2% from two or more races. Hispanic or Latino of any race were 1.2% of the population.
The median income for a household in the county was $37,917, and the median income for a family was $45,938. The per capita income for the county was $18,845. About 11.2% of families and 14.2% of the population were below the poverty line, including 17.2% of those under age 18 and 11.2% of those age 65 or over.
Conclusion
Knox County is a rural county located in the northeast corner of Missouri. The county has a total area of 517 square miles, and a population of 4,919 as of the 2010 census. The economy of the county is largely based on agriculture, with crops and livestock production being the main sources of income. The population is mostly white, with a small percentage of African Americans, Native Americans, Asians, and other races. The median income for a household in the county is $37,917, and the per capita income is $18,845.
Common Questions
What is Per Capita Income in Knox County?
Per Capita income in Knox County is $22,902.
What is the Median Family Income in Knox County?
Median Family Income in Knox County is $70,469.
What is the Median Household income in Knox County?
Median Household Income in Knox County is $49,167.
What is Income or Wage Gap in Knox County?
Income or Wage Gap in Knox County is 47.1%.
Women in Knox County earn 52.9 cents for every dollar earned by a man.
What is Family Income Deficit in Knox County?
Family Income Deficit in Knox County is $11,729.
Families that are below poverty line in Knox County earn $11,729 less on average than the poverty threshold level.
What is Inequality or Gini Index in Knox County?
Inequality or Gini Index in Knox County is 0.44.
What is the Total Population of Knox County?
Total Population of Knox County is 3,772.
What is the Total Male Population of Knox County?
Total Male Population of Knox County is 1,899.
What is the Total Female Population of Knox County?
Total Female Population of Knox County is 1,873.
What is the Ratio of Males per 100 Females in Knox County?
There are 101.39 Males per 100 Females in Knox County.
What is the Ratio of Females per 100 Males in Knox County?
There are 98.63 Females per 100 Males in Knox County.
What is the Median Population Age in Knox County?
Median Population Age in Knox County is 41.9 Years.
What is the Average Family Size in Knox County
Average Family Size in Knox County is 4.4 People.
What is the Average Household Size in Knox County
Average Household Size in Knox County is 3.2 People.
How Large is the Labor Force in Knox County?
There are 1,673 People in the Labor Forcein in Knox County.
What is the Percentage of People in the Labor Force in Knox County?
55.6% of People are in the Labor Force in Knox County.
What is the Unemployment Rate in Knox County?
Unemployment Rate in Knox County is 2.1%.