Johnson County, MO Map & Demographics
Johnson County Map
Johnson County Overview
$30,639
PER CAPITA INCOME
$80,979
AVG FAMILY INCOME
$62,503
AVG HOUSEHOLD INCOME
28.1%
WAGE / INCOME GAP [ % ]
71.9¢/ $1
WAGE / INCOME GAP [ $ ]
$9,145
FAMILY INCOME DEFICIT
0.40
INEQUALITY / GINI INDEX
54,025
TOTAL POPULATION
27,678
MALE POPULATION
26,347
FEMALE POPULATION
105.05
MALES / 100 FEMALES
95.19
FEMALES / 100 MALES
31.0
MEDIAN AGE
3.0
AVG FAMILY SIZE
2.4
AVG HOUSEHOLD SIZE
28,568
LABOR FORCE [ PEOPLE ]
65.8%
PERCENT IN LABOR FORCE
4.8%
UNEMPLOYMENT RATE
Income in Johnson County
Income Overview in Johnson County
Per Capita Income in Johnson County is $30,639, while median incomes of families and households are $80,979 and $62,503 respectively.
| Characteristic | Number | Measure |
| Per Capita Income | 54,025 | $30,639 |
| Median Family Income | 12,940 | $80,979 |
| Mean Family Income | 12,940 | $95,078 |
| Median Household Income | 20,613 | $62,503 |
| Mean Household Income | 20,613 | $78,854 |
| Income Deficit | 12,940 | $9,145 |
| Wage / Income Gap (%) | 54,025 | 28.14% |
| Wage / Income Gap ($) | 54,025 | 71.86¢ per $1 |
| Gini / Inequality Index | 54,025 | 0.40 |
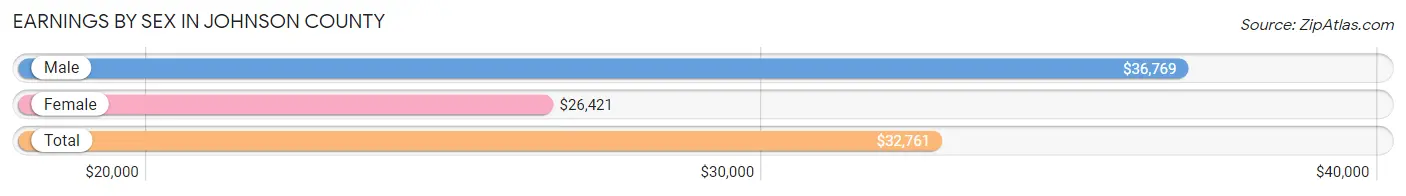
Earnings by Sex in Johnson County
Average Earnings in Johnson County are $32,761, $36,769 for men and $26,421 for women, a difference of 28.1%.
| Sex | Number | Average Earnings |
| Male | 17,231 (54.4%) | $36,769 |
| Female | 14,442 (45.6%) | $26,421 |
| Total | 31,673 (100.0%) | $32,761 |
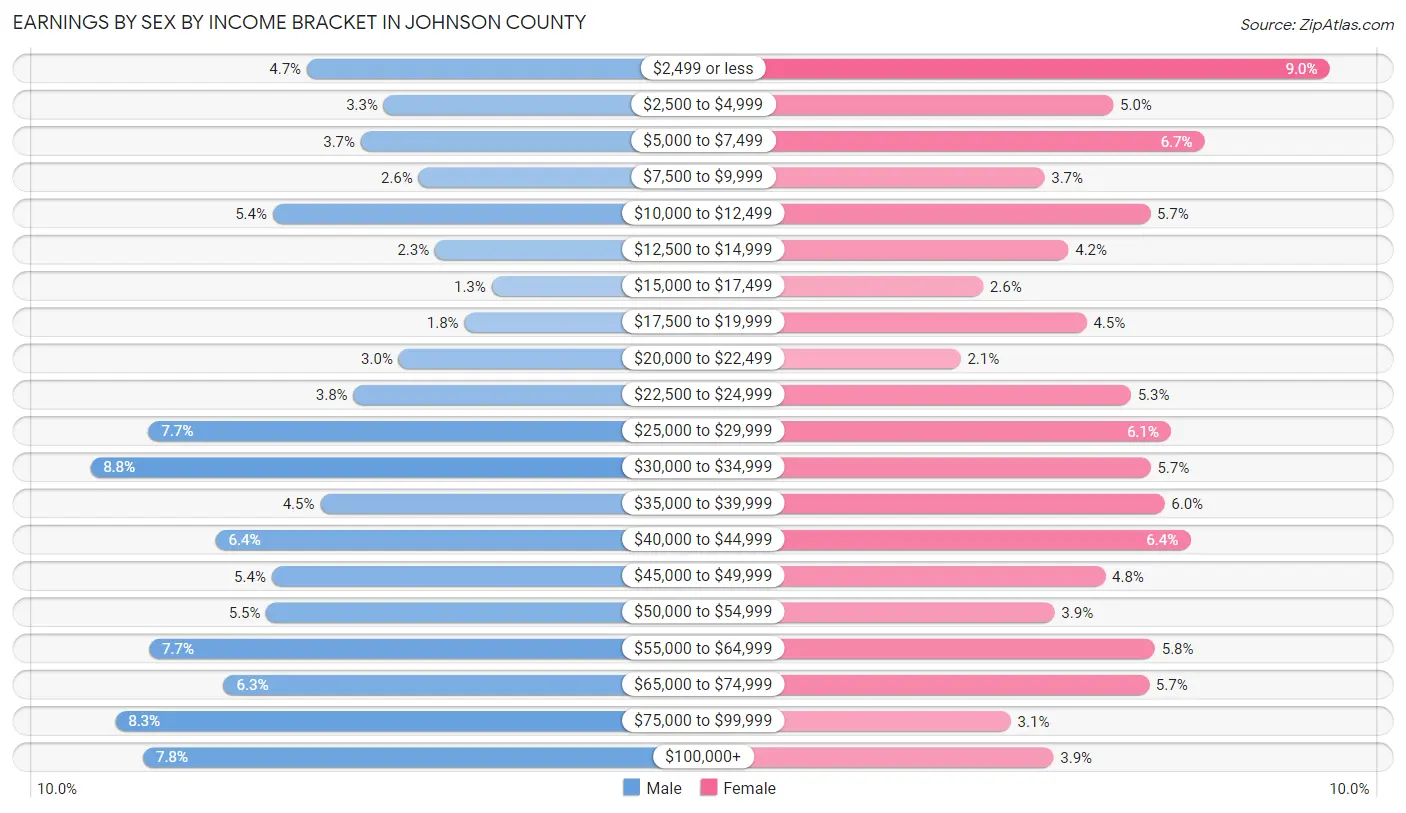
Earnings by Sex by Income Bracket in Johnson County
The most common earnings brackets in Johnson County are $30,000 to $34,999 for men (1,511 | 8.8%) and $2,499 or less for women (1,305 | 9.0%).
| Income | Male | Female |
| $2,499 or less | 812 (4.7%) | 1,305 (9.0%) |
| $2,500 to $4,999 | 564 (3.3%) | 721 (5.0%) |
| $5,000 to $7,499 | 638 (3.7%) | 967 (6.7%) |
| $7,500 to $9,999 | 452 (2.6%) | 534 (3.7%) |
| $10,000 to $12,499 | 921 (5.3%) | 820 (5.7%) |
| $12,500 to $14,999 | 398 (2.3%) | 600 (4.2%) |
| $15,000 to $17,499 | 215 (1.3%) | 368 (2.5%) |
| $17,500 to $19,999 | 303 (1.8%) | 648 (4.5%) |
| $20,000 to $22,499 | 515 (3.0%) | 307 (2.1%) |
| $22,500 to $24,999 | 662 (3.8%) | 768 (5.3%) |
| $25,000 to $29,999 | 1,323 (7.7%) | 877 (6.1%) |
| $30,000 to $34,999 | 1,511 (8.8%) | 822 (5.7%) |
| $35,000 to $39,999 | 769 (4.5%) | 860 (5.9%) |
| $40,000 to $44,999 | 1,106 (6.4%) | 929 (6.4%) |
| $45,000 to $49,999 | 926 (5.4%) | 699 (4.8%) |
| $50,000 to $54,999 | 942 (5.5%) | 562 (3.9%) |
| $55,000 to $64,999 | 1,322 (7.7%) | 834 (5.8%) |
| $65,000 to $74,999 | 1,081 (6.3%) | 818 (5.7%) |
| $75,000 to $99,999 | 1,431 (8.3%) | 444 (3.1%) |
| $100,000+ | 1,340 (7.8%) | 559 (3.9%) |
| Total | 17,231 (100.0%) | 14,442 (100.0%) |
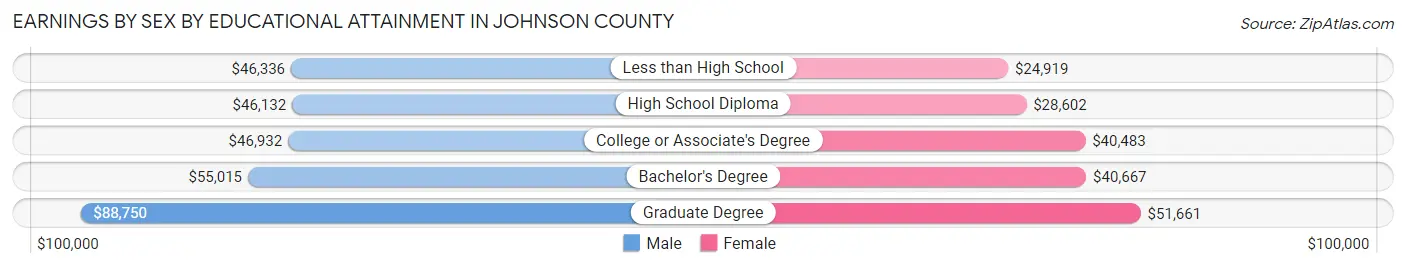
Earnings by Sex by Educational Attainment in Johnson County
Average earnings in Johnson County are $50,959 for men and $38,333 for women, a difference of 24.8%. Men with an educational attainment of graduate degree enjoy the highest average annual earnings of $88,750, while those with high school diploma education earn the least with $46,132. Women with an educational attainment of graduate degree earn the most with the average annual earnings of $51,661, while those with less than high school education have the smallest earnings of $24,919.
| Educational Attainment | Male Income | Female Income |
| Less than High School | $46,336 | $24,919 |
| High School Diploma | $46,132 | $28,602 |
| College or Associate's Degree | $46,932 | $40,483 |
| Bachelor's Degree | $55,015 | $40,667 |
| Graduate Degree | $88,750 | $51,661 |
| Total | $50,959 | $38,333 |
Family Income in Johnson County
Family Income Brackets in Johnson County
According to the Johnson County family income data, there are 3,196 families falling into the $100,000 to $149,999 income range, which is the most common income bracket and makes up 24.7% of all families. Conversely, the $10,000 to $14,999 income bracket is the least frequent group with only 116 families (0.9%) belonging to this category.
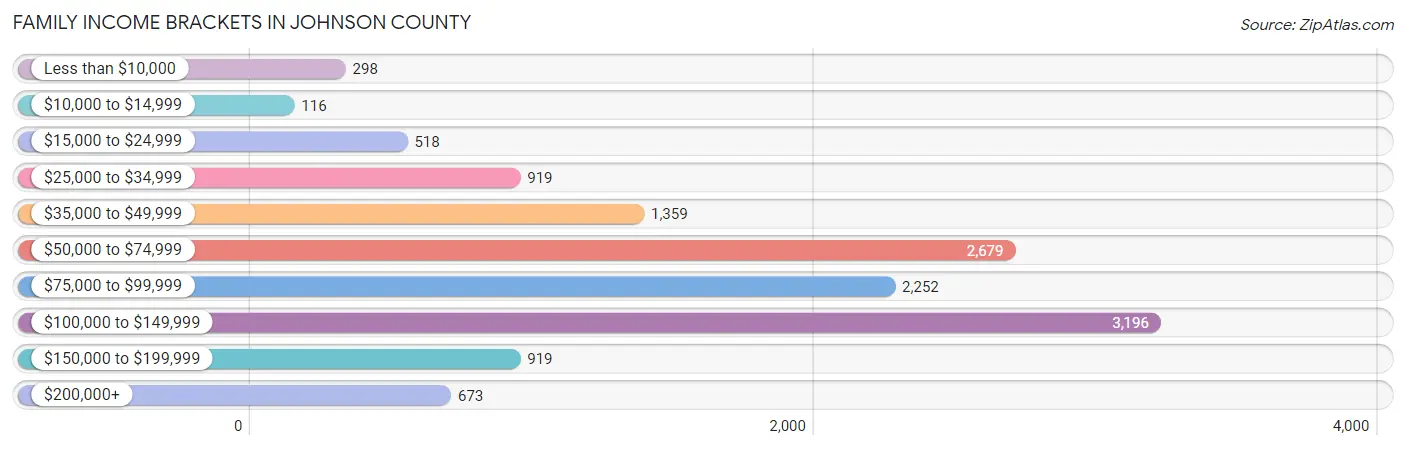
| Income Bracket | # Families | % Families |
| Less than $10,000 | 298 | 2.3% |
| $10,000 to $14,999 | 116 | 0.9% |
| $15,000 to $24,999 | 518 | 4.0% |
| $25,000 to $34,999 | 919 | 7.1% |
| $35,000 to $49,999 | 1,359 | 10.5% |
| $50,000 to $74,999 | 2,679 | 20.7% |
| $75,000 to $99,999 | 2,252 | 17.4% |
| $100,000 to $149,999 | 3,196 | 24.7% |
| $150,000 to $199,999 | 919 | 7.1% |
| $200,000+ | 673 | 5.2% |
Family Income by Famaliy Size in Johnson County
6-person families (375 | 2.9%) account for the highest median family income in Johnson County with $117,938 per family, while 2-person families (6,234 | 48.2%) have the highest median income of $33,835 per family member.
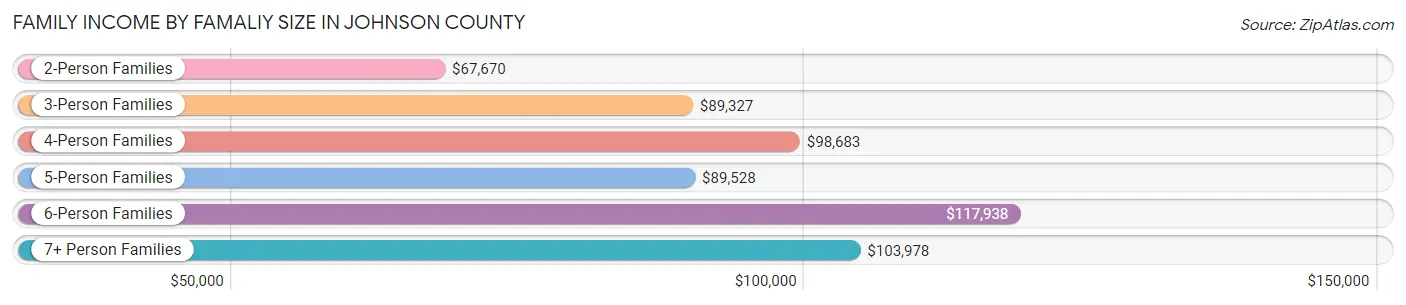
| Income Bracket | # Families | Median Income |
| 2-Person Families | 6,234 (48.2%) | $67,670 |
| 3-Person Families | 2,753 (21.3%) | $89,327 |
| 4-Person Families | 2,209 (17.1%) | $98,683 |
| 5-Person Families | 1,065 (8.2%) | $89,528 |
| 6-Person Families | 375 (2.9%) | $117,938 |
| 7+ Person Families | 304 (2.4%) | $103,978 |
| Total | 12,940 (100.0%) | $80,979 |
Family Income by Number of Earners in Johnson County
The median family income in Johnson County is $80,979, with families comprising 3+ earners (1,533) having the highest median family income of $123,640, while families with no earners (1,725) have the lowest median family income of $48,234, accounting for 11.8% and 13.3% of families, respectively.
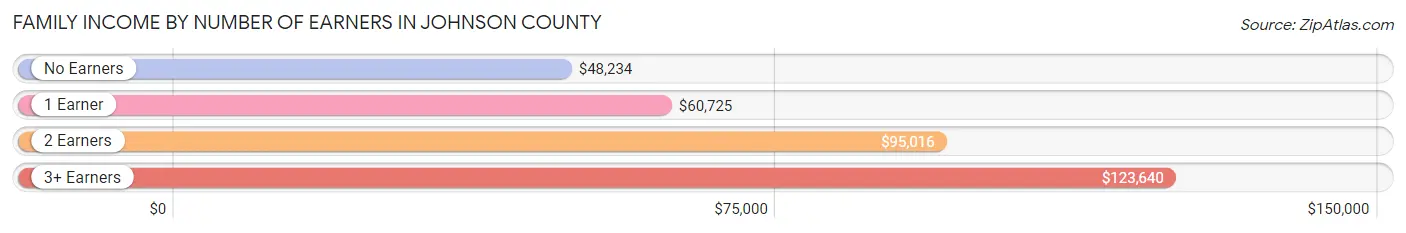
| Number of Earners | # Families | Median Income |
| No Earners | 1,725 (13.3%) | $48,234 |
| 1 Earner | 3,975 (30.7%) | $60,725 |
| 2 Earners | 5,707 (44.1%) | $95,016 |
| 3+ Earners | 1,533 (11.8%) | $123,640 |
| Total | 12,940 (100.0%) | $80,979 |
Household Income in Johnson County
Household Income Brackets in Johnson County
With 4,659 households falling in the category, the $50,000 to $74,999 income range is the most frequent in Johnson County, accounting for 22.6% of all households. In contrast, only 639 households (3.1%) fall into the $10,000 to $14,999 income bracket, making it the least populous group.
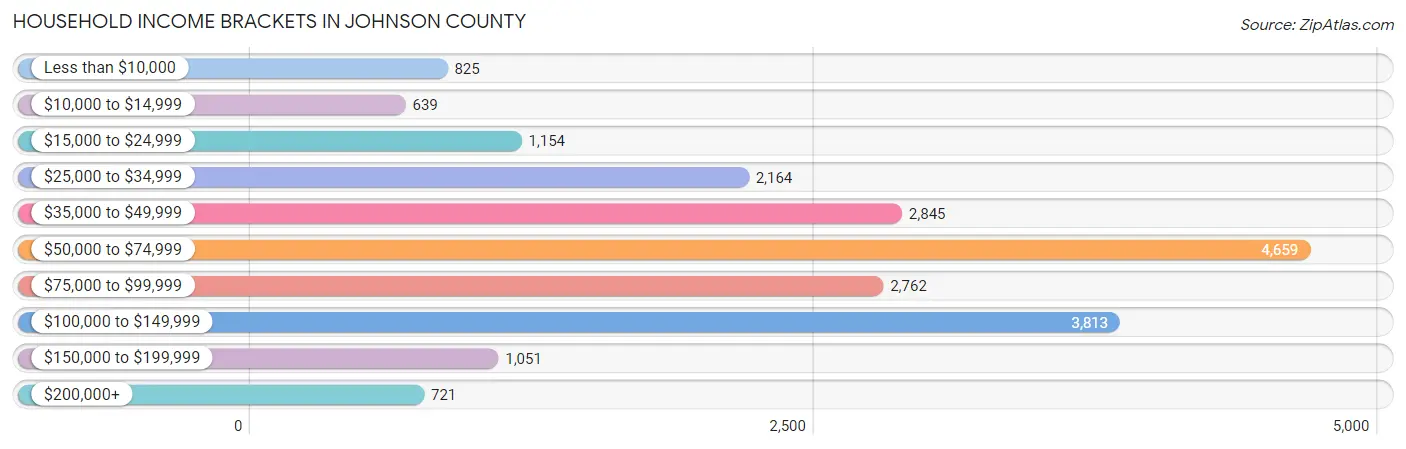
| Income Bracket | # Households | % Households |
| Less than $10,000 | 825 | 4.0% |
| $10,000 to $14,999 | 639 | 3.1% |
| $15,000 to $24,999 | 1,154 | 5.6% |
| $25,000 to $34,999 | 2,164 | 10.5% |
| $35,000 to $49,999 | 2,845 | 13.8% |
| $50,000 to $74,999 | 4,659 | 22.6% |
| $75,000 to $99,999 | 2,762 | 13.4% |
| $100,000 to $149,999 | 3,813 | 18.5% |
| $150,000 to $199,999 | 1,051 | 5.1% |
| $200,000+ | 721 | 3.5% |
Household Income by Householder Age in Johnson County
The median household income in Johnson County is $62,503, with the highest median household income of $86,786 found in the 45 to 64 years age bracket for the primary householder. A total of 6,530 households (31.7%) fall into this category. Meanwhile, the 15 to 24 years age bracket for the primary householder has the lowest median household income of $34,791, with 3,186 households (15.5%) in this group.
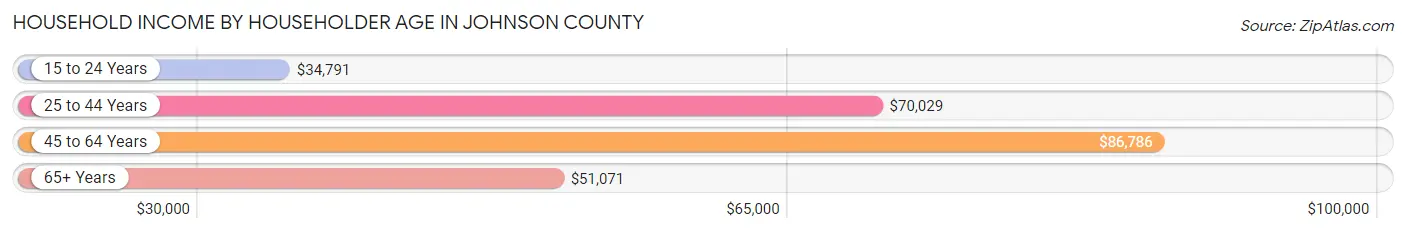
| Income Bracket | # Households | Median Income |
| 15 to 24 Years | 3,186 (15.5%) | $34,791 |
| 25 to 44 Years | 6,801 (33.0%) | $70,029 |
| 45 to 64 Years | 6,530 (31.7%) | $86,786 |
| 65+ Years | 4,096 (19.9%) | $51,071 |
| Total | 20,613 (100.0%) | $62,503 |
Poverty in Johnson County
Income Below Poverty by Sex and Age in Johnson County
With 10.5% poverty level for males and 14.1% for females among the residents of Johnson County, 18 to 24 year old males and 18 to 24 year old females are the most vulnerable to poverty, with 1,022 males (26.7%) and 1,537 females (41.5%) in their respective age groups living below the poverty level.
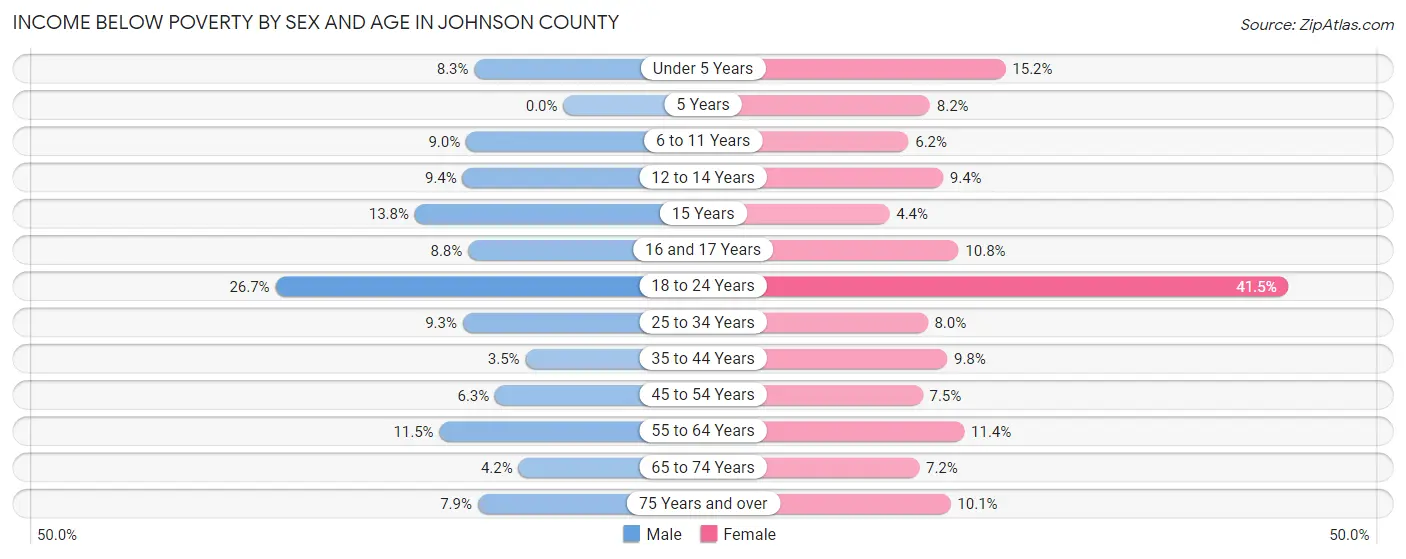
| Age Bracket | Male | Female |
| Under 5 Years | 133 (8.3%) | 245 (15.2%) |
| 5 Years | 0 (0.0%) | 21 (8.2%) |
| 6 to 11 Years | 171 (9.0%) | 106 (6.2%) |
| 12 to 14 Years | 88 (9.3%) | 111 (9.4%) |
| 15 Years | 59 (13.8%) | 9 (4.4%) |
| 16 and 17 Years | 44 (8.8%) | 67 (10.8%) |
| 18 to 24 Years | 1,022 (26.7%) | 1,537 (41.5%) |
| 25 to 34 Years | 363 (9.3%) | 272 (8.0%) |
| 35 to 44 Years | 111 (3.5%) | 287 (9.8%) |
| 45 to 54 Years | 160 (6.3%) | 189 (7.5%) |
| 55 to 64 Years | 331 (11.5%) | 343 (11.4%) |
| 65 to 74 Years | 85 (4.2%) | 138 (7.2%) |
| 75 Years and over | 80 (7.9%) | 143 (10.1%) |
| Total | 2,647 (10.5%) | 3,468 (14.1%) |
Income Above Poverty by Sex and Age in Johnson County
According to the poverty statistics in Johnson County, males aged 5 years and females aged 15 years are the age groups that are most secure financially, with 100.0% of males and 95.6% of females in these age groups living above the poverty line.
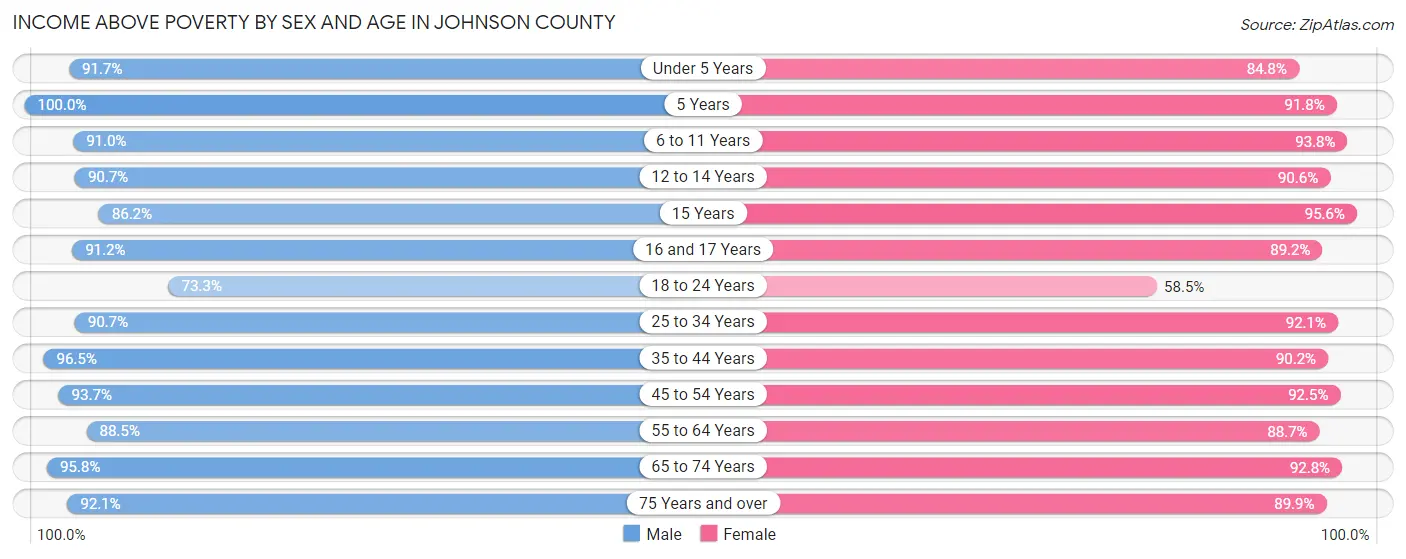
| Age Bracket | Male | Female |
| Under 5 Years | 1,477 (91.7%) | 1,369 (84.8%) |
| 5 Years | 396 (100.0%) | 236 (91.8%) |
| 6 to 11 Years | 1,723 (91.0%) | 1,612 (93.8%) |
| 12 to 14 Years | 853 (90.6%) | 1,073 (90.6%) |
| 15 Years | 369 (86.2%) | 195 (95.6%) |
| 16 and 17 Years | 454 (91.2%) | 552 (89.2%) |
| 18 to 24 Years | 2,803 (73.3%) | 2,170 (58.5%) |
| 25 to 34 Years | 3,528 (90.7%) | 3,151 (92.0%) |
| 35 to 44 Years | 3,041 (96.5%) | 2,650 (90.2%) |
| 45 to 54 Years | 2,366 (93.7%) | 2,333 (92.5%) |
| 55 to 64 Years | 2,548 (88.5%) | 2,678 (88.6%) |
| 65 to 74 Years | 1,957 (95.8%) | 1,788 (92.8%) |
| 75 Years and over | 927 (92.1%) | 1,275 (89.9%) |
| Total | 22,442 (89.4%) | 21,082 (85.9%) |
Income Below Poverty Among Married-Couple Families in Johnson County
The poverty statistics for married-couple families in Johnson County show that 3.7% or 381 of the total 10,233 families live below the poverty line. Families with 5 or more children have the highest poverty rate of 32.8%, comprising of 44 families. On the other hand, families with 3 or 4 children have the lowest poverty rate of 0.3%, which includes 3 families.
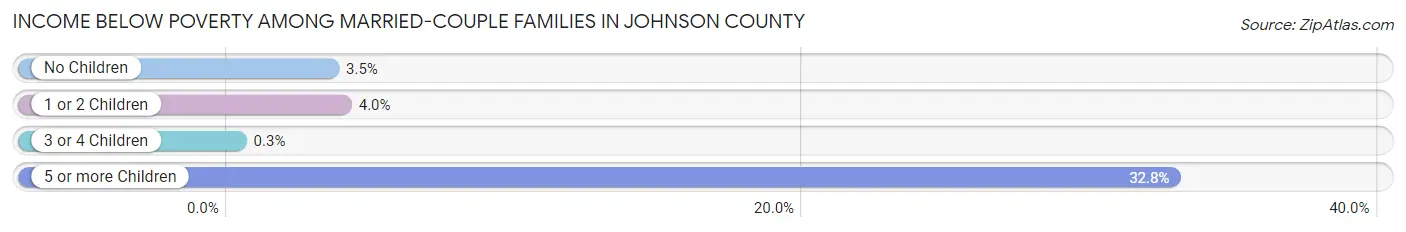
| Children | Above Poverty | Below Poverty |
| No Children | 5,624 (96.5%) | 205 (3.5%) |
| 1 or 2 Children | 3,126 (96.0%) | 129 (4.0%) |
| 3 or 4 Children | 1,012 (99.7%) | 3 (0.3%) |
| 5 or more Children | 90 (67.2%) | 44 (32.8%) |
| Total | 9,852 (96.3%) | 381 (3.7%) |
Income Below Poverty Among Single-Parent Households in Johnson County
According to the poverty data in Johnson County, 15.2% or 166 single-father households and 20.3% or 327 single-mother households are living below the poverty line. Among single-father households, those with no children have the highest poverty rate, with 95 households (24.1%) experiencing poverty. Likewise, among single-mother households, those with 1 or 2 children have the highest poverty rate, with 211 households (26.4%) falling below the poverty line.
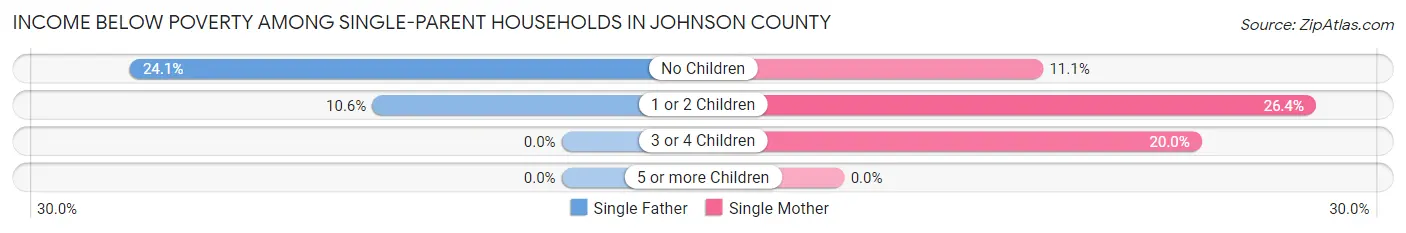
| Children | Single Father | Single Mother |
| No Children | 95 (24.1%) | 58 (11.1%) |
| 1 or 2 Children | 71 (10.6%) | 211 (26.4%) |
| 3 or 4 Children | 0 (0.0%) | 58 (20.0%) |
| 5 or more Children | 0 (0.0%) | 0 (0.0%) |
| Total | 166 (15.2%) | 327 (20.3%) |
Income Below Poverty Among Married-Couple vs Single-Parent Households in Johnson County
The poverty data for Johnson County shows that 381 of the married-couple family households (3.7%) and 493 of the single-parent households (18.2%) are living below the poverty level. Within the married-couple family households, those with 5 or more children have the highest poverty rate, with 44 households (32.8%) falling below the poverty line. Among the single-parent households, those with 1 or 2 children have the highest poverty rate, with 282 household (19.2%) living below poverty.
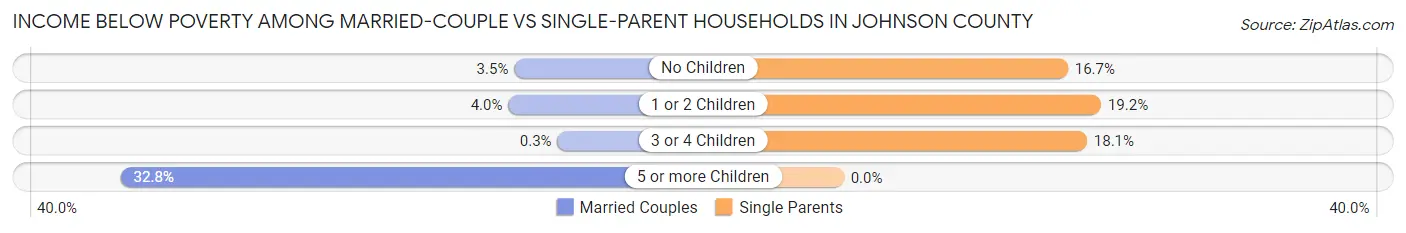
| Children | Married-Couple Families | Single-Parent Households |
| No Children | 205 (3.5%) | 153 (16.7%) |
| 1 or 2 Children | 129 (4.0%) | 282 (19.2%) |
| 3 or 4 Children | 3 (0.3%) | 58 (18.1%) |
| 5 or more Children | 44 (32.8%) | 0 (0.0%) |
| Total | 381 (3.7%) | 493 (18.2%) |
Race in Johnson County
The most populous races in Johnson County are White / Caucasian (46,867 | 86.8%), Two or more Races (3,415 | 6.3%), and Hispanic or Latino (2,721 | 5.0%).
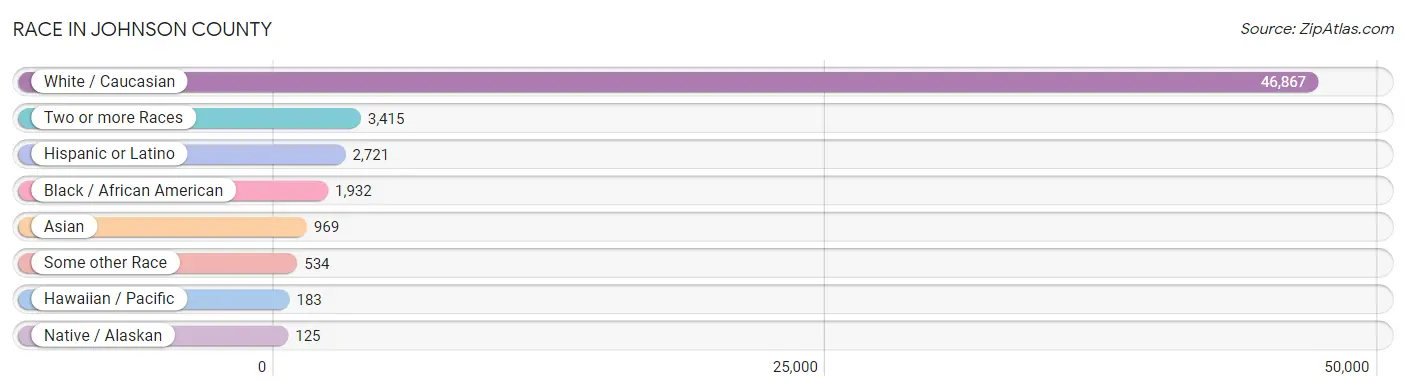
| Race | # Population | % Population |
| Asian | 969 | 1.8% |
| Black / African American | 1,932 | 3.6% |
| Hawaiian / Pacific | 183 | 0.3% |
| Hispanic or Latino | 2,721 | 5.0% |
| Native / Alaskan | 125 | 0.2% |
| White / Caucasian | 46,867 | 86.8% |
| Two or more Races | 3,415 | 6.3% |
| Some other Race | 534 | 1.0% |
| Total | 54,025 | 100.0% |
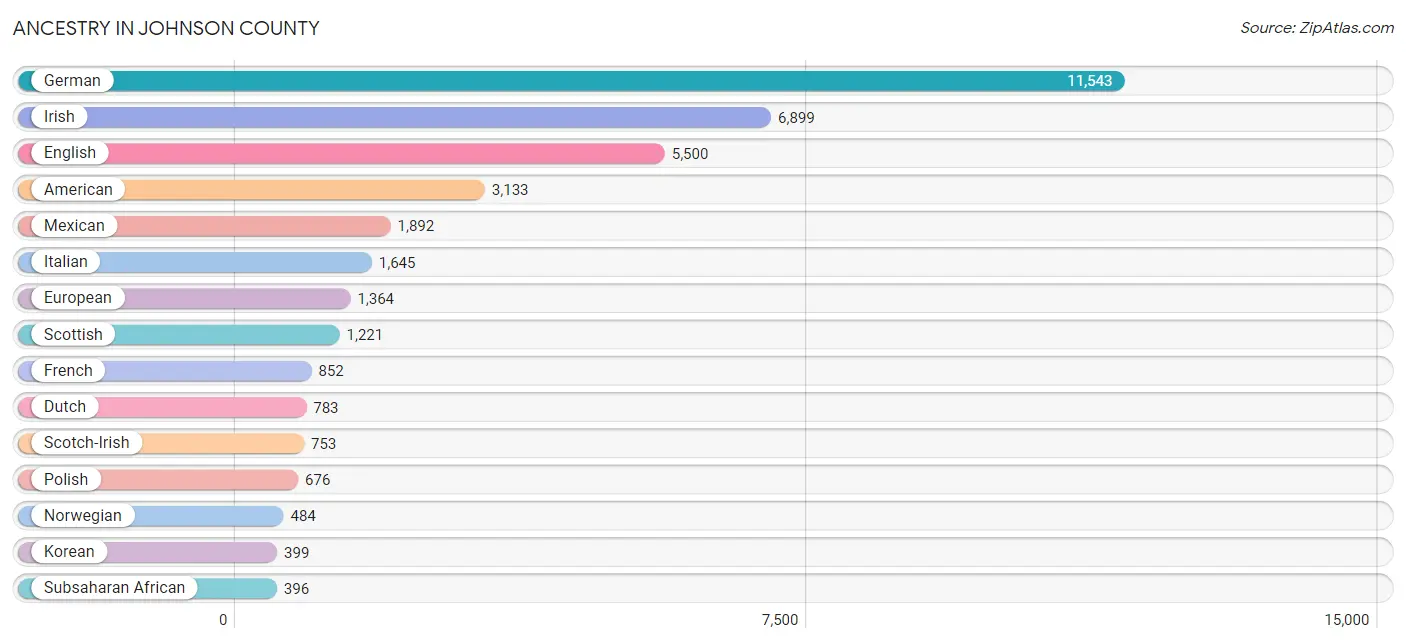
Ancestry in Johnson County
The most populous ancestries reported in Johnson County are German (11,543 | 21.4%), Irish (6,899 | 12.8%), English (5,500 | 10.2%), American (3,133 | 5.8%), and Mexican (1,892 | 3.5%), together accounting for 53.6% of all Johnson County residents.
| Ancestry | # Population | % Population |
| African | 116 | 0.2% |
| American | 3,133 | 5.8% |
| Apache | 3 | 0.0% |
| Arab | 92 | 0.2% |
| Belgian | 18 | 0.0% |
| Bhutanese | 79 | 0.2% |
| Blackfeet | 98 | 0.2% |
| British | 211 | 0.4% |
| Bulgarian | 6 | 0.0% |
| Burmese | 361 | 0.7% |
| Canadian | 14 | 0.0% |
| Carpatho Rusyn | 14 | 0.0% |
| Celtic | 5 | 0.0% |
| Central American | 42 | 0.1% |
| Central American Indian | 7 | 0.0% |
| Cherokee | 240 | 0.4% |
| Chickasaw | 33 | 0.1% |
| Chilean | 22 | 0.0% |
| Chippewa | 31 | 0.1% |
| Choctaw | 66 | 0.1% |
| Colombian | 29 | 0.1% |
| Creek | 1 | 0.0% |
| Croatian | 76 | 0.1% |
| Cuban | 15 | 0.0% |
| Czech | 264 | 0.5% |
| Czechoslovakian | 37 | 0.1% |
| Danish | 57 | 0.1% |
| Dominican | 16 | 0.0% |
| Dutch | 783 | 1.5% |
| Eastern European | 20 | 0.0% |
| Ecuadorian | 28 | 0.1% |
| English | 5,500 | 10.2% |
| Ethiopian | 15 | 0.0% |
| European | 1,364 | 2.5% |
| Filipino | 56 | 0.1% |
| Finnish | 7 | 0.0% |
| French | 852 | 1.6% |
| French Canadian | 260 | 0.5% |
| German | 11,543 | 21.4% |
| Ghanaian | 16 | 0.0% |
| Greek | 13 | 0.0% |
| Guatemalan | 7 | 0.0% |
| Haitian | 32 | 0.1% |
| Hungarian | 113 | 0.2% |
| Indian (Asian) | 64 | 0.1% |
| Indonesian | 67 | 0.1% |
| Irish | 6,899 | 12.8% |
| Iroquois | 15 | 0.0% |
| Italian | 1,645 | 3.0% |
| Jamaican | 16 | 0.0% |
| Kenyan | 203 | 0.4% |
| Korean | 399 | 0.7% |
| Latvian | 4 | 0.0% |
| Lebanese | 22 | 0.0% |
| Lithuanian | 17 | 0.0% |
| Malaysian | 16 | 0.0% |
| Mexican | 1,892 | 3.5% |
| Mexican American Indian | 3 | 0.0% |
| Native Hawaiian | 14 | 0.0% |
| Navajo | 39 | 0.1% |
| Nicaraguan | 6 | 0.0% |
| Nigerian | 7 | 0.0% |
| Northern European | 28 | 0.1% |
| Norwegian | 484 | 0.9% |
| Osage | 2 | 0.0% |
| Pakistani | 83 | 0.2% |
| Paraguayan | 12 | 0.0% |
| Pennsylvania German | 5 | 0.0% |
| Peruvian | 13 | 0.0% |
| Polish | 676 | 1.3% |
| Portuguese | 53 | 0.1% |
| Pueblo | 4 | 0.0% |
| Puerto Rican | 299 | 0.5% |
| Romanian | 46 | 0.1% |
| Russian | 75 | 0.1% |
| Salvadoran | 29 | 0.1% |
| Samoan | 65 | 0.1% |
| Scandinavian | 125 | 0.2% |
| Scotch-Irish | 753 | 1.4% |
| Scottish | 1,221 | 2.3% |
| Seminole | 14 | 0.0% |
| Serbian | 76 | 0.1% |
| Shoshone | 1 | 0.0% |
| Sioux | 4 | 0.0% |
| Slavic | 3 | 0.0% |
| Slovak | 41 | 0.1% |
| Slovene | 15 | 0.0% |
| South American | 150 | 0.3% |
| Spaniard | 87 | 0.2% |
| Spanish | 214 | 0.4% |
| Sri Lankan | 37 | 0.1% |
| Subsaharan African | 396 | 0.7% |
| Swedish | 341 | 0.6% |
| Swiss | 229 | 0.4% |
| Thai | 248 | 0.5% |
| Ukrainian | 103 | 0.2% |
| Uruguayan | 46 | 0.1% |
| Welsh | 147 | 0.3% |
| Yaqui | 35 | 0.1% | View All 99 Rows |
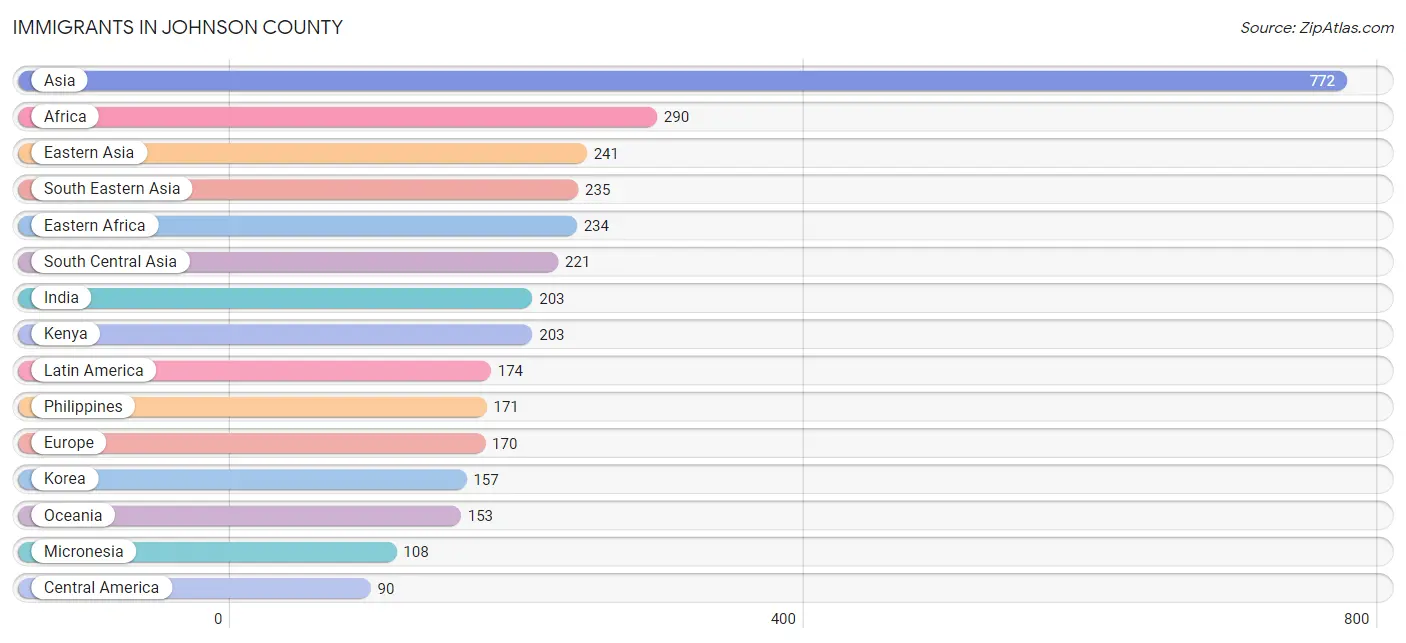
Immigrants in Johnson County
The most numerous immigrant groups reported in Johnson County came from Asia (772 | 1.4%), Africa (290 | 0.5%), Eastern Asia (241 | 0.4%), South Eastern Asia (235 | 0.4%), and Eastern Africa (234 | 0.4%), together accounting for 3.3% of all Johnson County residents.
| Immigration Origin | # Population | % Population |
| Africa | 290 | 0.5% |
| Asia | 772 | 1.4% |
| Canada | 73 | 0.1% |
| Caribbean | 16 | 0.0% |
| Central America | 90 | 0.2% |
| Chile | 22 | 0.0% |
| China | 58 | 0.1% |
| Cuba | 6 | 0.0% |
| Czechoslovakia | 28 | 0.1% |
| Eastern Africa | 234 | 0.4% |
| Eastern Asia | 241 | 0.4% |
| Eastern Europe | 86 | 0.2% |
| Ecuador | 21 | 0.0% |
| El Salvador | 20 | 0.0% |
| England | 9 | 0.0% |
| Ethiopia | 15 | 0.0% |
| Europe | 170 | 0.3% |
| Germany | 19 | 0.0% |
| Ghana | 16 | 0.0% |
| Guatemala | 39 | 0.1% |
| Hungary | 44 | 0.1% |
| India | 203 | 0.4% |
| Jamaica | 10 | 0.0% |
| Japan | 26 | 0.1% |
| Jordan | 15 | 0.0% |
| Kenya | 203 | 0.4% |
| Korea | 157 | 0.3% |
| Latin America | 174 | 0.3% |
| Mexico | 25 | 0.1% |
| Micronesia | 108 | 0.2% |
| Nepal | 18 | 0.0% |
| Nicaragua | 6 | 0.0% |
| Northern Europe | 22 | 0.0% |
| Oceania | 153 | 0.3% |
| Peru | 13 | 0.0% |
| Philippines | 171 | 0.3% |
| Saudi Arabia | 60 | 0.1% |
| South America | 68 | 0.1% |
| South Central Asia | 221 | 0.4% |
| South Eastern Asia | 235 | 0.4% |
| Southern Europe | 43 | 0.1% |
| Spain | 43 | 0.1% |
| Thailand | 8 | 0.0% |
| Ukraine | 14 | 0.0% |
| Vietnam | 21 | 0.0% |
| Western Africa | 50 | 0.1% |
| Western Asia | 75 | 0.1% |
| Western Europe | 19 | 0.0% |
| Zimbabwe | 16 | 0.0% | View All 49 Rows |
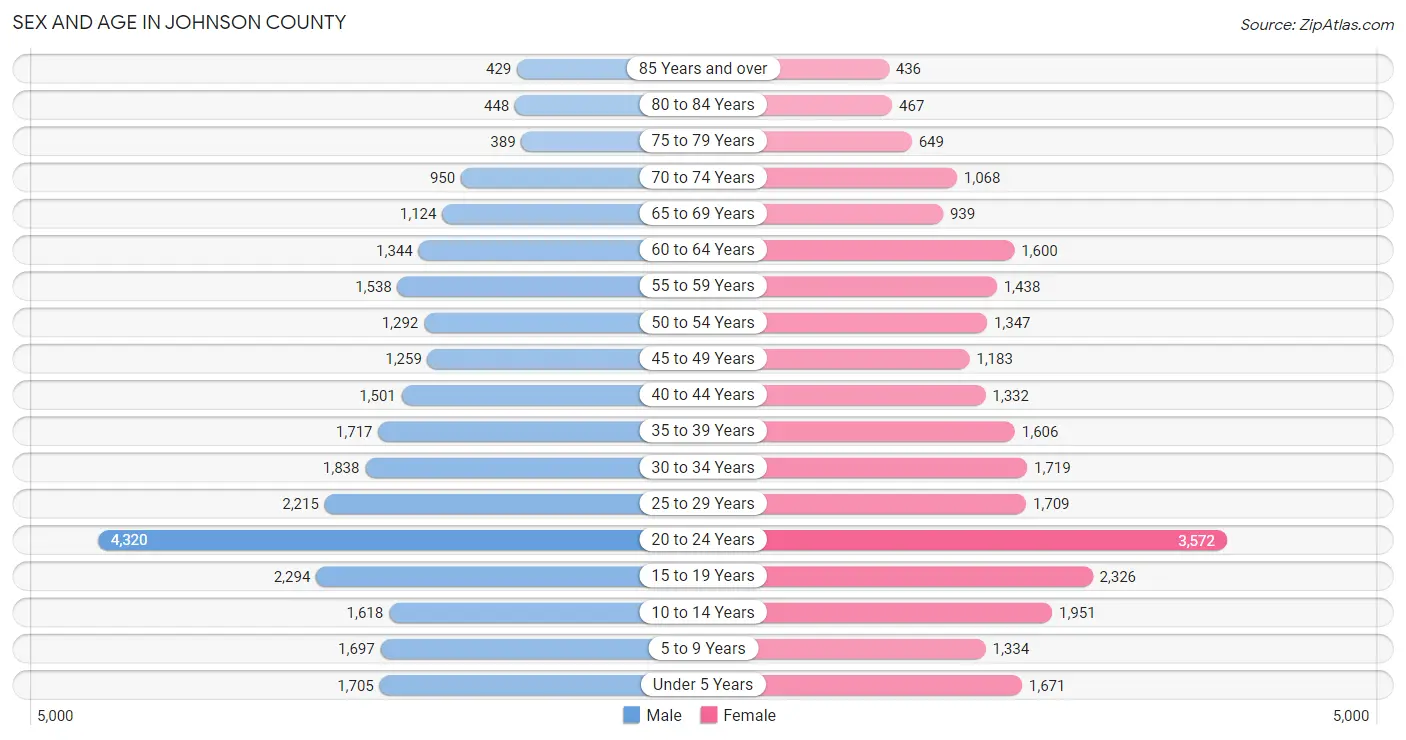
Sex and Age in Johnson County
Sex and Age in Johnson County
The most populous age groups in Johnson County are 20 to 24 Years (4,320 | 15.6%) for men and 20 to 24 Years (3,572 | 13.6%) for women.
| Age Bracket | Male | Female |
| Under 5 Years | 1,705 (6.2%) | 1,671 (6.3%) |
| 5 to 9 Years | 1,697 (6.1%) | 1,334 (5.1%) |
| 10 to 14 Years | 1,618 (5.9%) | 1,951 (7.4%) |
| 15 to 19 Years | 2,294 (8.3%) | 2,326 (8.8%) |
| 20 to 24 Years | 4,320 (15.6%) | 3,572 (13.6%) |
| 25 to 29 Years | 2,215 (8.0%) | 1,709 (6.5%) |
| 30 to 34 Years | 1,838 (6.6%) | 1,719 (6.5%) |
| 35 to 39 Years | 1,717 (6.2%) | 1,606 (6.1%) |
| 40 to 44 Years | 1,501 (5.4%) | 1,332 (5.1%) |
| 45 to 49 Years | 1,259 (4.5%) | 1,183 (4.5%) |
| 50 to 54 Years | 1,292 (4.7%) | 1,347 (5.1%) |
| 55 to 59 Years | 1,538 (5.6%) | 1,438 (5.5%) |
| 60 to 64 Years | 1,344 (4.9%) | 1,600 (6.1%) |
| 65 to 69 Years | 1,124 (4.1%) | 939 (3.6%) |
| 70 to 74 Years | 950 (3.4%) | 1,068 (4.1%) |
| 75 to 79 Years | 389 (1.4%) | 649 (2.5%) |
| 80 to 84 Years | 448 (1.6%) | 467 (1.8%) |
| 85 Years and over | 429 (1.5%) | 436 (1.7%) |
| Total | 27,678 (100.0%) | 26,347 (100.0%) |
Families and Households in Johnson County
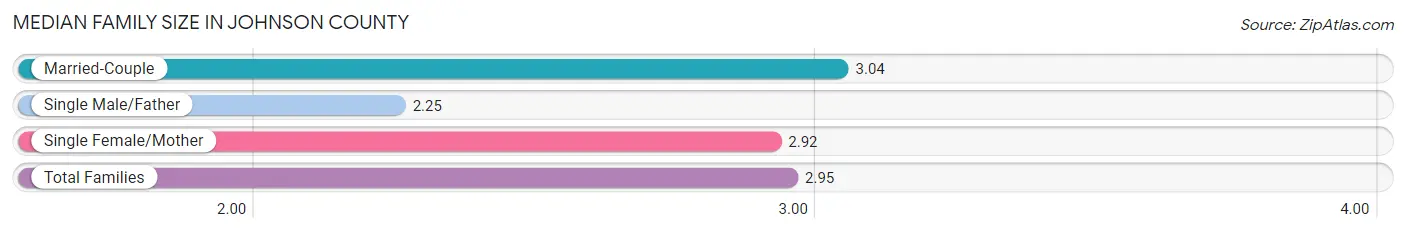
Median Family Size in Johnson County
The median family size in Johnson County is 2.95 persons per family, with married-couple families (10,233 | 79.1%) accounting for the largest median family size of 3.04 persons per family. On the other hand, single male/father families (1,095 | 8.5%) represent the smallest median family size with 2.25 persons per family.
| Family Type | # Families | Family Size |
| Married-Couple | 10,233 (79.1%) | 3.04 |
| Single Male/Father | 1,095 (8.5%) | 2.25 |
| Single Female/Mother | 1,612 (12.5%) | 2.92 |
| Total Families | 12,940 (100.0%) | 2.95 |
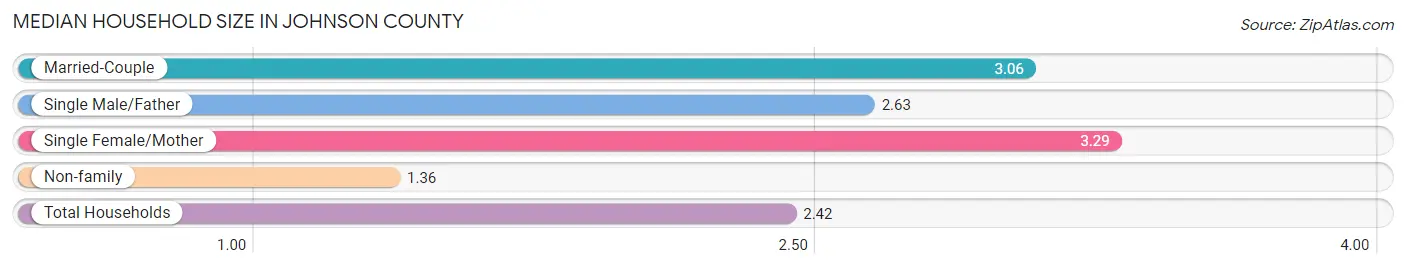
Median Household Size in Johnson County
The median household size in Johnson County is 2.42 persons per household, with single female/mother households (1,612 | 7.8%) accounting for the largest median household size of 3.29 persons per household. non-family households (7,673 | 37.2%) represent the smallest median household size with 1.36 persons per household.
| Household Type | # Households | Household Size |
| Married-Couple | 10,233 (49.6%) | 3.06 |
| Single Male/Father | 1,095 (5.3%) | 2.63 |
| Single Female/Mother | 1,612 (7.8%) | 3.29 |
| Non-family | 7,673 (37.2%) | 1.36 |
| Total Households | 20,613 (100.0%) | 2.42 |
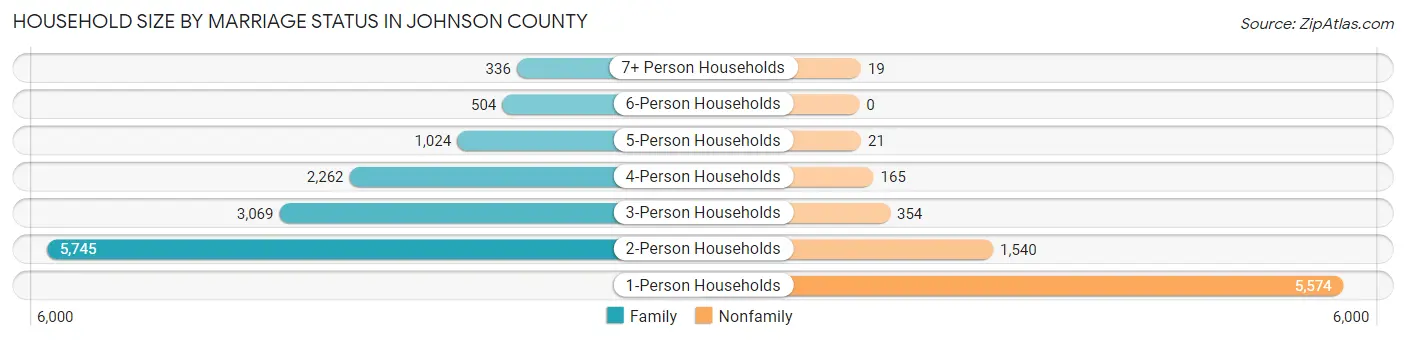
Household Size by Marriage Status in Johnson County
Out of a total of 20,613 households in Johnson County, 12,940 (62.8%) are family households, while 7,673 (37.2%) are nonfamily households. The most numerous type of family households are 2-person households, comprising 5,745, and the most common type of nonfamily households are 1-person households, comprising 5,574.
| Household Size | Family Households | Nonfamily Households |
| 1-Person Households | - | 5,574 (27.0%) |
| 2-Person Households | 5,745 (27.9%) | 1,540 (7.5%) |
| 3-Person Households | 3,069 (14.9%) | 354 (1.7%) |
| 4-Person Households | 2,262 (11.0%) | 165 (0.8%) |
| 5-Person Households | 1,024 (5.0%) | 21 (0.1%) |
| 6-Person Households | 504 (2.5%) | 0 (0.0%) |
| 7+ Person Households | 336 (1.6%) | 19 (0.1%) |
| Total | 12,940 (62.8%) | 7,673 (37.2%) |
Female Fertility in Johnson County
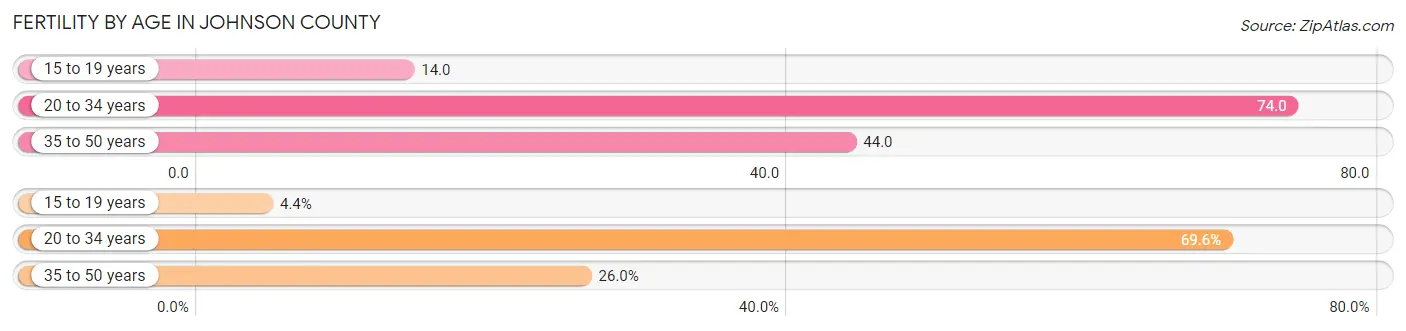
Fertility by Age in Johnson County
Average fertility rate in Johnson County is 54.0 births per 1,000 women. Women in the age bracket of 20 to 34 years have the highest fertility rate with 74.0 births per 1,000 women. Women in the age bracket of 20 to 34 years acount for 69.6% of all women with births.
| Age Bracket | Women with Births | Births / 1,000 Women |
| 15 to 19 years | 33 (4.4%) | 14.0 |
| 20 to 34 years | 521 (69.6%) | 74.0 |
| 35 to 50 years | 195 (26.0%) | 44.0 |
| Total | 749 (100.0%) | 54.0 |
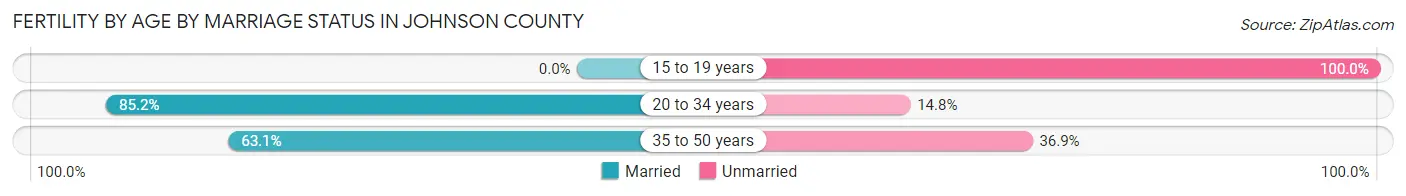
Fertility by Age by Marriage Status in Johnson County
75.7% of women with births (749) in Johnson County are married. The highest percentage of unmarried women with births falls into 15 to 19 years age bracket with 100.0% of them unmarried at the time of birth, while the lowest percentage of unmarried women with births belong to 20 to 34 years age bracket with 14.8% of them unmarried.
| Age Bracket | Married | Unmarried |
| 15 to 19 years | 0 (0.0%) | 33 (100.0%) |
| 20 to 34 years | 444 (85.2%) | 77 (14.8%) |
| 35 to 50 years | 123 (63.1%) | 72 (36.9%) |
| Total | 567 (75.7%) | 182 (24.3%) |
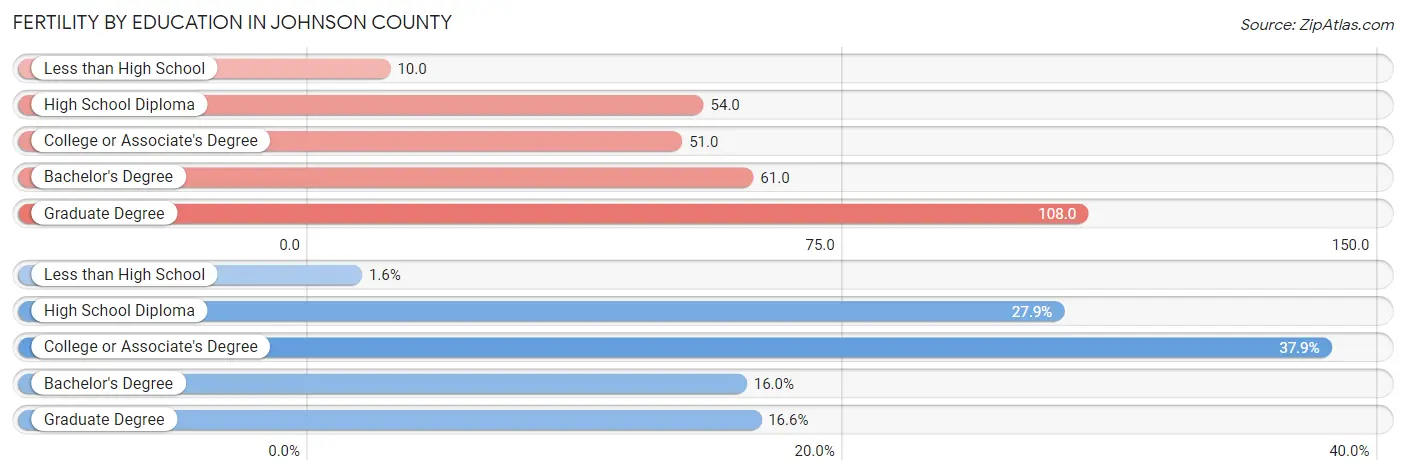
Fertility by Education in Johnson County
Average fertility rate in Johnson County is 54.0 births per 1,000 women. Women with the education attainment of graduate degree have the highest fertility rate of 108.0 births per 1,000 women, while women with the education attainment of less than high school have the lowest fertility at 10.0 births per 1,000 women. Women with the education attainment of college or associate's degree represent 37.9% of all women with births.
| Educational Attainment | Women with Births | Births / 1,000 Women |
| Less than High School | 12 (1.6%) | 10.0 |
| High School Diploma | 209 (27.9%) | 54.0 |
| College or Associate's Degree | 284 (37.9%) | 51.0 |
| Bachelor's Degree | 120 (16.0%) | 61.0 |
| Graduate Degree | 124 (16.6%) | 108.0 |
| Total | 749 (100.0%) | 54.0 |
Fertility by Education by Marriage Status in Johnson County
24.3% of women with births in Johnson County are unmarried. Women with the educational attainment of bachelor's degree are most likely to be married with 100.0% of them married at childbirth, while women with the educational attainment of less than high school are least likely to be married with 100.0% of them unmarried at childbirth.
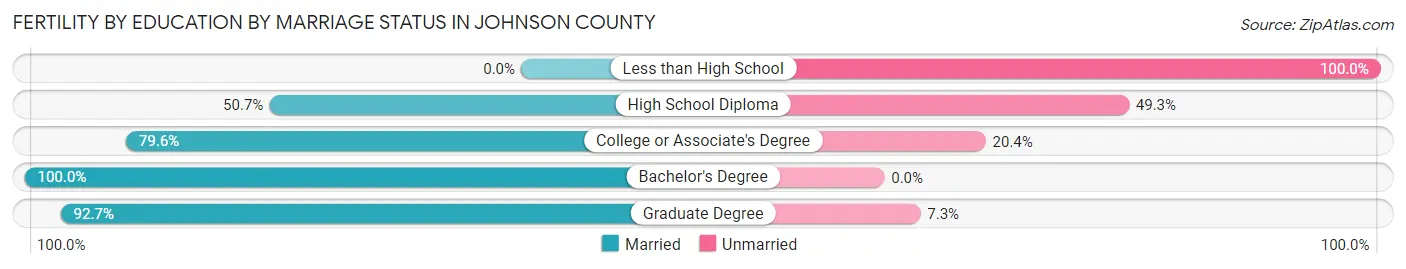
| Educational Attainment | Married | Unmarried |
| Less than High School | 0 (0.0%) | 12 (100.0%) |
| High School Diploma | 106 (50.7%) | 103 (49.3%) |
| College or Associate's Degree | 226 (79.6%) | 58 (20.4%) |
| Bachelor's Degree | 120 (100.0%) | 0 (0.0%) |
| Graduate Degree | 115 (92.7%) | 9 (7.3%) |
| Total | 567 (75.7%) | 182 (24.3%) |
Employment Characteristics in Johnson County
Employment by Class of Employer in Johnson County
Among the 26,671 employed individuals in Johnson County, private company employees (14,083 | 52.8%), federal government employees (5,100 | 19.1%), and local government employees (2,085 | 7.8%) make up the most common classes of employment.
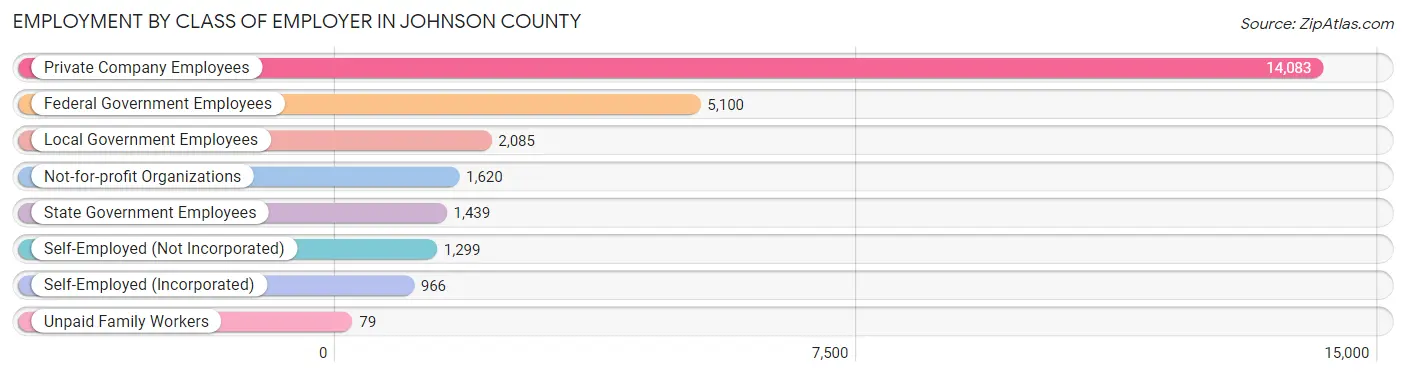
| Employer Class | # Employees | % Employees |
| Private Company Employees | 14,083 | 52.8% |
| Self-Employed (Incorporated) | 966 | 3.6% |
| Self-Employed (Not Incorporated) | 1,299 | 4.9% |
| Not-for-profit Organizations | 1,620 | 6.1% |
| Local Government Employees | 2,085 | 7.8% |
| State Government Employees | 1,439 | 5.4% |
| Federal Government Employees | 5,100 | 19.1% |
| Unpaid Family Workers | 79 | 0.3% |
| Total | 26,671 | 100.0% |
Employment Status by Age in Johnson County
According to the labor force statistics for Johnson County, out of the total population over 16 years of age (43,416), 65.8% or 28,568 individuals are in the labor force, with 4.8% or 1,371 of them unemployed. The age group with the highest labor force participation rate is 20 to 24 years, with 84.7% or 6,685 individuals in the labor force. Within the labor force, the 16 to 19 years age range has the highest percentage of unemployed individuals, with 17.2% or 287 of them being unemployed.
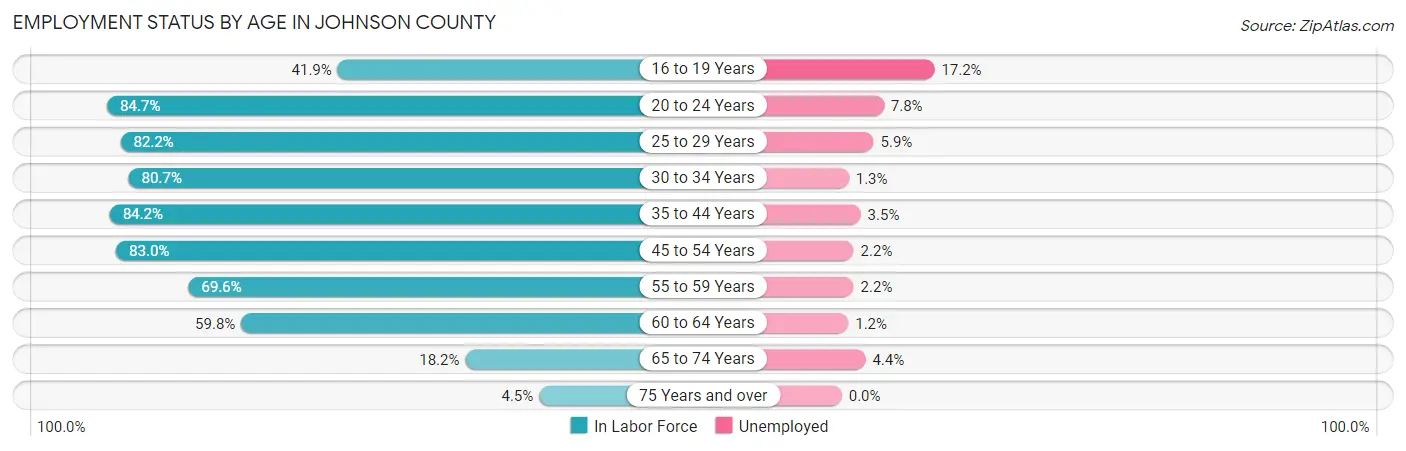
| Age Bracket | In Labor Force | Unemployed |
| 16 to 19 Years | 1,671 (41.9%) | 287 (17.2%) |
| 20 to 24 Years | 6,685 (84.7%) | 521 (7.8%) |
| 25 to 29 Years | 3,226 (82.2%) | 190 (5.9%) |
| 30 to 34 Years | 2,870 (80.7%) | 37 (1.3%) |
| 35 to 44 Years | 5,183 (84.2%) | 181 (3.5%) |
| 45 to 54 Years | 4,217 (83.0%) | 93 (2.2%) |
| 55 to 59 Years | 2,071 (69.6%) | 46 (2.2%) |
| 60 to 64 Years | 1,761 (59.8%) | 21 (1.2%) |
| 65 to 74 Years | 743 (18.2%) | 33 (4.4%) |
| 75 Years and over | 127 (4.5%) | 0 (0.0%) |
| Total | 28,568 (65.8%) | 1,371 (4.8%) |
Employment Status by Educational Attainment in Johnson County
According to labor force statistics for Johnson County, 78.4% of individuals (19,316) out of the total population between 25 and 64 years of age (24,638) are in the labor force, with 2.8% or 541 of them being unemployed. The group with the highest labor force participation rate are those with the educational attainment of bachelor's degree or higher, with 89.2% or 6,347 individuals in the labor force. Within the labor force, individuals with less than high school education have the highest percentage of unemployment, with 5.1% or 47 of them being unemployed.
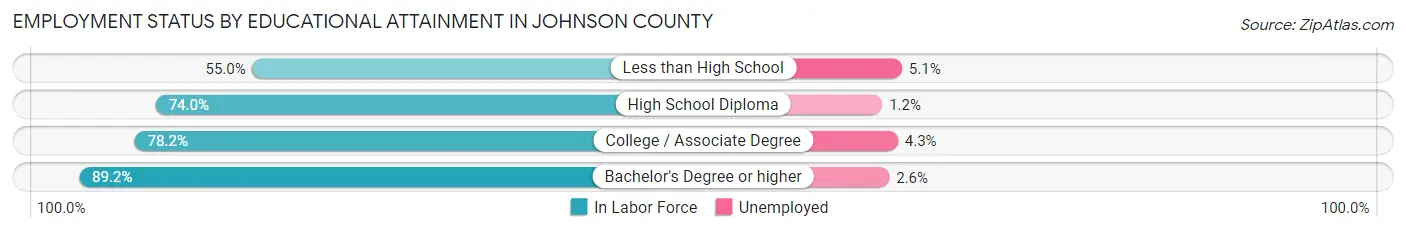
| Educational Attainment | In Labor Force | Unemployed |
| Less than High School | 922 (55.0%) | 86 (5.1%) |
| High School Diploma | 5,856 (74.0%) | 95 (1.2%) |
| College / Associate Degree | 6,202 (78.2%) | 341 (4.3%) |
| Bachelor's Degree or higher | 6,347 (89.2%) | 185 (2.6%) |
| Total | 19,316 (78.4%) | 690 (2.8%) |
Employment Occupations by Sex in Johnson County
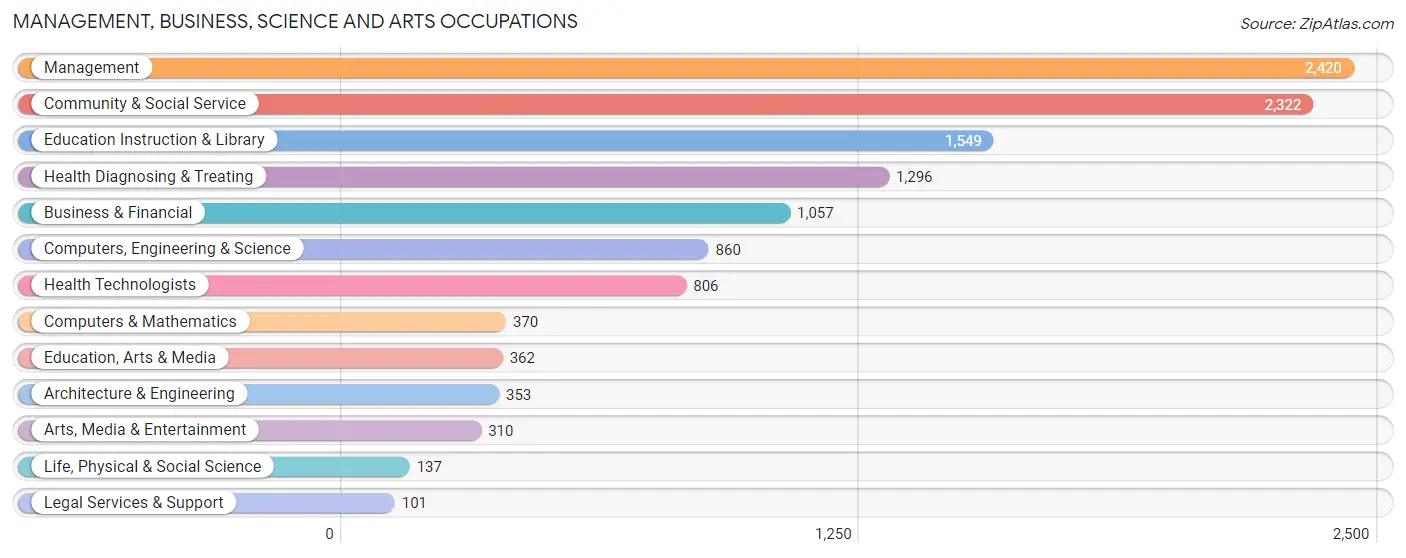
Management, Business, Science and Arts Occupations
The most common Management, Business, Science and Arts occupations in Johnson County are Management (2,420 | 10.1%), Community & Social Service (2,322 | 9.7%), Education Instruction & Library (1,549 | 6.5%), Health Diagnosing & Treating (1,296 | 5.4%), and Business & Financial (1,057 | 4.4%).
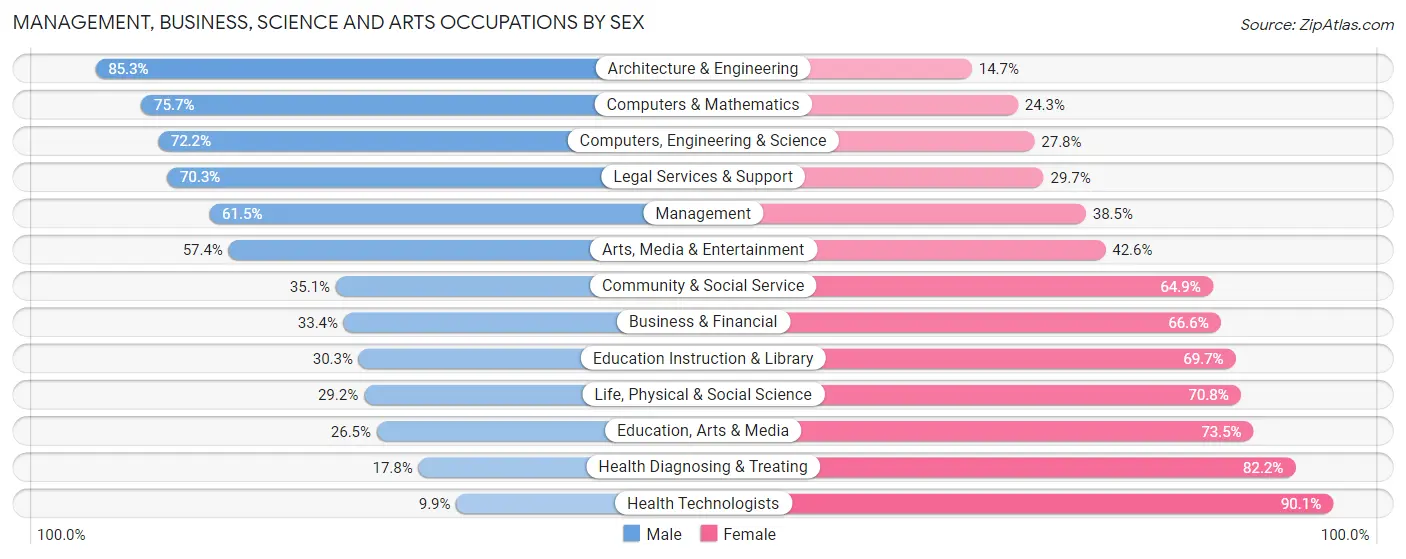
Management, Business, Science and Arts Occupations by Sex
Within the Management, Business, Science and Arts occupations in Johnson County, the most male-oriented occupations are Architecture & Engineering (85.3%), Computers & Mathematics (75.7%), and Computers, Engineering & Science (72.2%), while the most female-oriented occupations are Health Technologists (90.1%), Health Diagnosing & Treating (82.2%), and Education, Arts & Media (73.5%).
| Occupation | Male | Female |
| Management | 1,488 (61.5%) | 932 (38.5%) |
| Business & Financial | 353 (33.4%) | 704 (66.6%) |
| Computers, Engineering & Science | 621 (72.2%) | 239 (27.8%) |
| Computers & Mathematics | 280 (75.7%) | 90 (24.3%) |
| Architecture & Engineering | 301 (85.3%) | 52 (14.7%) |
| Life, Physical & Social Science | 40 (29.2%) | 97 (70.8%) |
| Community & Social Service | 814 (35.1%) | 1,508 (64.9%) |
| Education, Arts & Media | 96 (26.5%) | 266 (73.5%) |
| Legal Services & Support | 71 (70.3%) | 30 (29.7%) |
| Education Instruction & Library | 469 (30.3%) | 1,080 (69.7%) |
| Arts, Media & Entertainment | 178 (57.4%) | 132 (42.6%) |
| Health Diagnosing & Treating | 231 (17.8%) | 1,065 (82.2%) |
| Health Technologists | 80 (9.9%) | 726 (90.1%) |
| Total (Category) | 3,507 (44.1%) | 4,448 (55.9%) |
| Total (Overall) | 12,057 (50.3%) | 11,894 (49.7%) |
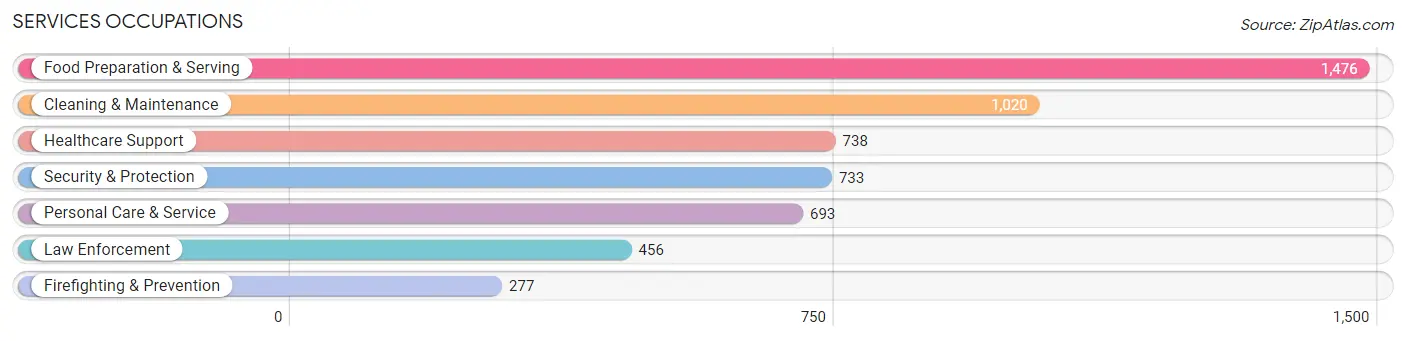
Services Occupations
The most common Services occupations in Johnson County are Food Preparation & Serving (1,476 | 6.2%), Cleaning & Maintenance (1,020 | 4.3%), Healthcare Support (738 | 3.1%), Security & Protection (733 | 3.1%), and Personal Care & Service (693 | 2.9%).
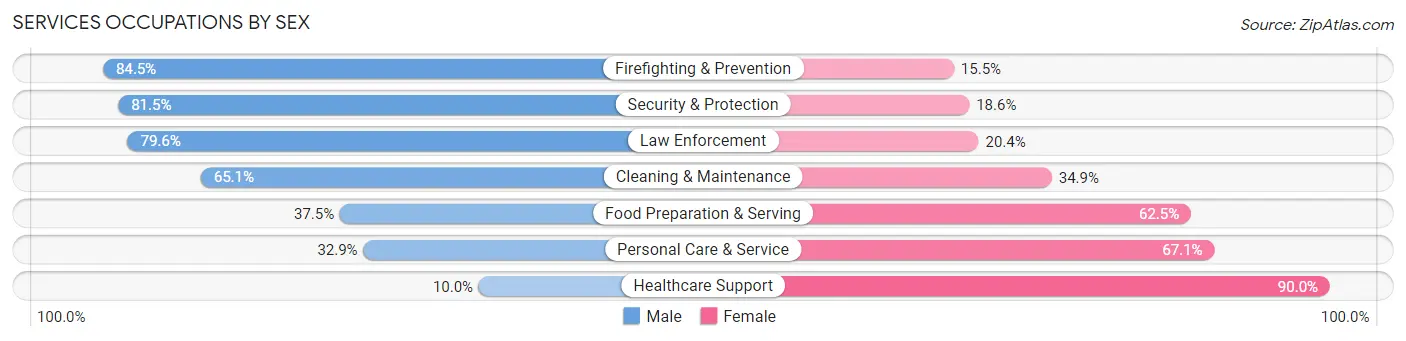
Services Occupations by Sex
Within the Services occupations in Johnson County, the most male-oriented occupations are Firefighting & Prevention (84.5%), Security & Protection (81.5%), and Law Enforcement (79.6%), while the most female-oriented occupations are Healthcare Support (90.0%), Personal Care & Service (67.1%), and Food Preparation & Serving (62.5%).
| Occupation | Male | Female |
| Healthcare Support | 74 (10.0%) | 664 (90.0%) |
| Security & Protection | 597 (81.5%) | 136 (18.5%) |
| Firefighting & Prevention | 234 (84.5%) | 43 (15.5%) |
| Law Enforcement | 363 (79.6%) | 93 (20.4%) |
| Food Preparation & Serving | 554 (37.5%) | 922 (62.5%) |
| Cleaning & Maintenance | 664 (65.1%) | 356 (34.9%) |
| Personal Care & Service | 228 (32.9%) | 465 (67.1%) |
| Total (Category) | 2,117 (45.4%) | 2,543 (54.6%) |
| Total (Overall) | 12,057 (50.3%) | 11,894 (49.7%) |
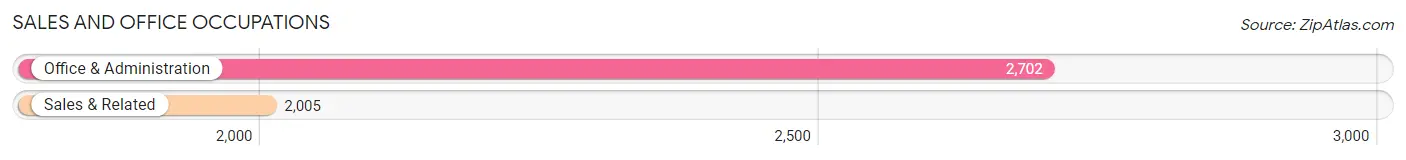
Sales and Office Occupations
The most common Sales and Office occupations in Johnson County are Office & Administration (2,702 | 11.3%), and Sales & Related (2,005 | 8.4%).
Sales and Office Occupations by Sex
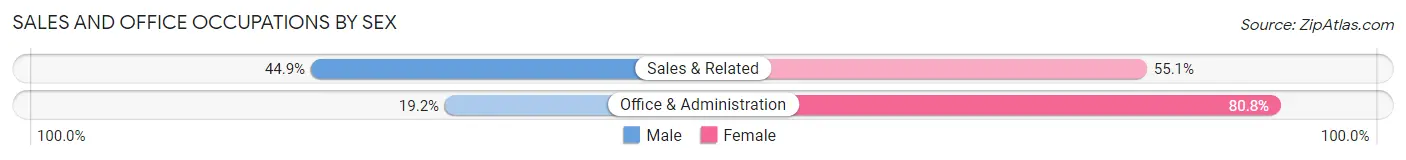
| Occupation | Male | Female |
| Sales & Related | 901 (44.9%) | 1,104 (55.1%) |
| Office & Administration | 518 (19.2%) | 2,184 (80.8%) |
| Total (Category) | 1,419 (30.1%) | 3,288 (69.9%) |
| Total (Overall) | 12,057 (50.3%) | 11,894 (49.7%) |
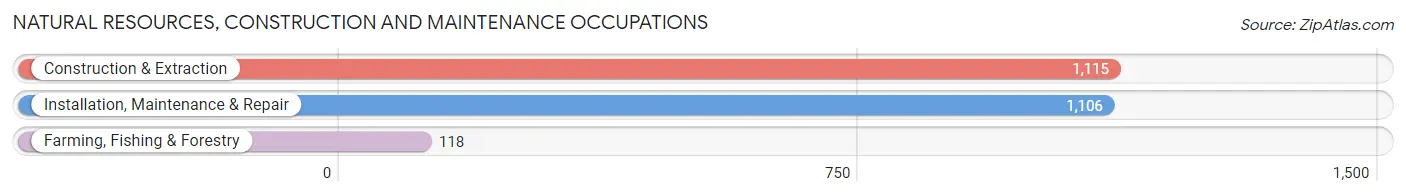
Natural Resources, Construction and Maintenance Occupations
The most common Natural Resources, Construction and Maintenance occupations in Johnson County are Construction & Extraction (1,115 | 4.7%), Installation, Maintenance & Repair (1,106 | 4.6%), and Farming, Fishing & Forestry (118 | 0.5%).
Natural Resources, Construction and Maintenance Occupations by Sex
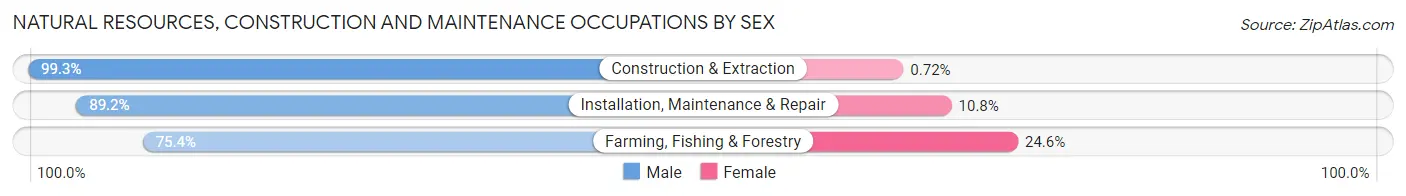
| Occupation | Male | Female |
| Farming, Fishing & Forestry | 89 (75.4%) | 29 (24.6%) |
| Construction & Extraction | 1,107 (99.3%) | 8 (0.7%) |
| Installation, Maintenance & Repair | 987 (89.2%) | 119 (10.8%) |
| Total (Category) | 2,183 (93.3%) | 156 (6.7%) |
| Total (Overall) | 12,057 (50.3%) | 11,894 (49.7%) |
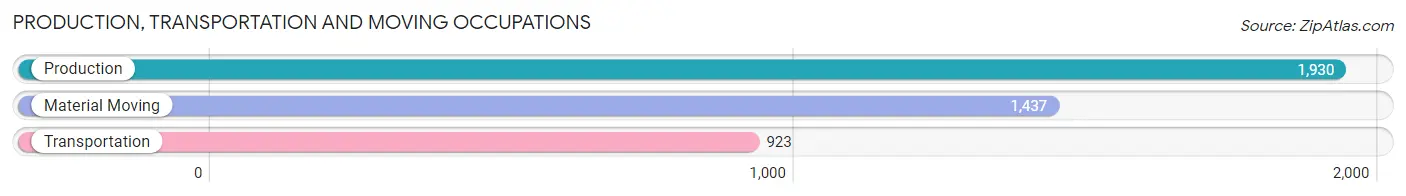
Production, Transportation and Moving Occupations
The most common Production, Transportation and Moving occupations in Johnson County are Production (1,930 | 8.1%), Material Moving (1,437 | 6.0%), and Transportation (923 | 3.8%).
Production, Transportation and Moving Occupations by Sex
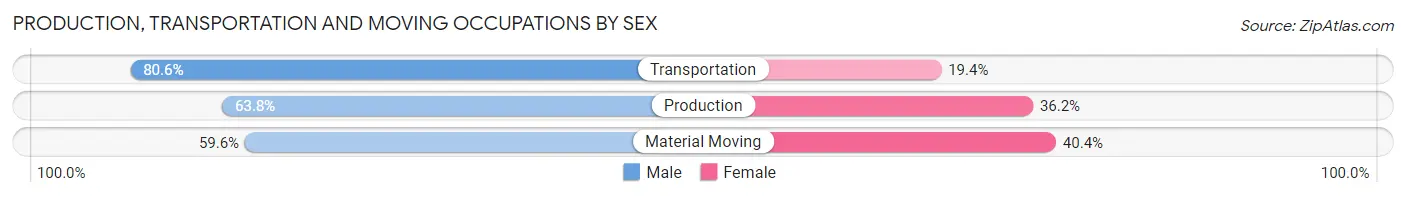
| Occupation | Male | Female |
| Production | 1,231 (63.8%) | 699 (36.2%) |
| Transportation | 744 (80.6%) | 179 (19.4%) |
| Material Moving | 856 (59.6%) | 581 (40.4%) |
| Total (Category) | 2,831 (66.0%) | 1,459 (34.0%) |
| Total (Overall) | 12,057 (50.3%) | 11,894 (49.7%) |
Employment Industries by Sex in Johnson County
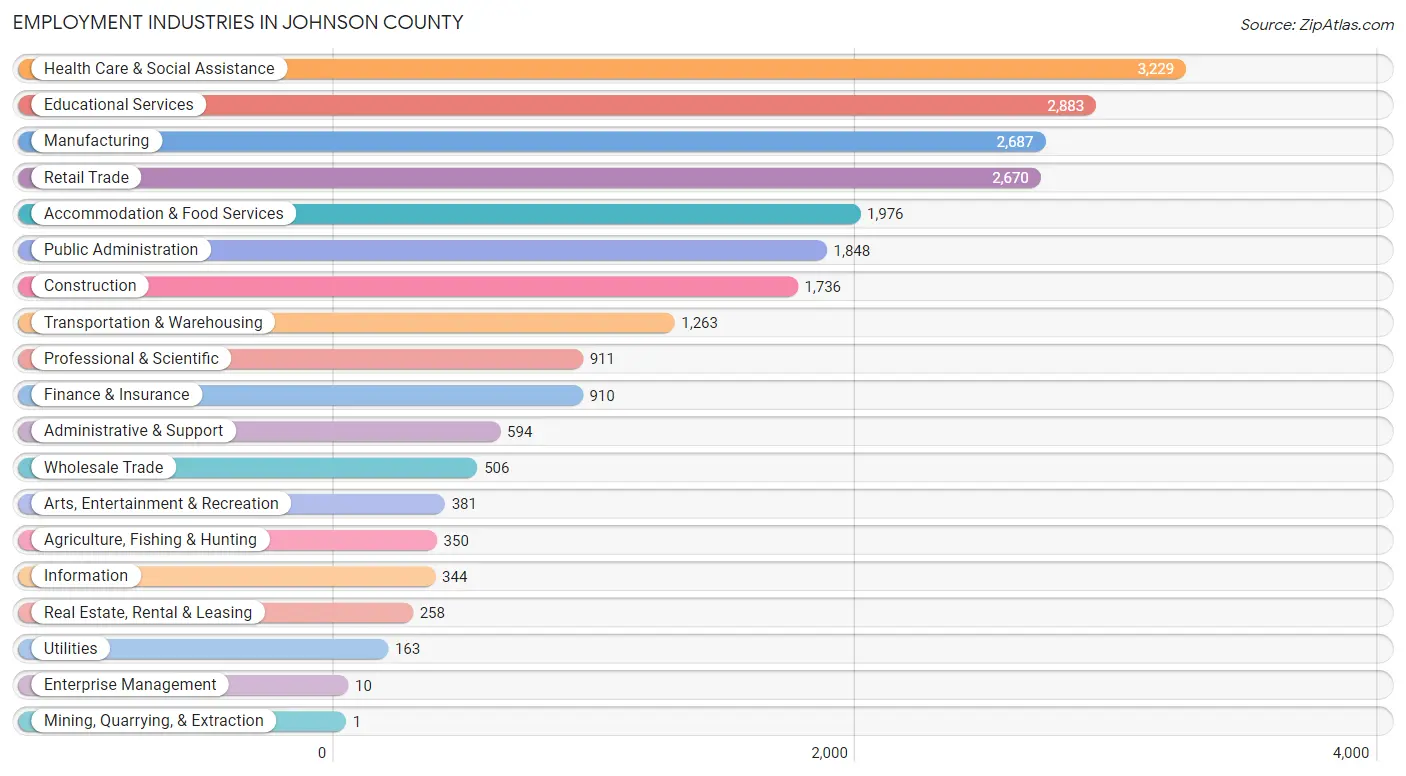
Employment Industries in Johnson County
The major employment industries in Johnson County include Health Care & Social Assistance (3,229 | 13.5%), Educational Services (2,883 | 12.0%), Manufacturing (2,687 | 11.2%), Retail Trade (2,670 | 11.2%), and Accommodation & Food Services (1,976 | 8.3%).
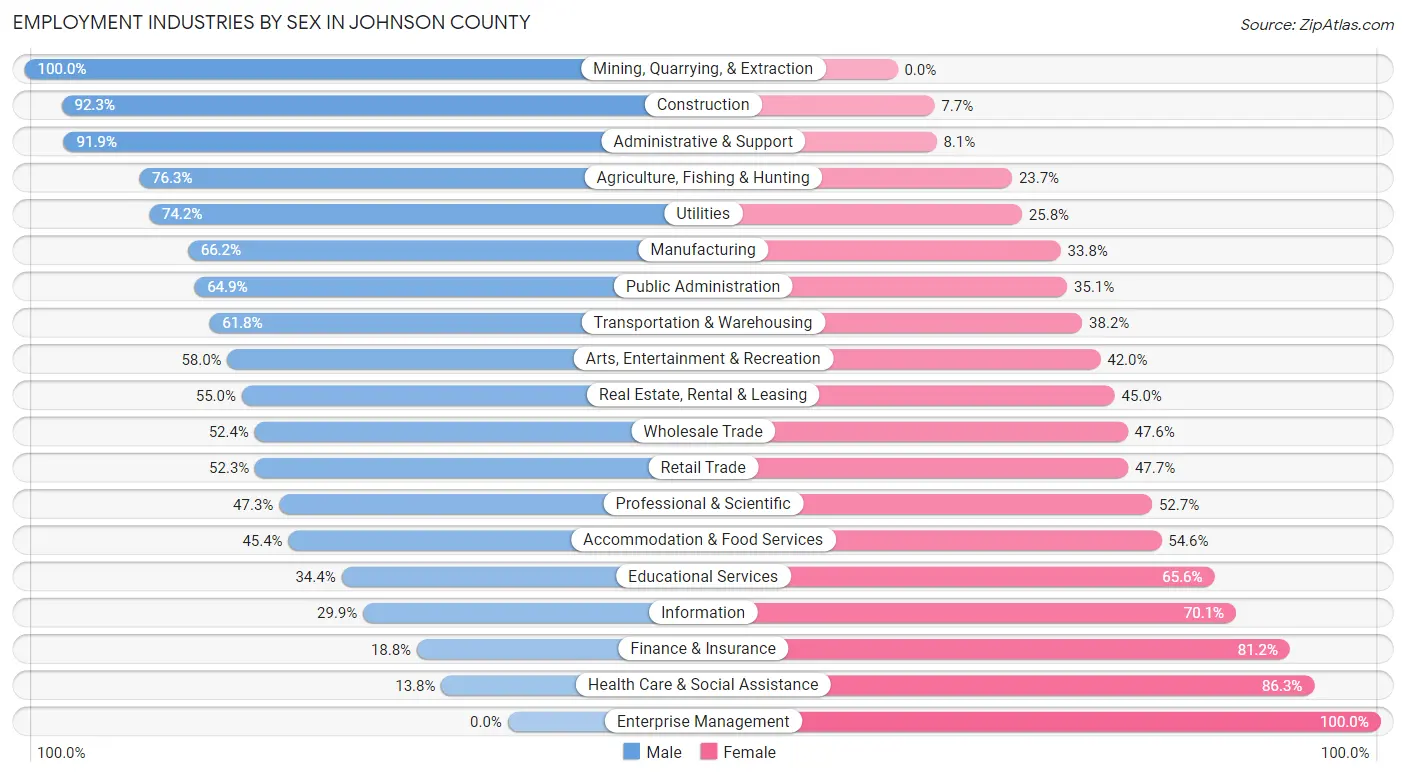
Employment Industries by Sex in Johnson County
The Johnson County industries that see more men than women are Mining, Quarrying, & Extraction (100.0%), Construction (92.3%), and Administrative & Support (91.9%), whereas the industries that tend to have a higher number of women are Enterprise Management (100.0%), Health Care & Social Assistance (86.3%), and Finance & Insurance (81.2%).
| Industry | Male | Female |
| Agriculture, Fishing & Hunting | 267 (76.3%) | 83 (23.7%) |
| Mining, Quarrying, & Extraction | 1 (100.0%) | 0 (0.0%) |
| Construction | 1,603 (92.3%) | 133 (7.7%) |
| Manufacturing | 1,779 (66.2%) | 908 (33.8%) |
| Wholesale Trade | 265 (52.4%) | 241 (47.6%) |
| Retail Trade | 1,396 (52.3%) | 1,274 (47.7%) |
| Transportation & Warehousing | 780 (61.8%) | 483 (38.2%) |
| Utilities | 121 (74.2%) | 42 (25.8%) |
| Information | 103 (29.9%) | 241 (70.1%) |
| Finance & Insurance | 171 (18.8%) | 739 (81.2%) |
| Real Estate, Rental & Leasing | 142 (55.0%) | 116 (45.0%) |
| Professional & Scientific | 431 (47.3%) | 480 (52.7%) |
| Enterprise Management | 0 (0.0%) | 10 (100.0%) |
| Administrative & Support | 546 (91.9%) | 48 (8.1%) |
| Educational Services | 992 (34.4%) | 1,891 (65.6%) |
| Health Care & Social Assistance | 444 (13.8%) | 2,785 (86.3%) |
| Arts, Entertainment & Recreation | 221 (58.0%) | 160 (42.0%) |
| Accommodation & Food Services | 897 (45.4%) | 1,079 (54.6%) |
| Public Administration | 1,199 (64.9%) | 649 (35.1%) |
| Total | 12,057 (50.3%) | 11,894 (49.7%) |
Education in Johnson County
School Enrollment in Johnson County
The most common levels of schooling among the 15,932 students in Johnson County are college / undergraduate (6,475 | 40.6%), middle school (2,670 | 16.8%), and elementary school (2,419 | 15.2%).
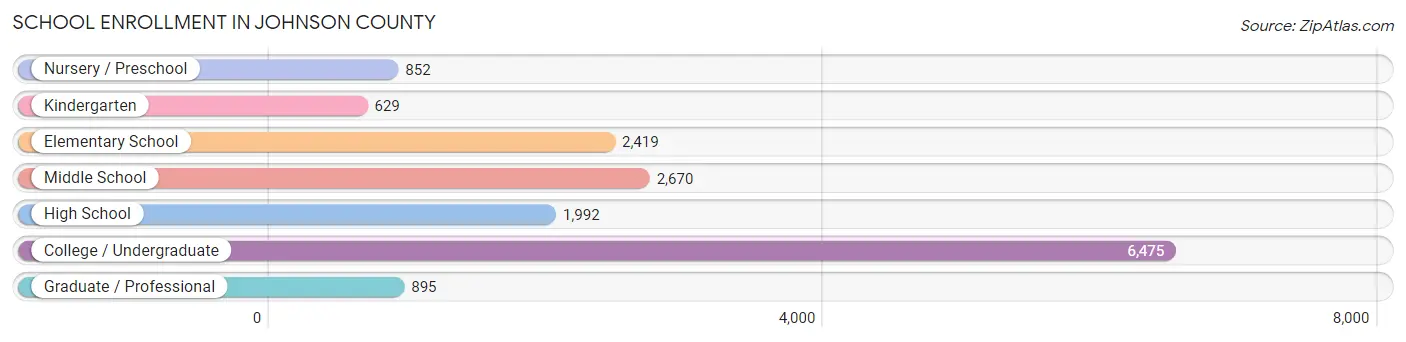
| School Level | # Students | % Students |
| Nursery / Preschool | 852 | 5.3% |
| Kindergarten | 629 | 4.0% |
| Elementary School | 2,419 | 15.2% |
| Middle School | 2,670 | 16.8% |
| High School | 1,992 | 12.5% |
| College / Undergraduate | 6,475 | 40.6% |
| Graduate / Professional | 895 | 5.6% |
| Total | 15,932 | 100.0% |
School Enrollment by Age by Funding Source in Johnson County
Out of a total of 15,932 students who are enrolled in schools in Johnson County, 1,992 (12.5%) attend a private institution, while the remaining 13,940 (87.5%) are enrolled in public schools. The age group of 3 to 4 year olds has the highest likelihood of being enrolled in private schools, with 209 (33.7% in the age bracket) enrolled. Conversely, the age group of 18 to 19 year olds has the lowest likelihood of being enrolled in a private school, with 2,405 (98.7% in the age bracket) attending a public institution.
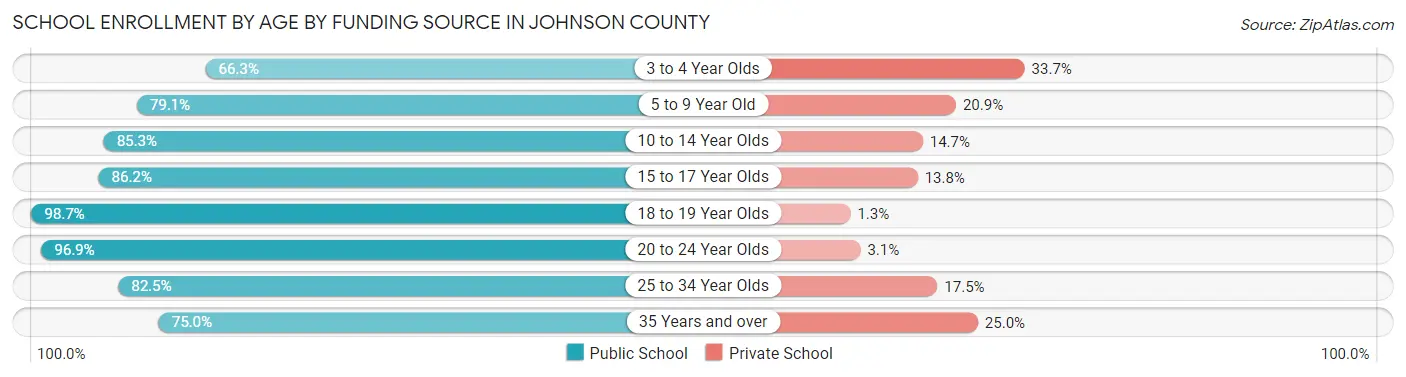
| Age Bracket | Public School | Private School |
| 3 to 4 Year Olds | 411 (66.3%) | 209 (33.7%) |
| 5 to 9 Year Old | 2,181 (79.1%) | 577 (20.9%) |
| 10 to 14 Year Olds | 2,887 (85.3%) | 499 (14.7%) |
| 15 to 17 Year Olds | 1,257 (86.2%) | 201 (13.8%) |
| 18 to 19 Year Olds | 2,405 (98.7%) | 31 (1.3%) |
| 20 to 24 Year Olds | 3,433 (96.9%) | 111 (3.1%) |
| 25 to 34 Year Olds | 837 (82.5%) | 177 (17.5%) |
| 35 Years and over | 537 (75.0%) | 179 (25.0%) |
| Total | 13,940 (87.5%) | 1,992 (12.5%) |
Educational Attainment by Field of Study in Johnson County
Education (1,757 | 17.8%), business (1,598 | 16.2%), arts & humanities (1,383 | 14.1%), science & technology (1,133 | 11.5%), and bio, nature & agricultural (749 | 7.6%) are the most common fields of study among 9,846 individuals in Johnson County who have obtained a bachelor's degree or higher.
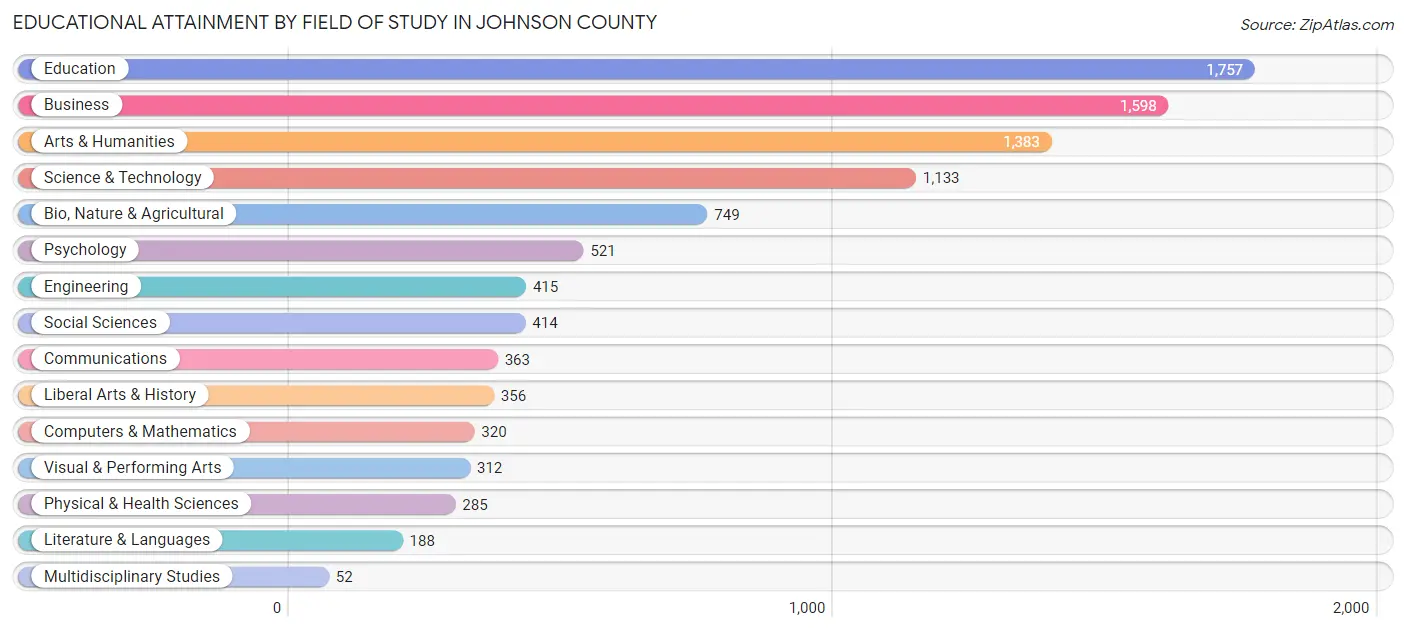
| Field of Study | # Graduates | % Graduates |
| Computers & Mathematics | 320 | 3.3% |
| Bio, Nature & Agricultural | 749 | 7.6% |
| Physical & Health Sciences | 285 | 2.9% |
| Psychology | 521 | 5.3% |
| Social Sciences | 414 | 4.2% |
| Engineering | 415 | 4.2% |
| Multidisciplinary Studies | 52 | 0.5% |
| Science & Technology | 1,133 | 11.5% |
| Business | 1,598 | 16.2% |
| Education | 1,757 | 17.8% |
| Literature & Languages | 188 | 1.9% |
| Liberal Arts & History | 356 | 3.6% |
| Visual & Performing Arts | 312 | 3.2% |
| Communications | 363 | 3.7% |
| Arts & Humanities | 1,383 | 14.1% |
| Total | 9,846 | 100.0% |
Transportation & Commute in Johnson County
Vehicle Availability by Sex in Johnson County
The most prevalent vehicle ownership categories in Johnson County are males with 2 vehicles (5,448, accounting for 40.4%) and females with 2 vehicles (4,778, making up 47.2%).
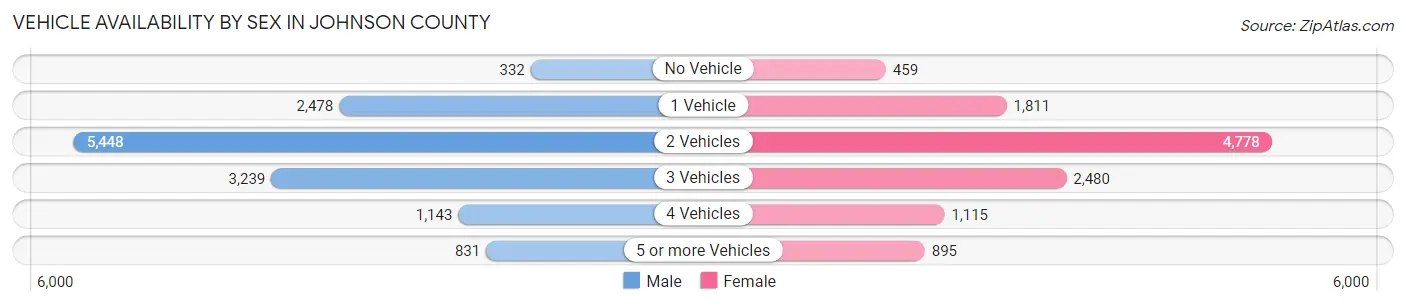
| Vehicles Available | Male | Female |
| No Vehicle | 332 (2.5%) | 459 (4.0%) |
| 1 Vehicle | 2,478 (18.4%) | 1,811 (15.7%) |
| 2 Vehicles | 5,448 (40.4%) | 4,778 (41.4%) |
| 3 Vehicles | 3,239 (24.0%) | 2,480 (21.5%) |
| 4 Vehicles | 1,143 (8.5%) | 1,115 (9.7%) |
| 5 or more Vehicles | 831 (6.2%) | 895 (7.8%) |
| Total | 13,471 (100.0%) | 11,538 (100.0%) |
Commute Time in Johnson County
The most frequently occuring commute durations in Johnson County are 10 to 14 minutes (4,684 commuters, 18.5%), 5 to 9 minutes (3,889 commuters, 15.4%), and 15 to 19 minutes (3,679 commuters, 14.5%).
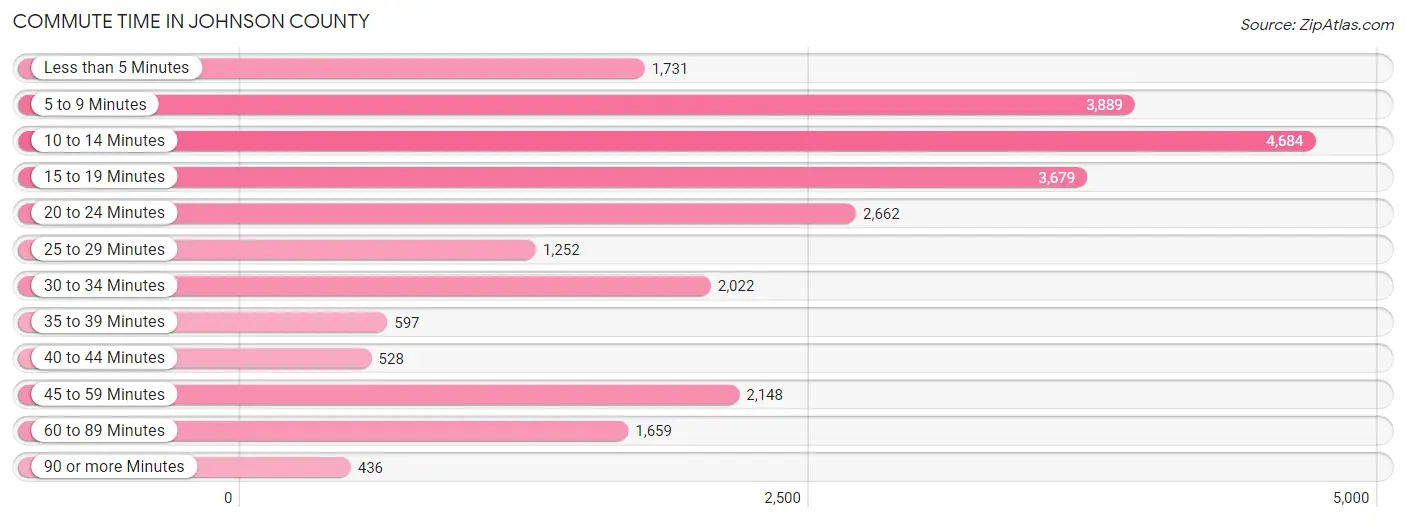
| Commute Time | # Commuters | % Commuters |
| Less than 5 Minutes | 1,731 | 6.9% |
| 5 to 9 Minutes | 3,889 | 15.4% |
| 10 to 14 Minutes | 4,684 | 18.5% |
| 15 to 19 Minutes | 3,679 | 14.5% |
| 20 to 24 Minutes | 2,662 | 10.5% |
| 25 to 29 Minutes | 1,252 | 5.0% |
| 30 to 34 Minutes | 2,022 | 8.0% |
| 35 to 39 Minutes | 597 | 2.4% |
| 40 to 44 Minutes | 528 | 2.1% |
| 45 to 59 Minutes | 2,148 | 8.5% |
| 60 to 89 Minutes | 1,659 | 6.6% |
| 90 or more Minutes | 436 | 1.7% |
Commute Time by Sex in Johnson County
The most common commute times in Johnson County are 10 to 14 minutes (2,381 commuters, 16.9%) for males and 10 to 14 minutes (2,303 commuters, 20.5%) for females.
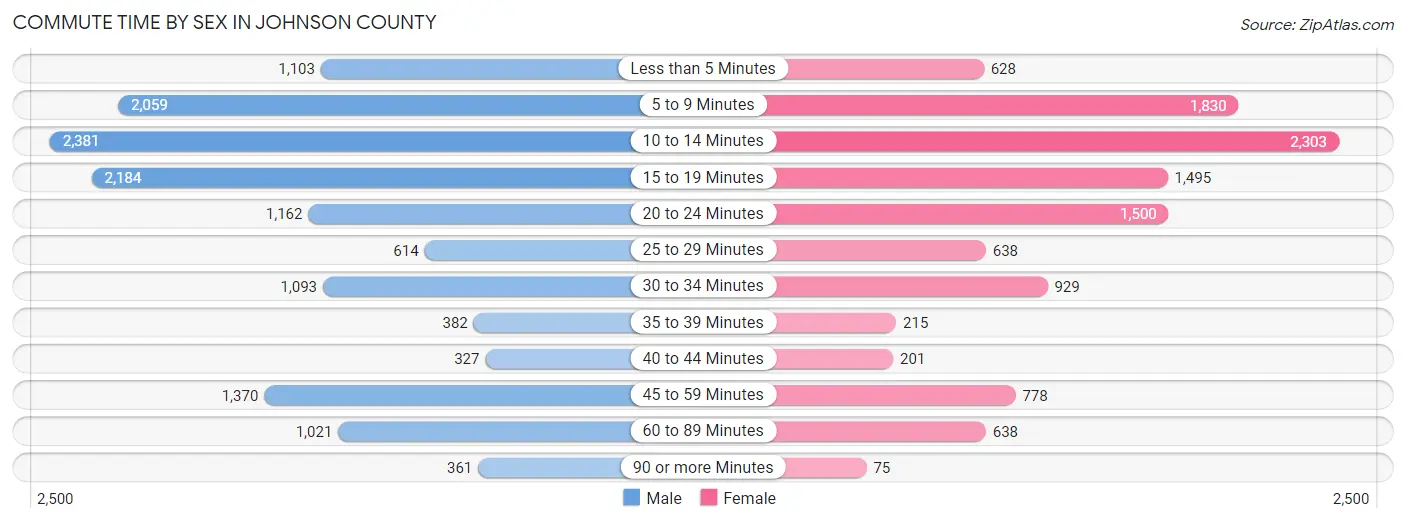
| Commute Time | Male | Female |
| Less than 5 Minutes | 1,103 (7.9%) | 628 (5.6%) |
| 5 to 9 Minutes | 2,059 (14.6%) | 1,830 (16.3%) |
| 10 to 14 Minutes | 2,381 (16.9%) | 2,303 (20.5%) |
| 15 to 19 Minutes | 2,184 (15.5%) | 1,495 (13.3%) |
| 20 to 24 Minutes | 1,162 (8.3%) | 1,500 (13.4%) |
| 25 to 29 Minutes | 614 (4.4%) | 638 (5.7%) |
| 30 to 34 Minutes | 1,093 (7.8%) | 929 (8.3%) |
| 35 to 39 Minutes | 382 (2.7%) | 215 (1.9%) |
| 40 to 44 Minutes | 327 (2.3%) | 201 (1.8%) |
| 45 to 59 Minutes | 1,370 (9.8%) | 778 (6.9%) |
| 60 to 89 Minutes | 1,021 (7.3%) | 638 (5.7%) |
| 90 or more Minutes | 361 (2.6%) | 75 (0.7%) |
Time of Departure to Work by Sex in Johnson County
The most frequent times of departure to work in Johnson County are 7:00 AM to 7:29 AM (2,533, 18.0%) for males and 7:30 AM to 7:59 AM (2,187, 19.5%) for females.
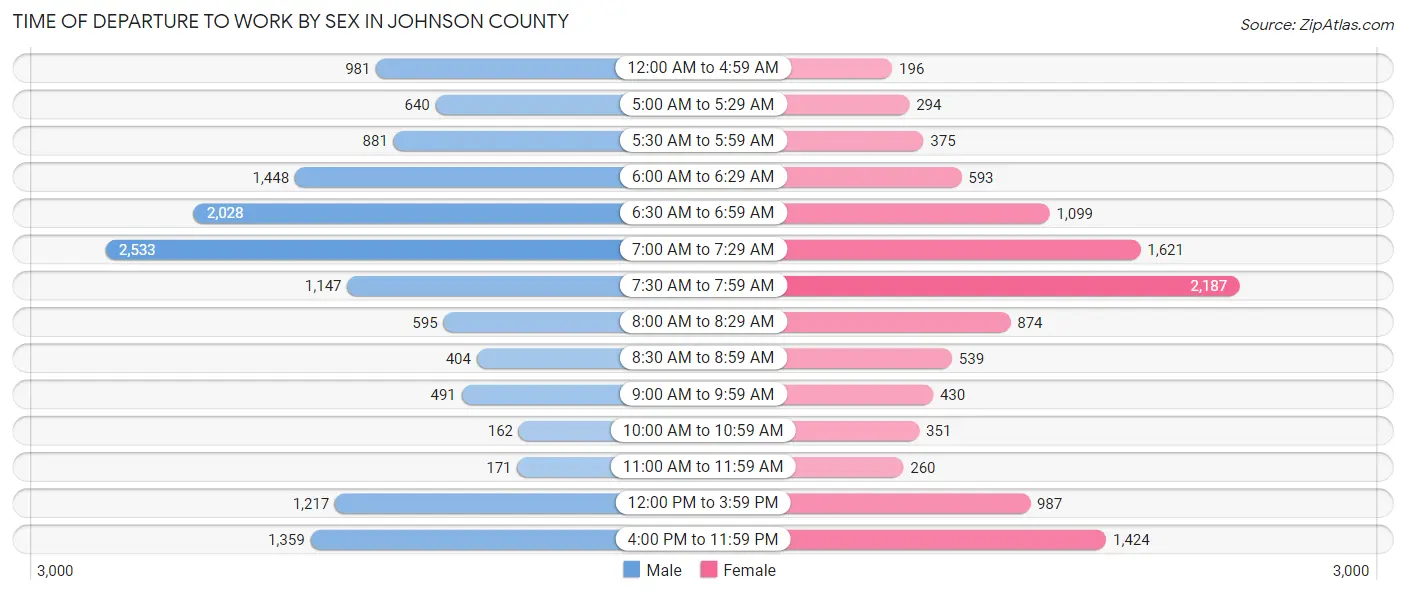
| Time of Departure | Male | Female |
| 12:00 AM to 4:59 AM | 981 (7.0%) | 196 (1.8%) |
| 5:00 AM to 5:29 AM | 640 (4.5%) | 294 (2.6%) |
| 5:30 AM to 5:59 AM | 881 (6.3%) | 375 (3.3%) |
| 6:00 AM to 6:29 AM | 1,448 (10.3%) | 593 (5.3%) |
| 6:30 AM to 6:59 AM | 2,028 (14.4%) | 1,099 (9.8%) |
| 7:00 AM to 7:29 AM | 2,533 (18.0%) | 1,621 (14.4%) |
| 7:30 AM to 7:59 AM | 1,147 (8.2%) | 2,187 (19.5%) |
| 8:00 AM to 8:29 AM | 595 (4.2%) | 874 (7.8%) |
| 8:30 AM to 8:59 AM | 404 (2.9%) | 539 (4.8%) |
| 9:00 AM to 9:59 AM | 491 (3.5%) | 430 (3.8%) |
| 10:00 AM to 10:59 AM | 162 (1.1%) | 351 (3.1%) |
| 11:00 AM to 11:59 AM | 171 (1.2%) | 260 (2.3%) |
| 12:00 PM to 3:59 PM | 1,217 (8.7%) | 987 (8.8%) |
| 4:00 PM to 11:59 PM | 1,359 (9.7%) | 1,424 (12.7%) |
| Total | 14,057 (100.0%) | 11,230 (100.0%) |
Housing Occupancy in Johnson County
Occupancy by Ownership in Johnson County
Of the total 20,613 dwellings in Johnson County, owner-occupied units account for 13,015 (63.1%), while renter-occupied units make up 7,598 (36.9%).
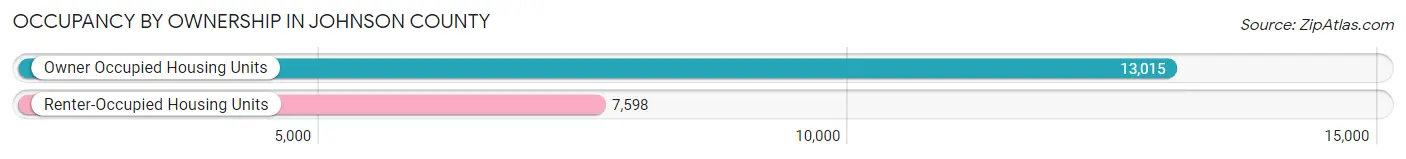
| Occupancy | # Housing Units | % Housing Units |
| Owner Occupied Housing Units | 13,015 | 63.1% |
| Renter-Occupied Housing Units | 7,598 | 36.9% |
| Total Occupied Housing Units | 20,613 | 100.0% |
Occupancy by Household Size in Johnson County
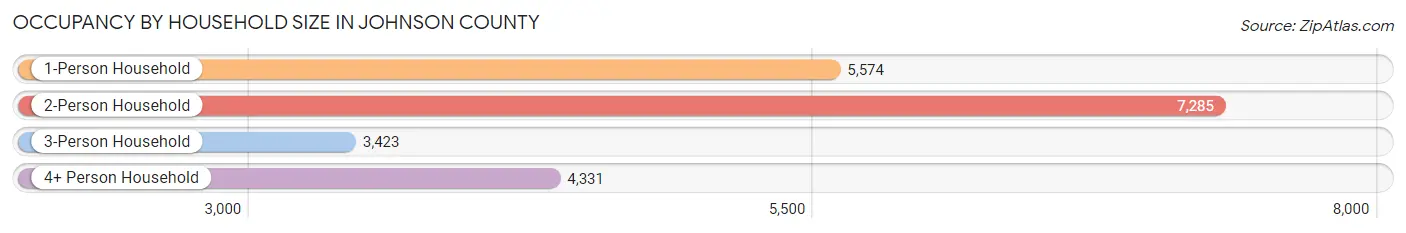
| Household Size | # Housing Units | % Housing Units |
| 1-Person Household | 5,574 | 27.0% |
| 2-Person Household | 7,285 | 35.3% |
| 3-Person Household | 3,423 | 16.6% |
| 4+ Person Household | 4,331 | 21.0% |
| Total Housing Units | 20,613 | 100.0% |
Occupancy by Ownership by Household Size in Johnson County
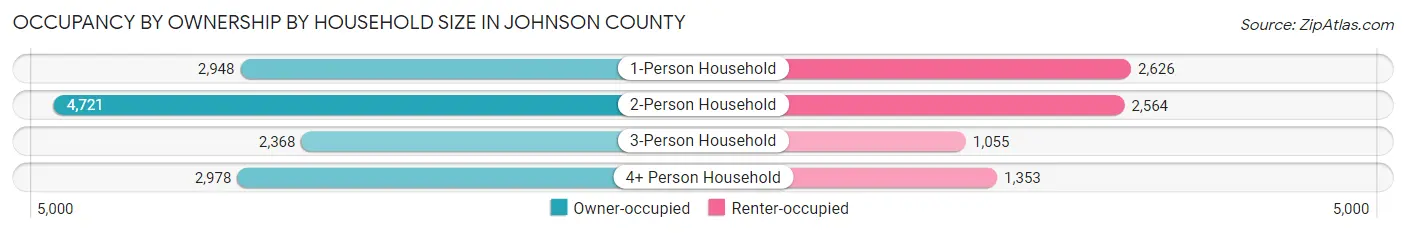
| Household Size | Owner-occupied | Renter-occupied |
| 1-Person Household | 2,948 (52.9%) | 2,626 (47.1%) |
| 2-Person Household | 4,721 (64.8%) | 2,564 (35.2%) |
| 3-Person Household | 2,368 (69.2%) | 1,055 (30.8%) |
| 4+ Person Household | 2,978 (68.8%) | 1,353 (31.2%) |
| Total Housing Units | 13,015 (63.1%) | 7,598 (36.9%) |
Occupancy by Educational Attainment in Johnson County
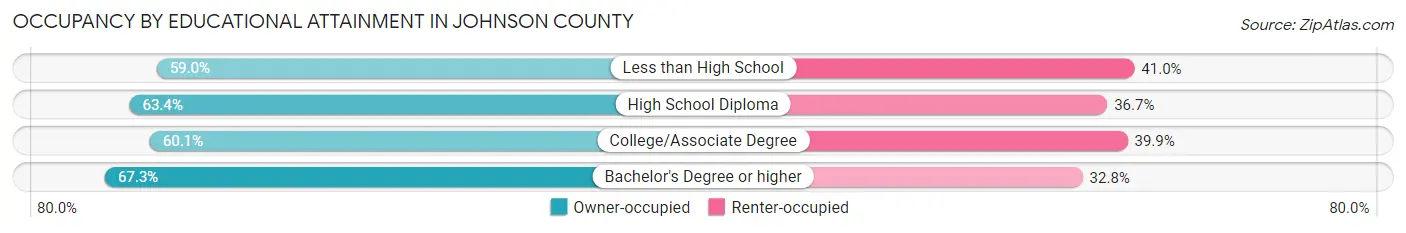
| Household Size | Owner-occupied | Renter-occupied |
| Less than High School | 627 (59.0%) | 435 (41.0%) |
| High School Diploma | 4,086 (63.3%) | 2,364 (36.6%) |
| College/Associate Degree | 4,294 (60.1%) | 2,847 (39.9%) |
| Bachelor's Degree or higher | 4,008 (67.2%) | 1,952 (32.8%) |
Occupancy by Age of Householder in Johnson County
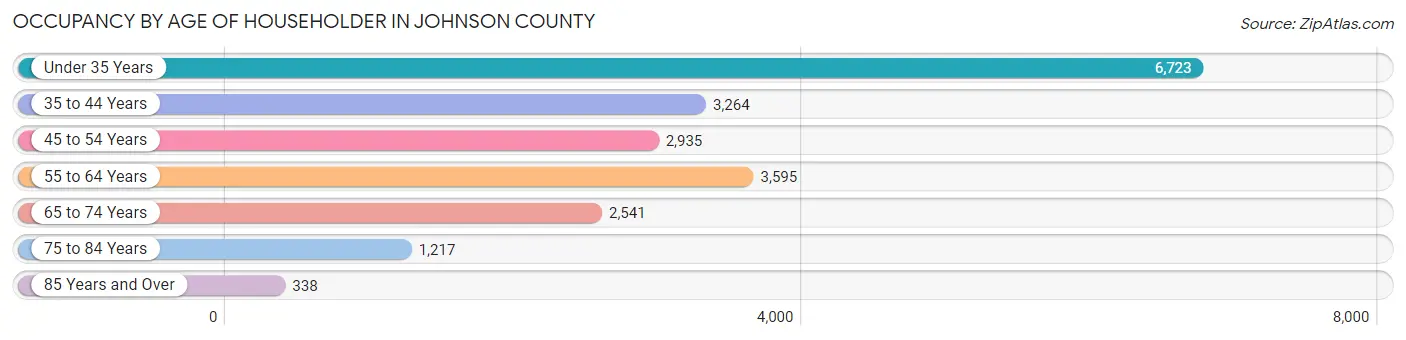
| Age Bracket | # Households | % Households |
| Under 35 Years | 6,723 | 32.6% |
| 35 to 44 Years | 3,264 | 15.8% |
| 45 to 54 Years | 2,935 | 14.2% |
| 55 to 64 Years | 3,595 | 17.4% |
| 65 to 74 Years | 2,541 | 12.3% |
| 75 to 84 Years | 1,217 | 5.9% |
| 85 Years and Over | 338 | 1.6% |
| Total | 20,613 | 100.0% |
Housing Finances in Johnson County
Median Income by Occupancy in Johnson County
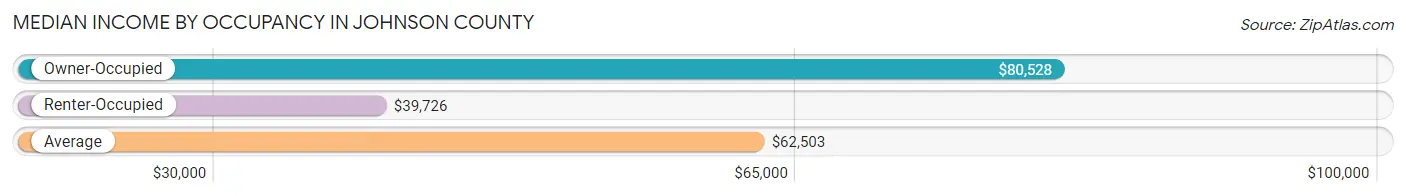
| Occupancy Type | # Households | Median Income |
| Owner-Occupied | 13,015 (63.1%) | $80,528 |
| Renter-Occupied | 7,598 (36.9%) | $39,726 |
| Average | 20,613 (100.0%) | $62,503 |
Occupancy by Householder Income Bracket in Johnson County
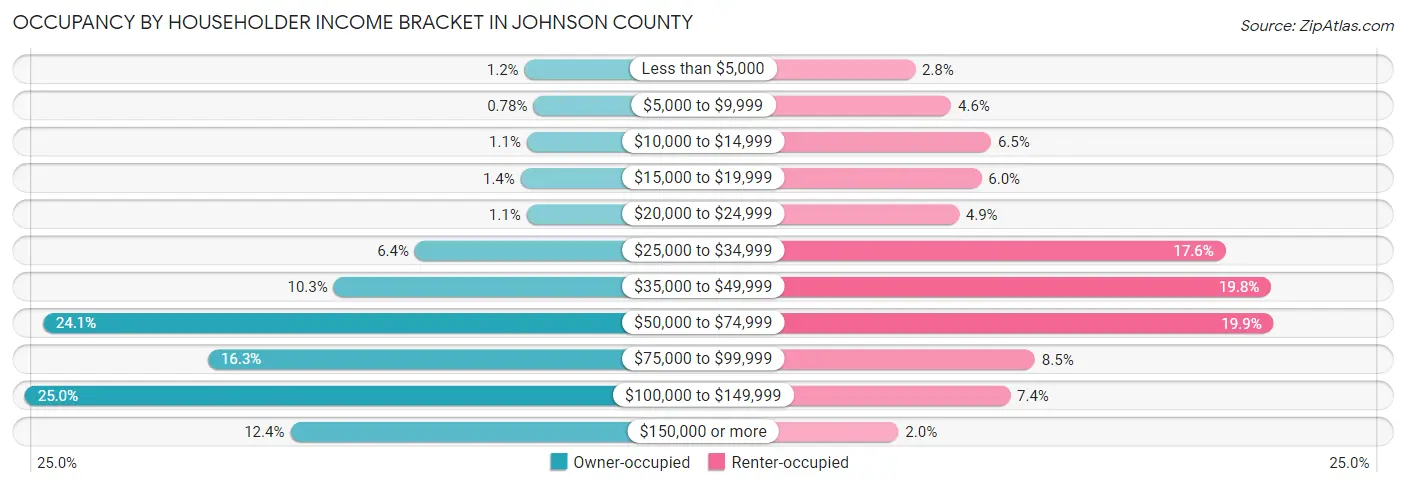
| Income Bracket | Owner-occupied | Renter-occupied |
| Less than $5,000 | 156 (1.2%) | 215 (2.8%) |
| $5,000 to $9,999 | 101 (0.8%) | 346 (4.5%) |
| $10,000 to $14,999 | 142 (1.1%) | 490 (6.5%) |
| $15,000 to $19,999 | 179 (1.4%) | 455 (6.0%) |
| $20,000 to $24,999 | 143 (1.1%) | 374 (4.9%) |
| $25,000 to $34,999 | 835 (6.4%) | 1,339 (17.6%) |
| $35,000 to $49,999 | 1,339 (10.3%) | 1,504 (19.8%) |
| $50,000 to $74,999 | 3,141 (24.1%) | 1,512 (19.9%) |
| $75,000 to $99,999 | 2,118 (16.3%) | 649 (8.5%) |
| $100,000 to $149,999 | 3,253 (25.0%) | 559 (7.4%) |
| $150,000 or more | 1,608 (12.3%) | 155 (2.0%) |
| Total | 13,015 (100.0%) | 7,598 (100.0%) |
Monthly Housing Cost Tiers in Johnson County
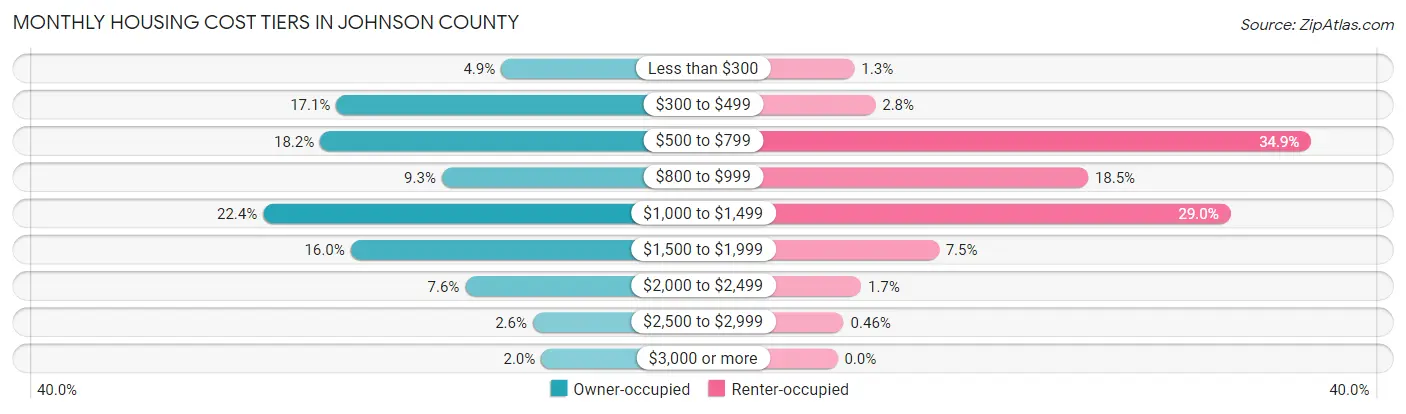
| Monthly Cost | Owner-occupied | Renter-occupied |
| Less than $300 | 639 (4.9%) | 95 (1.3%) |
| $300 to $499 | 2,219 (17.1%) | 212 (2.8%) |
| $500 to $799 | 2,374 (18.2%) | 2,651 (34.9%) |
| $800 to $999 | 1,208 (9.3%) | 1,402 (18.4%) |
| $1,000 to $1,499 | 2,921 (22.4%) | 2,200 (28.9%) |
| $1,500 to $1,999 | 2,082 (16.0%) | 567 (7.5%) |
| $2,000 to $2,499 | 983 (7.5%) | 132 (1.7%) |
| $2,500 to $2,999 | 334 (2.6%) | 35 (0.5%) |
| $3,000 or more | 255 (2.0%) | 0 (0.0%) |
| Total | 13,015 (100.0%) | 7,598 (100.0%) |
Physical Housing Characteristics in Johnson County
Housing Structures in Johnson County
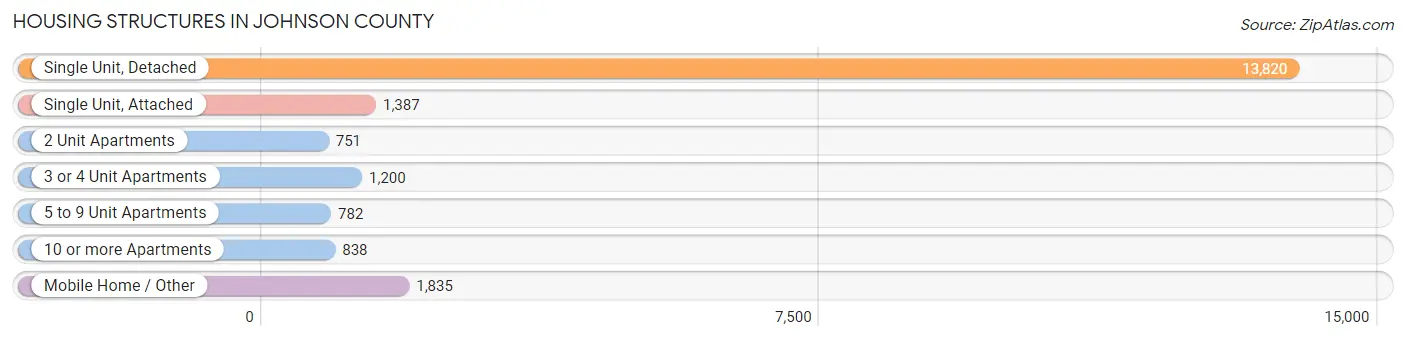
| Structure Type | # Housing Units | % Housing Units |
| Single Unit, Detached | 13,820 | 67.0% |
| Single Unit, Attached | 1,387 | 6.7% |
| 2 Unit Apartments | 751 | 3.6% |
| 3 or 4 Unit Apartments | 1,200 | 5.8% |
| 5 to 9 Unit Apartments | 782 | 3.8% |
| 10 or more Apartments | 838 | 4.1% |
| Mobile Home / Other | 1,835 | 8.9% |
| Total | 20,613 | 100.0% |
Housing Structures by Occupancy in Johnson County
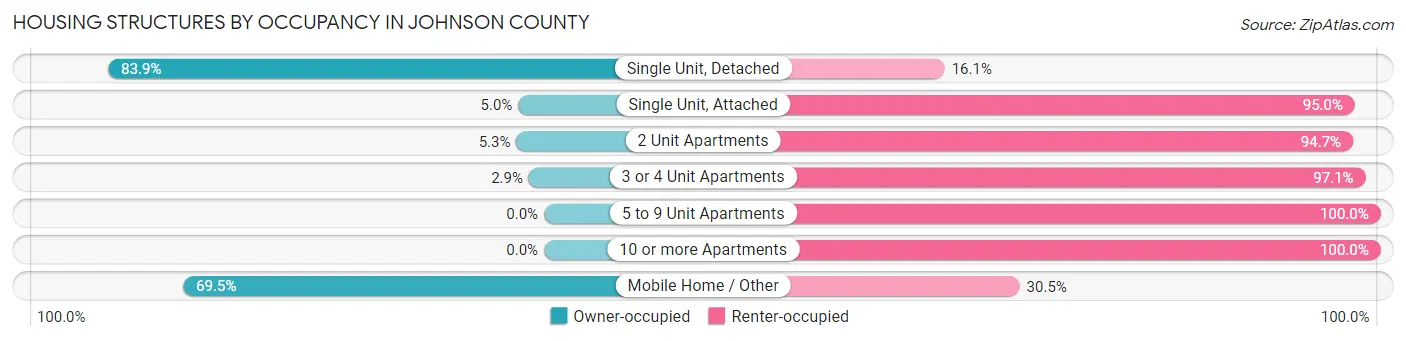
| Structure Type | Owner-occupied | Renter-occupied |
| Single Unit, Detached | 11,596 (83.9%) | 2,224 (16.1%) |
| Single Unit, Attached | 69 (5.0%) | 1,318 (95.0%) |
| 2 Unit Apartments | 40 (5.3%) | 711 (94.7%) |
| 3 or 4 Unit Apartments | 35 (2.9%) | 1,165 (97.1%) |
| 5 to 9 Unit Apartments | 0 (0.0%) | 782 (100.0%) |
| 10 or more Apartments | 0 (0.0%) | 838 (100.0%) |
| Mobile Home / Other | 1,275 (69.5%) | 560 (30.5%) |
| Total | 13,015 (63.1%) | 7,598 (36.9%) |
Housing Structures by Number of Rooms in Johnson County
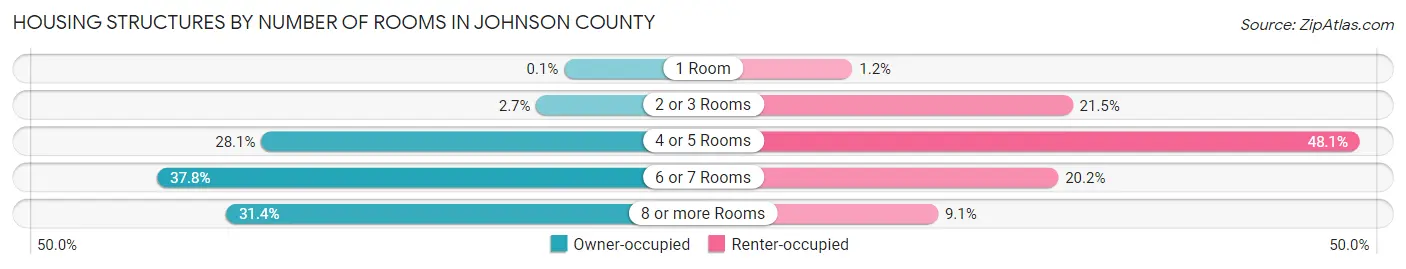
| Number of Rooms | Owner-occupied | Renter-occupied |
| 1 Room | 13 (0.1%) | 87 (1.1%) |
| 2 or 3 Rooms | 347 (2.7%) | 1,635 (21.5%) |
| 4 or 5 Rooms | 3,659 (28.1%) | 3,653 (48.1%) |
| 6 or 7 Rooms | 4,913 (37.8%) | 1,534 (20.2%) |
| 8 or more Rooms | 4,083 (31.4%) | 689 (9.1%) |
| Total | 13,015 (100.0%) | 7,598 (100.0%) |
Housing Structure by Heating Type in Johnson County
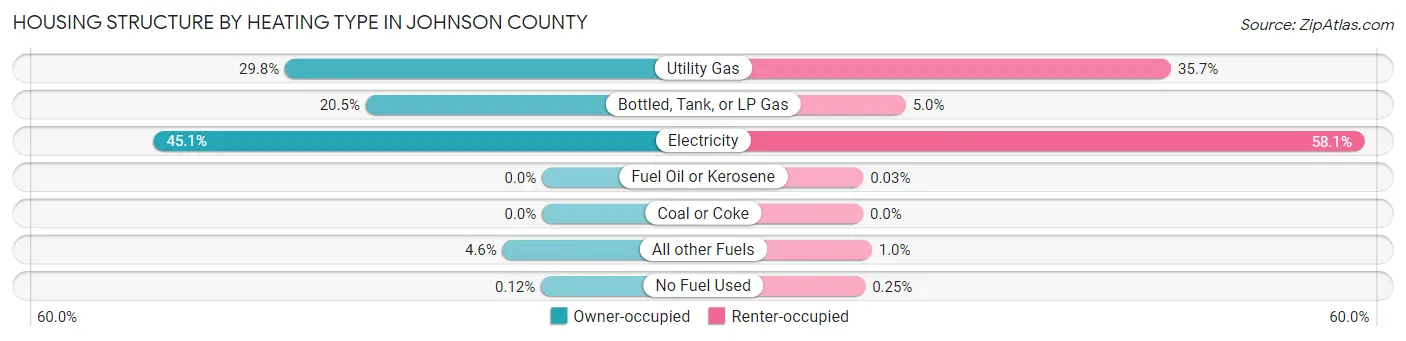
| Heating Type | Owner-occupied | Renter-occupied |
| Utility Gas | 3,879 (29.8%) | 2,713 (35.7%) |
| Bottled, Tank, or LP Gas | 2,662 (20.4%) | 376 (5.0%) |
| Electricity | 5,863 (45.1%) | 4,411 (58.1%) |
| Fuel Oil or Kerosene | 0 (0.0%) | 2 (0.0%) |
| Coal or Coke | 0 (0.0%) | 0 (0.0%) |
| All other Fuels | 596 (4.6%) | 77 (1.0%) |
| No Fuel Used | 15 (0.1%) | 19 (0.3%) |
| Total | 13,015 (100.0%) | 7,598 (100.0%) |
Household Vehicle Usage in Johnson County
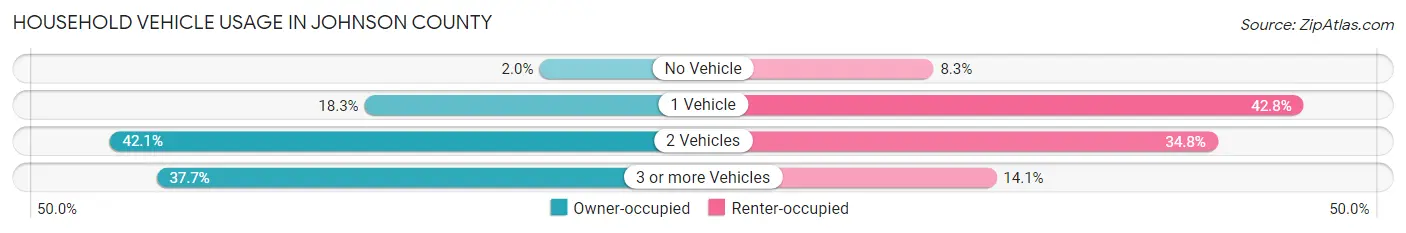
| Vehicles per Household | Owner-occupied | Renter-occupied |
| No Vehicle | 255 (2.0%) | 628 (8.3%) |
| 1 Vehicle | 2,379 (18.3%) | 3,253 (42.8%) |
| 2 Vehicles | 5,476 (42.1%) | 2,643 (34.8%) |
| 3 or more Vehicles | 4,905 (37.7%) | 1,074 (14.1%) |
| Total | 13,015 (100.0%) | 7,598 (100.0%) |
Real Estate & Mortgages in Johnson County
Real Estate and Mortgage Overview in Johnson County
| Characteristic | Without Mortgage | With Mortgage |
| Housing Units | 5,096 | 7,919 |
| Median Property Value | $172,000 | $224,700 |
| Median Household Income | $67,769 | $1,184 |
| Monthly Housing Costs | $477 | $233 |
| Real Estate Taxes | $1,453 | $334 |
Property Value by Mortgage Status in Johnson County
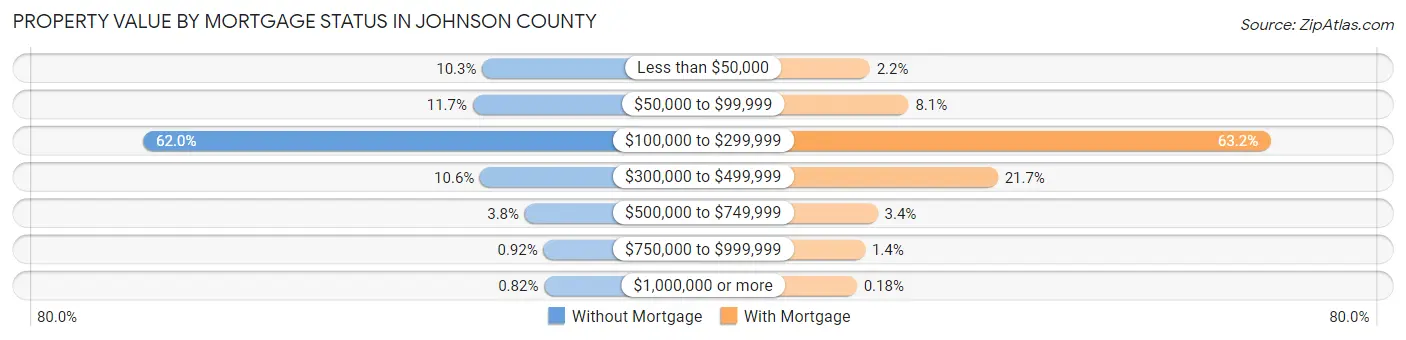
| Property Value | Without Mortgage | With Mortgage |
| Less than $50,000 | 523 (10.3%) | 171 (2.2%) |
| $50,000 to $99,999 | 596 (11.7%) | 638 (8.1%) |
| $100,000 to $299,999 | 3,157 (62.0%) | 5,002 (63.2%) |
| $300,000 to $499,999 | 539 (10.6%) | 1,715 (21.7%) |
| $500,000 to $749,999 | 192 (3.8%) | 266 (3.4%) |
| $750,000 to $999,999 | 47 (0.9%) | 113 (1.4%) |
| $1,000,000 or more | 42 (0.8%) | 14 (0.2%) |
| Total | 5,096 (100.0%) | 7,919 (100.0%) |
Household Income by Mortgage Status in Johnson County
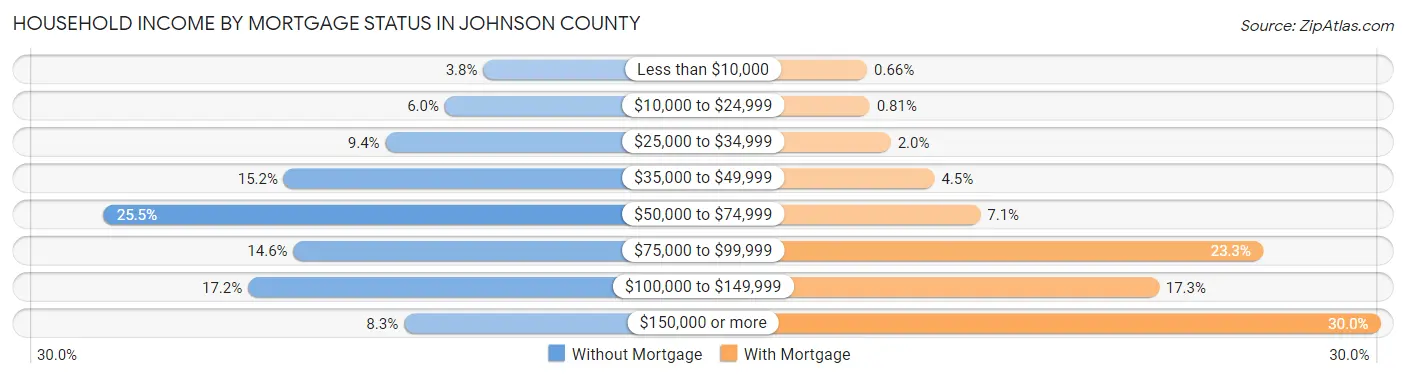
| Household Income | Without Mortgage | With Mortgage |
| Less than $10,000 | 193 (3.8%) | 52 (0.7%) |
| $10,000 to $24,999 | 305 (6.0%) | 64 (0.8%) |
| $25,000 to $34,999 | 478 (9.4%) | 159 (2.0%) |
| $35,000 to $49,999 | 774 (15.2%) | 357 (4.5%) |
| $50,000 to $74,999 | 1,298 (25.5%) | 565 (7.1%) |
| $75,000 to $99,999 | 746 (14.6%) | 1,843 (23.3%) |
| $100,000 to $149,999 | 878 (17.2%) | 1,372 (17.3%) |
| $150,000 or more | 424 (8.3%) | 2,375 (30.0%) |
| Total | 5,096 (100.0%) | 7,919 (100.0%) |
Property Value to Household Income Ratio in Johnson County
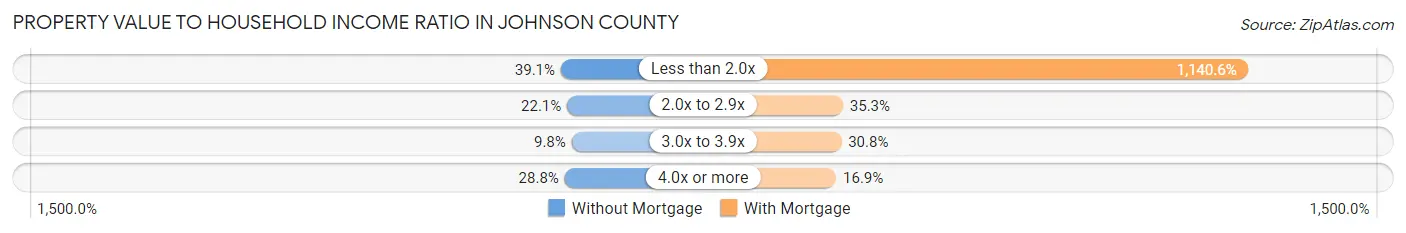
| Value-to-Income Ratio | Without Mortgage | With Mortgage |
| Less than 2.0x | 1,993 (39.1%) | 90,326 (1,140.6%) |
| 2.0x to 2.9x | 1,124 (22.1%) | 2,792 (35.3%) |
| 3.0x to 3.9x | 501 (9.8%) | 2,439 (30.8%) |
| 4.0x or more | 1,465 (28.7%) | 1,337 (16.9%) |
| Total | 5,096 (100.0%) | 7,919 (100.0%) |
Real Estate Taxes by Mortgage Status in Johnson County
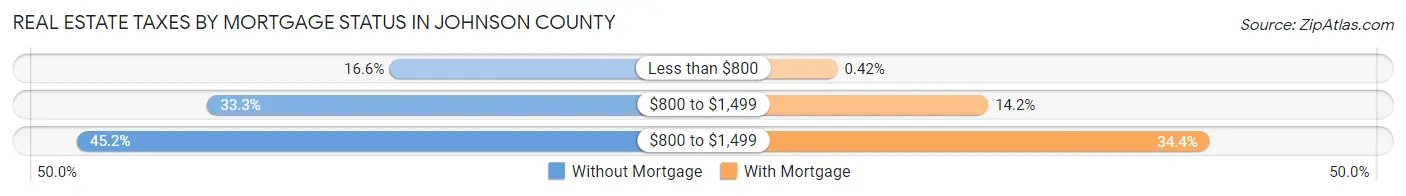
| Property Taxes | Without Mortgage | With Mortgage |
| Less than $800 | 847 (16.6%) | 33 (0.4%) |
| $800 to $1,499 | 1,697 (33.3%) | 1,122 (14.2%) |
| $800 to $1,499 | 2,304 (45.2%) | 2,723 (34.4%) |
| Total | 5,096 (100.0%) | 7,919 (100.0%) |
Health & Disability in Johnson County
Health Insurance Coverage by Age in Johnson County
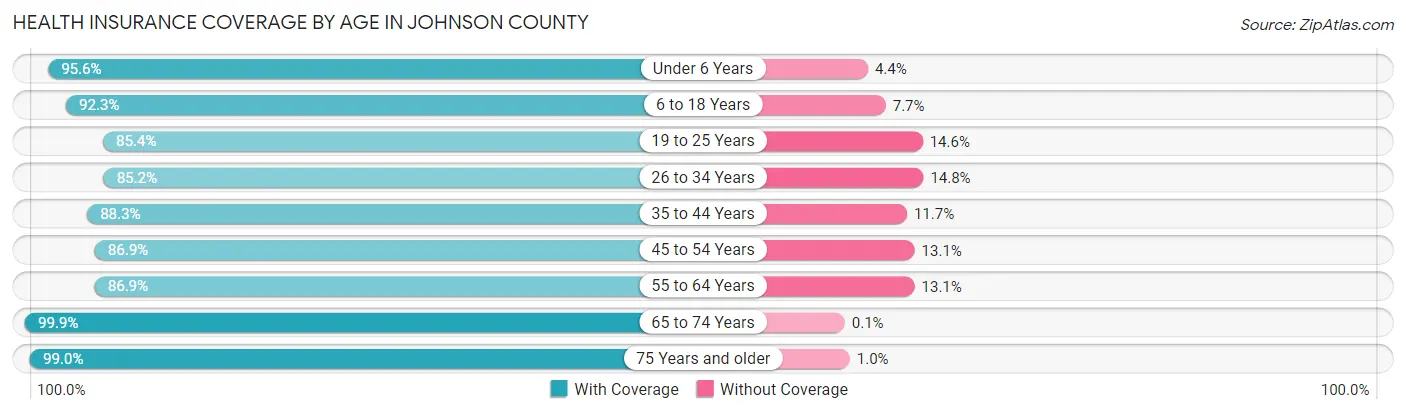
| Age Bracket | With Coverage | Without Coverage |
| Under 6 Years | 3,860 (95.6%) | 178 (4.4%) |
| 6 to 18 Years | 8,160 (92.3%) | 685 (7.7%) |
| 19 to 25 Years | 7,312 (85.4%) | 1,253 (14.6%) |
| 26 to 34 Years | 4,610 (85.2%) | 798 (14.8%) |
| 35 to 44 Years | 4,956 (88.3%) | 656 (11.7%) |
| 45 to 54 Years | 4,345 (86.9%) | 656 (13.1%) |
| 55 to 64 Years | 5,115 (86.9%) | 772 (13.1%) |
| 65 to 74 Years | 3,964 (99.9%) | 4 (0.1%) |
| 75 Years and older | 2,400 (99.0%) | 25 (1.0%) |
| Total | 44,722 (89.9%) | 5,027 (10.1%) |
Health Insurance Coverage by Citizenship Status in Johnson County
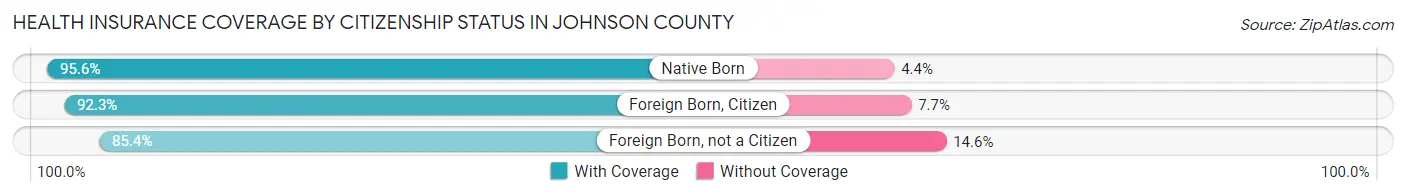
| Citizenship Status | With Coverage | Without Coverage |
| Native Born | 3,860 (95.6%) | 178 (4.4%) |
| Foreign Born, Citizen | 8,160 (92.3%) | 685 (7.7%) |
| Foreign Born, not a Citizen | 7,312 (85.4%) | 1,253 (14.6%) |
Health Insurance Coverage by Household Income in Johnson County
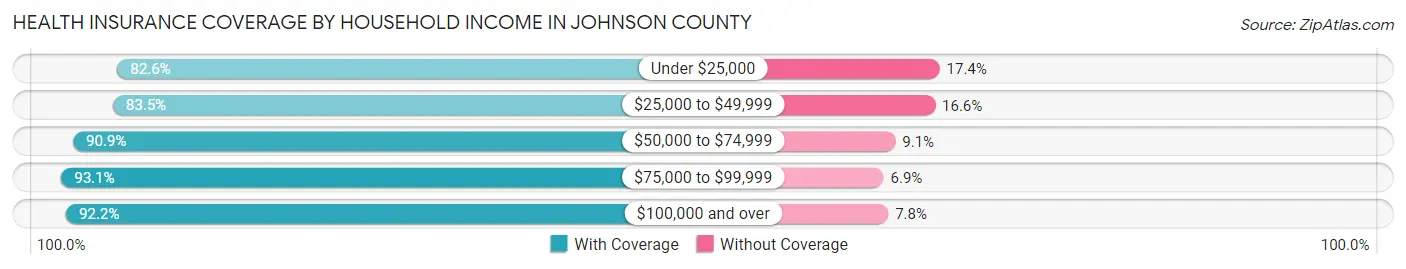
| Household Income | With Coverage | Without Coverage |
| Under $25,000 | 3,521 (82.6%) | 741 (17.4%) |
| $25,000 to $49,999 | 7,473 (83.5%) | 1,482 (16.6%) |
| $50,000 to $74,999 | 9,154 (90.9%) | 915 (9.1%) |
| $75,000 to $99,999 | 6,720 (93.1%) | 497 (6.9%) |
| $100,000 and over | 15,448 (92.2%) | 1,299 (7.8%) |
Public vs Private Health Insurance Coverage by Age in Johnson County
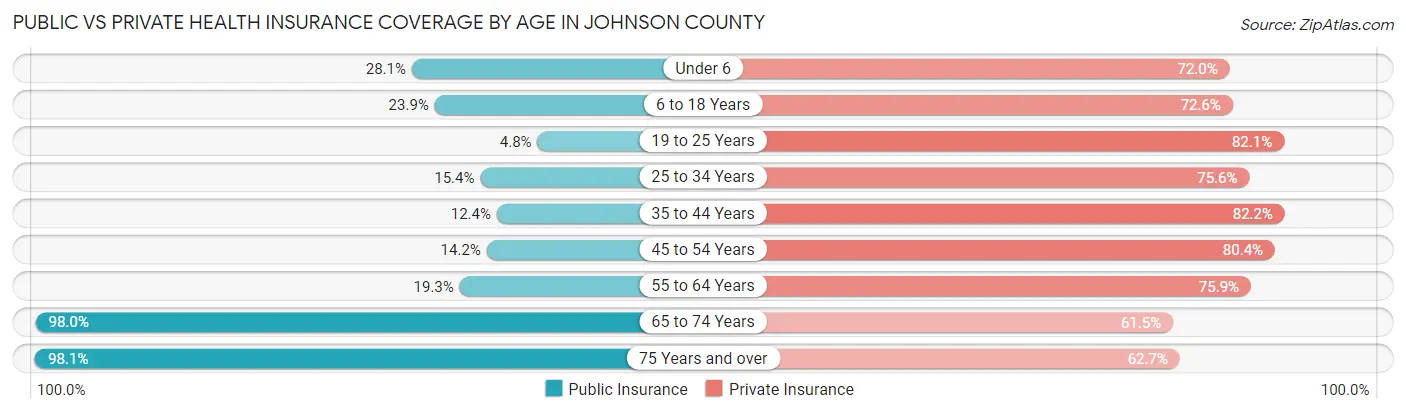
| Age Bracket | Public Insurance | Private Insurance |
| Under 6 | 1,136 (28.1%) | 2,906 (72.0%) |
| 6 to 18 Years | 2,113 (23.9%) | 6,417 (72.6%) |
| 19 to 25 Years | 412 (4.8%) | 7,029 (82.1%) |
| 25 to 34 Years | 834 (15.4%) | 4,090 (75.6%) |
| 35 to 44 Years | 693 (12.3%) | 4,614 (82.2%) |
| 45 to 54 Years | 712 (14.2%) | 4,020 (80.4%) |
| 55 to 64 Years | 1,134 (19.3%) | 4,470 (75.9%) |
| 65 to 74 Years | 3,887 (98.0%) | 2,439 (61.5%) |
| 75 Years and over | 2,378 (98.1%) | 1,521 (62.7%) |
| Total | 13,299 (26.7%) | 37,506 (75.4%) |
Disability Status by Sex by Age in Johnson County
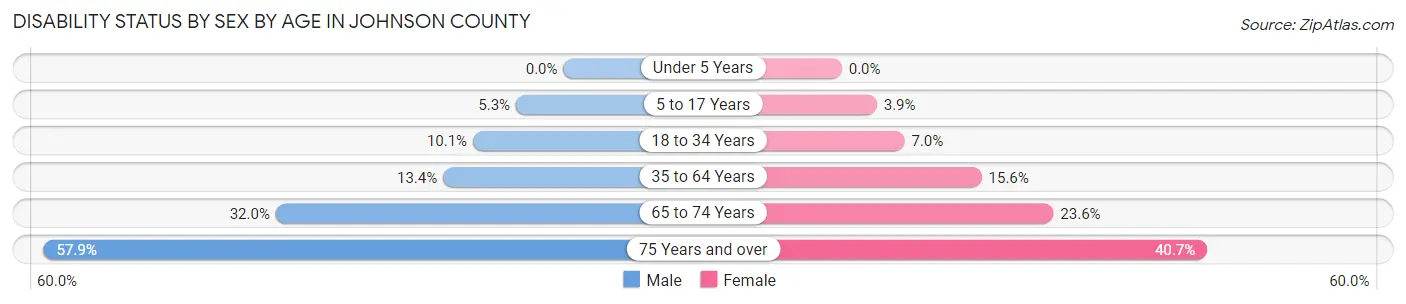
| Age Bracket | Male | Female |
| Under 5 Years | 0 (0.0%) | 0 (0.0%) |
| 5 to 17 Years | 224 (5.3%) | 160 (3.9%) |
| 18 to 34 Years | 719 (10.1%) | 559 (7.0%) |
| 35 to 64 Years | 1,085 (13.4%) | 1,308 (15.6%) |
| 65 to 74 Years | 654 (32.0%) | 454 (23.6%) |
| 75 Years and over | 583 (57.9%) | 577 (40.7%) |
Disability Class by Sex by Age in Johnson County
Disability Class: Hearing Difficulty
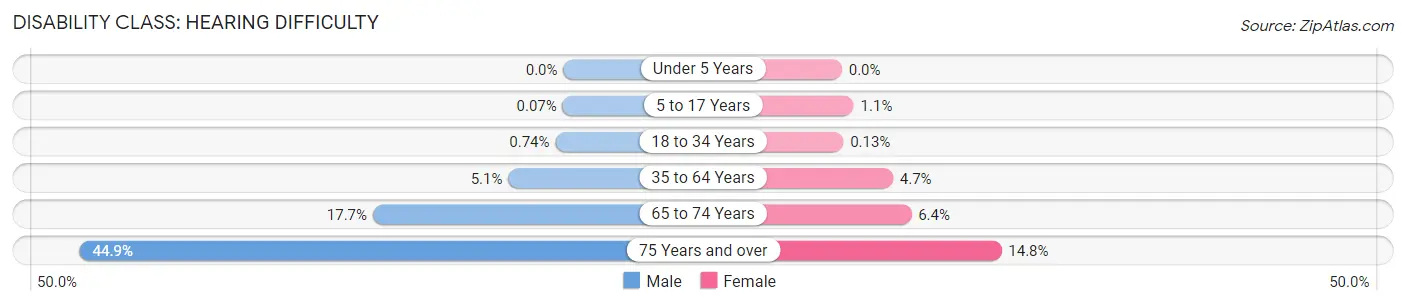
| Age Bracket | Male | Female |
| Under 5 Years | 0 (0.0%) | 0 (0.0%) |
| 5 to 17 Years | 3 (0.1%) | 45 (1.1%) |
| 18 to 34 Years | 53 (0.7%) | 10 (0.1%) |
| 35 to 64 Years | 414 (5.1%) | 398 (4.7%) |
| 65 to 74 Years | 361 (17.7%) | 124 (6.4%) |
| 75 Years and over | 452 (44.9%) | 210 (14.8%) |
Disability Class: Vision Difficulty
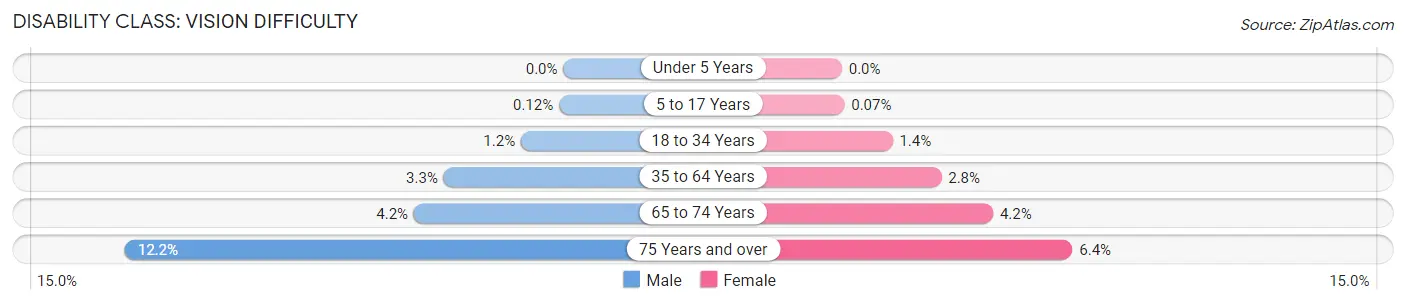
| Age Bracket | Male | Female |
| Under 5 Years | 0 (0.0%) | 0 (0.0%) |
| 5 to 17 Years | 5 (0.1%) | 3 (0.1%) |
| 18 to 34 Years | 84 (1.2%) | 113 (1.4%) |
| 35 to 64 Years | 270 (3.3%) | 233 (2.8%) |
| 65 to 74 Years | 85 (4.2%) | 81 (4.2%) |
| 75 Years and over | 123 (12.2%) | 91 (6.4%) |
Disability Class: Cognitive Difficulty
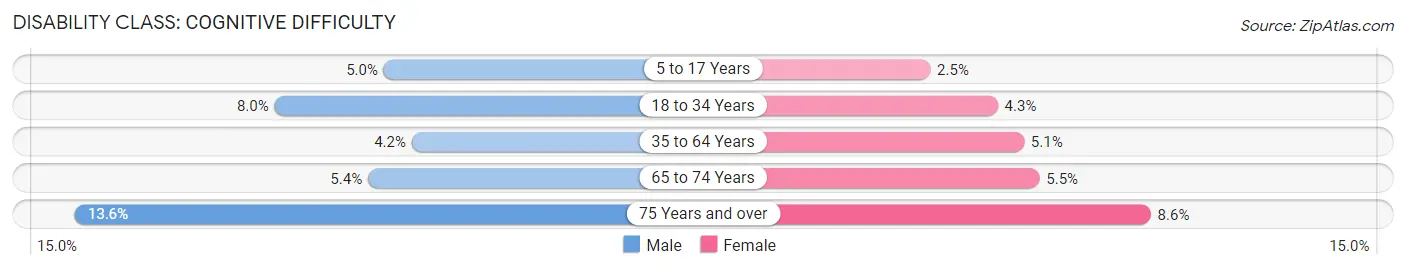
| Age Bracket | Male | Female |
| 5 to 17 Years | 212 (5.0%) | 101 (2.5%) |
| 18 to 34 Years | 574 (8.0%) | 347 (4.3%) |
| 35 to 64 Years | 342 (4.2%) | 426 (5.1%) |
| 65 to 74 Years | 111 (5.4%) | 106 (5.5%) |
| 75 Years and over | 137 (13.6%) | 122 (8.6%) |
Disability Class: Ambulatory Difficulty
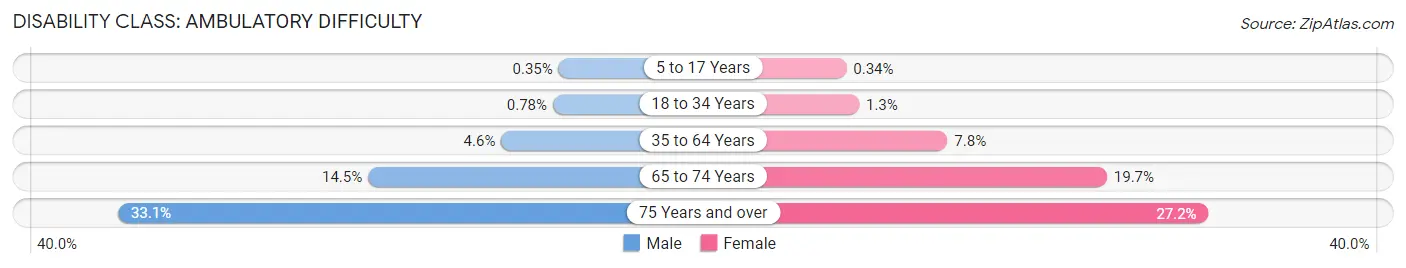
| Age Bracket | Male | Female |
| 5 to 17 Years | 15 (0.4%) | 14 (0.3%) |
| 18 to 34 Years | 56 (0.8%) | 102 (1.3%) |
| 35 to 64 Years | 373 (4.6%) | 659 (7.8%) |
| 65 to 74 Years | 296 (14.5%) | 379 (19.7%) |
| 75 Years and over | 333 (33.1%) | 386 (27.2%) |
Disability Class: Self-Care Difficulty
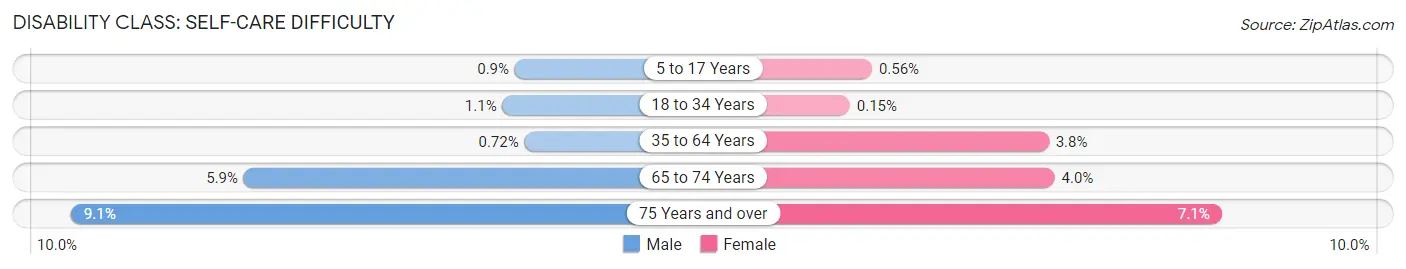
| Age Bracket | Male | Female |
| 5 to 17 Years | 38 (0.9%) | 23 (0.6%) |
| 18 to 34 Years | 81 (1.1%) | 12 (0.2%) |
| 35 to 64 Years | 58 (0.7%) | 323 (3.8%) |
| 65 to 74 Years | 121 (5.9%) | 76 (4.0%) |
| 75 Years and over | 92 (9.1%) | 100 (7.0%) |
Technology Access in Johnson County
Computing Device Access in Johnson County
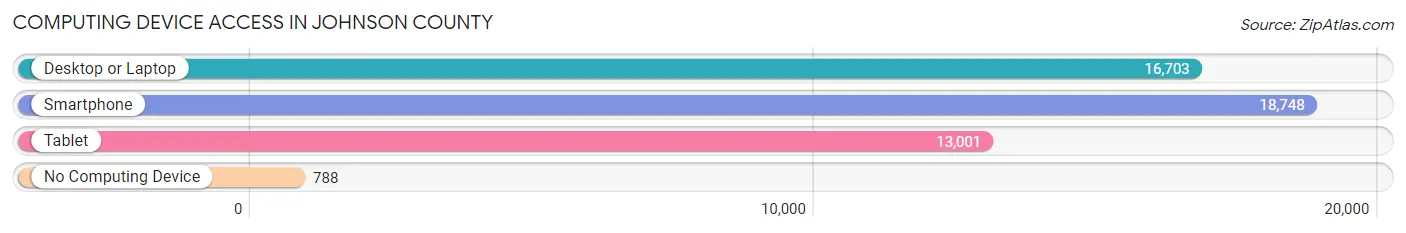
| Device Type | # Households | % Households |
| Desktop or Laptop | 16,703 | 81.0% |
| Smartphone | 18,748 | 90.9% |
| Tablet | 13,001 | 63.1% |
| No Computing Device | 788 | 3.8% |
| Total | 20,613 | 100.0% |
Internet Access in Johnson County
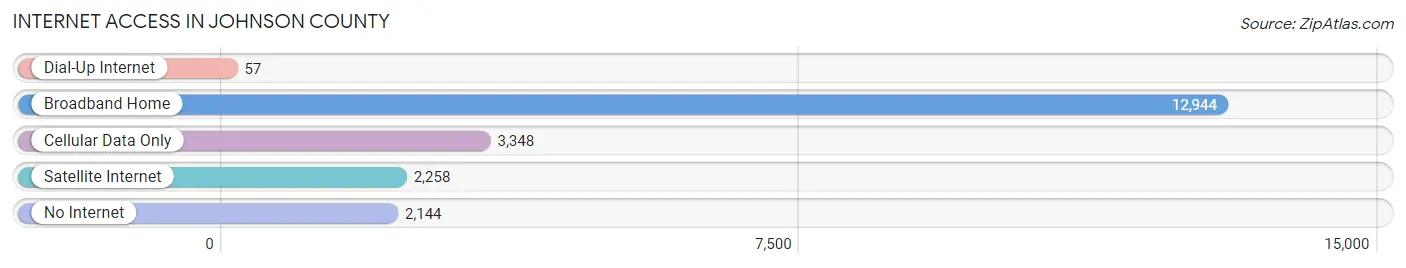
| Internet Type | # Households | % Households |
| Dial-Up Internet | 57 | 0.3% |
| Broadband Home | 12,944 | 62.8% |
| Cellular Data Only | 3,348 | 16.2% |
| Satellite Internet | 2,258 | 11.0% |
| No Internet | 2,144 | 10.4% |
| Total | 20,613 | 100.0% |
Johnson County Summary
Johnson County, Missouri is located in the western part of the state, and is bordered by Lafayette, Henry, and Pettis counties. It is part of the Kansas City metropolitan area, and is the second most populous county in the state. The county seat is Warrensburg, and the largest city is Warrensburg.
History
Johnson County was established in 1834, and was named after Richard Mentor Johnson, the ninth Vice President of the United States. The county was originally part of Lafayette County, and was created to provide a more convenient location for the county seat. The county was organized in 1836, and the first county court was held in Warrensburg.
The county was largely agricultural in the 19th century, and the main crops were corn, wheat, and oats. The county also had a thriving livestock industry, and the county was home to several large cattle ranches.
In the early 20th century, the county began to experience rapid growth due to the development of the Kansas City metropolitan area. The county was also home to several military bases, including Whiteman Air Force Base, which was established in 1942.
Geography
Johnson County is located in the western part of the state, and is bordered by Lafayette, Henry, and Pettis counties. The county has a total area of 545 square miles, and is the second most populous county in the state. The county is mostly rural, with the majority of the population living in the cities of Warrensburg and Knob Noster.
The county is located in the Ozark Plateau region of Missouri, and is characterized by rolling hills and wooded areas. The county is home to several rivers, including the Osage, Blackwater, and Grand Rivers.
Economy
Johnson County has a diverse economy, and is home to several large employers. The county is home to Whiteman Air Force Base, which is the largest employer in the county. Other major employers include the University of Central Missouri, the Warrensburg School District, and the Johnson County Health Department.
The county is also home to several manufacturing companies, including Johnson Controls, which produces automotive parts, and Johnson & Johnson, which produces medical supplies. The county is also home to several agricultural businesses, including dairy farms, poultry farms, and cattle ranches.
Demographics
As of the 2010 census, Johnson County had a population of 52,595. The population was spread out, with 25.3% under the age of 18, 10.2% from 18 to 24, 28.2% from 25 to 44, 22.2% from 45 to 64, and 14.1% who were 65 years of age or older. The median age was 36.4 years.
The racial makeup of the county was 90.2% White, 4.3% African American, 0.5% Native American, 1.2% Asian, 0.1% Pacific Islander, 1.7% from other races, and 1.9% from two or more races. Hispanic or Latino of any race were 4.2% of the population.
The median income for a household in the county was $41,945, and the median income for a family was $50,945. The per capita income for the county was $20,945. About 11.2% of families and 15.2% of the population were below the poverty line, including 20.2% of those under age 18 and 8.2% of those age 65 or over.
Common Questions
What is Per Capita Income in Johnson County?
Per Capita income in Johnson County is $30,639.
What is the Median Family Income in Johnson County?
Median Family Income in Johnson County is $80,979.
What is the Median Household income in Johnson County?
Median Household Income in Johnson County is $62,503.
What is Income or Wage Gap in Johnson County?
Income or Wage Gap in Johnson County is 28.1%.
Women in Johnson County earn 71.9 cents for every dollar earned by a man.
What is Family Income Deficit in Johnson County?
Family Income Deficit in Johnson County is $9,145.
Families that are below poverty line in Johnson County earn $9,145 less on average than the poverty threshold level.
What is Inequality or Gini Index in Johnson County?
Inequality or Gini Index in Johnson County is 0.40.
What is the Total Population of Johnson County?
Total Population of Johnson County is 54,025.
What is the Total Male Population of Johnson County?
Total Male Population of Johnson County is 27,678.
What is the Total Female Population of Johnson County?
Total Female Population of Johnson County is 26,347.
What is the Ratio of Males per 100 Females in Johnson County?
There are 105.05 Males per 100 Females in Johnson County.
What is the Ratio of Females per 100 Males in Johnson County?
There are 95.19 Females per 100 Males in Johnson County.
What is the Median Population Age in Johnson County?
Median Population Age in Johnson County is 31.0 Years.
What is the Average Family Size in Johnson County
Average Family Size in Johnson County is 3.0 People.
What is the Average Household Size in Johnson County
Average Household Size in Johnson County is 2.4 People.
How Large is the Labor Force in Johnson County?
There are 28,568 People in the Labor Forcein in Johnson County.
What is the Percentage of People in the Labor Force in Johnson County?
65.8% of People are in the Labor Force in Johnson County.
What is the Unemployment Rate in Johnson County?
Unemployment Rate in Johnson County is 4.8%.