Jefferson County, MO Map & Demographics
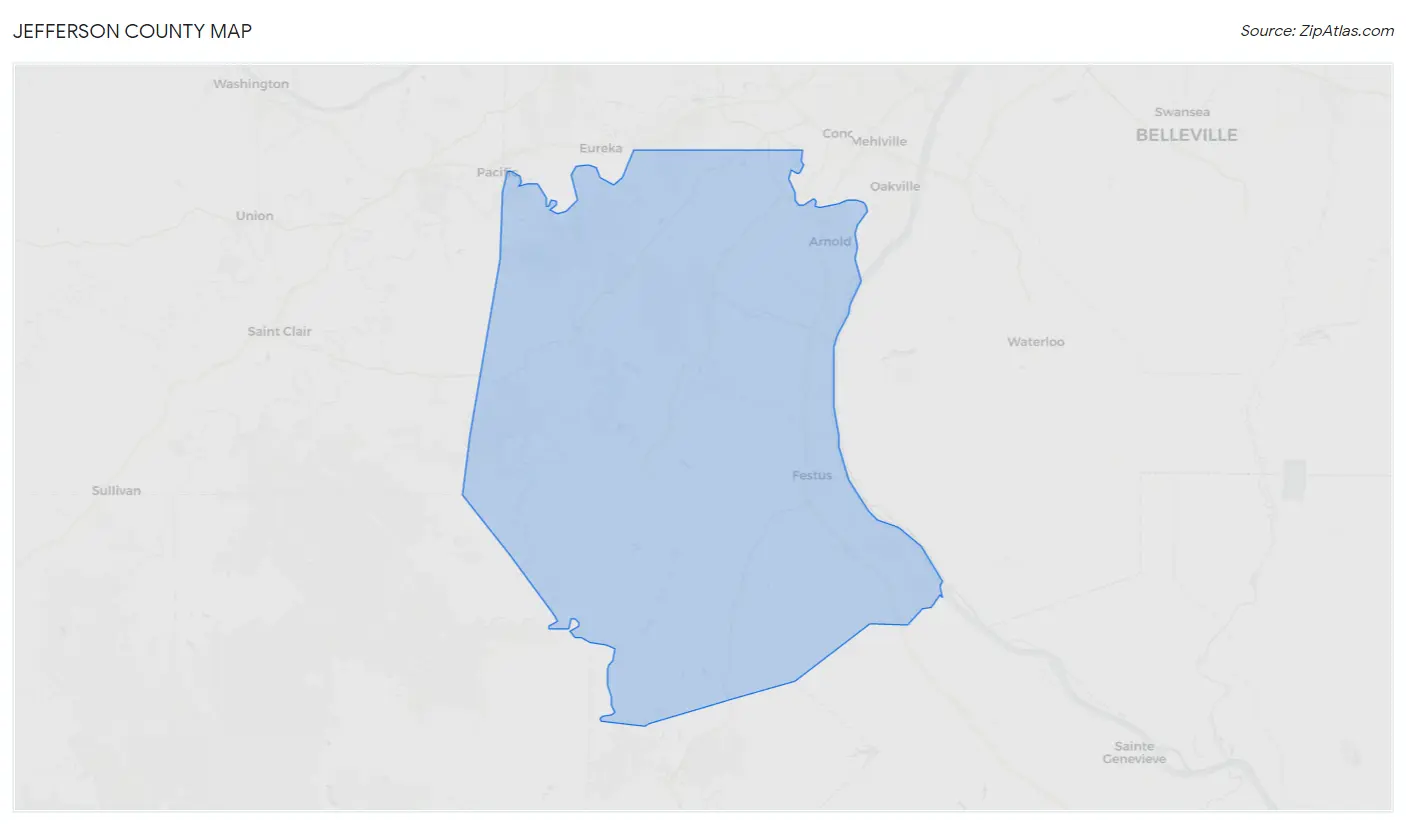
Jefferson County Map
Jefferson County Overview
$36,184
PER CAPITA INCOME
$90,332
AVG FAMILY INCOME
$77,217
AVG HOUSEHOLD INCOME
34.7%
WAGE / INCOME GAP [ % ]
65.3¢/ $1
WAGE / INCOME GAP [ $ ]
$9,311
FAMILY INCOME DEFICIT
0.39
INEQUALITY / GINI INDEX
226,984
TOTAL POPULATION
113,749
MALE POPULATION
113,235
FEMALE POPULATION
100.45
MALES / 100 FEMALES
99.55
FEMALES / 100 MALES
39.9
MEDIAN AGE
3.1
AVG FAMILY SIZE
2.6
AVG HOUSEHOLD SIZE
120,031
LABOR FORCE [ PEOPLE ]
66.2%
PERCENT IN LABOR FORCE
3.8%
UNEMPLOYMENT RATE
Jefferson County Area Codes
Income in Jefferson County
Income Overview in Jefferson County
Per Capita Income in Jefferson County is $36,184, while median incomes of families and households are $90,332 and $77,217 respectively.
| Characteristic | Number | Measure |
| Per Capita Income | 226,984 | $36,184 |
| Median Family Income | 60,853 | $90,332 |
| Mean Family Income | 60,853 | $103,888 |
| Median Household Income | 86,455 | $77,217 |
| Mean Household Income | 86,455 | $92,016 |
| Income Deficit | 60,853 | $9,311 |
| Wage / Income Gap (%) | 226,984 | 34.73% |
| Wage / Income Gap ($) | 226,984 | 65.27¢ per $1 |
| Gini / Inequality Index | 226,984 | 0.39 |
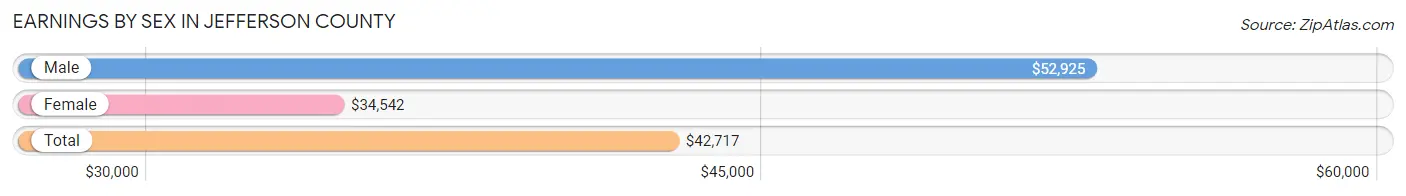
Earnings by Sex in Jefferson County
Average Earnings in Jefferson County are $42,717, $52,925 for men and $34,542 for women, a difference of 34.7%.
| Sex | Number | Average Earnings |
| Male | 65,638 (52.4%) | $52,925 |
| Female | 59,604 (47.6%) | $34,542 |
| Total | 125,242 (100.0%) | $42,717 |
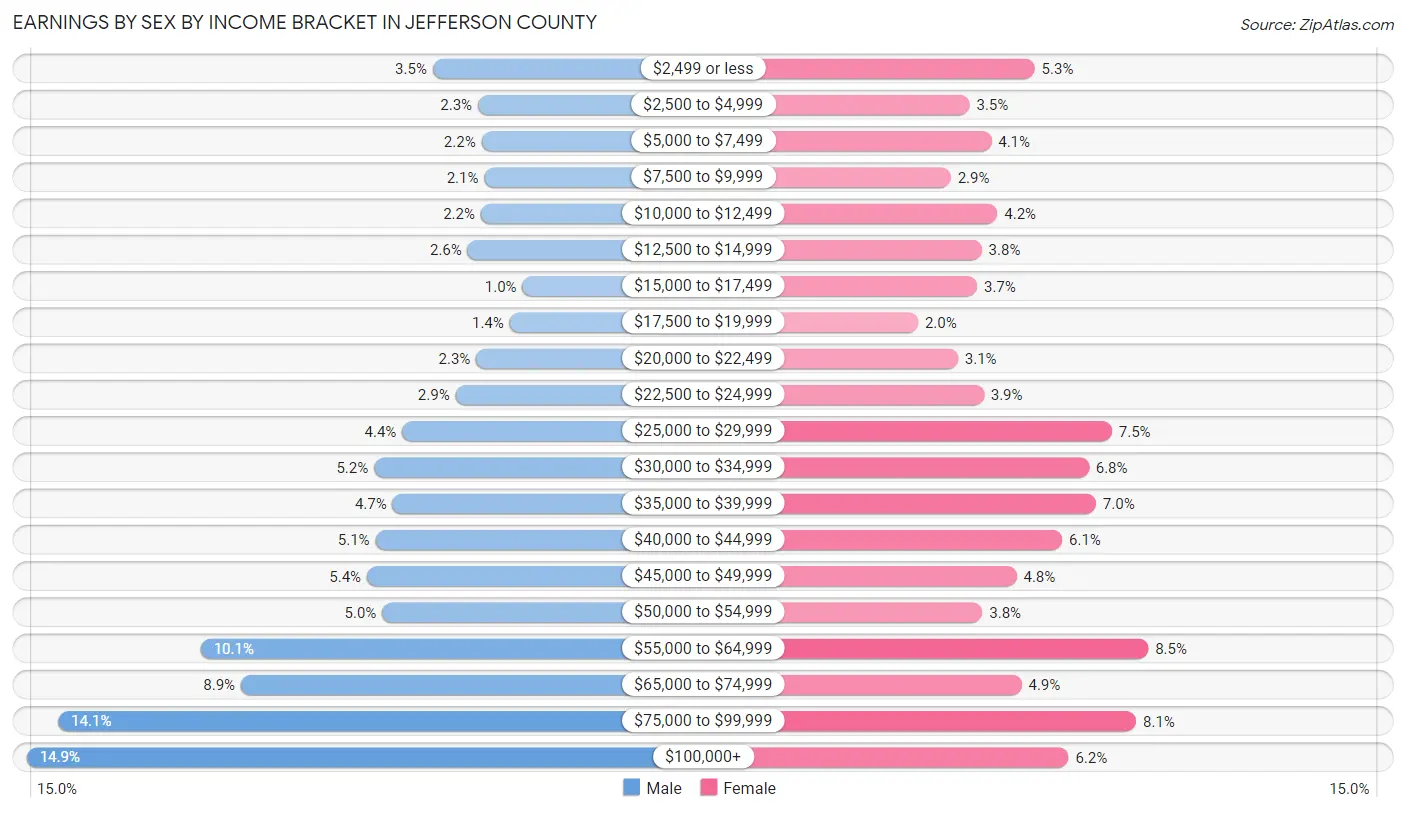
Earnings by Sex by Income Bracket in Jefferson County
The most common earnings brackets in Jefferson County are $100,000+ for men (9,808 | 14.9%) and $55,000 to $64,999 for women (5,049 | 8.5%).
| Income | Male | Female |
| $2,499 or less | 2,315 (3.5%) | 3,150 (5.3%) |
| $2,500 to $4,999 | 1,483 (2.3%) | 2,055 (3.5%) |
| $5,000 to $7,499 | 1,418 (2.2%) | 2,422 (4.1%) |
| $7,500 to $9,999 | 1,367 (2.1%) | 1,743 (2.9%) |
| $10,000 to $12,499 | 1,430 (2.2%) | 2,522 (4.2%) |
| $12,500 to $14,999 | 1,677 (2.5%) | 2,258 (3.8%) |
| $15,000 to $17,499 | 660 (1.0%) | 2,182 (3.7%) |
| $17,500 to $19,999 | 901 (1.4%) | 1,195 (2.0%) |
| $20,000 to $22,499 | 1,513 (2.3%) | 1,862 (3.1%) |
| $22,500 to $24,999 | 1,898 (2.9%) | 2,296 (3.8%) |
| $25,000 to $29,999 | 2,879 (4.4%) | 4,439 (7.4%) |
| $30,000 to $34,999 | 3,402 (5.2%) | 4,051 (6.8%) |
| $35,000 to $39,999 | 3,058 (4.7%) | 4,175 (7.0%) |
| $40,000 to $44,999 | 3,372 (5.1%) | 3,605 (6.0%) |
| $45,000 to $49,999 | 3,531 (5.4%) | 2,841 (4.8%) |
| $50,000 to $54,999 | 3,251 (5.0%) | 2,269 (3.8%) |
| $55,000 to $64,999 | 6,595 (10.1%) | 5,049 (8.5%) |
| $65,000 to $74,999 | 5,853 (8.9%) | 2,926 (4.9%) |
| $75,000 to $99,999 | 9,227 (14.1%) | 4,848 (8.1%) |
| $100,000+ | 9,808 (14.9%) | 3,716 (6.2%) |
| Total | 65,638 (100.0%) | 59,604 (100.0%) |
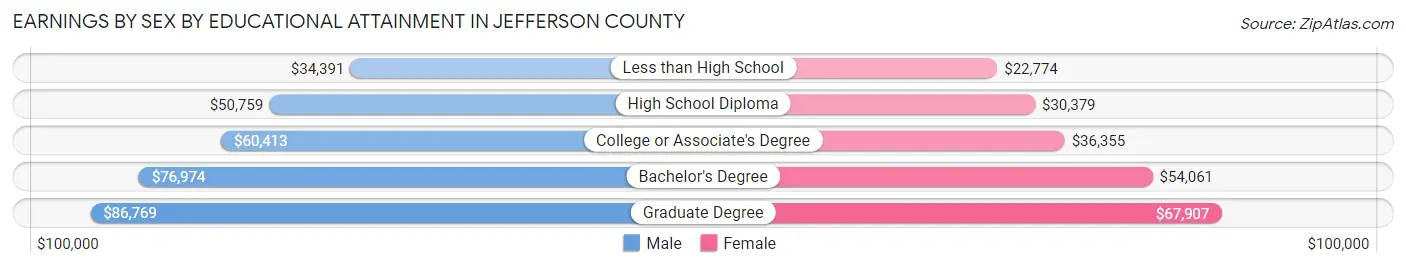
Earnings by Sex by Educational Attainment in Jefferson County
Average earnings in Jefferson County are $58,119 for men and $38,899 for women, a difference of 33.1%. Men with an educational attainment of graduate degree enjoy the highest average annual earnings of $86,769, while those with less than high school education earn the least with $34,391. Women with an educational attainment of graduate degree earn the most with the average annual earnings of $67,907, while those with less than high school education have the smallest earnings of $22,774.
| Educational Attainment | Male Income | Female Income |
| Less than High School | $34,391 | $22,774 |
| High School Diploma | $50,759 | $30,379 |
| College or Associate's Degree | $60,413 | $36,355 |
| Bachelor's Degree | $76,974 | $54,061 |
| Graduate Degree | $86,769 | $67,907 |
| Total | $58,119 | $38,899 |
Family Income in Jefferson County
Family Income Brackets in Jefferson County
According to the Jefferson County family income data, there are 15,639 families falling into the $100,000 to $149,999 income range, which is the most common income bracket and makes up 25.7% of all families. Conversely, the less than $10,000 income bracket is the least frequent group with only 913 families (1.5%) belonging to this category.
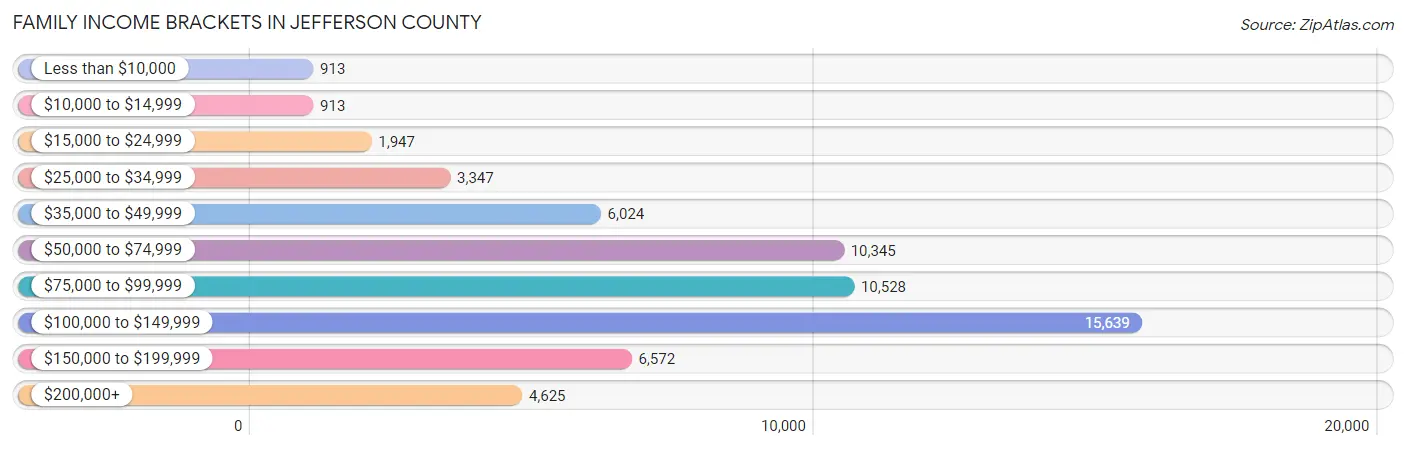
| Income Bracket | # Families | % Families |
| Less than $10,000 | 913 | 1.5% |
| $10,000 to $14,999 | 913 | 1.5% |
| $15,000 to $24,999 | 1,947 | 3.2% |
| $25,000 to $34,999 | 3,347 | 5.5% |
| $35,000 to $49,999 | 6,024 | 9.9% |
| $50,000 to $74,999 | 10,345 | 17.0% |
| $75,000 to $99,999 | 10,528 | 17.3% |
| $100,000 to $149,999 | 15,639 | 25.7% |
| $150,000 to $199,999 | 6,572 | 10.8% |
| $200,000+ | 4,625 | 7.6% |
Family Income by Famaliy Size in Jefferson County
7+ person families (557 | 0.9%) account for the highest median family income in Jefferson County with $155,114 per family, while 2-person families (28,464 | 46.8%) have the highest median income of $38,825 per family member.
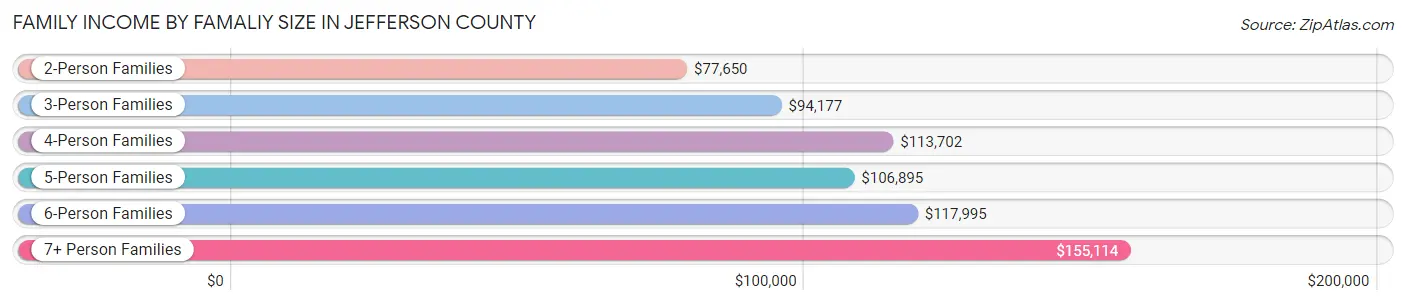
| Income Bracket | # Families | Median Income |
| 2-Person Families | 28,464 (46.8%) | $77,650 |
| 3-Person Families | 14,461 (23.8%) | $94,177 |
| 4-Person Families | 11,275 (18.5%) | $113,702 |
| 5-Person Families | 4,496 (7.4%) | $106,895 |
| 6-Person Families | 1,600 (2.6%) | $117,995 |
| 7+ Person Families | 557 (0.9%) | $155,114 |
| Total | 60,853 (100.0%) | $90,332 |
Family Income by Number of Earners in Jefferson County
The median family income in Jefferson County is $90,332, with families comprising 3+ earners (7,653) having the highest median family income of $145,631, while families with no earners (8,630) have the lowest median family income of $54,200, accounting for 12.6% and 14.2% of families, respectively.
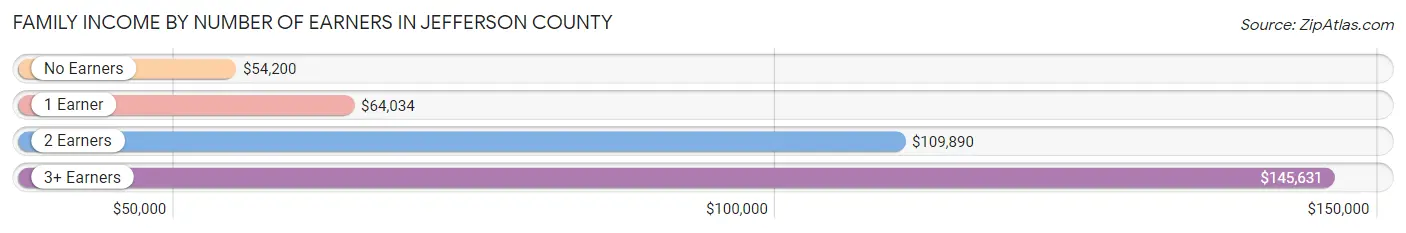
| Number of Earners | # Families | Median Income |
| No Earners | 8,630 (14.2%) | $54,200 |
| 1 Earner | 17,595 (28.9%) | $64,034 |
| 2 Earners | 26,975 (44.3%) | $109,890 |
| 3+ Earners | 7,653 (12.6%) | $145,631 |
| Total | 60,853 (100.0%) | $90,332 |
Household Income in Jefferson County
Household Income Brackets in Jefferson County
With 18,328 households falling in the category, the $100,000 to $149,999 income range is the most frequent in Jefferson County, accounting for 21.2% of all households. In contrast, only 2,421 households (2.8%) fall into the $10,000 to $14,999 income bracket, making it the least populous group.
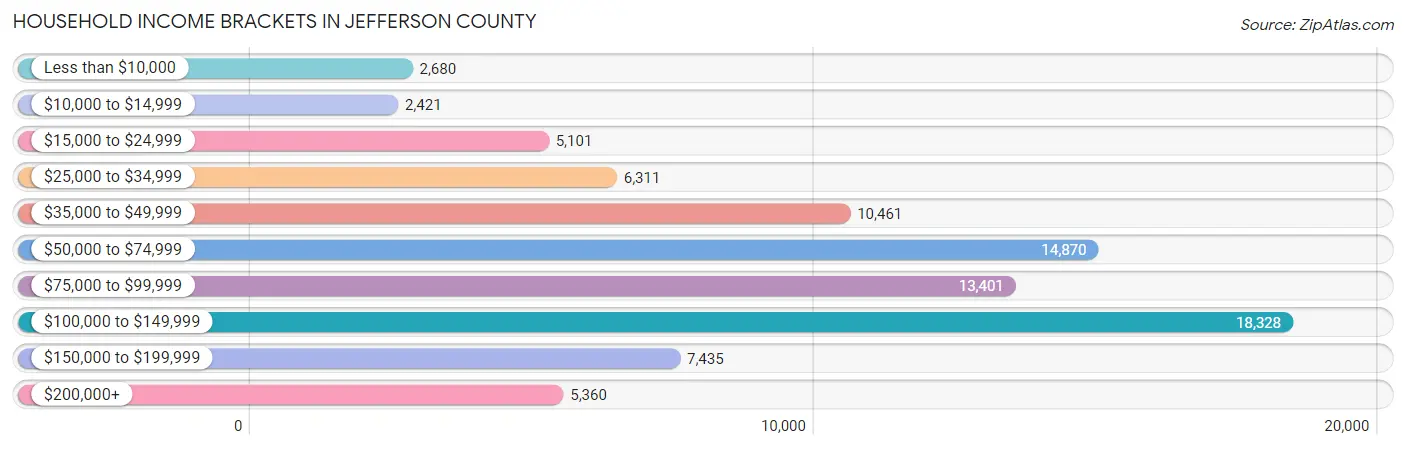
| Income Bracket | # Households | % Households |
| Less than $10,000 | 2,680 | 3.1% |
| $10,000 to $14,999 | 2,421 | 2.8% |
| $15,000 to $24,999 | 5,101 | 5.9% |
| $25,000 to $34,999 | 6,311 | 7.3% |
| $35,000 to $49,999 | 10,461 | 12.1% |
| $50,000 to $74,999 | 14,870 | 17.2% |
| $75,000 to $99,999 | 13,401 | 15.5% |
| $100,000 to $149,999 | 18,328 | 21.2% |
| $150,000 to $199,999 | 7,435 | 8.6% |
| $200,000+ | 5,360 | 6.2% |
Household Income by Householder Age in Jefferson County
The median household income in Jefferson County is $77,217, with the highest median household income of $89,683 found in the 25 to 44 years age bracket for the primary householder. A total of 27,842 households (32.2%) fall into this category. Meanwhile, the 15 to 24 years age bracket for the primary householder has the lowest median household income of $49,304, with 2,071 households (2.4%) in this group.
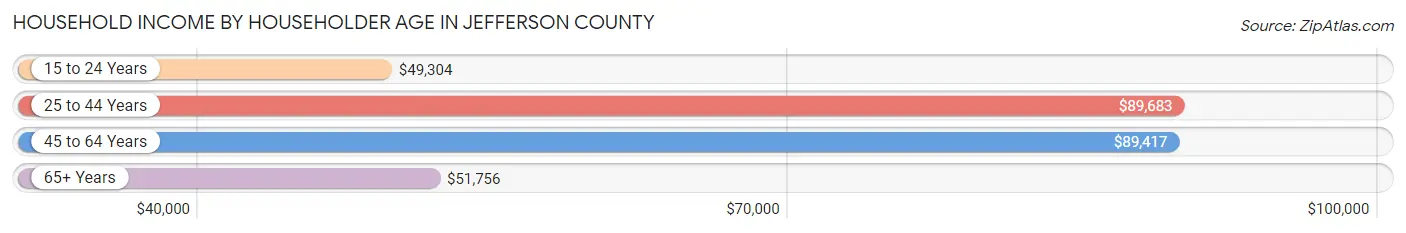
| Income Bracket | # Households | Median Income |
| 15 to 24 Years | 2,071 (2.4%) | $49,304 |
| 25 to 44 Years | 27,842 (32.2%) | $89,683 |
| 45 to 64 Years | 34,684 (40.1%) | $89,417 |
| 65+ Years | 21,858 (25.3%) | $51,756 |
| Total | 86,455 (100.0%) | $77,217 |
Poverty in Jefferson County
Income Below Poverty by Sex and Age in Jefferson County
With 7.5% poverty level for males and 9.1% for females among the residents of Jefferson County, 12 to 14 year old males and 15 year old females are the most vulnerable to poverty, with 535 males (11.8%) and 338 females (19.1%) in their respective age groups living below the poverty level.
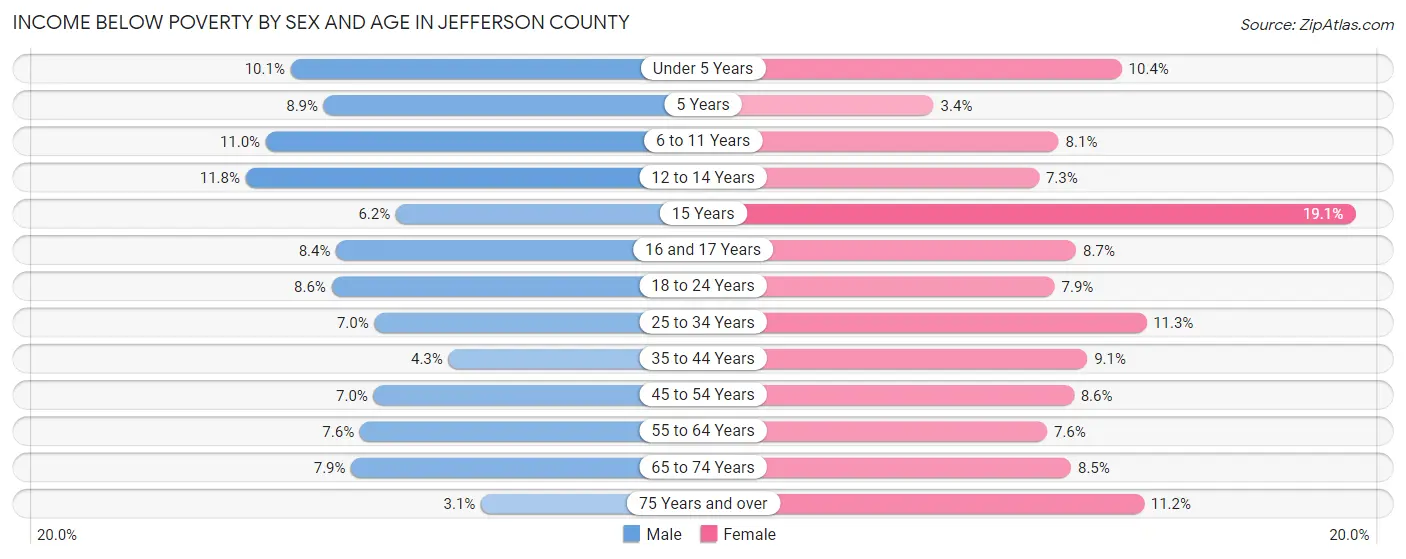
| Age Bracket | Male | Female |
| Under 5 Years | 657 (10.1%) | 638 (10.4%) |
| 5 Years | 142 (8.9%) | 37 (3.4%) |
| 6 to 11 Years | 951 (11.0%) | 687 (8.1%) |
| 12 to 14 Years | 535 (11.8%) | 310 (7.3%) |
| 15 Years | 95 (6.2%) | 338 (19.1%) |
| 16 and 17 Years | 268 (8.4%) | 246 (8.7%) |
| 18 to 24 Years | 759 (8.6%) | 662 (7.9%) |
| 25 to 34 Years | 996 (7.0%) | 1,562 (11.3%) |
| 35 to 44 Years | 670 (4.3%) | 1,377 (9.1%) |
| 45 to 54 Years | 1,046 (7.0%) | 1,254 (8.6%) |
| 55 to 64 Years | 1,265 (7.5%) | 1,264 (7.6%) |
| 65 to 74 Years | 839 (7.9%) | 992 (8.5%) |
| 75 Years and over | 165 (3.0%) | 794 (11.2%) |
| Total | 8,388 (7.5%) | 10,161 (9.1%) |
Income Above Poverty by Sex and Age in Jefferson County
According to the poverty statistics in Jefferson County, males aged 75 years and over and females aged 5 years are the age groups that are most secure financially, with 97.0% of males and 96.6% of females in these age groups living above the poverty line.
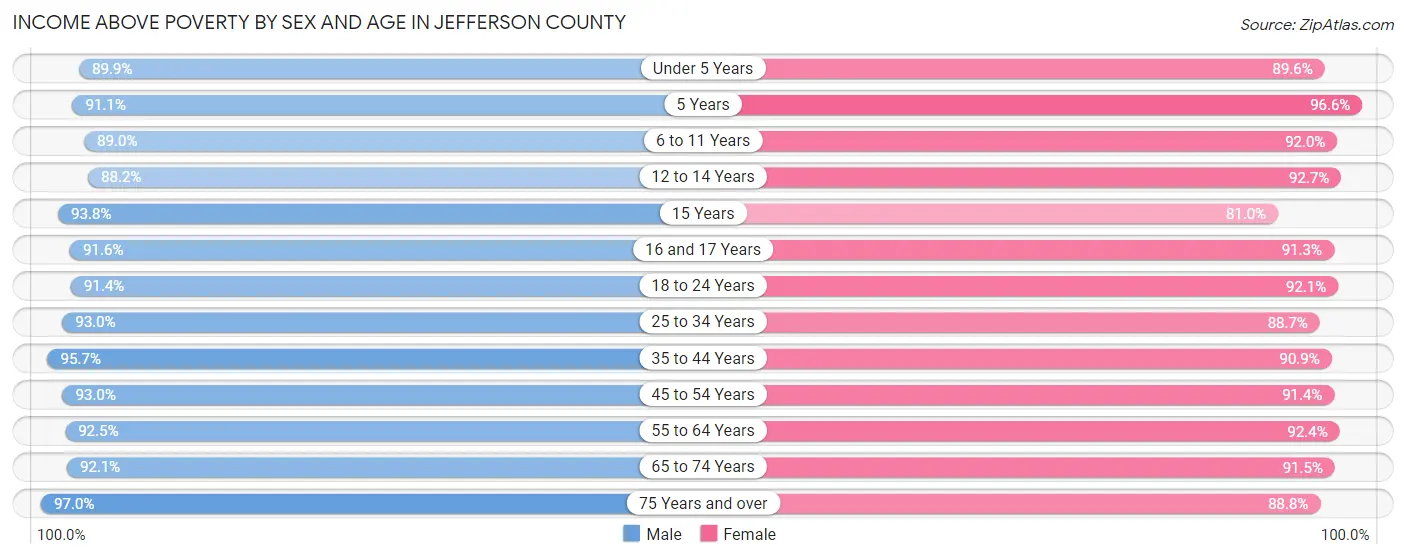
| Age Bracket | Male | Female |
| Under 5 Years | 5,834 (89.9%) | 5,503 (89.6%) |
| 5 Years | 1,456 (91.1%) | 1,048 (96.6%) |
| 6 to 11 Years | 7,664 (89.0%) | 7,850 (91.9%) |
| 12 to 14 Years | 4,004 (88.2%) | 3,926 (92.7%) |
| 15 Years | 1,435 (93.8%) | 1,436 (80.9%) |
| 16 and 17 Years | 2,911 (91.6%) | 2,583 (91.3%) |
| 18 to 24 Years | 8,070 (91.4%) | 7,720 (92.1%) |
| 25 to 34 Years | 13,214 (93.0%) | 12,261 (88.7%) |
| 35 to 44 Years | 15,060 (95.7%) | 13,735 (90.9%) |
| 45 to 54 Years | 13,805 (93.0%) | 13,318 (91.4%) |
| 55 to 64 Years | 15,484 (92.4%) | 15,317 (92.4%) |
| 65 to 74 Years | 9,817 (92.1%) | 10,661 (91.5%) |
| 75 Years and over | 5,251 (97.0%) | 6,292 (88.8%) |
| Total | 104,005 (92.5%) | 101,650 (90.9%) |
Income Below Poverty Among Married-Couple Families in Jefferson County
The poverty statistics for married-couple families in Jefferson County show that 3.0% or 1,382 of the total 46,616 families live below the poverty line. Families with 5 or more children have the highest poverty rate of 16.9%, comprising of 44 families. On the other hand, families with 1 or 2 children have the lowest poverty rate of 2.4%, which includes 350 families.
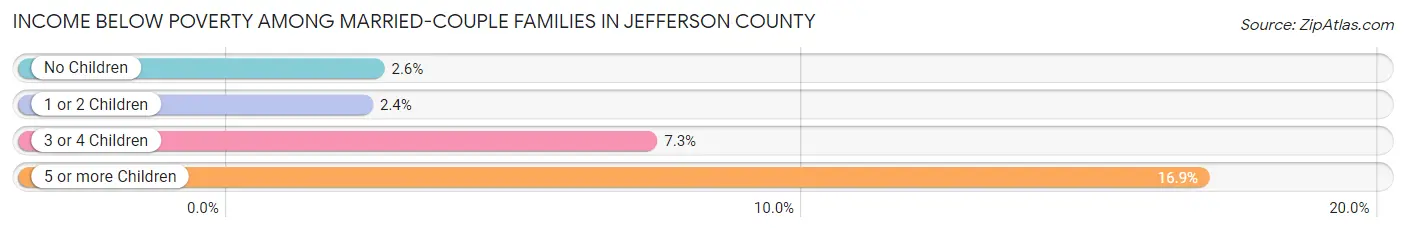
| Children | Above Poverty | Below Poverty |
| No Children | 26,875 (97.5%) | 704 (2.5%) |
| 1 or 2 Children | 14,538 (97.7%) | 350 (2.4%) |
| 3 or 4 Children | 3,605 (92.7%) | 284 (7.3%) |
| 5 or more Children | 216 (83.1%) | 44 (16.9%) |
| Total | 45,234 (97.0%) | 1,382 (3.0%) |
Income Below Poverty Among Single-Parent Households in Jefferson County
According to the poverty data in Jefferson County, 6.3% or 304 single-father households and 17.1% or 1,606 single-mother households are living below the poverty line. Among single-father households, those with 5 or more children have the highest poverty rate, with 11 households (100.0%) experiencing poverty. Likewise, among single-mother households, those with 5 or more children have the highest poverty rate, with 22 households (40.7%) falling below the poverty line.
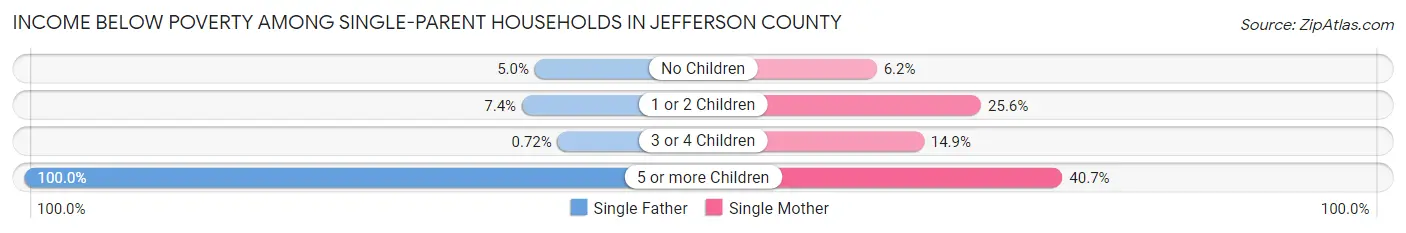
| Children | Single Father | Single Mother |
| No Children | 92 (5.0%) | 225 (6.2%) |
| 1 or 2 Children | 199 (7.4%) | 1,223 (25.6%) |
| 3 or 4 Children | 2 (0.7%) | 136 (14.9%) |
| 5 or more Children | 11 (100.0%) | 22 (40.7%) |
| Total | 304 (6.3%) | 1,606 (17.1%) |
Income Below Poverty Among Married-Couple vs Single-Parent Households in Jefferson County
The poverty data for Jefferson County shows that 1,382 of the married-couple family households (3.0%) and 1,910 of the single-parent households (13.4%) are living below the poverty level. Within the married-couple family households, those with 5 or more children have the highest poverty rate, with 44 households (16.9%) falling below the poverty line. Among the single-parent households, those with 5 or more children have the highest poverty rate, with 33 household (50.8%) living below poverty.
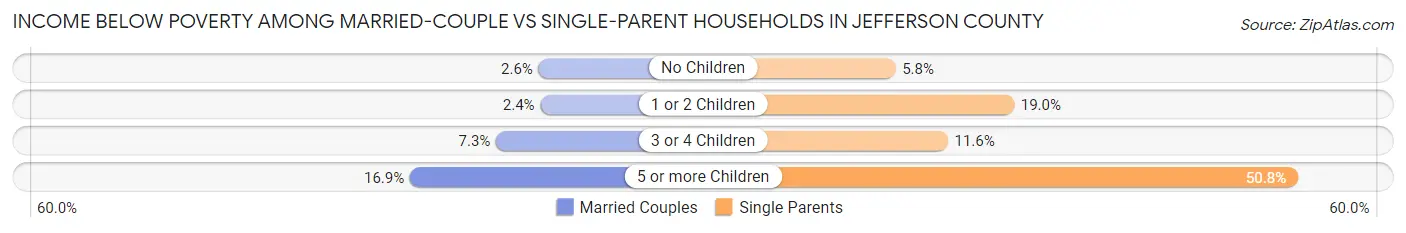
| Children | Married-Couple Families | Single-Parent Households |
| No Children | 704 (2.5%) | 317 (5.8%) |
| 1 or 2 Children | 350 (2.4%) | 1,422 (19.0%) |
| 3 or 4 Children | 284 (7.3%) | 138 (11.6%) |
| 5 or more Children | 44 (16.9%) | 33 (50.8%) |
| Total | 1,382 (3.0%) | 1,910 (13.4%) |
Race in Jefferson County
The most populous races in Jefferson County are White / Caucasian (207,690 | 91.5%), Two or more Races (13,162 | 5.8%), and Hispanic or Latino (5,031 | 2.2%).
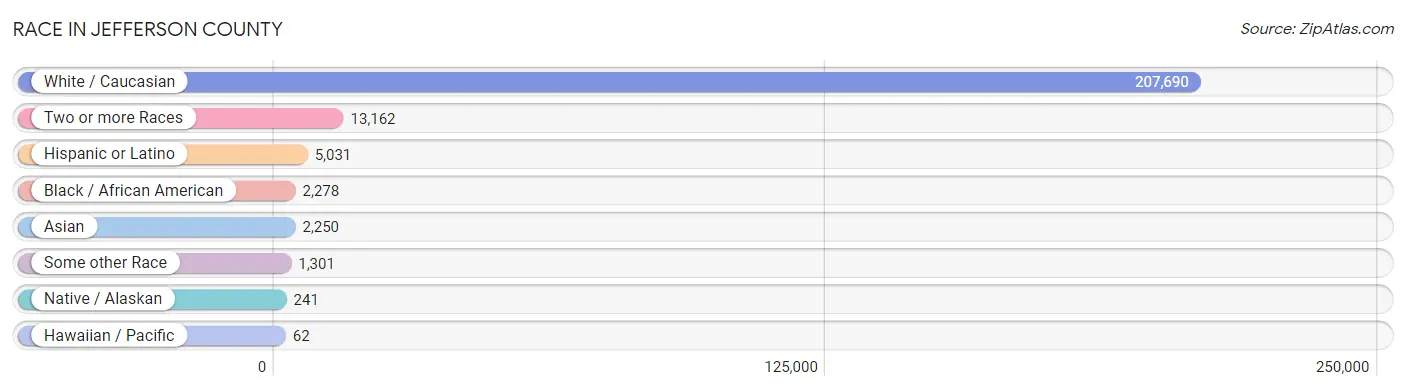
| Race | # Population | % Population |
| Asian | 2,250 | 1.0% |
| Black / African American | 2,278 | 1.0% |
| Hawaiian / Pacific | 62 | 0.0% |
| Hispanic or Latino | 5,031 | 2.2% |
| Native / Alaskan | 241 | 0.1% |
| White / Caucasian | 207,690 | 91.5% |
| Two or more Races | 13,162 | 5.8% |
| Some other Race | 1,301 | 0.6% |
| Total | 226,984 | 100.0% |
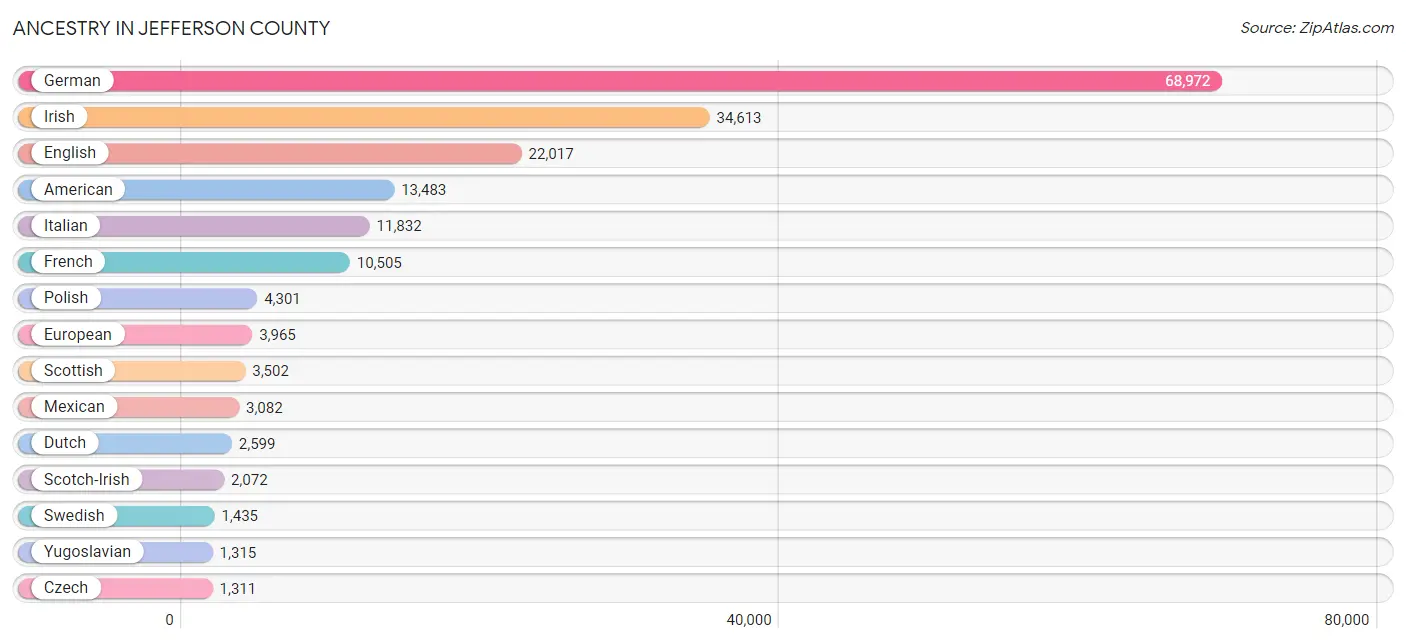
Ancestry in Jefferson County
The most populous ancestries reported in Jefferson County are German (68,972 | 30.4%), Irish (34,613 | 15.2%), English (22,017 | 9.7%), American (13,483 | 5.9%), and Italian (11,832 | 5.2%), together accounting for 66.5% of all Jefferson County residents.
| Ancestry | # Population | % Population |
| Afghan | 15 | 0.0% |
| African | 94 | 0.0% |
| Albanian | 34 | 0.0% |
| Alsatian | 10 | 0.0% |
| American | 13,483 | 5.9% |
| Apache | 11 | 0.0% |
| Arab | 519 | 0.2% |
| Argentinean | 12 | 0.0% |
| Armenian | 37 | 0.0% |
| Australian | 63 | 0.0% |
| Austrian | 578 | 0.3% |
| Basque | 67 | 0.0% |
| Belgian | 240 | 0.1% |
| Belizean | 9 | 0.0% |
| Bhutanese | 198 | 0.1% |
| Blackfeet | 40 | 0.0% |
| Bolivian | 8 | 0.0% |
| Brazilian | 9 | 0.0% |
| British | 1,168 | 0.5% |
| Bulgarian | 24 | 0.0% |
| Burmese | 343 | 0.2% |
| Cajun | 2 | 0.0% |
| Canadian | 220 | 0.1% |
| Carpatho Rusyn | 10 | 0.0% |
| Celtic | 31 | 0.0% |
| Central American | 391 | 0.2% |
| Central American Indian | 5 | 0.0% |
| Cherokee | 835 | 0.4% |
| Chickasaw | 24 | 0.0% |
| Choctaw | 57 | 0.0% |
| Colombian | 103 | 0.1% |
| Comanche | 5 | 0.0% |
| Costa Rican | 91 | 0.0% |
| Creek | 17 | 0.0% |
| Croatian | 723 | 0.3% |
| Cuban | 41 | 0.0% |
| Czech | 1,311 | 0.6% |
| Czechoslovakian | 177 | 0.1% |
| Danish | 441 | 0.2% |
| Delaware | 4 | 0.0% |
| Dominican | 35 | 0.0% |
| Dutch | 2,599 | 1.1% |
| Eastern European | 496 | 0.2% |
| Egyptian | 19 | 0.0% |
| English | 22,017 | 9.7% |
| Ethiopian | 74 | 0.0% |
| European | 3,965 | 1.8% |
| Filipino | 43 | 0.0% |
| Finnish | 83 | 0.0% |
| French | 10,505 | 4.6% |
| French American Indian | 10 | 0.0% |
| French Canadian | 374 | 0.2% |
| German | 68,972 | 30.4% |
| German Russian | 32 | 0.0% |
| Greek | 654 | 0.3% |
| Guamanian / Chamorro | 10 | 0.0% |
| Guatemalan | 5 | 0.0% |
| Honduran | 10 | 0.0% |
| Hungarian | 1,207 | 0.5% |
| Icelander | 19 | 0.0% |
| Indian (Asian) | 547 | 0.2% |
| Inupiat | 1 | 0.0% |
| Iraqi | 142 | 0.1% |
| Irish | 34,613 | 15.2% |
| Iroquois | 44 | 0.0% |
| Italian | 11,832 | 5.2% |
| Jamaican | 9 | 0.0% |
| Japanese | 68 | 0.0% |
| Kenyan | 203 | 0.1% |
| Korean | 488 | 0.2% |
| Laotian | 35 | 0.0% |
| Latvian | 30 | 0.0% |
| Lebanese | 149 | 0.1% |
| Lithuanian | 181 | 0.1% |
| Lumbee | 16 | 0.0% |
| Malaysian | 68 | 0.0% |
| Mexican | 3,082 | 1.4% |
| Mongolian | 9 | 0.0% |
| Moroccan | 114 | 0.1% |
| Native Hawaiian | 136 | 0.1% |
| Nicaraguan | 285 | 0.1% |
| Nigerian | 25 | 0.0% |
| Northern European | 102 | 0.0% |
| Norwegian | 1,100 | 0.5% |
| Osage | 3 | 0.0% |
| Pakistani | 258 | 0.1% |
| Pennsylvania German | 15 | 0.0% |
| Peruvian | 145 | 0.1% |
| Polish | 4,301 | 1.9% |
| Portuguese | 76 | 0.0% |
| Puerto Rican | 460 | 0.2% |
| Romanian | 195 | 0.1% |
| Russian | 450 | 0.2% |
| Samoan | 50 | 0.0% |
| Scandinavian | 618 | 0.3% |
| Scotch-Irish | 2,072 | 0.9% |
| Scottish | 3,502 | 1.5% |
| Seminole | 2 | 0.0% |
| Serbian | 320 | 0.1% |
| Shoshone | 3 | 0.0% |
| Sierra Leonean | 24 | 0.0% |
| Sioux | 42 | 0.0% |
| Slavic | 59 | 0.0% |
| Slovak | 280 | 0.1% |
| Slovene | 148 | 0.1% |
| South American | 285 | 0.1% |
| Spaniard | 204 | 0.1% |
| Spanish | 357 | 0.2% |
| Sri Lankan | 119 | 0.1% |
| Subsaharan African | 472 | 0.2% |
| Swedish | 1,435 | 0.6% |
| Swiss | 556 | 0.2% |
| Syrian | 15 | 0.0% |
| Thai | 352 | 0.2% |
| Tongan | 15 | 0.0% |
| Turkish | 48 | 0.0% |
| Ukrainian | 271 | 0.1% |
| Venezuelan | 17 | 0.0% |
| Vietnamese | 133 | 0.1% |
| Welsh | 669 | 0.3% |
| Yugoslavian | 1,315 | 0.6% | View All 121 Rows |
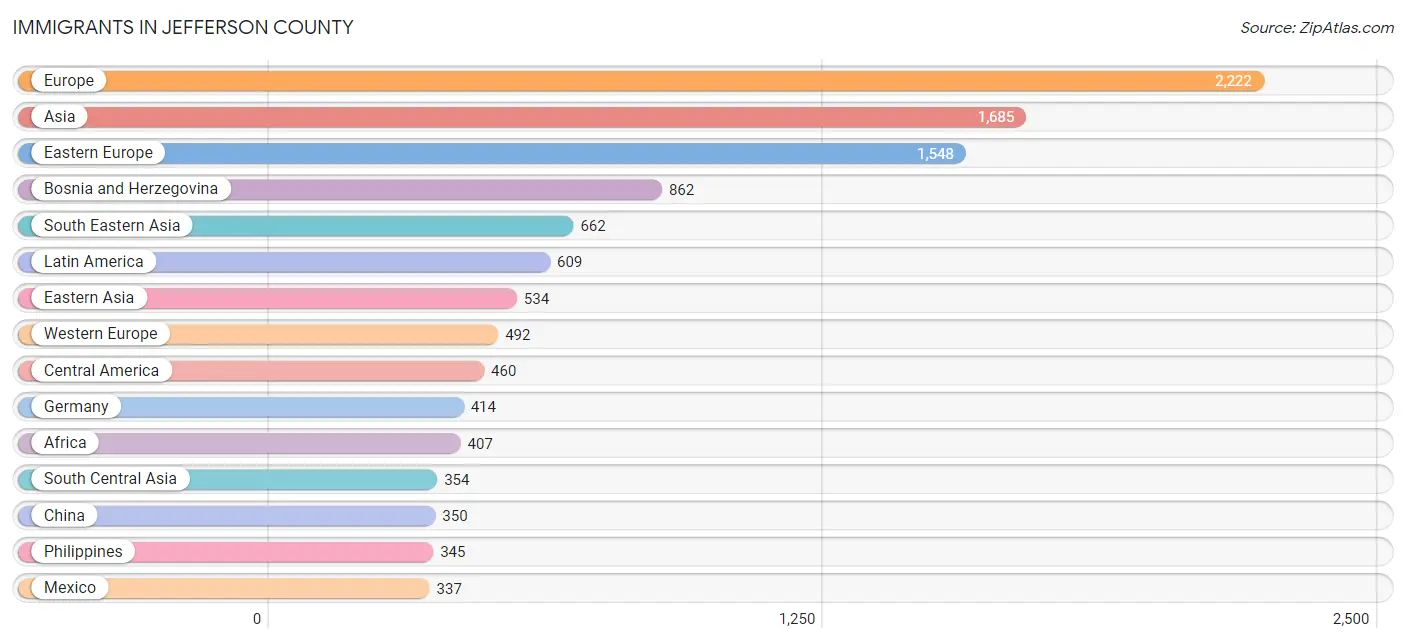
Immigrants in Jefferson County
The most numerous immigrant groups reported in Jefferson County came from Europe (2,222 | 1.0%), Asia (1,685 | 0.7%), Eastern Europe (1,548 | 0.7%), Bosnia and Herzegovina (862 | 0.4%), and South Eastern Asia (662 | 0.3%), together accounting for 3.1% of all Jefferson County residents.
| Immigration Origin | # Population | % Population |
| Afghanistan | 4 | 0.0% |
| Africa | 407 | 0.2% |
| Asia | 1,685 | 0.7% |
| Austria | 53 | 0.0% |
| Bangladesh | 133 | 0.1% |
| Belarus | 12 | 0.0% |
| Bolivia | 8 | 0.0% |
| Bosnia and Herzegovina | 862 | 0.4% |
| Brazil | 19 | 0.0% |
| Bulgaria | 22 | 0.0% |
| Cambodia | 19 | 0.0% |
| Canada | 123 | 0.1% |
| Caribbean | 14 | 0.0% |
| Central America | 460 | 0.2% |
| China | 350 | 0.2% |
| Colombia | 54 | 0.0% |
| Croatia | 244 | 0.1% |
| Cuba | 14 | 0.0% |
| Czechoslovakia | 27 | 0.0% |
| Eastern Africa | 208 | 0.1% |
| Eastern Asia | 534 | 0.2% |
| Eastern Europe | 1,548 | 0.7% |
| Egypt | 22 | 0.0% |
| England | 23 | 0.0% |
| Ethiopia | 22 | 0.0% |
| Europe | 2,222 | 1.0% |
| France | 16 | 0.0% |
| Germany | 414 | 0.2% |
| Greece | 19 | 0.0% |
| Guatemala | 32 | 0.0% |
| Honduras | 10 | 0.0% |
| Hungary | 8 | 0.0% |
| India | 60 | 0.0% |
| Iraq | 110 | 0.1% |
| Ireland | 3 | 0.0% |
| Italy | 70 | 0.0% |
| Japan | 12 | 0.0% |
| Kazakhstan | 13 | 0.0% |
| Kenya | 134 | 0.1% |
| Korea | 172 | 0.1% |
| Laos | 43 | 0.0% |
| Latin America | 609 | 0.3% |
| Malaysia | 50 | 0.0% |
| Mexico | 337 | 0.2% |
| Morocco | 114 | 0.1% |
| Nepal | 85 | 0.0% |
| Nicaragua | 64 | 0.0% |
| Nigeria | 25 | 0.0% |
| Northern Africa | 136 | 0.1% |
| Northern Europe | 90 | 0.0% |
| Oceania | 21 | 0.0% |
| Pakistan | 46 | 0.0% |
| Panama | 17 | 0.0% |
| Peru | 37 | 0.0% |
| Philippines | 345 | 0.2% |
| Poland | 103 | 0.1% |
| Russia | 113 | 0.1% |
| Scotland | 10 | 0.0% |
| Senegal | 38 | 0.0% |
| Serbia | 52 | 0.0% |
| South America | 135 | 0.1% |
| South Central Asia | 354 | 0.2% |
| South Eastern Asia | 662 | 0.3% |
| Southern Europe | 92 | 0.0% |
| Spain | 3 | 0.0% |
| Switzerland | 9 | 0.0% |
| Taiwan | 52 | 0.0% |
| Thailand | 90 | 0.0% |
| Turkey | 25 | 0.0% |
| Ukraine | 39 | 0.0% |
| Uzbekistan | 13 | 0.0% |
| Venezuela | 17 | 0.0% |
| Vietnam | 115 | 0.1% |
| Western Africa | 63 | 0.0% |
| Western Asia | 135 | 0.1% |
| Western Europe | 492 | 0.2% | View All 76 Rows |
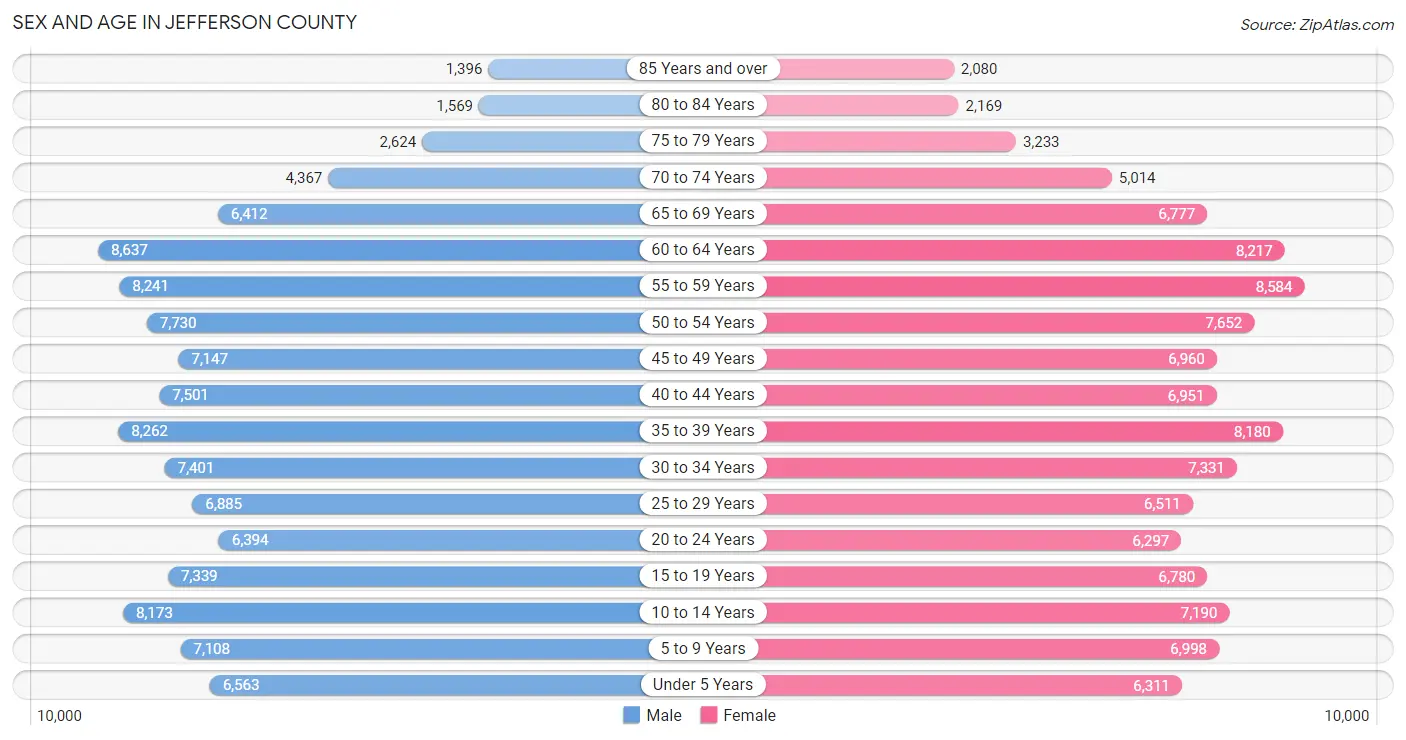
Sex and Age in Jefferson County
Sex and Age in Jefferson County
The most populous age groups in Jefferson County are 60 to 64 Years (8,637 | 7.6%) for men and 55 to 59 Years (8,584 | 7.6%) for women.
| Age Bracket | Male | Female |
| Under 5 Years | 6,563 (5.8%) | 6,311 (5.6%) |
| 5 to 9 Years | 7,108 (6.2%) | 6,998 (6.2%) |
| 10 to 14 Years | 8,173 (7.2%) | 7,190 (6.4%) |
| 15 to 19 Years | 7,339 (6.5%) | 6,780 (6.0%) |
| 20 to 24 Years | 6,394 (5.6%) | 6,297 (5.6%) |
| 25 to 29 Years | 6,885 (6.0%) | 6,511 (5.8%) |
| 30 to 34 Years | 7,401 (6.5%) | 7,331 (6.5%) |
| 35 to 39 Years | 8,262 (7.3%) | 8,180 (7.2%) |
| 40 to 44 Years | 7,501 (6.6%) | 6,951 (6.1%) |
| 45 to 49 Years | 7,147 (6.3%) | 6,960 (6.1%) |
| 50 to 54 Years | 7,730 (6.8%) | 7,652 (6.8%) |
| 55 to 59 Years | 8,241 (7.2%) | 8,584 (7.6%) |
| 60 to 64 Years | 8,637 (7.6%) | 8,217 (7.3%) |
| 65 to 69 Years | 6,412 (5.6%) | 6,777 (6.0%) |
| 70 to 74 Years | 4,367 (3.8%) | 5,014 (4.4%) |
| 75 to 79 Years | 2,624 (2.3%) | 3,233 (2.9%) |
| 80 to 84 Years | 1,569 (1.4%) | 2,169 (1.9%) |
| 85 Years and over | 1,396 (1.2%) | 2,080 (1.8%) |
| Total | 113,749 (100.0%) | 113,235 (100.0%) |
Families and Households in Jefferson County
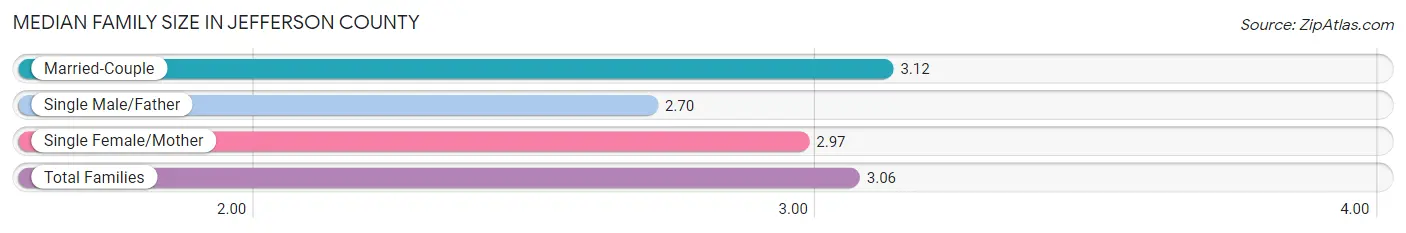
Median Family Size in Jefferson County
The median family size in Jefferson County is 3.06 persons per family, with married-couple families (46,616 | 76.6%) accounting for the largest median family size of 3.12 persons per family. On the other hand, single male/father families (4,841 | 8.0%) represent the smallest median family size with 2.70 persons per family.
| Family Type | # Families | Family Size |
| Married-Couple | 46,616 (76.6%) | 3.12 |
| Single Male/Father | 4,841 (8.0%) | 2.70 |
| Single Female/Mother | 9,396 (15.4%) | 2.97 |
| Total Families | 60,853 (100.0%) | 3.06 |
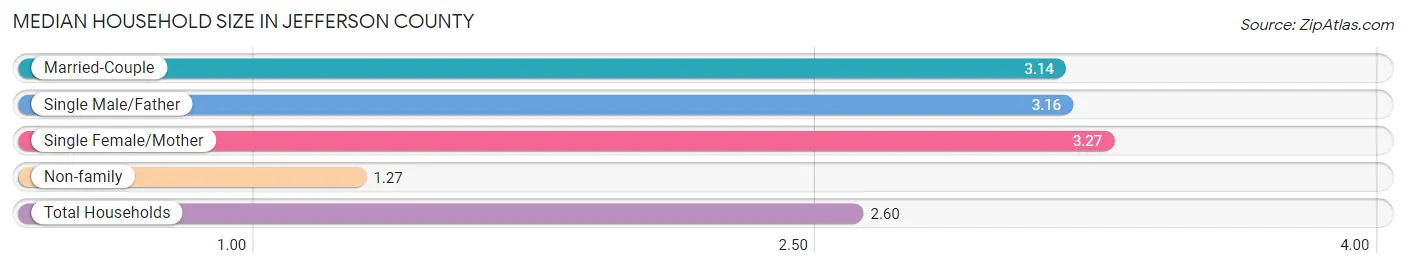
Median Household Size in Jefferson County
The median household size in Jefferson County is 2.60 persons per household, with single female/mother households (9,396 | 10.9%) accounting for the largest median household size of 3.27 persons per household. non-family households (25,602 | 29.6%) represent the smallest median household size with 1.27 persons per household.
| Household Type | # Households | Household Size |
| Married-Couple | 46,616 (53.9%) | 3.14 |
| Single Male/Father | 4,841 (5.6%) | 3.16 |
| Single Female/Mother | 9,396 (10.9%) | 3.27 |
| Non-family | 25,602 (29.6%) | 1.27 |
| Total Households | 86,455 (100.0%) | 2.60 |
Household Size by Marriage Status in Jefferson County
Out of a total of 86,455 households in Jefferson County, 60,853 (70.4%) are family households, while 25,602 (29.6%) are nonfamily households. The most numerous type of family households are 2-person households, comprising 26,817, and the most common type of nonfamily households are 1-person households, comprising 19,883.
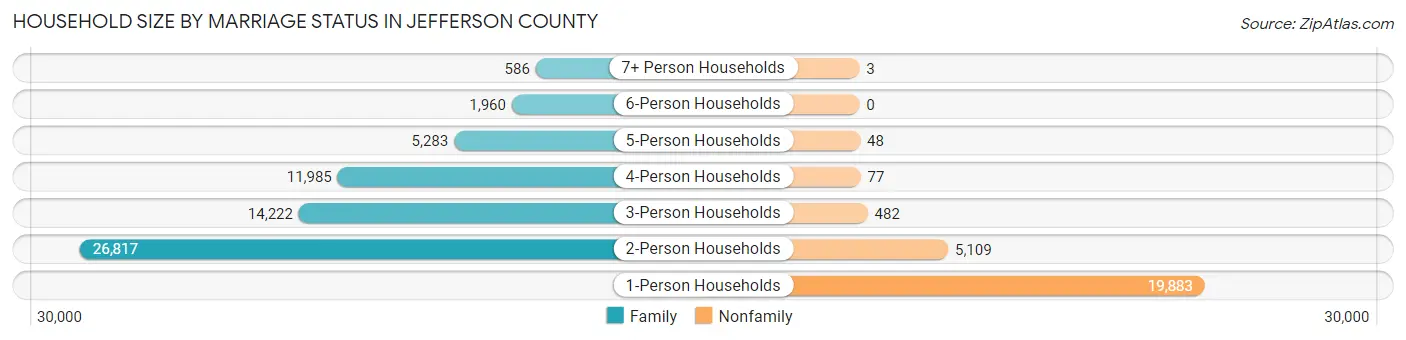
| Household Size | Family Households | Nonfamily Households |
| 1-Person Households | - | 19,883 (23.0%) |
| 2-Person Households | 26,817 (31.0%) | 5,109 (5.9%) |
| 3-Person Households | 14,222 (16.5%) | 482 (0.6%) |
| 4-Person Households | 11,985 (13.9%) | 77 (0.1%) |
| 5-Person Households | 5,283 (6.1%) | 48 (0.1%) |
| 6-Person Households | 1,960 (2.3%) | 0 (0.0%) |
| 7+ Person Households | 586 (0.7%) | 3 (0.0%) |
| Total | 60,853 (70.4%) | 25,602 (29.6%) |
Female Fertility in Jefferson County
Fertility by Age in Jefferson County
Average fertility rate in Jefferson County is 47.0 births per 1,000 women. Women in the age bracket of 20 to 34 years have the highest fertility rate with 87.0 births per 1,000 women. Women in the age bracket of 20 to 34 years acount for 73.4% of all women with births.
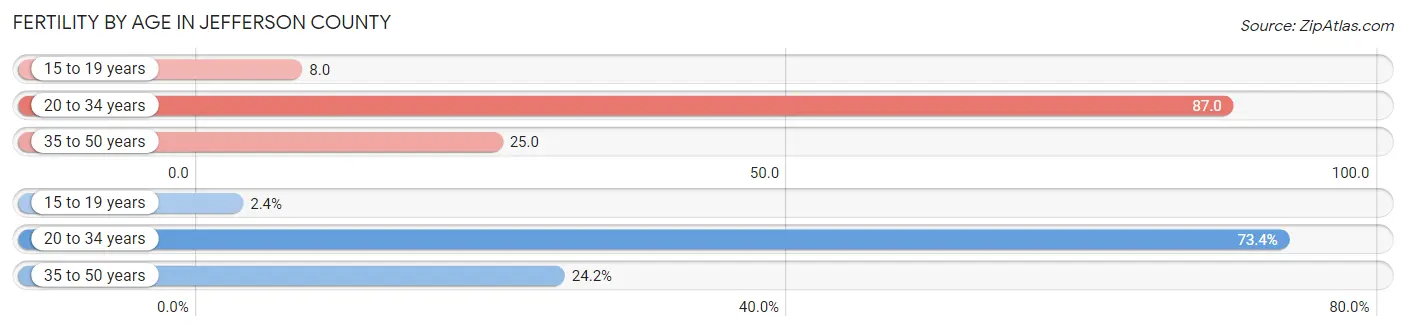
| Age Bracket | Women with Births | Births / 1,000 Women |
| 15 to 19 years | 57 (2.4%) | 8.0 |
| 20 to 34 years | 1,751 (73.4%) | 87.0 |
| 35 to 50 years | 578 (24.2%) | 25.0 |
| Total | 2,386 (100.0%) | 47.0 |
Fertility by Age by Marriage Status in Jefferson County
70.9% of women with births (2,386) in Jefferson County are married. The highest percentage of unmarried women with births falls into 15 to 19 years age bracket with 100.0% of them unmarried at the time of birth, while the lowest percentage of unmarried women with births belong to 35 to 50 years age bracket with 25.1% of them unmarried.
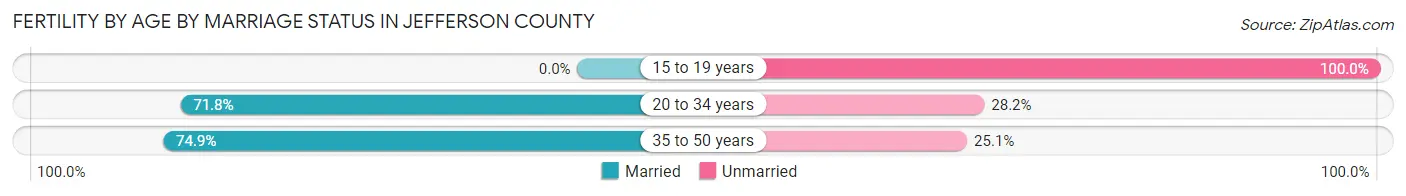
| Age Bracket | Married | Unmarried |
| 15 to 19 years | 0 (0.0%) | 57 (100.0%) |
| 20 to 34 years | 1,257 (71.8%) | 494 (28.2%) |
| 35 to 50 years | 433 (74.9%) | 145 (25.1%) |
| Total | 1,692 (70.9%) | 694 (29.1%) |
Fertility by Education in Jefferson County
Average fertility rate in Jefferson County is 47.0 births per 1,000 women. Women with the education attainment of college or associate's degree have the highest fertility rate of 58.0 births per 1,000 women, while women with the education attainment of less than high school have the lowest fertility at 24.0 births per 1,000 women. Women with the education attainment of college or associate's degree represent 46.7% of all women with births.
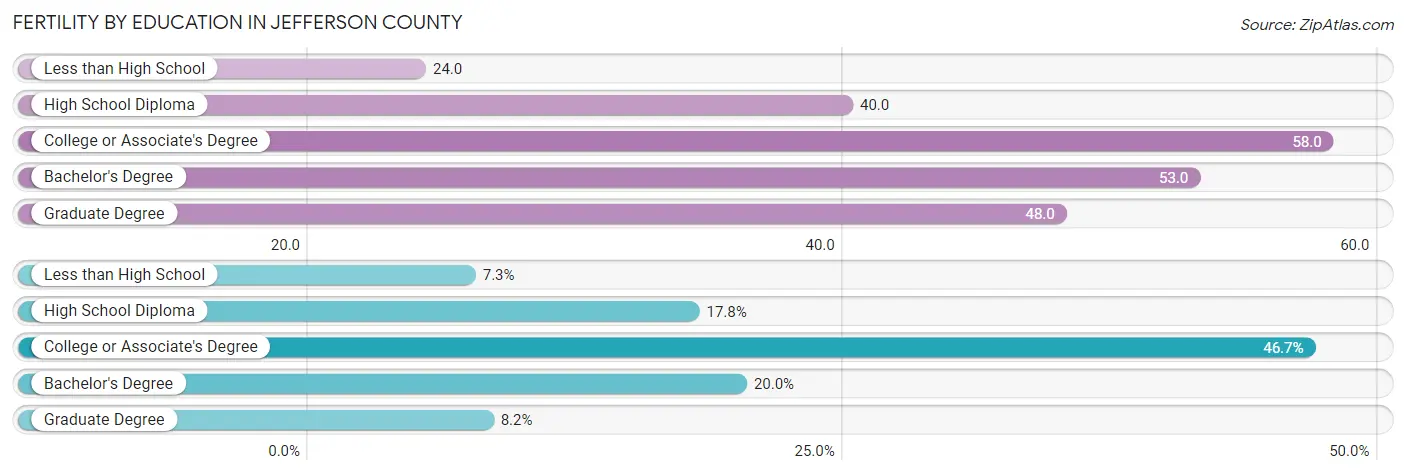
| Educational Attainment | Women with Births | Births / 1,000 Women |
| Less than High School | 175 (7.3%) | 24.0 |
| High School Diploma | 425 (17.8%) | 40.0 |
| College or Associate's Degree | 1,113 (46.7%) | 58.0 |
| Bachelor's Degree | 478 (20.0%) | 53.0 |
| Graduate Degree | 195 (8.2%) | 48.0 |
| Total | 2,386 (100.0%) | 47.0 |
Fertility by Education by Marriage Status in Jefferson County
29.1% of women with births in Jefferson County are unmarried. Women with the educational attainment of graduate degree are most likely to be married with 100.0% of them married at childbirth, while women with the educational attainment of less than high school are least likely to be married with 60.0% of them unmarried at childbirth.
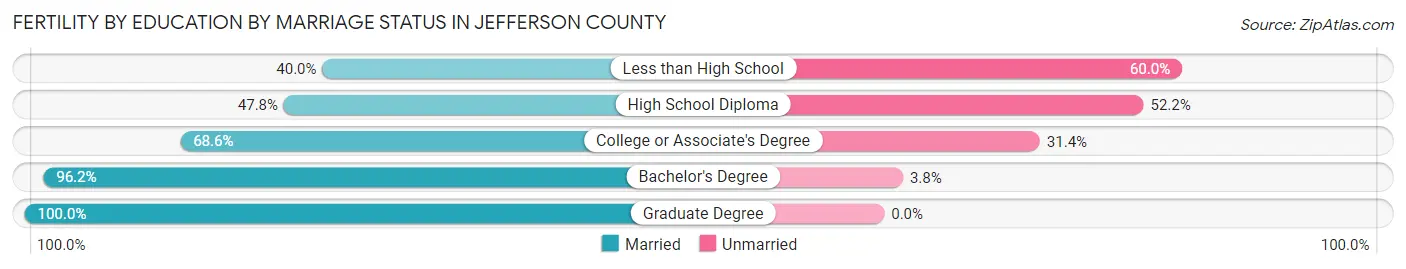
| Educational Attainment | Married | Unmarried |
| Less than High School | 70 (40.0%) | 105 (60.0%) |
| High School Diploma | 203 (47.8%) | 222 (52.2%) |
| College or Associate's Degree | 764 (68.6%) | 349 (31.4%) |
| Bachelor's Degree | 460 (96.2%) | 18 (3.8%) |
| Graduate Degree | 195 (100.0%) | 0 (0.0%) |
| Total | 1,692 (70.9%) | 694 (29.1%) |
Employment Characteristics in Jefferson County
Employment by Class of Employer in Jefferson County
Among the 113,879 employed individuals in Jefferson County, private company employees (84,479 | 74.2%), not-for-profit organizations (10,409 | 9.1%), and local government employees (6,474 | 5.7%) make up the most common classes of employment.
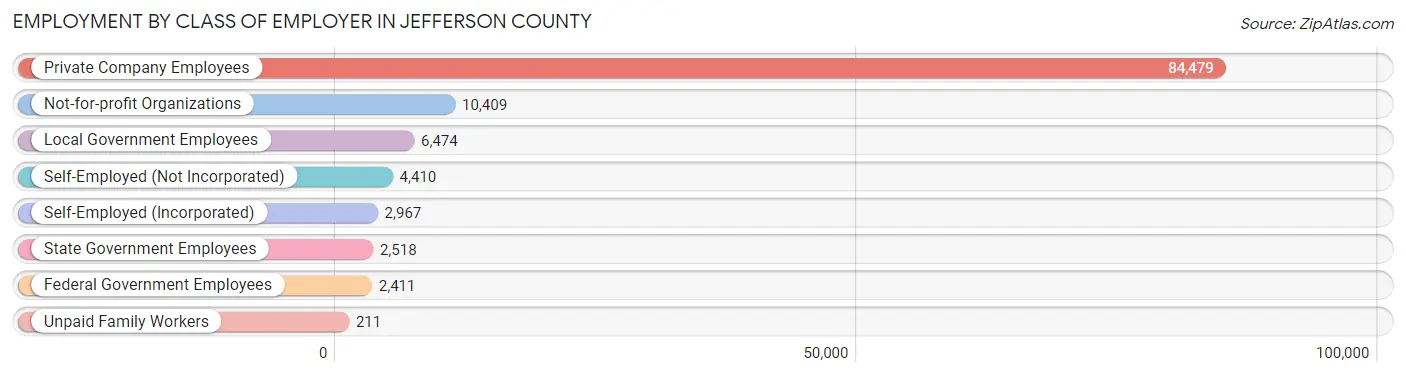
| Employer Class | # Employees | % Employees |
| Private Company Employees | 84,479 | 74.2% |
| Self-Employed (Incorporated) | 2,967 | 2.6% |
| Self-Employed (Not Incorporated) | 4,410 | 3.9% |
| Not-for-profit Organizations | 10,409 | 9.1% |
| Local Government Employees | 6,474 | 5.7% |
| State Government Employees | 2,518 | 2.2% |
| Federal Government Employees | 2,411 | 2.1% |
| Unpaid Family Workers | 211 | 0.2% |
| Total | 113,879 | 100.0% |
Employment Status by Age in Jefferson County
According to the labor force statistics for Jefferson County, out of the total population over 16 years of age (181,316), 66.2% or 120,031 individuals are in the labor force, with 3.8% or 4,561 of them unemployed. The age group with the highest labor force participation rate is 25 to 29 years, with 89.3% or 11,963 individuals in the labor force. Within the labor force, the 16 to 19 years age range has the highest percentage of unemployed individuals, with 9.7% or 522 of them being unemployed.
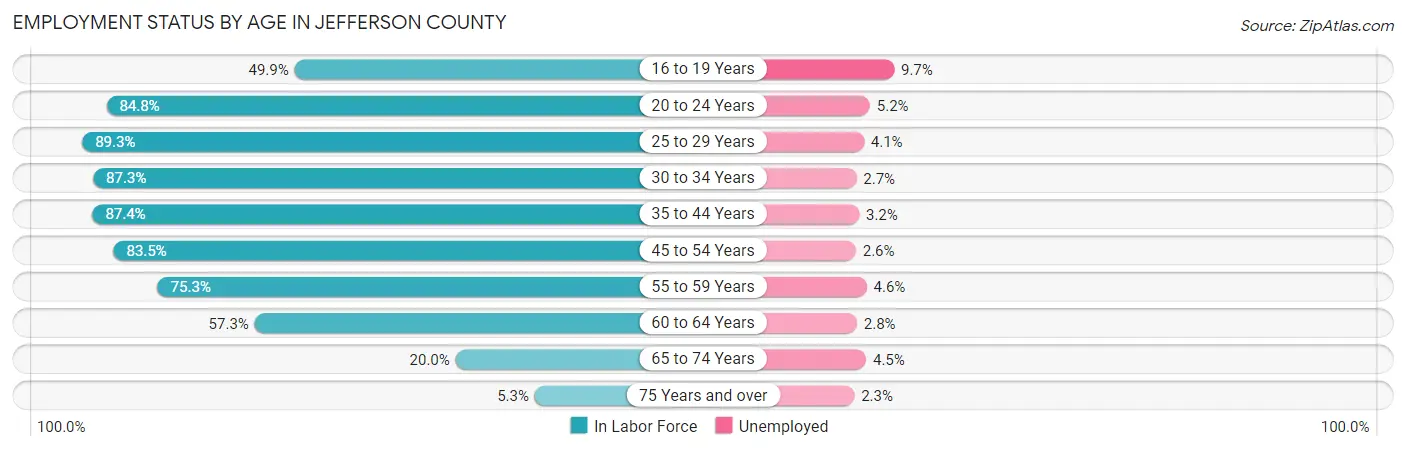
| Age Bracket | In Labor Force | Unemployed |
| 16 to 19 Years | 5,386 (49.9%) | 522 (9.7%) |
| 20 to 24 Years | 10,762 (84.8%) | 560 (5.2%) |
| 25 to 29 Years | 11,963 (89.3%) | 490 (4.1%) |
| 30 to 34 Years | 12,861 (87.3%) | 347 (2.7%) |
| 35 to 44 Years | 27,001 (87.4%) | 864 (3.2%) |
| 45 to 54 Years | 24,623 (83.5%) | 640 (2.6%) |
| 55 to 59 Years | 12,669 (75.3%) | 583 (4.6%) |
| 60 to 64 Years | 9,657 (57.3%) | 270 (2.8%) |
| 65 to 74 Years | 4,514 (20.0%) | 203 (4.5%) |
| 75 Years and over | 693 (5.3%) | 16 (2.3%) |
| Total | 120,031 (66.2%) | 4,561 (3.8%) |
Employment Status by Educational Attainment in Jefferson County
According to labor force statistics for Jefferson County, 80.8% of individuals (98,730) out of the total population between 25 and 64 years of age (122,190) are in the labor force, with 3.2% or 3,159 of them being unemployed. The group with the highest labor force participation rate are those with the educational attainment of bachelor's degree or higher, with 89.3% or 26,998 individuals in the labor force. Within the labor force, individuals with less than high school education have the highest percentage of unemployment, with 7.9% or 411 of them being unemployed.
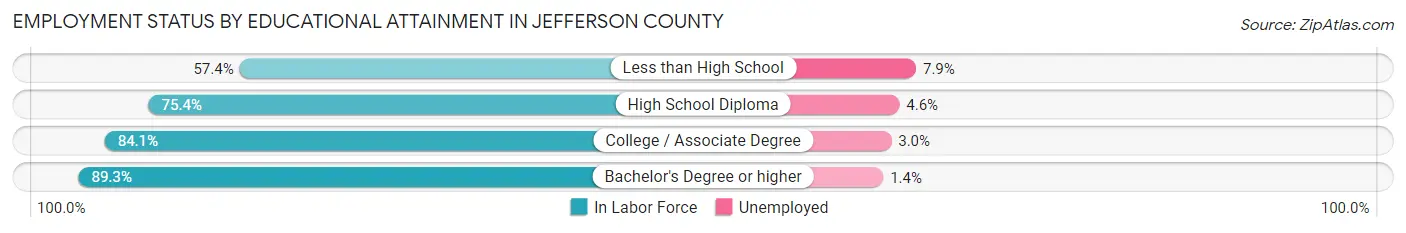
| Educational Attainment | In Labor Force | Unemployed |
| Less than High School | 5,208 (57.4%) | 717 (7.9%) |
| High School Diploma | 27,397 (75.4%) | 1,671 (4.6%) |
| College / Associate Degree | 39,147 (84.1%) | 1,396 (3.0%) |
| Bachelor's Degree or higher | 26,998 (89.3%) | 423 (1.4%) |
| Total | 98,730 (80.8%) | 3,910 (3.2%) |
Employment Occupations by Sex in Jefferson County
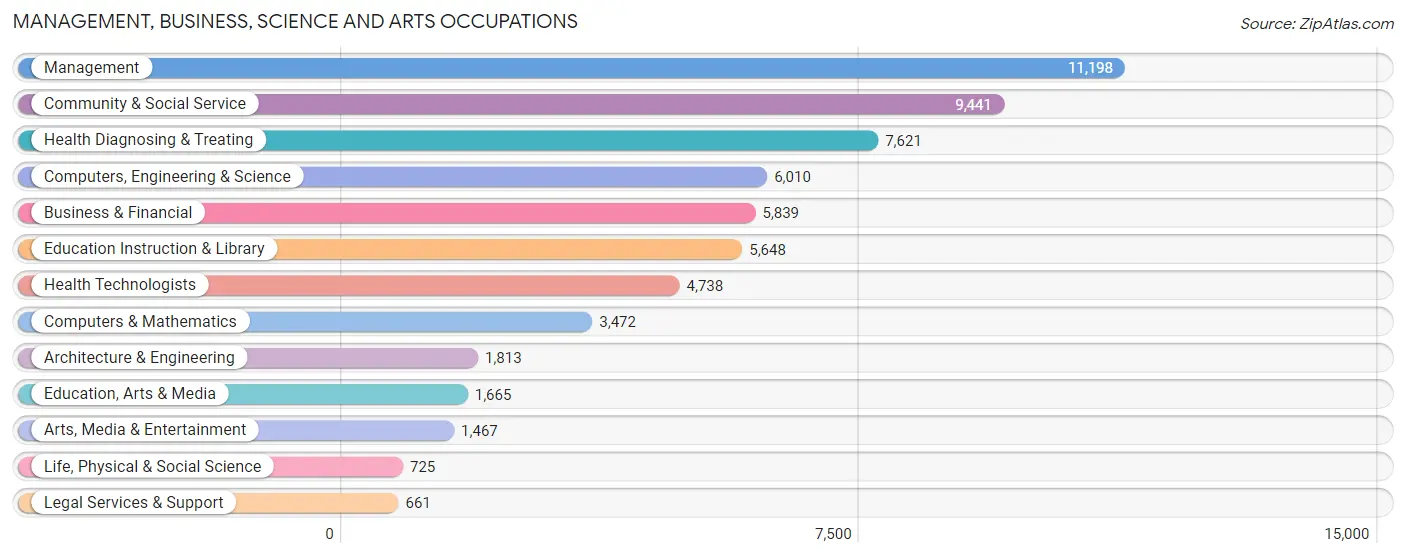
Management, Business, Science and Arts Occupations
The most common Management, Business, Science and Arts occupations in Jefferson County are Management (11,198 | 9.7%), Community & Social Service (9,441 | 8.2%), Health Diagnosing & Treating (7,621 | 6.6%), Computers, Engineering & Science (6,010 | 5.2%), and Business & Financial (5,839 | 5.1%).
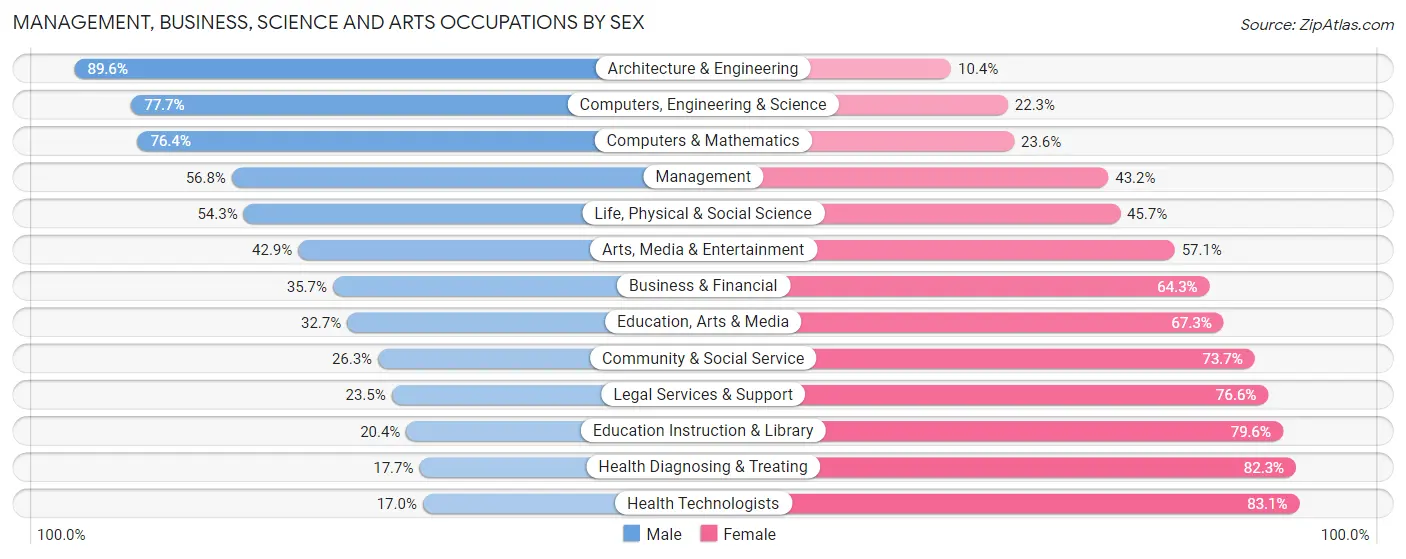
Management, Business, Science and Arts Occupations by Sex
Within the Management, Business, Science and Arts occupations in Jefferson County, the most male-oriented occupations are Architecture & Engineering (89.6%), Computers, Engineering & Science (77.7%), and Computers & Mathematics (76.4%), while the most female-oriented occupations are Health Technologists (83.1%), Health Diagnosing & Treating (82.3%), and Education Instruction & Library (79.6%).
| Occupation | Male | Female |
| Management | 6,361 (56.8%) | 4,837 (43.2%) |
| Business & Financial | 2,085 (35.7%) | 3,754 (64.3%) |
| Computers, Engineering & Science | 4,672 (77.7%) | 1,338 (22.3%) |
| Computers & Mathematics | 2,654 (76.4%) | 818 (23.6%) |
| Architecture & Engineering | 1,624 (89.6%) | 189 (10.4%) |
| Life, Physical & Social Science | 394 (54.3%) | 331 (45.7%) |
| Community & Social Service | 2,482 (26.3%) | 6,959 (73.7%) |
| Education, Arts & Media | 545 (32.7%) | 1,120 (67.3%) |
| Legal Services & Support | 155 (23.4%) | 506 (76.5%) |
| Education Instruction & Library | 1,152 (20.4%) | 4,496 (79.6%) |
| Arts, Media & Entertainment | 630 (42.9%) | 837 (57.1%) |
| Health Diagnosing & Treating | 1,346 (17.7%) | 6,275 (82.3%) |
| Health Technologists | 803 (17.0%) | 3,935 (83.1%) |
| Total (Category) | 16,946 (42.2%) | 23,163 (57.8%) |
| Total (Overall) | 60,702 (52.6%) | 54,620 (47.4%) |
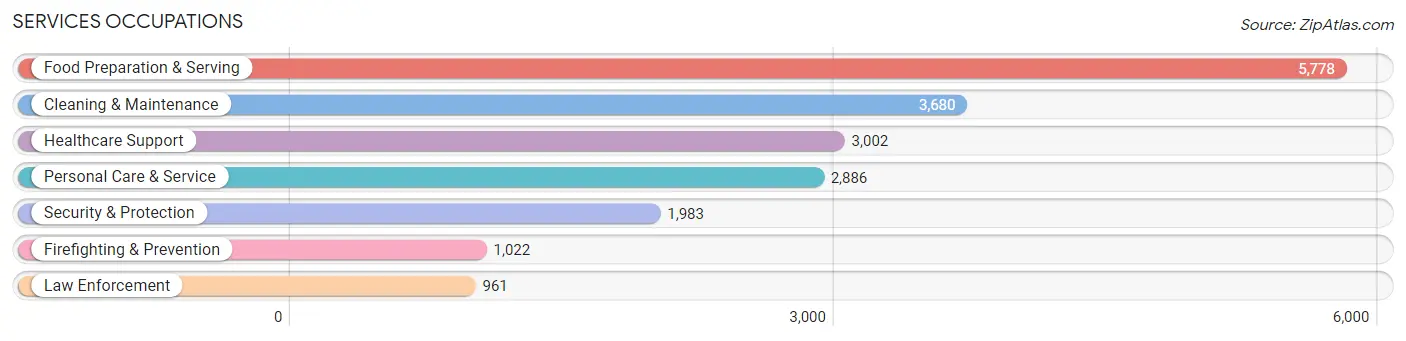
Services Occupations
The most common Services occupations in Jefferson County are Food Preparation & Serving (5,778 | 5.0%), Cleaning & Maintenance (3,680 | 3.2%), Healthcare Support (3,002 | 2.6%), Personal Care & Service (2,886 | 2.5%), and Security & Protection (1,983 | 1.7%).
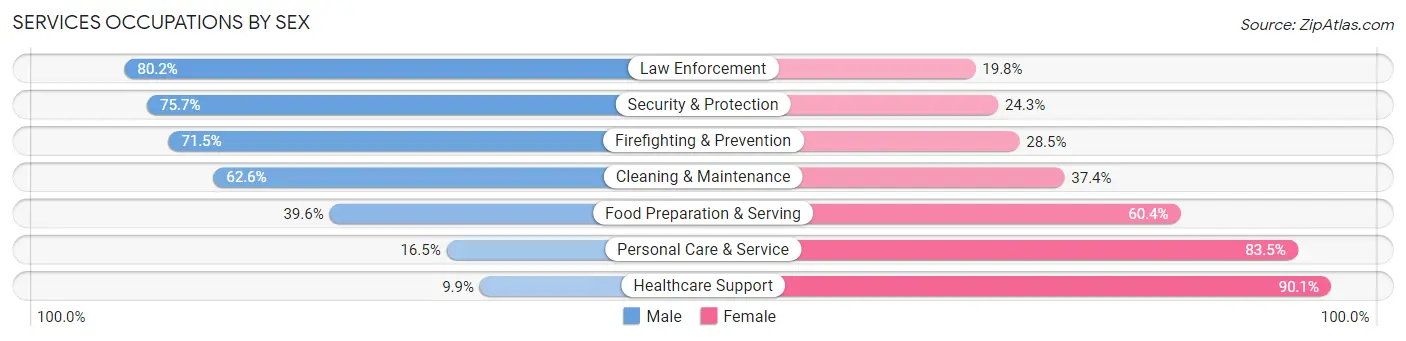
Services Occupations by Sex
Within the Services occupations in Jefferson County, the most male-oriented occupations are Law Enforcement (80.2%), Security & Protection (75.7%), and Firefighting & Prevention (71.5%), while the most female-oriented occupations are Healthcare Support (90.1%), Personal Care & Service (83.5%), and Food Preparation & Serving (60.4%).
| Occupation | Male | Female |
| Healthcare Support | 296 (9.9%) | 2,706 (90.1%) |
| Security & Protection | 1,502 (75.7%) | 481 (24.3%) |
| Firefighting & Prevention | 731 (71.5%) | 291 (28.5%) |
| Law Enforcement | 771 (80.2%) | 190 (19.8%) |
| Food Preparation & Serving | 2,290 (39.6%) | 3,488 (60.4%) |
| Cleaning & Maintenance | 2,304 (62.6%) | 1,376 (37.4%) |
| Personal Care & Service | 475 (16.5%) | 2,411 (83.5%) |
| Total (Category) | 6,867 (39.6%) | 10,462 (60.4%) |
| Total (Overall) | 60,702 (52.6%) | 54,620 (47.4%) |
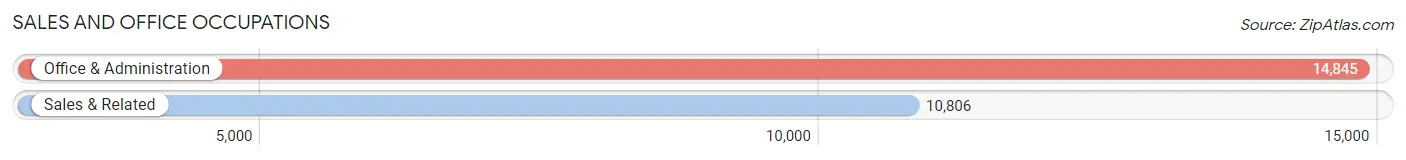
Sales and Office Occupations
The most common Sales and Office occupations in Jefferson County are Office & Administration (14,845 | 12.9%), and Sales & Related (10,806 | 9.4%).
Sales and Office Occupations by Sex
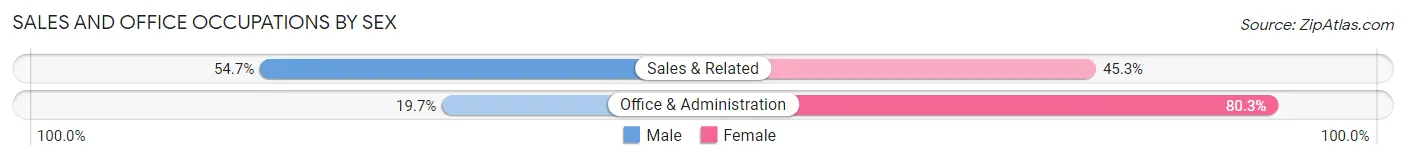
| Occupation | Male | Female |
| Sales & Related | 5,914 (54.7%) | 4,892 (45.3%) |
| Office & Administration | 2,925 (19.7%) | 11,920 (80.3%) |
| Total (Category) | 8,839 (34.5%) | 16,812 (65.5%) |
| Total (Overall) | 60,702 (52.6%) | 54,620 (47.4%) |
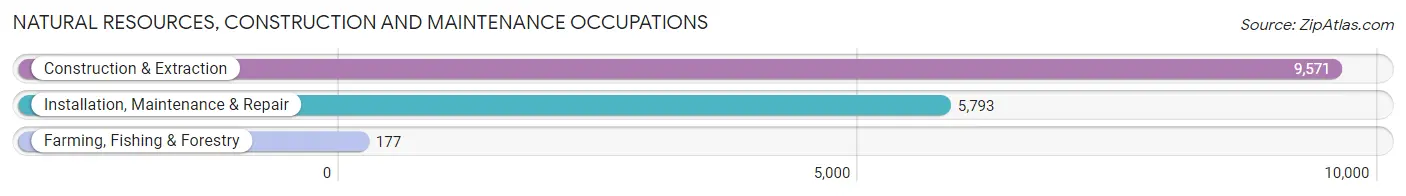
Natural Resources, Construction and Maintenance Occupations
The most common Natural Resources, Construction and Maintenance occupations in Jefferson County are Construction & Extraction (9,571 | 8.3%), Installation, Maintenance & Repair (5,793 | 5.0%), and Farming, Fishing & Forestry (177 | 0.2%).
Natural Resources, Construction and Maintenance Occupations by Sex
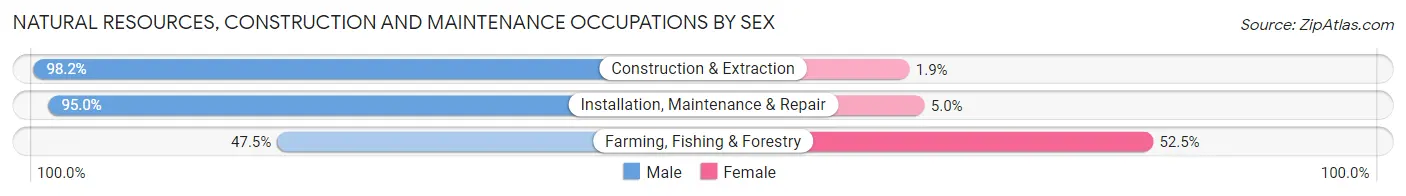
| Occupation | Male | Female |
| Farming, Fishing & Forestry | 84 (47.5%) | 93 (52.5%) |
| Construction & Extraction | 9,394 (98.2%) | 177 (1.8%) |
| Installation, Maintenance & Repair | 5,505 (95.0%) | 288 (5.0%) |
| Total (Category) | 14,983 (96.4%) | 558 (3.6%) |
| Total (Overall) | 60,702 (52.6%) | 54,620 (47.4%) |
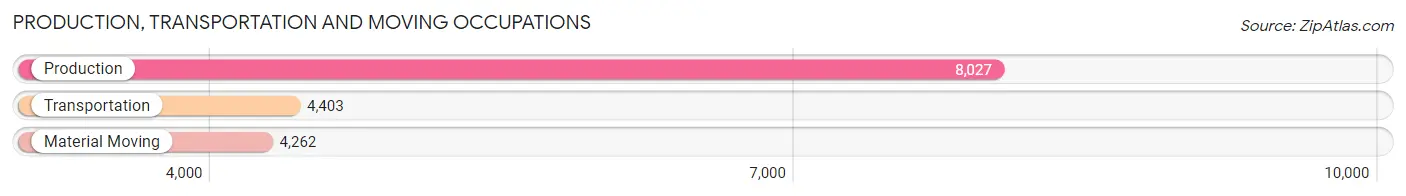
Production, Transportation and Moving Occupations
The most common Production, Transportation and Moving occupations in Jefferson County are Production (8,027 | 7.0%), Transportation (4,403 | 3.8%), and Material Moving (4,262 | 3.7%).
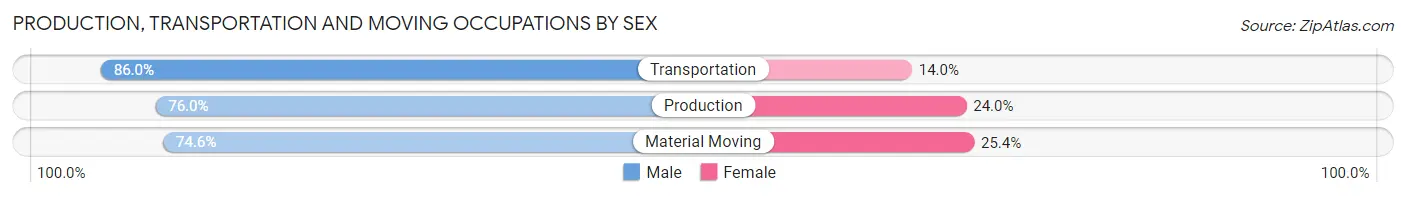
Production, Transportation and Moving Occupations by Sex
| Occupation | Male | Female |
| Production | 6,101 (76.0%) | 1,926 (24.0%) |
| Transportation | 3,787 (86.0%) | 616 (14.0%) |
| Material Moving | 3,179 (74.6%) | 1,083 (25.4%) |
| Total (Category) | 13,067 (78.3%) | 3,625 (21.7%) |
| Total (Overall) | 60,702 (52.6%) | 54,620 (47.4%) |
Employment Industries by Sex in Jefferson County
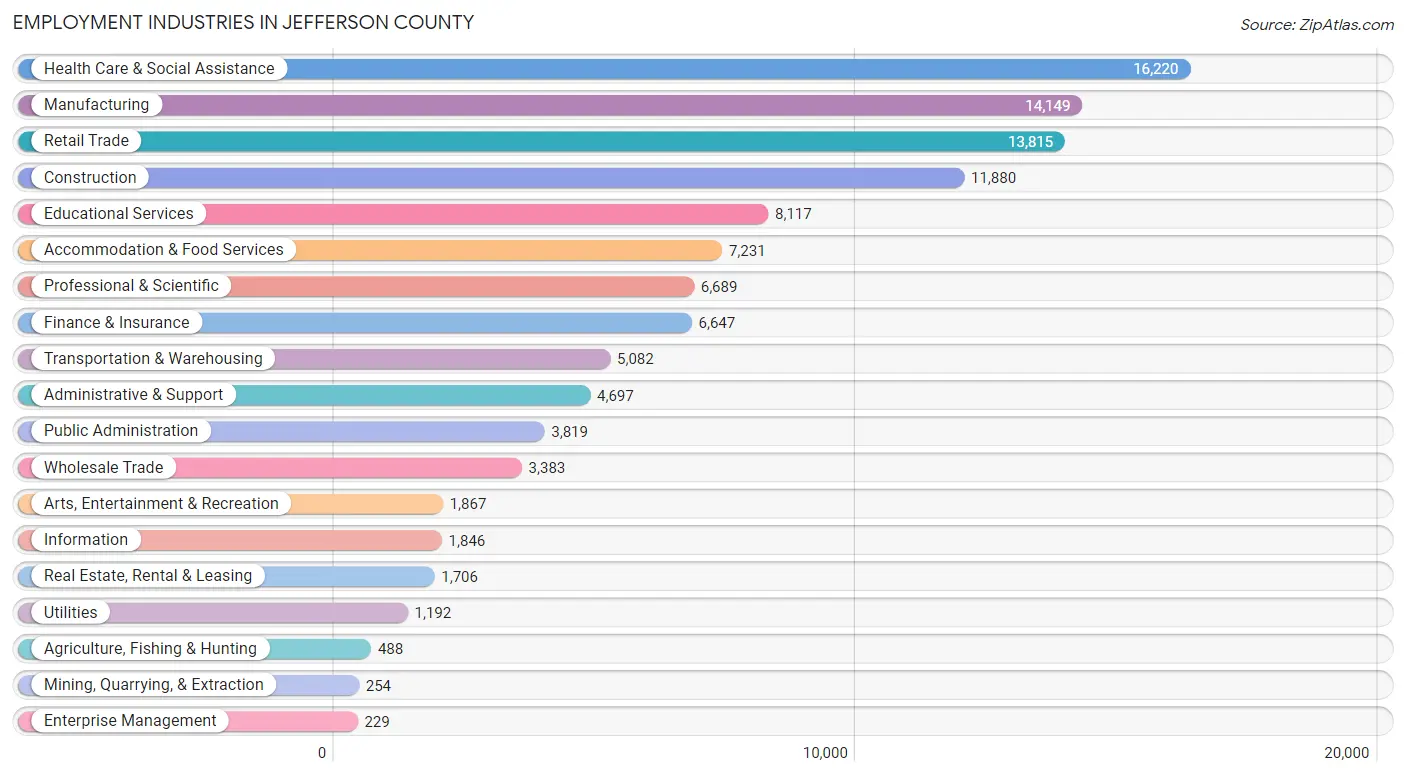
Employment Industries in Jefferson County
The major employment industries in Jefferson County include Health Care & Social Assistance (16,220 | 14.1%), Manufacturing (14,149 | 12.3%), Retail Trade (13,815 | 12.0%), Construction (11,880 | 10.3%), and Educational Services (8,117 | 7.0%).
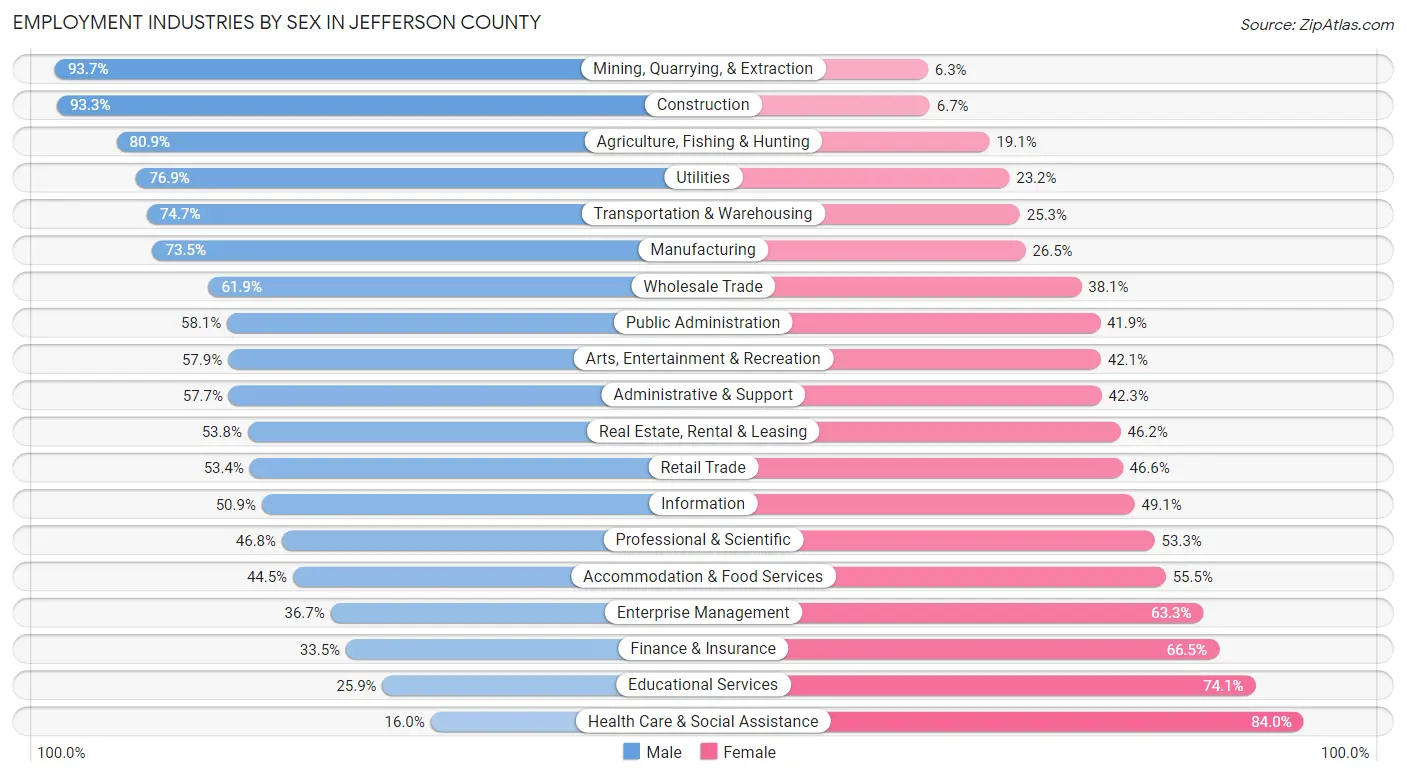
Employment Industries by Sex in Jefferson County
The Jefferson County industries that see more men than women are Mining, Quarrying, & Extraction (93.7%), Construction (93.3%), and Agriculture, Fishing & Hunting (80.9%), whereas the industries that tend to have a higher number of women are Health Care & Social Assistance (84.0%), Educational Services (74.1%), and Finance & Insurance (66.5%).
| Industry | Male | Female |
| Agriculture, Fishing & Hunting | 395 (80.9%) | 93 (19.1%) |
| Mining, Quarrying, & Extraction | 238 (93.7%) | 16 (6.3%) |
| Construction | 11,083 (93.3%) | 797 (6.7%) |
| Manufacturing | 10,400 (73.5%) | 3,749 (26.5%) |
| Wholesale Trade | 2,095 (61.9%) | 1,288 (38.1%) |
| Retail Trade | 7,379 (53.4%) | 6,436 (46.6%) |
| Transportation & Warehousing | 3,794 (74.7%) | 1,288 (25.3%) |
| Utilities | 916 (76.8%) | 276 (23.2%) |
| Information | 940 (50.9%) | 906 (49.1%) |
| Finance & Insurance | 2,226 (33.5%) | 4,421 (66.5%) |
| Real Estate, Rental & Leasing | 918 (53.8%) | 788 (46.2%) |
| Professional & Scientific | 3,127 (46.8%) | 3,562 (53.2%) |
| Enterprise Management | 84 (36.7%) | 145 (63.3%) |
| Administrative & Support | 2,712 (57.7%) | 1,985 (42.3%) |
| Educational Services | 2,105 (25.9%) | 6,012 (74.1%) |
| Health Care & Social Assistance | 2,588 (16.0%) | 13,632 (84.0%) |
| Arts, Entertainment & Recreation | 1,081 (57.9%) | 786 (42.1%) |
| Accommodation & Food Services | 3,215 (44.5%) | 4,016 (55.5%) |
| Public Administration | 2,218 (58.1%) | 1,601 (41.9%) |
| Total | 60,702 (52.6%) | 54,620 (47.4%) |
Education in Jefferson County
School Enrollment in Jefferson County
The most common levels of schooling among the 52,264 students in Jefferson County are high school (12,560 | 24.0%), elementary school (11,935 | 22.8%), and middle school (11,736 | 22.5%).
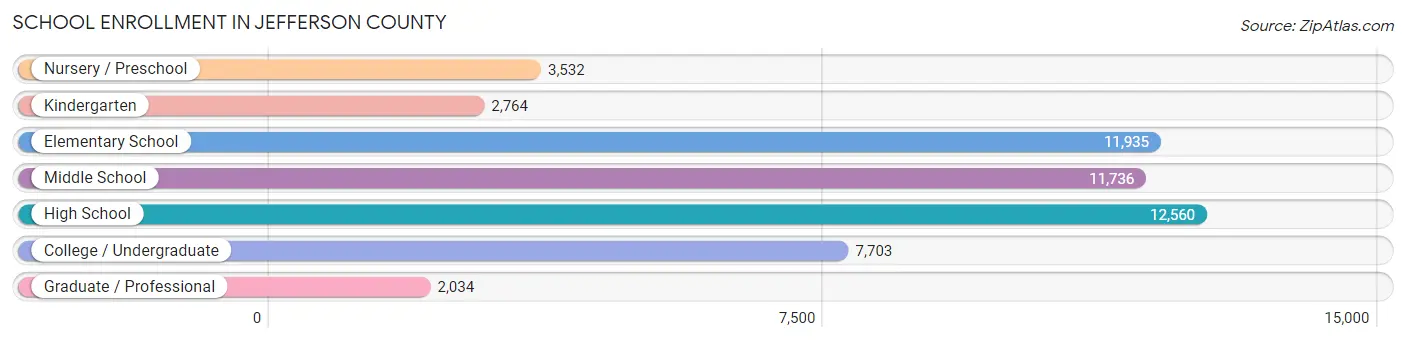
| School Level | # Students | % Students |
| Nursery / Preschool | 3,532 | 6.8% |
| Kindergarten | 2,764 | 5.3% |
| Elementary School | 11,935 | 22.8% |
| Middle School | 11,736 | 22.5% |
| High School | 12,560 | 24.0% |
| College / Undergraduate | 7,703 | 14.7% |
| Graduate / Professional | 2,034 | 3.9% |
| Total | 52,264 | 100.0% |
School Enrollment by Age by Funding Source in Jefferson County
Out of a total of 52,264 students who are enrolled in schools in Jefferson County, 8,101 (15.5%) attend a private institution, while the remaining 44,163 (84.5%) are enrolled in public schools. The age group of 3 to 4 year olds has the highest likelihood of being enrolled in private schools, with 1,029 (40.2% in the age bracket) enrolled. Conversely, the age group of 10 to 14 year olds has the lowest likelihood of being enrolled in a private school, with 13,848 (91.0% in the age bracket) attending a public institution.
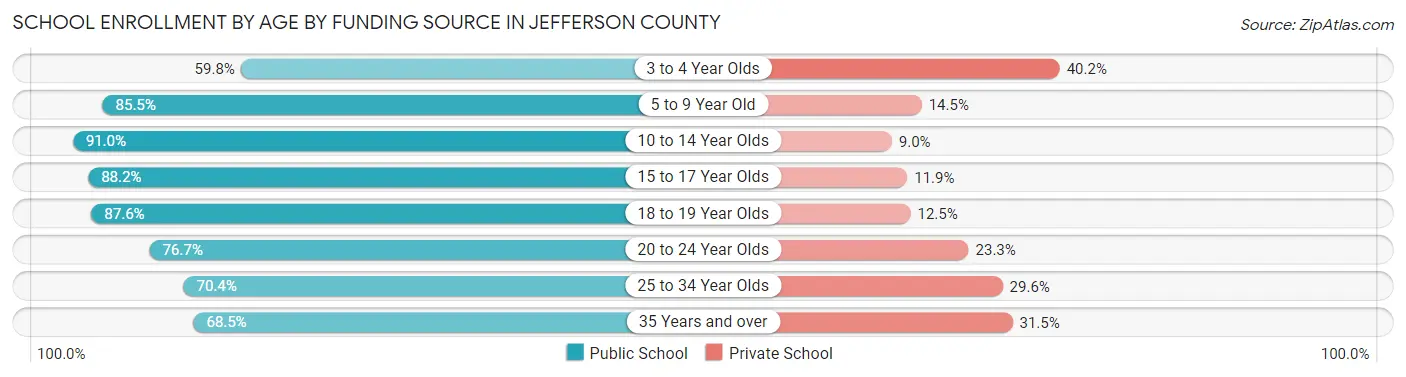
| Age Bracket | Public School | Private School |
| 3 to 4 Year Olds | 1,528 (59.8%) | 1,029 (40.2%) |
| 5 to 9 Year Old | 11,465 (85.5%) | 1,950 (14.5%) |
| 10 to 14 Year Olds | 13,848 (91.0%) | 1,366 (9.0%) |
| 15 to 17 Year Olds | 8,182 (88.1%) | 1,100 (11.8%) |
| 18 to 19 Year Olds | 3,073 (87.5%) | 437 (12.4%) |
| 20 to 24 Year Olds | 2,955 (76.7%) | 896 (23.3%) |
| 25 to 34 Year Olds | 1,804 (70.4%) | 759 (29.6%) |
| 35 Years and over | 1,283 (68.5%) | 589 (31.5%) |
| Total | 44,163 (84.5%) | 8,101 (15.5%) |
Educational Attainment by Field of Study in Jefferson County
Business (8,770 | 22.7%), education (6,414 | 16.6%), science & technology (4,394 | 11.4%), arts & humanities (3,111 | 8.1%), and bio, nature & agricultural (2,408 | 6.2%) are the most common fields of study among 38,608 individuals in Jefferson County who have obtained a bachelor's degree or higher.
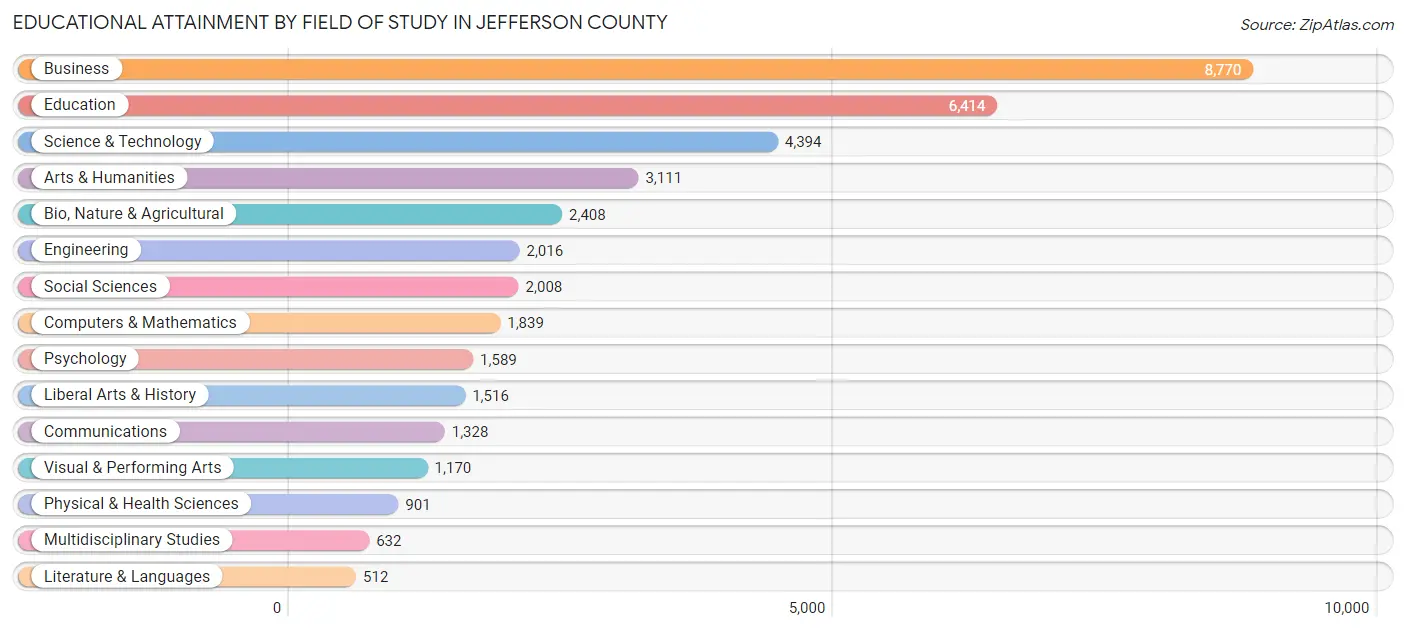
| Field of Study | # Graduates | % Graduates |
| Computers & Mathematics | 1,839 | 4.8% |
| Bio, Nature & Agricultural | 2,408 | 6.2% |
| Physical & Health Sciences | 901 | 2.3% |
| Psychology | 1,589 | 4.1% |
| Social Sciences | 2,008 | 5.2% |
| Engineering | 2,016 | 5.2% |
| Multidisciplinary Studies | 632 | 1.6% |
| Science & Technology | 4,394 | 11.4% |
| Business | 8,770 | 22.7% |
| Education | 6,414 | 16.6% |
| Literature & Languages | 512 | 1.3% |
| Liberal Arts & History | 1,516 | 3.9% |
| Visual & Performing Arts | 1,170 | 3.0% |
| Communications | 1,328 | 3.4% |
| Arts & Humanities | 3,111 | 8.1% |
| Total | 38,608 | 100.0% |
Transportation & Commute in Jefferson County
Vehicle Availability by Sex in Jefferson County
The most prevalent vehicle ownership categories in Jefferson County are males with 2 vehicles (24,695, accounting for 41.1%) and females with 2 vehicles (21,083, making up 46.0%).
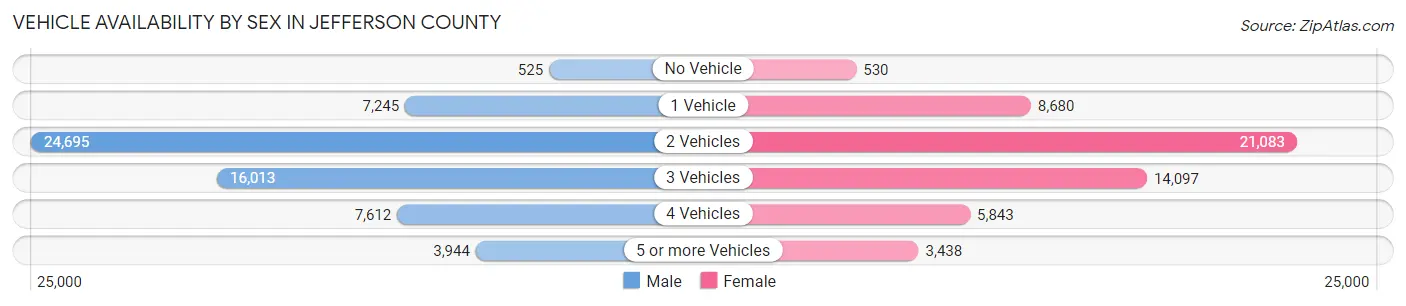
| Vehicles Available | Male | Female |
| No Vehicle | 525 (0.9%) | 530 (1.0%) |
| 1 Vehicle | 7,245 (12.1%) | 8,680 (16.2%) |
| 2 Vehicles | 24,695 (41.1%) | 21,083 (39.3%) |
| 3 Vehicles | 16,013 (26.7%) | 14,097 (26.3%) |
| 4 Vehicles | 7,612 (12.7%) | 5,843 (10.9%) |
| 5 or more Vehicles | 3,944 (6.6%) | 3,438 (6.4%) |
| Total | 60,034 (100.0%) | 53,671 (100.0%) |
Commute Time in Jefferson County
The most frequently occuring commute durations in Jefferson County are 30 to 34 minutes (17,712 commuters, 17.0%), 45 to 59 minutes (14,874 commuters, 14.3%), and 15 to 19 minutes (11,826 commuters, 11.4%).
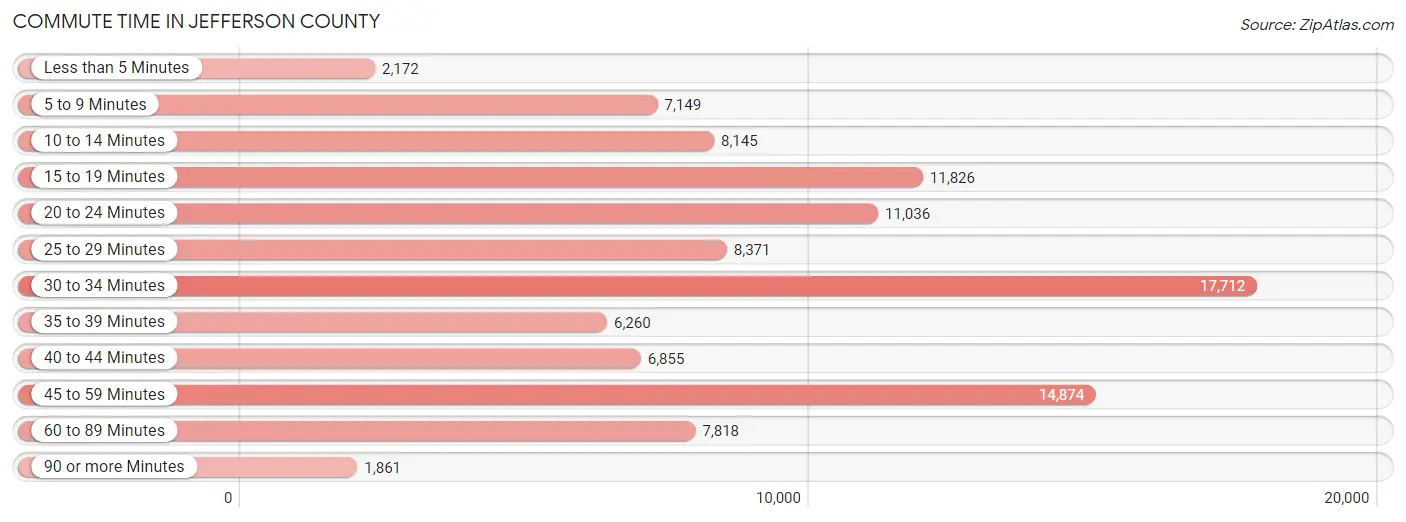
| Commute Time | # Commuters | % Commuters |
| Less than 5 Minutes | 2,172 | 2.1% |
| 5 to 9 Minutes | 7,149 | 6.9% |
| 10 to 14 Minutes | 8,145 | 7.8% |
| 15 to 19 Minutes | 11,826 | 11.4% |
| 20 to 24 Minutes | 11,036 | 10.6% |
| 25 to 29 Minutes | 8,371 | 8.0% |
| 30 to 34 Minutes | 17,712 | 17.0% |
| 35 to 39 Minutes | 6,260 | 6.0% |
| 40 to 44 Minutes | 6,855 | 6.6% |
| 45 to 59 Minutes | 14,874 | 14.3% |
| 60 to 89 Minutes | 7,818 | 7.5% |
| 90 or more Minutes | 1,861 | 1.8% |
Commute Time by Sex in Jefferson County
The most common commute times in Jefferson County are 30 to 34 minutes (10,009 commuters, 18.0%) for males and 30 to 34 minutes (7,703 commuters, 15.9%) for females.
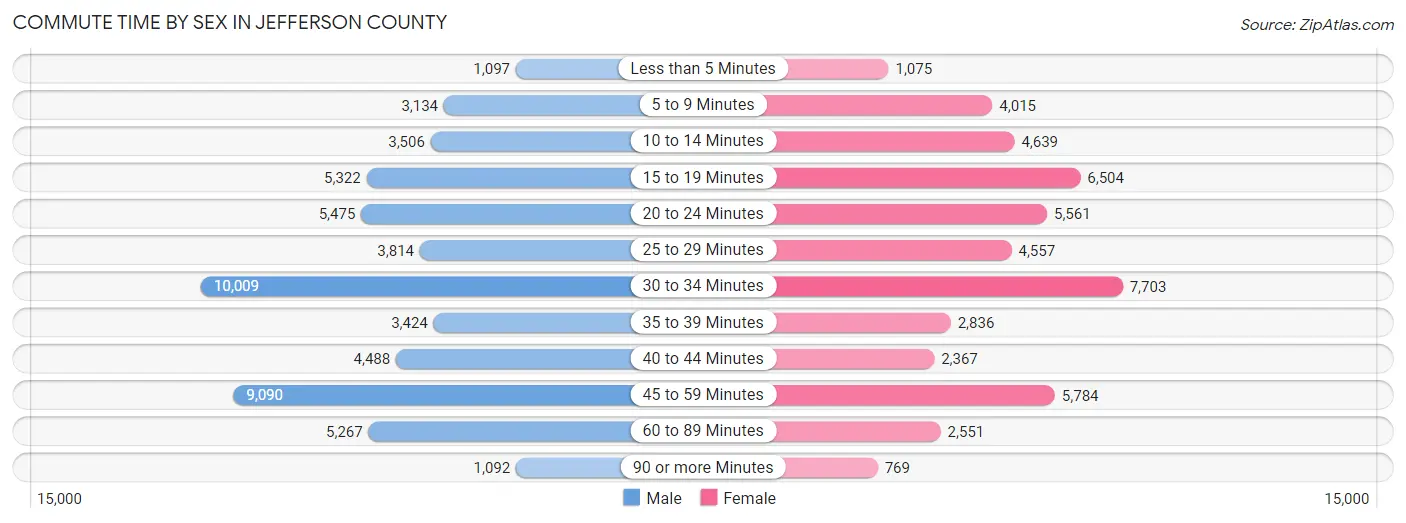
| Commute Time | Male | Female |
| Less than 5 Minutes | 1,097 (2.0%) | 1,075 (2.2%) |
| 5 to 9 Minutes | 3,134 (5.6%) | 4,015 (8.3%) |
| 10 to 14 Minutes | 3,506 (6.3%) | 4,639 (9.6%) |
| 15 to 19 Minutes | 5,322 (9.6%) | 6,504 (13.5%) |
| 20 to 24 Minutes | 5,475 (9.8%) | 5,561 (11.5%) |
| 25 to 29 Minutes | 3,814 (6.9%) | 4,557 (9.4%) |
| 30 to 34 Minutes | 10,009 (18.0%) | 7,703 (15.9%) |
| 35 to 39 Minutes | 3,424 (6.1%) | 2,836 (5.9%) |
| 40 to 44 Minutes | 4,488 (8.1%) | 2,367 (4.9%) |
| 45 to 59 Minutes | 9,090 (16.3%) | 5,784 (12.0%) |
| 60 to 89 Minutes | 5,267 (9.5%) | 2,551 (5.3%) |
| 90 or more Minutes | 1,092 (2.0%) | 769 (1.6%) |
Time of Departure to Work by Sex in Jefferson County
The most frequent times of departure to work in Jefferson County are 6:00 AM to 6:29 AM (7,861, 14.1%) for males and 7:00 AM to 7:29 AM (8,400, 17.4%) for females.
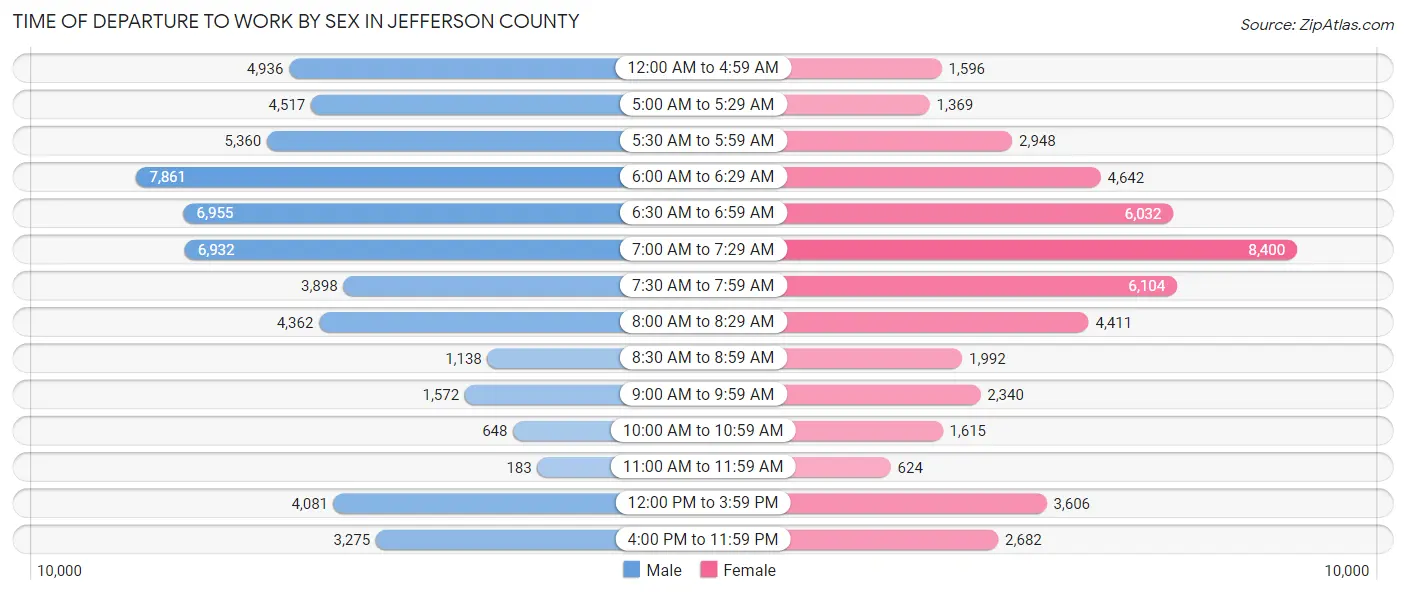
| Time of Departure | Male | Female |
| 12:00 AM to 4:59 AM | 4,936 (8.9%) | 1,596 (3.3%) |
| 5:00 AM to 5:29 AM | 4,517 (8.1%) | 1,369 (2.8%) |
| 5:30 AM to 5:59 AM | 5,360 (9.6%) | 2,948 (6.1%) |
| 6:00 AM to 6:29 AM | 7,861 (14.1%) | 4,642 (9.6%) |
| 6:30 AM to 6:59 AM | 6,955 (12.5%) | 6,032 (12.5%) |
| 7:00 AM to 7:29 AM | 6,932 (12.4%) | 8,400 (17.4%) |
| 7:30 AM to 7:59 AM | 3,898 (7.0%) | 6,104 (12.6%) |
| 8:00 AM to 8:29 AM | 4,362 (7.8%) | 4,411 (9.1%) |
| 8:30 AM to 8:59 AM | 1,138 (2.0%) | 1,992 (4.1%) |
| 9:00 AM to 9:59 AM | 1,572 (2.8%) | 2,340 (4.8%) |
| 10:00 AM to 10:59 AM | 648 (1.2%) | 1,615 (3.3%) |
| 11:00 AM to 11:59 AM | 183 (0.3%) | 624 (1.3%) |
| 12:00 PM to 3:59 PM | 4,081 (7.3%) | 3,606 (7.5%) |
| 4:00 PM to 11:59 PM | 3,275 (5.9%) | 2,682 (5.6%) |
| Total | 55,718 (100.0%) | 48,361 (100.0%) |
Housing Occupancy in Jefferson County
Occupancy by Ownership in Jefferson County
Of the total 86,455 dwellings in Jefferson County, owner-occupied units account for 69,779 (80.7%), while renter-occupied units make up 16,676 (19.3%).
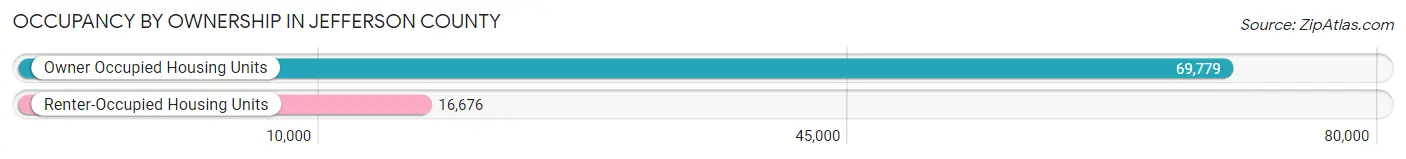
| Occupancy | # Housing Units | % Housing Units |
| Owner Occupied Housing Units | 69,779 | 80.7% |
| Renter-Occupied Housing Units | 16,676 | 19.3% |
| Total Occupied Housing Units | 86,455 | 100.0% |
Occupancy by Household Size in Jefferson County
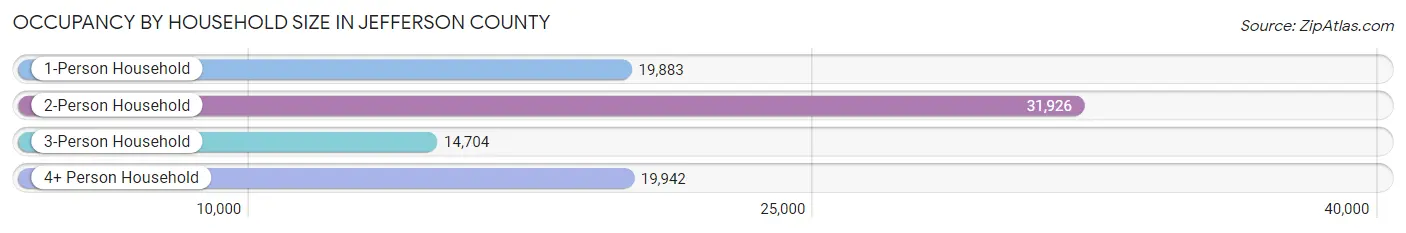
| Household Size | # Housing Units | % Housing Units |
| 1-Person Household | 19,883 | 23.0% |
| 2-Person Household | 31,926 | 36.9% |
| 3-Person Household | 14,704 | 17.0% |
| 4+ Person Household | 19,942 | 23.1% |
| Total Housing Units | 86,455 | 100.0% |
Occupancy by Ownership by Household Size in Jefferson County
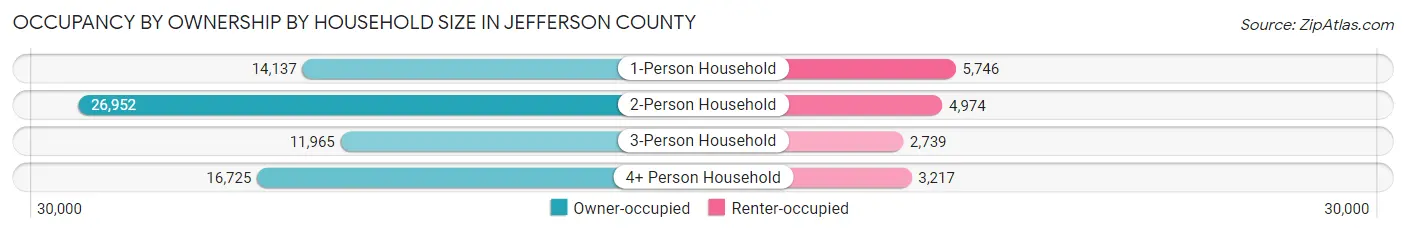
| Household Size | Owner-occupied | Renter-occupied |
| 1-Person Household | 14,137 (71.1%) | 5,746 (28.9%) |
| 2-Person Household | 26,952 (84.4%) | 4,974 (15.6%) |
| 3-Person Household | 11,965 (81.4%) | 2,739 (18.6%) |
| 4+ Person Household | 16,725 (83.9%) | 3,217 (16.1%) |
| Total Housing Units | 69,779 (80.7%) | 16,676 (19.3%) |
Occupancy by Educational Attainment in Jefferson County
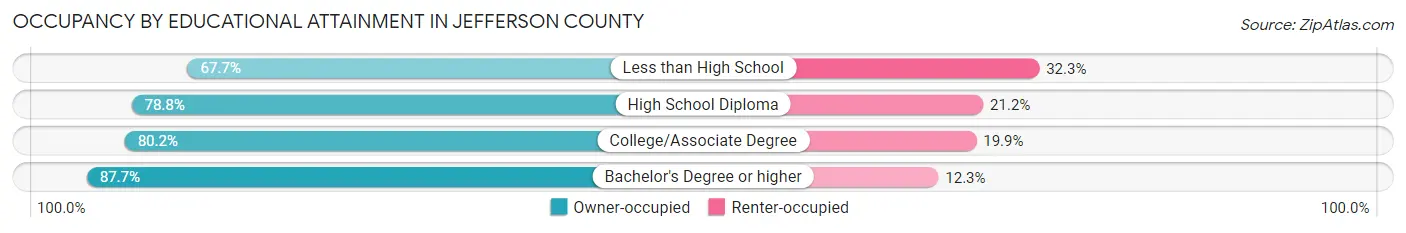
| Household Size | Owner-occupied | Renter-occupied |
| Less than High School | 4,313 (67.7%) | 2,061 (32.3%) |
| High School Diploma | 19,864 (78.8%) | 5,346 (21.2%) |
| College/Associate Degree | 26,688 (80.1%) | 6,609 (19.9%) |
| Bachelor's Degree or higher | 18,914 (87.7%) | 2,660 (12.3%) |
Occupancy by Age of Householder in Jefferson County
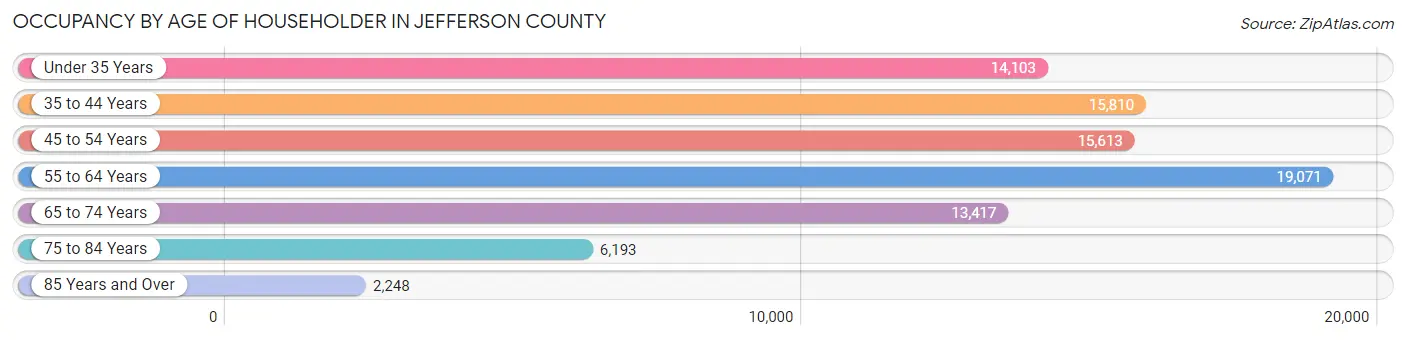
| Age Bracket | # Households | % Households |
| Under 35 Years | 14,103 | 16.3% |
| 35 to 44 Years | 15,810 | 18.3% |
| 45 to 54 Years | 15,613 | 18.1% |
| 55 to 64 Years | 19,071 | 22.1% |
| 65 to 74 Years | 13,417 | 15.5% |
| 75 to 84 Years | 6,193 | 7.2% |
| 85 Years and Over | 2,248 | 2.6% |
| Total | 86,455 | 100.0% |
Housing Finances in Jefferson County
Median Income by Occupancy in Jefferson County
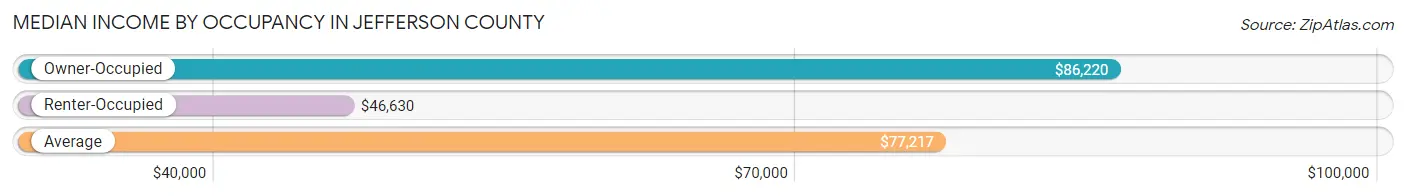
| Occupancy Type | # Households | Median Income |
| Owner-Occupied | 69,779 (80.7%) | $86,220 |
| Renter-Occupied | 16,676 (19.3%) | $46,630 |
| Average | 86,455 (100.0%) | $77,217 |
Occupancy by Householder Income Bracket in Jefferson County
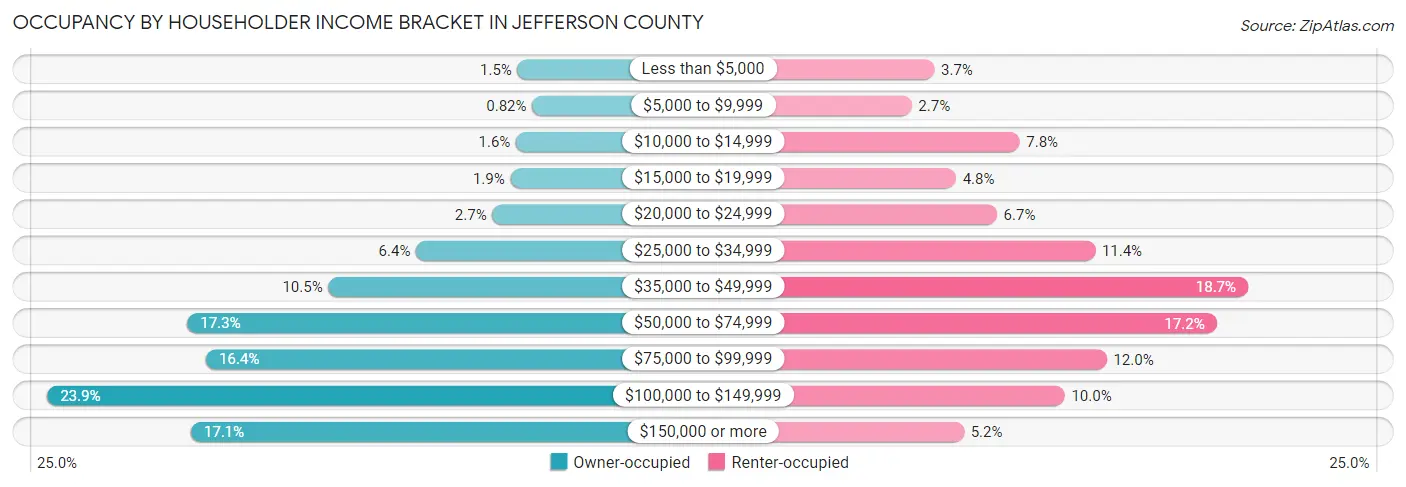
| Income Bracket | Owner-occupied | Renter-occupied |
| Less than $5,000 | 1,060 (1.5%) | 623 (3.7%) |
| $5,000 to $9,999 | 575 (0.8%) | 443 (2.7%) |
| $10,000 to $14,999 | 1,106 (1.6%) | 1,300 (7.8%) |
| $15,000 to $19,999 | 1,296 (1.9%) | 796 (4.8%) |
| $20,000 to $24,999 | 1,896 (2.7%) | 1,121 (6.7%) |
| $25,000 to $34,999 | 4,434 (6.4%) | 1,901 (11.4%) |
| $35,000 to $49,999 | 7,346 (10.5%) | 3,115 (18.7%) |
| $50,000 to $74,999 | 12,038 (17.2%) | 2,866 (17.2%) |
| $75,000 to $99,999 | 11,418 (16.4%) | 1,993 (11.9%) |
| $100,000 to $149,999 | 16,692 (23.9%) | 1,660 (10.0%) |
| $150,000 or more | 11,918 (17.1%) | 858 (5.1%) |
| Total | 69,779 (100.0%) | 16,676 (100.0%) |
Monthly Housing Cost Tiers in Jefferson County
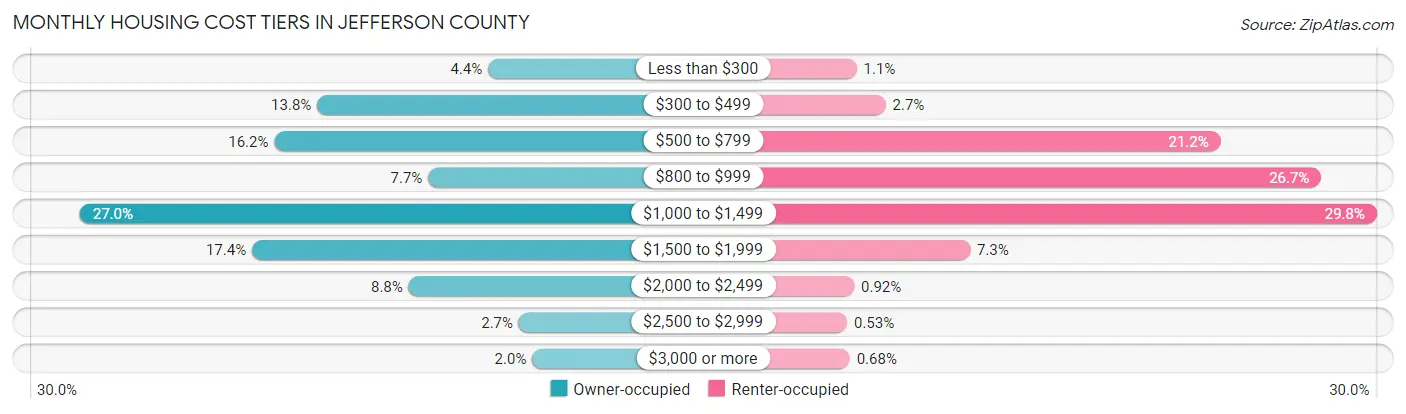
| Monthly Cost | Owner-occupied | Renter-occupied |
| Less than $300 | 3,070 (4.4%) | 176 (1.1%) |
| $300 to $499 | 9,660 (13.8%) | 443 (2.7%) |
| $500 to $799 | 11,310 (16.2%) | 3,529 (21.2%) |
| $800 to $999 | 5,380 (7.7%) | 4,455 (26.7%) |
| $1,000 to $1,499 | 18,807 (27.0%) | 4,968 (29.8%) |
| $1,500 to $1,999 | 12,166 (17.4%) | 1,220 (7.3%) |
| $2,000 to $2,499 | 6,136 (8.8%) | 153 (0.9%) |
| $2,500 to $2,999 | 1,881 (2.7%) | 88 (0.5%) |
| $3,000 or more | 1,369 (2.0%) | 114 (0.7%) |
| Total | 69,779 (100.0%) | 16,676 (100.0%) |
Physical Housing Characteristics in Jefferson County
Housing Structures in Jefferson County
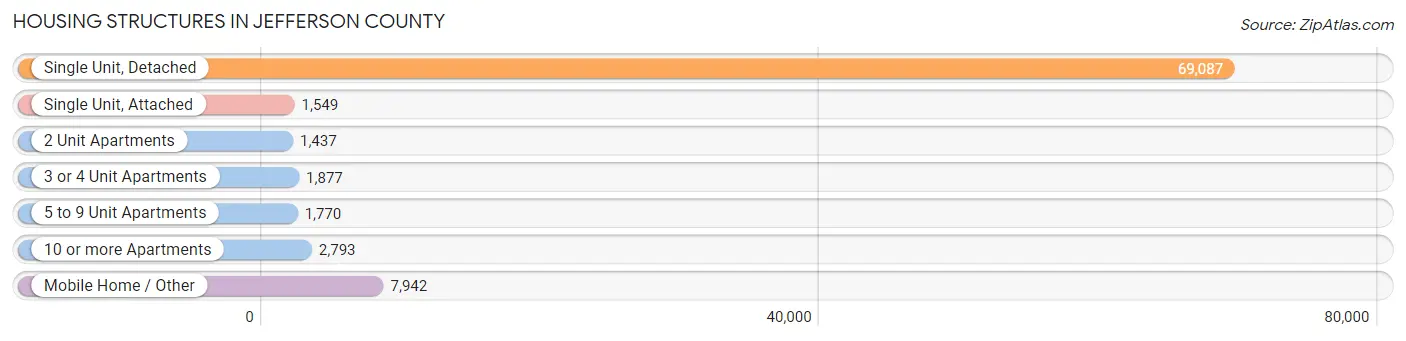
| Structure Type | # Housing Units | % Housing Units |
| Single Unit, Detached | 69,087 | 79.9% |
| Single Unit, Attached | 1,549 | 1.8% |
| 2 Unit Apartments | 1,437 | 1.7% |
| 3 or 4 Unit Apartments | 1,877 | 2.2% |
| 5 to 9 Unit Apartments | 1,770 | 2.1% |
| 10 or more Apartments | 2,793 | 3.2% |
| Mobile Home / Other | 7,942 | 9.2% |
| Total | 86,455 | 100.0% |
Housing Structures by Occupancy in Jefferson County
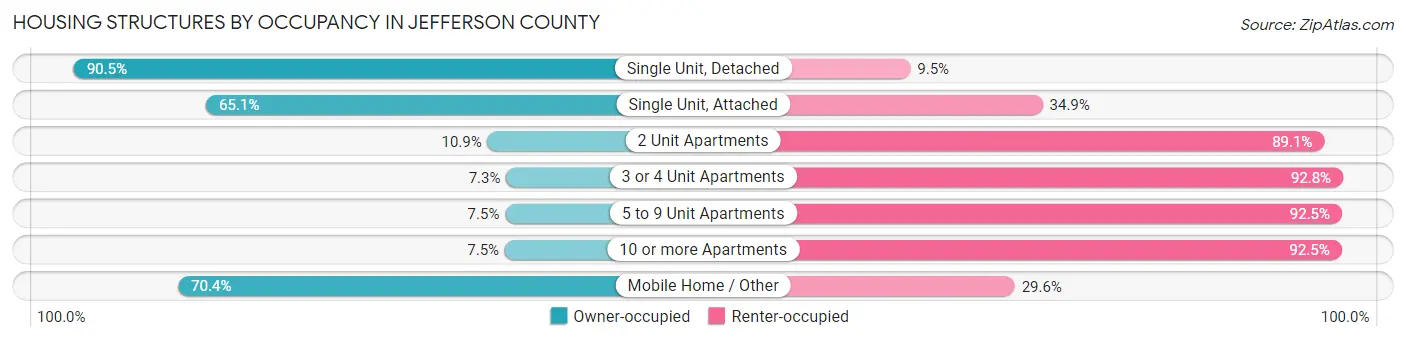
| Structure Type | Owner-occupied | Renter-occupied |
| Single Unit, Detached | 62,543 (90.5%) | 6,544 (9.5%) |
| Single Unit, Attached | 1,008 (65.1%) | 541 (34.9%) |
| 2 Unit Apartments | 156 (10.9%) | 1,281 (89.1%) |
| 3 or 4 Unit Apartments | 136 (7.2%) | 1,741 (92.7%) |
| 5 to 9 Unit Apartments | 132 (7.5%) | 1,638 (92.5%) |
| 10 or more Apartments | 210 (7.5%) | 2,583 (92.5%) |
| Mobile Home / Other | 5,594 (70.4%) | 2,348 (29.6%) |
| Total | 69,779 (80.7%) | 16,676 (19.3%) |
Housing Structures by Number of Rooms in Jefferson County
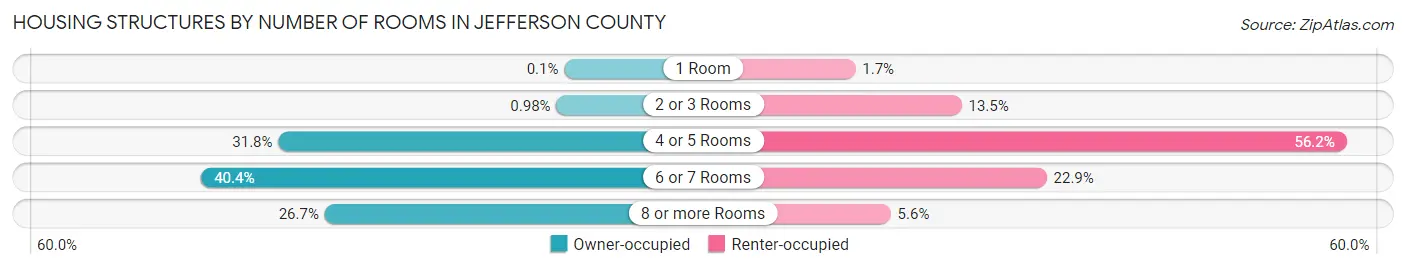
| Number of Rooms | Owner-occupied | Renter-occupied |
| 1 Room | 69 (0.1%) | 285 (1.7%) |
| 2 or 3 Rooms | 684 (1.0%) | 2,252 (13.5%) |
| 4 or 5 Rooms | 22,216 (31.8%) | 9,375 (56.2%) |
| 6 or 7 Rooms | 28,184 (40.4%) | 3,825 (22.9%) |
| 8 or more Rooms | 18,626 (26.7%) | 939 (5.6%) |
| Total | 69,779 (100.0%) | 16,676 (100.0%) |
Housing Structure by Heating Type in Jefferson County
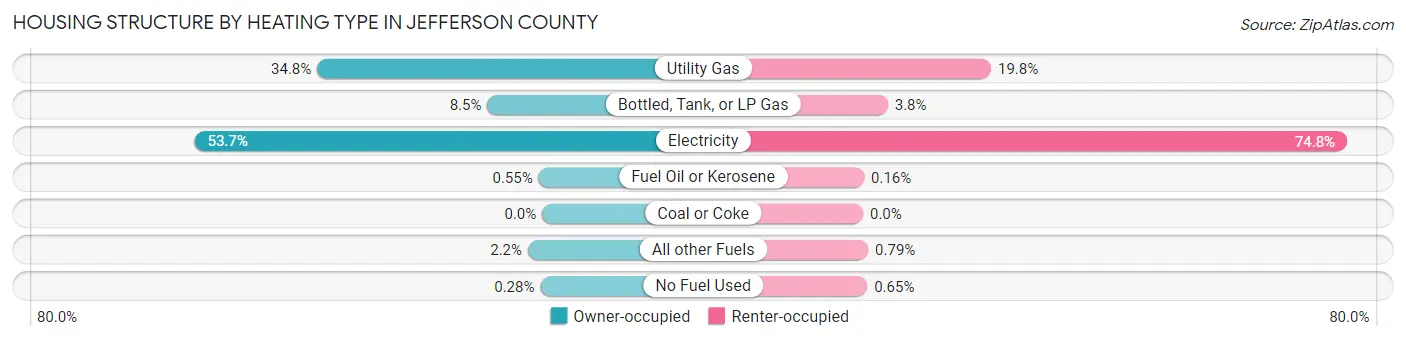
| Heating Type | Owner-occupied | Renter-occupied |
| Utility Gas | 24,268 (34.8%) | 3,301 (19.8%) |
| Bottled, Tank, or LP Gas | 5,908 (8.5%) | 637 (3.8%) |
| Electricity | 37,487 (53.7%) | 12,473 (74.8%) |
| Fuel Oil or Kerosene | 387 (0.5%) | 26 (0.2%) |
| Coal or Coke | 0 (0.0%) | 0 (0.0%) |
| All other Fuels | 1,535 (2.2%) | 131 (0.8%) |
| No Fuel Used | 194 (0.3%) | 108 (0.6%) |
| Total | 69,779 (100.0%) | 16,676 (100.0%) |
Household Vehicle Usage in Jefferson County
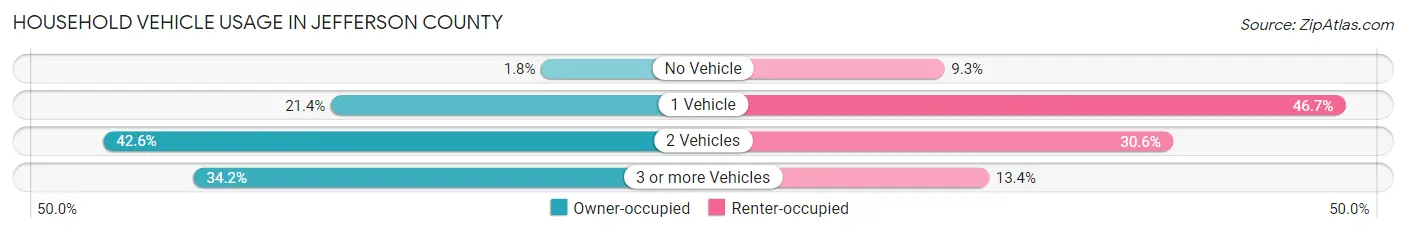
| Vehicles per Household | Owner-occupied | Renter-occupied |
| No Vehicle | 1,231 (1.8%) | 1,548 (9.3%) |
| 1 Vehicle | 14,916 (21.4%) | 7,786 (46.7%) |
| 2 Vehicles | 29,753 (42.6%) | 5,102 (30.6%) |
| 3 or more Vehicles | 23,879 (34.2%) | 2,240 (13.4%) |
| Total | 69,779 (100.0%) | 16,676 (100.0%) |
Real Estate & Mortgages in Jefferson County
Real Estate and Mortgage Overview in Jefferson County
| Characteristic | Without Mortgage | With Mortgage |
| Housing Units | 23,882 | 45,897 |
| Median Property Value | $175,400 | $215,700 |
| Median Household Income | $58,542 | $9,942 |
| Monthly Housing Costs | $489 | $1,347 |
| Real Estate Taxes | $1,507 | $901 |
Property Value by Mortgage Status in Jefferson County
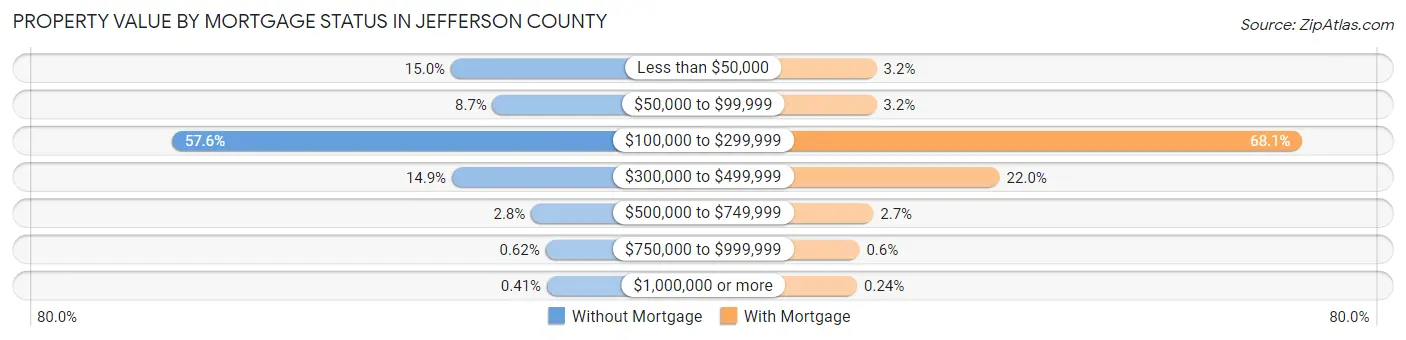
| Property Value | Without Mortgage | With Mortgage |
| Less than $50,000 | 3,591 (15.0%) | 1,477 (3.2%) |
| $50,000 to $99,999 | 2,070 (8.7%) | 1,461 (3.2%) |
| $100,000 to $299,999 | 13,747 (57.6%) | 31,252 (68.1%) |
| $300,000 to $499,999 | 3,554 (14.9%) | 10,079 (22.0%) |
| $500,000 to $749,999 | 674 (2.8%) | 1,243 (2.7%) |
| $750,000 to $999,999 | 149 (0.6%) | 275 (0.6%) |
| $1,000,000 or more | 97 (0.4%) | 110 (0.2%) |
| Total | 23,882 (100.0%) | 45,897 (100.0%) |
Household Income by Mortgage Status in Jefferson County
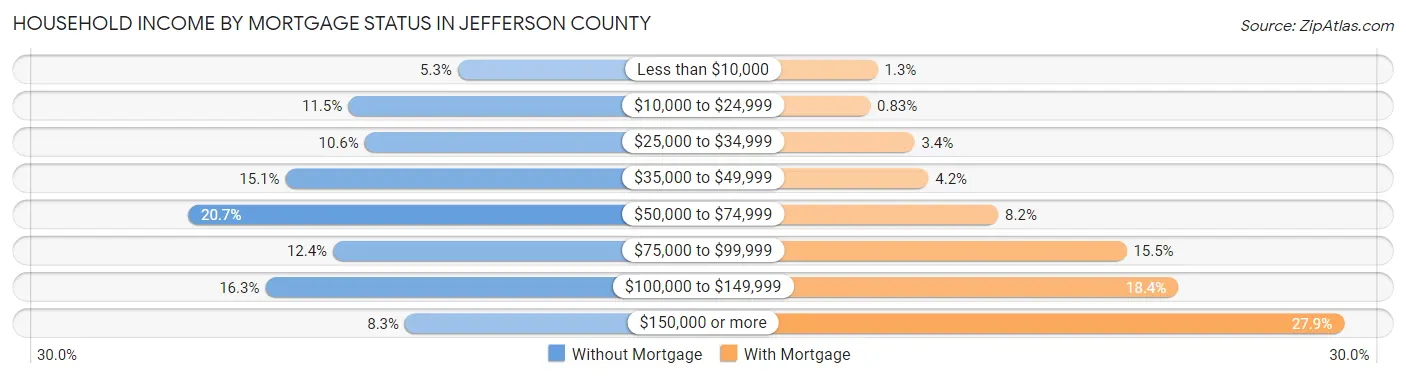
| Household Income | Without Mortgage | With Mortgage |
| Less than $10,000 | 1,254 (5.2%) | 577 (1.3%) |
| $10,000 to $24,999 | 2,752 (11.5%) | 381 (0.8%) |
| $25,000 to $34,999 | 2,524 (10.6%) | 1,546 (3.4%) |
| $35,000 to $49,999 | 3,605 (15.1%) | 1,910 (4.2%) |
| $50,000 to $74,999 | 4,934 (20.7%) | 3,741 (8.2%) |
| $75,000 to $99,999 | 2,957 (12.4%) | 7,104 (15.5%) |
| $100,000 to $149,999 | 3,880 (16.3%) | 8,461 (18.4%) |
| $150,000 or more | 1,976 (8.3%) | 12,812 (27.9%) |
| Total | 23,882 (100.0%) | 45,897 (100.0%) |
Property Value to Household Income Ratio in Jefferson County
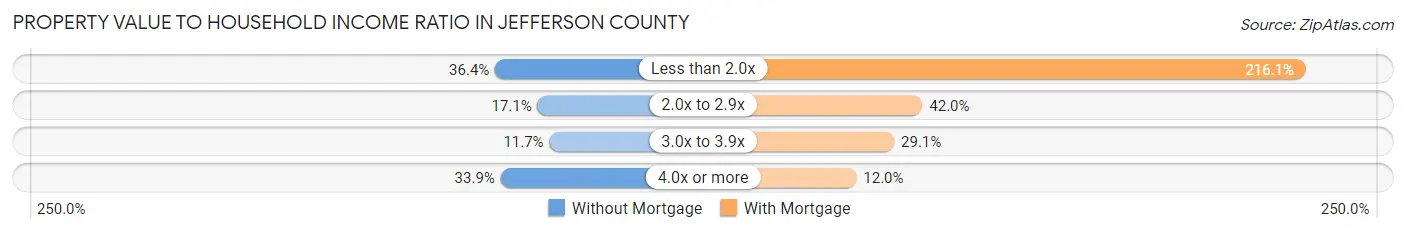
| Value-to-Income Ratio | Without Mortgage | With Mortgage |
| Less than 2.0x | 8,682 (36.3%) | 99,184 (216.1%) |
| 2.0x to 2.9x | 4,083 (17.1%) | 19,262 (42.0%) |
| 3.0x to 3.9x | 2,796 (11.7%) | 13,375 (29.1%) |
| 4.0x or more | 8,086 (33.9%) | 5,502 (12.0%) |
| Total | 23,882 (100.0%) | 45,897 (100.0%) |
Real Estate Taxes by Mortgage Status in Jefferson County
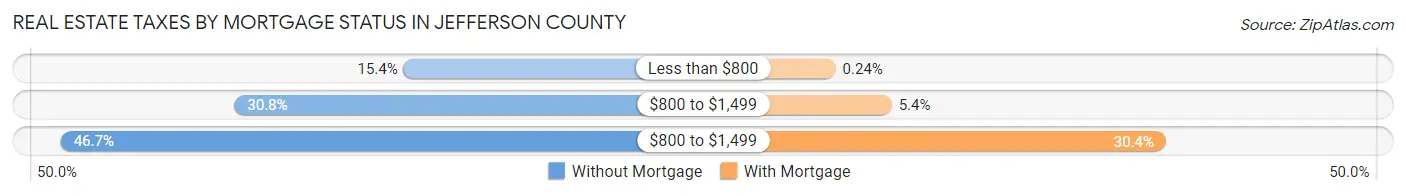
| Property Taxes | Without Mortgage | With Mortgage |
| Less than $800 | 3,676 (15.4%) | 111 (0.2%) |
| $800 to $1,499 | 7,365 (30.8%) | 2,462 (5.4%) |
| $800 to $1,499 | 11,153 (46.7%) | 13,950 (30.4%) |
| Total | 23,882 (100.0%) | 45,897 (100.0%) |
Health & Disability in Jefferson County
Health Insurance Coverage by Age in Jefferson County
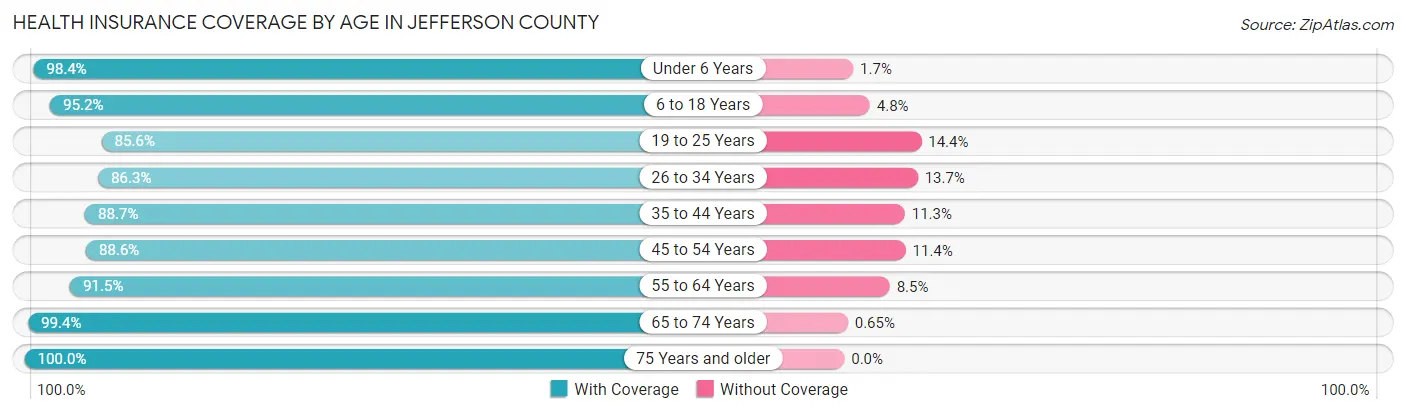
| Age Bracket | With Coverage | Without Coverage |
| Under 6 Years | 15,356 (98.4%) | 257 (1.7%) |
| 6 to 18 Years | 37,006 (95.2%) | 1,852 (4.8%) |
| 19 to 25 Years | 14,192 (85.6%) | 2,379 (14.4%) |
| 26 to 34 Years | 22,352 (86.3%) | 3,545 (13.7%) |
| 35 to 44 Years | 27,333 (88.7%) | 3,480 (11.3%) |
| 45 to 54 Years | 25,953 (88.6%) | 3,353 (11.4%) |
| 55 to 64 Years | 30,507 (91.5%) | 2,823 (8.5%) |
| 65 to 74 Years | 22,165 (99.4%) | 144 (0.6%) |
| 75 Years and older | 12,502 (100.0%) | 0 (0.0%) |
| Total | 207,366 (92.1%) | 17,833 (7.9%) |
Health Insurance Coverage by Citizenship Status in Jefferson County
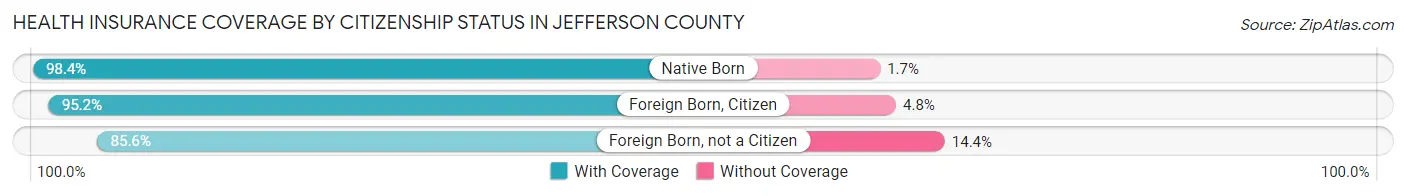
| Citizenship Status | With Coverage | Without Coverage |
| Native Born | 15,356 (98.4%) | 257 (1.7%) |
| Foreign Born, Citizen | 37,006 (95.2%) | 1,852 (4.8%) |
| Foreign Born, not a Citizen | 14,192 (85.6%) | 2,379 (14.4%) |
Health Insurance Coverage by Household Income in Jefferson County
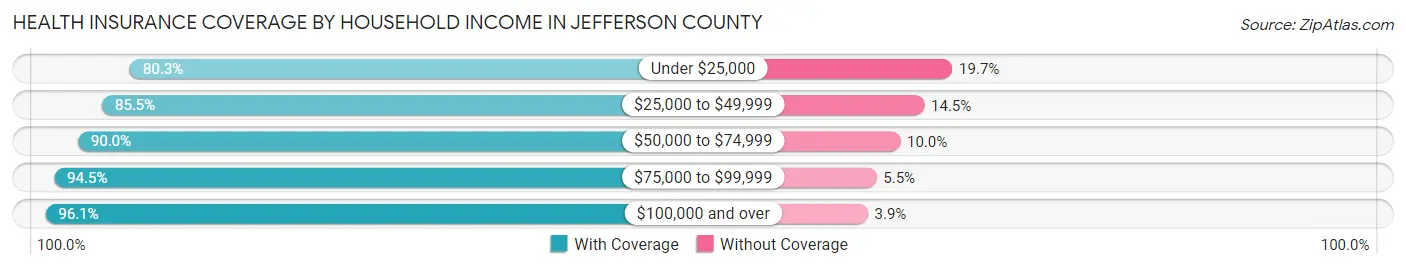
| Household Income | With Coverage | Without Coverage |
| Under $25,000 | 13,191 (80.3%) | 3,244 (19.7%) |
| $25,000 to $49,999 | 29,843 (85.5%) | 5,051 (14.5%) |
| $50,000 to $74,999 | 31,710 (90.0%) | 3,515 (10.0%) |
| $75,000 to $99,999 | 34,280 (94.5%) | 2,007 (5.5%) |
| $100,000 and over | 97,780 (96.1%) | 3,973 (3.9%) |
Public vs Private Health Insurance Coverage by Age in Jefferson County
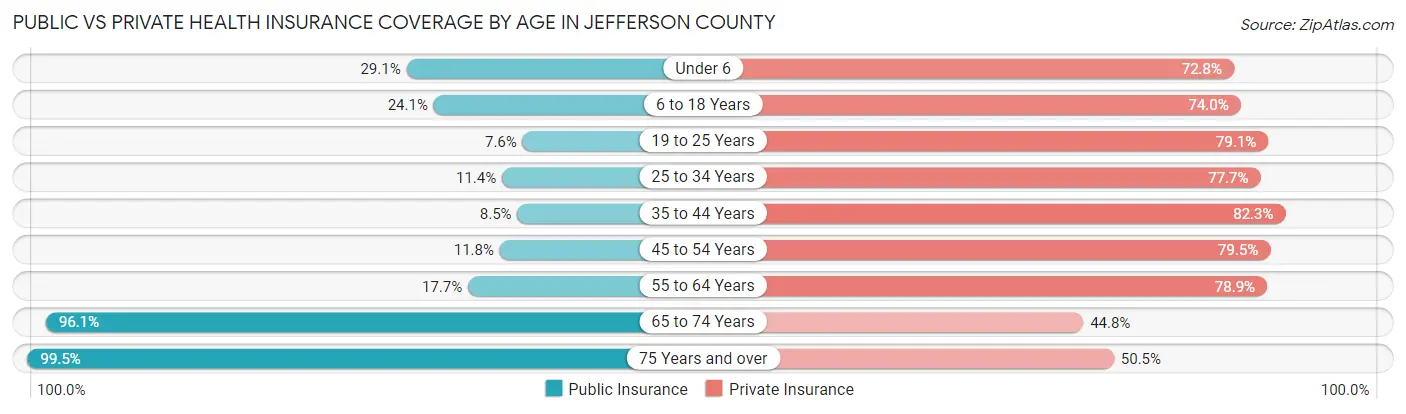
| Age Bracket | Public Insurance | Private Insurance |
| Under 6 | 4,547 (29.1%) | 11,360 (72.8%) |
| 6 to 18 Years | 9,349 (24.1%) | 28,755 (74.0%) |
| 19 to 25 Years | 1,253 (7.6%) | 13,112 (79.1%) |
| 25 to 34 Years | 2,948 (11.4%) | 20,117 (77.7%) |
| 35 to 44 Years | 2,624 (8.5%) | 25,361 (82.3%) |
| 45 to 54 Years | 3,454 (11.8%) | 23,299 (79.5%) |
| 55 to 64 Years | 5,895 (17.7%) | 26,297 (78.9%) |
| 65 to 74 Years | 21,430 (96.1%) | 9,996 (44.8%) |
| 75 Years and over | 12,436 (99.5%) | 6,313 (50.5%) |
| Total | 63,936 (28.4%) | 164,610 (73.1%) |
Disability Status by Sex by Age in Jefferson County
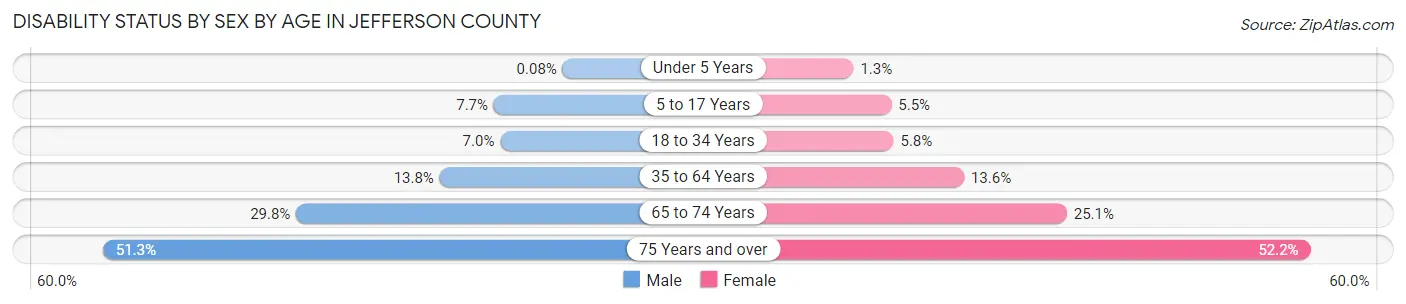
| Age Bracket | Male | Female |
| Under 5 Years | 5 (0.1%) | 82 (1.3%) |
| 5 to 17 Years | 1,546 (7.7%) | 1,038 (5.5%) |
| 18 to 34 Years | 1,618 (7.0%) | 1,282 (5.8%) |
| 35 to 64 Years | 6,495 (13.8%) | 6,297 (13.6%) |
| 65 to 74 Years | 3,170 (29.7%) | 2,920 (25.1%) |
| 75 Years and over | 2,778 (51.3%) | 3,698 (52.2%) |
Disability Class by Sex by Age in Jefferson County
Disability Class: Hearing Difficulty
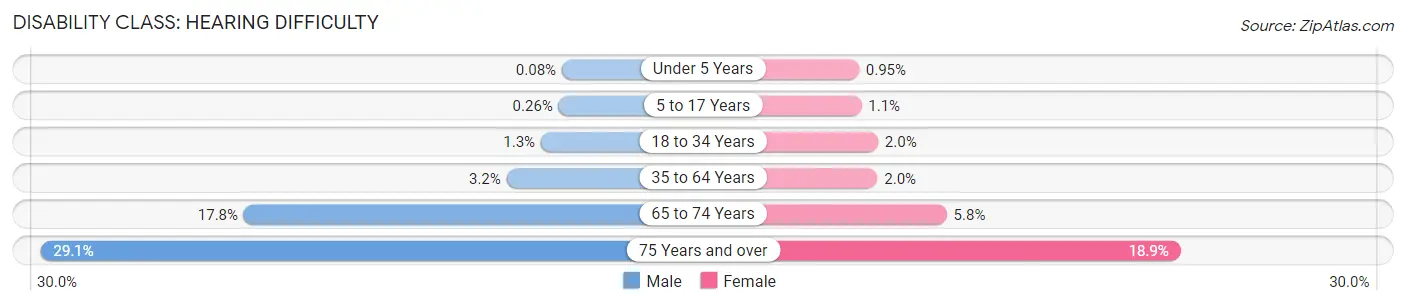
| Age Bracket | Male | Female |
| Under 5 Years | 5 (0.1%) | 60 (0.9%) |
| 5 to 17 Years | 52 (0.3%) | 204 (1.1%) |
| 18 to 34 Years | 288 (1.3%) | 447 (2.0%) |
| 35 to 64 Years | 1,493 (3.2%) | 916 (2.0%) |
| 65 to 74 Years | 1,896 (17.8%) | 681 (5.8%) |
| 75 Years and over | 1,577 (29.1%) | 1,337 (18.9%) |
Disability Class: Vision Difficulty
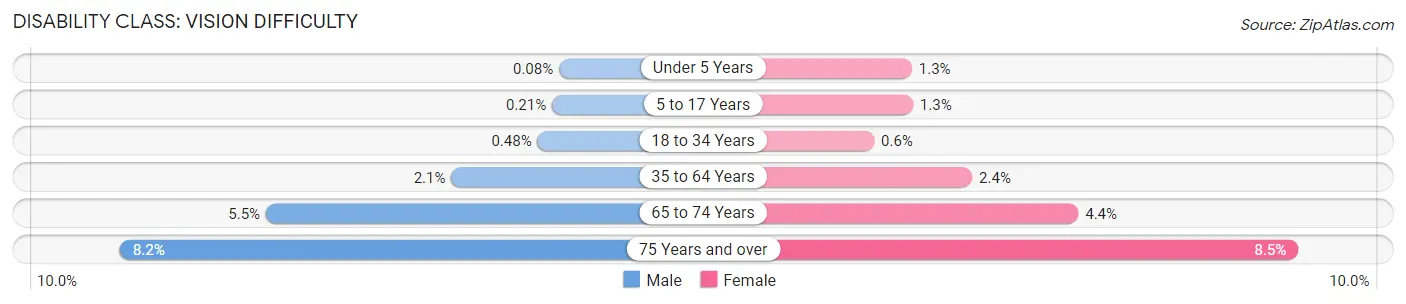
| Age Bracket | Male | Female |
| Under 5 Years | 5 (0.1%) | 82 (1.3%) |
| 5 to 17 Years | 41 (0.2%) | 248 (1.3%) |
| 18 to 34 Years | 111 (0.5%) | 133 (0.6%) |
| 35 to 64 Years | 982 (2.1%) | 1,120 (2.4%) |
| 65 to 74 Years | 588 (5.5%) | 512 (4.4%) |
| 75 Years and over | 446 (8.2%) | 600 (8.5%) |
Disability Class: Cognitive Difficulty
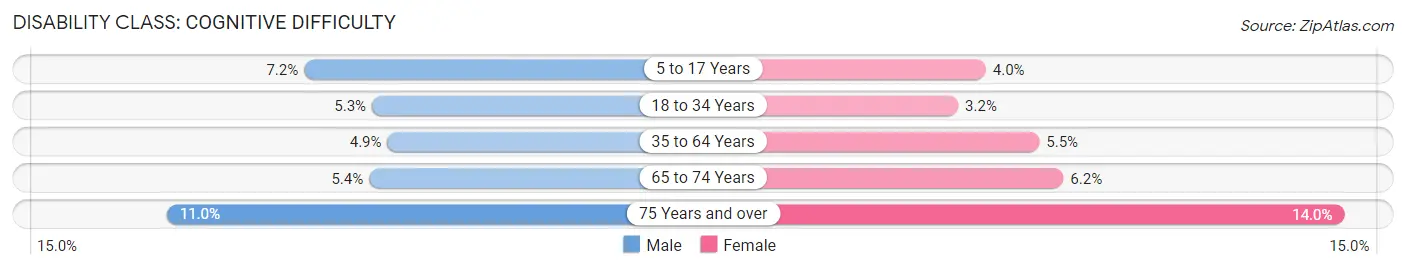
| Age Bracket | Male | Female |
| 5 to 17 Years | 1,443 (7.2%) | 754 (4.0%) |
| 18 to 34 Years | 1,228 (5.3%) | 720 (3.2%) |
| 35 to 64 Years | 2,314 (4.9%) | 2,544 (5.5%) |
| 65 to 74 Years | 576 (5.4%) | 719 (6.2%) |
| 75 Years and over | 598 (11.0%) | 991 (14.0%) |
Disability Class: Ambulatory Difficulty
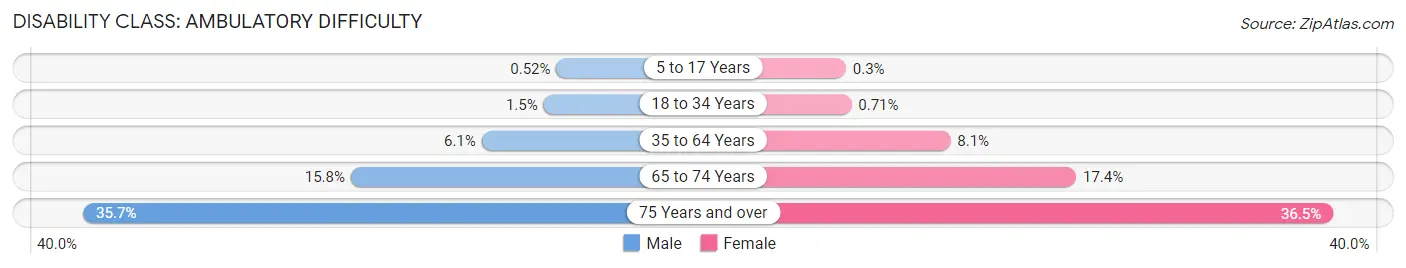
| Age Bracket | Male | Female |
| 5 to 17 Years | 104 (0.5%) | 56 (0.3%) |
| 18 to 34 Years | 339 (1.5%) | 159 (0.7%) |
| 35 to 64 Years | 2,866 (6.1%) | 3,729 (8.1%) |
| 65 to 74 Years | 1,682 (15.8%) | 2,026 (17.4%) |
| 75 Years and over | 1,931 (35.6%) | 2,584 (36.5%) |
Disability Class: Self-Care Difficulty
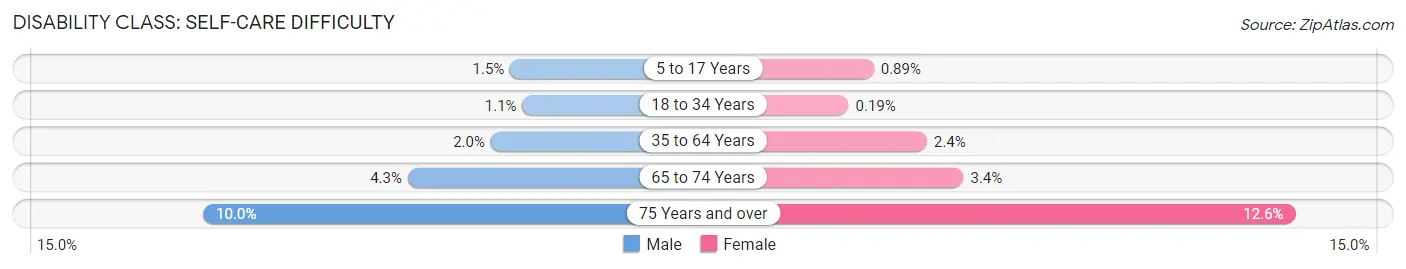
| Age Bracket | Male | Female |
| 5 to 17 Years | 296 (1.5%) | 167 (0.9%) |
| 18 to 34 Years | 263 (1.1%) | 43 (0.2%) |
| 35 to 64 Years | 954 (2.0%) | 1,096 (2.4%) |
| 65 to 74 Years | 461 (4.3%) | 395 (3.4%) |
| 75 Years and over | 543 (10.0%) | 895 (12.6%) |
Technology Access in Jefferson County
Computing Device Access in Jefferson County
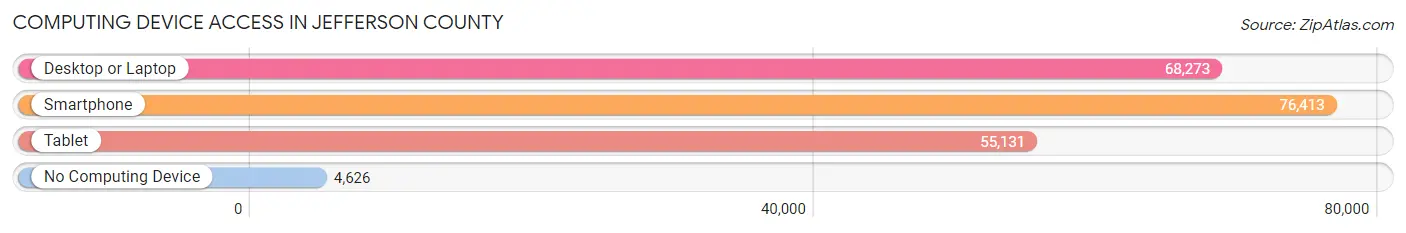
| Device Type | # Households | % Households |
| Desktop or Laptop | 68,273 | 79.0% |
| Smartphone | 76,413 | 88.4% |
| Tablet | 55,131 | 63.8% |
| No Computing Device | 4,626 | 5.3% |
| Total | 86,455 | 100.0% |
Internet Access in Jefferson County
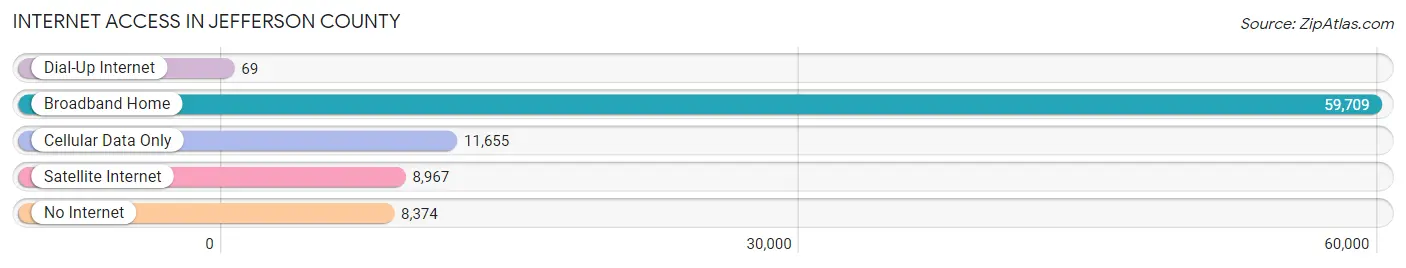
| Internet Type | # Households | % Households |
| Dial-Up Internet | 69 | 0.1% |
| Broadband Home | 59,709 | 69.1% |
| Cellular Data Only | 11,655 | 13.5% |
| Satellite Internet | 8,967 | 10.4% |
| No Internet | 8,374 | 9.7% |
| Total | 86,455 | 100.0% |
Jefferson County Summary
Jefferson County, Missouri is located in the eastern part of the state, just south of St. Louis. It is bordered by St. Louis County to the north, Franklin County to the east, St. Charles County to the south, and Warren County to the west. The county seat is Hillsboro, and the largest city is Arnold. The county was established in 1818 and named after Thomas Jefferson, the third president of the United States.
Geography
Jefferson County covers an area of 545 square miles and is located in the Ozark Plateau region of Missouri. The terrain is mostly rolling hills and valleys, with some flat areas in the northern part of the county. The highest point in the county is located in the northwest corner, at an elevation of 1,068 feet. The county is drained by the Meramec River, which flows through the center of the county. Other major waterways include the Big River, which forms the western border of the county, and the Bourbeuse River, which forms the eastern border.
Climate
Jefferson County has a humid continental climate, with hot, humid summers and cold, wet winters. The average annual temperature is around 54°F, with average highs in the summer reaching around 90°F and average lows in the winter dropping to around 20°F. The average annual precipitation is around 40 inches, with most of it falling in the spring and summer months.
Demographics
As of the 2010 census, Jefferson County had a population of 218,733. The population was spread out, with 24.3% under the age of 18, 8.2% from 18 to 24, 28.2% from 25 to 44, 25.2% from 45 to 64, and 14.1% who were 65 years of age or older. The median age was 37.4 years. The gender makeup of the county was 49.2% male and 50.8% female.
The racial makeup of the county was 87.2% White, 8.2% African American, 0.4% Native American, 1.7% Asian, 0.1% Pacific Islander, 0.9% from other races, and 1.5% from two or more races. Hispanic or Latino of any race were 2.7% of the population.
Economy
Jefferson County has a diverse economy, with a mix of manufacturing, retail, and service industries. The largest employers in the county are the Jefferson County Public Schools, the City of Arnold, and the City of Hillsboro. Other major employers include the Jefferson County Health Department, the Jefferson County Sheriff's Office, and the Jefferson County Courthouse.
The county is also home to several large companies, including Emerson Electric, Monsanto, and Express Scripts. Agriculture is also an important part of the economy, with corn, soybeans, and hay being the main crops.
Jefferson County is also home to several tourist attractions, including the Meramec Caverns, the Jefferson County Historical Society Museum, and the Arnold Historical Society Museum. The county also has several parks and recreational areas, including the Jefferson County Park, the Arnold City Park, and the Hillsboro City Park.
Conclusion
Jefferson County, Missouri is a diverse and vibrant county located in the eastern part of the state. It has a population of 218,733 and a diverse economy, with a mix of manufacturing, retail, and service industries. Agriculture is also an important part of the economy, with corn, soybeans, and hay being the main crops. The county is also home to several tourist attractions, including the Meramec Caverns, the Jefferson County Historical Society Museum, and the Arnold Historical Society Museum.
Common Questions
What is Per Capita Income in Jefferson County?
Per Capita income in Jefferson County is $36,184.
What is the Median Family Income in Jefferson County?
Median Family Income in Jefferson County is $90,332.
What is the Median Household income in Jefferson County?
Median Household Income in Jefferson County is $77,217.
What is Income or Wage Gap in Jefferson County?
Income or Wage Gap in Jefferson County is 34.7%.
Women in Jefferson County earn 65.3 cents for every dollar earned by a man.
What is Family Income Deficit in Jefferson County?
Family Income Deficit in Jefferson County is $9,311.
Families that are below poverty line in Jefferson County earn $9,311 less on average than the poverty threshold level.
What is Inequality or Gini Index in Jefferson County?
Inequality or Gini Index in Jefferson County is 0.39.
What is the Total Population of Jefferson County?
Total Population of Jefferson County is 226,984.
What is the Total Male Population of Jefferson County?
Total Male Population of Jefferson County is 113,749.
What is the Total Female Population of Jefferson County?
Total Female Population of Jefferson County is 113,235.
What is the Ratio of Males per 100 Females in Jefferson County?
There are 100.45 Males per 100 Females in Jefferson County.
What is the Ratio of Females per 100 Males in Jefferson County?
There are 99.55 Females per 100 Males in Jefferson County.
What is the Median Population Age in Jefferson County?
Median Population Age in Jefferson County is 39.9 Years.
What is the Average Family Size in Jefferson County
Average Family Size in Jefferson County is 3.1 People.
What is the Average Household Size in Jefferson County
Average Household Size in Jefferson County is 2.6 People.
How Large is the Labor Force in Jefferson County?
There are 120,031 People in the Labor Forcein in Jefferson County.
What is the Percentage of People in the Labor Force in Jefferson County?
66.2% of People are in the Labor Force in Jefferson County.
What is the Unemployment Rate in Jefferson County?
Unemployment Rate in Jefferson County is 3.8%.