Jasper County, MO Map & Demographics
Jasper County Map
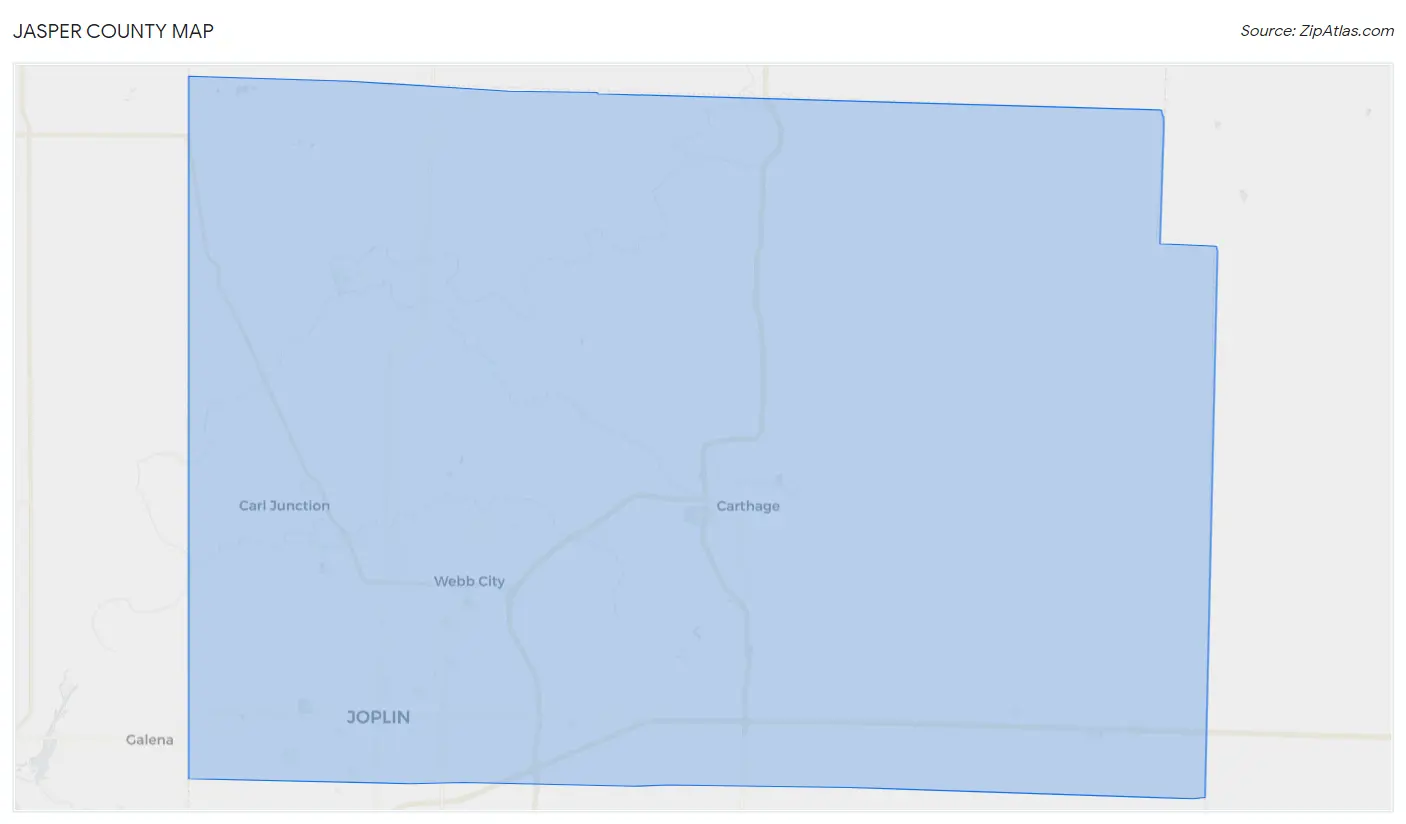
Jasper County Overview
$28,371
PER CAPITA INCOME
$68,289
AVG FAMILY INCOME
$54,963
AVG HOUSEHOLD INCOME
31.7%
WAGE / INCOME GAP [ % ]
68.3¢/ $1
WAGE / INCOME GAP [ $ ]
$10,557
FAMILY INCOME DEFICIT
0.44
INEQUALITY / GINI INDEX
122,788
TOTAL POPULATION
60,468
MALE POPULATION
62,320
FEMALE POPULATION
97.03
MALES / 100 FEMALES
103.06
FEMALES / 100 MALES
36.6
MEDIAN AGE
3.1
AVG FAMILY SIZE
2.5
AVG HOUSEHOLD SIZE
60,504
LABOR FORCE [ PEOPLE ]
63.1%
PERCENT IN LABOR FORCE
4.1%
UNEMPLOYMENT RATE
Jasper County Area Codes
Income in Jasper County
Income Overview in Jasper County
Per Capita Income in Jasper County is $28,371, while median incomes of families and households are $68,289 and $54,963 respectively.
| Characteristic | Number | Measure |
| Per Capita Income | 122,788 | $28,371 |
| Median Family Income | 30,067 | $68,289 |
| Mean Family Income | 30,067 | $85,430 |
| Median Household Income | 47,481 | $54,963 |
| Mean Household Income | 47,481 | $71,579 |
| Income Deficit | 30,067 | $10,557 |
| Wage / Income Gap (%) | 122,788 | 31.67% |
| Wage / Income Gap ($) | 122,788 | 68.33¢ per $1 |
| Gini / Inequality Index | 122,788 | 0.44 |
Earnings by Sex in Jasper County
Average Earnings in Jasper County are $32,571, $40,168 for men and $27,447 for women, a difference of 31.7%.
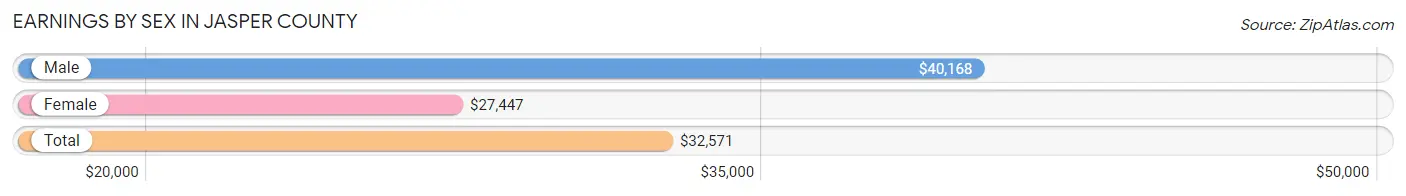
| Sex | Number | Average Earnings |
| Male | 33,383 (52.1%) | $40,168 |
| Female | 30,702 (47.9%) | $27,447 |
| Total | 64,085 (100.0%) | $32,571 |
Earnings by Sex by Income Bracket in Jasper County
The most common earnings brackets in Jasper County are $100,000+ for men (3,152 | 9.4%) and $25,000 to $29,999 for women (3,292 | 10.7%).
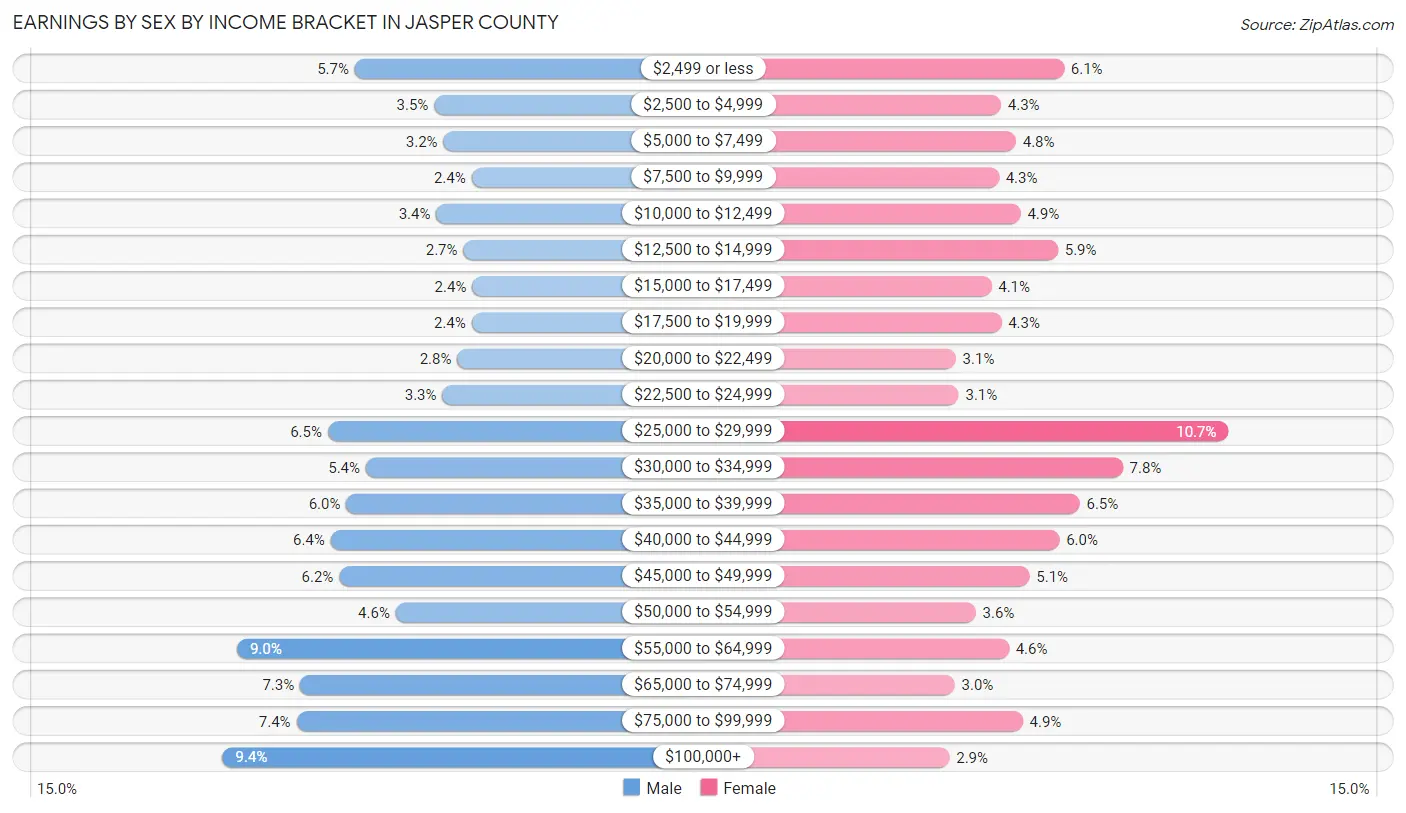
| Income | Male | Female |
| $2,499 or less | 1,909 (5.7%) | 1,872 (6.1%) |
| $2,500 to $4,999 | 1,164 (3.5%) | 1,330 (4.3%) |
| $5,000 to $7,499 | 1,077 (3.2%) | 1,458 (4.8%) |
| $7,500 to $9,999 | 814 (2.4%) | 1,312 (4.3%) |
| $10,000 to $12,499 | 1,145 (3.4%) | 1,499 (4.9%) |
| $12,500 to $14,999 | 890 (2.7%) | 1,822 (5.9%) |
| $15,000 to $17,499 | 808 (2.4%) | 1,248 (4.1%) |
| $17,500 to $19,999 | 813 (2.4%) | 1,332 (4.3%) |
| $20,000 to $22,499 | 948 (2.8%) | 939 (3.1%) |
| $22,500 to $24,999 | 1,088 (3.3%) | 965 (3.1%) |
| $25,000 to $29,999 | 2,162 (6.5%) | 3,292 (10.7%) |
| $30,000 to $34,999 | 1,807 (5.4%) | 2,380 (7.7%) |
| $35,000 to $39,999 | 1,989 (6.0%) | 2,009 (6.5%) |
| $40,000 to $44,999 | 2,138 (6.4%) | 1,832 (6.0%) |
| $45,000 to $49,999 | 2,055 (6.2%) | 1,574 (5.1%) |
| $50,000 to $54,999 | 1,526 (4.6%) | 1,110 (3.6%) |
| $55,000 to $64,999 | 3,016 (9.0%) | 1,398 (4.5%) |
| $65,000 to $74,999 | 2,424 (7.3%) | 930 (3.0%) |
| $75,000 to $99,999 | 2,458 (7.4%) | 1,517 (4.9%) |
| $100,000+ | 3,152 (9.4%) | 883 (2.9%) |
| Total | 33,383 (100.0%) | 30,702 (100.0%) |
Earnings by Sex by Educational Attainment in Jasper County
Average earnings in Jasper County are $45,843 for men and $30,510 for women, a difference of 33.5%. Men with an educational attainment of graduate degree enjoy the highest average annual earnings of $68,561, while those with less than high school education earn the least with $26,061. Women with an educational attainment of graduate degree earn the most with the average annual earnings of $54,859, while those with less than high school education have the smallest earnings of $22,750.
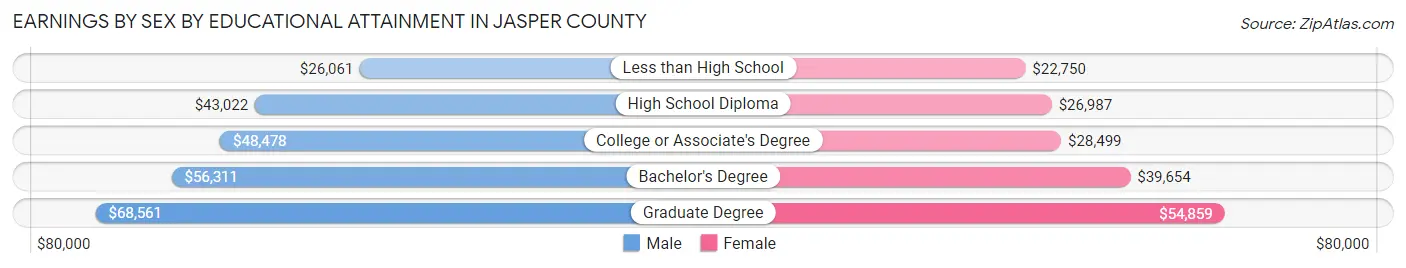
| Educational Attainment | Male Income | Female Income |
| Less than High School | $26,061 | $22,750 |
| High School Diploma | $43,022 | $26,987 |
| College or Associate's Degree | $48,478 | $28,499 |
| Bachelor's Degree | $56,311 | $39,654 |
| Graduate Degree | $68,561 | $54,859 |
| Total | $45,843 | $30,510 |
Family Income in Jasper County
Family Income Brackets in Jasper County
According to the Jasper County family income data, there are 6,344 families falling into the $50,000 to $74,999 income range, which is the most common income bracket and makes up 21.1% of all families. Conversely, the $10,000 to $14,999 income bracket is the least frequent group with only 842 families (2.8%) belonging to this category.
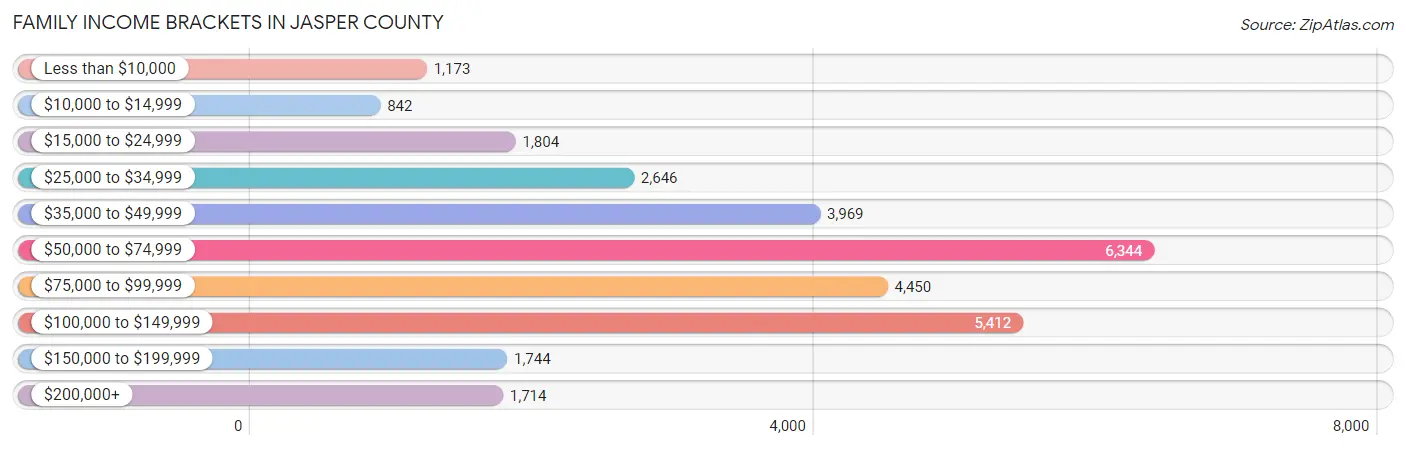
| Income Bracket | # Families | % Families |
| Less than $10,000 | 1,173 | 3.9% |
| $10,000 to $14,999 | 842 | 2.8% |
| $15,000 to $24,999 | 1,804 | 6.0% |
| $25,000 to $34,999 | 2,646 | 8.8% |
| $35,000 to $49,999 | 3,969 | 13.2% |
| $50,000 to $74,999 | 6,344 | 21.1% |
| $75,000 to $99,999 | 4,450 | 14.8% |
| $100,000 to $149,999 | 5,412 | 18.0% |
| $150,000 to $199,999 | 1,744 | 5.8% |
| $200,000+ | 1,714 | 5.7% |
Family Income by Famaliy Size in Jasper County
4-person families (5,197 | 17.3%) account for the highest median family income in Jasper County with $90,796 per family, while 2-person families (14,652 | 48.7%) have the highest median income of $30,810 per family member.
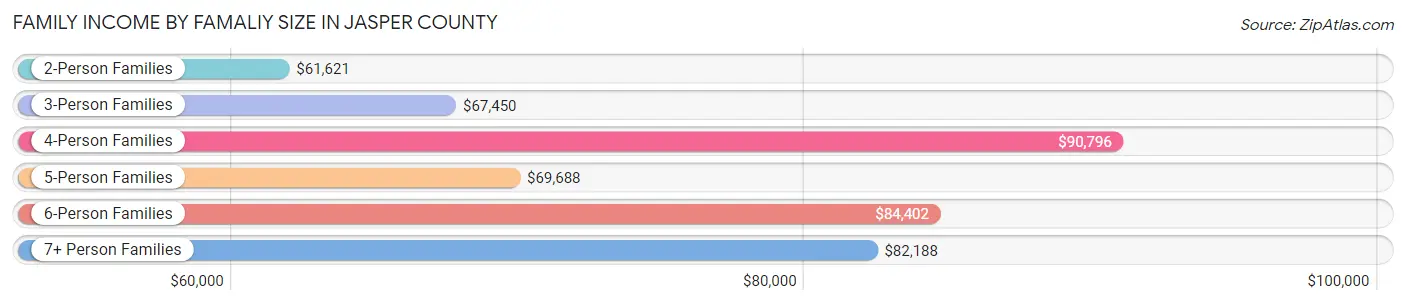
| Income Bracket | # Families | Median Income |
| 2-Person Families | 14,652 (48.7%) | $61,621 |
| 3-Person Families | 6,266 (20.8%) | $67,450 |
| 4-Person Families | 5,197 (17.3%) | $90,796 |
| 5-Person Families | 2,332 (7.8%) | $69,688 |
| 6-Person Families | 1,149 (3.8%) | $84,402 |
| 7+ Person Families | 471 (1.6%) | $82,188 |
| Total | 30,067 (100.0%) | $68,289 |
Family Income by Number of Earners in Jasper County
The median family income in Jasper County is $68,289, with families comprising 3+ earners (3,673) having the highest median family income of $124,034, while families with no earners (3,885) have the lowest median family income of $42,046, accounting for 12.2% and 12.9% of families, respectively.
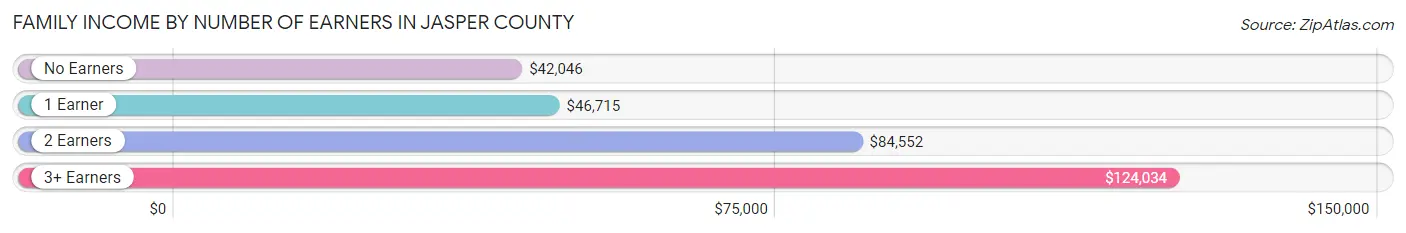
| Number of Earners | # Families | Median Income |
| No Earners | 3,885 (12.9%) | $42,046 |
| 1 Earner | 10,346 (34.4%) | $46,715 |
| 2 Earners | 12,163 (40.5%) | $84,552 |
| 3+ Earners | 3,673 (12.2%) | $124,034 |
| Total | 30,067 (100.0%) | $68,289 |
Household Income in Jasper County
Household Income Brackets in Jasper County
With 9,829 households falling in the category, the $50,000 to $74,999 income range is the most frequent in Jasper County, accounting for 20.7% of all households. In contrast, only 1,852 households (3.9%) fall into the $200,000+ income bracket, making it the least populous group.
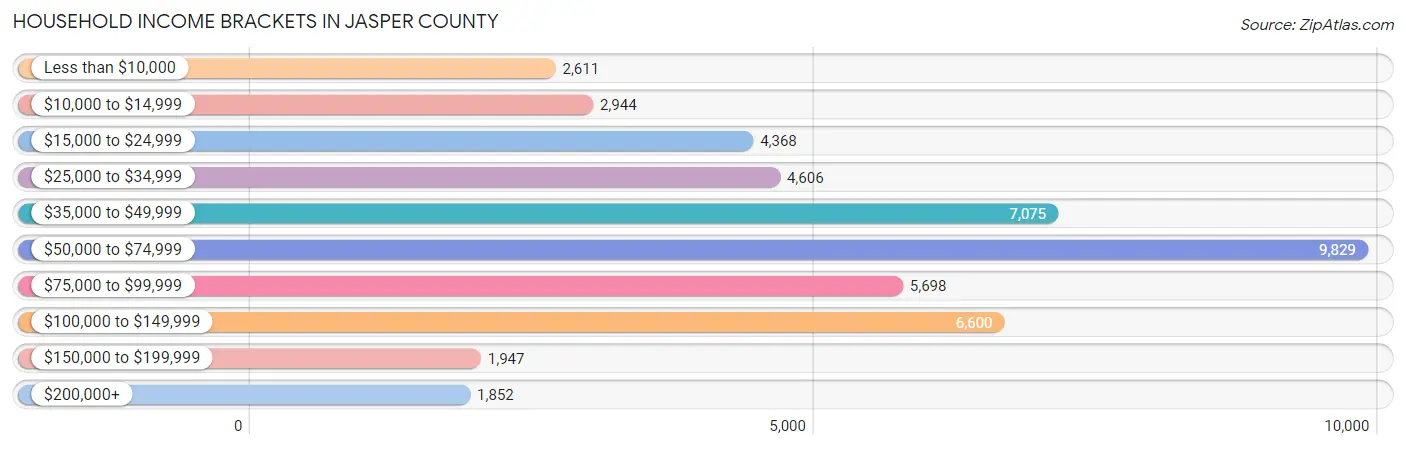
| Income Bracket | # Households | % Households |
| Less than $10,000 | 2,611 | 5.5% |
| $10,000 to $14,999 | 2,944 | 6.2% |
| $15,000 to $24,999 | 4,368 | 9.2% |
| $25,000 to $34,999 | 4,606 | 9.7% |
| $35,000 to $49,999 | 7,075 | 14.9% |
| $50,000 to $74,999 | 9,829 | 20.7% |
| $75,000 to $99,999 | 5,698 | 12.0% |
| $100,000 to $149,999 | 6,600 | 13.9% |
| $150,000 to $199,999 | 1,947 | 4.1% |
| $200,000+ | 1,852 | 3.9% |
Household Income by Householder Age in Jasper County
The median household income in Jasper County is $54,963, with the highest median household income of $61,752 found in the 25 to 44 years age bracket for the primary householder. A total of 15,908 households (33.5%) fall into this category. Meanwhile, the 15 to 24 years age bracket for the primary householder has the lowest median household income of $41,943, with 2,703 households (5.7%) in this group.
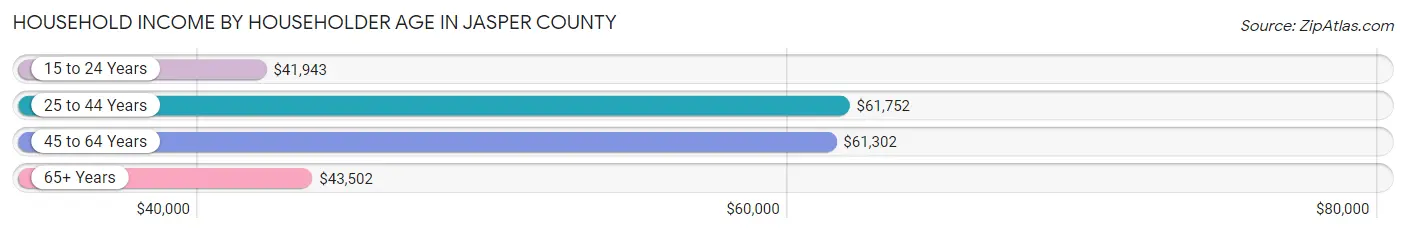
| Income Bracket | # Households | Median Income |
| 15 to 24 Years | 2,703 (5.7%) | $41,943 |
| 25 to 44 Years | 15,908 (33.5%) | $61,752 |
| 45 to 64 Years | 16,321 (34.4%) | $61,302 |
| 65+ Years | 12,549 (26.4%) | $43,502 |
| Total | 47,481 (100.0%) | $54,963 |
Poverty in Jasper County
Income Below Poverty by Sex and Age in Jasper County
With 17.2% poverty level for males and 19.8% for females among the residents of Jasper County, 15 year old males and under 5 year old females are the most vulnerable to poverty, with 293 males (33.8%) and 1,253 females (33.8%) in their respective age groups living below the poverty level.
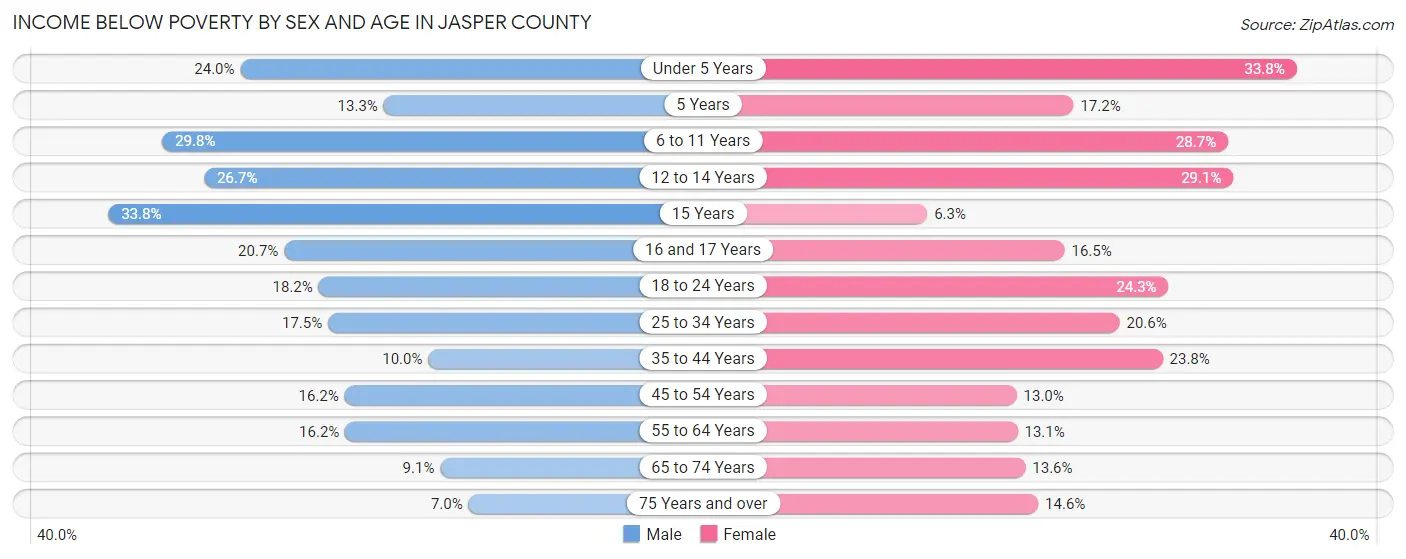
| Age Bracket | Male | Female |
| Under 5 Years | 977 (24.0%) | 1,253 (33.8%) |
| 5 Years | 111 (13.3%) | 146 (17.2%) |
| 6 to 11 Years | 1,592 (29.8%) | 1,314 (28.7%) |
| 12 to 14 Years | 629 (26.7%) | 804 (29.1%) |
| 15 Years | 293 (33.8%) | 58 (6.3%) |
| 16 and 17 Years | 364 (20.7%) | 263 (16.5%) |
| 18 to 24 Years | 1,009 (18.2%) | 1,260 (24.2%) |
| 25 to 34 Years | 1,444 (17.5%) | 1,718 (20.6%) |
| 35 to 44 Years | 792 (10.0%) | 1,807 (23.8%) |
| 45 to 54 Years | 1,157 (16.2%) | 950 (13.0%) |
| 55 to 64 Years | 1,166 (16.2%) | 972 (13.1%) |
| 65 to 74 Years | 464 (9.1%) | 834 (13.6%) |
| 75 Years and over | 219 (7.0%) | 669 (14.6%) |
| Total | 10,217 (17.2%) | 12,048 (19.8%) |
Income Above Poverty by Sex and Age in Jasper County
According to the poverty statistics in Jasper County, males aged 75 years and over and females aged 15 years are the age groups that are most secure financially, with 93.0% of males and 93.7% of females in these age groups living above the poverty line.
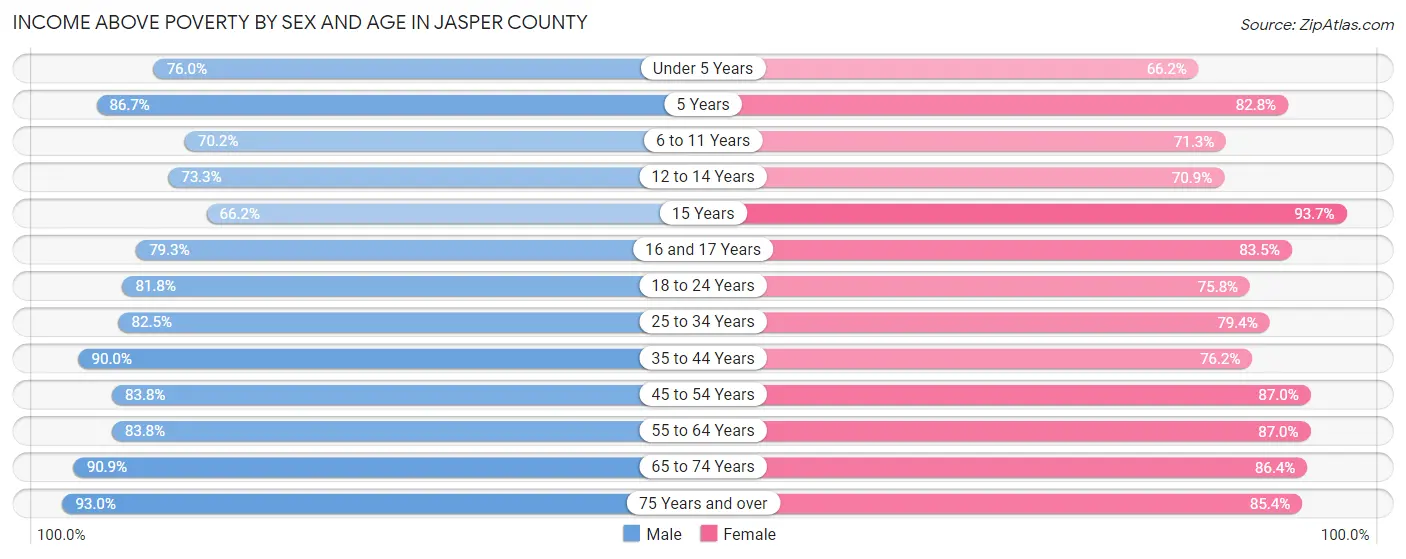
| Age Bracket | Male | Female |
| Under 5 Years | 3,098 (76.0%) | 2,458 (66.2%) |
| 5 Years | 721 (86.7%) | 703 (82.8%) |
| 6 to 11 Years | 3,752 (70.2%) | 3,269 (71.3%) |
| 12 to 14 Years | 1,729 (73.3%) | 1,963 (70.9%) |
| 15 Years | 574 (66.2%) | 857 (93.7%) |
| 16 and 17 Years | 1,392 (79.3%) | 1,327 (83.5%) |
| 18 to 24 Years | 4,545 (81.8%) | 3,936 (75.7%) |
| 25 to 34 Years | 6,821 (82.5%) | 6,612 (79.4%) |
| 35 to 44 Years | 7,108 (90.0%) | 5,779 (76.2%) |
| 45 to 54 Years | 5,969 (83.8%) | 6,367 (87.0%) |
| 55 to 64 Years | 6,030 (83.8%) | 6,479 (87.0%) |
| 65 to 74 Years | 4,611 (90.9%) | 5,284 (86.4%) |
| 75 Years and over | 2,894 (93.0%) | 3,920 (85.4%) |
| Total | 49,244 (82.8%) | 48,954 (80.2%) |
Income Below Poverty Among Married-Couple Families in Jasper County
The poverty statistics for married-couple families in Jasper County show that 6.7% or 1,444 of the total 21,576 families live below the poverty line. Families with 5 or more children have the highest poverty rate of 52.6%, comprising of 112 families. On the other hand, families with 1 or 2 children have the lowest poverty rate of 3.4%, which includes 215 families.
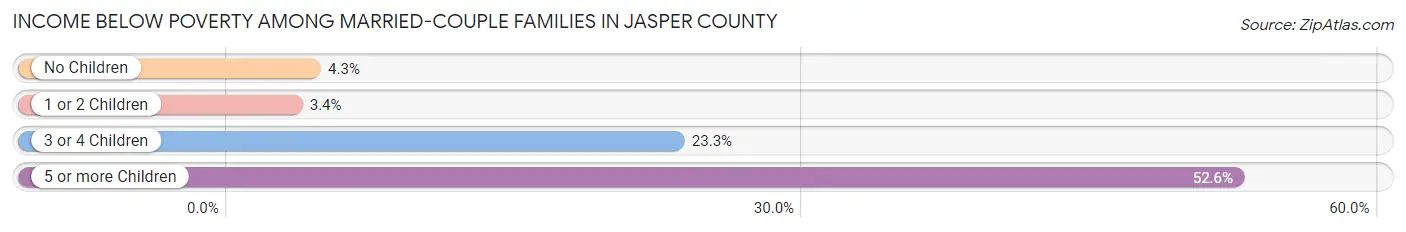
| Children | Above Poverty | Below Poverty |
| No Children | 12,007 (95.7%) | 545 (4.3%) |
| 1 or 2 Children | 6,145 (96.6%) | 215 (3.4%) |
| 3 or 4 Children | 1,879 (76.7%) | 572 (23.3%) |
| 5 or more Children | 101 (47.4%) | 112 (52.6%) |
| Total | 20,132 (93.3%) | 1,444 (6.7%) |
Income Below Poverty Among Single-Parent Households in Jasper County
According to the poverty data in Jasper County, 16.9% or 411 single-father households and 32.7% or 1,980 single-mother households are living below the poverty line. Among single-father households, those with 5 or more children have the highest poverty rate, with 6 households (100.0%) experiencing poverty. Likewise, among single-mother households, those with 5 or more children have the highest poverty rate, with 32 households (86.5%) falling below the poverty line.
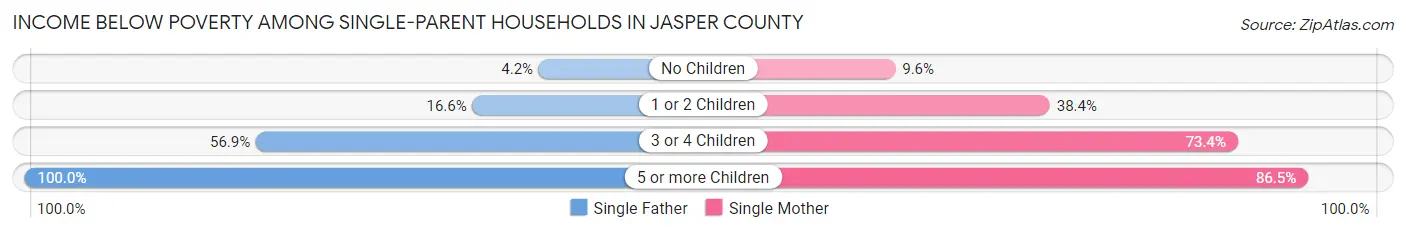
| Children | Single Father | Single Mother |
| No Children | 38 (4.2%) | 179 (9.6%) |
| 1 or 2 Children | 206 (16.6%) | 1,405 (38.4%) |
| 3 or 4 Children | 161 (56.9%) | 364 (73.4%) |
| 5 or more Children | 6 (100.0%) | 32 (86.5%) |
| Total | 411 (16.9%) | 1,980 (32.7%) |
Income Below Poverty Among Married-Couple vs Single-Parent Households in Jasper County
The poverty data for Jasper County shows that 1,444 of the married-couple family households (6.7%) and 2,391 of the single-parent households (28.2%) are living below the poverty level. Within the married-couple family households, those with 5 or more children have the highest poverty rate, with 112 households (52.6%) falling below the poverty line. Among the single-parent households, those with 5 or more children have the highest poverty rate, with 38 household (88.4%) living below poverty.
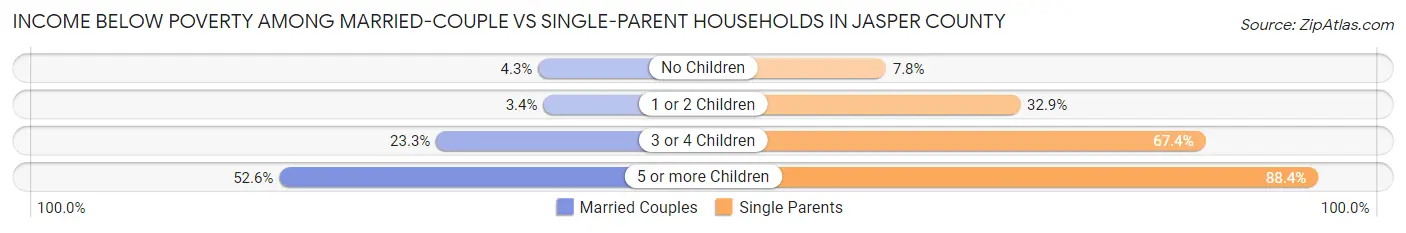
| Children | Married-Couple Families | Single-Parent Households |
| No Children | 545 (4.3%) | 217 (7.8%) |
| 1 or 2 Children | 215 (3.4%) | 1,611 (32.9%) |
| 3 or 4 Children | 572 (23.3%) | 525 (67.4%) |
| 5 or more Children | 112 (52.6%) | 38 (88.4%) |
| Total | 1,444 (6.7%) | 2,391 (28.2%) |
Race in Jasper County
The most populous races in Jasper County are White / Caucasian (106,113 | 86.4%), Hispanic or Latino (10,658 | 8.7%), and Two or more Races (8,684 | 7.1%).
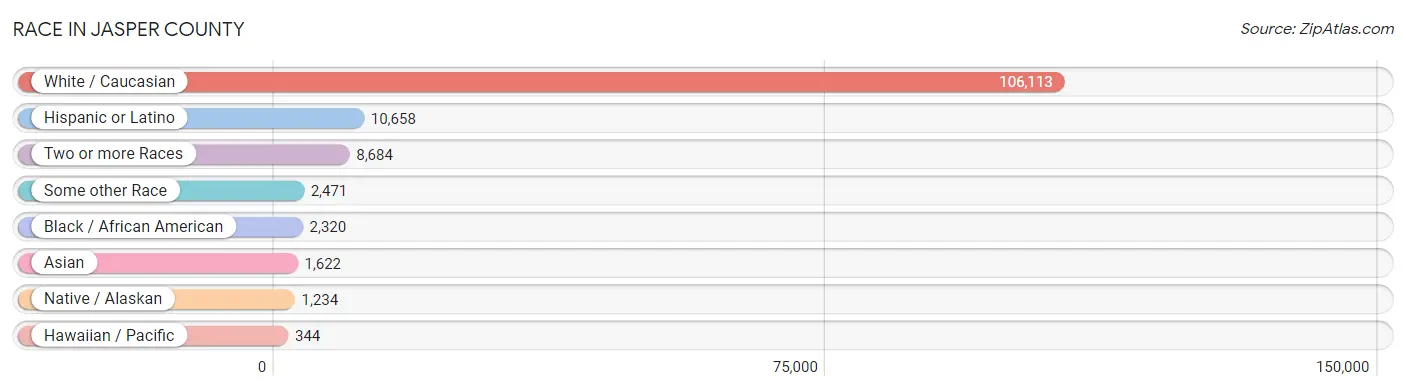
| Race | # Population | % Population |
| Asian | 1,622 | 1.3% |
| Black / African American | 2,320 | 1.9% |
| Hawaiian / Pacific | 344 | 0.3% |
| Hispanic or Latino | 10,658 | 8.7% |
| Native / Alaskan | 1,234 | 1.0% |
| White / Caucasian | 106,113 | 86.4% |
| Two or more Races | 8,684 | 7.1% |
| Some other Race | 2,471 | 2.0% |
| Total | 122,788 | 100.0% |
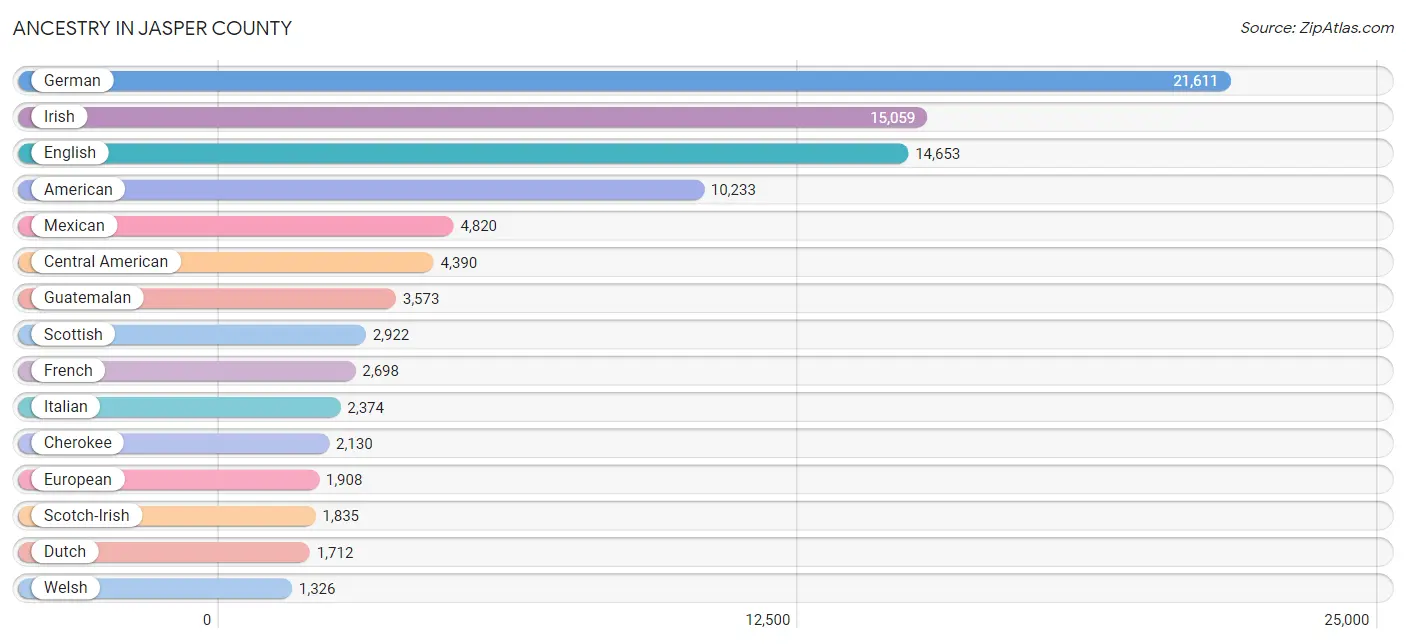
Ancestry in Jasper County
The most populous ancestries reported in Jasper County are German (21,611 | 17.6%), Irish (15,059 | 12.3%), English (14,653 | 11.9%), American (10,233 | 8.3%), and Mexican (4,820 | 3.9%), together accounting for 54.0% of all Jasper County residents.
| Ancestry | # Population | % Population |
| African | 38 | 0.0% |
| Alaskan Athabascan | 8 | 0.0% |
| Albanian | 59 | 0.1% |
| American | 10,233 | 8.3% |
| Apache | 14 | 0.0% |
| Arab | 198 | 0.2% |
| Australian | 140 | 0.1% |
| Austrian | 133 | 0.1% |
| Bangladeshi | 31 | 0.0% |
| Belgian | 4 | 0.0% |
| Bermudan | 9 | 0.0% |
| Bhutanese | 57 | 0.1% |
| Blackfeet | 157 | 0.1% |
| Bolivian | 15 | 0.0% |
| Brazilian | 88 | 0.1% |
| British | 588 | 0.5% |
| Burmese | 208 | 0.2% |
| Cambodian | 2 | 0.0% |
| Canadian | 55 | 0.0% |
| Celtic | 1 | 0.0% |
| Central American | 4,390 | 3.6% |
| Central American Indian | 136 | 0.1% |
| Cherokee | 2,130 | 1.7% |
| Chippewa | 60 | 0.1% |
| Choctaw | 145 | 0.1% |
| Colombian | 44 | 0.0% |
| Comanche | 13 | 0.0% |
| Costa Rican | 21 | 0.0% |
| Creek | 96 | 0.1% |
| Croatian | 23 | 0.0% |
| Czech | 397 | 0.3% |
| Czechoslovakian | 15 | 0.0% |
| Danish | 406 | 0.3% |
| Delaware | 1 | 0.0% |
| Dominican | 7 | 0.0% |
| Dutch | 1,712 | 1.4% |
| Dutch West Indian | 6 | 0.0% |
| Eastern European | 154 | 0.1% |
| English | 14,653 | 11.9% |
| European | 1,908 | 1.5% |
| Fijian | 15 | 0.0% |
| Filipino | 68 | 0.1% |
| Finnish | 167 | 0.1% |
| French | 2,698 | 2.2% |
| French American Indian | 152 | 0.1% |
| French Canadian | 143 | 0.1% |
| German | 21,611 | 17.6% |
| Greek | 171 | 0.1% |
| Guamanian / Chamorro | 26 | 0.0% |
| Guatemalan | 3,573 | 2.9% |
| Haitian | 2 | 0.0% |
| Honduran | 183 | 0.2% |
| Hungarian | 96 | 0.1% |
| Indian (Asian) | 218 | 0.2% |
| Indonesian | 53 | 0.0% |
| Iranian | 24 | 0.0% |
| Irish | 15,059 | 12.3% |
| Iroquois | 211 | 0.2% |
| Italian | 2,374 | 1.9% |
| Jamaican | 38 | 0.0% |
| Japanese | 35 | 0.0% |
| Jordanian | 100 | 0.1% |
| Kenyan | 61 | 0.1% |
| Korean | 499 | 0.4% |
| Latvian | 81 | 0.1% |
| Lebanese | 89 | 0.1% |
| Lithuanian | 122 | 0.1% |
| Marshallese | 61 | 0.1% |
| Menominee | 9 | 0.0% |
| Mexican | 4,820 | 3.9% |
| Mexican American Indian | 18 | 0.0% |
| Native Hawaiian | 64 | 0.1% |
| Navajo | 155 | 0.1% |
| New Zealander | 6 | 0.0% |
| Nicaraguan | 10 | 0.0% |
| Northern European | 55 | 0.0% |
| Norwegian | 710 | 0.6% |
| Osage | 72 | 0.1% |
| Ottawa | 72 | 0.1% |
| Pakistani | 102 | 0.1% |
| Panamanian | 55 | 0.0% |
| Pennsylvania German | 33 | 0.0% |
| Polish | 971 | 0.8% |
| Portuguese | 84 | 0.1% |
| Potawatomi | 55 | 0.0% |
| Puerto Rican | 641 | 0.5% |
| Romanian | 96 | 0.1% |
| Russian | 250 | 0.2% |
| Salvadoran | 548 | 0.4% |
| Samoan | 78 | 0.1% |
| Scandinavian | 566 | 0.5% |
| Scotch-Irish | 1,835 | 1.5% |
| Scottish | 2,922 | 2.4% |
| Seminole | 56 | 0.1% |
| Serbian | 21 | 0.0% |
| Shoshone | 4 | 0.0% |
| Sioux | 127 | 0.1% |
| Slavic | 11 | 0.0% |
| Slovak | 47 | 0.0% |
| Slovene | 11 | 0.0% |
| South African | 10 | 0.0% |
| South American | 88 | 0.1% |
| Spaniard | 484 | 0.4% |
| Spanish | 162 | 0.1% |
| Spanish American | 15 | 0.0% |
| Sri Lankan | 500 | 0.4% |
| Subsaharan African | 109 | 0.1% |
| Swedish | 1,206 | 1.0% |
| Swiss | 339 | 0.3% |
| Thai | 170 | 0.1% |
| Tlingit-Haida | 4 | 0.0% |
| Ukrainian | 14 | 0.0% |
| Venezuelan | 29 | 0.0% |
| Welsh | 1,326 | 1.1% |
| Yugoslavian | 31 | 0.0% | View All 115 Rows |
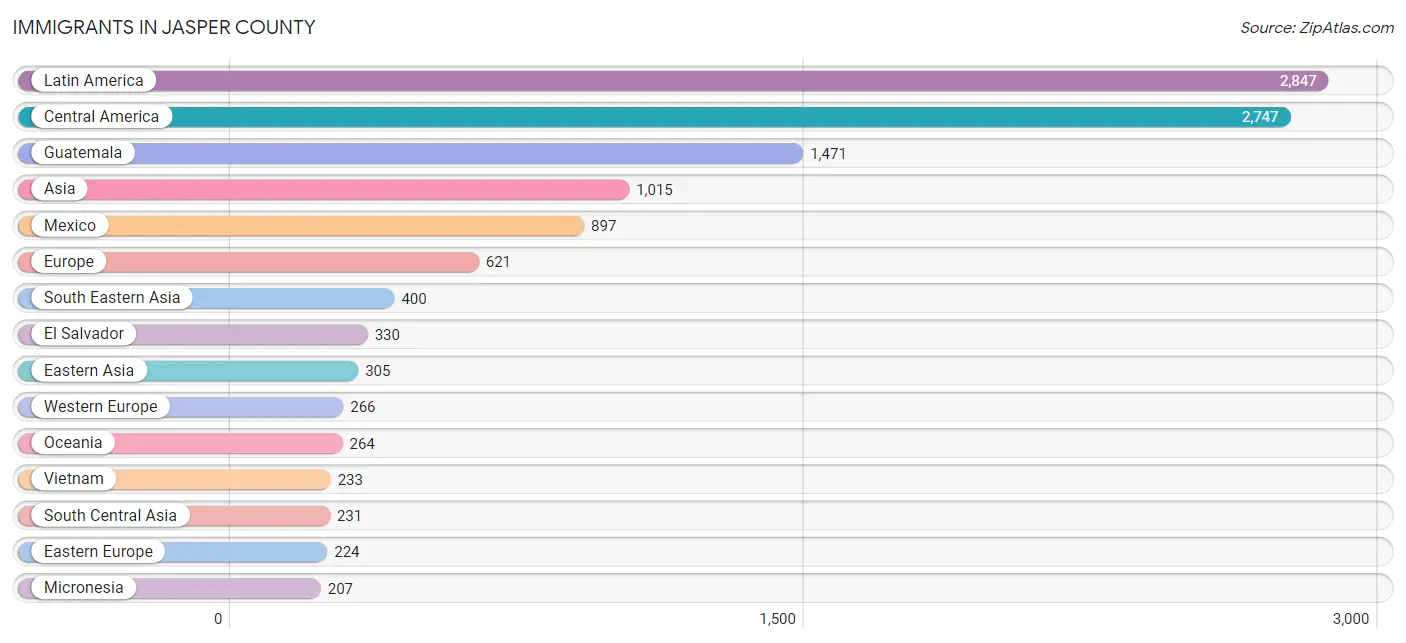
Immigrants in Jasper County
The most numerous immigrant groups reported in Jasper County came from Latin America (2,847 | 2.3%), Central America (2,747 | 2.2%), Guatemala (1,471 | 1.2%), Asia (1,015 | 0.8%), and Mexico (897 | 0.7%), together accounting for 7.3% of all Jasper County residents.
| Immigration Origin | # Population | % Population |
| Africa | 96 | 0.1% |
| Asia | 1,015 | 0.8% |
| Australia | 36 | 0.0% |
| Austria | 15 | 0.0% |
| Brazil | 58 | 0.1% |
| Canada | 22 | 0.0% |
| Caribbean | 13 | 0.0% |
| Central America | 2,747 | 2.2% |
| China | 176 | 0.1% |
| Costa Rica | 21 | 0.0% |
| Czechoslovakia | 11 | 0.0% |
| Eastern Africa | 51 | 0.0% |
| Eastern Asia | 305 | 0.3% |
| Eastern Europe | 224 | 0.2% |
| El Salvador | 330 | 0.3% |
| England | 51 | 0.0% |
| Europe | 621 | 0.5% |
| France | 63 | 0.1% |
| Germany | 172 | 0.1% |
| Guatemala | 1,471 | 1.2% |
| Honduras | 17 | 0.0% |
| Hong Kong | 9 | 0.0% |
| Hungary | 52 | 0.0% |
| India | 32 | 0.0% |
| Iran | 5 | 0.0% |
| Ireland | 54 | 0.0% |
| Jamaica | 13 | 0.0% |
| Japan | 22 | 0.0% |
| Jordan | 54 | 0.0% |
| Kazakhstan | 6 | 0.0% |
| Kenya | 51 | 0.0% |
| Korea | 107 | 0.1% |
| Latin America | 2,847 | 2.3% |
| Latvia | 13 | 0.0% |
| Mexico | 897 | 0.7% |
| Micronesia | 207 | 0.2% |
| Nepal | 102 | 0.1% |
| Netherlands | 16 | 0.0% |
| Nigeria | 7 | 0.0% |
| North Macedonia | 19 | 0.0% |
| Northern Africa | 38 | 0.0% |
| Northern Europe | 131 | 0.1% |
| Oceania | 264 | 0.2% |
| Pakistan | 86 | 0.1% |
| Philippines | 101 | 0.1% |
| Russia | 109 | 0.1% |
| Saudi Arabia | 15 | 0.0% |
| Scotland | 1 | 0.0% |
| Singapore | 1 | 0.0% |
| South America | 87 | 0.1% |
| South Central Asia | 231 | 0.2% |
| South Eastern Asia | 400 | 0.3% |
| Sudan | 38 | 0.0% |
| Syria | 10 | 0.0% |
| Taiwan | 73 | 0.1% |
| Thailand | 52 | 0.0% |
| Venezuela | 29 | 0.0% |
| Vietnam | 233 | 0.2% |
| Western Africa | 7 | 0.0% |
| Western Asia | 79 | 0.1% |
| Western Europe | 266 | 0.2% | View All 61 Rows |
Sex and Age in Jasper County
Sex and Age in Jasper County
The most populous age groups in Jasper County are 5 to 9 Years (4,356 | 7.2%) for men and 10 to 14 Years (4,608 | 7.4%) for women.
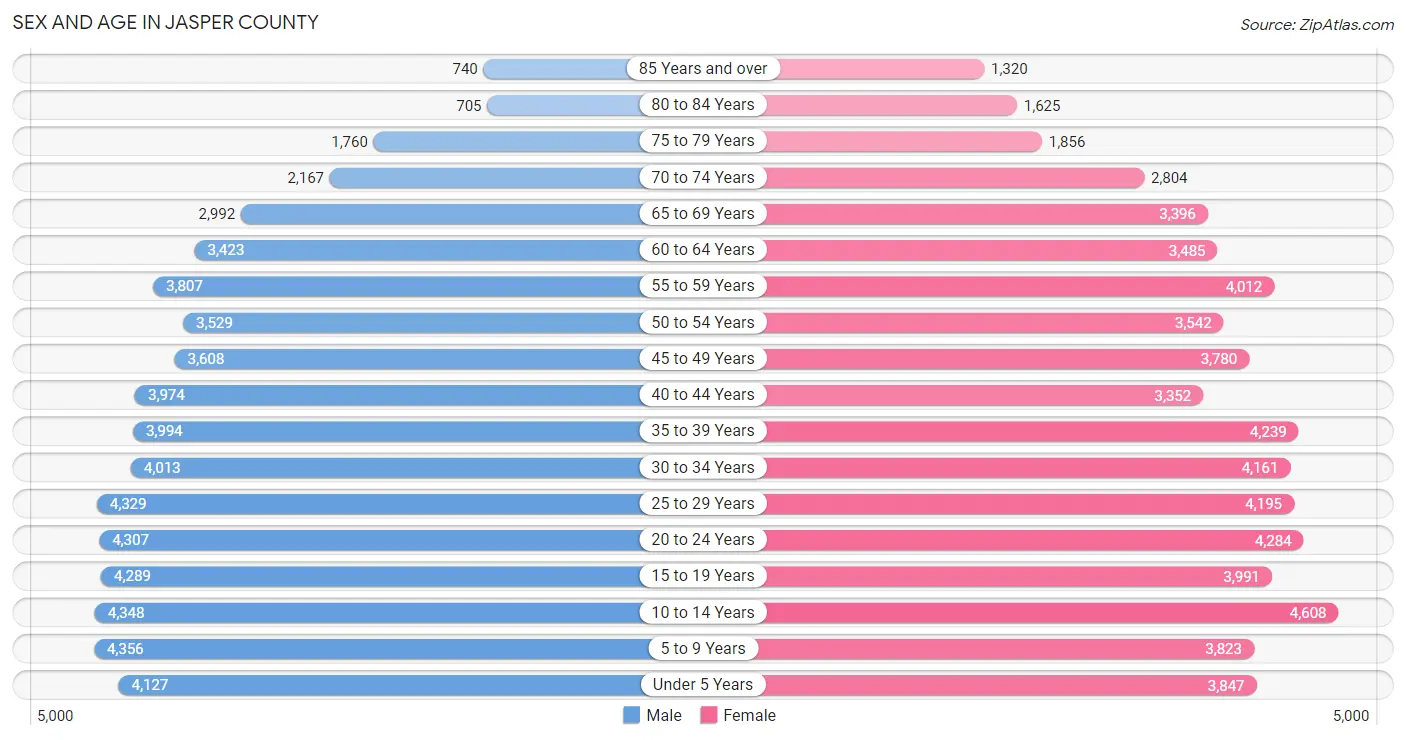
| Age Bracket | Male | Female |
| Under 5 Years | 4,127 (6.8%) | 3,847 (6.2%) |
| 5 to 9 Years | 4,356 (7.2%) | 3,823 (6.1%) |
| 10 to 14 Years | 4,348 (7.2%) | 4,608 (7.4%) |
| 15 to 19 Years | 4,289 (7.1%) | 3,991 (6.4%) |
| 20 to 24 Years | 4,307 (7.1%) | 4,284 (6.9%) |
| 25 to 29 Years | 4,329 (7.2%) | 4,195 (6.7%) |
| 30 to 34 Years | 4,013 (6.6%) | 4,161 (6.7%) |
| 35 to 39 Years | 3,994 (6.6%) | 4,239 (6.8%) |
| 40 to 44 Years | 3,974 (6.6%) | 3,352 (5.4%) |
| 45 to 49 Years | 3,608 (6.0%) | 3,780 (6.1%) |
| 50 to 54 Years | 3,529 (5.8%) | 3,542 (5.7%) |
| 55 to 59 Years | 3,807 (6.3%) | 4,012 (6.4%) |
| 60 to 64 Years | 3,423 (5.7%) | 3,485 (5.6%) |
| 65 to 69 Years | 2,992 (5.0%) | 3,396 (5.4%) |
| 70 to 74 Years | 2,167 (3.6%) | 2,804 (4.5%) |
| 75 to 79 Years | 1,760 (2.9%) | 1,856 (3.0%) |
| 80 to 84 Years | 705 (1.2%) | 1,625 (2.6%) |
| 85 Years and over | 740 (1.2%) | 1,320 (2.1%) |
| Total | 60,468 (100.0%) | 62,320 (100.0%) |
Families and Households in Jasper County
Median Family Size in Jasper County
The median family size in Jasper County is 3.15 persons per family, with married-couple families (21,576 | 71.8%) accounting for the largest median family size of 3.22 persons per family. On the other hand, single male/father families (2,436 | 8.1%) represent the smallest median family size with 2.92 persons per family.
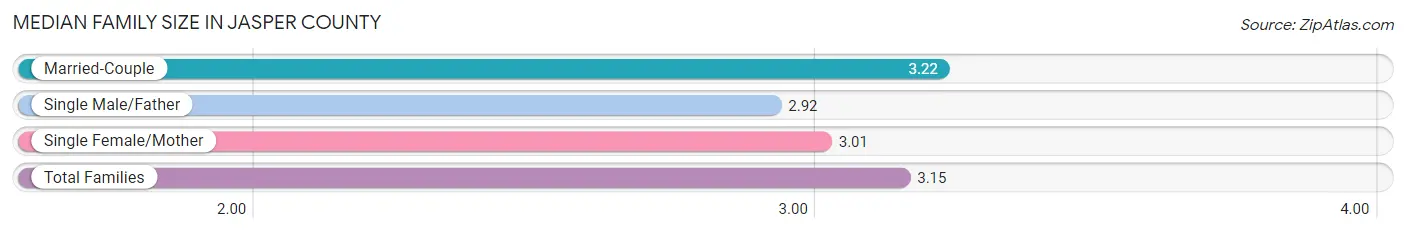
| Family Type | # Families | Family Size |
| Married-Couple | 21,576 (71.8%) | 3.22 |
| Single Male/Father | 2,436 (8.1%) | 2.92 |
| Single Female/Mother | 6,055 (20.1%) | 3.01 |
| Total Families | 30,067 (100.0%) | 3.15 |
Median Household Size in Jasper County
The median household size in Jasper County is 2.54 persons per household, with single male/father households (2,436 | 5.1%) accounting for the largest median household size of 3.39 persons per household. non-family households (17,414 | 36.7%) represent the smallest median household size with 1.28 persons per household.
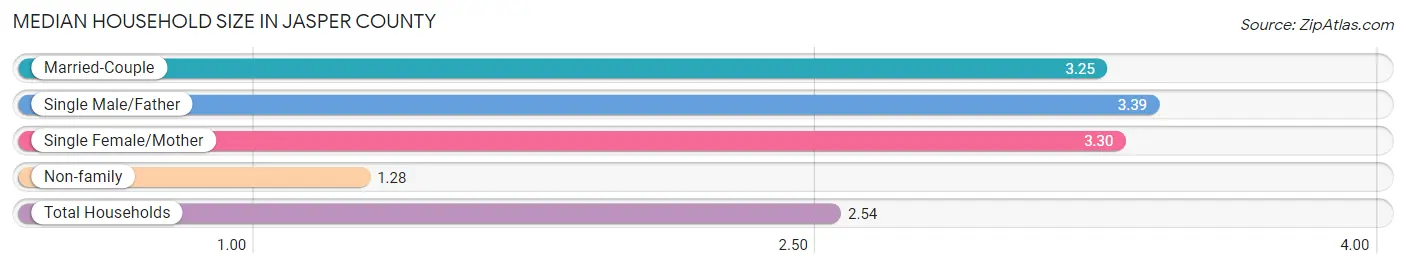
| Household Type | # Households | Household Size |
| Married-Couple | 21,576 (45.4%) | 3.25 |
| Single Male/Father | 2,436 (5.1%) | 3.39 |
| Single Female/Mother | 6,055 (12.8%) | 3.30 |
| Non-family | 17,414 (36.7%) | 1.28 |
| Total Households | 47,481 (100.0%) | 2.54 |
Household Size by Marriage Status in Jasper County
Out of a total of 47,481 households in Jasper County, 30,067 (63.3%) are family households, while 17,414 (36.7%) are nonfamily households. The most numerous type of family households are 2-person households, comprising 13,551, and the most common type of nonfamily households are 1-person households, comprising 13,532.
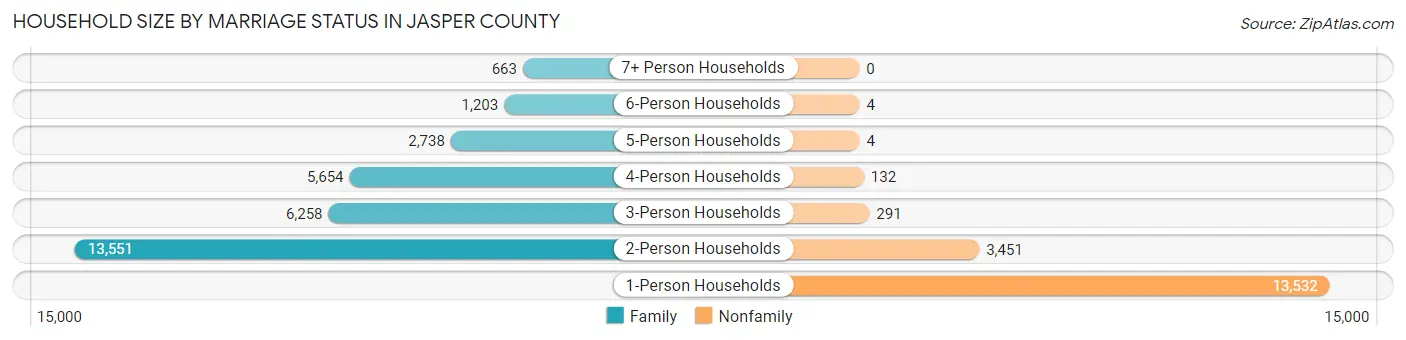
| Household Size | Family Households | Nonfamily Households |
| 1-Person Households | - | 13,532 (28.5%) |
| 2-Person Households | 13,551 (28.5%) | 3,451 (7.3%) |
| 3-Person Households | 6,258 (13.2%) | 291 (0.6%) |
| 4-Person Households | 5,654 (11.9%) | 132 (0.3%) |
| 5-Person Households | 2,738 (5.8%) | 4 (0.0%) |
| 6-Person Households | 1,203 (2.5%) | 4 (0.0%) |
| 7+ Person Households | 663 (1.4%) | 0 (0.0%) |
| Total | 30,067 (63.3%) | 17,414 (36.7%) |
Female Fertility in Jasper County
Fertility by Age in Jasper County
Average fertility rate in Jasper County is 57.0 births per 1,000 women. Women in the age bracket of 20 to 34 years have the highest fertility rate with 100.0 births per 1,000 women. Women in the age bracket of 20 to 34 years acount for 76.9% of all women with births.
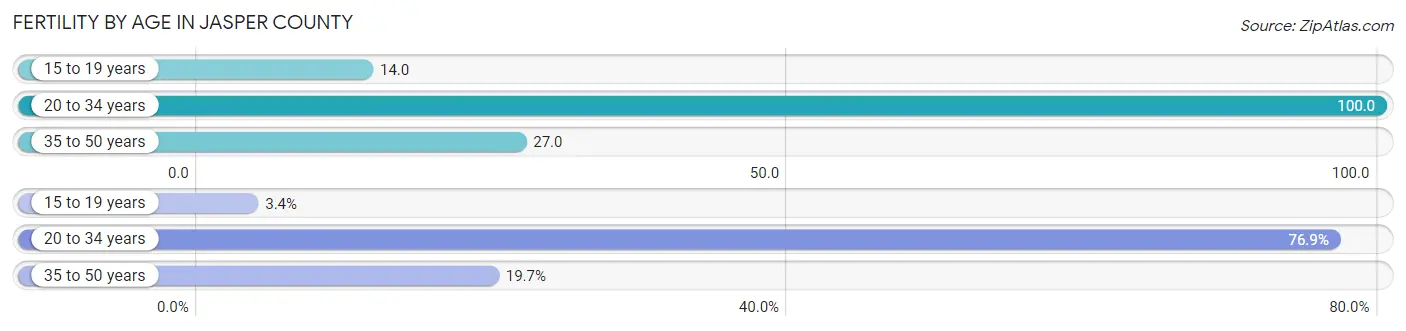
| Age Bracket | Women with Births | Births / 1,000 Women |
| 15 to 19 years | 56 (3.4%) | 14.0 |
| 20 to 34 years | 1,262 (76.9%) | 100.0 |
| 35 to 50 years | 324 (19.7%) | 27.0 |
| Total | 1,642 (100.0%) | 57.0 |
Fertility by Age by Marriage Status in Jasper County
68.3% of women with births (1,642) in Jasper County are married. The highest percentage of unmarried women with births falls into 15 to 19 years age bracket with 60.7% of them unmarried at the time of birth, while the lowest percentage of unmarried women with births belong to 35 to 50 years age bracket with 22.2% of them unmarried.
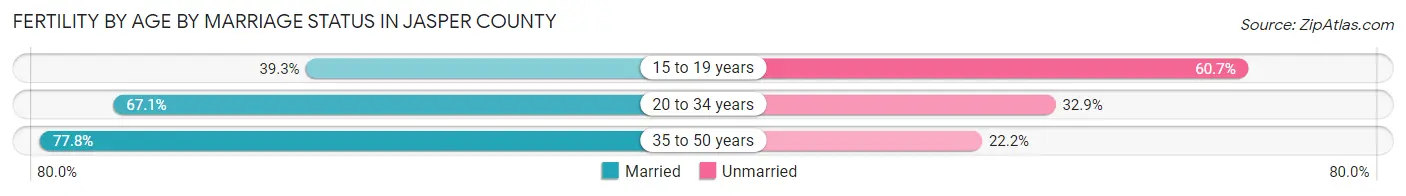
| Age Bracket | Married | Unmarried |
| 15 to 19 years | 22 (39.3%) | 34 (60.7%) |
| 20 to 34 years | 847 (67.1%) | 415 (32.9%) |
| 35 to 50 years | 252 (77.8%) | 72 (22.2%) |
| Total | 1,121 (68.3%) | 521 (31.7%) |
Fertility by Education in Jasper County
Average fertility rate in Jasper County is 57.0 births per 1,000 women. Women with the education attainment of bachelor's degree have the highest fertility rate of 68.0 births per 1,000 women, while women with the education attainment of less than high school have the lowest fertility at 38.0 births per 1,000 women. Women with the education attainment of college or associate's degree represent 35.7% of all women with births.
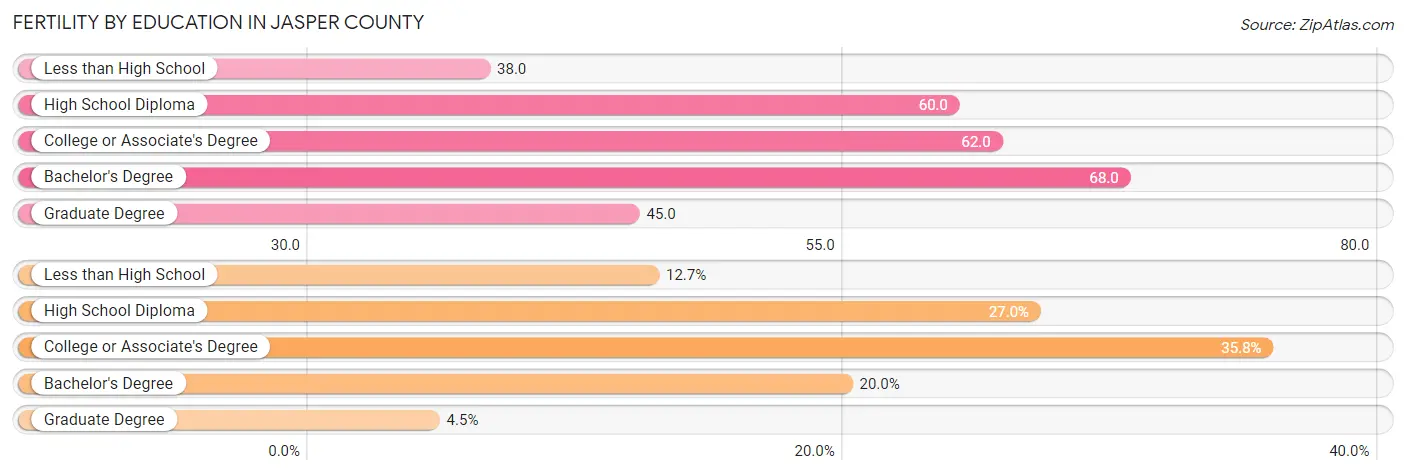
| Educational Attainment | Women with Births | Births / 1,000 Women |
| Less than High School | 209 (12.7%) | 38.0 |
| High School Diploma | 444 (27.0%) | 60.0 |
| College or Associate's Degree | 587 (35.7%) | 62.0 |
| Bachelor's Degree | 328 (20.0%) | 68.0 |
| Graduate Degree | 74 (4.5%) | 45.0 |
| Total | 1,642 (100.0%) | 57.0 |
Fertility by Education by Marriage Status in Jasper County
31.7% of women with births in Jasper County are unmarried. Women with the educational attainment of graduate degree are most likely to be married with 97.3% of them married at childbirth, while women with the educational attainment of high school diploma are least likely to be married with 52.9% of them unmarried at childbirth.
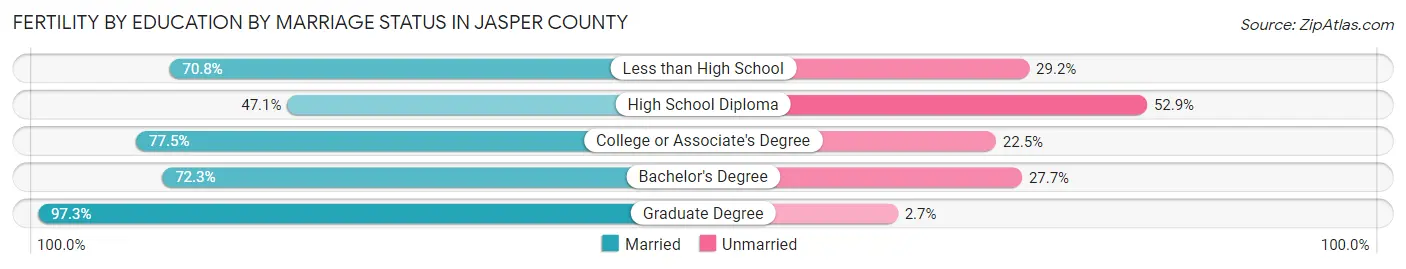
| Educational Attainment | Married | Unmarried |
| Less than High School | 148 (70.8%) | 61 (29.2%) |
| High School Diploma | 209 (47.1%) | 235 (52.9%) |
| College or Associate's Degree | 455 (77.5%) | 132 (22.5%) |
| Bachelor's Degree | 237 (72.3%) | 91 (27.7%) |
| Graduate Degree | 72 (97.3%) | 2 (2.7%) |
| Total | 1,121 (68.3%) | 521 (31.7%) |
Employment Characteristics in Jasper County
Employment by Class of Employer in Jasper County
Among the 56,502 employed individuals in Jasper County, private company employees (39,158 | 69.3%), not-for-profit organizations (6,034 | 10.7%), and local government employees (3,169 | 5.6%) make up the most common classes of employment.
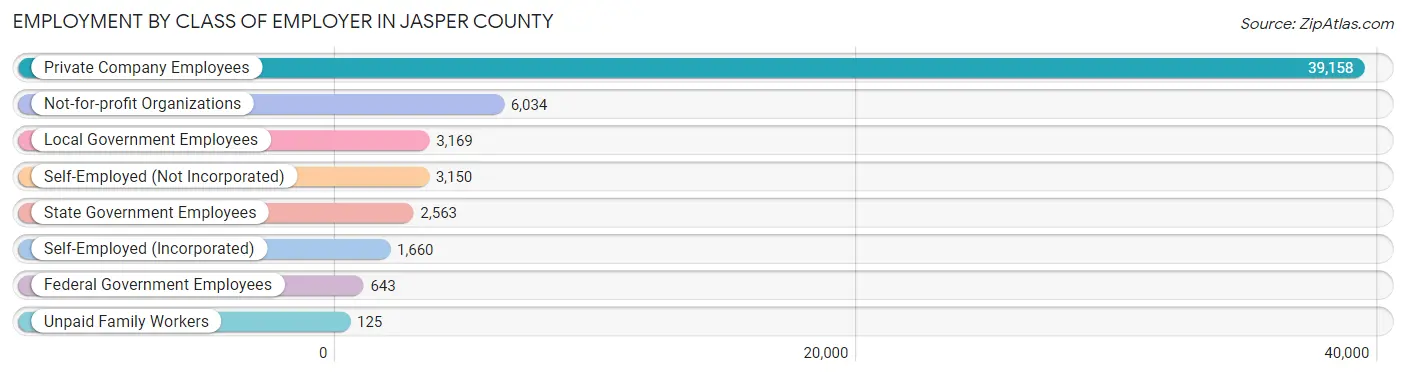
| Employer Class | # Employees | % Employees |
| Private Company Employees | 39,158 | 69.3% |
| Self-Employed (Incorporated) | 1,660 | 2.9% |
| Self-Employed (Not Incorporated) | 3,150 | 5.6% |
| Not-for-profit Organizations | 6,034 | 10.7% |
| Local Government Employees | 3,169 | 5.6% |
| State Government Employees | 2,563 | 4.5% |
| Federal Government Employees | 643 | 1.1% |
| Unpaid Family Workers | 125 | 0.2% |
| Total | 56,502 | 100.0% |
Employment Status by Age in Jasper County
According to the labor force statistics for Jasper County, out of the total population over 16 years of age (95,886), 63.1% or 60,504 individuals are in the labor force, with 4.1% or 2,481 of them unemployed. The age group with the highest labor force participation rate is 20 to 24 years, with 84.9% or 7,294 individuals in the labor force. Within the labor force, the 16 to 19 years age range has the highest percentage of unemployed individuals, with 12.5% or 411 of them being unemployed.
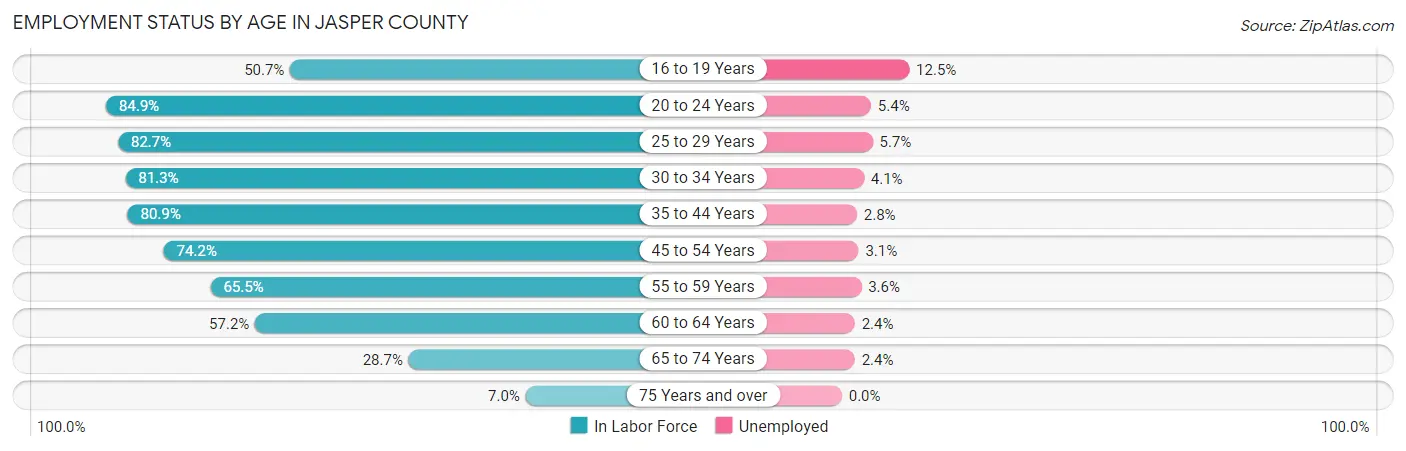
| Age Bracket | In Labor Force | Unemployed |
| 16 to 19 Years | 3,289 (50.7%) | 411 (12.5%) |
| 20 to 24 Years | 7,294 (84.9%) | 394 (5.4%) |
| 25 to 29 Years | 7,049 (82.7%) | 402 (5.7%) |
| 30 to 34 Years | 6,645 (81.3%) | 272 (4.1%) |
| 35 to 44 Years | 12,587 (80.9%) | 352 (2.8%) |
| 45 to 54 Years | 10,729 (74.2%) | 333 (3.1%) |
| 55 to 59 Years | 5,121 (65.5%) | 184 (3.6%) |
| 60 to 64 Years | 3,951 (57.2%) | 95 (2.4%) |
| 65 to 74 Years | 3,260 (28.7%) | 78 (2.4%) |
| 75 Years and over | 560 (7.0%) | 0 (0.0%) |
| Total | 60,504 (63.1%) | 2,481 (4.1%) |
Employment Status by Educational Attainment in Jasper County
According to labor force statistics for Jasper County, 75.0% of individuals (46,082) out of the total population between 25 and 64 years of age (61,443) are in the labor force, with 3.5% or 1,613 of them being unemployed. The group with the highest labor force participation rate are those with the educational attainment of bachelor's degree or higher, with 87.5% or 13,722 individuals in the labor force. Within the labor force, individuals with less than high school education have the highest percentage of unemployment, with 5.3% or 212 of them being unemployed.
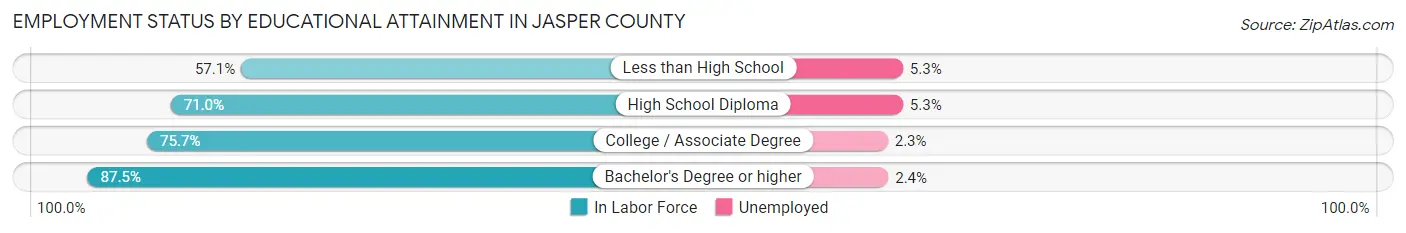
| Educational Attainment | In Labor Force | Unemployed |
| Less than High School | 3,996 (57.1%) | 371 (5.3%) |
| High School Diploma | 14,762 (71.0%) | 1,102 (5.3%) |
| College / Associate Degree | 13,605 (75.7%) | 413 (2.3%) |
| Bachelor's Degree or higher | 13,722 (87.5%) | 376 (2.4%) |
| Total | 46,082 (75.0%) | 2,151 (3.5%) |
Employment Occupations by Sex in Jasper County
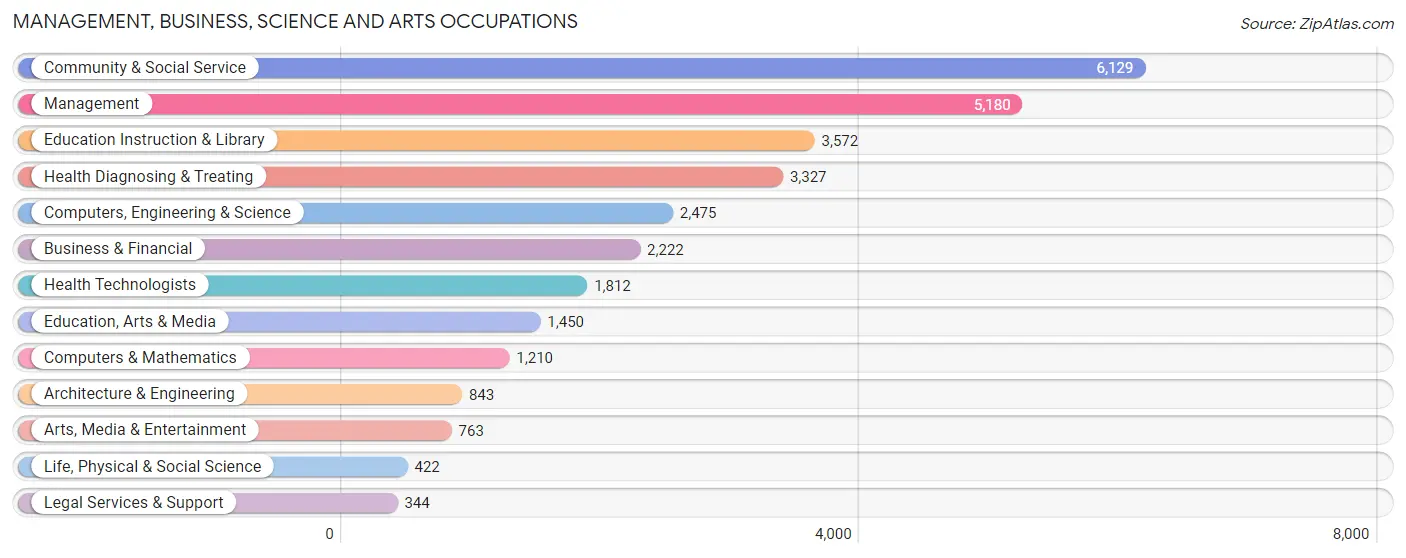
Management, Business, Science and Arts Occupations
The most common Management, Business, Science and Arts occupations in Jasper County are Community & Social Service (6,129 | 10.6%), Management (5,180 | 8.9%), Education Instruction & Library (3,572 | 6.2%), Health Diagnosing & Treating (3,327 | 5.7%), and Computers, Engineering & Science (2,475 | 4.3%).
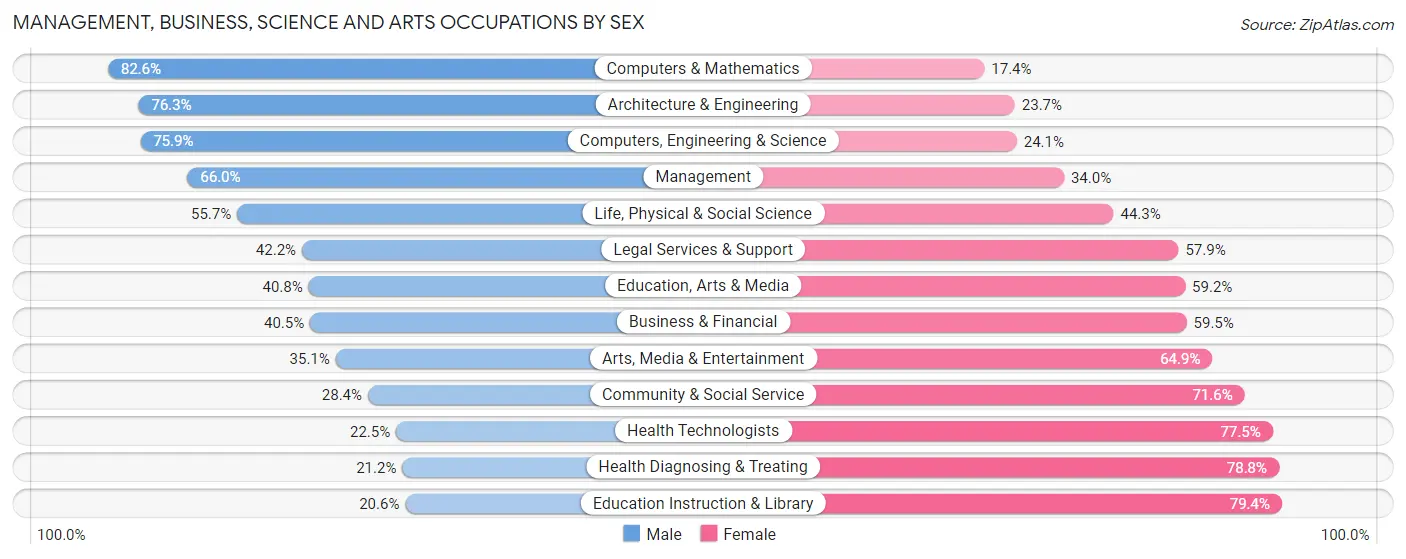
Management, Business, Science and Arts Occupations by Sex
Within the Management, Business, Science and Arts occupations in Jasper County, the most male-oriented occupations are Computers & Mathematics (82.6%), Architecture & Engineering (76.3%), and Computers, Engineering & Science (75.9%), while the most female-oriented occupations are Education Instruction & Library (79.4%), Health Diagnosing & Treating (78.8%), and Health Technologists (77.5%).
| Occupation | Male | Female |
| Management | 3,421 (66.0%) | 1,759 (34.0%) |
| Business & Financial | 899 (40.5%) | 1,323 (59.5%) |
| Computers, Engineering & Science | 1,878 (75.9%) | 597 (24.1%) |
| Computers & Mathematics | 1,000 (82.6%) | 210 (17.4%) |
| Architecture & Engineering | 643 (76.3%) | 200 (23.7%) |
| Life, Physical & Social Science | 235 (55.7%) | 187 (44.3%) |
| Community & Social Service | 1,740 (28.4%) | 4,389 (71.6%) |
| Education, Arts & Media | 591 (40.8%) | 859 (59.2%) |
| Legal Services & Support | 145 (42.1%) | 199 (57.9%) |
| Education Instruction & Library | 736 (20.6%) | 2,836 (79.4%) |
| Arts, Media & Entertainment | 268 (35.1%) | 495 (64.9%) |
| Health Diagnosing & Treating | 706 (21.2%) | 2,621 (78.8%) |
| Health Technologists | 408 (22.5%) | 1,404 (77.5%) |
| Total (Category) | 8,644 (44.7%) | 10,689 (55.3%) |
| Total (Overall) | 30,312 (52.3%) | 27,660 (47.7%) |
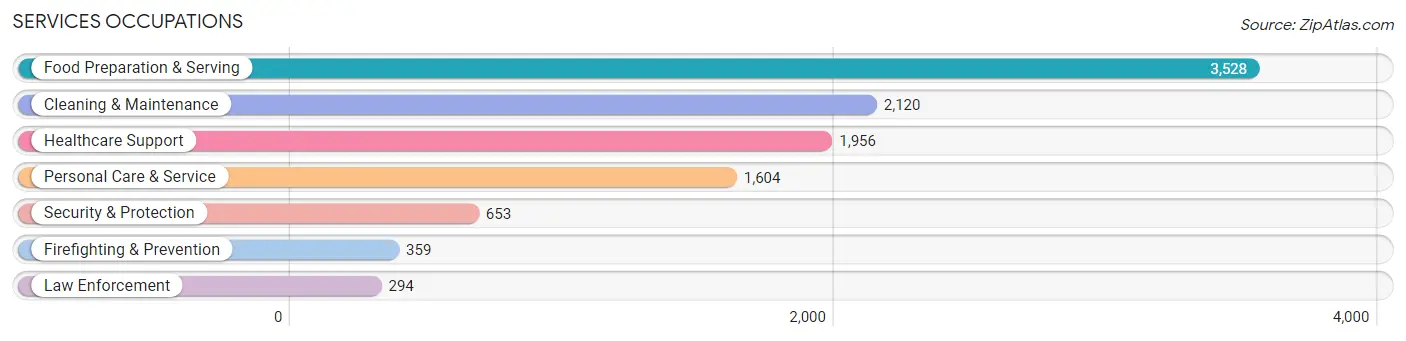
Services Occupations
The most common Services occupations in Jasper County are Food Preparation & Serving (3,528 | 6.1%), Cleaning & Maintenance (2,120 | 3.7%), Healthcare Support (1,956 | 3.4%), Personal Care & Service (1,604 | 2.8%), and Security & Protection (653 | 1.1%).
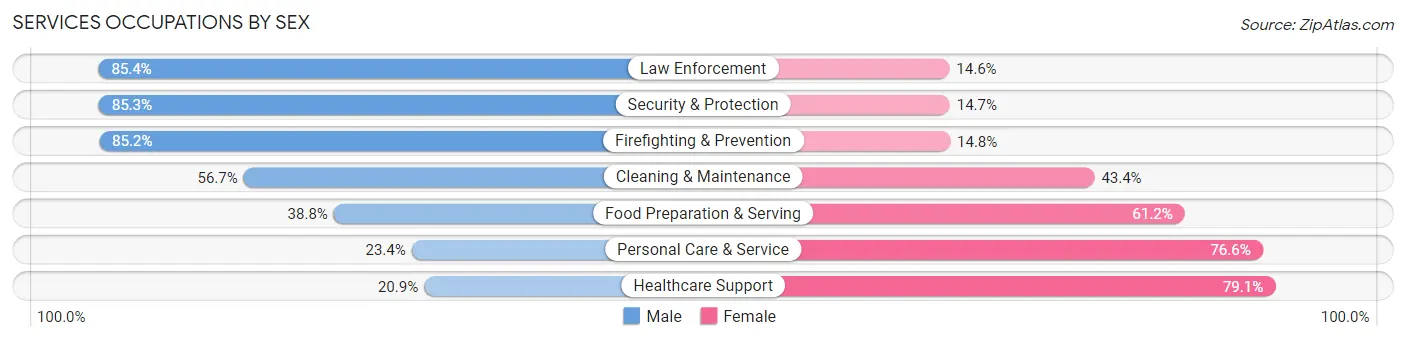
Services Occupations by Sex
Within the Services occupations in Jasper County, the most male-oriented occupations are Law Enforcement (85.4%), Security & Protection (85.3%), and Firefighting & Prevention (85.2%), while the most female-oriented occupations are Healthcare Support (79.1%), Personal Care & Service (76.6%), and Food Preparation & Serving (61.2%).
| Occupation | Male | Female |
| Healthcare Support | 409 (20.9%) | 1,547 (79.1%) |
| Security & Protection | 557 (85.3%) | 96 (14.7%) |
| Firefighting & Prevention | 306 (85.2%) | 53 (14.8%) |
| Law Enforcement | 251 (85.4%) | 43 (14.6%) |
| Food Preparation & Serving | 1,369 (38.8%) | 2,159 (61.2%) |
| Cleaning & Maintenance | 1,201 (56.7%) | 919 (43.3%) |
| Personal Care & Service | 375 (23.4%) | 1,229 (76.6%) |
| Total (Category) | 3,911 (39.7%) | 5,950 (60.3%) |
| Total (Overall) | 30,312 (52.3%) | 27,660 (47.7%) |
Sales and Office Occupations
The most common Sales and Office occupations in Jasper County are Office & Administration (6,668 | 11.5%), and Sales & Related (6,148 | 10.6%).

Sales and Office Occupations by Sex
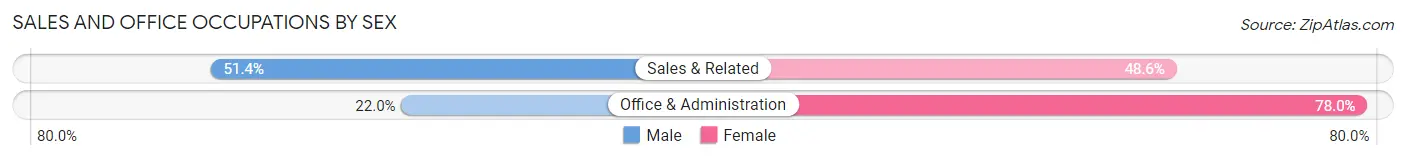
| Occupation | Male | Female |
| Sales & Related | 3,158 (51.4%) | 2,990 (48.6%) |
| Office & Administration | 1,469 (22.0%) | 5,199 (78.0%) |
| Total (Category) | 4,627 (36.1%) | 8,189 (63.9%) |
| Total (Overall) | 30,312 (52.3%) | 27,660 (47.7%) |
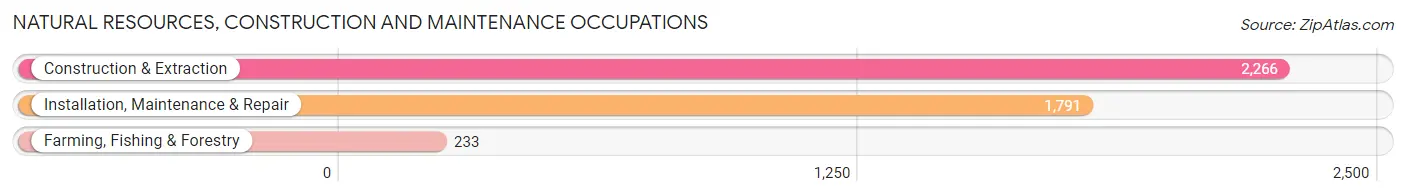
Natural Resources, Construction and Maintenance Occupations
The most common Natural Resources, Construction and Maintenance occupations in Jasper County are Construction & Extraction (2,266 | 3.9%), Installation, Maintenance & Repair (1,791 | 3.1%), and Farming, Fishing & Forestry (233 | 0.4%).
Natural Resources, Construction and Maintenance Occupations by Sex
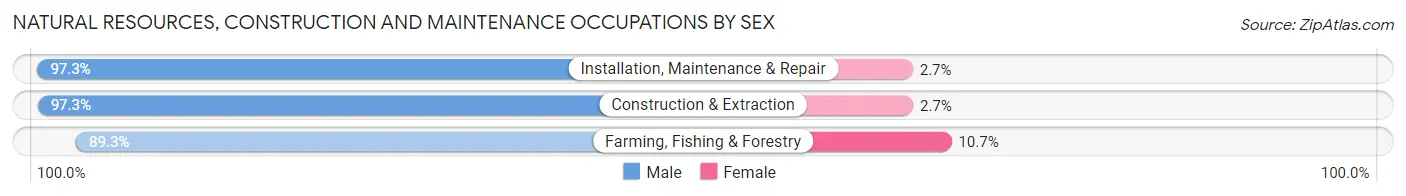
| Occupation | Male | Female |
| Farming, Fishing & Forestry | 208 (89.3%) | 25 (10.7%) |
| Construction & Extraction | 2,204 (97.3%) | 62 (2.7%) |
| Installation, Maintenance & Repair | 1,743 (97.3%) | 48 (2.7%) |
| Total (Category) | 4,155 (96.9%) | 135 (3.2%) |
| Total (Overall) | 30,312 (52.3%) | 27,660 (47.7%) |
Production, Transportation and Moving Occupations
The most common Production, Transportation and Moving occupations in Jasper County are Production (5,444 | 9.4%), Material Moving (3,479 | 6.0%), and Transportation (2,749 | 4.7%).
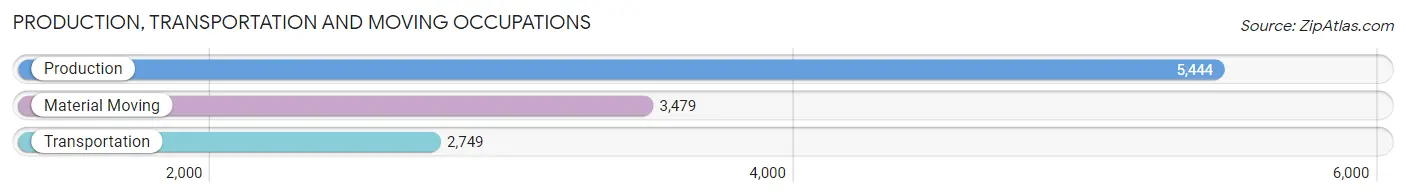
Production, Transportation and Moving Occupations by Sex
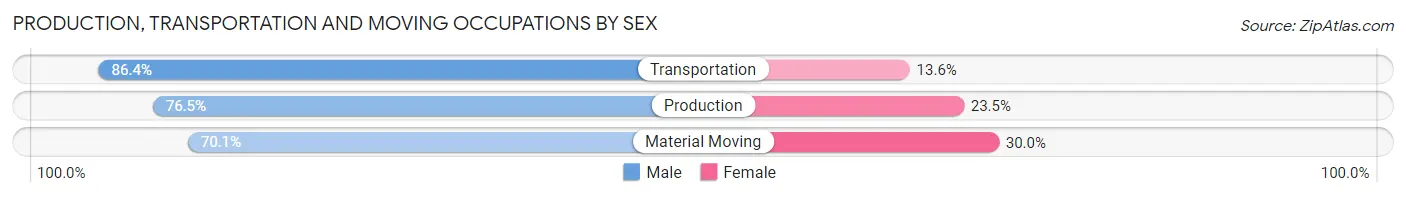
| Occupation | Male | Female |
| Production | 4,163 (76.5%) | 1,281 (23.5%) |
| Transportation | 2,375 (86.4%) | 374 (13.6%) |
| Material Moving | 2,437 (70.1%) | 1,042 (29.9%) |
| Total (Category) | 8,975 (76.9%) | 2,697 (23.1%) |
| Total (Overall) | 30,312 (52.3%) | 27,660 (47.7%) |
Employment Industries by Sex in Jasper County
Employment Industries in Jasper County
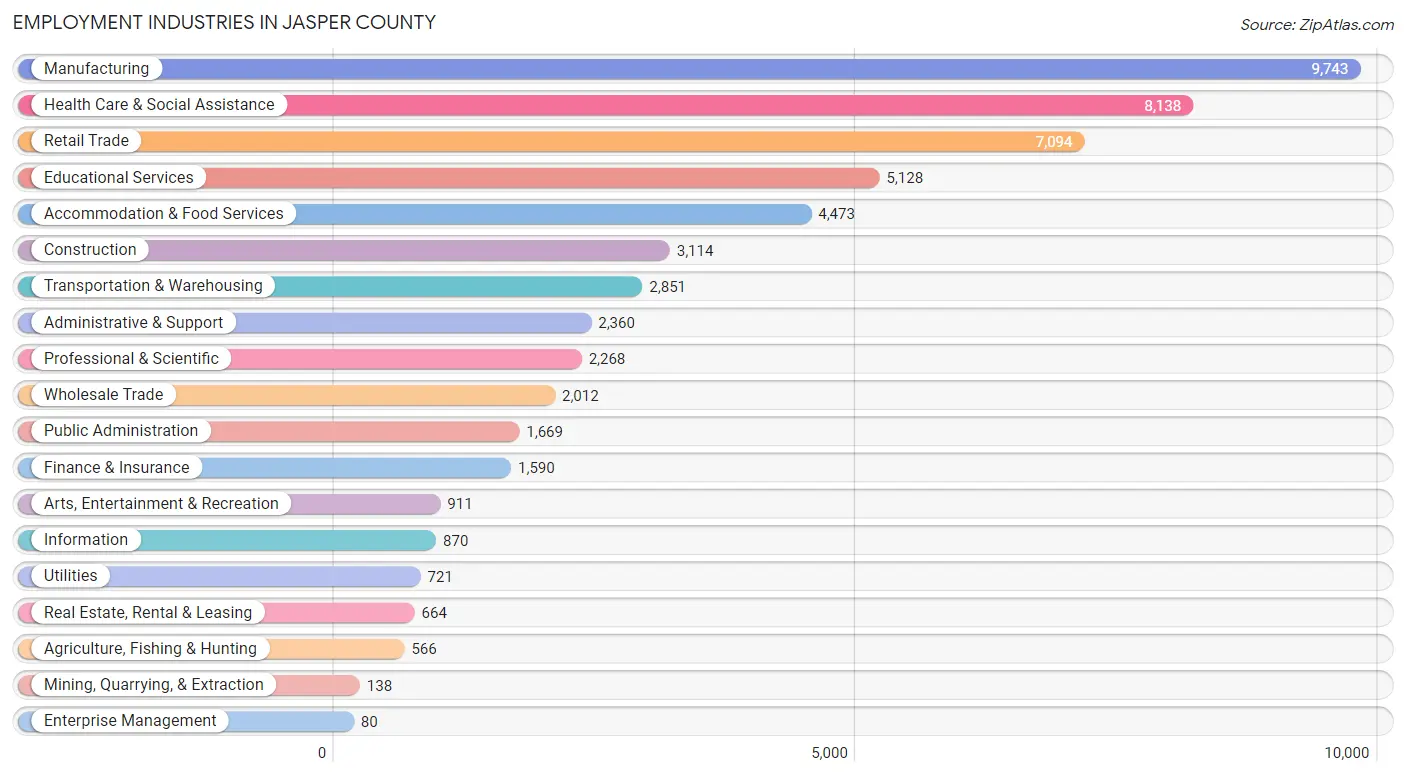
The major employment industries in Jasper County include Manufacturing (9,743 | 16.8%), Health Care & Social Assistance (8,138 | 14.0%), Retail Trade (7,094 | 12.2%), Educational Services (5,128 | 8.8%), and Accommodation & Food Services (4,473 | 7.7%).
Employment Industries by Sex in Jasper County
The Jasper County industries that see more men than women are Construction (87.7%), Agriculture, Fishing & Hunting (87.5%), and Transportation & Warehousing (82.1%), whereas the industries that tend to have a higher number of women are Enterprise Management (88.7%), Health Care & Social Assistance (79.6%), and Educational Services (73.3%).
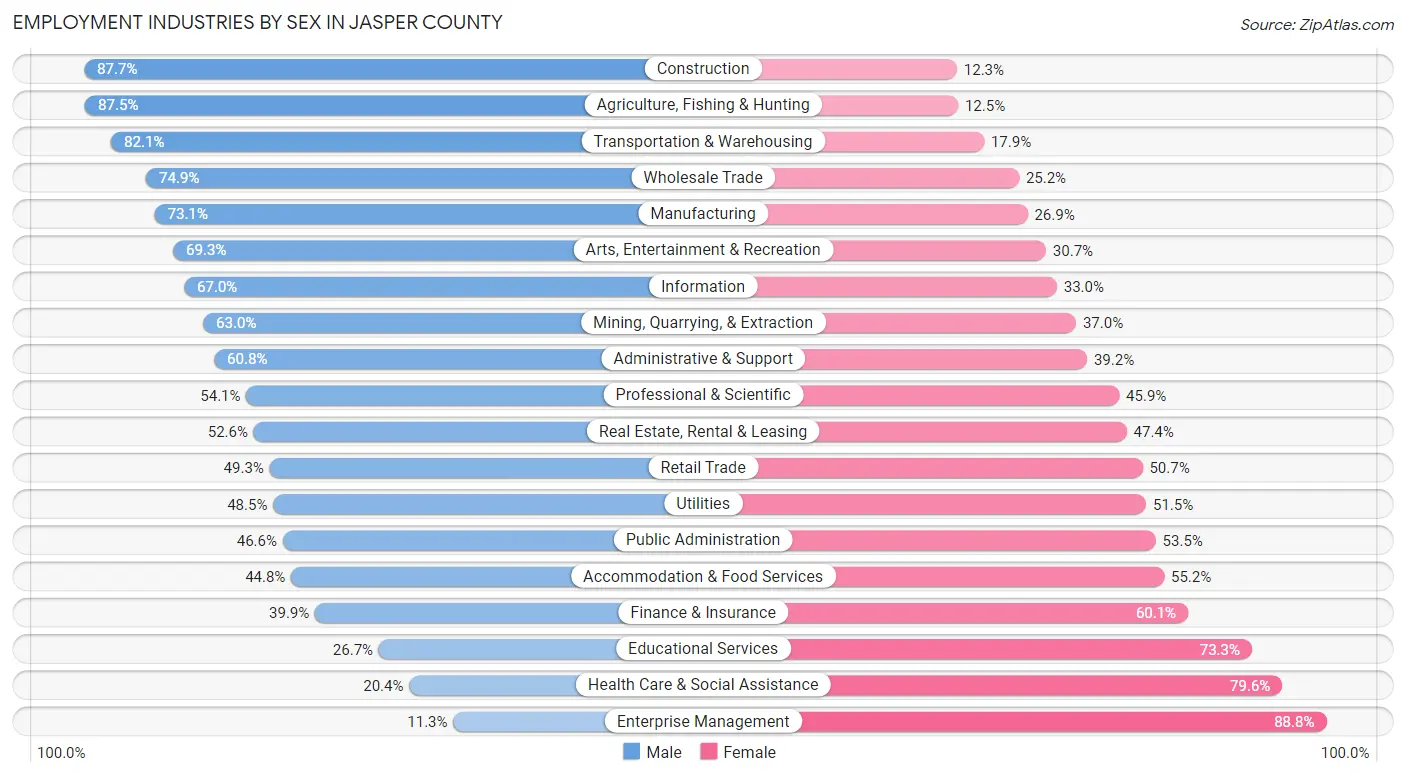
| Industry | Male | Female |
| Agriculture, Fishing & Hunting | 495 (87.5%) | 71 (12.5%) |
| Mining, Quarrying, & Extraction | 87 (63.0%) | 51 (37.0%) |
| Construction | 2,731 (87.7%) | 383 (12.3%) |
| Manufacturing | 7,120 (73.1%) | 2,623 (26.9%) |
| Wholesale Trade | 1,506 (74.9%) | 506 (25.2%) |
| Retail Trade | 3,496 (49.3%) | 3,598 (50.7%) |
| Transportation & Warehousing | 2,340 (82.1%) | 511 (17.9%) |
| Utilities | 350 (48.5%) | 371 (51.5%) |
| Information | 583 (67.0%) | 287 (33.0%) |
| Finance & Insurance | 634 (39.9%) | 956 (60.1%) |
| Real Estate, Rental & Leasing | 349 (52.6%) | 315 (47.4%) |
| Professional & Scientific | 1,227 (54.1%) | 1,041 (45.9%) |
| Enterprise Management | 9 (11.3%) | 71 (88.7%) |
| Administrative & Support | 1,434 (60.8%) | 926 (39.2%) |
| Educational Services | 1,367 (26.7%) | 3,761 (73.3%) |
| Health Care & Social Assistance | 1,658 (20.4%) | 6,480 (79.6%) |
| Arts, Entertainment & Recreation | 631 (69.3%) | 280 (30.7%) |
| Accommodation & Food Services | 2,005 (44.8%) | 2,468 (55.2%) |
| Public Administration | 777 (46.6%) | 892 (53.4%) |
| Total | 30,312 (52.3%) | 27,660 (47.7%) |
Education in Jasper County
School Enrollment in Jasper County
The most common levels of schooling among the 30,457 students in Jasper County are middle school (7,470 | 24.5%), high school (6,505 | 21.4%), and elementary school (6,164 | 20.2%).
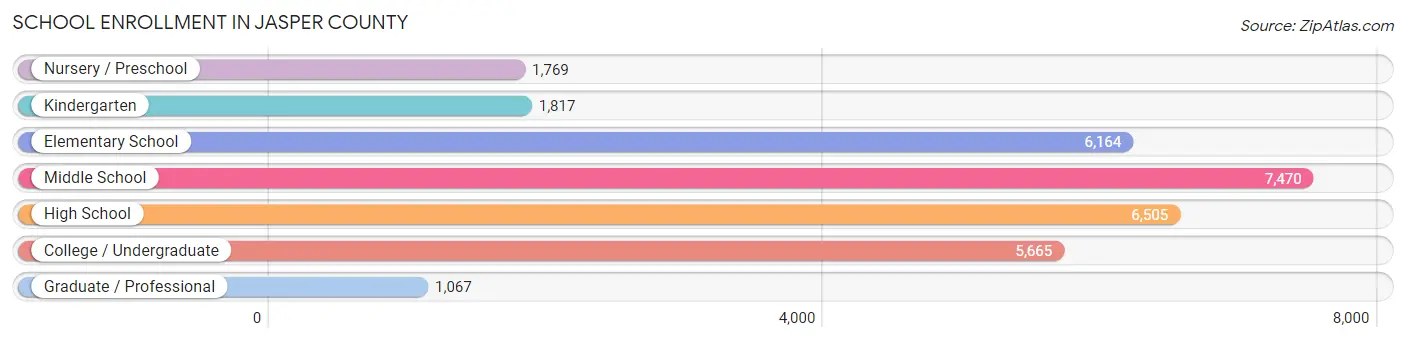
| School Level | # Students | % Students |
| Nursery / Preschool | 1,769 | 5.8% |
| Kindergarten | 1,817 | 6.0% |
| Elementary School | 6,164 | 20.2% |
| Middle School | 7,470 | 24.5% |
| High School | 6,505 | 21.4% |
| College / Undergraduate | 5,665 | 18.6% |
| Graduate / Professional | 1,067 | 3.5% |
| Total | 30,457 | 100.0% |
School Enrollment by Age by Funding Source in Jasper County
Out of a total of 30,457 students who are enrolled in schools in Jasper County, 4,599 (15.1%) attend a private institution, while the remaining 25,858 (84.9%) are enrolled in public schools. The age group of 3 to 4 year olds has the highest likelihood of being enrolled in private schools, with 430 (34.2% in the age bracket) enrolled. Conversely, the age group of 10 to 14 year olds has the lowest likelihood of being enrolled in a private school, with 8,172 (92.4% in the age bracket) attending a public institution.
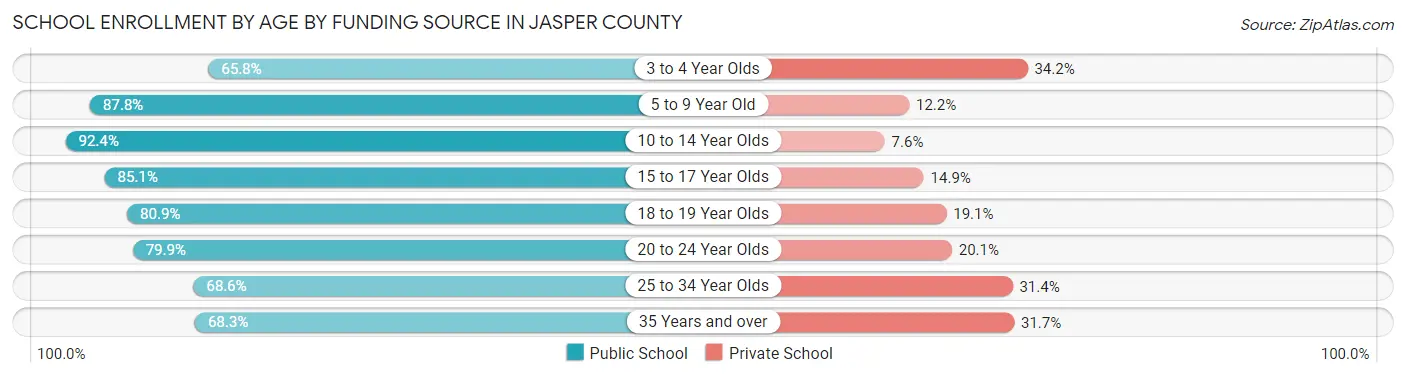
| Age Bracket | Public School | Private School |
| 3 to 4 Year Olds | 826 (65.8%) | 430 (34.2%) |
| 5 to 9 Year Old | 6,648 (87.8%) | 921 (12.2%) |
| 10 to 14 Year Olds | 8,172 (92.4%) | 675 (7.6%) |
| 15 to 17 Year Olds | 4,289 (85.1%) | 751 (14.9%) |
| 18 to 19 Year Olds | 1,820 (80.9%) | 430 (19.1%) |
| 20 to 24 Year Olds | 2,359 (79.9%) | 595 (20.1%) |
| 25 to 34 Year Olds | 1,027 (68.6%) | 471 (31.4%) |
| 35 Years and over | 712 (68.3%) | 331 (31.7%) |
| Total | 25,858 (84.9%) | 4,599 (15.1%) |
Educational Attainment by Field of Study in Jasper County
Business (4,321 | 20.0%), education (4,179 | 19.3%), science & technology (2,251 | 10.4%), bio, nature & agricultural (1,560 | 7.2%), and arts & humanities (1,485 | 6.9%) are the most common fields of study among 21,635 individuals in Jasper County who have obtained a bachelor's degree or higher.
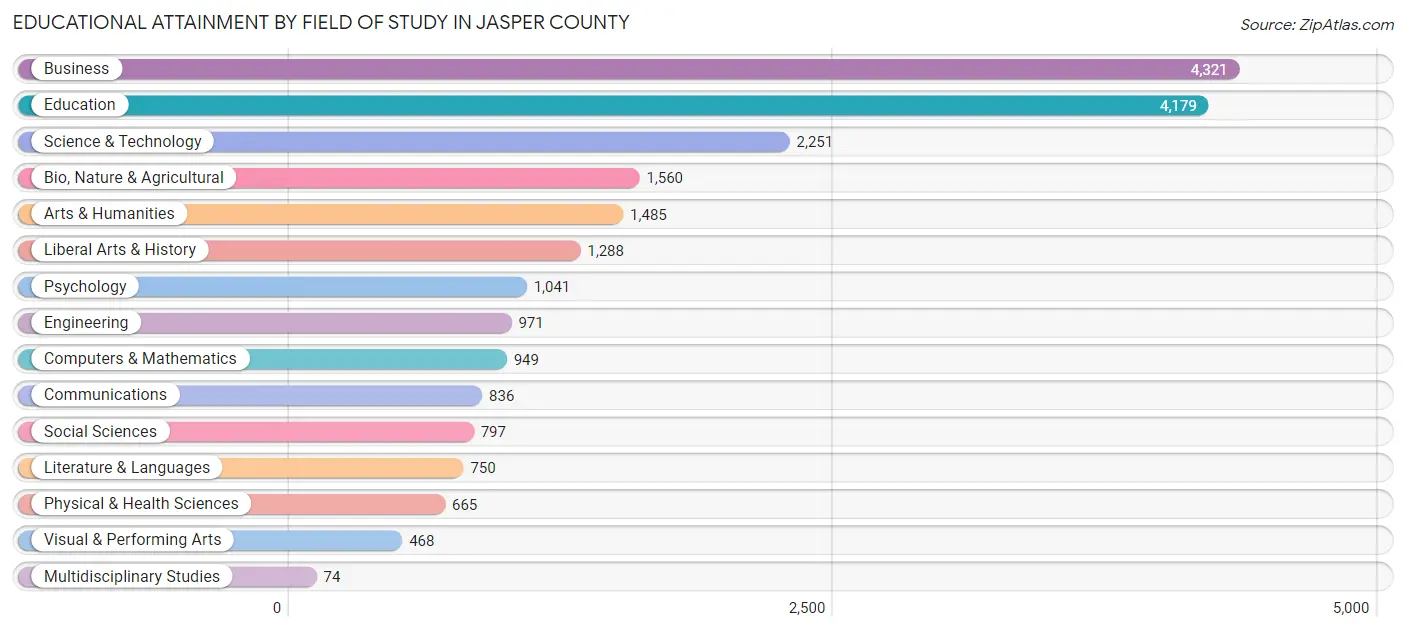
| Field of Study | # Graduates | % Graduates |
| Computers & Mathematics | 949 | 4.4% |
| Bio, Nature & Agricultural | 1,560 | 7.2% |
| Physical & Health Sciences | 665 | 3.1% |
| Psychology | 1,041 | 4.8% |
| Social Sciences | 797 | 3.7% |
| Engineering | 971 | 4.5% |
| Multidisciplinary Studies | 74 | 0.3% |
| Science & Technology | 2,251 | 10.4% |
| Business | 4,321 | 20.0% |
| Education | 4,179 | 19.3% |
| Literature & Languages | 750 | 3.5% |
| Liberal Arts & History | 1,288 | 5.9% |
| Visual & Performing Arts | 468 | 2.2% |
| Communications | 836 | 3.9% |
| Arts & Humanities | 1,485 | 6.9% |
| Total | 21,635 | 100.0% |
Transportation & Commute in Jasper County
Vehicle Availability by Sex in Jasper County
The most prevalent vehicle ownership categories in Jasper County are males with 2 vehicles (12,964, accounting for 43.9%) and females with 2 vehicles (10,870, making up 49.2%).
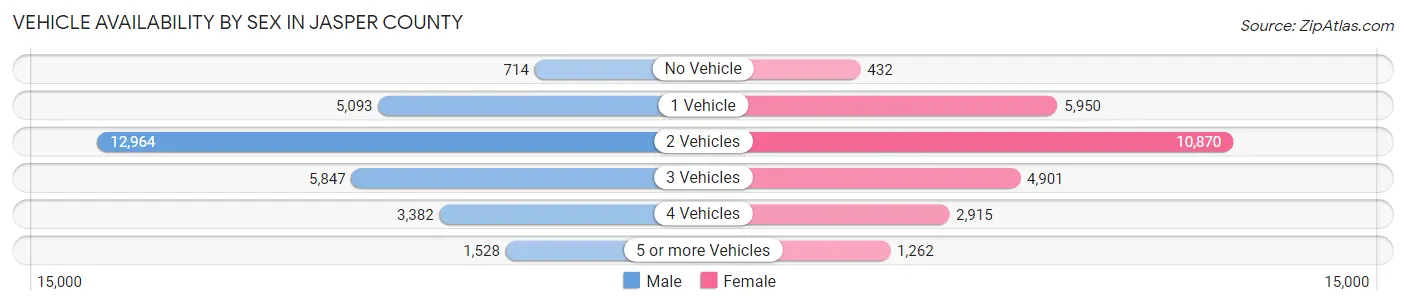
| Vehicles Available | Male | Female |
| No Vehicle | 714 (2.4%) | 432 (1.6%) |
| 1 Vehicle | 5,093 (17.2%) | 5,950 (22.6%) |
| 2 Vehicles | 12,964 (43.9%) | 10,870 (41.3%) |
| 3 Vehicles | 5,847 (19.8%) | 4,901 (18.6%) |
| 4 Vehicles | 3,382 (11.5%) | 2,915 (11.1%) |
| 5 or more Vehicles | 1,528 (5.2%) | 1,262 (4.8%) |
| Total | 29,528 (100.0%) | 26,330 (100.0%) |
Commute Time in Jasper County
The most frequently occuring commute durations in Jasper County are 10 to 14 minutes (11,237 commuters, 21.5%), 15 to 19 minutes (10,858 commuters, 20.8%), and 20 to 24 minutes (7,860 commuters, 15.0%).
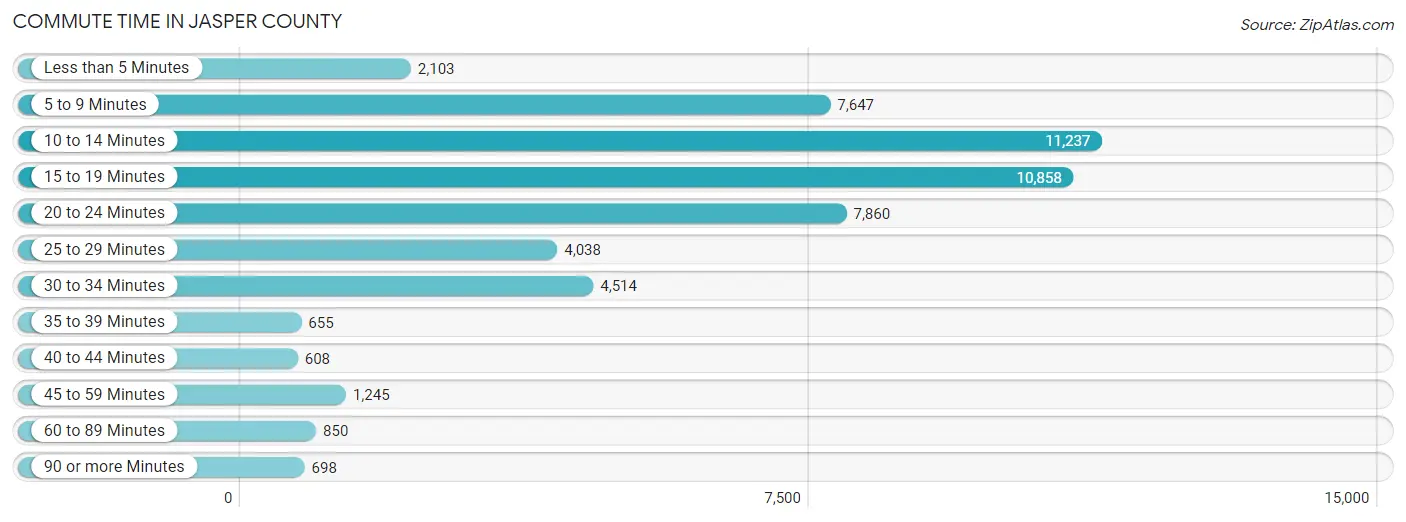
| Commute Time | # Commuters | % Commuters |
| Less than 5 Minutes | 2,103 | 4.0% |
| 5 to 9 Minutes | 7,647 | 14.6% |
| 10 to 14 Minutes | 11,237 | 21.5% |
| 15 to 19 Minutes | 10,858 | 20.8% |
| 20 to 24 Minutes | 7,860 | 15.0% |
| 25 to 29 Minutes | 4,038 | 7.7% |
| 30 to 34 Minutes | 4,514 | 8.6% |
| 35 to 39 Minutes | 655 | 1.3% |
| 40 to 44 Minutes | 608 | 1.2% |
| 45 to 59 Minutes | 1,245 | 2.4% |
| 60 to 89 Minutes | 850 | 1.6% |
| 90 or more Minutes | 698 | 1.3% |
Commute Time by Sex in Jasper County
The most common commute times in Jasper County are 15 to 19 minutes (5,814 commuters, 21.2%) for males and 10 to 14 minutes (5,799 commuters, 23.3%) for females.
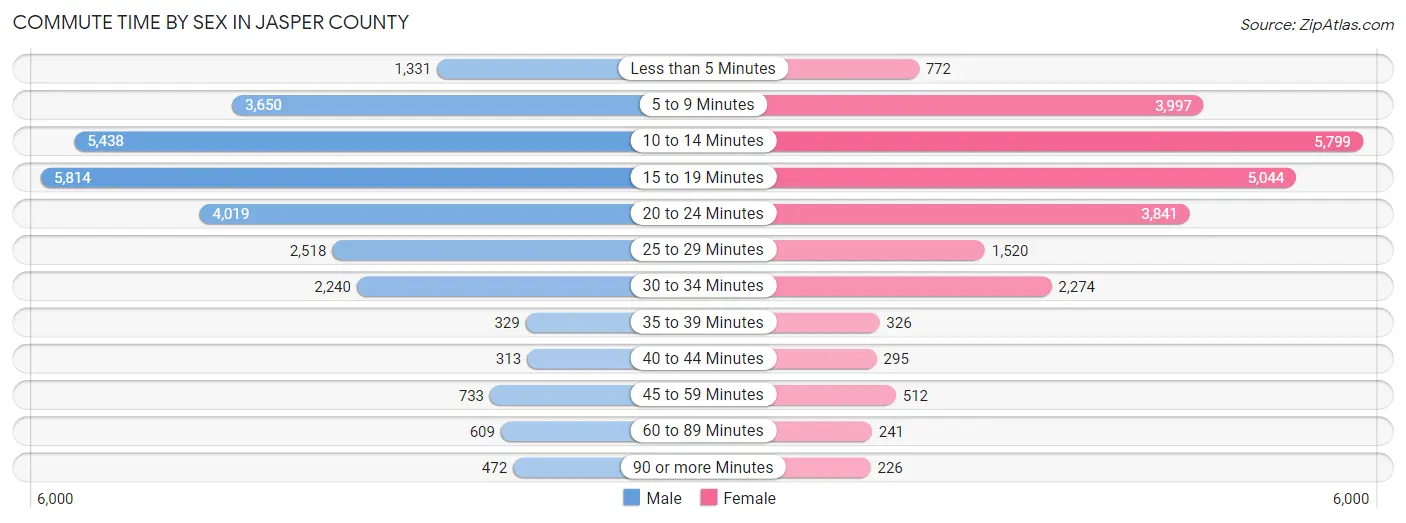
| Commute Time | Male | Female |
| Less than 5 Minutes | 1,331 (4.9%) | 772 (3.1%) |
| 5 to 9 Minutes | 3,650 (13.3%) | 3,997 (16.1%) |
| 10 to 14 Minutes | 5,438 (19.8%) | 5,799 (23.3%) |
| 15 to 19 Minutes | 5,814 (21.2%) | 5,044 (20.3%) |
| 20 to 24 Minutes | 4,019 (14.6%) | 3,841 (15.5%) |
| 25 to 29 Minutes | 2,518 (9.2%) | 1,520 (6.1%) |
| 30 to 34 Minutes | 2,240 (8.2%) | 2,274 (9.1%) |
| 35 to 39 Minutes | 329 (1.2%) | 326 (1.3%) |
| 40 to 44 Minutes | 313 (1.1%) | 295 (1.2%) |
| 45 to 59 Minutes | 733 (2.7%) | 512 (2.1%) |
| 60 to 89 Minutes | 609 (2.2%) | 241 (1.0%) |
| 90 or more Minutes | 472 (1.7%) | 226 (0.9%) |
Time of Departure to Work by Sex in Jasper County
The most frequent times of departure to work in Jasper County are 7:30 AM to 7:59 AM (3,374, 12.3%) for males and 7:30 AM to 7:59 AM (4,185, 16.8%) for females.
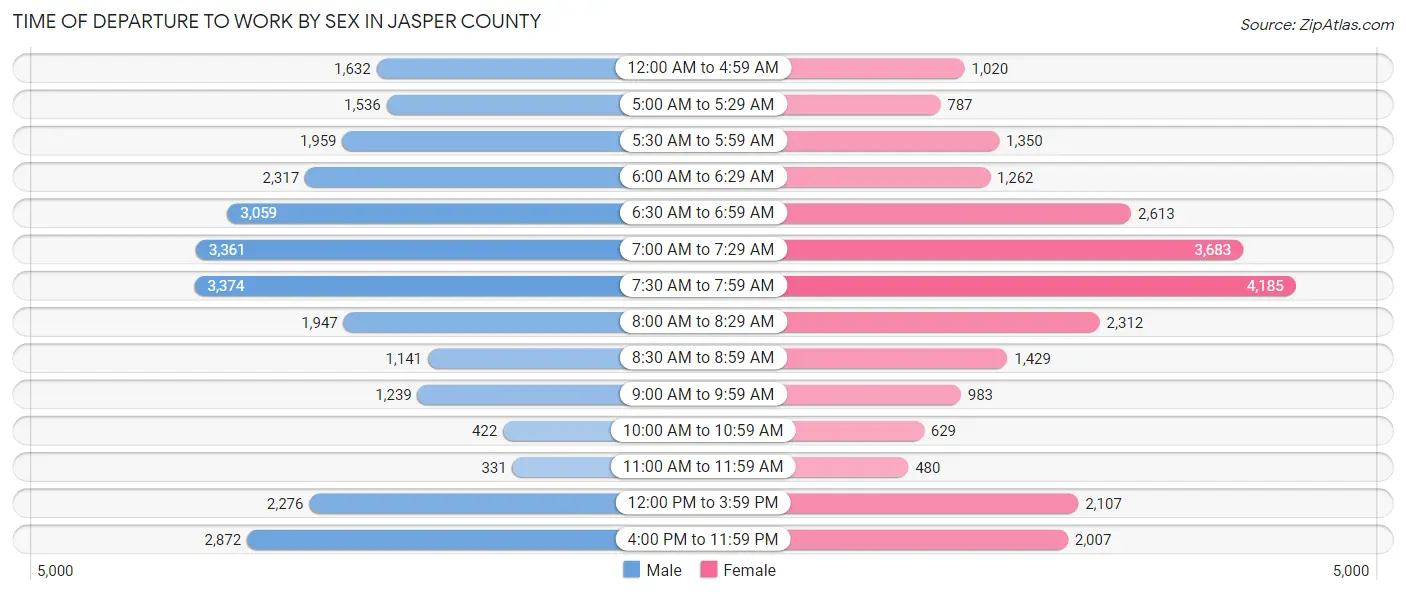
| Time of Departure | Male | Female |
| 12:00 AM to 4:59 AM | 1,632 (5.9%) | 1,020 (4.1%) |
| 5:00 AM to 5:29 AM | 1,536 (5.6%) | 787 (3.2%) |
| 5:30 AM to 5:59 AM | 1,959 (7.1%) | 1,350 (5.4%) |
| 6:00 AM to 6:29 AM | 2,317 (8.4%) | 1,262 (5.1%) |
| 6:30 AM to 6:59 AM | 3,059 (11.1%) | 2,613 (10.5%) |
| 7:00 AM to 7:29 AM | 3,361 (12.2%) | 3,683 (14.8%) |
| 7:30 AM to 7:59 AM | 3,374 (12.3%) | 4,185 (16.8%) |
| 8:00 AM to 8:29 AM | 1,947 (7.1%) | 2,312 (9.3%) |
| 8:30 AM to 8:59 AM | 1,141 (4.2%) | 1,429 (5.8%) |
| 9:00 AM to 9:59 AM | 1,239 (4.5%) | 983 (4.0%) |
| 10:00 AM to 10:59 AM | 422 (1.5%) | 629 (2.5%) |
| 11:00 AM to 11:59 AM | 331 (1.2%) | 480 (1.9%) |
| 12:00 PM to 3:59 PM | 2,276 (8.3%) | 2,107 (8.5%) |
| 4:00 PM to 11:59 PM | 2,872 (10.5%) | 2,007 (8.1%) |
| Total | 27,466 (100.0%) | 24,847 (100.0%) |
Housing Occupancy in Jasper County
Occupancy by Ownership in Jasper County
Of the total 47,481 dwellings in Jasper County, owner-occupied units account for 30,014 (63.2%), while renter-occupied units make up 17,467 (36.8%).
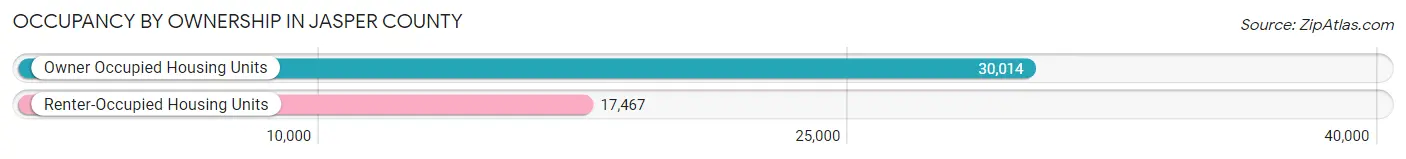
| Occupancy | # Housing Units | % Housing Units |
| Owner Occupied Housing Units | 30,014 | 63.2% |
| Renter-Occupied Housing Units | 17,467 | 36.8% |
| Total Occupied Housing Units | 47,481 | 100.0% |
Occupancy by Household Size in Jasper County
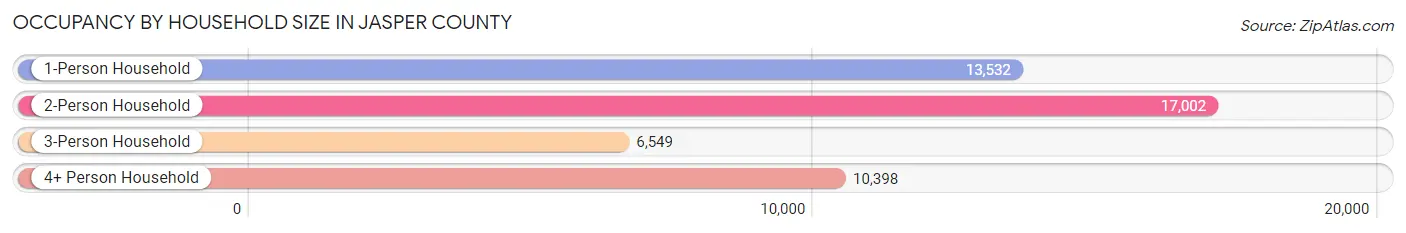
| Household Size | # Housing Units | % Housing Units |
| 1-Person Household | 13,532 | 28.5% |
| 2-Person Household | 17,002 | 35.8% |
| 3-Person Household | 6,549 | 13.8% |
| 4+ Person Household | 10,398 | 21.9% |
| Total Housing Units | 47,481 | 100.0% |
Occupancy by Ownership by Household Size in Jasper County
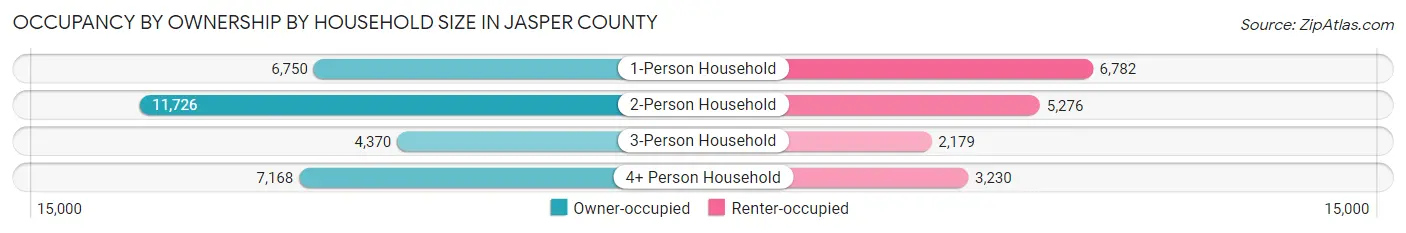
| Household Size | Owner-occupied | Renter-occupied |
| 1-Person Household | 6,750 (49.9%) | 6,782 (50.1%) |
| 2-Person Household | 11,726 (69.0%) | 5,276 (31.0%) |
| 3-Person Household | 4,370 (66.7%) | 2,179 (33.3%) |
| 4+ Person Household | 7,168 (68.9%) | 3,230 (31.1%) |
| Total Housing Units | 30,014 (63.2%) | 17,467 (36.8%) |
Occupancy by Educational Attainment in Jasper County
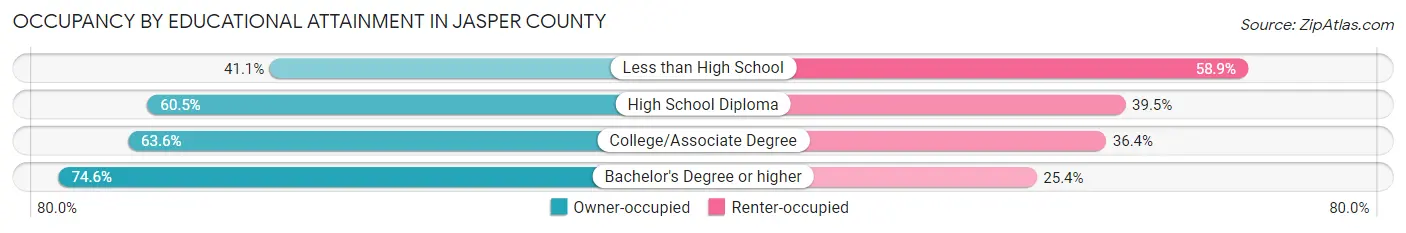
| Household Size | Owner-occupied | Renter-occupied |
| Less than High School | 2,013 (41.1%) | 2,889 (58.9%) |
| High School Diploma | 9,329 (60.5%) | 6,086 (39.5%) |
| College/Associate Degree | 9,172 (63.6%) | 5,256 (36.4%) |
| Bachelor's Degree or higher | 9,500 (74.6%) | 3,236 (25.4%) |
Occupancy by Age of Householder in Jasper County
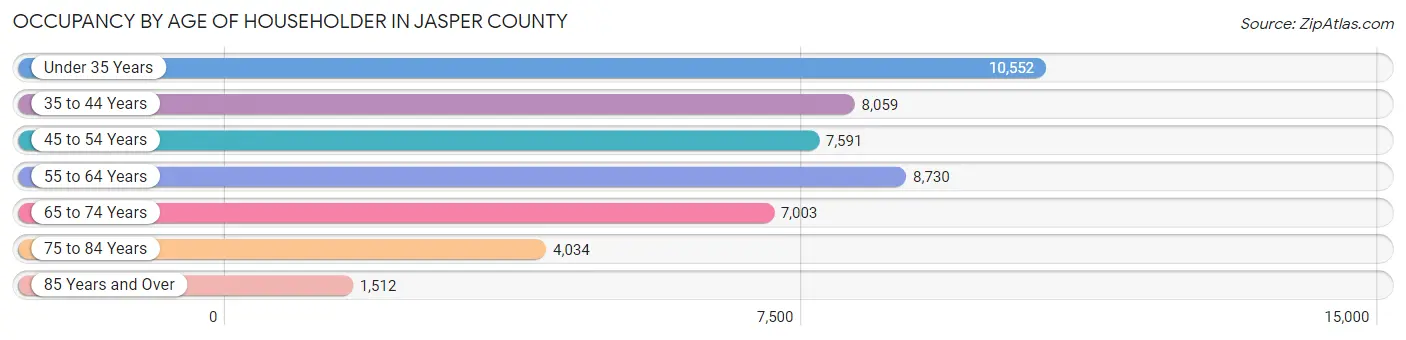
| Age Bracket | # Households | % Households |
| Under 35 Years | 10,552 | 22.2% |
| 35 to 44 Years | 8,059 | 17.0% |
| 45 to 54 Years | 7,591 | 16.0% |
| 55 to 64 Years | 8,730 | 18.4% |
| 65 to 74 Years | 7,003 | 14.7% |
| 75 to 84 Years | 4,034 | 8.5% |
| 85 Years and Over | 1,512 | 3.2% |
| Total | 47,481 | 100.0% |
Housing Finances in Jasper County
Median Income by Occupancy in Jasper County
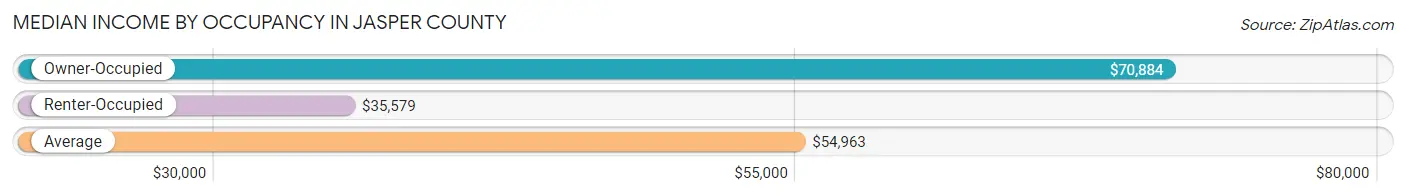
| Occupancy Type | # Households | Median Income |
| Owner-Occupied | 30,014 (63.2%) | $70,884 |
| Renter-Occupied | 17,467 (36.8%) | $35,579 |
| Average | 47,481 (100.0%) | $54,963 |
Occupancy by Householder Income Bracket in Jasper County
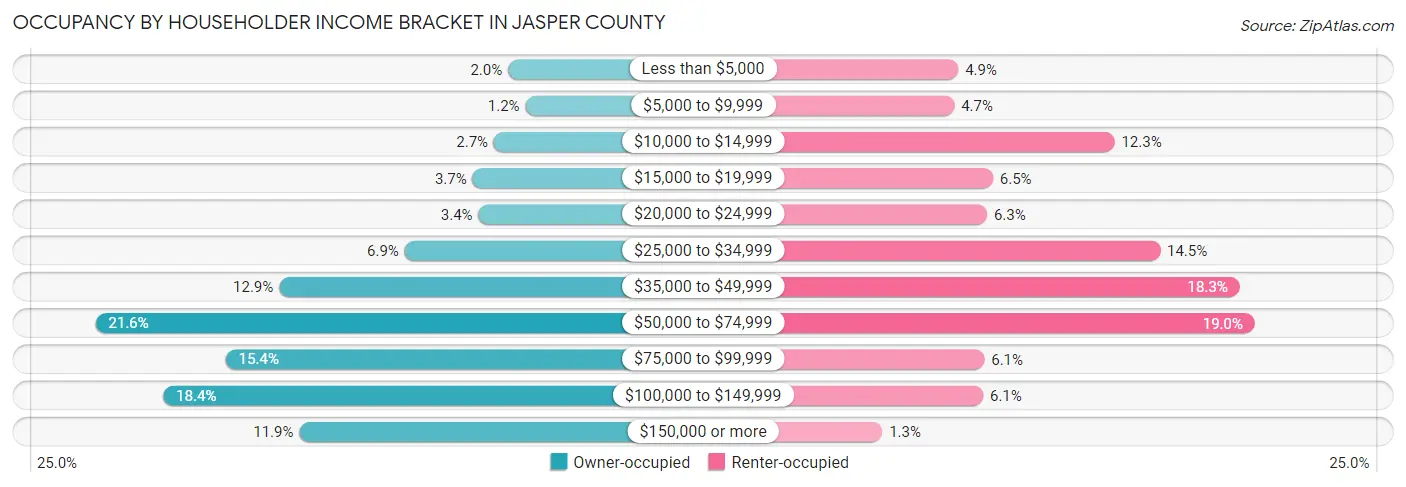
| Income Bracket | Owner-occupied | Renter-occupied |
| Less than $5,000 | 593 (2.0%) | 855 (4.9%) |
| $5,000 to $9,999 | 346 (1.1%) | 821 (4.7%) |
| $10,000 to $14,999 | 795 (2.6%) | 2,154 (12.3%) |
| $15,000 to $19,999 | 1,101 (3.7%) | 1,143 (6.5%) |
| $20,000 to $24,999 | 1,017 (3.4%) | 1,094 (6.3%) |
| $25,000 to $34,999 | 2,070 (6.9%) | 2,533 (14.5%) |
| $35,000 to $49,999 | 3,867 (12.9%) | 3,194 (18.3%) |
| $50,000 to $74,999 | 6,493 (21.6%) | 3,321 (19.0%) |
| $75,000 to $99,999 | 4,631 (15.4%) | 1,070 (6.1%) |
| $100,000 to $149,999 | 5,523 (18.4%) | 1,061 (6.1%) |
| $150,000 or more | 3,578 (11.9%) | 221 (1.3%) |
| Total | 30,014 (100.0%) | 17,467 (100.0%) |
Monthly Housing Cost Tiers in Jasper County
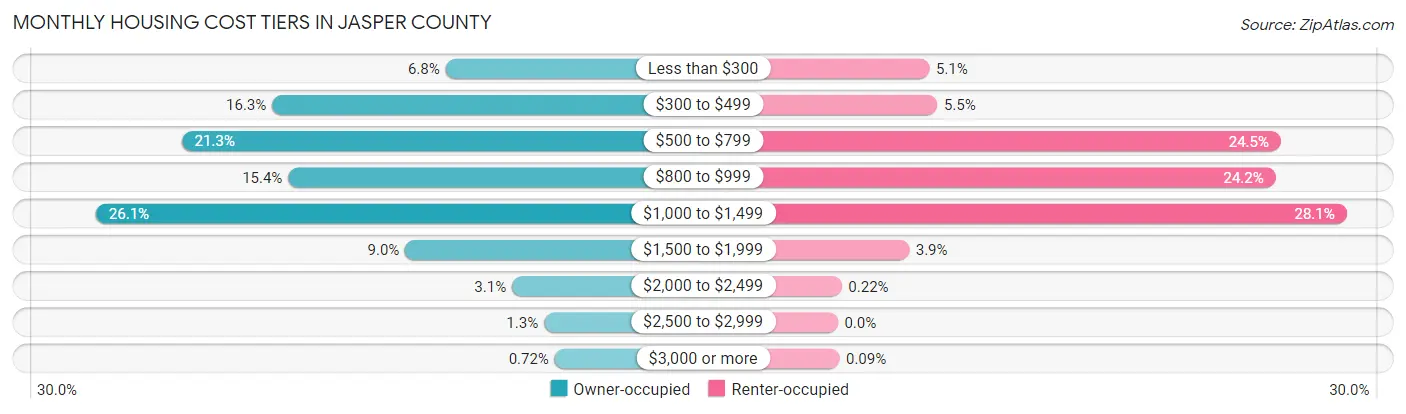
| Monthly Cost | Owner-occupied | Renter-occupied |
| Less than $300 | 2,025 (6.8%) | 884 (5.1%) |
| $300 to $499 | 4,901 (16.3%) | 961 (5.5%) |
| $500 to $799 | 6,403 (21.3%) | 4,277 (24.5%) |
| $800 to $999 | 4,634 (15.4%) | 4,227 (24.2%) |
| $1,000 to $1,499 | 7,823 (26.1%) | 4,912 (28.1%) |
| $1,500 to $1,999 | 2,696 (9.0%) | 688 (3.9%) |
| $2,000 to $2,499 | 925 (3.1%) | 38 (0.2%) |
| $2,500 to $2,999 | 392 (1.3%) | 0 (0.0%) |
| $3,000 or more | 215 (0.7%) | 16 (0.1%) |
| Total | 30,014 (100.0%) | 17,467 (100.0%) |
Physical Housing Characteristics in Jasper County
Housing Structures in Jasper County
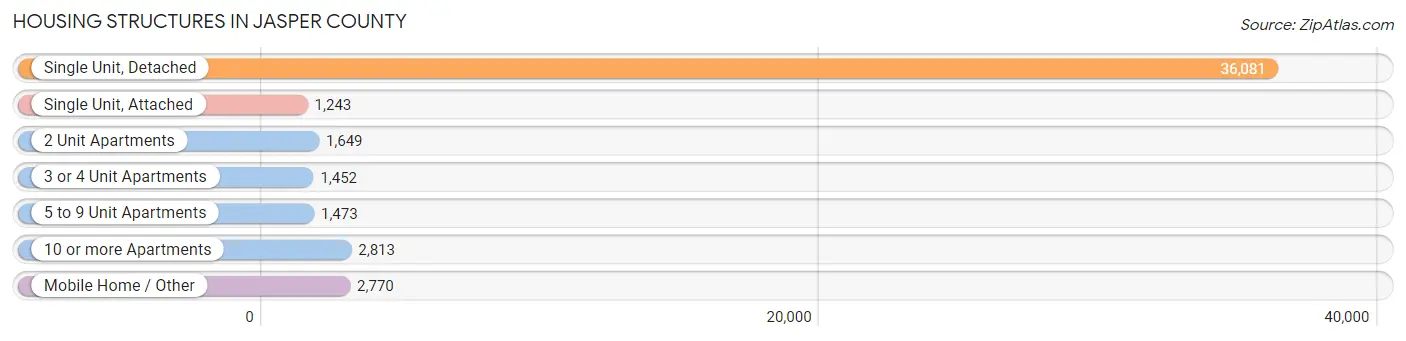
| Structure Type | # Housing Units | % Housing Units |
| Single Unit, Detached | 36,081 | 76.0% |
| Single Unit, Attached | 1,243 | 2.6% |
| 2 Unit Apartments | 1,649 | 3.5% |
| 3 or 4 Unit Apartments | 1,452 | 3.1% |
| 5 to 9 Unit Apartments | 1,473 | 3.1% |
| 10 or more Apartments | 2,813 | 5.9% |
| Mobile Home / Other | 2,770 | 5.8% |
| Total | 47,481 | 100.0% |
Housing Structures by Occupancy in Jasper County
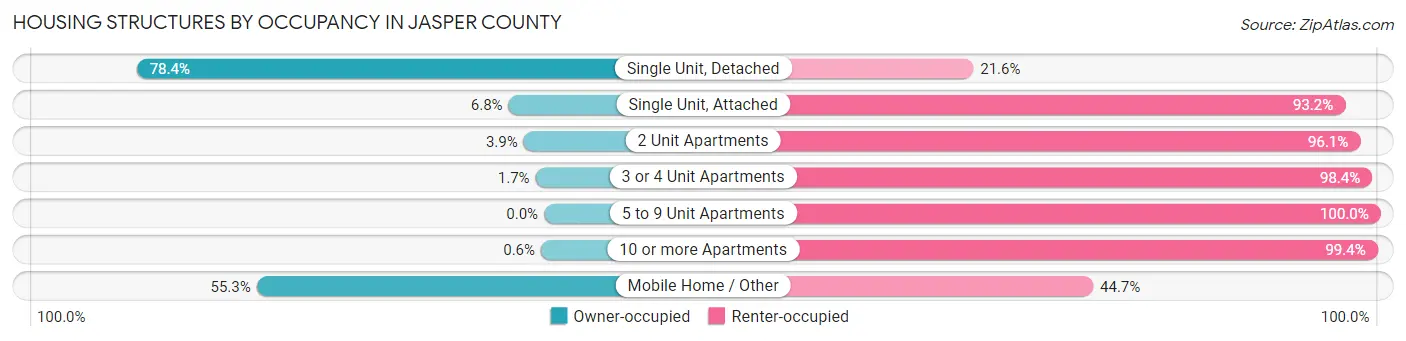
| Structure Type | Owner-occupied | Renter-occupied |
| Single Unit, Detached | 28,290 (78.4%) | 7,791 (21.6%) |
| Single Unit, Attached | 85 (6.8%) | 1,158 (93.2%) |
| 2 Unit Apartments | 65 (3.9%) | 1,584 (96.1%) |
| 3 or 4 Unit Apartments | 24 (1.7%) | 1,428 (98.4%) |
| 5 to 9 Unit Apartments | 0 (0.0%) | 1,473 (100.0%) |
| 10 or more Apartments | 17 (0.6%) | 2,796 (99.4%) |
| Mobile Home / Other | 1,533 (55.3%) | 1,237 (44.7%) |
| Total | 30,014 (63.2%) | 17,467 (36.8%) |
Housing Structures by Number of Rooms in Jasper County
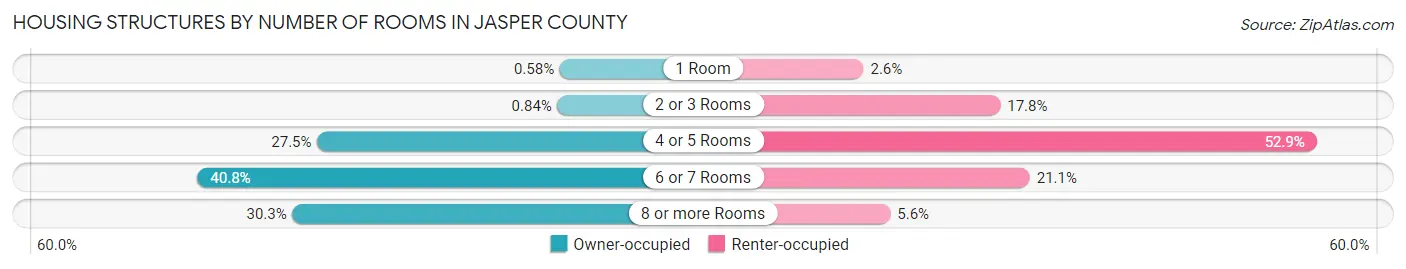
| Number of Rooms | Owner-occupied | Renter-occupied |
| 1 Room | 174 (0.6%) | 458 (2.6%) |
| 2 or 3 Rooms | 251 (0.8%) | 3,109 (17.8%) |
| 4 or 5 Rooms | 8,256 (27.5%) | 9,242 (52.9%) |
| 6 or 7 Rooms | 12,251 (40.8%) | 3,680 (21.1%) |
| 8 or more Rooms | 9,082 (30.3%) | 978 (5.6%) |
| Total | 30,014 (100.0%) | 17,467 (100.0%) |
Housing Structure by Heating Type in Jasper County
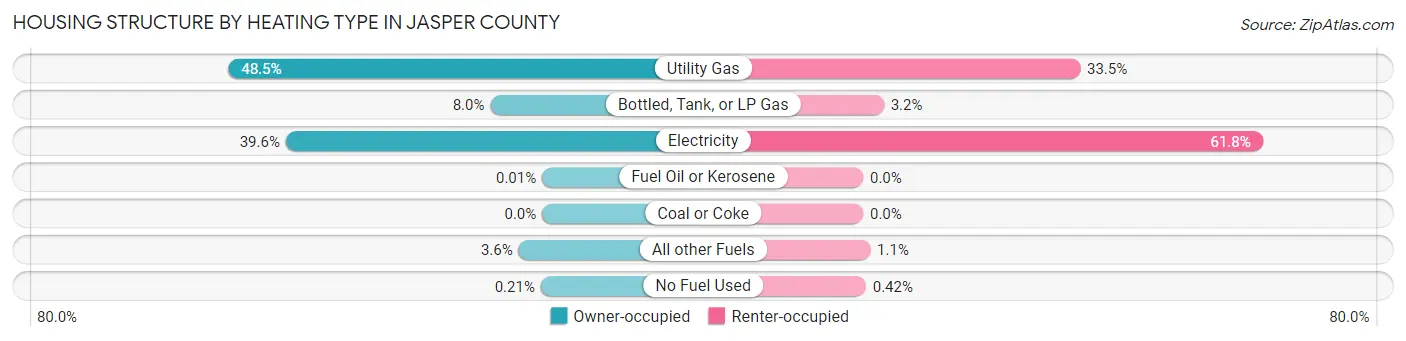
| Heating Type | Owner-occupied | Renter-occupied |
| Utility Gas | 14,558 (48.5%) | 5,858 (33.5%) |
| Bottled, Tank, or LP Gas | 2,404 (8.0%) | 557 (3.2%) |
| Electricity | 11,895 (39.6%) | 10,786 (61.8%) |
| Fuel Oil or Kerosene | 2 (0.0%) | 0 (0.0%) |
| Coal or Coke | 0 (0.0%) | 0 (0.0%) |
| All other Fuels | 1,092 (3.6%) | 192 (1.1%) |
| No Fuel Used | 63 (0.2%) | 74 (0.4%) |
| Total | 30,014 (100.0%) | 17,467 (100.0%) |
Household Vehicle Usage in Jasper County
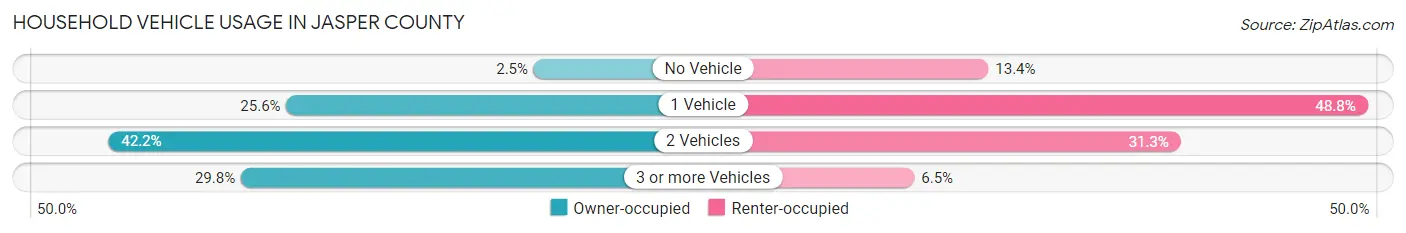
| Vehicles per Household | Owner-occupied | Renter-occupied |
| No Vehicle | 737 (2.5%) | 2,338 (13.4%) |
| 1 Vehicle | 7,672 (25.6%) | 8,523 (48.8%) |
| 2 Vehicles | 12,660 (42.2%) | 5,475 (31.3%) |
| 3 or more Vehicles | 8,945 (29.8%) | 1,131 (6.5%) |
| Total | 30,014 (100.0%) | 17,467 (100.0%) |
Real Estate & Mortgages in Jasper County
Real Estate and Mortgage Overview in Jasper County
| Characteristic | Without Mortgage | With Mortgage |
| Housing Units | 11,743 | 18,271 |
| Median Property Value | $138,500 | $150,200 |
| Median Household Income | $52,112 | $2,720 |
| Monthly Housing Costs | $461 | $187 |
| Real Estate Taxes | $974 | $302 |
Property Value by Mortgage Status in Jasper County
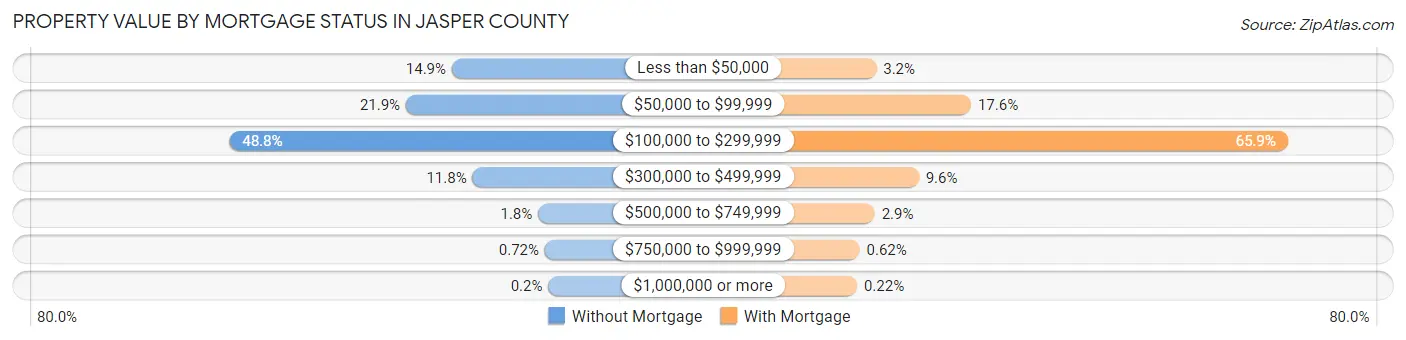
| Property Value | Without Mortgage | With Mortgage |
| Less than $50,000 | 1,749 (14.9%) | 577 (3.2%) |
| $50,000 to $99,999 | 2,570 (21.9%) | 3,213 (17.6%) |
| $100,000 to $299,999 | 5,730 (48.8%) | 12,034 (65.9%) |
| $300,000 to $499,999 | 1,380 (11.7%) | 1,760 (9.6%) |
| $500,000 to $749,999 | 206 (1.8%) | 534 (2.9%) |
| $750,000 to $999,999 | 84 (0.7%) | 113 (0.6%) |
| $1,000,000 or more | 24 (0.2%) | 40 (0.2%) |
| Total | 11,743 (100.0%) | 18,271 (100.0%) |
Household Income by Mortgage Status in Jasper County
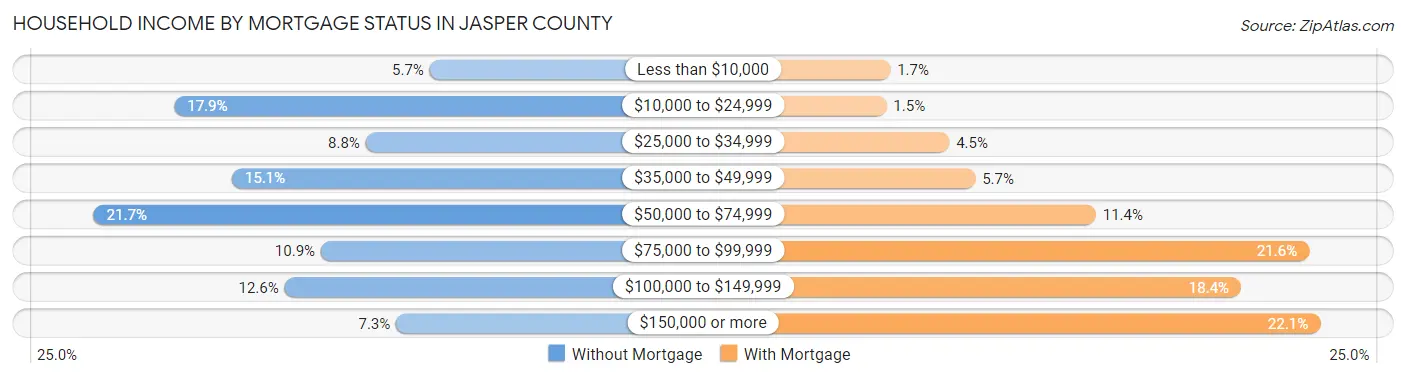
| Household Income | Without Mortgage | With Mortgage |
| Less than $10,000 | 671 (5.7%) | 301 (1.7%) |
| $10,000 to $24,999 | 2,098 (17.9%) | 268 (1.5%) |
| $25,000 to $34,999 | 1,029 (8.8%) | 815 (4.5%) |
| $35,000 to $49,999 | 1,777 (15.1%) | 1,041 (5.7%) |
| $50,000 to $74,999 | 2,549 (21.7%) | 2,090 (11.4%) |
| $75,000 to $99,999 | 1,279 (10.9%) | 3,944 (21.6%) |
| $100,000 to $149,999 | 1,482 (12.6%) | 3,352 (18.3%) |
| $150,000 or more | 858 (7.3%) | 4,041 (22.1%) |
| Total | 11,743 (100.0%) | 18,271 (100.0%) |
Property Value to Household Income Ratio in Jasper County
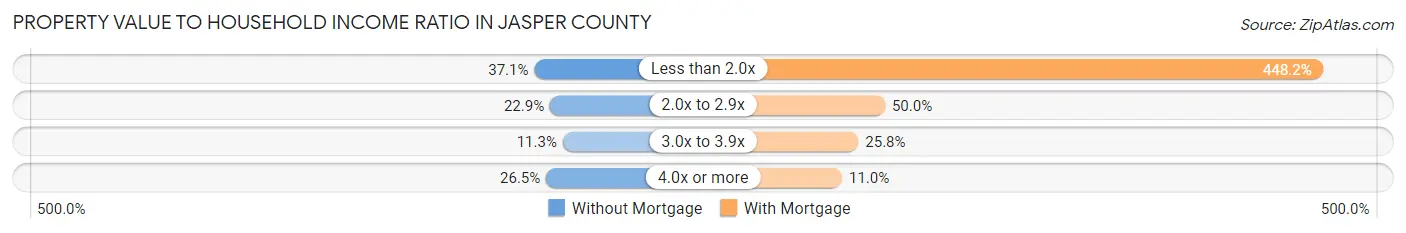
| Value-to-Income Ratio | Without Mortgage | With Mortgage |
| Less than 2.0x | 4,361 (37.1%) | 81,895 (448.2%) |
| 2.0x to 2.9x | 2,693 (22.9%) | 9,136 (50.0%) |
| 3.0x to 3.9x | 1,330 (11.3%) | 4,722 (25.8%) |
| 4.0x or more | 3,107 (26.5%) | 2,008 (11.0%) |
| Total | 11,743 (100.0%) | 18,271 (100.0%) |
Real Estate Taxes by Mortgage Status in Jasper County
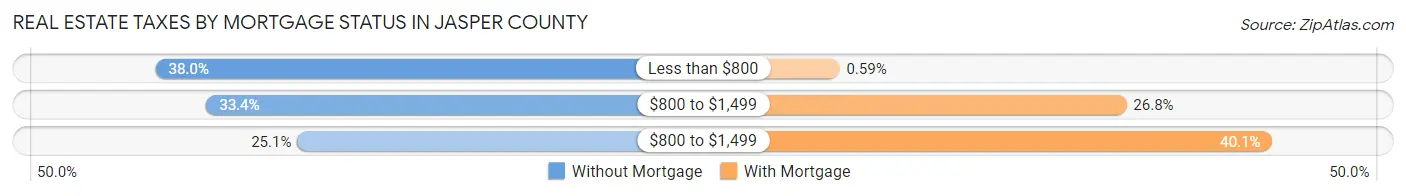
| Property Taxes | Without Mortgage | With Mortgage |
| Less than $800 | 4,467 (38.0%) | 108 (0.6%) |
| $800 to $1,499 | 3,922 (33.4%) | 4,895 (26.8%) |
| $800 to $1,499 | 2,948 (25.1%) | 7,331 (40.1%) |
| Total | 11,743 (100.0%) | 18,271 (100.0%) |
Health & Disability in Jasper County
Health Insurance Coverage by Age in Jasper County
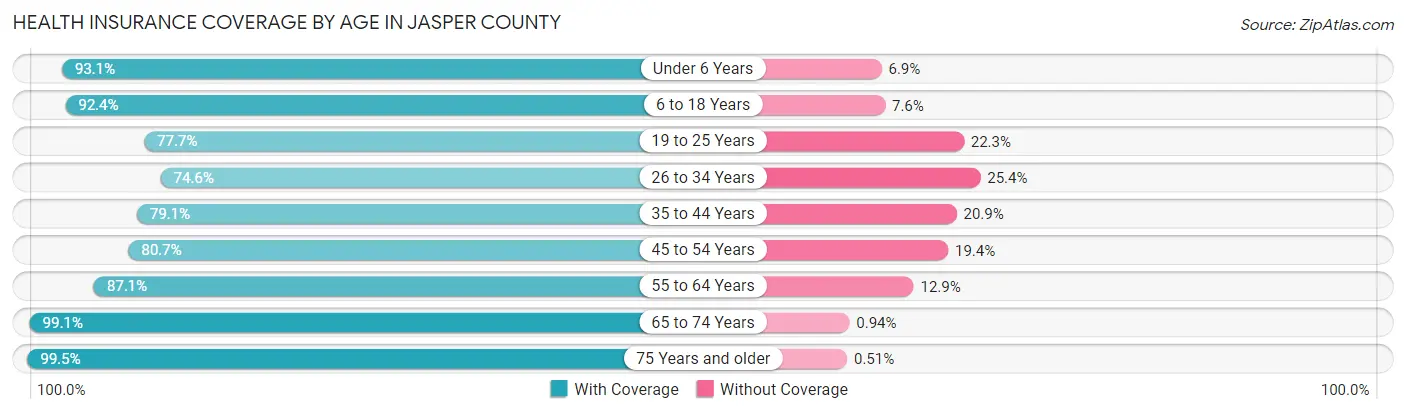
| Age Bracket | With Coverage | Without Coverage |
| Under 6 Years | 8,998 (93.1%) | 671 (6.9%) |
| 6 to 18 Years | 20,514 (92.4%) | 1,687 (7.6%) |
| 19 to 25 Years | 9,347 (77.7%) | 2,681 (22.3%) |
| 26 to 34 Years | 10,902 (74.6%) | 3,704 (25.4%) |
| 35 to 44 Years | 12,237 (79.1%) | 3,240 (20.9%) |
| 45 to 54 Years | 11,649 (80.6%) | 2,794 (19.4%) |
| 55 to 64 Years | 12,755 (87.1%) | 1,892 (12.9%) |
| 65 to 74 Years | 11,088 (99.1%) | 105 (0.9%) |
| 75 Years and older | 7,663 (99.5%) | 39 (0.5%) |
| Total | 105,153 (86.2%) | 16,813 (13.8%) |
Health Insurance Coverage by Citizenship Status in Jasper County
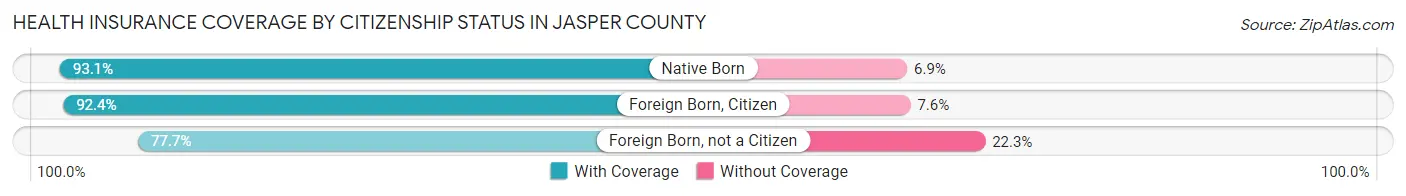
| Citizenship Status | With Coverage | Without Coverage |
| Native Born | 8,998 (93.1%) | 671 (6.9%) |
| Foreign Born, Citizen | 20,514 (92.4%) | 1,687 (7.6%) |
| Foreign Born, not a Citizen | 9,347 (77.7%) | 2,681 (22.3%) |
Health Insurance Coverage by Household Income in Jasper County
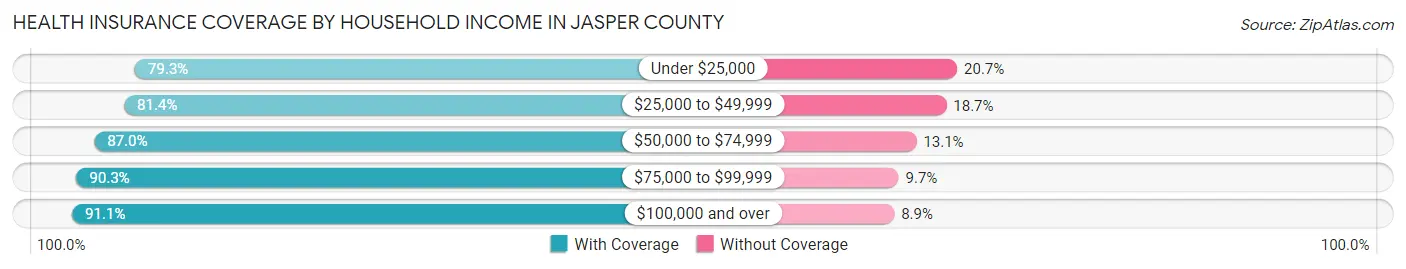
| Household Income | With Coverage | Without Coverage |
| Under $25,000 | 14,018 (79.3%) | 3,653 (20.7%) |
| $25,000 to $49,999 | 22,288 (81.4%) | 5,111 (18.6%) |
| $50,000 to $74,999 | 20,909 (87.0%) | 3,139 (13.1%) |
| $75,000 to $99,999 | 15,567 (90.3%) | 1,674 (9.7%) |
| $100,000 and over | 31,120 (91.1%) | 3,035 (8.9%) |
Public vs Private Health Insurance Coverage by Age in Jasper County
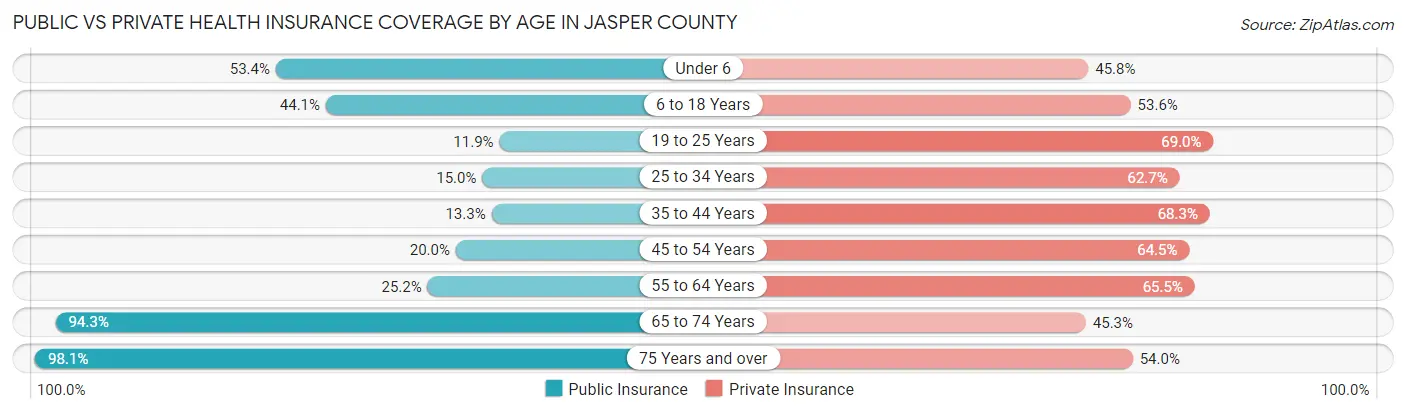
| Age Bracket | Public Insurance | Private Insurance |
| Under 6 | 5,161 (53.4%) | 4,424 (45.8%) |
| 6 to 18 Years | 9,786 (44.1%) | 11,904 (53.6%) |
| 19 to 25 Years | 1,428 (11.9%) | 8,295 (69.0%) |
| 25 to 34 Years | 2,197 (15.0%) | 9,155 (62.7%) |
| 35 to 44 Years | 2,065 (13.3%) | 10,570 (68.3%) |
| 45 to 54 Years | 2,884 (20.0%) | 9,314 (64.5%) |
| 55 to 64 Years | 3,693 (25.2%) | 9,594 (65.5%) |
| 65 to 74 Years | 10,550 (94.3%) | 5,070 (45.3%) |
| 75 Years and over | 7,552 (98.1%) | 4,159 (54.0%) |
| Total | 45,316 (37.1%) | 72,485 (59.4%) |
Disability Status by Sex by Age in Jasper County
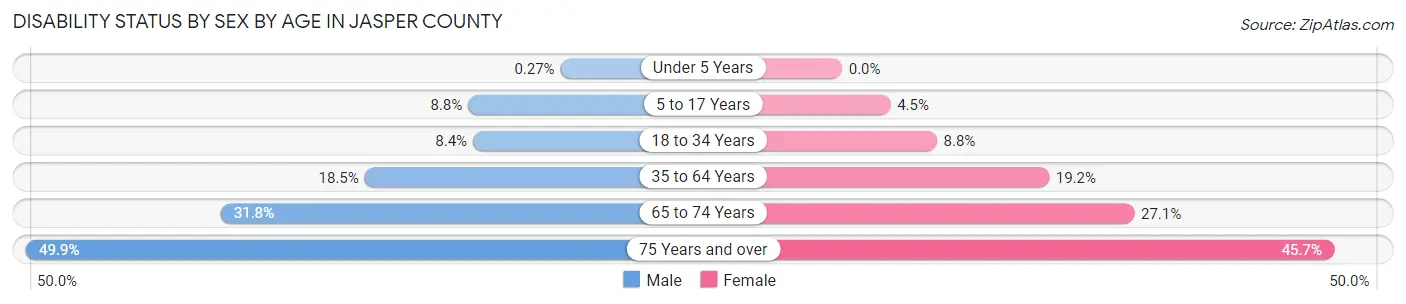
| Age Bracket | Male | Female |
| Under 5 Years | 11 (0.3%) | 0 (0.0%) |
| 5 to 17 Years | 1,001 (8.8%) | 491 (4.5%) |
| 18 to 34 Years | 1,190 (8.4%) | 1,240 (8.8%) |
| 35 to 64 Years | 4,099 (18.4%) | 4,294 (19.2%) |
| 65 to 74 Years | 1,613 (31.8%) | 1,659 (27.1%) |
| 75 Years and over | 1,552 (49.9%) | 2,095 (45.7%) |
Disability Class by Sex by Age in Jasper County
Disability Class: Hearing Difficulty
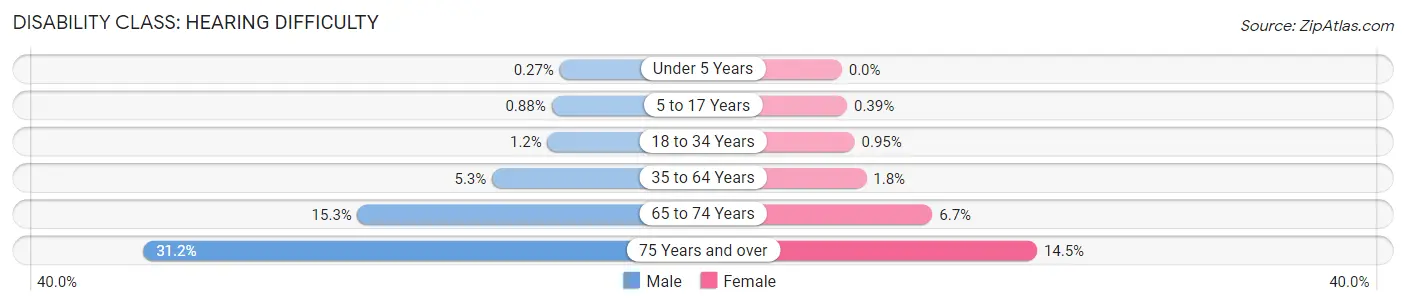
| Age Bracket | Male | Female |
| Under 5 Years | 11 (0.3%) | 0 (0.0%) |
| 5 to 17 Years | 100 (0.9%) | 43 (0.4%) |
| 18 to 34 Years | 166 (1.2%) | 134 (0.9%) |
| 35 to 64 Years | 1,175 (5.3%) | 407 (1.8%) |
| 65 to 74 Years | 775 (15.3%) | 411 (6.7%) |
| 75 Years and over | 971 (31.2%) | 665 (14.5%) |
Disability Class: Vision Difficulty
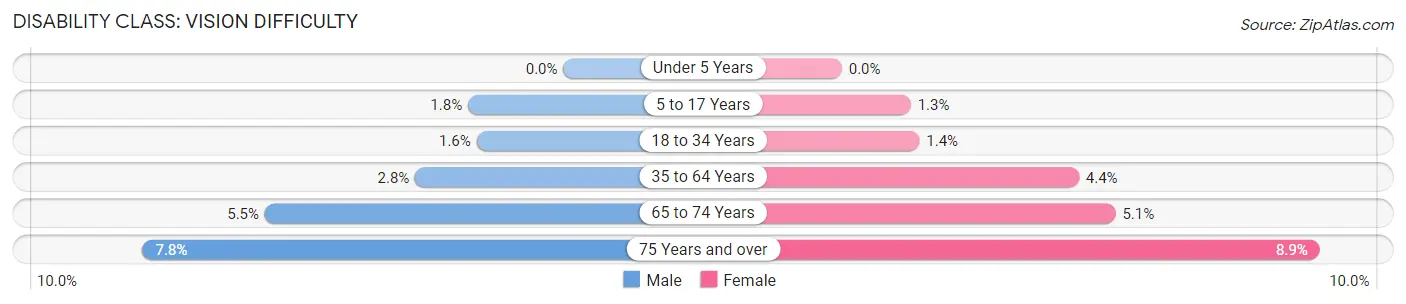
| Age Bracket | Male | Female |
| Under 5 Years | 0 (0.0%) | 0 (0.0%) |
| 5 to 17 Years | 200 (1.8%) | 140 (1.3%) |
| 18 to 34 Years | 228 (1.6%) | 203 (1.4%) |
| 35 to 64 Years | 611 (2.8%) | 983 (4.4%) |
| 65 to 74 Years | 281 (5.5%) | 311 (5.1%) |
| 75 Years and over | 243 (7.8%) | 407 (8.9%) |
Disability Class: Cognitive Difficulty
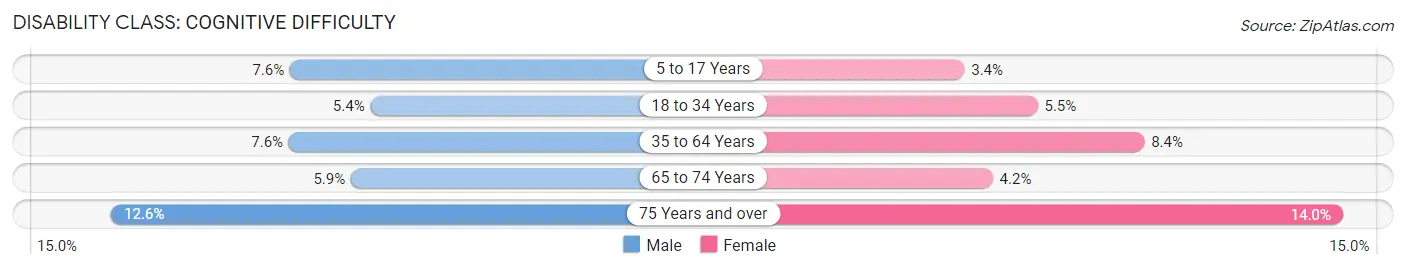
| Age Bracket | Male | Female |
| 5 to 17 Years | 862 (7.6%) | 373 (3.4%) |
| 18 to 34 Years | 762 (5.4%) | 768 (5.4%) |
| 35 to 64 Years | 1,698 (7.6%) | 1,882 (8.4%) |
| 65 to 74 Years | 300 (5.9%) | 257 (4.2%) |
| 75 Years and over | 392 (12.6%) | 640 (14.0%) |
Disability Class: Ambulatory Difficulty
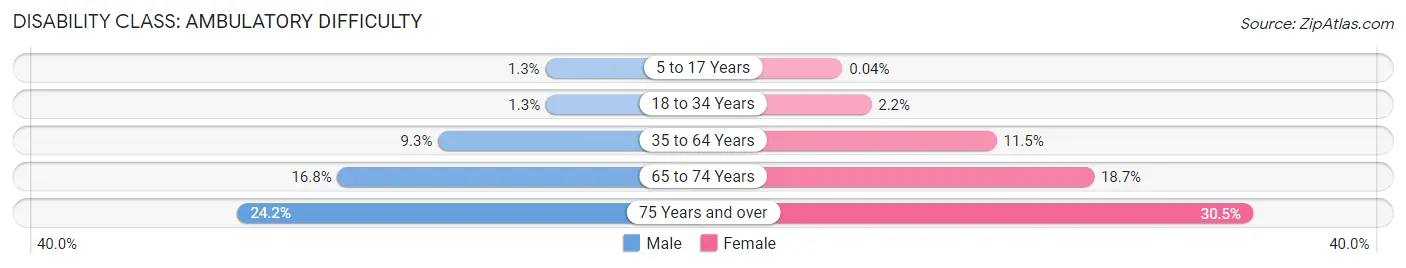
| Age Bracket | Male | Female |
| 5 to 17 Years | 151 (1.3%) | 4 (0.0%) |
| 18 to 34 Years | 183 (1.3%) | 309 (2.2%) |
| 35 to 64 Years | 2,064 (9.3%) | 2,569 (11.5%) |
| 65 to 74 Years | 851 (16.8%) | 1,145 (18.7%) |
| 75 Years and over | 753 (24.2%) | 1,400 (30.5%) |
Disability Class: Self-Care Difficulty
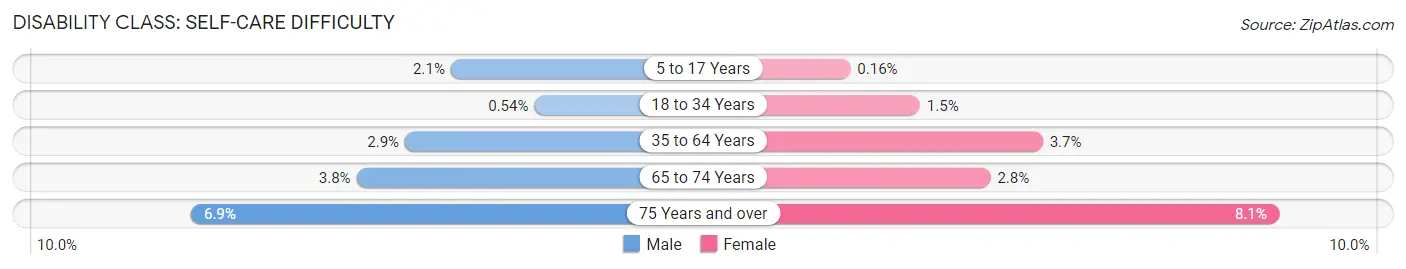
| Age Bracket | Male | Female |
| 5 to 17 Years | 237 (2.1%) | 18 (0.2%) |
| 18 to 34 Years | 77 (0.5%) | 205 (1.5%) |
| 35 to 64 Years | 654 (2.9%) | 833 (3.7%) |
| 65 to 74 Years | 195 (3.8%) | 169 (2.8%) |
| 75 Years and over | 215 (6.9%) | 372 (8.1%) |
Technology Access in Jasper County
Computing Device Access in Jasper County
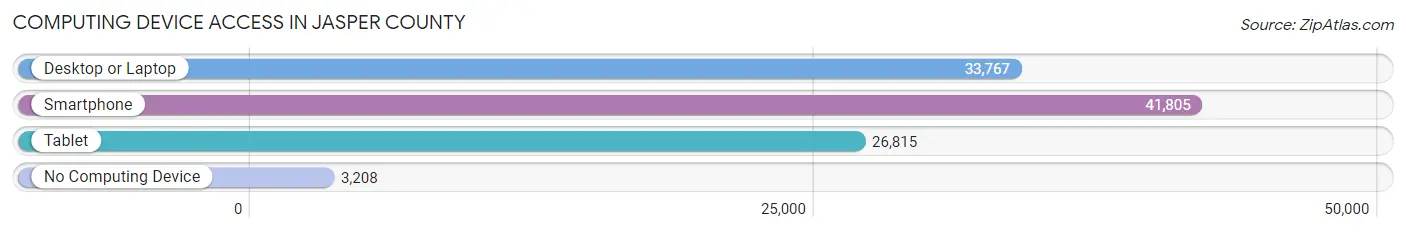
| Device Type | # Households | % Households |
| Desktop or Laptop | 33,767 | 71.1% |
| Smartphone | 41,805 | 88.0% |
| Tablet | 26,815 | 56.5% |
| No Computing Device | 3,208 | 6.8% |
| Total | 47,481 | 100.0% |
Internet Access in Jasper County
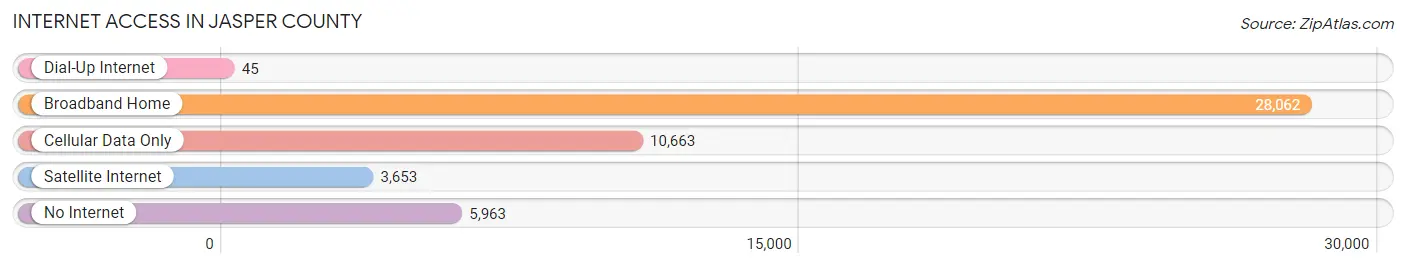
| Internet Type | # Households | % Households |
| Dial-Up Internet | 45 | 0.1% |
| Broadband Home | 28,062 | 59.1% |
| Cellular Data Only | 10,663 | 22.5% |
| Satellite Internet | 3,653 | 7.7% |
| No Internet | 5,963 | 12.6% |
| Total | 47,481 | 100.0% |
Jasper County Summary
Jasper County is located in the southwestern corner of Missouri, and is part of the Joplin, Missouri Metropolitan Statistical Area. The county was established in 1841 and named after William Jasper, a Revolutionary War hero. As of the 2010 census, the population was 117,404, making it the 15th most populous county in Missouri.
Geography
Jasper County is located in the southwestern corner of Missouri, and is bordered by Newton County to the north, Lawrence County to the east, Barton County to the south, and Cherokee County, Kansas to the west. The county has a total area of 576 square miles, of which 575 square miles is land and 1.2 square miles is water. The county is located in the Ozark Plateau region of Missouri, and is characterized by rolling hills and valleys. The highest point in the county is located in the northwest corner, at an elevation of 1,092 feet. The county is drained by the Spring River, which flows through the center of the county.
Demographics
As of the 2010 census, there were 117,404 people, 45,845 households, and 31,845 families residing in the county. The population density was 204 people per square mile. There were 50,845 housing units at an average density of 88 per square mile. The racial makeup of the county was 92.2% White, 2.7% Black or African American, 0.7% Native American, 0.6% Asian, 0.1% Pacific Islander, 1.7% from other races, and 2.1% from two or more races. 4.3% of the population were Hispanic or Latino of any race.
There were 45,845 households, out of which 30.2% had children under the age of 18 living with them, 53.2% were married couples living together, 11.2% had a female householder with no husband present, and 31.2% were non-families. 26.2% of all households were made up of individuals, and 11.2% had someone living alone who was 65 years of age or older. The average household size was 2.48 and the average family size was 2.99.
The median age in the county was 39.3 years. 24.2% of residents were under the age of 18; 8.2% were between the ages of 18 and 24; 23.7% were from 25 to 44; 27.2% were from 45 to 64; and 16.7% were 65 years of age or older. The gender makeup of the county was 48.2% male and 51.8% female.
Economy
Jasper County is home to a diverse economy, with a mix of manufacturing, agriculture, and services. The county is home to several large employers, including EaglePicher Technologies, a manufacturer of batteries and other energy storage products; Leggett & Platt, a manufacturer of bedding and furniture components; and ConAgra Foods, a food processing company. The county is also home to several smaller employers, including several agricultural operations, as well as a number of small businesses.
The county is served by two major highways, Interstate 44 and U.S. Route 71. The county is also served by the Joplin Regional Airport, which provides commercial air service to the region.
The median household income in the county was $41,945, and the median family income was $50,845. The per capita income for the county was $21,845. About 11.2% of families and 14.7% of the population were below the poverty line, including 19.2% of those under age 18 and 8.7% of those age 65 or over.
Jasper County is a vibrant and diverse community, with a strong economy and a high quality of life. The county is home to a variety of businesses, industries, and services, and is a great place to live, work, and play.
Common Questions
What is Per Capita Income in Jasper County?
Per Capita income in Jasper County is $28,371.
What is the Median Family Income in Jasper County?
Median Family Income in Jasper County is $68,289.
What is the Median Household income in Jasper County?
Median Household Income in Jasper County is $54,963.
What is Income or Wage Gap in Jasper County?
Income or Wage Gap in Jasper County is 31.7%.
Women in Jasper County earn 68.3 cents for every dollar earned by a man.
What is Family Income Deficit in Jasper County?
Family Income Deficit in Jasper County is $10,557.
Families that are below poverty line in Jasper County earn $10,557 less on average than the poverty threshold level.
What is Inequality or Gini Index in Jasper County?
Inequality or Gini Index in Jasper County is 0.44.
What is the Total Population of Jasper County?
Total Population of Jasper County is 122,788.
What is the Total Male Population of Jasper County?
Total Male Population of Jasper County is 60,468.
What is the Total Female Population of Jasper County?
Total Female Population of Jasper County is 62,320.
What is the Ratio of Males per 100 Females in Jasper County?
There are 97.03 Males per 100 Females in Jasper County.
What is the Ratio of Females per 100 Males in Jasper County?
There are 103.06 Females per 100 Males in Jasper County.
What is the Median Population Age in Jasper County?
Median Population Age in Jasper County is 36.6 Years.
What is the Average Family Size in Jasper County
Average Family Size in Jasper County is 3.1 People.
What is the Average Household Size in Jasper County
Average Household Size in Jasper County is 2.5 People.
How Large is the Labor Force in Jasper County?
There are 60,504 People in the Labor Forcein in Jasper County.
What is the Percentage of People in the Labor Force in Jasper County?
63.1% of People are in the Labor Force in Jasper County.
What is the Unemployment Rate in Jasper County?
Unemployment Rate in Jasper County is 4.1%.