Jackson County, MO Map & Demographics
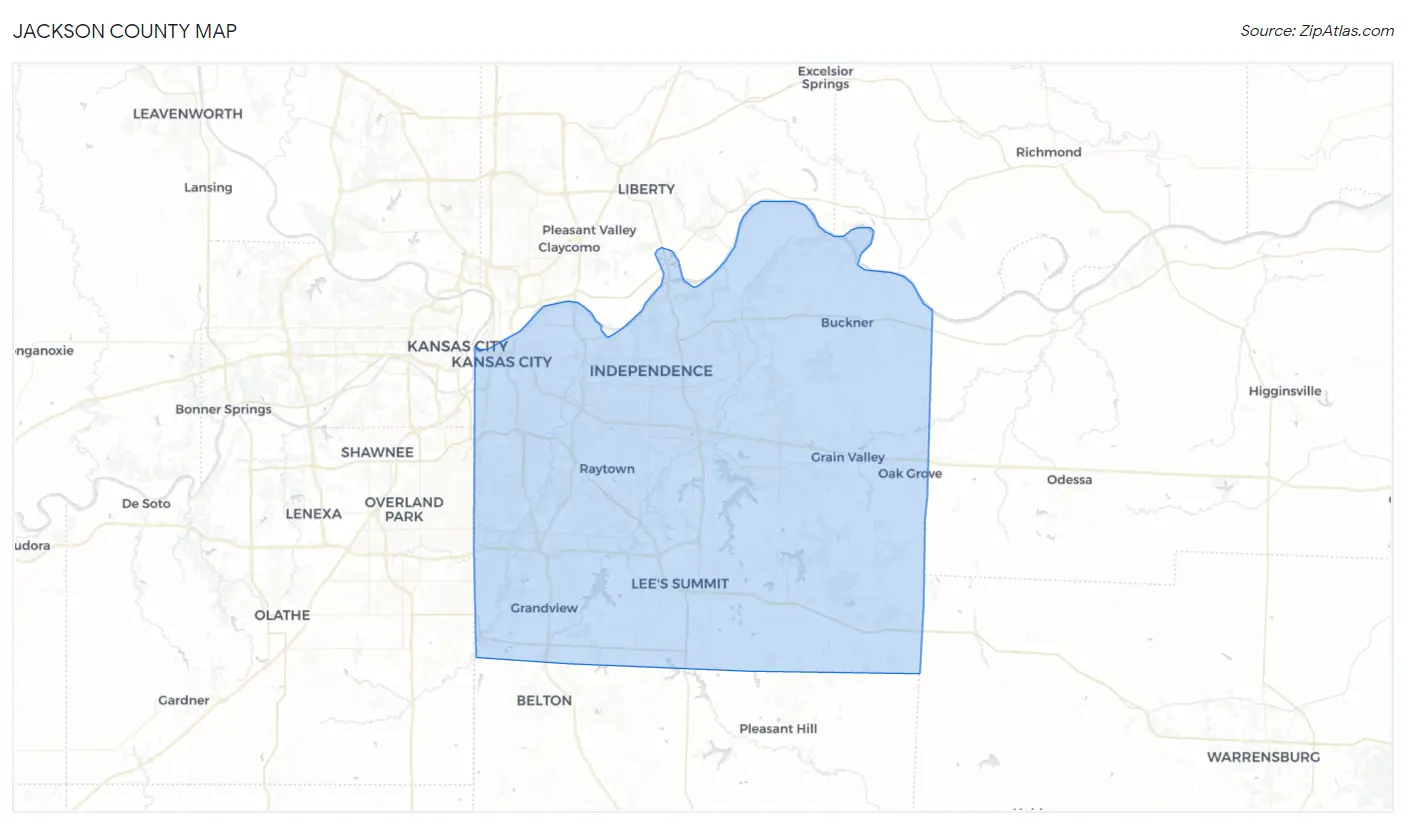
Jackson County Map
Jackson County Overview
$36,890
PER CAPITA INCOME
$85,388
AVG FAMILY INCOME
$65,169
AVG HOUSEHOLD INCOME
25.0%
WAGE / INCOME GAP [ % ]
75.0¢/ $1
WAGE / INCOME GAP [ $ ]
$11,479
FAMILY INCOME DEFICIT
0.46
INEQUALITY / GINI INDEX
715,526
TOTAL POPULATION
348,351
MALE POPULATION
367,175
FEMALE POPULATION
94.87
MALES / 100 FEMALES
105.40
FEMALES / 100 MALES
37.0
MEDIAN AGE
3.1
AVG FAMILY SIZE
2.4
AVG HOUSEHOLD SIZE
380,838
LABOR FORCE [ PEOPLE ]
67.1%
PERCENT IN LABOR FORCE
4.9%
UNEMPLOYMENT RATE
Jackson County Area Codes
Income in Jackson County
Income Overview in Jackson County
Per Capita Income in Jackson County is $36,890, while median incomes of families and households are $85,388 and $65,169 respectively.
| Characteristic | Number | Measure |
| Per Capita Income | 715,526 | $36,890 |
| Median Family Income | 169,849 | $85,388 |
| Mean Family Income | 169,849 | $106,877 |
| Median Household Income | 298,908 | $65,169 |
| Mean Household Income | 298,908 | $86,997 |
| Income Deficit | 169,849 | $11,479 |
| Wage / Income Gap (%) | 715,526 | 24.96% |
| Wage / Income Gap ($) | 715,526 | 75.04¢ per $1 |
| Gini / Inequality Index | 715,526 | 0.46 |
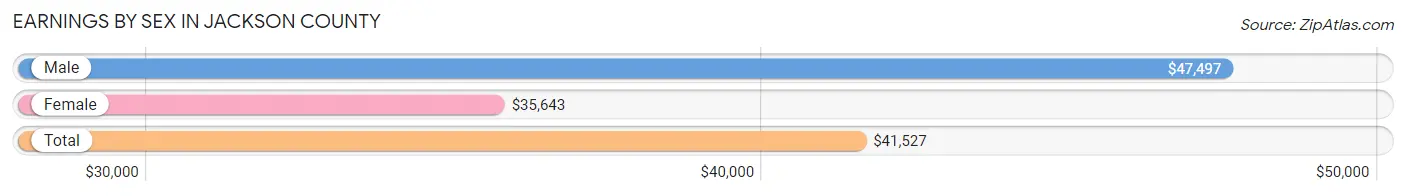
Earnings by Sex in Jackson County
Average Earnings in Jackson County are $41,527, $47,497 for men and $35,643 for women, a difference of 25.0%.
| Sex | Number | Average Earnings |
| Male | 201,524 (51.3%) | $47,497 |
| Female | 191,644 (48.7%) | $35,643 |
| Total | 393,168 (100.0%) | $41,527 |
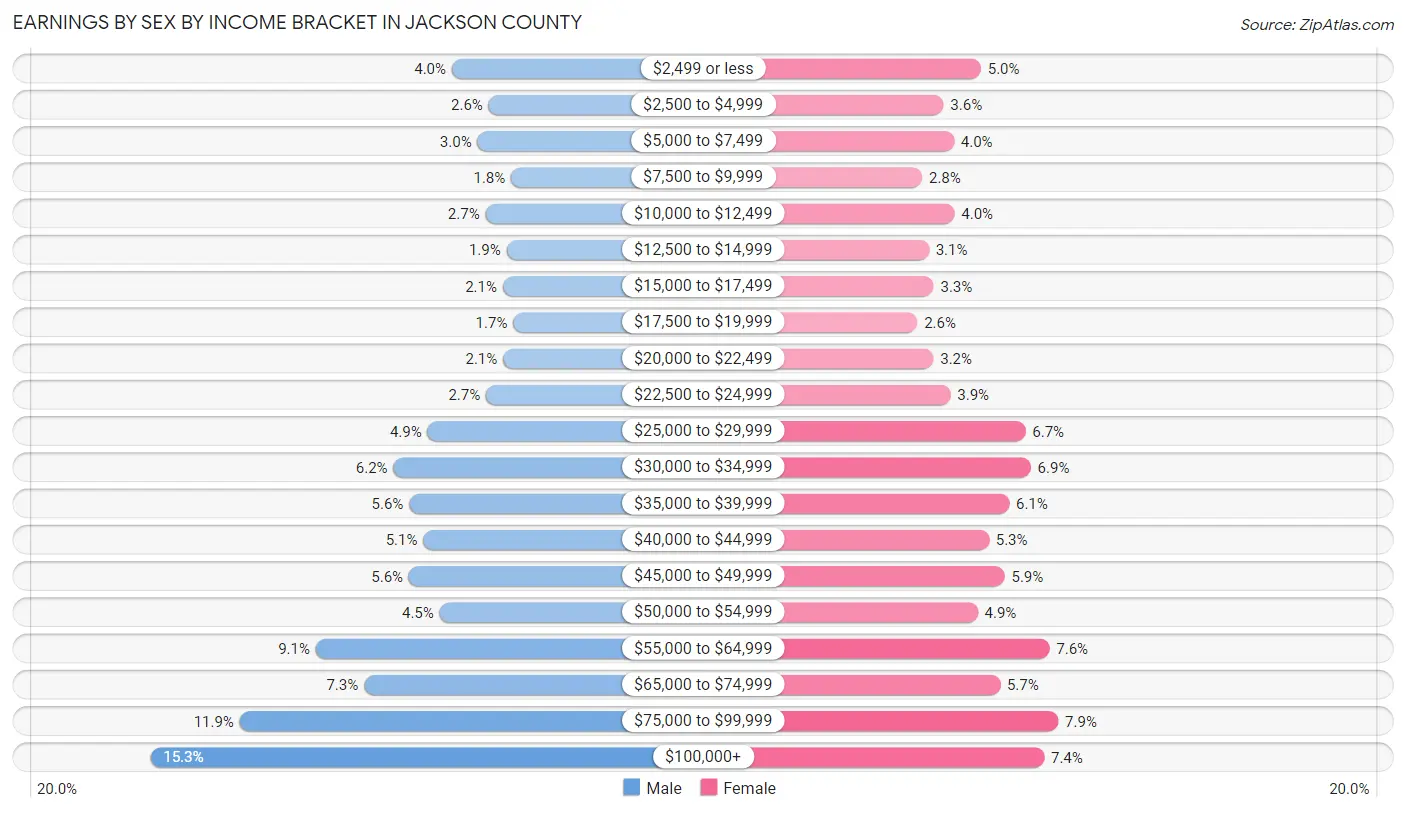
Earnings by Sex by Income Bracket in Jackson County
The most common earnings brackets in Jackson County are $100,000+ for men (30,820 | 15.3%) and $75,000 to $99,999 for women (15,171 | 7.9%).
| Income | Male | Female |
| $2,499 or less | 8,037 (4.0%) | 9,624 (5.0%) |
| $2,500 to $4,999 | 5,263 (2.6%) | 6,946 (3.6%) |
| $5,000 to $7,499 | 6,105 (3.0%) | 7,683 (4.0%) |
| $7,500 to $9,999 | 3,564 (1.8%) | 5,409 (2.8%) |
| $10,000 to $12,499 | 5,496 (2.7%) | 7,728 (4.0%) |
| $12,500 to $14,999 | 3,913 (1.9%) | 5,886 (3.1%) |
| $15,000 to $17,499 | 4,191 (2.1%) | 6,223 (3.3%) |
| $17,500 to $19,999 | 3,411 (1.7%) | 5,067 (2.6%) |
| $20,000 to $22,499 | 4,172 (2.1%) | 6,211 (3.2%) |
| $22,500 to $24,999 | 5,453 (2.7%) | 7,432 (3.9%) |
| $25,000 to $29,999 | 9,884 (4.9%) | 12,813 (6.7%) |
| $30,000 to $34,999 | 12,454 (6.2%) | 13,203 (6.9%) |
| $35,000 to $39,999 | 11,275 (5.6%) | 11,658 (6.1%) |
| $40,000 to $44,999 | 10,199 (5.1%) | 10,189 (5.3%) |
| $45,000 to $49,999 | 11,279 (5.6%) | 11,324 (5.9%) |
| $50,000 to $54,999 | 8,960 (4.4%) | 9,385 (4.9%) |
| $55,000 to $64,999 | 18,324 (9.1%) | 14,546 (7.6%) |
| $65,000 to $74,999 | 14,668 (7.3%) | 10,992 (5.7%) |
| $75,000 to $99,999 | 24,056 (11.9%) | 15,171 (7.9%) |
| $100,000+ | 30,820 (15.3%) | 14,154 (7.4%) |
| Total | 201,524 (100.0%) | 191,644 (100.0%) |
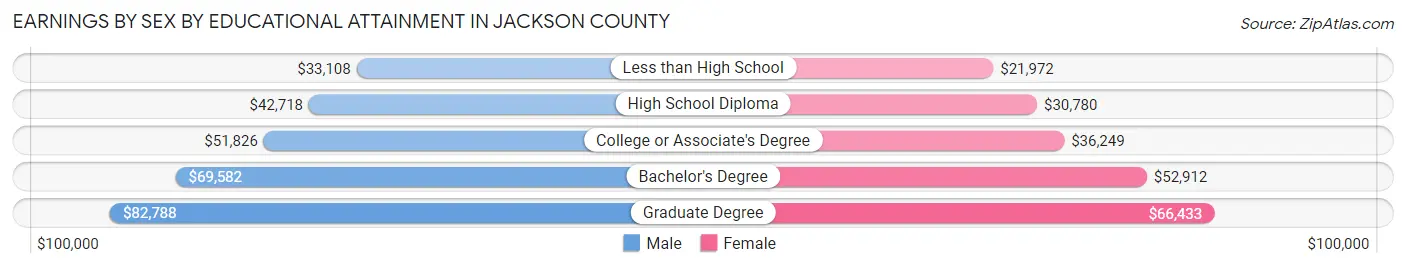
Earnings by Sex by Educational Attainment in Jackson County
Average earnings in Jackson County are $54,569 for men and $40,417 for women, a difference of 25.9%. Men with an educational attainment of graduate degree enjoy the highest average annual earnings of $82,788, while those with less than high school education earn the least with $33,108. Women with an educational attainment of graduate degree earn the most with the average annual earnings of $66,433, while those with less than high school education have the smallest earnings of $21,972.
| Educational Attainment | Male Income | Female Income |
| Less than High School | $33,108 | $21,972 |
| High School Diploma | $42,718 | $30,780 |
| College or Associate's Degree | $51,826 | $36,249 |
| Bachelor's Degree | $69,582 | $52,912 |
| Graduate Degree | $82,788 | $66,433 |
| Total | $54,569 | $40,417 |
Family Income in Jackson County
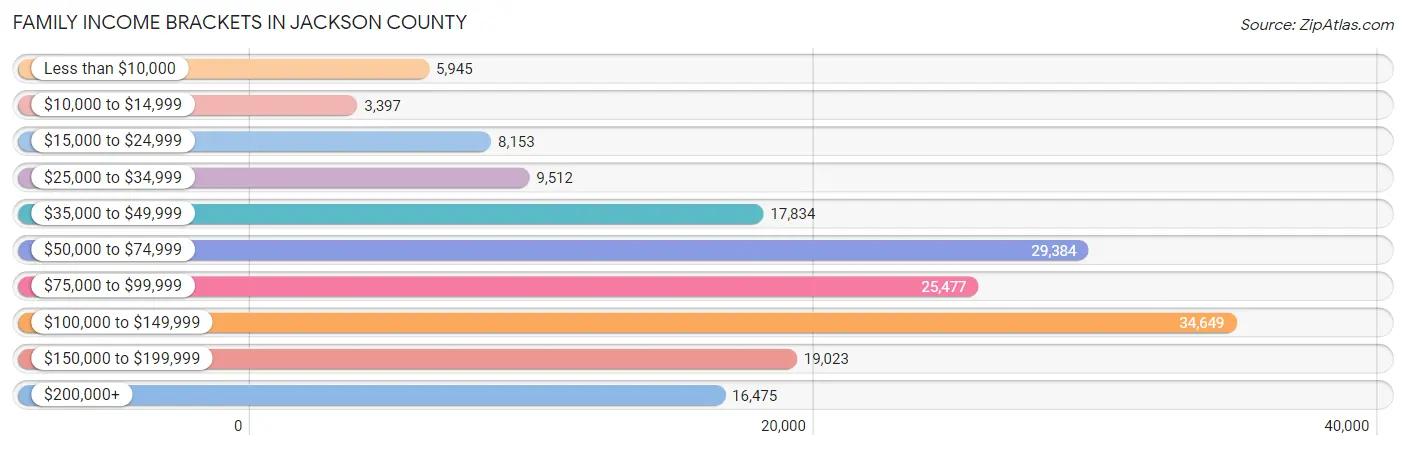
Family Income Brackets in Jackson County
According to the Jackson County family income data, there are 34,649 families falling into the $100,000 to $149,999 income range, which is the most common income bracket and makes up 20.4% of all families. Conversely, the $10,000 to $14,999 income bracket is the least frequent group with only 3,397 families (2.0%) belonging to this category.
| Income Bracket | # Families | % Families |
| Less than $10,000 | 5,945 | 3.5% |
| $10,000 to $14,999 | 3,397 | 2.0% |
| $15,000 to $24,999 | 8,153 | 4.8% |
| $25,000 to $34,999 | 9,512 | 5.6% |
| $35,000 to $49,999 | 17,834 | 10.5% |
| $50,000 to $74,999 | 29,384 | 17.3% |
| $75,000 to $99,999 | 25,477 | 15.0% |
| $100,000 to $149,999 | 34,649 | 20.4% |
| $150,000 to $199,999 | 19,023 | 11.2% |
| $200,000+ | 16,475 | 9.7% |
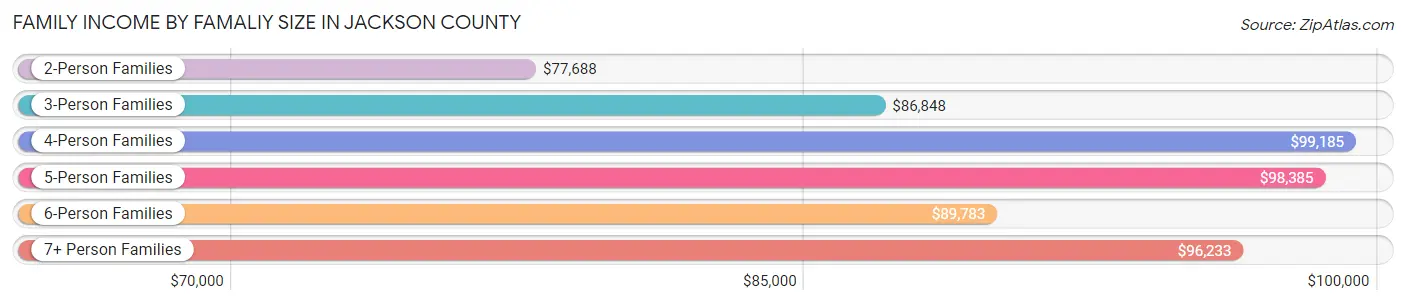
Family Income by Famaliy Size in Jackson County
4-person families (29,163 | 17.2%) account for the highest median family income in Jackson County with $99,185 per family, while 2-person families (81,954 | 48.2%) have the highest median income of $38,844 per family member.
| Income Bracket | # Families | Median Income |
| 2-Person Families | 81,954 (48.2%) | $77,688 |
| 3-Person Families | 37,783 (22.3%) | $86,848 |
| 4-Person Families | 29,163 (17.2%) | $99,185 |
| 5-Person Families | 12,579 (7.4%) | $98,385 |
| 6-Person Families | 5,781 (3.4%) | $89,783 |
| 7+ Person Families | 2,589 (1.5%) | $96,233 |
| Total | 169,849 (100.0%) | $85,388 |
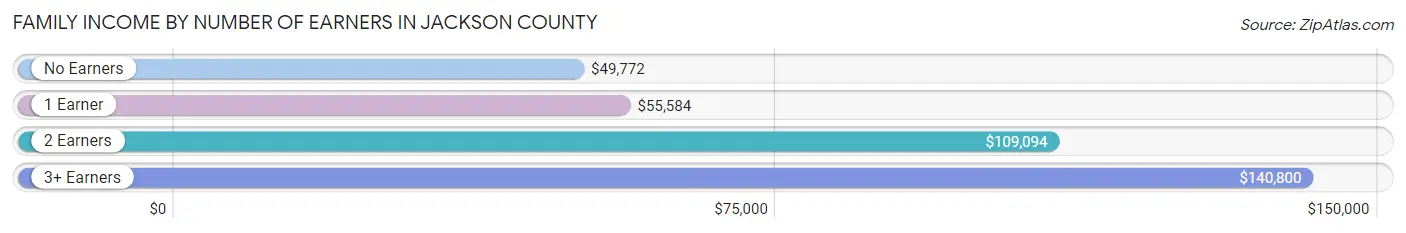
Family Income by Number of Earners in Jackson County
The median family income in Jackson County is $85,388, with families comprising 3+ earners (19,005) having the highest median family income of $140,800, while families with no earners (23,142) have the lowest median family income of $49,772, accounting for 11.2% and 13.6% of families, respectively.
| Number of Earners | # Families | Median Income |
| No Earners | 23,142 (13.6%) | $49,772 |
| 1 Earner | 54,877 (32.3%) | $55,584 |
| 2 Earners | 72,825 (42.9%) | $109,094 |
| 3+ Earners | 19,005 (11.2%) | $140,800 |
| Total | 169,849 (100.0%) | $85,388 |
Household Income in Jackson County
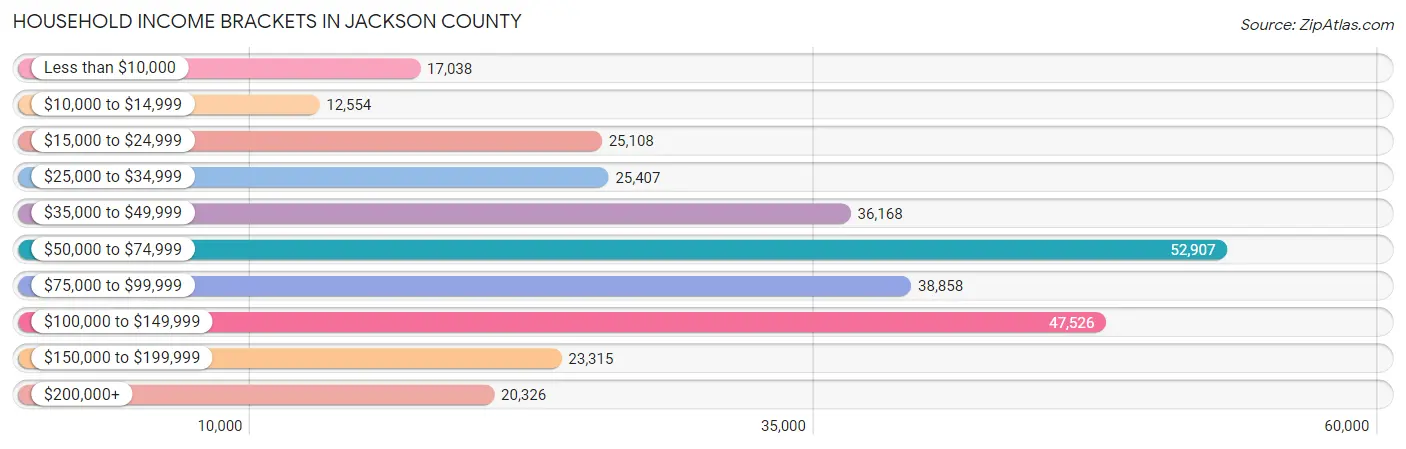
Household Income Brackets in Jackson County
With 52,907 households falling in the category, the $50,000 to $74,999 income range is the most frequent in Jackson County, accounting for 17.7% of all households. In contrast, only 12,554 households (4.2%) fall into the $10,000 to $14,999 income bracket, making it the least populous group.
| Income Bracket | # Households | % Households |
| Less than $10,000 | 17,038 | 5.7% |
| $10,000 to $14,999 | 12,554 | 4.2% |
| $15,000 to $24,999 | 25,108 | 8.4% |
| $25,000 to $34,999 | 25,407 | 8.5% |
| $35,000 to $49,999 | 36,168 | 12.1% |
| $50,000 to $74,999 | 52,907 | 17.7% |
| $75,000 to $99,999 | 38,858 | 13.0% |
| $100,000 to $149,999 | 47,526 | 15.9% |
| $150,000 to $199,999 | 23,315 | 7.8% |
| $200,000+ | 20,326 | 6.8% |
Household Income by Householder Age in Jackson County
The median household income in Jackson County is $65,169, with the highest median household income of $74,696 found in the 45 to 64 years age bracket for the primary householder. A total of 103,803 households (34.7%) fall into this category. Meanwhile, the 15 to 24 years age bracket for the primary householder has the lowest median household income of $37,155, with 14,039 households (4.7%) in this group.
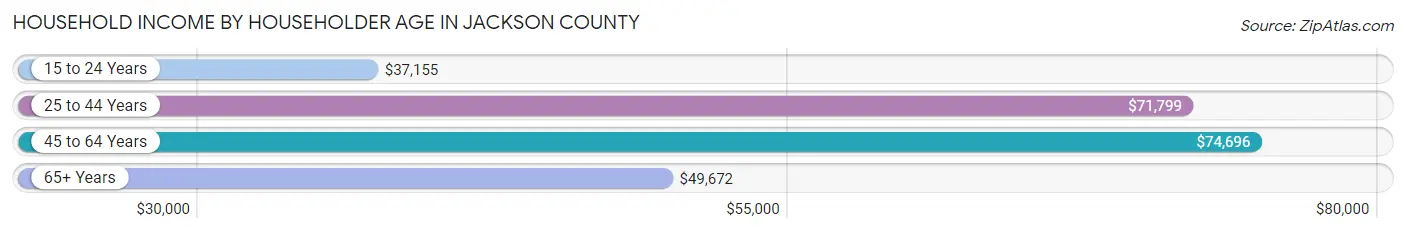
| Income Bracket | # Households | Median Income |
| 15 to 24 Years | 14,039 (4.7%) | $37,155 |
| 25 to 44 Years | 110,177 (36.9%) | $71,799 |
| 45 to 64 Years | 103,803 (34.7%) | $74,696 |
| 65+ Years | 70,889 (23.7%) | $49,672 |
| Total | 298,908 (100.0%) | $65,169 |
Poverty in Jackson County
Income Below Poverty by Sex and Age in Jackson County
With 12.5% poverty level for males and 15.2% for females among the residents of Jackson County, 5 year old males and under 5 year old females are the most vulnerable to poverty, with 1,052 males (22.8%) and 5,127 females (23.7%) in their respective age groups living below the poverty level.
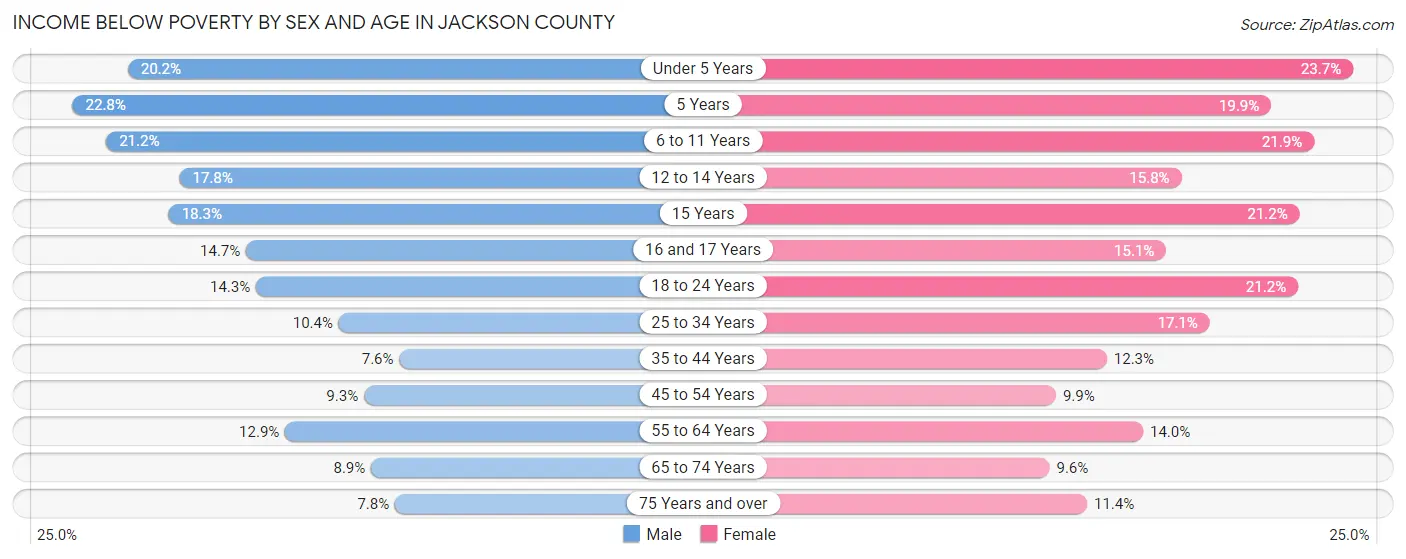
| Age Bracket | Male | Female |
| Under 5 Years | 4,514 (20.2%) | 5,127 (23.7%) |
| 5 Years | 1,052 (22.8%) | 982 (19.9%) |
| 6 to 11 Years | 6,001 (21.2%) | 5,777 (21.9%) |
| 12 to 14 Years | 2,428 (17.8%) | 2,190 (15.8%) |
| 15 Years | 866 (18.3%) | 983 (21.2%) |
| 16 and 17 Years | 1,383 (14.7%) | 1,360 (15.0%) |
| 18 to 24 Years | 4,096 (14.3%) | 6,298 (21.2%) |
| 25 to 34 Years | 5,617 (10.4%) | 9,455 (17.1%) |
| 35 to 44 Years | 3,485 (7.6%) | 5,794 (12.3%) |
| 45 to 54 Years | 3,822 (9.2%) | 4,167 (9.9%) |
| 55 to 64 Years | 5,605 (12.9%) | 6,556 (14.0%) |
| 65 to 74 Years | 2,620 (8.9%) | 3,359 (9.6%) |
| 75 Years and over | 1,327 (7.8%) | 2,909 (11.4%) |
| Total | 42,816 (12.5%) | 54,957 (15.2%) |
Income Above Poverty by Sex and Age in Jackson County
According to the poverty statistics in Jackson County, males aged 35 to 44 years and females aged 65 to 74 years are the age groups that are most secure financially, with 92.4% of males and 90.4% of females in these age groups living above the poverty line.
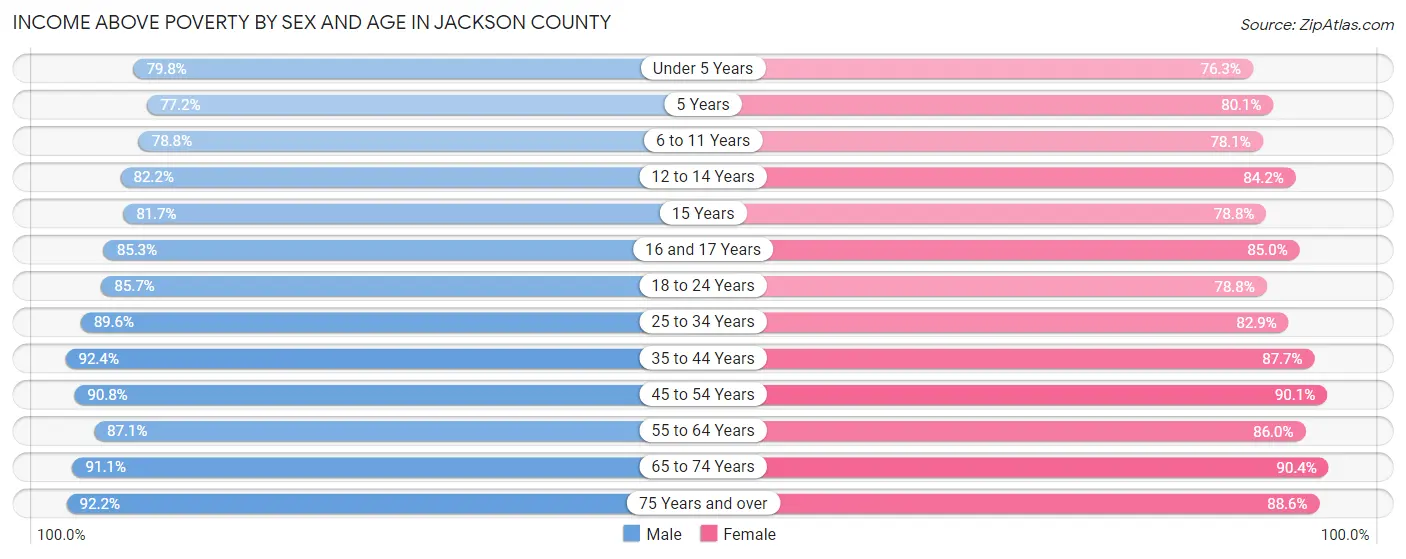
| Age Bracket | Male | Female |
| Under 5 Years | 17,816 (79.8%) | 16,489 (76.3%) |
| 5 Years | 3,569 (77.2%) | 3,948 (80.1%) |
| 6 to 11 Years | 22,291 (78.8%) | 20,588 (78.1%) |
| 12 to 14 Years | 11,203 (82.2%) | 11,703 (84.2%) |
| 15 Years | 3,863 (81.7%) | 3,644 (78.8%) |
| 16 and 17 Years | 8,010 (85.3%) | 7,677 (85.0%) |
| 18 to 24 Years | 24,624 (85.7%) | 23,457 (78.8%) |
| 25 to 34 Years | 48,264 (89.6%) | 45,941 (82.9%) |
| 35 to 44 Years | 42,291 (92.4%) | 41,319 (87.7%) |
| 45 to 54 Years | 37,514 (90.7%) | 37,764 (90.1%) |
| 55 to 64 Years | 37,801 (87.1%) | 40,336 (86.0%) |
| 65 to 74 Years | 26,747 (91.1%) | 31,469 (90.4%) |
| 75 Years and over | 15,672 (92.2%) | 22,646 (88.6%) |
| Total | 299,665 (87.5%) | 306,981 (84.8%) |
Income Below Poverty Among Married-Couple Families in Jackson County
The poverty statistics for married-couple families in Jackson County show that 3.7% or 4,358 of the total 116,615 families live below the poverty line. Families with 5 or more children have the highest poverty rate of 25.4%, comprising of 229 families. On the other hand, families with no children have the lowest poverty rate of 2.9%, which includes 1,985 families.
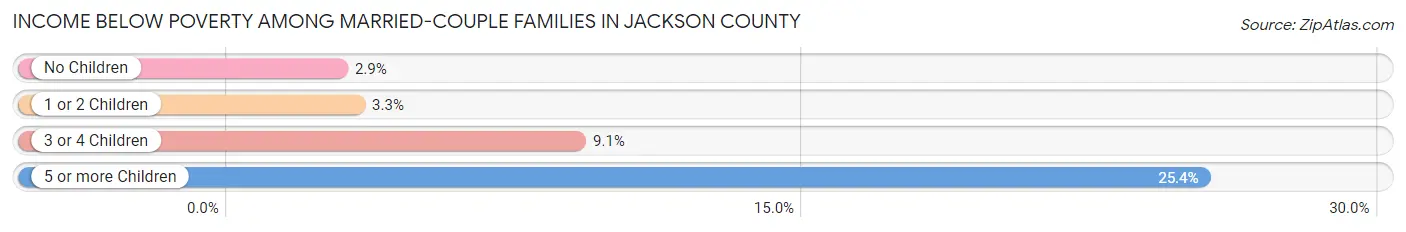
| Children | Above Poverty | Below Poverty |
| No Children | 67,101 (97.1%) | 1,985 (2.9%) |
| 1 or 2 Children | 35,091 (96.7%) | 1,205 (3.3%) |
| 3 or 4 Children | 9,392 (90.9%) | 939 (9.1%) |
| 5 or more Children | 673 (74.6%) | 229 (25.4%) |
| Total | 112,257 (96.3%) | 4,358 (3.7%) |
Income Below Poverty Among Single-Parent Households in Jackson County
According to the poverty data in Jackson County, 11.0% or 1,411 single-father households and 26.6% or 10,727 single-mother households are living below the poverty line. Among single-father households, those with 5 or more children have the highest poverty rate, with 68 households (43.6%) experiencing poverty. Likewise, among single-mother households, those with 5 or more children have the highest poverty rate, with 370 households (63.4%) falling below the poverty line.
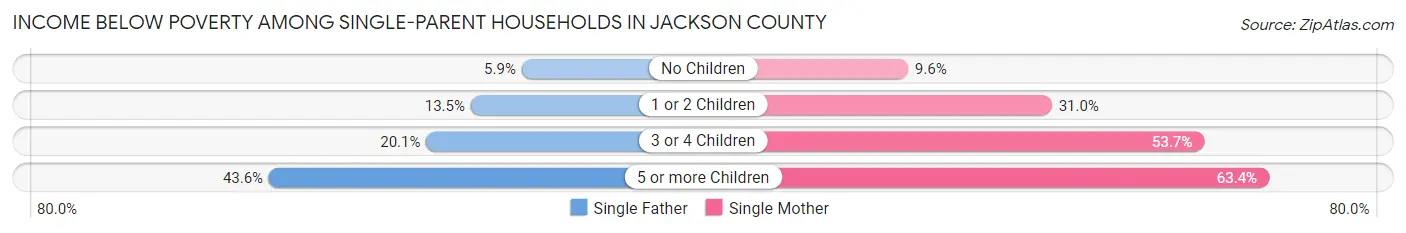
| Children | Single Father | Single Mother |
| No Children | 351 (5.9%) | 1,417 (9.6%) |
| 1 or 2 Children | 762 (13.5%) | 6,106 (31.0%) |
| 3 or 4 Children | 230 (20.1%) | 2,834 (53.7%) |
| 5 or more Children | 68 (43.6%) | 370 (63.4%) |
| Total | 1,411 (11.0%) | 10,727 (26.6%) |
Income Below Poverty Among Married-Couple vs Single-Parent Households in Jackson County
The poverty data for Jackson County shows that 4,358 of the married-couple family households (3.7%) and 12,138 of the single-parent households (22.8%) are living below the poverty level. Within the married-couple family households, those with 5 or more children have the highest poverty rate, with 229 households (25.4%) falling below the poverty line. Among the single-parent households, those with 5 or more children have the highest poverty rate, with 438 household (59.2%) living below poverty.
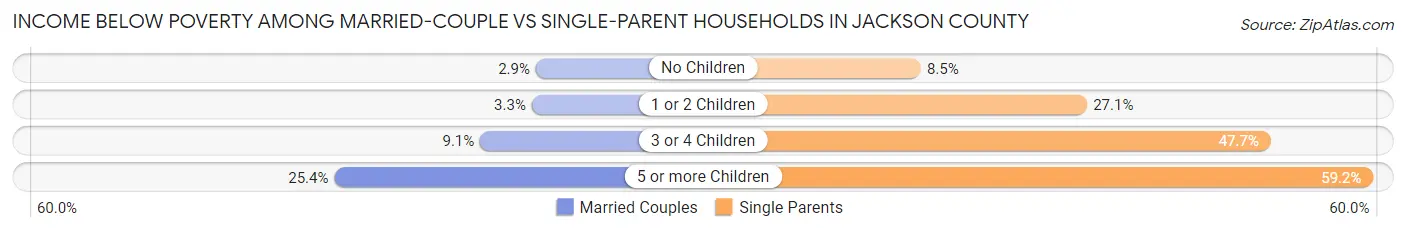
| Children | Married-Couple Families | Single-Parent Households |
| No Children | 1,985 (2.9%) | 1,768 (8.5%) |
| 1 or 2 Children | 1,205 (3.3%) | 6,868 (27.1%) |
| 3 or 4 Children | 939 (9.1%) | 3,064 (47.7%) |
| 5 or more Children | 229 (25.4%) | 438 (59.2%) |
| Total | 4,358 (3.7%) | 12,138 (22.8%) |
Race in Jackson County
The most populous races in Jackson County are White / Caucasian (460,920 | 64.4%), Black / African American (163,035 | 22.8%), and Hispanic or Latino (68,575 | 9.6%).
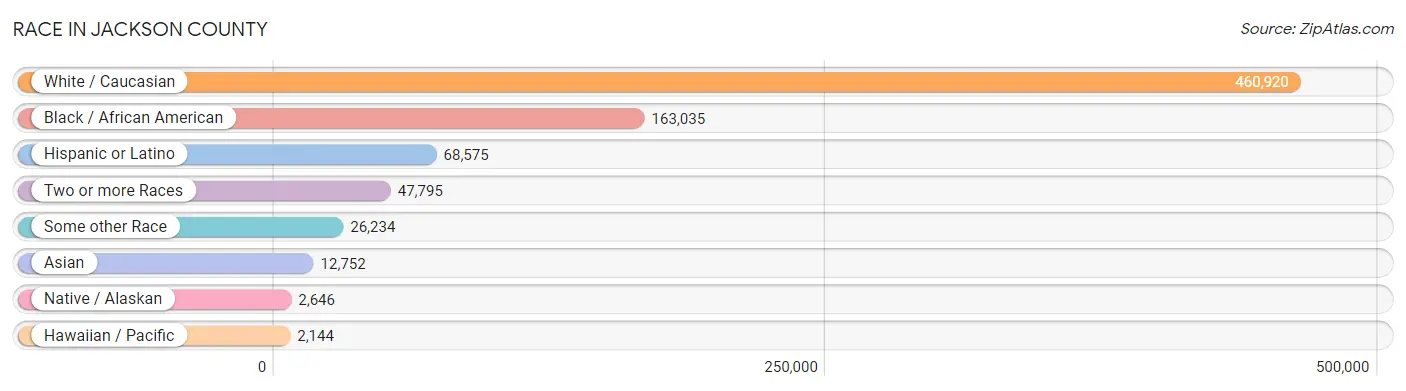
| Race | # Population | % Population |
| Asian | 12,752 | 1.8% |
| Black / African American | 163,035 | 22.8% |
| Hawaiian / Pacific | 2,144 | 0.3% |
| Hispanic or Latino | 68,575 | 9.6% |
| Native / Alaskan | 2,646 | 0.4% |
| White / Caucasian | 460,920 | 64.4% |
| Two or more Races | 47,795 | 6.7% |
| Some other Race | 26,234 | 3.7% |
| Total | 715,526 | 100.0% |
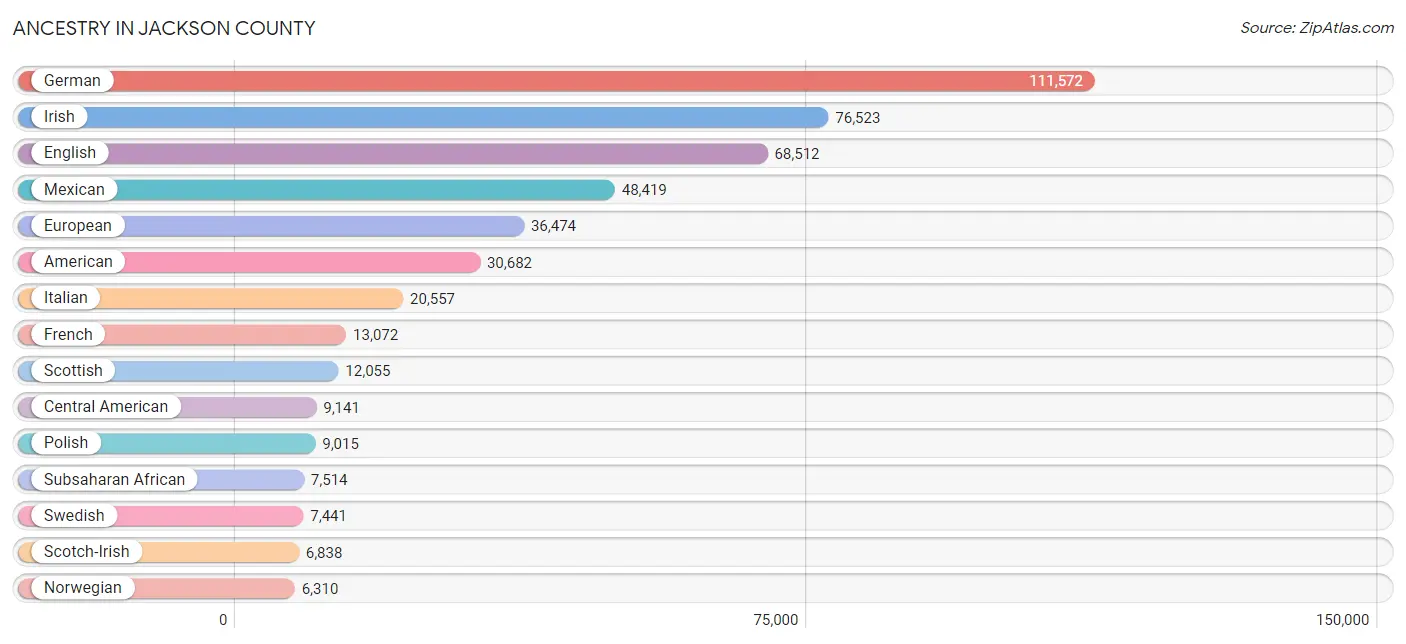
Ancestry in Jackson County
The most populous ancestries reported in Jackson County are German (111,572 | 15.6%), Irish (76,523 | 10.7%), English (68,512 | 9.6%), Mexican (48,419 | 6.8%), and European (36,474 | 5.1%), together accounting for 47.7% of all Jackson County residents.
| Ancestry | # Population | % Population |
| Afghan | 78 | 0.0% |
| African | 3,504 | 0.5% |
| Alaska Native | 25 | 0.0% |
| Albanian | 20 | 0.0% |
| American | 30,682 | 4.3% |
| Apache | 72 | 0.0% |
| Arab | 4,850 | 0.7% |
| Argentinean | 50 | 0.0% |
| Armenian | 216 | 0.0% |
| Assyrian / Chaldean / Syriac | 7 | 0.0% |
| Australian | 273 | 0.0% |
| Austrian | 1,042 | 0.2% |
| Bahamian | 143 | 0.0% |
| Bangladeshi | 43 | 0.0% |
| Barbadian | 10 | 0.0% |
| Basque | 9 | 0.0% |
| Belgian | 627 | 0.1% |
| Belizean | 8 | 0.0% |
| Bhutanese | 1,425 | 0.2% |
| Blackfeet | 765 | 0.1% |
| Bolivian | 54 | 0.0% |
| Brazilian | 173 | 0.0% |
| British | 4,080 | 0.6% |
| British West Indian | 21 | 0.0% |
| Bulgarian | 28 | 0.0% |
| Burmese | 1,928 | 0.3% |
| Cajun | 19 | 0.0% |
| Cambodian | 6 | 0.0% |
| Canadian | 645 | 0.1% |
| Celtic | 9 | 0.0% |
| Central American | 9,141 | 1.3% |
| Central American Indian | 532 | 0.1% |
| Cherokee | 3,197 | 0.4% |
| Cheyenne | 41 | 0.0% |
| Chickasaw | 98 | 0.0% |
| Chilean | 129 | 0.0% |
| Chinese | 88 | 0.0% |
| Chippewa | 148 | 0.0% |
| Choctaw | 440 | 0.1% |
| Colombian | 1,012 | 0.1% |
| Colville | 12 | 0.0% |
| Comanche | 84 | 0.0% |
| Costa Rican | 79 | 0.0% |
| Cree | 33 | 0.0% |
| Creek | 110 | 0.0% |
| Croatian | 1,136 | 0.2% |
| Crow | 31 | 0.0% |
| Cuban | 2,262 | 0.3% |
| Cypriot | 2 | 0.0% |
| Czech | 2,350 | 0.3% |
| Czechoslovakian | 645 | 0.1% |
| Danish | 1,979 | 0.3% |
| Delaware | 52 | 0.0% |
| Dominican | 355 | 0.1% |
| Dutch | 6,242 | 0.9% |
| Dutch West Indian | 43 | 0.0% |
| Eastern European | 1,264 | 0.2% |
| Ecuadorian | 204 | 0.0% |
| Egyptian | 641 | 0.1% |
| English | 68,512 | 9.6% |
| Estonian | 10 | 0.0% |
| Ethiopian | 279 | 0.0% |
| European | 36,474 | 5.1% |
| Fijian | 38 | 0.0% |
| Filipino | 109 | 0.0% |
| Finnish | 546 | 0.1% |
| French | 13,072 | 1.8% |
| French American Indian | 62 | 0.0% |
| French Canadian | 1,517 | 0.2% |
| German | 111,572 | 15.6% |
| German Russian | 165 | 0.0% |
| Ghanaian | 77 | 0.0% |
| Greek | 1,559 | 0.2% |
| Guamanian / Chamorro | 146 | 0.0% |
| Guatemalan | 2,219 | 0.3% |
| Guyanese | 28 | 0.0% |
| Haitian | 468 | 0.1% |
| Honduran | 3,115 | 0.4% |
| Hungarian | 943 | 0.1% |
| Icelander | 82 | 0.0% |
| Indian (Asian) | 2,650 | 0.4% |
| Indonesian | 421 | 0.1% |
| Inupiat | 7 | 0.0% |
| Iranian | 340 | 0.1% |
| Iraqi | 528 | 0.1% |
| Irish | 76,523 | 10.7% |
| Iroquois | 87 | 0.0% |
| Israeli | 40 | 0.0% |
| Italian | 20,557 | 2.9% |
| Jamaican | 1,170 | 0.2% |
| Japanese | 283 | 0.0% |
| Jordanian | 175 | 0.0% |
| Kenyan | 315 | 0.0% |
| Korean | 3,922 | 0.5% |
| Laotian | 57 | 0.0% |
| Latvian | 74 | 0.0% |
| Lebanese | 821 | 0.1% |
| Liberian | 76 | 0.0% |
| Lithuanian | 610 | 0.1% |
| Lumbee | 24 | 0.0% |
| Luxembourger | 236 | 0.0% |
| Malaysian | 286 | 0.0% |
| Marshallese | 20 | 0.0% |
| Mexican | 48,419 | 6.8% |
| Mexican American Indian | 768 | 0.1% |
| Mongolian | 100 | 0.0% |
| Moroccan | 420 | 0.1% |
| Native Hawaiian | 490 | 0.1% |
| Navajo | 91 | 0.0% |
| New Zealander | 56 | 0.0% |
| Nicaraguan | 126 | 0.0% |
| Nigerian | 1,168 | 0.2% |
| Northern European | 736 | 0.1% |
| Norwegian | 6,310 | 0.9% |
| Osage | 97 | 0.0% |
| Paiute | 1 | 0.0% |
| Pakistani | 596 | 0.1% |
| Palestinian | 1,012 | 0.1% |
| Panamanian | 151 | 0.0% |
| Pennsylvania German | 114 | 0.0% |
| Peruvian | 246 | 0.0% |
| Pima | 15 | 0.0% |
| Polish | 9,015 | 1.3% |
| Portuguese | 623 | 0.1% |
| Potawatomi | 122 | 0.0% |
| Pueblo | 12 | 0.0% |
| Puerto Rican | 2,601 | 0.4% |
| Romanian | 138 | 0.0% |
| Russian | 2,252 | 0.3% |
| Salvadoran | 3,432 | 0.5% |
| Samoan | 1,964 | 0.3% |
| Scandinavian | 2,037 | 0.3% |
| Scotch-Irish | 6,838 | 1.0% |
| Scottish | 12,055 | 1.7% |
| Seminole | 131 | 0.0% |
| Serbian | 77 | 0.0% |
| Shoshone | 29 | 0.0% |
| Sierra Leonean | 167 | 0.0% |
| Sioux | 509 | 0.1% |
| Slavic | 215 | 0.0% |
| Slovak | 545 | 0.1% |
| Slovene | 119 | 0.0% |
| Somali | 669 | 0.1% |
| South African | 110 | 0.0% |
| South American | 2,021 | 0.3% |
| South American Indian | 20 | 0.0% |
| Spaniard | 676 | 0.1% |
| Spanish | 1,368 | 0.2% |
| Spanish American | 23 | 0.0% |
| Sri Lankan | 2,811 | 0.4% |
| Subsaharan African | 7,514 | 1.1% |
| Sudanese | 113 | 0.0% |
| Swedish | 7,441 | 1.0% |
| Swiss | 1,580 | 0.2% |
| Syrian | 532 | 0.1% |
| Thai | 3,397 | 0.5% |
| Tlingit-Haida | 5 | 0.0% |
| Trinidadian and Tobagonian | 158 | 0.0% |
| Turkish | 178 | 0.0% |
| U.S. Virgin Islander | 9 | 0.0% |
| Ugandan | 265 | 0.0% |
| Ukrainian | 798 | 0.1% |
| Uruguayan | 24 | 0.0% |
| Ute | 5 | 0.0% |
| Venezuelan | 294 | 0.0% |
| Vietnamese | 150 | 0.0% |
| Welsh | 4,849 | 0.7% |
| West Indian | 41 | 0.0% |
| Yaqui | 10 | 0.0% |
| Yugoslavian | 96 | 0.0% |
| Zimbabwean | 21 | 0.0% | View All 171 Rows |
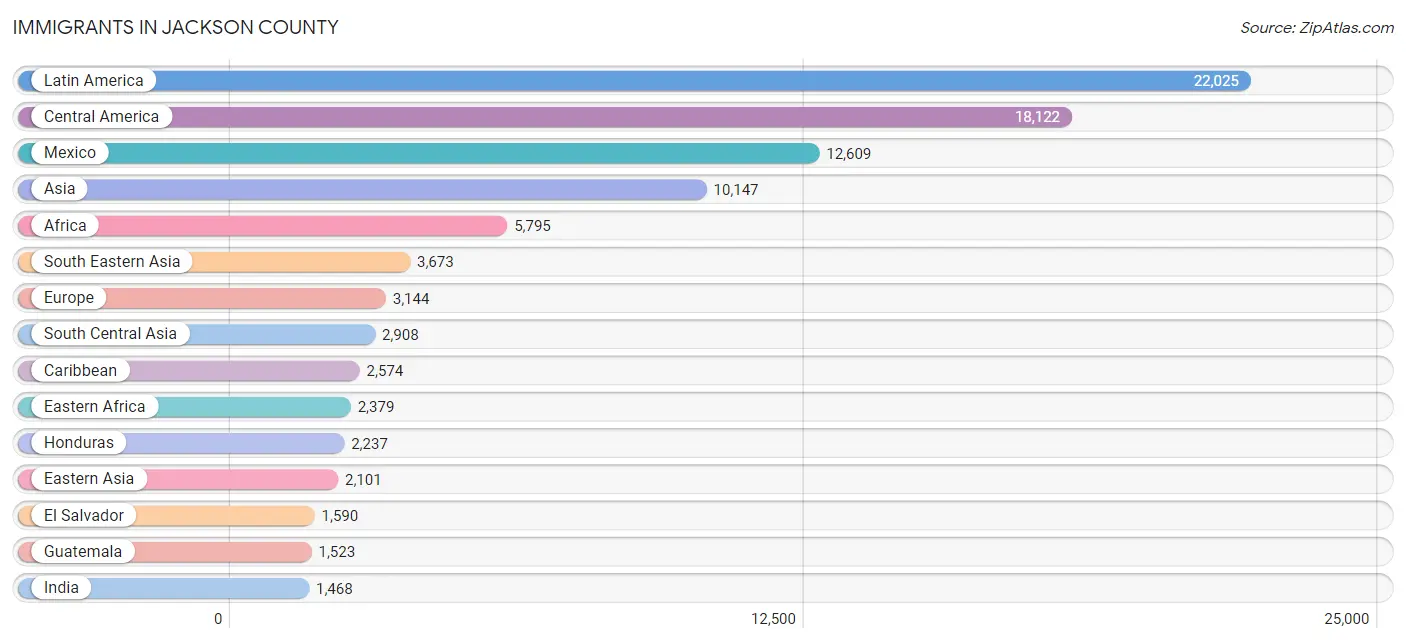
Immigrants in Jackson County
The most numerous immigrant groups reported in Jackson County came from Latin America (22,025 | 3.1%), Central America (18,122 | 2.5%), Mexico (12,609 | 1.8%), Asia (10,147 | 1.4%), and Africa (5,795 | 0.8%), together accounting for 9.6% of all Jackson County residents.
| Immigration Origin | # Population | % Population |
| Afghanistan | 60 | 0.0% |
| Africa | 5,795 | 0.8% |
| Argentina | 41 | 0.0% |
| Asia | 10,147 | 1.4% |
| Australia | 252 | 0.0% |
| Austria | 49 | 0.0% |
| Bahamas | 63 | 0.0% |
| Bangladesh | 554 | 0.1% |
| Belarus | 37 | 0.0% |
| Belgium | 9 | 0.0% |
| Belize | 5 | 0.0% |
| Bolivia | 58 | 0.0% |
| Bosnia and Herzegovina | 181 | 0.0% |
| Brazil | 168 | 0.0% |
| Bulgaria | 17 | 0.0% |
| Cambodia | 91 | 0.0% |
| Cameroon | 48 | 0.0% |
| Canada | 682 | 0.1% |
| Caribbean | 2,574 | 0.4% |
| Central America | 18,122 | 2.5% |
| Chile | 85 | 0.0% |
| China | 1,125 | 0.2% |
| Colombia | 408 | 0.1% |
| Congo | 305 | 0.0% |
| Costa Rica | 17 | 0.0% |
| Croatia | 19 | 0.0% |
| Cuba | 1,151 | 0.2% |
| Czechoslovakia | 57 | 0.0% |
| Dominican Republic | 246 | 0.0% |
| Eastern Africa | 2,379 | 0.3% |
| Eastern Asia | 2,101 | 0.3% |
| Eastern Europe | 940 | 0.1% |
| Ecuador | 87 | 0.0% |
| Egypt | 345 | 0.1% |
| El Salvador | 1,590 | 0.2% |
| England | 202 | 0.0% |
| Eritrea | 10 | 0.0% |
| Ethiopia | 312 | 0.0% |
| Europe | 3,144 | 0.4% |
| Fiji | 20 | 0.0% |
| France | 74 | 0.0% |
| Germany | 753 | 0.1% |
| Ghana | 53 | 0.0% |
| Greece | 16 | 0.0% |
| Guatemala | 1,523 | 0.2% |
| Guyana | 60 | 0.0% |
| Haiti | 194 | 0.0% |
| Honduras | 2,237 | 0.3% |
| Hong Kong | 96 | 0.0% |
| Hungary | 22 | 0.0% |
| India | 1,468 | 0.2% |
| Indonesia | 58 | 0.0% |
| Iran | 238 | 0.0% |
| Iraq | 317 | 0.0% |
| Ireland | 127 | 0.0% |
| Israel | 8 | 0.0% |
| Italy | 204 | 0.0% |
| Jamaica | 820 | 0.1% |
| Japan | 131 | 0.0% |
| Jordan | 186 | 0.0% |
| Kazakhstan | 22 | 0.0% |
| Kenya | 1,061 | 0.2% |
| Korea | 845 | 0.1% |
| Kuwait | 132 | 0.0% |
| Laos | 89 | 0.0% |
| Latin America | 22,025 | 3.1% |
| Latvia | 17 | 0.0% |
| Lebanon | 40 | 0.0% |
| Liberia | 118 | 0.0% |
| Lithuania | 18 | 0.0% |
| Malaysia | 131 | 0.0% |
| Mexico | 12,609 | 1.8% |
| Micronesia | 95 | 0.0% |
| Middle Africa | 908 | 0.1% |
| Moldova | 46 | 0.0% |
| Morocco | 255 | 0.0% |
| Nepal | 46 | 0.0% |
| Netherlands | 62 | 0.0% |
| Nicaragua | 76 | 0.0% |
| Nigeria | 754 | 0.1% |
| Northern Africa | 727 | 0.1% |
| Northern Europe | 831 | 0.1% |
| Oceania | 824 | 0.1% |
| Pakistan | 460 | 0.1% |
| Panama | 28 | 0.0% |
| Peru | 185 | 0.0% |
| Philippines | 1,305 | 0.2% |
| Poland | 129 | 0.0% |
| Portugal | 40 | 0.0% |
| Romania | 45 | 0.0% |
| Russia | 103 | 0.0% |
| Saudi Arabia | 104 | 0.0% |
| Scotland | 94 | 0.0% |
| Senegal | 30 | 0.0% |
| Serbia | 50 | 0.0% |
| Sierra Leone | 126 | 0.0% |
| Somalia | 601 | 0.1% |
| South Africa | 117 | 0.0% |
| South America | 1,329 | 0.2% |
| South Central Asia | 2,908 | 0.4% |
| South Eastern Asia | 3,673 | 0.5% |
| Southern Europe | 403 | 0.1% |
| Spain | 143 | 0.0% |
| Sri Lanka | 17 | 0.0% |
| Sudan | 106 | 0.0% |
| Switzerland | 23 | 0.0% |
| Syria | 285 | 0.0% |
| Taiwan | 187 | 0.0% |
| Thailand | 400 | 0.1% |
| Trinidad and Tobago | 57 | 0.0% |
| Turkey | 90 | 0.0% |
| Uganda | 92 | 0.0% |
| Ukraine | 135 | 0.0% |
| Uruguay | 24 | 0.0% |
| Venezuela | 213 | 0.0% |
| Vietnam | 1,284 | 0.2% |
| West Indies | 6 | 0.0% |
| Western Africa | 1,101 | 0.2% |
| Western Asia | 1,358 | 0.2% |
| Western Europe | 970 | 0.1% |
| Yemen | 71 | 0.0% |
| Zaire | 555 | 0.1% |
| Zimbabwe | 88 | 0.0% | View All 123 Rows |
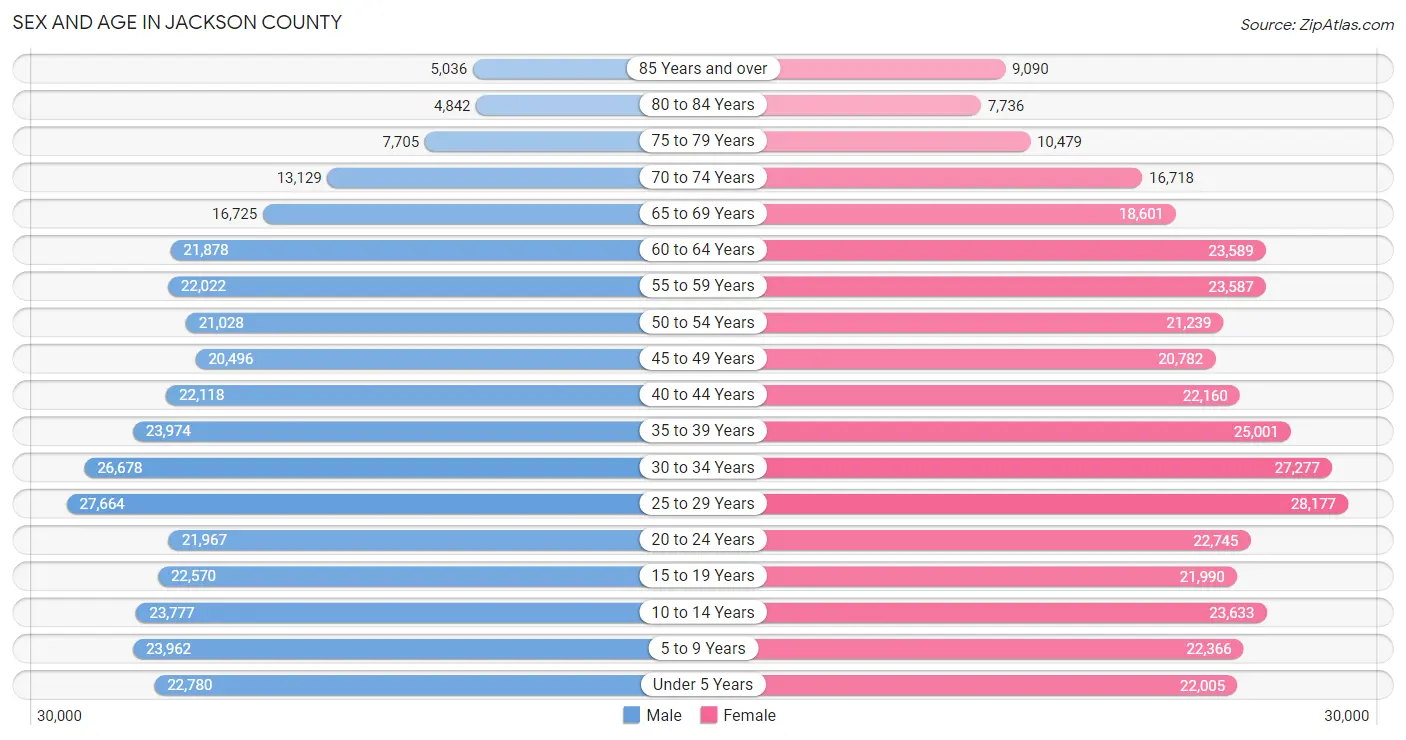
Sex and Age in Jackson County
Sex and Age in Jackson County
The most populous age groups in Jackson County are 25 to 29 Years (27,664 | 7.9%) for men and 25 to 29 Years (28,177 | 7.7%) for women.
| Age Bracket | Male | Female |
| Under 5 Years | 22,780 (6.5%) | 22,005 (6.0%) |
| 5 to 9 Years | 23,962 (6.9%) | 22,366 (6.1%) |
| 10 to 14 Years | 23,777 (6.8%) | 23,633 (6.4%) |
| 15 to 19 Years | 22,570 (6.5%) | 21,990 (6.0%) |
| 20 to 24 Years | 21,967 (6.3%) | 22,745 (6.2%) |
| 25 to 29 Years | 27,664 (7.9%) | 28,177 (7.7%) |
| 30 to 34 Years | 26,678 (7.7%) | 27,277 (7.4%) |
| 35 to 39 Years | 23,974 (6.9%) | 25,001 (6.8%) |
| 40 to 44 Years | 22,118 (6.4%) | 22,160 (6.0%) |
| 45 to 49 Years | 20,496 (5.9%) | 20,782 (5.7%) |
| 50 to 54 Years | 21,028 (6.0%) | 21,239 (5.8%) |
| 55 to 59 Years | 22,022 (6.3%) | 23,587 (6.4%) |
| 60 to 64 Years | 21,878 (6.3%) | 23,589 (6.4%) |
| 65 to 69 Years | 16,725 (4.8%) | 18,601 (5.1%) |
| 70 to 74 Years | 13,129 (3.8%) | 16,718 (4.5%) |
| 75 to 79 Years | 7,705 (2.2%) | 10,479 (2.9%) |
| 80 to 84 Years | 4,842 (1.4%) | 7,736 (2.1%) |
| 85 Years and over | 5,036 (1.5%) | 9,090 (2.5%) |
| Total | 348,351 (100.0%) | 367,175 (100.0%) |
Families and Households in Jackson County
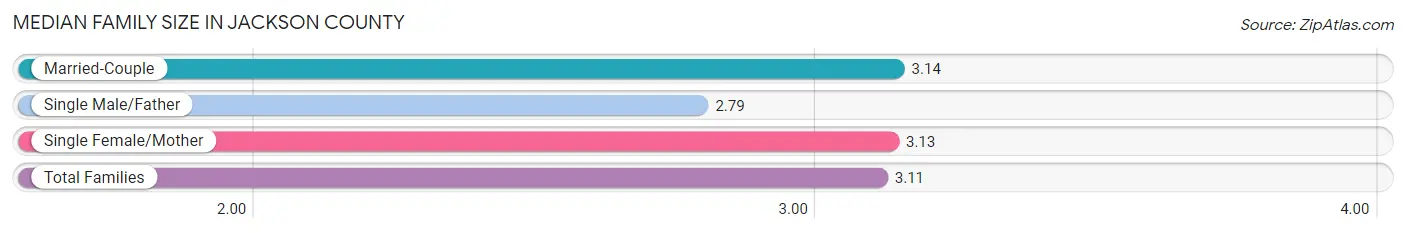
Median Family Size in Jackson County
The median family size in Jackson County is 3.11 persons per family, with married-couple families (116,615 | 68.7%) accounting for the largest median family size of 3.14 persons per family. On the other hand, single male/father families (12,870 | 7.6%) represent the smallest median family size with 2.79 persons per family.
| Family Type | # Families | Family Size |
| Married-Couple | 116,615 (68.7%) | 3.14 |
| Single Male/Father | 12,870 (7.6%) | 2.79 |
| Single Female/Mother | 40,364 (23.8%) | 3.13 |
| Total Families | 169,849 (100.0%) | 3.11 |
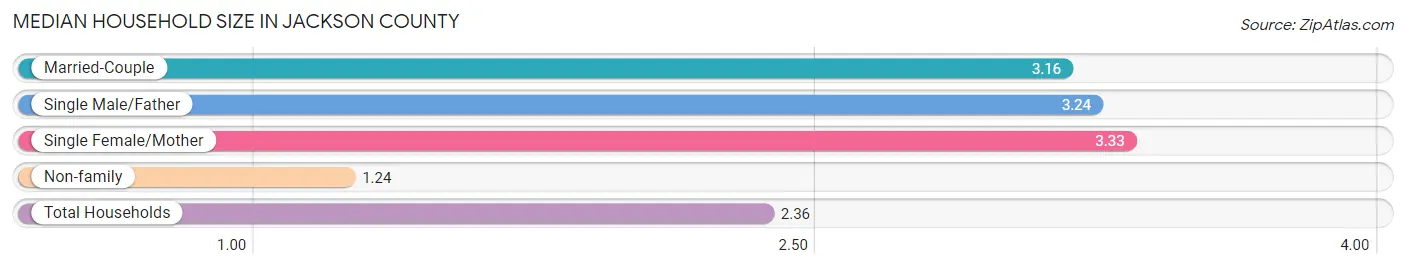
Median Household Size in Jackson County
The median household size in Jackson County is 2.36 persons per household, with single female/mother households (40,364 | 13.5%) accounting for the largest median household size of 3.33 persons per household. non-family households (129,059 | 43.2%) represent the smallest median household size with 1.24 persons per household.
| Household Type | # Households | Household Size |
| Married-Couple | 116,615 (39.0%) | 3.16 |
| Single Male/Father | 12,870 (4.3%) | 3.24 |
| Single Female/Mother | 40,364 (13.5%) | 3.33 |
| Non-family | 129,059 (43.2%) | 1.24 |
| Total Households | 298,908 (100.0%) | 2.36 |
Household Size by Marriage Status in Jackson County
Out of a total of 298,908 households in Jackson County, 169,849 (56.8%) are family households, while 129,059 (43.2%) are nonfamily households. The most numerous type of family households are 2-person households, comprising 75,924, and the most common type of nonfamily households are 1-person households, comprising 105,342.
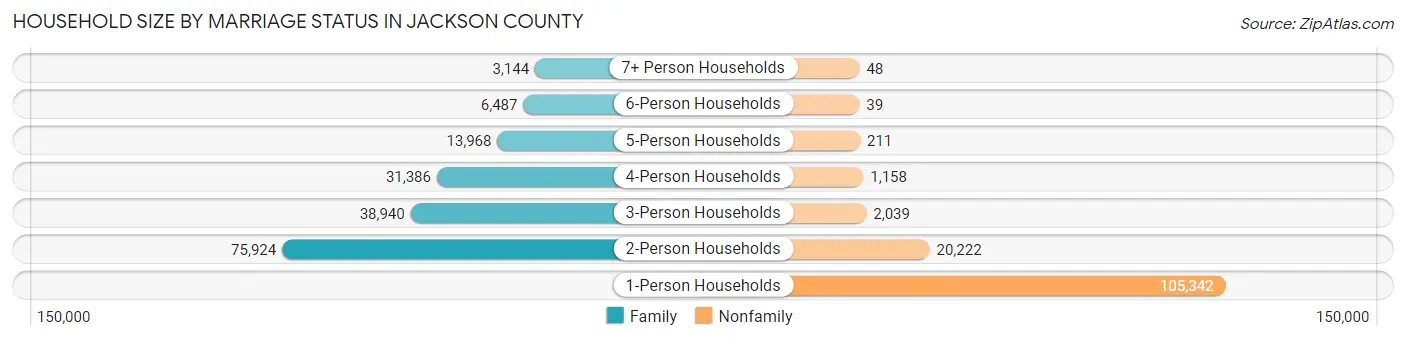
| Household Size | Family Households | Nonfamily Households |
| 1-Person Households | - | 105,342 (35.2%) |
| 2-Person Households | 75,924 (25.4%) | 20,222 (6.8%) |
| 3-Person Households | 38,940 (13.0%) | 2,039 (0.7%) |
| 4-Person Households | 31,386 (10.5%) | 1,158 (0.4%) |
| 5-Person Households | 13,968 (4.7%) | 211 (0.1%) |
| 6-Person Households | 6,487 (2.2%) | 39 (0.0%) |
| 7+ Person Households | 3,144 (1.1%) | 48 (0.0%) |
| Total | 169,849 (56.8%) | 129,059 (43.2%) |
Female Fertility in Jackson County
Fertility by Age in Jackson County
Average fertility rate in Jackson County is 49.0 births per 1,000 women. Women in the age bracket of 20 to 34 years have the highest fertility rate with 82.0 births per 1,000 women. Women in the age bracket of 20 to 34 years acount for 75.2% of all women with births.
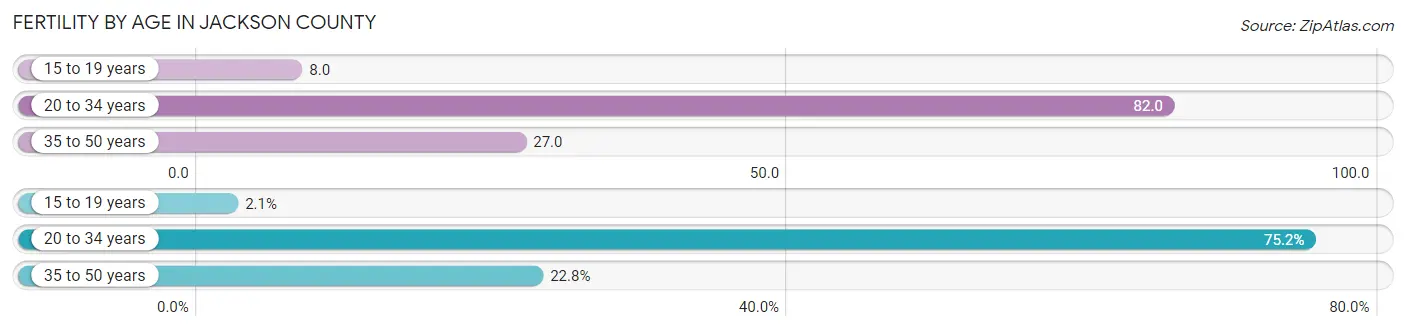
| Age Bracket | Women with Births | Births / 1,000 Women |
| 15 to 19 years | 174 (2.1%) | 8.0 |
| 20 to 34 years | 6,376 (75.2%) | 82.0 |
| 35 to 50 years | 1,929 (22.8%) | 27.0 |
| Total | 8,479 (100.0%) | 49.0 |
Fertility by Age by Marriage Status in Jackson County
67.1% of women with births (8,479) in Jackson County are married. The highest percentage of unmarried women with births falls into 15 to 19 years age bracket with 82.8% of them unmarried at the time of birth, while the lowest percentage of unmarried women with births belong to 35 to 50 years age bracket with 23.4% of them unmarried.
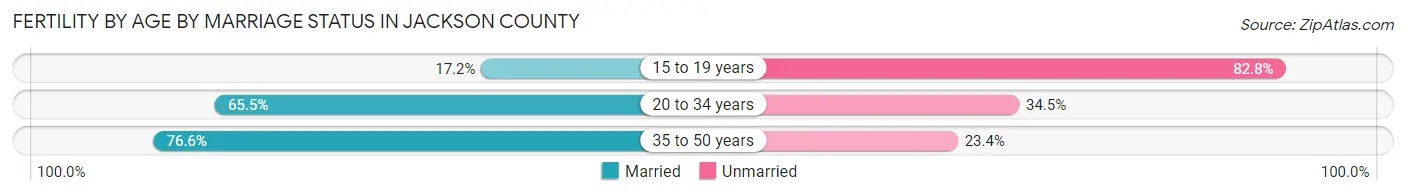
| Age Bracket | Married | Unmarried |
| 15 to 19 years | 30 (17.2%) | 144 (82.8%) |
| 20 to 34 years | 4,176 (65.5%) | 2,200 (34.5%) |
| 35 to 50 years | 1,478 (76.6%) | 451 (23.4%) |
| Total | 5,689 (67.1%) | 2,790 (32.9%) |
Fertility by Education in Jackson County
Average fertility rate in Jackson County is 49.0 births per 1,000 women. Women with the education attainment of bachelor's degree have the highest fertility rate of 64.0 births per 1,000 women, while women with the education attainment of less than high school have the lowest fertility at 36.0 births per 1,000 women. Women with the education attainment of college or associate's degree represent 27.2% of all women with births.
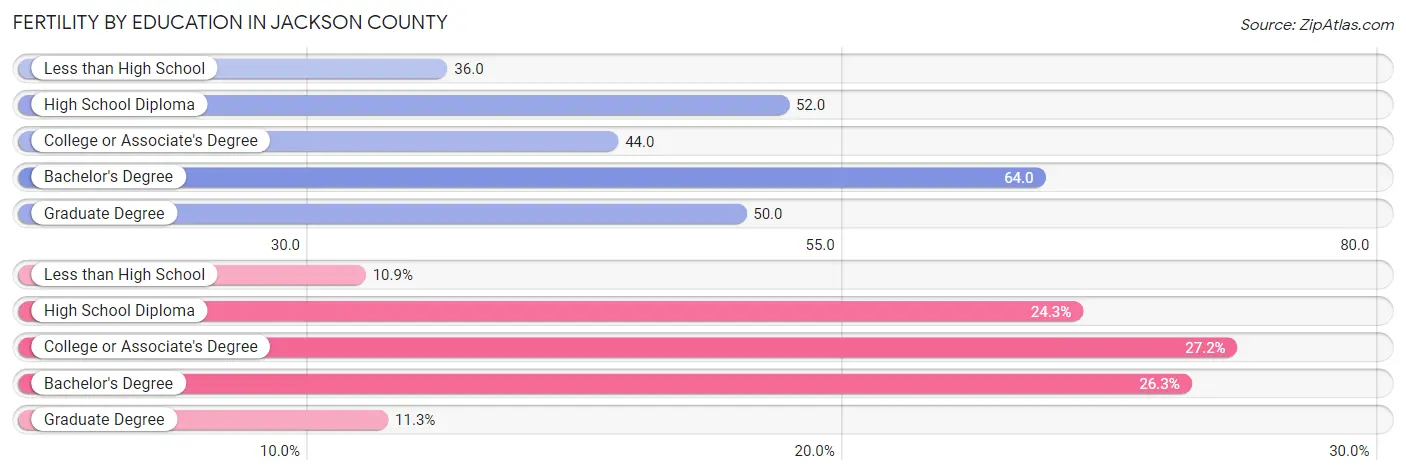
| Educational Attainment | Women with Births | Births / 1,000 Women |
| Less than High School | 922 (10.9%) | 36.0 |
| High School Diploma | 2,061 (24.3%) | 52.0 |
| College or Associate's Degree | 2,306 (27.2%) | 44.0 |
| Bachelor's Degree | 2,233 (26.3%) | 64.0 |
| Graduate Degree | 957 (11.3%) | 50.0 |
| Total | 8,479 (100.0%) | 49.0 |
Fertility by Education by Marriage Status in Jackson County
32.9% of women with births in Jackson County are unmarried. Women with the educational attainment of graduate degree are most likely to be married with 97.0% of them married at childbirth, while women with the educational attainment of high school diploma are least likely to be married with 52.0% of them unmarried at childbirth.
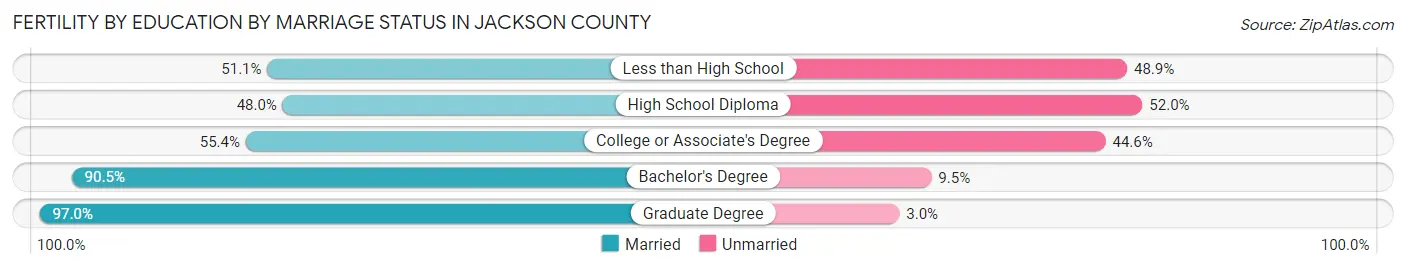
| Educational Attainment | Married | Unmarried |
| Less than High School | 471 (51.1%) | 451 (48.9%) |
| High School Diploma | 989 (48.0%) | 1,072 (52.0%) |
| College or Associate's Degree | 1,278 (55.4%) | 1,028 (44.6%) |
| Bachelor's Degree | 2,021 (90.5%) | 212 (9.5%) |
| Graduate Degree | 928 (97.0%) | 29 (3.0%) |
| Total | 5,689 (67.1%) | 2,790 (32.9%) |
Employment Characteristics in Jackson County
Employment by Class of Employer in Jackson County
Among the 355,790 employed individuals in Jackson County, private company employees (252,166 | 70.9%), not-for-profit organizations (32,717 | 9.2%), and local government employees (19,664 | 5.5%) make up the most common classes of employment.
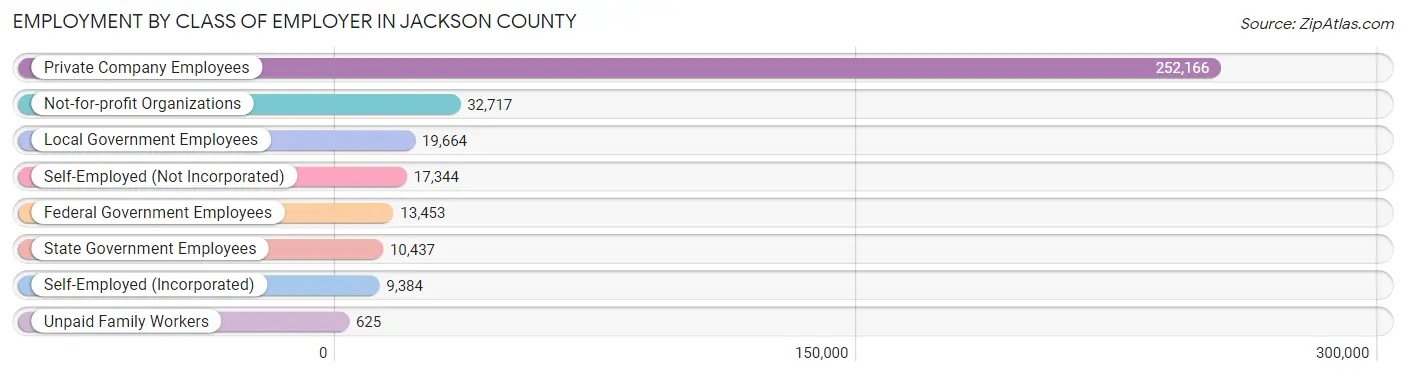
| Employer Class | # Employees | % Employees |
| Private Company Employees | 252,166 | 70.9% |
| Self-Employed (Incorporated) | 9,384 | 2.6% |
| Self-Employed (Not Incorporated) | 17,344 | 4.9% |
| Not-for-profit Organizations | 32,717 | 9.2% |
| Local Government Employees | 19,664 | 5.5% |
| State Government Employees | 10,437 | 2.9% |
| Federal Government Employees | 13,453 | 3.8% |
| Unpaid Family Workers | 625 | 0.2% |
| Total | 355,790 | 100.0% |
Employment Status by Age in Jackson County
According to the labor force statistics for Jackson County, out of the total population over 16 years of age (567,568), 67.1% or 380,838 individuals are in the labor force, with 4.9% or 18,661 of them unemployed. The age group with the highest labor force participation rate is 25 to 29 years, with 87.9% or 49,084 individuals in the labor force. Within the labor force, the 16 to 19 years age range has the highest percentage of unemployed individuals, with 12.1% or 1,887 of them being unemployed.
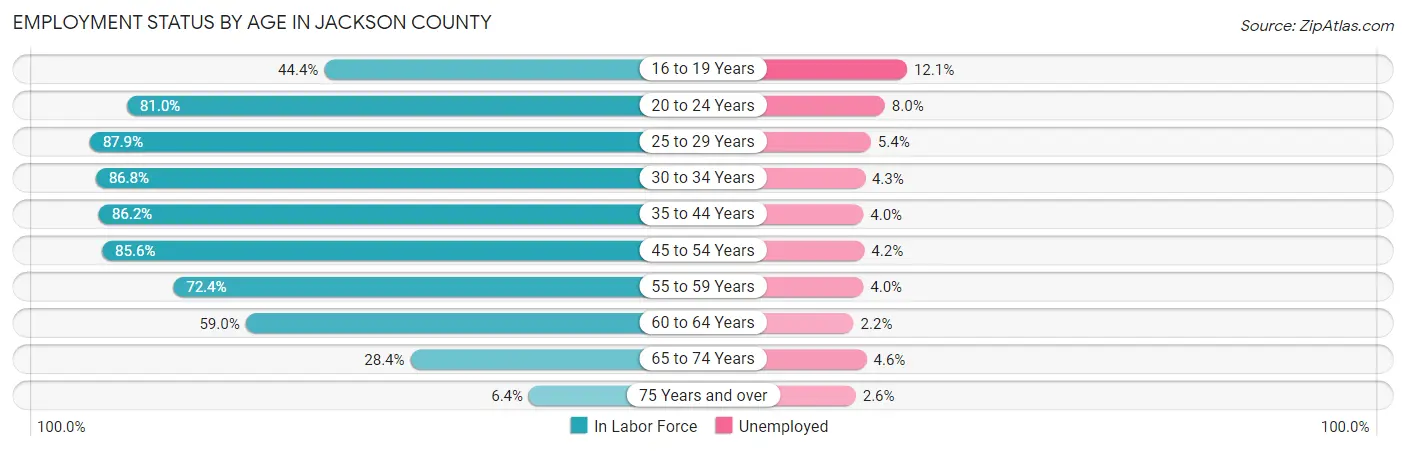
| Age Bracket | In Labor Force | Unemployed |
| 16 to 19 Years | 15,596 (44.4%) | 1,887 (12.1%) |
| 20 to 24 Years | 36,217 (81.0%) | 2,897 (8.0%) |
| 25 to 29 Years | 49,084 (87.9%) | 2,651 (5.4%) |
| 30 to 34 Years | 46,833 (86.8%) | 2,014 (4.3%) |
| 35 to 44 Years | 80,384 (86.2%) | 3,215 (4.0%) |
| 45 to 54 Years | 71,515 (85.6%) | 3,004 (4.2%) |
| 55 to 59 Years | 33,021 (72.4%) | 1,321 (4.0%) |
| 60 to 64 Years | 26,826 (59.0%) | 590 (2.2%) |
| 65 to 74 Years | 18,509 (28.4%) | 851 (4.6%) |
| 75 Years and over | 2,873 (6.4%) | 75 (2.6%) |
| Total | 380,838 (67.1%) | 18,661 (4.9%) |
Employment Status by Educational Attainment in Jackson County
According to labor force statistics for Jackson County, 81.4% of individuals (307,423) out of the total population between 25 and 64 years of age (377,670) are in the labor force, with 4.2% or 12,912 of them being unemployed. The group with the highest labor force participation rate are those with the educational attainment of bachelor's degree or higher, with 89.6% or 117,092 individuals in the labor force. Within the labor force, individuals with less than high school education have the highest percentage of unemployment, with 8.6% or 1,584 of them being unemployed.
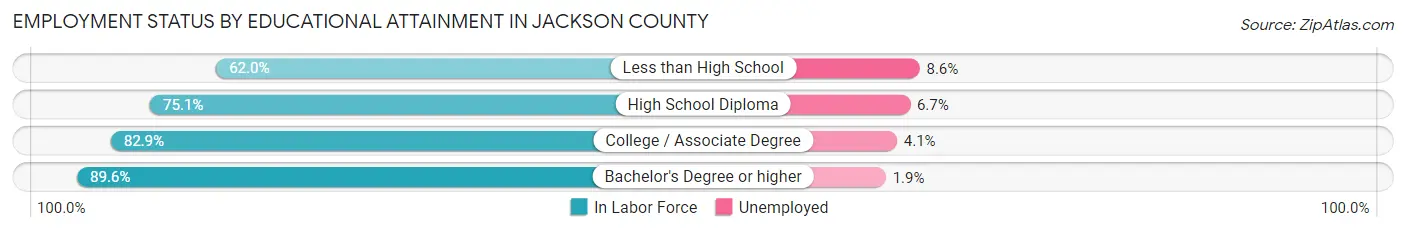
| Educational Attainment | In Labor Force | Unemployed |
| Less than High School | 18,415 (62.0%) | 2,554 (8.6%) |
| High School Diploma | 76,471 (75.1%) | 6,822 (6.7%) |
| College / Associate Degree | 95,716 (82.9%) | 4,734 (4.1%) |
| Bachelor's Degree or higher | 117,092 (89.6%) | 2,483 (1.9%) |
| Total | 307,423 (81.4%) | 15,862 (4.2%) |
Employment Occupations by Sex in Jackson County
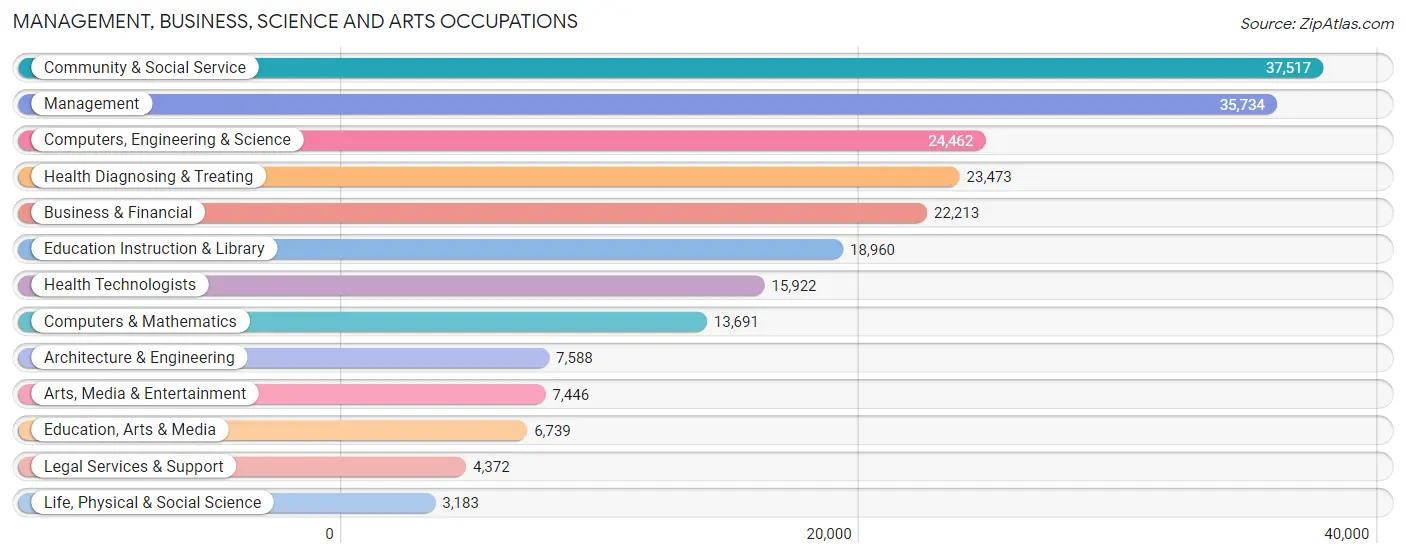
Management, Business, Science and Arts Occupations
The most common Management, Business, Science and Arts occupations in Jackson County are Community & Social Service (37,517 | 10.4%), Management (35,734 | 9.9%), Computers, Engineering & Science (24,462 | 6.8%), Health Diagnosing & Treating (23,473 | 6.5%), and Business & Financial (22,213 | 6.1%).
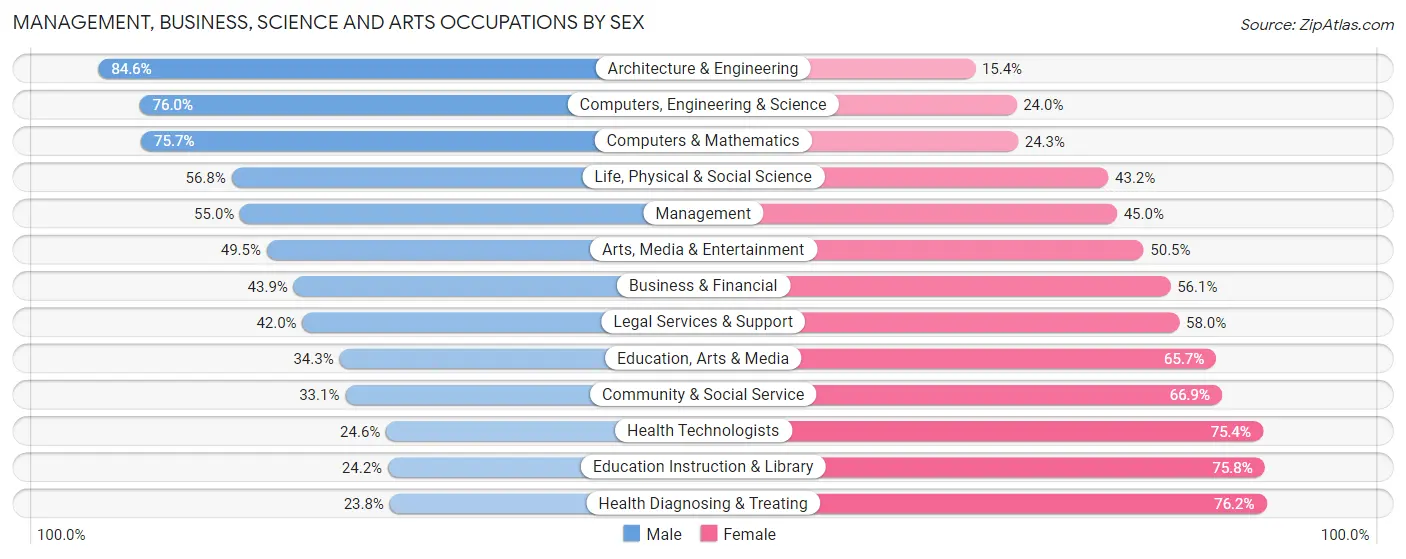
Management, Business, Science and Arts Occupations by Sex
Within the Management, Business, Science and Arts occupations in Jackson County, the most male-oriented occupations are Architecture & Engineering (84.6%), Computers, Engineering & Science (76.0%), and Computers & Mathematics (75.7%), while the most female-oriented occupations are Health Diagnosing & Treating (76.2%), Education Instruction & Library (75.8%), and Health Technologists (75.4%).
| Occupation | Male | Female |
| Management | 19,663 (55.0%) | 16,071 (45.0%) |
| Business & Financial | 9,744 (43.9%) | 12,469 (56.1%) |
| Computers, Engineering & Science | 18,591 (76.0%) | 5,871 (24.0%) |
| Computers & Mathematics | 10,362 (75.7%) | 3,329 (24.3%) |
| Architecture & Engineering | 6,420 (84.6%) | 1,168 (15.4%) |
| Life, Physical & Social Science | 1,809 (56.8%) | 1,374 (43.2%) |
| Community & Social Service | 12,425 (33.1%) | 25,092 (66.9%) |
| Education, Arts & Media | 2,312 (34.3%) | 4,427 (65.7%) |
| Legal Services & Support | 1,838 (42.0%) | 2,534 (58.0%) |
| Education Instruction & Library | 4,591 (24.2%) | 14,369 (75.8%) |
| Arts, Media & Entertainment | 3,684 (49.5%) | 3,762 (50.5%) |
| Health Diagnosing & Treating | 5,595 (23.8%) | 17,878 (76.2%) |
| Health Technologists | 3,913 (24.6%) | 12,009 (75.4%) |
| Total (Category) | 66,018 (46.0%) | 77,381 (54.0%) |
| Total (Overall) | 185,670 (51.4%) | 175,786 (48.6%) |
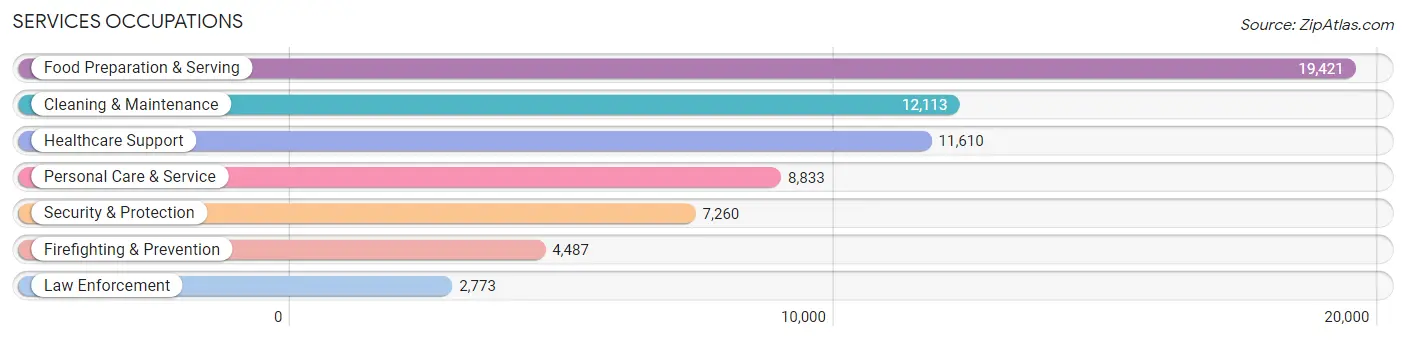
Services Occupations
The most common Services occupations in Jackson County are Food Preparation & Serving (19,421 | 5.4%), Cleaning & Maintenance (12,113 | 3.4%), Healthcare Support (11,610 | 3.2%), Personal Care & Service (8,833 | 2.4%), and Security & Protection (7,260 | 2.0%).
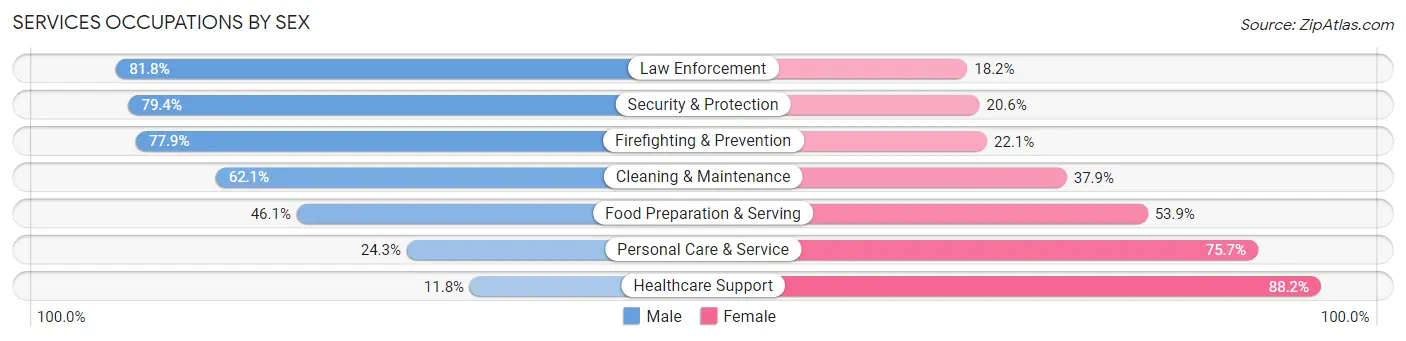
Services Occupations by Sex
Within the Services occupations in Jackson County, the most male-oriented occupations are Law Enforcement (81.8%), Security & Protection (79.4%), and Firefighting & Prevention (77.9%), while the most female-oriented occupations are Healthcare Support (88.2%), Personal Care & Service (75.7%), and Food Preparation & Serving (53.9%).
| Occupation | Male | Female |
| Healthcare Support | 1,372 (11.8%) | 10,238 (88.2%) |
| Security & Protection | 5,765 (79.4%) | 1,495 (20.6%) |
| Firefighting & Prevention | 3,496 (77.9%) | 991 (22.1%) |
| Law Enforcement | 2,269 (81.8%) | 504 (18.2%) |
| Food Preparation & Serving | 8,955 (46.1%) | 10,466 (53.9%) |
| Cleaning & Maintenance | 7,526 (62.1%) | 4,587 (37.9%) |
| Personal Care & Service | 2,148 (24.3%) | 6,685 (75.7%) |
| Total (Category) | 25,766 (43.5%) | 33,471 (56.5%) |
| Total (Overall) | 185,670 (51.4%) | 175,786 (48.6%) |
Sales and Office Occupations
The most common Sales and Office occupations in Jackson County are Office & Administration (43,764 | 12.1%), and Sales & Related (34,653 | 9.6%).

Sales and Office Occupations by Sex
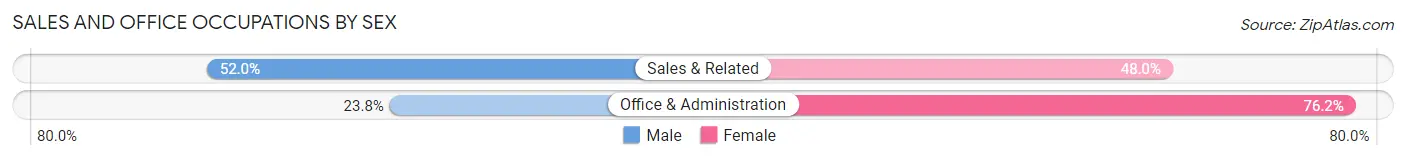
| Occupation | Male | Female |
| Sales & Related | 18,007 (52.0%) | 16,646 (48.0%) |
| Office & Administration | 10,434 (23.8%) | 33,330 (76.2%) |
| Total (Category) | 28,441 (36.3%) | 49,976 (63.7%) |
| Total (Overall) | 185,670 (51.4%) | 175,786 (48.6%) |
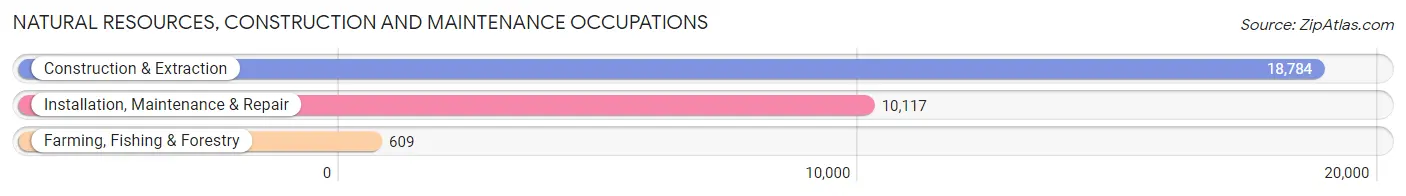
Natural Resources, Construction and Maintenance Occupations
The most common Natural Resources, Construction and Maintenance occupations in Jackson County are Construction & Extraction (18,784 | 5.2%), Installation, Maintenance & Repair (10,117 | 2.8%), and Farming, Fishing & Forestry (609 | 0.2%).
Natural Resources, Construction and Maintenance Occupations by Sex
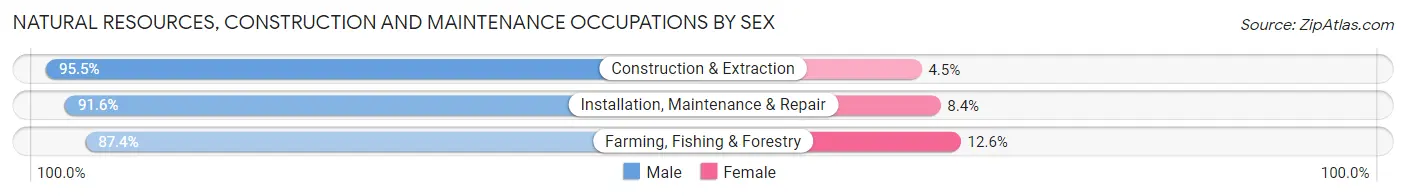
| Occupation | Male | Female |
| Farming, Fishing & Forestry | 532 (87.4%) | 77 (12.6%) |
| Construction & Extraction | 17,941 (95.5%) | 843 (4.5%) |
| Installation, Maintenance & Repair | 9,265 (91.6%) | 852 (8.4%) |
| Total (Category) | 27,738 (94.0%) | 1,772 (6.0%) |
| Total (Overall) | 185,670 (51.4%) | 175,786 (48.6%) |
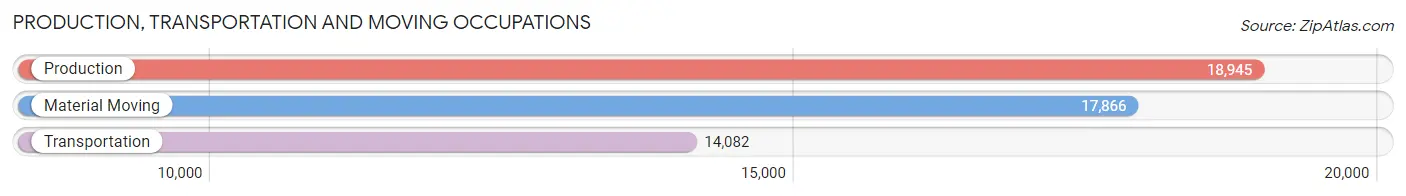
Production, Transportation and Moving Occupations
The most common Production, Transportation and Moving occupations in Jackson County are Production (18,945 | 5.2%), Material Moving (17,866 | 4.9%), and Transportation (14,082 | 3.9%).
Production, Transportation and Moving Occupations by Sex
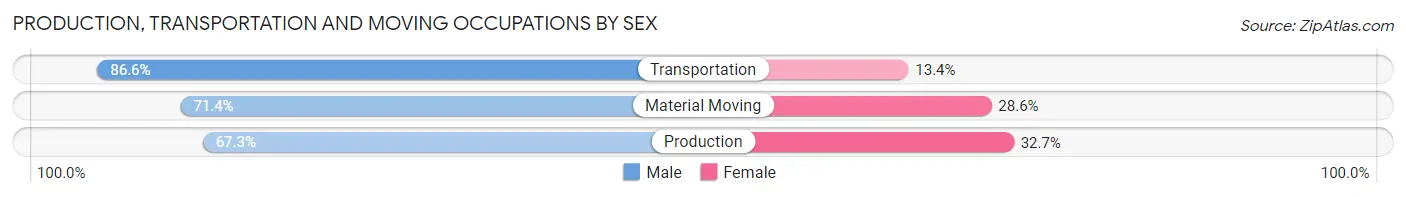
| Occupation | Male | Female |
| Production | 12,751 (67.3%) | 6,194 (32.7%) |
| Transportation | 12,200 (86.6%) | 1,882 (13.4%) |
| Material Moving | 12,756 (71.4%) | 5,110 (28.6%) |
| Total (Category) | 37,707 (74.1%) | 13,186 (25.9%) |
| Total (Overall) | 185,670 (51.4%) | 175,786 (48.6%) |
Employment Industries by Sex in Jackson County
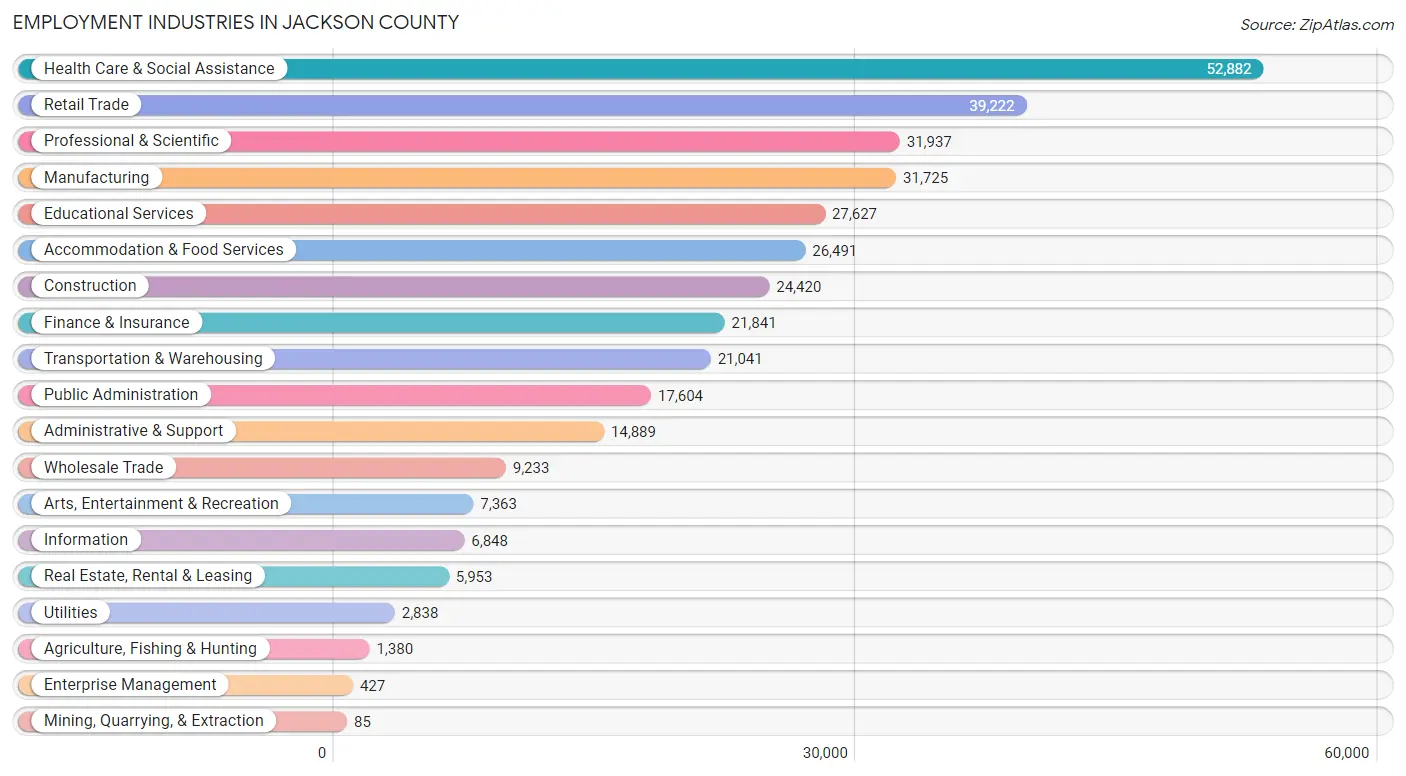
Employment Industries in Jackson County
The major employment industries in Jackson County include Health Care & Social Assistance (52,882 | 14.6%), Retail Trade (39,222 | 10.8%), Professional & Scientific (31,937 | 8.8%), Manufacturing (31,725 | 8.8%), and Educational Services (27,627 | 7.6%).
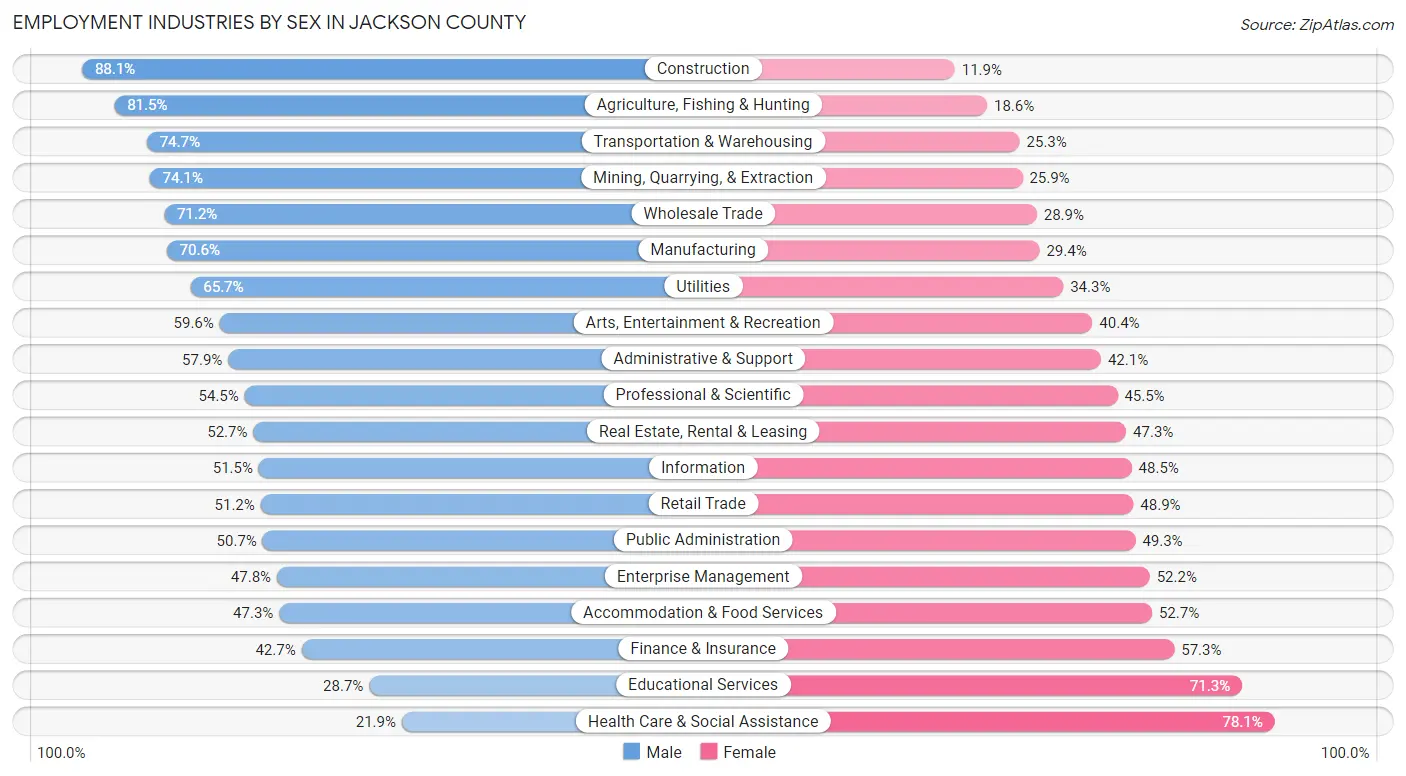
Employment Industries by Sex in Jackson County
The Jackson County industries that see more men than women are Construction (88.1%), Agriculture, Fishing & Hunting (81.5%), and Transportation & Warehousing (74.7%), whereas the industries that tend to have a higher number of women are Health Care & Social Assistance (78.1%), Educational Services (71.3%), and Finance & Insurance (57.3%).
| Industry | Male | Female |
| Agriculture, Fishing & Hunting | 1,124 (81.5%) | 256 (18.5%) |
| Mining, Quarrying, & Extraction | 63 (74.1%) | 22 (25.9%) |
| Construction | 21,519 (88.1%) | 2,901 (11.9%) |
| Manufacturing | 22,396 (70.6%) | 9,329 (29.4%) |
| Wholesale Trade | 6,569 (71.2%) | 2,664 (28.8%) |
| Retail Trade | 20,064 (51.1%) | 19,158 (48.8%) |
| Transportation & Warehousing | 15,719 (74.7%) | 5,322 (25.3%) |
| Utilities | 1,864 (65.7%) | 974 (34.3%) |
| Information | 3,528 (51.5%) | 3,320 (48.5%) |
| Finance & Insurance | 9,324 (42.7%) | 12,517 (57.3%) |
| Real Estate, Rental & Leasing | 3,135 (52.7%) | 2,818 (47.3%) |
| Professional & Scientific | 17,392 (54.5%) | 14,545 (45.5%) |
| Enterprise Management | 204 (47.8%) | 223 (52.2%) |
| Administrative & Support | 8,616 (57.9%) | 6,273 (42.1%) |
| Educational Services | 7,923 (28.7%) | 19,704 (71.3%) |
| Health Care & Social Assistance | 11,590 (21.9%) | 41,292 (78.1%) |
| Arts, Entertainment & Recreation | 4,391 (59.6%) | 2,972 (40.4%) |
| Accommodation & Food Services | 12,532 (47.3%) | 13,959 (52.7%) |
| Public Administration | 8,930 (50.7%) | 8,674 (49.3%) |
| Total | 185,670 (51.4%) | 175,786 (48.6%) |
Education in Jackson County
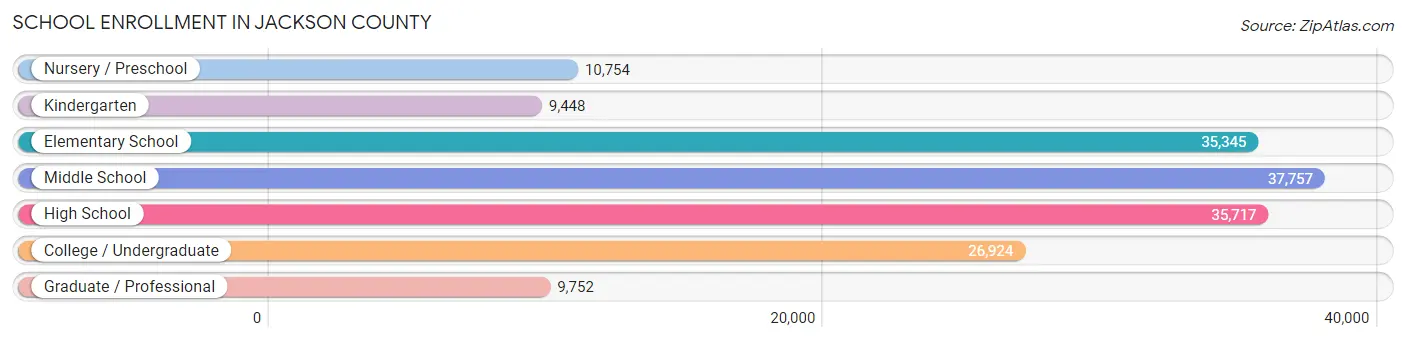
School Enrollment in Jackson County
The most common levels of schooling among the 165,697 students in Jackson County are middle school (37,757 | 22.8%), high school (35,717 | 21.6%), and elementary school (35,345 | 21.3%).
| School Level | # Students | % Students |
| Nursery / Preschool | 10,754 | 6.5% |
| Kindergarten | 9,448 | 5.7% |
| Elementary School | 35,345 | 21.3% |
| Middle School | 37,757 | 22.8% |
| High School | 35,717 | 21.6% |
| College / Undergraduate | 26,924 | 16.3% |
| Graduate / Professional | 9,752 | 5.9% |
| Total | 165,697 | 100.0% |
School Enrollment by Age by Funding Source in Jackson County
Out of a total of 165,697 students who are enrolled in schools in Jackson County, 27,174 (16.4%) attend a private institution, while the remaining 138,523 (83.6%) are enrolled in public schools. The age group of 3 to 4 year olds has the highest likelihood of being enrolled in private schools, with 2,960 (39.4% in the age bracket) enrolled. Conversely, the age group of 10 to 14 year olds has the lowest likelihood of being enrolled in a private school, with 40,767 (89.1% in the age bracket) attending a public institution.
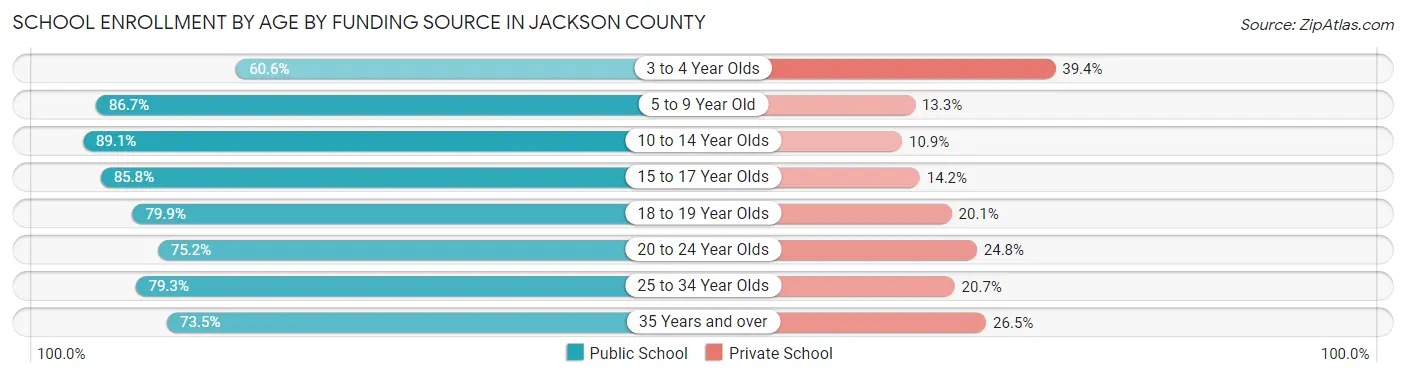
| Age Bracket | Public School | Private School |
| 3 to 4 Year Olds | 4,549 (60.6%) | 2,960 (39.4%) |
| 5 to 9 Year Old | 37,338 (86.7%) | 5,717 (13.3%) |
| 10 to 14 Year Olds | 40,767 (89.1%) | 4,973 (10.9%) |
| 15 to 17 Year Olds | 23,028 (85.8%) | 3,807 (14.2%) |
| 18 to 19 Year Olds | 9,232 (79.9%) | 2,322 (20.1%) |
| 20 to 24 Year Olds | 10,299 (75.2%) | 3,398 (24.8%) |
| 25 to 34 Year Olds | 8,062 (79.3%) | 2,100 (20.7%) |
| 35 Years and over | 5,249 (73.5%) | 1,896 (26.5%) |
| Total | 138,523 (83.6%) | 27,174 (16.4%) |
Educational Attainment by Field of Study in Jackson County
Business (37,564 | 21.4%), education (20,809 | 11.9%), science & technology (17,709 | 10.1%), arts & humanities (11,717 | 6.7%), and social sciences (11,566 | 6.6%) are the most common fields of study among 175,348 individuals in Jackson County who have obtained a bachelor's degree or higher.
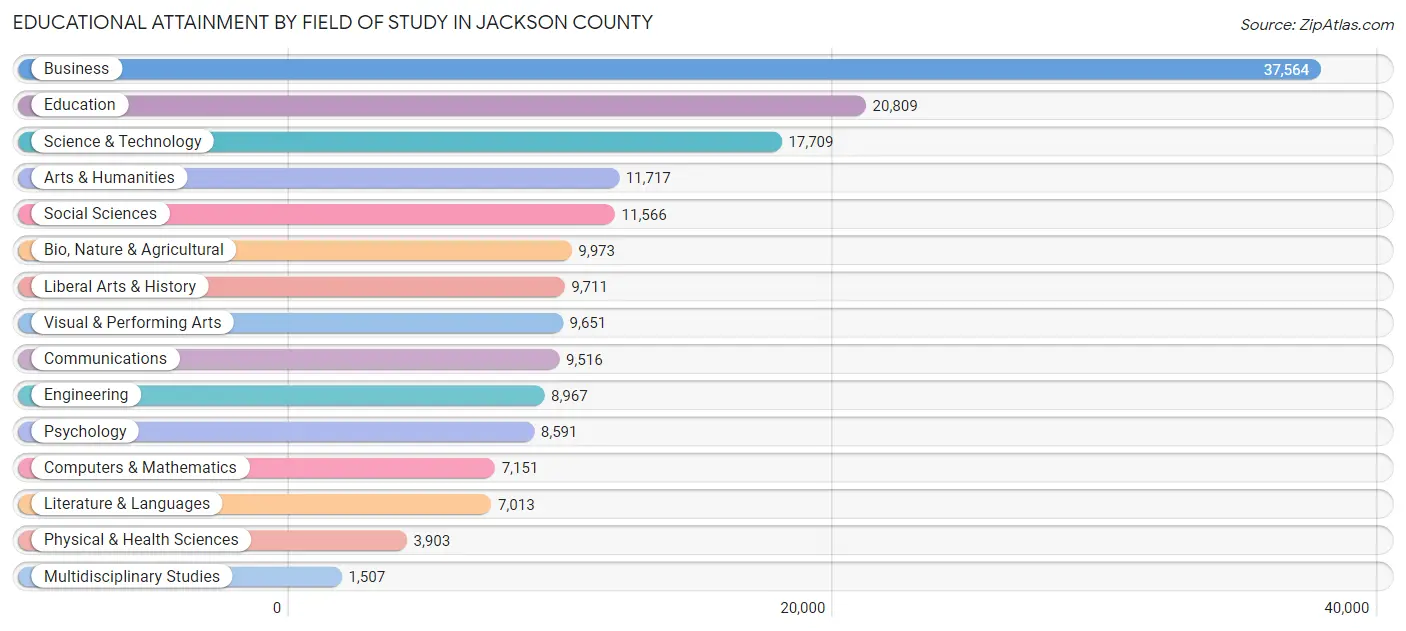
| Field of Study | # Graduates | % Graduates |
| Computers & Mathematics | 7,151 | 4.1% |
| Bio, Nature & Agricultural | 9,973 | 5.7% |
| Physical & Health Sciences | 3,903 | 2.2% |
| Psychology | 8,591 | 4.9% |
| Social Sciences | 11,566 | 6.6% |
| Engineering | 8,967 | 5.1% |
| Multidisciplinary Studies | 1,507 | 0.9% |
| Science & Technology | 17,709 | 10.1% |
| Business | 37,564 | 21.4% |
| Education | 20,809 | 11.9% |
| Literature & Languages | 7,013 | 4.0% |
| Liberal Arts & History | 9,711 | 5.5% |
| Visual & Performing Arts | 9,651 | 5.5% |
| Communications | 9,516 | 5.4% |
| Arts & Humanities | 11,717 | 6.7% |
| Total | 175,348 | 100.0% |
Transportation & Commute in Jackson County
Vehicle Availability by Sex in Jackson County
The most prevalent vehicle ownership categories in Jackson County are males with 2 vehicles (78,674, accounting for 43.0%) and females with 2 vehicles (70,073, making up 45.9%).
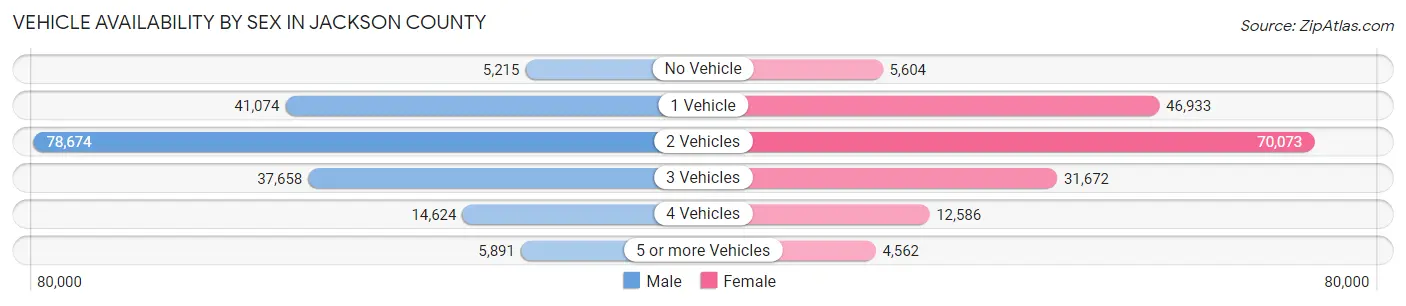
| Vehicles Available | Male | Female |
| No Vehicle | 5,215 (2.9%) | 5,604 (3.3%) |
| 1 Vehicle | 41,074 (22.4%) | 46,933 (27.4%) |
| 2 Vehicles | 78,674 (43.0%) | 70,073 (40.9%) |
| 3 Vehicles | 37,658 (20.6%) | 31,672 (18.5%) |
| 4 Vehicles | 14,624 (8.0%) | 12,586 (7.3%) |
| 5 or more Vehicles | 5,891 (3.2%) | 4,562 (2.7%) |
| Total | 183,136 (100.0%) | 171,430 (100.0%) |
Commute Time in Jackson County
The most frequently occuring commute durations in Jackson County are 20 to 24 minutes (54,577 commuters, 17.4%), 15 to 19 minutes (52,487 commuters, 16.7%), and 30 to 34 minutes (51,104 commuters, 16.3%).
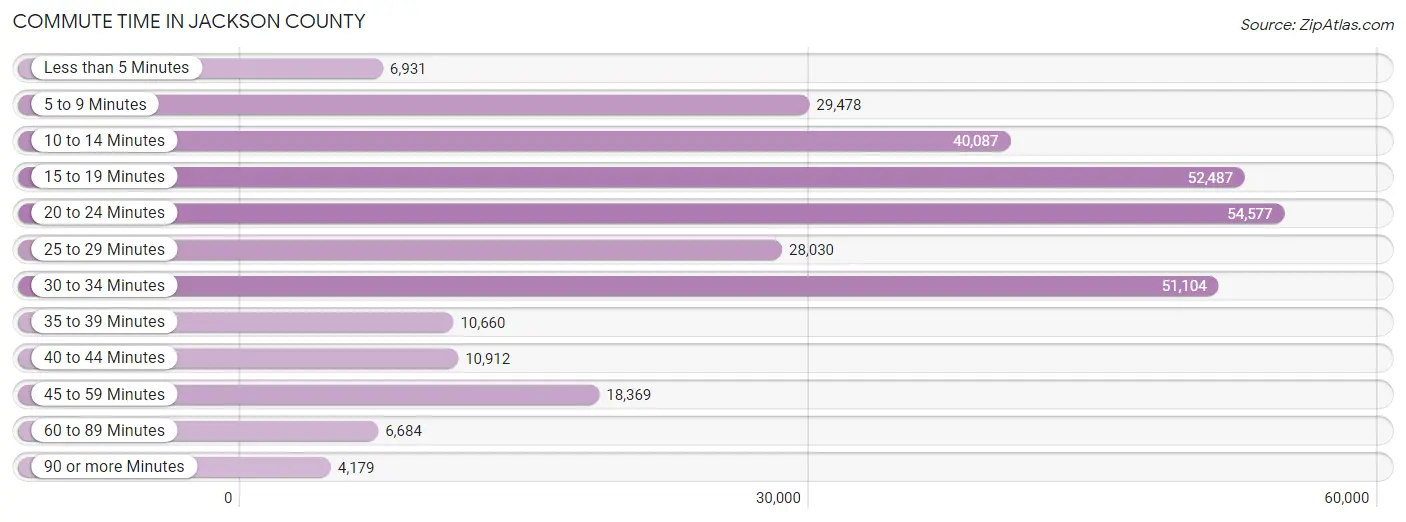
| Commute Time | # Commuters | % Commuters |
| Less than 5 Minutes | 6,931 | 2.2% |
| 5 to 9 Minutes | 29,478 | 9.4% |
| 10 to 14 Minutes | 40,087 | 12.8% |
| 15 to 19 Minutes | 52,487 | 16.7% |
| 20 to 24 Minutes | 54,577 | 17.4% |
| 25 to 29 Minutes | 28,030 | 8.9% |
| 30 to 34 Minutes | 51,104 | 16.3% |
| 35 to 39 Minutes | 10,660 | 3.4% |
| 40 to 44 Minutes | 10,912 | 3.5% |
| 45 to 59 Minutes | 18,369 | 5.9% |
| 60 to 89 Minutes | 6,684 | 2.1% |
| 90 or more Minutes | 4,179 | 1.3% |
Commute Time by Sex in Jackson County
The most common commute times in Jackson County are 20 to 24 minutes (29,249 commuters, 17.8%) for males and 15 to 19 minutes (27,292 commuters, 18.3%) for females.
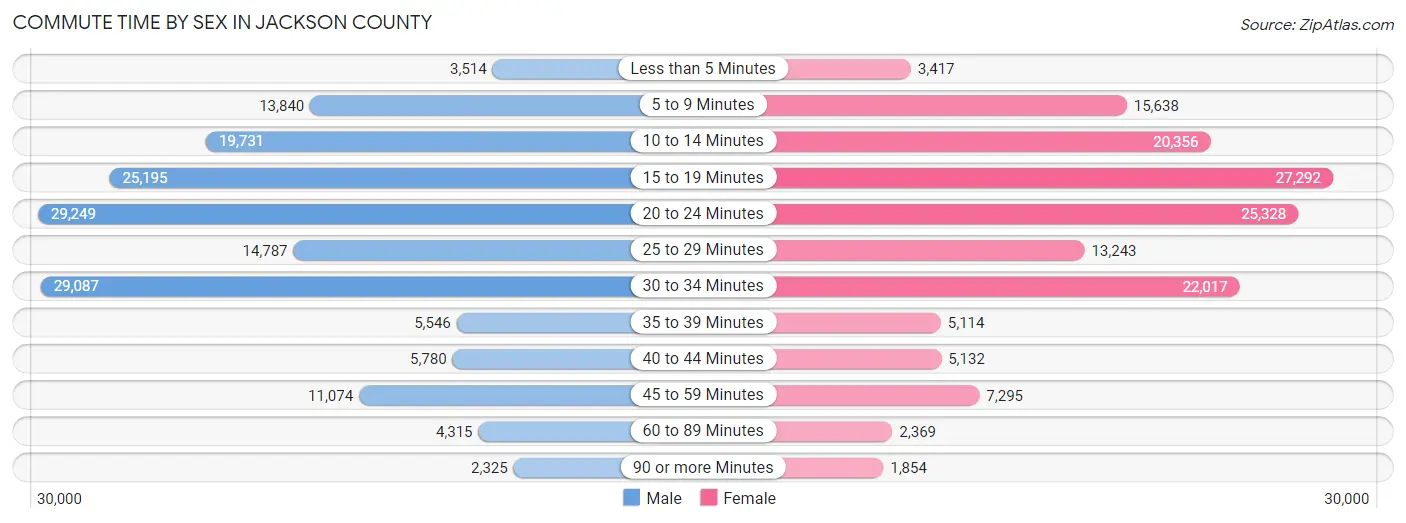
| Commute Time | Male | Female |
| Less than 5 Minutes | 3,514 (2.1%) | 3,417 (2.3%) |
| 5 to 9 Minutes | 13,840 (8.4%) | 15,638 (10.5%) |
| 10 to 14 Minutes | 19,731 (12.0%) | 20,356 (13.7%) |
| 15 to 19 Minutes | 25,195 (15.3%) | 27,292 (18.3%) |
| 20 to 24 Minutes | 29,249 (17.8%) | 25,328 (17.0%) |
| 25 to 29 Minutes | 14,787 (9.0%) | 13,243 (8.9%) |
| 30 to 34 Minutes | 29,087 (17.7%) | 22,017 (14.8%) |
| 35 to 39 Minutes | 5,546 (3.4%) | 5,114 (3.4%) |
| 40 to 44 Minutes | 5,780 (3.5%) | 5,132 (3.4%) |
| 45 to 59 Minutes | 11,074 (6.7%) | 7,295 (4.9%) |
| 60 to 89 Minutes | 4,315 (2.6%) | 2,369 (1.6%) |
| 90 or more Minutes | 2,325 (1.4%) | 1,854 (1.2%) |
Time of Departure to Work by Sex in Jackson County
The most frequent times of departure to work in Jackson County are 7:30 AM to 7:59 AM (23,320, 14.2%) for males and 7:30 AM to 7:59 AM (24,492, 16.4%) for females.
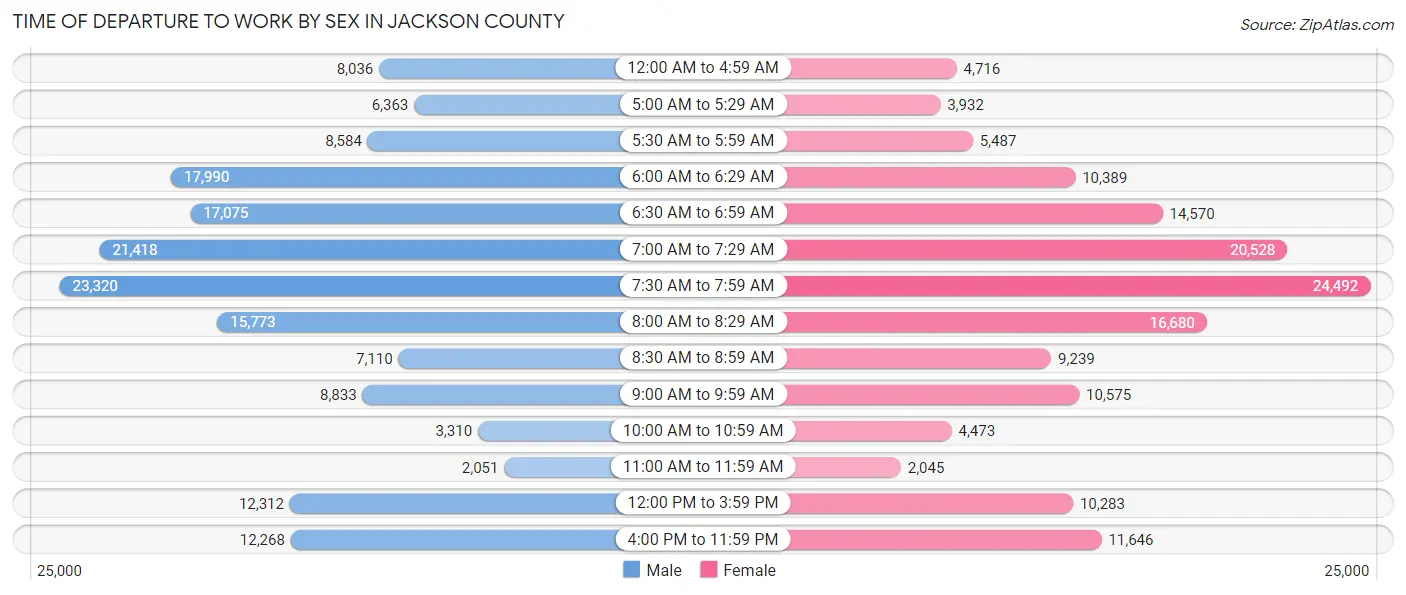
| Time of Departure | Male | Female |
| 12:00 AM to 4:59 AM | 8,036 (4.9%) | 4,716 (3.2%) |
| 5:00 AM to 5:29 AM | 6,363 (3.9%) | 3,932 (2.6%) |
| 5:30 AM to 5:59 AM | 8,584 (5.2%) | 5,487 (3.7%) |
| 6:00 AM to 6:29 AM | 17,990 (10.9%) | 10,389 (7.0%) |
| 6:30 AM to 6:59 AM | 17,075 (10.4%) | 14,570 (9.8%) |
| 7:00 AM to 7:29 AM | 21,418 (13.0%) | 20,528 (13.8%) |
| 7:30 AM to 7:59 AM | 23,320 (14.2%) | 24,492 (16.4%) |
| 8:00 AM to 8:29 AM | 15,773 (9.6%) | 16,680 (11.2%) |
| 8:30 AM to 8:59 AM | 7,110 (4.3%) | 9,239 (6.2%) |
| 9:00 AM to 9:59 AM | 8,833 (5.4%) | 10,575 (7.1%) |
| 10:00 AM to 10:59 AM | 3,310 (2.0%) | 4,473 (3.0%) |
| 11:00 AM to 11:59 AM | 2,051 (1.3%) | 2,045 (1.4%) |
| 12:00 PM to 3:59 PM | 12,312 (7.5%) | 10,283 (6.9%) |
| 4:00 PM to 11:59 PM | 12,268 (7.5%) | 11,646 (7.8%) |
| Total | 164,443 (100.0%) | 149,055 (100.0%) |
Housing Occupancy in Jackson County
Occupancy by Ownership in Jackson County
Of the total 298,908 dwellings in Jackson County, owner-occupied units account for 174,963 (58.5%), while renter-occupied units make up 123,945 (41.5%).
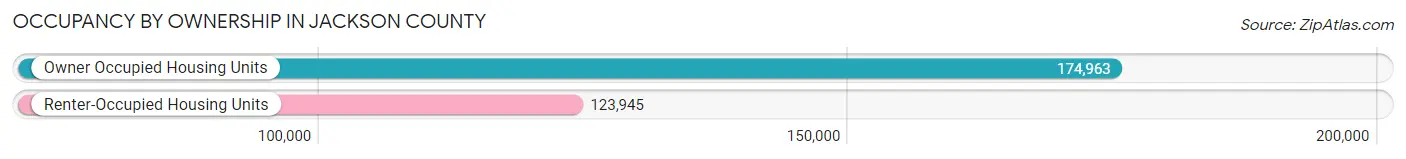
| Occupancy | # Housing Units | % Housing Units |
| Owner Occupied Housing Units | 174,963 | 58.5% |
| Renter-Occupied Housing Units | 123,945 | 41.5% |
| Total Occupied Housing Units | 298,908 | 100.0% |
Occupancy by Household Size in Jackson County
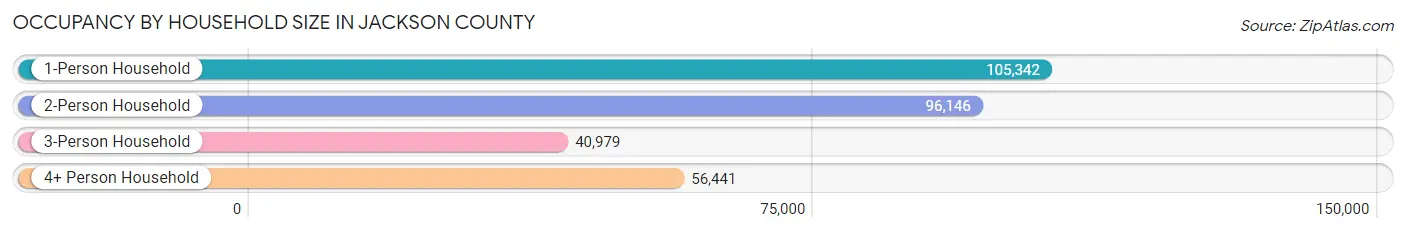
| Household Size | # Housing Units | % Housing Units |
| 1-Person Household | 105,342 | 35.2% |
| 2-Person Household | 96,146 | 32.2% |
| 3-Person Household | 40,979 | 13.7% |
| 4+ Person Household | 56,441 | 18.9% |
| Total Housing Units | 298,908 | 100.0% |
Occupancy by Ownership by Household Size in Jackson County
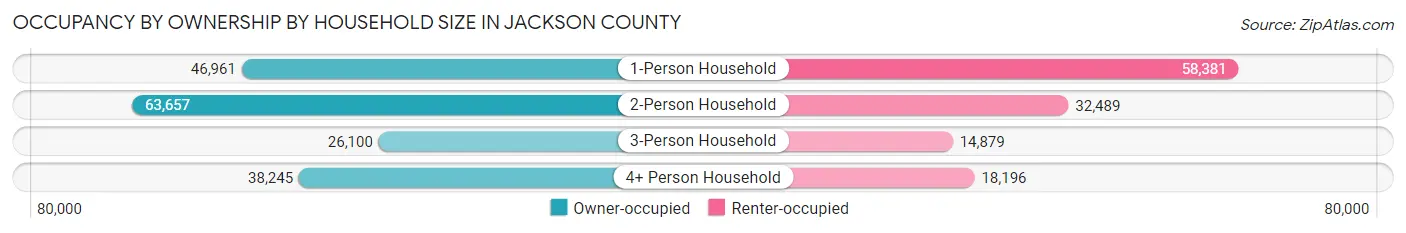
| Household Size | Owner-occupied | Renter-occupied |
| 1-Person Household | 46,961 (44.6%) | 58,381 (55.4%) |
| 2-Person Household | 63,657 (66.2%) | 32,489 (33.8%) |
| 3-Person Household | 26,100 (63.7%) | 14,879 (36.3%) |
| 4+ Person Household | 38,245 (67.8%) | 18,196 (32.2%) |
| Total Housing Units | 174,963 (58.5%) | 123,945 (41.5%) |
Occupancy by Educational Attainment in Jackson County
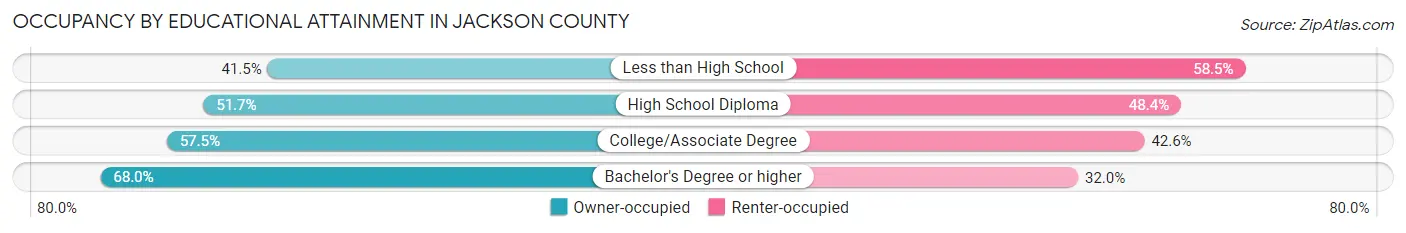
| Household Size | Owner-occupied | Renter-occupied |
| Less than High School | 8,800 (41.5%) | 12,423 (58.5%) |
| High School Diploma | 38,957 (51.6%) | 36,464 (48.3%) |
| College/Associate Degree | 56,167 (57.5%) | 41,593 (42.5%) |
| Bachelor's Degree or higher | 71,039 (68.0%) | 33,465 (32.0%) |
Occupancy by Age of Householder in Jackson County
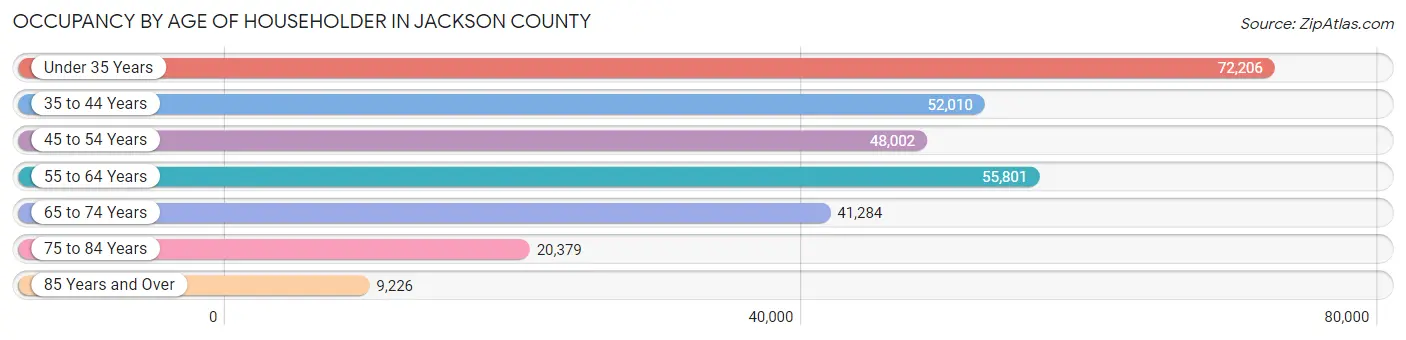
| Age Bracket | # Households | % Households |
| Under 35 Years | 72,206 | 24.2% |
| 35 to 44 Years | 52,010 | 17.4% |
| 45 to 54 Years | 48,002 | 16.1% |
| 55 to 64 Years | 55,801 | 18.7% |
| 65 to 74 Years | 41,284 | 13.8% |
| 75 to 84 Years | 20,379 | 6.8% |
| 85 Years and Over | 9,226 | 3.1% |
| Total | 298,908 | 100.0% |
Housing Finances in Jackson County
Median Income by Occupancy in Jackson County
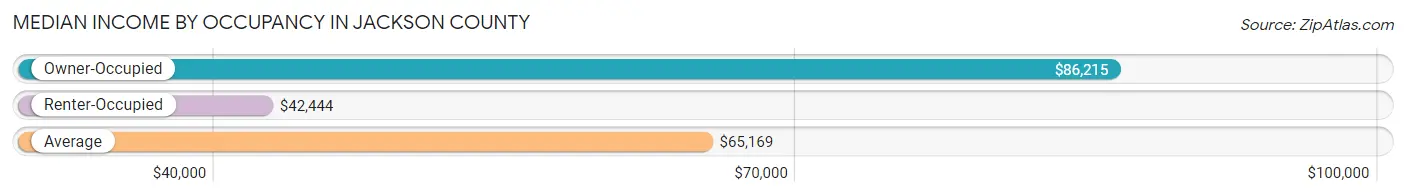
| Occupancy Type | # Households | Median Income |
| Owner-Occupied | 174,963 (58.5%) | $86,215 |
| Renter-Occupied | 123,945 (41.5%) | $42,444 |
| Average | 298,908 (100.0%) | $65,169 |
Occupancy by Householder Income Bracket in Jackson County
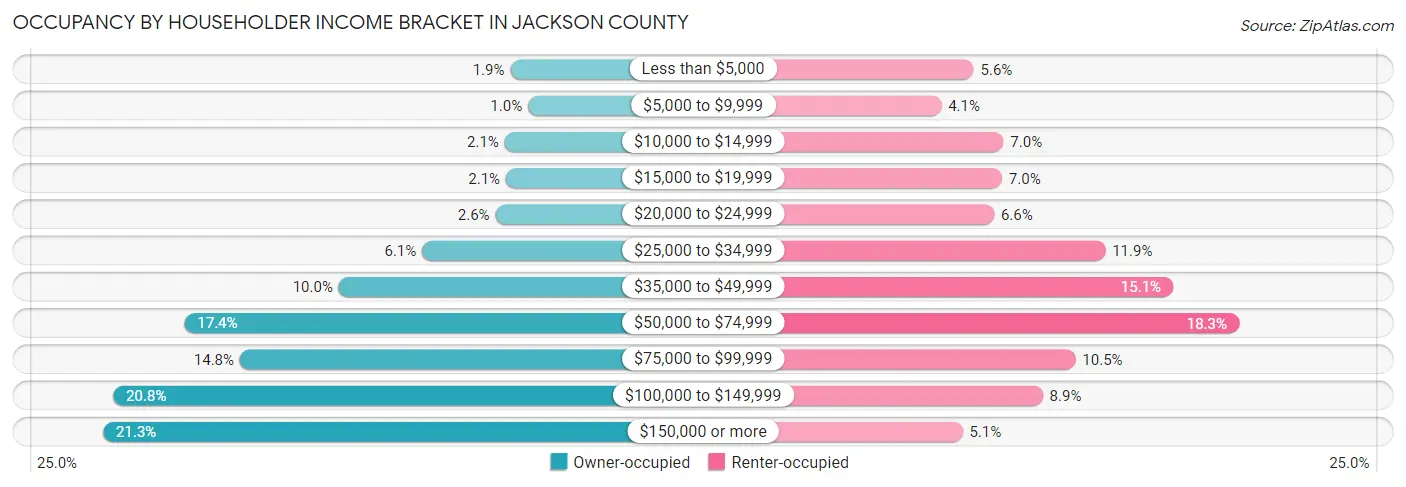
| Income Bracket | Owner-occupied | Renter-occupied |
| Less than $5,000 | 3,274 (1.9%) | 6,960 (5.6%) |
| $5,000 to $9,999 | 1,806 (1.0%) | 5,059 (4.1%) |
| $10,000 to $14,999 | 3,740 (2.1%) | 8,723 (7.0%) |
| $15,000 to $19,999 | 3,644 (2.1%) | 8,642 (7.0%) |
| $20,000 to $24,999 | 4,510 (2.6%) | 8,165 (6.6%) |
| $25,000 to $34,999 | 10,612 (6.1%) | 14,732 (11.9%) |
| $35,000 to $49,999 | 17,561 (10.0%) | 18,732 (15.1%) |
| $50,000 to $74,999 | 30,419 (17.4%) | 22,616 (18.2%) |
| $75,000 to $99,999 | 25,801 (14.7%) | 12,971 (10.5%) |
| $100,000 to $149,999 | 36,379 (20.8%) | 11,041 (8.9%) |
| $150,000 or more | 37,217 (21.3%) | 6,304 (5.1%) |
| Total | 174,963 (100.0%) | 123,945 (100.0%) |
Monthly Housing Cost Tiers in Jackson County
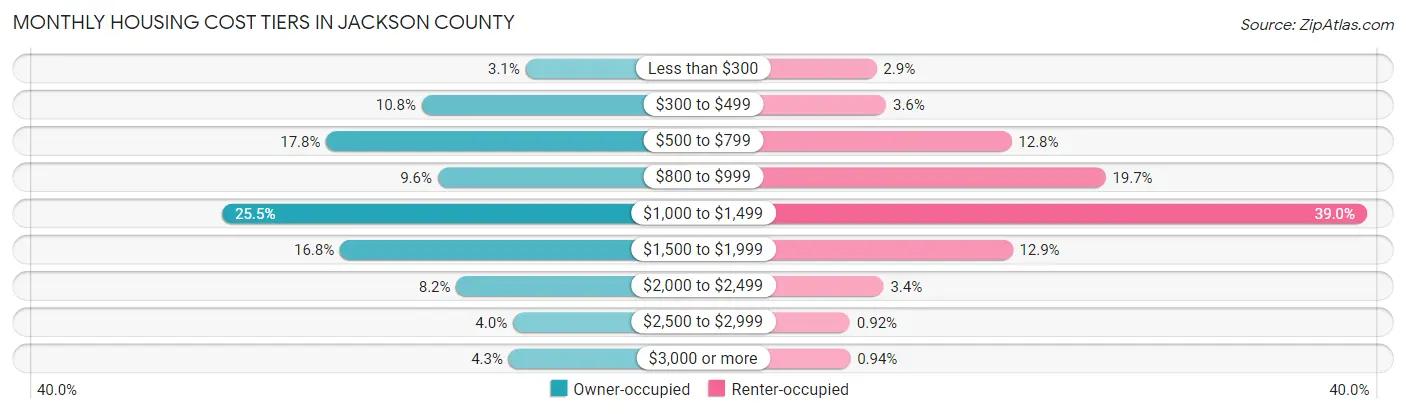
| Monthly Cost | Owner-occupied | Renter-occupied |
| Less than $300 | 5,426 (3.1%) | 3,559 (2.9%) |
| $300 to $499 | 18,815 (10.7%) | 4,437 (3.6%) |
| $500 to $799 | 31,101 (17.8%) | 15,881 (12.8%) |
| $800 to $999 | 16,741 (9.6%) | 24,471 (19.7%) |
| $1,000 to $1,499 | 44,547 (25.5%) | 48,321 (39.0%) |
| $1,500 to $1,999 | 29,333 (16.8%) | 15,976 (12.9%) |
| $2,000 to $2,499 | 14,352 (8.2%) | 4,199 (3.4%) |
| $2,500 to $2,999 | 7,048 (4.0%) | 1,146 (0.9%) |
| $3,000 or more | 7,600 (4.3%) | 1,163 (0.9%) |
| Total | 174,963 (100.0%) | 123,945 (100.0%) |
Physical Housing Characteristics in Jackson County
Housing Structures in Jackson County
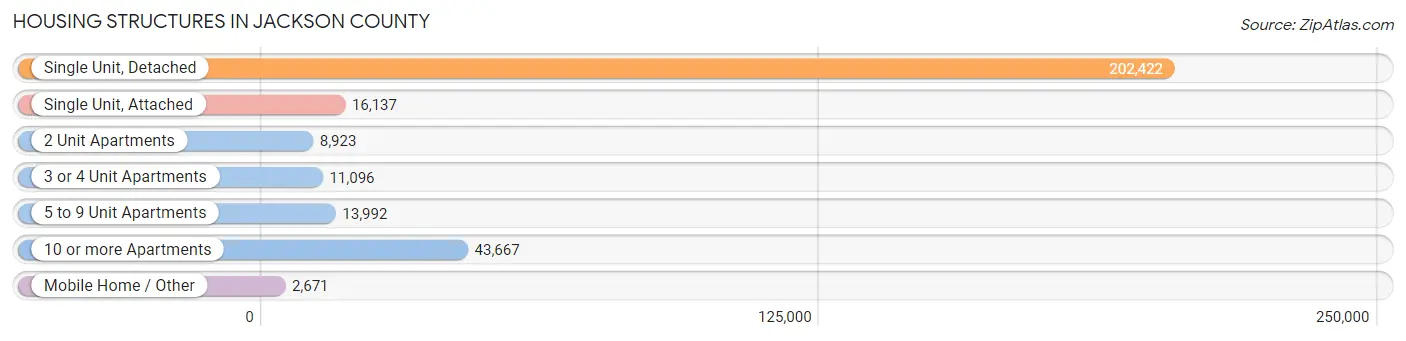
| Structure Type | # Housing Units | % Housing Units |
| Single Unit, Detached | 202,422 | 67.7% |
| Single Unit, Attached | 16,137 | 5.4% |
| 2 Unit Apartments | 8,923 | 3.0% |
| 3 or 4 Unit Apartments | 11,096 | 3.7% |
| 5 to 9 Unit Apartments | 13,992 | 4.7% |
| 10 or more Apartments | 43,667 | 14.6% |
| Mobile Home / Other | 2,671 | 0.9% |
| Total | 298,908 | 100.0% |
Housing Structures by Occupancy in Jackson County
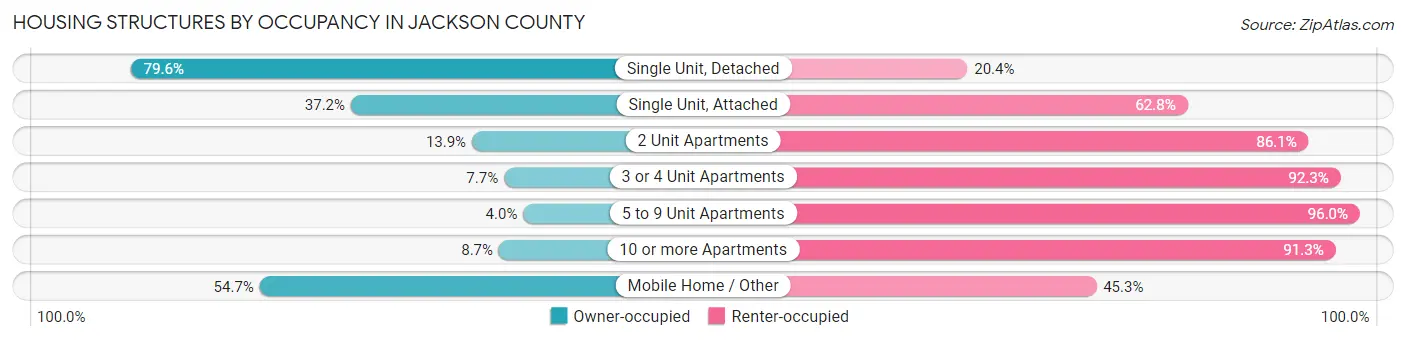
| Structure Type | Owner-occupied | Renter-occupied |
| Single Unit, Detached | 161,063 (79.6%) | 41,359 (20.4%) |
| Single Unit, Attached | 5,999 (37.2%) | 10,138 (62.8%) |
| 2 Unit Apartments | 1,238 (13.9%) | 7,685 (86.1%) |
| 3 or 4 Unit Apartments | 854 (7.7%) | 10,242 (92.3%) |
| 5 to 9 Unit Apartments | 558 (4.0%) | 13,434 (96.0%) |
| 10 or more Apartments | 3,789 (8.7%) | 39,878 (91.3%) |
| Mobile Home / Other | 1,462 (54.7%) | 1,209 (45.3%) |
| Total | 174,963 (58.5%) | 123,945 (41.5%) |
Housing Structures by Number of Rooms in Jackson County
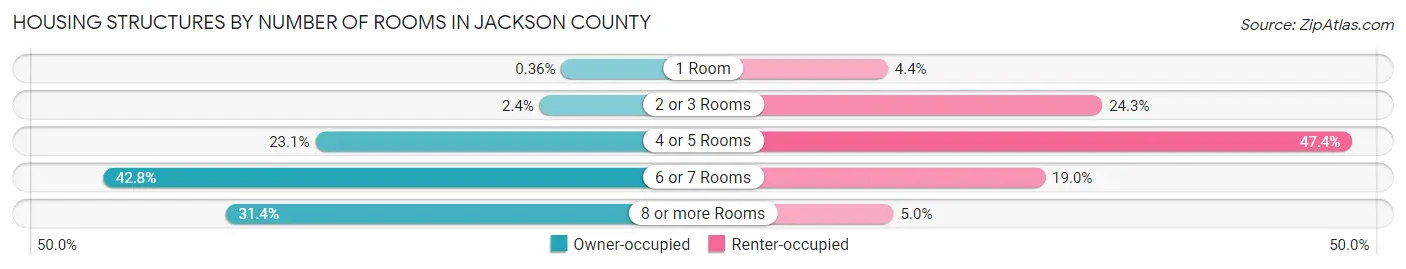
| Number of Rooms | Owner-occupied | Renter-occupied |
| 1 Room | 622 (0.4%) | 5,489 (4.4%) |
| 2 or 3 Rooms | 4,127 (2.4%) | 30,070 (24.3%) |
| 4 or 5 Rooms | 40,447 (23.1%) | 58,698 (47.4%) |
| 6 or 7 Rooms | 74,810 (42.8%) | 23,522 (19.0%) |
| 8 or more Rooms | 54,957 (31.4%) | 6,166 (5.0%) |
| Total | 174,963 (100.0%) | 123,945 (100.0%) |
Housing Structure by Heating Type in Jackson County
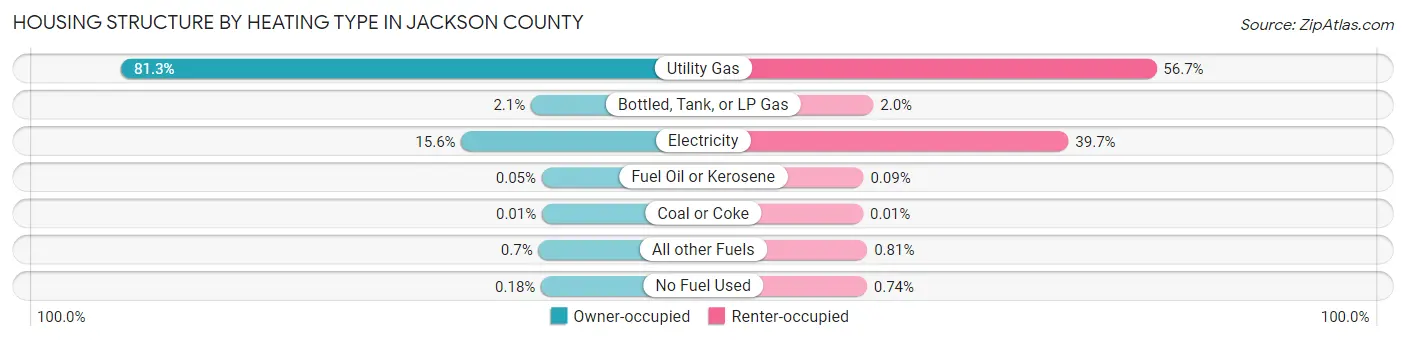
| Heating Type | Owner-occupied | Renter-occupied |
| Utility Gas | 142,306 (81.3%) | 70,259 (56.7%) |
| Bottled, Tank, or LP Gas | 3,743 (2.1%) | 2,469 (2.0%) |
| Electricity | 27,285 (15.6%) | 49,178 (39.7%) |
| Fuel Oil or Kerosene | 94 (0.1%) | 109 (0.1%) |
| Coal or Coke | 11 (0.0%) | 9 (0.0%) |
| All other Fuels | 1,217 (0.7%) | 1,007 (0.8%) |
| No Fuel Used | 307 (0.2%) | 914 (0.7%) |
| Total | 174,963 (100.0%) | 123,945 (100.0%) |
Household Vehicle Usage in Jackson County
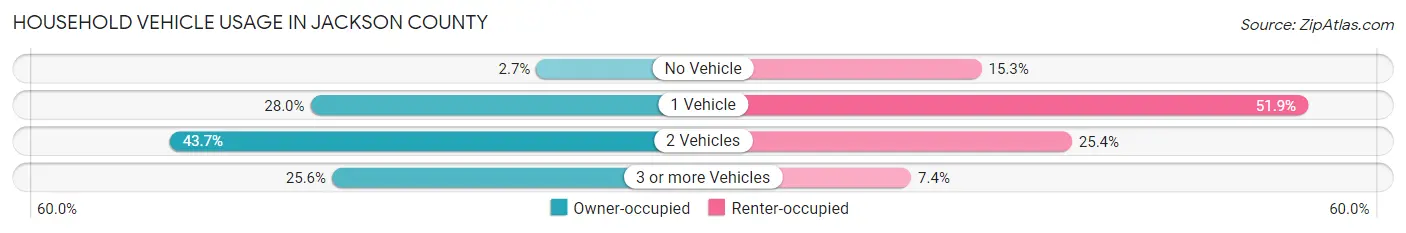
| Vehicles per Household | Owner-occupied | Renter-occupied |
| No Vehicle | 4,704 (2.7%) | 18,963 (15.3%) |
| 1 Vehicle | 48,975 (28.0%) | 64,280 (51.9%) |
| 2 Vehicles | 76,531 (43.7%) | 31,505 (25.4%) |
| 3 or more Vehicles | 44,753 (25.6%) | 9,197 (7.4%) |
| Total | 174,963 (100.0%) | 123,945 (100.0%) |
Real Estate & Mortgages in Jackson County
Real Estate and Mortgage Overview in Jackson County
| Characteristic | Without Mortgage | With Mortgage |
| Housing Units | 63,602 | 111,361 |
| Median Property Value | $166,900 | $213,500 |
| Median Household Income | $62,874 | $28,286 |
| Monthly Housing Costs | $580 | $7,355 |
| Real Estate Taxes | $2,124 | $2,154 |
Property Value by Mortgage Status in Jackson County
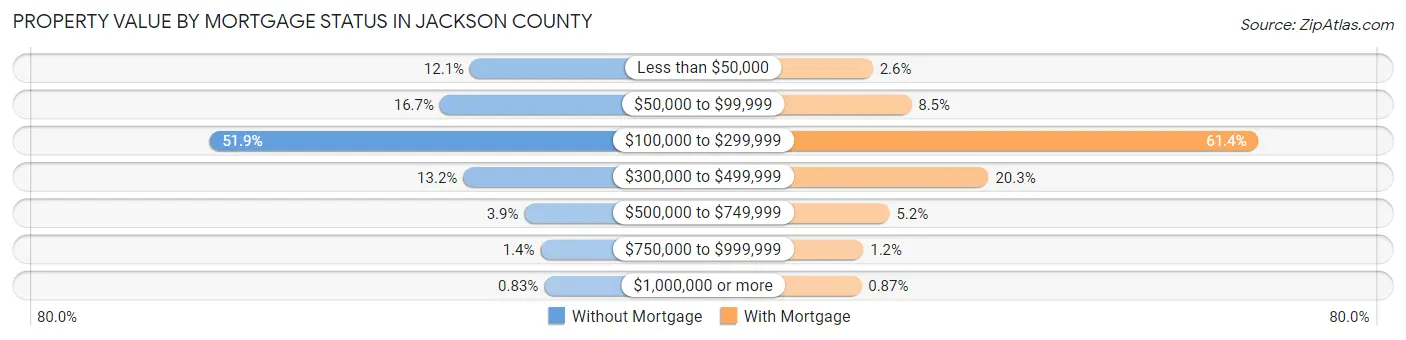
| Property Value | Without Mortgage | With Mortgage |
| Less than $50,000 | 7,723 (12.1%) | 2,920 (2.6%) |
| $50,000 to $99,999 | 10,642 (16.7%) | 9,451 (8.5%) |
| $100,000 to $299,999 | 32,986 (51.9%) | 68,385 (61.4%) |
| $300,000 to $499,999 | 8,375 (13.2%) | 22,561 (20.3%) |
| $500,000 to $749,999 | 2,450 (3.8%) | 5,757 (5.2%) |
| $750,000 to $999,999 | 901 (1.4%) | 1,316 (1.2%) |
| $1,000,000 or more | 525 (0.8%) | 971 (0.9%) |
| Total | 63,602 (100.0%) | 111,361 (100.0%) |
Household Income by Mortgage Status in Jackson County
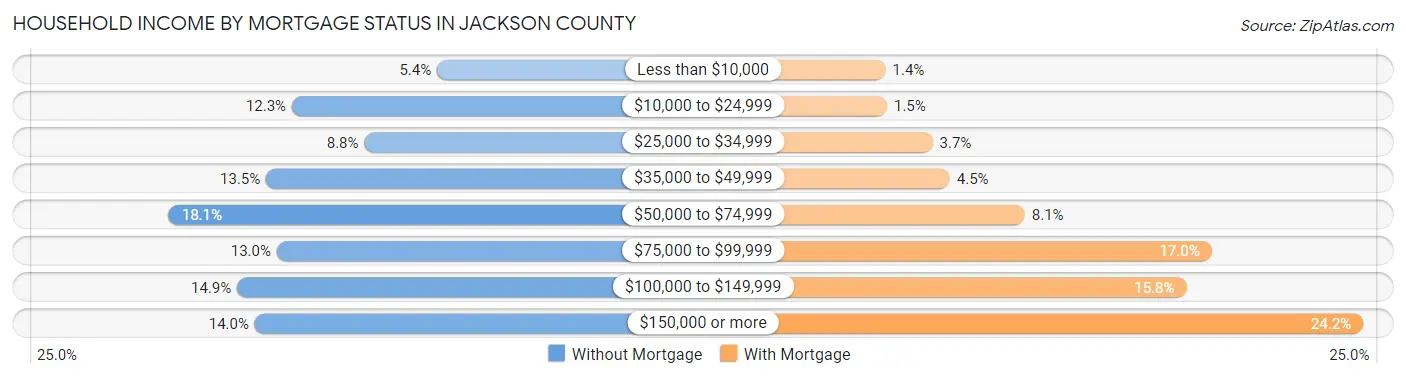
| Household Income | Without Mortgage | With Mortgage |
| Less than $10,000 | 3,409 (5.4%) | 1,588 (1.4%) |
| $10,000 to $24,999 | 7,803 (12.3%) | 1,671 (1.5%) |
| $25,000 to $34,999 | 5,610 (8.8%) | 4,091 (3.7%) |
| $35,000 to $49,999 | 8,584 (13.5%) | 5,002 (4.5%) |
| $50,000 to $74,999 | 11,533 (18.1%) | 8,977 (8.1%) |
| $75,000 to $99,999 | 8,265 (13.0%) | 18,886 (17.0%) |
| $100,000 to $149,999 | 9,467 (14.9%) | 17,536 (15.8%) |
| $150,000 or more | 8,931 (14.0%) | 26,912 (24.2%) |
| Total | 63,602 (100.0%) | 111,361 (100.0%) |
Property Value to Household Income Ratio in Jackson County
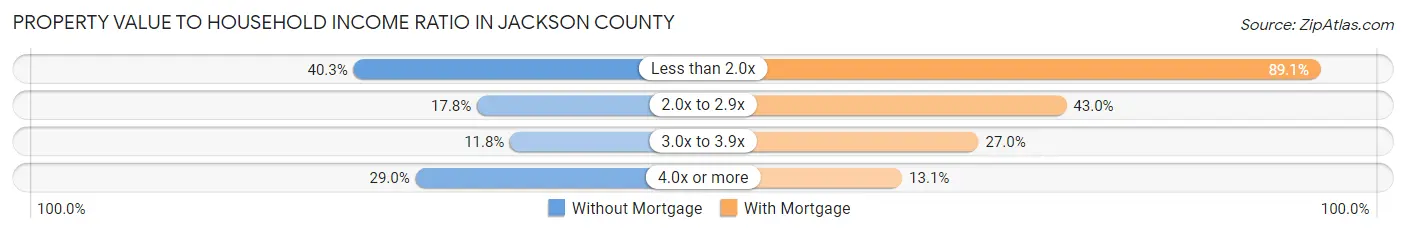
| Value-to-Income Ratio | Without Mortgage | With Mortgage |
| Less than 2.0x | 25,608 (40.3%) | 99,261 (89.1%) |
| 2.0x to 2.9x | 11,336 (17.8%) | 47,831 (42.9%) |
| 3.0x to 3.9x | 7,511 (11.8%) | 30,053 (27.0%) |
| 4.0x or more | 18,446 (29.0%) | 14,610 (13.1%) |
| Total | 63,602 (100.0%) | 111,361 (100.0%) |
Real Estate Taxes by Mortgage Status in Jackson County
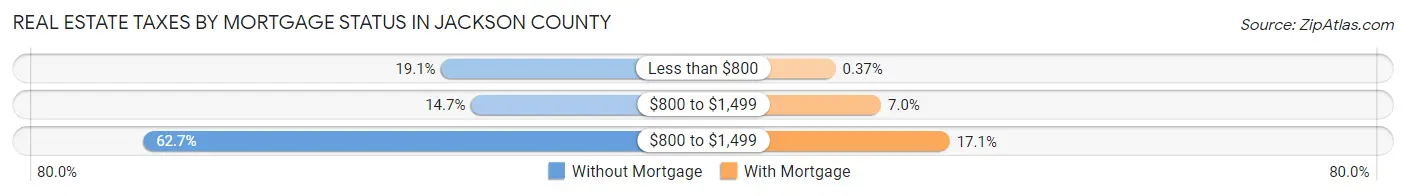
| Property Taxes | Without Mortgage | With Mortgage |
| Less than $800 | 12,144 (19.1%) | 415 (0.4%) |
| $800 to $1,499 | 9,372 (14.7%) | 7,812 (7.0%) |
| $800 to $1,499 | 39,855 (62.7%) | 18,989 (17.1%) |
| Total | 63,602 (100.0%) | 111,361 (100.0%) |
Health & Disability in Jackson County
Health Insurance Coverage by Age in Jackson County
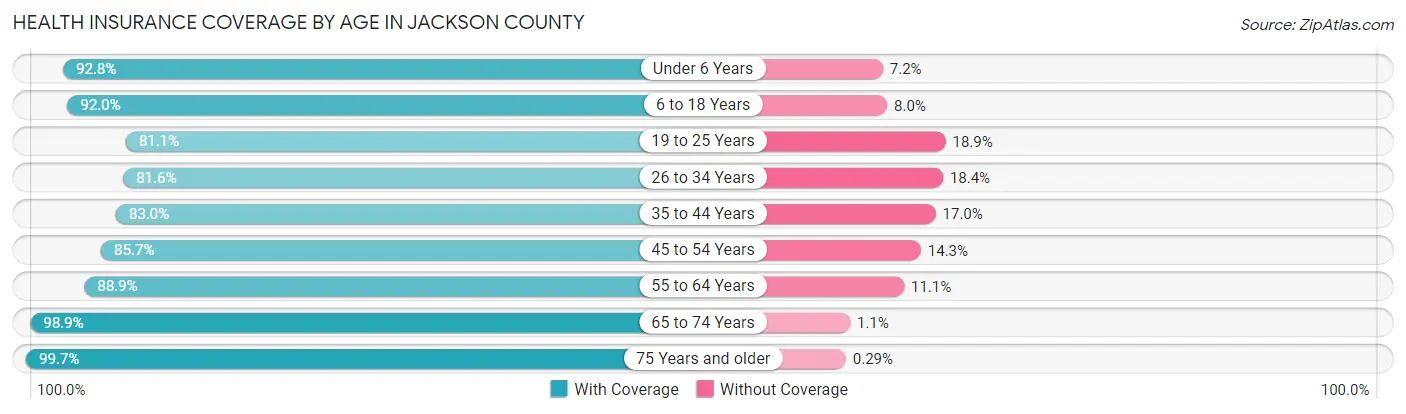
| Age Bracket | With Coverage | Without Coverage |
| Under 6 Years | 50,644 (92.8%) | 3,923 (7.2%) |
| 6 to 18 Years | 110,355 (92.0%) | 9,572 (8.0%) |
| 19 to 25 Years | 51,700 (81.1%) | 12,035 (18.9%) |
| 26 to 34 Years | 79,687 (81.6%) | 17,971 (18.4%) |
| 35 to 44 Years | 76,929 (83.0%) | 15,795 (17.0%) |
| 45 to 54 Years | 71,336 (85.7%) | 11,881 (14.3%) |
| 55 to 64 Years | 80,241 (88.9%) | 10,057 (11.1%) |
| 65 to 74 Years | 63,506 (98.9%) | 689 (1.1%) |
| 75 Years and older | 42,432 (99.7%) | 122 (0.3%) |
| Total | 626,830 (88.4%) | 82,045 (11.6%) |
Health Insurance Coverage by Citizenship Status in Jackson County
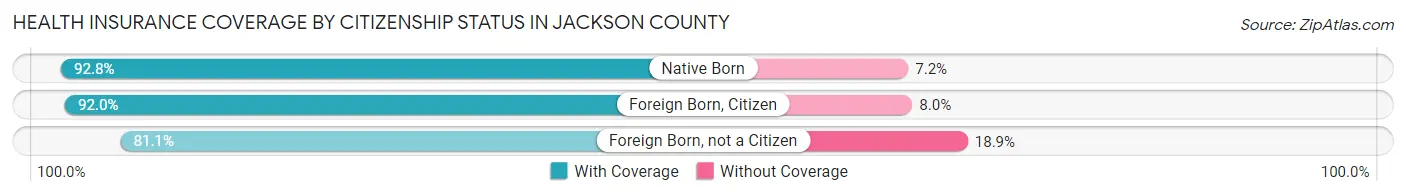
| Citizenship Status | With Coverage | Without Coverage |
| Native Born | 50,644 (92.8%) | 3,923 (7.2%) |
| Foreign Born, Citizen | 110,355 (92.0%) | 9,572 (8.0%) |
| Foreign Born, not a Citizen | 51,700 (81.1%) | 12,035 (18.9%) |
Health Insurance Coverage by Household Income in Jackson County
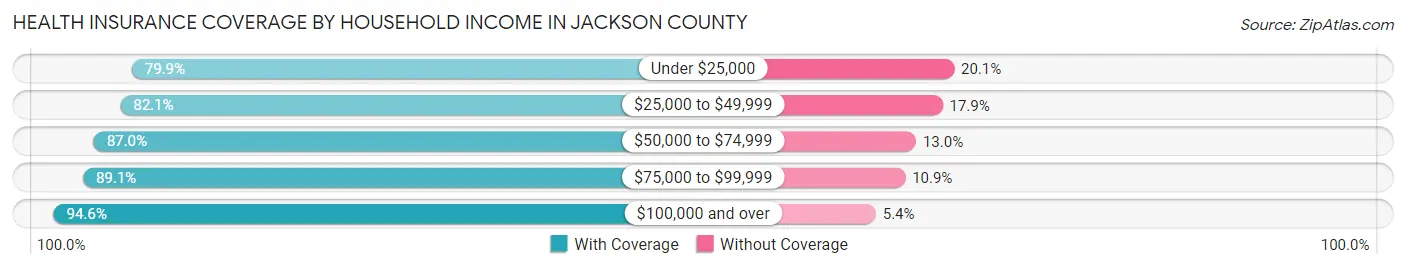
| Household Income | With Coverage | Without Coverage |
| Under $25,000 | 74,189 (79.9%) | 18,651 (20.1%) |
| $25,000 to $49,999 | 96,881 (82.1%) | 21,183 (17.9%) |
| $50,000 to $74,999 | 104,883 (87.0%) | 15,615 (13.0%) |
| $75,000 to $99,999 | 90,094 (89.1%) | 11,063 (10.9%) |
| $100,000 and over | 256,312 (94.6%) | 14,730 (5.4%) |
Public vs Private Health Insurance Coverage by Age in Jackson County
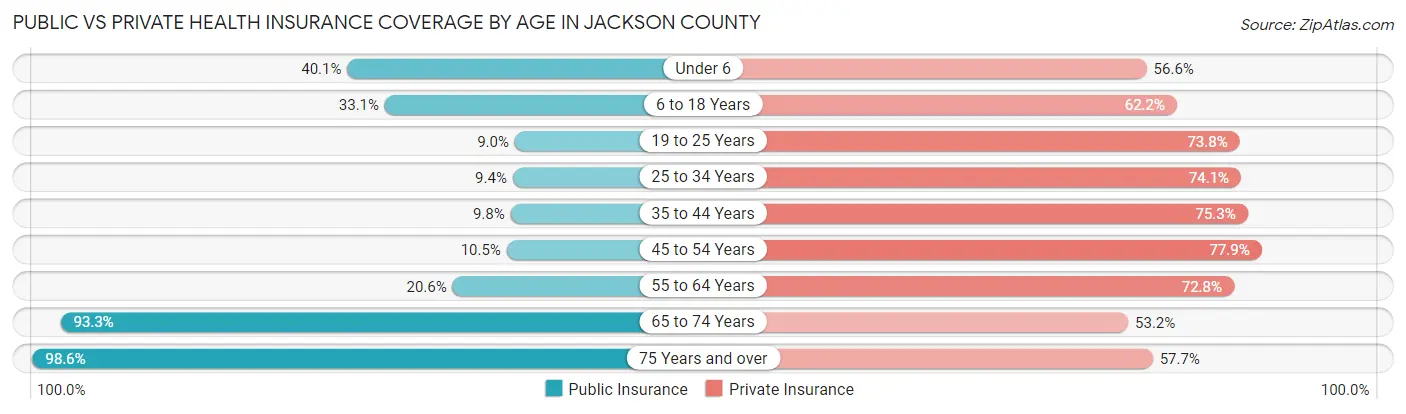
| Age Bracket | Public Insurance | Private Insurance |
| Under 6 | 21,887 (40.1%) | 30,877 (56.6%) |
| 6 to 18 Years | 39,729 (33.1%) | 74,571 (62.2%) |
| 19 to 25 Years | 5,741 (9.0%) | 47,044 (73.8%) |
| 25 to 34 Years | 9,172 (9.4%) | 72,345 (74.1%) |
| 35 to 44 Years | 9,091 (9.8%) | 69,835 (75.3%) |
| 45 to 54 Years | 8,752 (10.5%) | 64,833 (77.9%) |
| 55 to 64 Years | 18,576 (20.6%) | 65,703 (72.8%) |
| 65 to 74 Years | 59,918 (93.3%) | 34,118 (53.1%) |
| 75 Years and over | 41,935 (98.6%) | 24,556 (57.7%) |
| Total | 214,801 (30.3%) | 483,882 (68.3%) |
Disability Status by Sex by Age in Jackson County
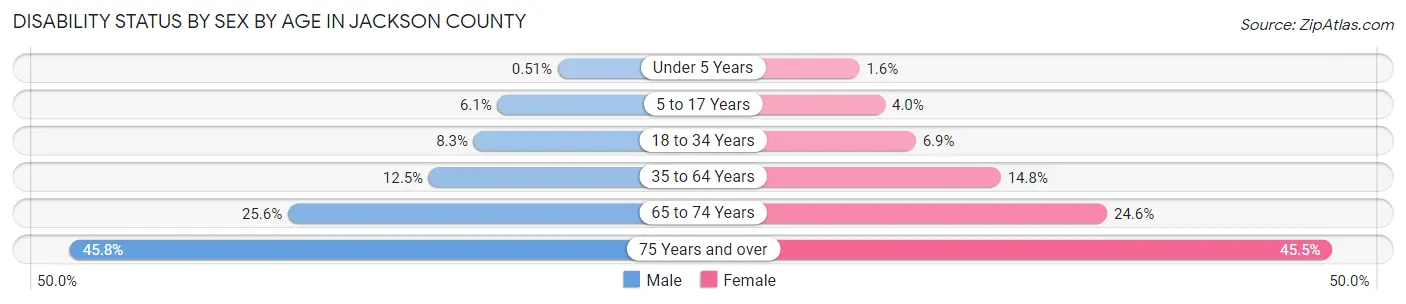
| Age Bracket | Male | Female |
| Under 5 Years | 117 (0.5%) | 360 (1.6%) |
| 5 to 17 Years | 3,768 (6.1%) | 2,388 (4.0%) |
| 18 to 34 Years | 6,924 (8.3%) | 5,925 (6.9%) |
| 35 to 64 Years | 16,272 (12.5%) | 20,050 (14.7%) |
| 65 to 74 Years | 7,504 (25.6%) | 8,576 (24.6%) |
| 75 Years and over | 7,784 (45.8%) | 11,636 (45.5%) |
Disability Class by Sex by Age in Jackson County
Disability Class: Hearing Difficulty
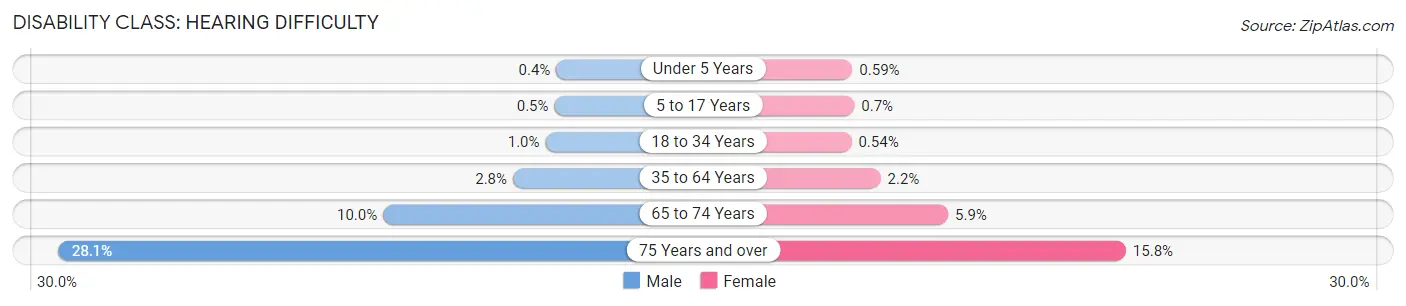
| Age Bracket | Male | Female |
| Under 5 Years | 91 (0.4%) | 130 (0.6%) |
| 5 to 17 Years | 308 (0.5%) | 420 (0.7%) |
| 18 to 34 Years | 833 (1.0%) | 470 (0.5%) |
| 35 to 64 Years | 3,661 (2.8%) | 2,932 (2.2%) |
| 65 to 74 Years | 2,949 (10.0%) | 2,062 (5.9%) |
| 75 Years and over | 4,775 (28.1%) | 4,044 (15.8%) |
Disability Class: Vision Difficulty
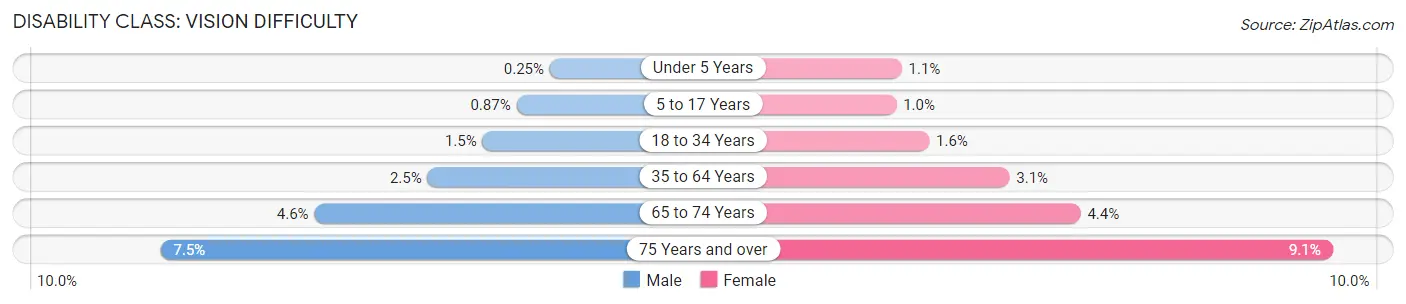
| Age Bracket | Male | Female |
| Under 5 Years | 57 (0.3%) | 245 (1.1%) |
| 5 to 17 Years | 538 (0.9%) | 602 (1.0%) |
| 18 to 34 Years | 1,251 (1.5%) | 1,399 (1.6%) |
| 35 to 64 Years | 3,279 (2.5%) | 4,224 (3.1%) |
| 65 to 74 Years | 1,356 (4.6%) | 1,542 (4.4%) |
| 75 Years and over | 1,272 (7.5%) | 2,327 (9.1%) |
Disability Class: Cognitive Difficulty
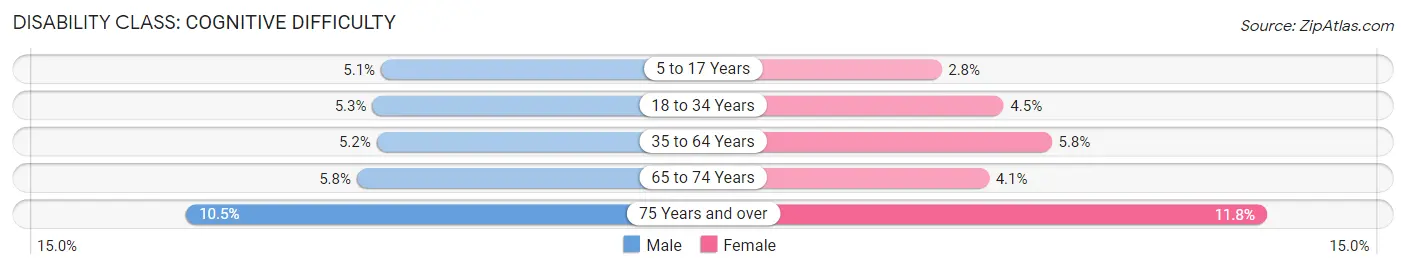
| Age Bracket | Male | Female |
| 5 to 17 Years | 3,138 (5.1%) | 1,651 (2.8%) |
| 18 to 34 Years | 4,431 (5.3%) | 3,888 (4.5%) |
| 35 to 64 Years | 6,777 (5.2%) | 7,935 (5.8%) |
| 65 to 74 Years | 1,688 (5.8%) | 1,425 (4.1%) |
| 75 Years and over | 1,785 (10.5%) | 3,022 (11.8%) |
Disability Class: Ambulatory Difficulty
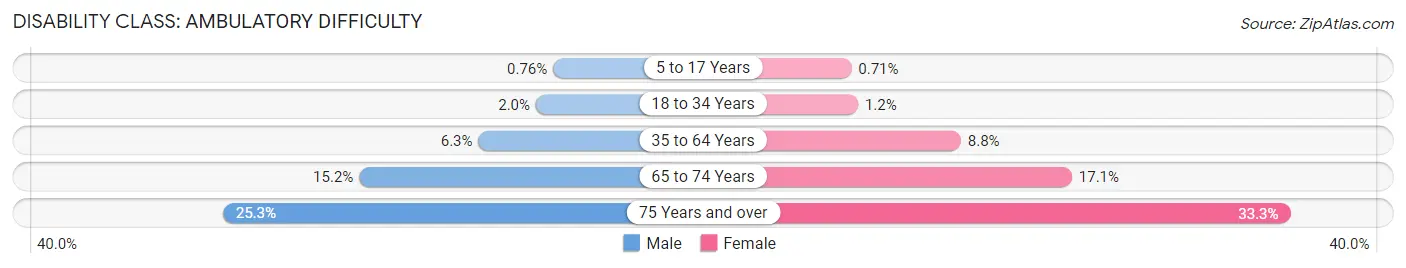
| Age Bracket | Male | Female |
| 5 to 17 Years | 472 (0.8%) | 423 (0.7%) |
| 18 to 34 Years | 1,703 (2.0%) | 1,033 (1.2%) |
| 35 to 64 Years | 8,223 (6.3%) | 12,011 (8.8%) |
| 65 to 74 Years | 4,452 (15.2%) | 5,948 (17.1%) |
| 75 Years and over | 4,297 (25.3%) | 8,509 (33.3%) |
Disability Class: Self-Care Difficulty
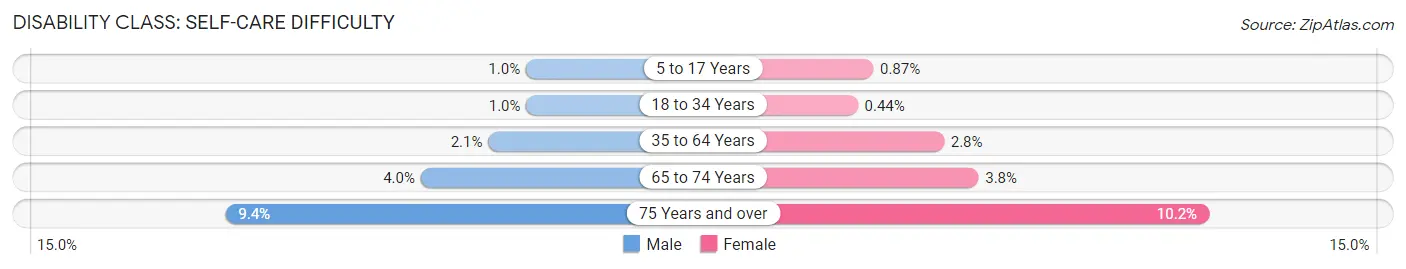
| Age Bracket | Male | Female |
| 5 to 17 Years | 640 (1.0%) | 520 (0.9%) |
| 18 to 34 Years | 857 (1.0%) | 378 (0.4%) |
| 35 to 64 Years | 2,723 (2.1%) | 3,853 (2.8%) |
| 65 to 74 Years | 1,165 (4.0%) | 1,325 (3.8%) |
| 75 Years and over | 1,599 (9.4%) | 2,612 (10.2%) |
Technology Access in Jackson County
Computing Device Access in Jackson County
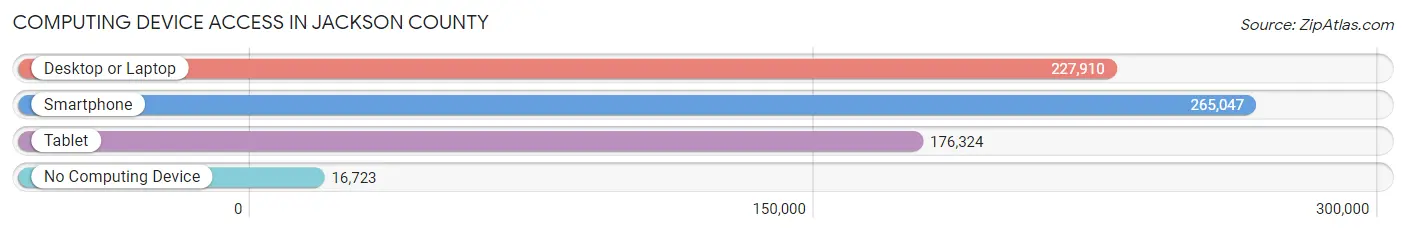
| Device Type | # Households | % Households |
| Desktop or Laptop | 227,910 | 76.2% |
| Smartphone | 265,047 | 88.7% |
| Tablet | 176,324 | 59.0% |
| No Computing Device | 16,723 | 5.6% |
| Total | 298,908 | 100.0% |
Internet Access in Jackson County
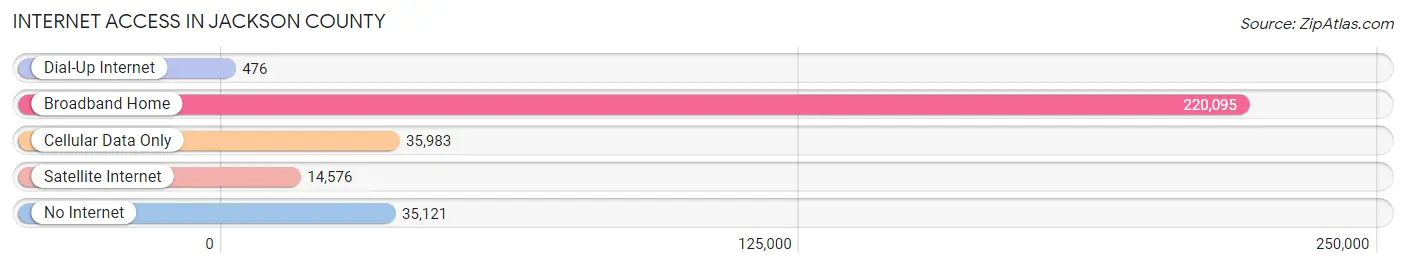
| Internet Type | # Households | % Households |
| Dial-Up Internet | 476 | 0.2% |
| Broadband Home | 220,095 | 73.6% |
| Cellular Data Only | 35,983 | 12.0% |
| Satellite Internet | 14,576 | 4.9% |
| No Internet | 35,121 | 11.7% |
| Total | 298,908 | 100.0% |
Jackson County Summary
Jackson County, Missouri is located in the western portion of the state and is the second most populous county in the state. It is bordered by Clay, Cass, and Platte counties to the north, Lafayette and Johnson counties to the east, and Bates and Cass counties to the south. The county seat is Kansas City, which is also the largest city in the county.
History
Jackson County was established in 1826 and named after President Andrew Jackson. The county was originally part of the Louisiana Purchase and was part of the Missouri Territory until 1821 when it became part of the state of Missouri. The county was initially populated by Native American tribes, including the Osage, Shawnee, and Delaware.
The county was home to several early settlements, including Westport, which was founded in 1833 and is now part of Kansas City. The city of Independence was founded in 1827 and is now the county seat.
The county was a major stop on the Oregon Trail and the Santa Fe Trail, and was also the site of several battles during the Civil War.
Geography
Jackson County covers an area of 877 square miles and is located in the western portion of the state. The county is mostly flat, with some rolling hills in the northern and eastern portions. The county is drained by the Missouri River and its tributaries, including the Blue, Grand, and Little Blue rivers.
The county is home to several state parks, including the Harry S. Truman State Park, the George Washington Carver National Monument, and the Lewis and Clark State Historic Site.
Economy
Jackson County has a diverse economy, with a mix of manufacturing, retail, and service industries. The county is home to several major employers, including Ford Motor Company, Hallmark Cards, and Cerner Corporation.
The county is also home to several universities and colleges, including the University of Missouri-Kansas City, Rockhurst University, and Avila University.
Demographics
As of the 2010 census, Jackson County had a population of 674,158. The racial makeup of the county was 68.3% White, 24.2% African American, 0.7% Native American, 2.3% Asian, 0.1% Pacific Islander, and 4.4% from other races. Hispanic or Latino of any race were 8.2% of the population.
The median household income in the county was $50,867, and the median family income was $60,879. The per capita income was $25,945. About 15.2% of the population was below the poverty line.
Jackson County is home to a large number of immigrants, with the largest groups coming from Mexico, India, and Vietnam. The county is also home to a large number of refugees, with the largest groups coming from Burma, Iraq, and Somalia.
Common Questions
What is Per Capita Income in Jackson County?
Per Capita income in Jackson County is $36,890.
What is the Median Family Income in Jackson County?
Median Family Income in Jackson County is $85,388.
What is the Median Household income in Jackson County?
Median Household Income in Jackson County is $65,169.
What is Income or Wage Gap in Jackson County?
Income or Wage Gap in Jackson County is 25.0%.
Women in Jackson County earn 75.0 cents for every dollar earned by a man.
What is Family Income Deficit in Jackson County?
Family Income Deficit in Jackson County is $11,479.
Families that are below poverty line in Jackson County earn $11,479 less on average than the poverty threshold level.
What is Inequality or Gini Index in Jackson County?
Inequality or Gini Index in Jackson County is 0.46.
What is the Total Population of Jackson County?
Total Population of Jackson County is 715,526.
What is the Total Male Population of Jackson County?
Total Male Population of Jackson County is 348,351.
What is the Total Female Population of Jackson County?
Total Female Population of Jackson County is 367,175.
What is the Ratio of Males per 100 Females in Jackson County?
There are 94.87 Males per 100 Females in Jackson County.
What is the Ratio of Females per 100 Males in Jackson County?
There are 105.40 Females per 100 Males in Jackson County.
What is the Median Population Age in Jackson County?
Median Population Age in Jackson County is 37.0 Years.
What is the Average Family Size in Jackson County
Average Family Size in Jackson County is 3.1 People.
What is the Average Household Size in Jackson County
Average Household Size in Jackson County is 2.4 People.
How Large is the Labor Force in Jackson County?
There are 380,838 People in the Labor Forcein in Jackson County.
What is the Percentage of People in the Labor Force in Jackson County?
67.1% of People are in the Labor Force in Jackson County.
What is the Unemployment Rate in Jackson County?
Unemployment Rate in Jackson County is 4.9%.