Howell County, MO Map & Demographics
Howell County Map
Howell County Overview
$24,389
PER CAPITA INCOME
$55,746
AVG FAMILY INCOME
$46,401
AVG HOUSEHOLD INCOME
32.3%
WAGE / INCOME GAP [ % ]
67.7¢/ $1
WAGE / INCOME GAP [ $ ]
$10,365
FAMILY INCOME DEFICIT
0.47
INEQUALITY / GINI INDEX
39,960
TOTAL POPULATION
19,454
MALE POPULATION
20,506
FEMALE POPULATION
94.87
MALES / 100 FEMALES
105.41
FEMALES / 100 MALES
40.7
MEDIAN AGE
3.2
AVG FAMILY SIZE
2.5
AVG HOUSEHOLD SIZE
16,892
LABOR FORCE [ PEOPLE ]
53.5%
PERCENT IN LABOR FORCE
5.5%
UNEMPLOYMENT RATE
Howell County Area Codes
Income in Howell County
Income Overview in Howell County
Per Capita Income in Howell County is $24,389, while median incomes of families and households are $55,746 and $46,401 respectively.
| Characteristic | Number | Measure |
| Per Capita Income | 39,960 | $24,389 |
| Median Family Income | 10,102 | $55,746 |
| Mean Family Income | 10,102 | $71,722 |
| Median Household Income | 15,433 | $46,401 |
| Mean Household Income | 15,433 | $60,708 |
| Income Deficit | 10,102 | $10,365 |
| Wage / Income Gap (%) | 39,960 | 32.29% |
| Wage / Income Gap ($) | 39,960 | 67.71¢ per $1 |
| Gini / Inequality Index | 39,960 | 0.47 |
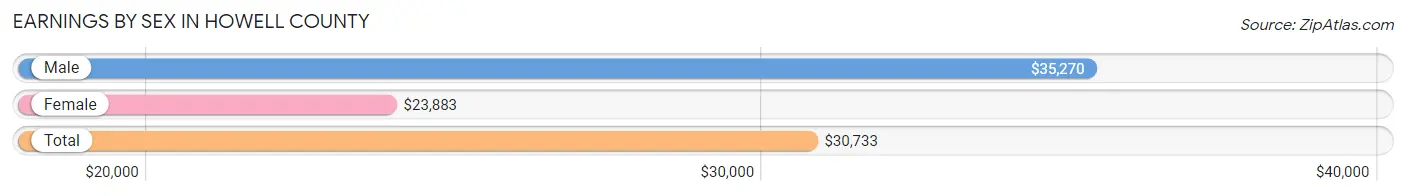
Earnings by Sex in Howell County
Average Earnings in Howell County are $30,733, $35,270 for men and $23,883 for women, a difference of 32.3%.
| Sex | Number | Average Earnings |
| Male | 8,978 (50.3%) | $35,270 |
| Female | 8,870 (49.7%) | $23,883 |
| Total | 17,848 (100.0%) | $30,733 |
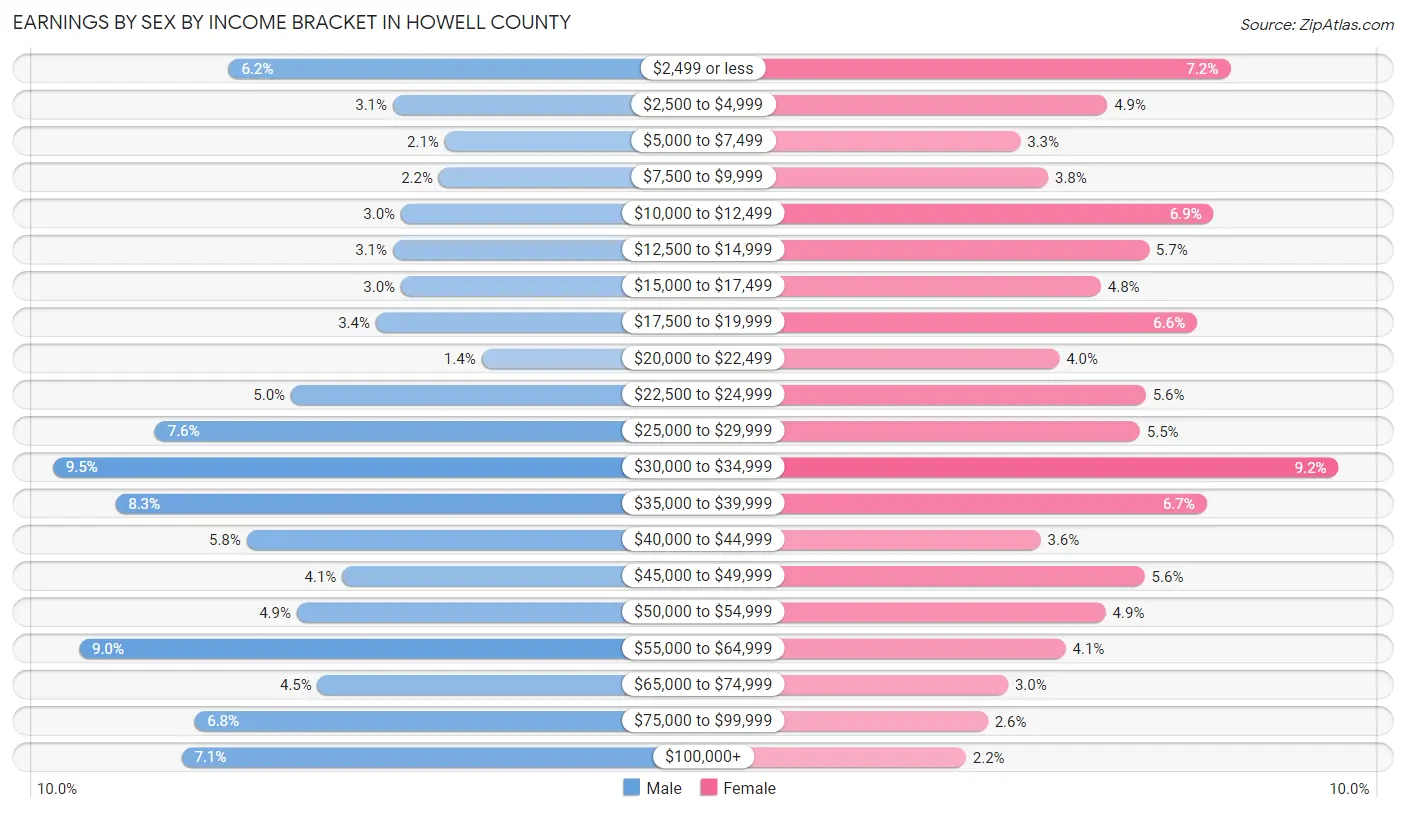
Earnings by Sex by Income Bracket in Howell County
The most common earnings brackets in Howell County are $30,000 to $34,999 for men (850 | 9.5%) and $30,000 to $34,999 for women (817 | 9.2%).
| Income | Male | Female |
| $2,499 or less | 555 (6.2%) | 637 (7.2%) |
| $2,500 to $4,999 | 278 (3.1%) | 433 (4.9%) |
| $5,000 to $7,499 | 191 (2.1%) | 288 (3.3%) |
| $7,500 to $9,999 | 201 (2.2%) | 334 (3.8%) |
| $10,000 to $12,499 | 265 (2.9%) | 609 (6.9%) |
| $12,500 to $14,999 | 278 (3.1%) | 502 (5.7%) |
| $15,000 to $17,499 | 265 (2.9%) | 422 (4.8%) |
| $17,500 to $19,999 | 307 (3.4%) | 582 (6.6%) |
| $20,000 to $22,499 | 129 (1.4%) | 353 (4.0%) |
| $22,500 to $24,999 | 450 (5.0%) | 497 (5.6%) |
| $25,000 to $29,999 | 679 (7.6%) | 487 (5.5%) |
| $30,000 to $34,999 | 850 (9.5%) | 817 (9.2%) |
| $35,000 to $39,999 | 745 (8.3%) | 598 (6.7%) |
| $40,000 to $44,999 | 524 (5.8%) | 322 (3.6%) |
| $45,000 to $49,999 | 364 (4.1%) | 495 (5.6%) |
| $50,000 to $54,999 | 440 (4.9%) | 430 (4.9%) |
| $55,000 to $64,999 | 806 (9.0%) | 364 (4.1%) |
| $65,000 to $74,999 | 405 (4.5%) | 268 (3.0%) |
| $75,000 to $99,999 | 612 (6.8%) | 234 (2.6%) |
| $100,000+ | 634 (7.1%) | 198 (2.2%) |
| Total | 8,978 (100.0%) | 8,870 (100.0%) |
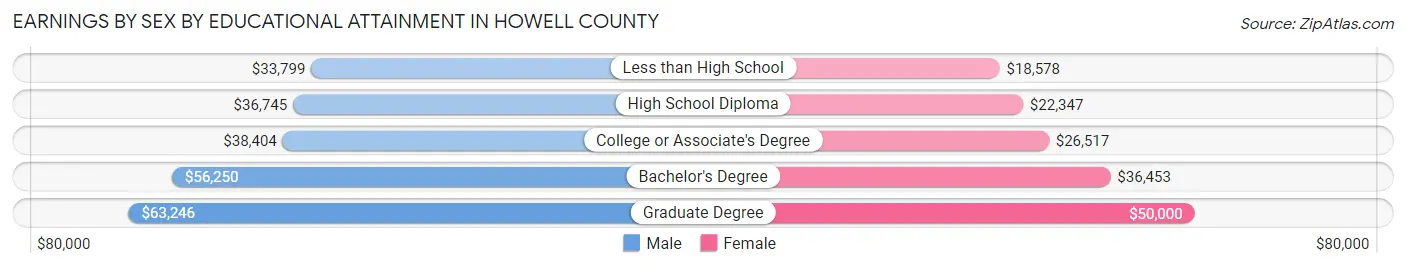
Earnings by Sex by Educational Attainment in Howell County
Average earnings in Howell County are $38,516 for men and $27,165 for women, a difference of 29.5%. Men with an educational attainment of graduate degree enjoy the highest average annual earnings of $63,246, while those with less than high school education earn the least with $33,799. Women with an educational attainment of graduate degree earn the most with the average annual earnings of $50,000, while those with less than high school education have the smallest earnings of $18,578.
| Educational Attainment | Male Income | Female Income |
| Less than High School | $33,799 | $18,578 |
| High School Diploma | $36,745 | $22,347 |
| College or Associate's Degree | $38,404 | $26,517 |
| Bachelor's Degree | $56,250 | $36,453 |
| Graduate Degree | $63,246 | $50,000 |
| Total | $38,516 | $27,165 |
Family Income in Howell County
Family Income Brackets in Howell County
According to the Howell County family income data, there are 2,222 families falling into the $50,000 to $74,999 income range, which is the most common income bracket and makes up 22.0% of all families. Conversely, the $150,000 to $199,999 income bracket is the least frequent group with only 273 families (2.7%) belonging to this category.
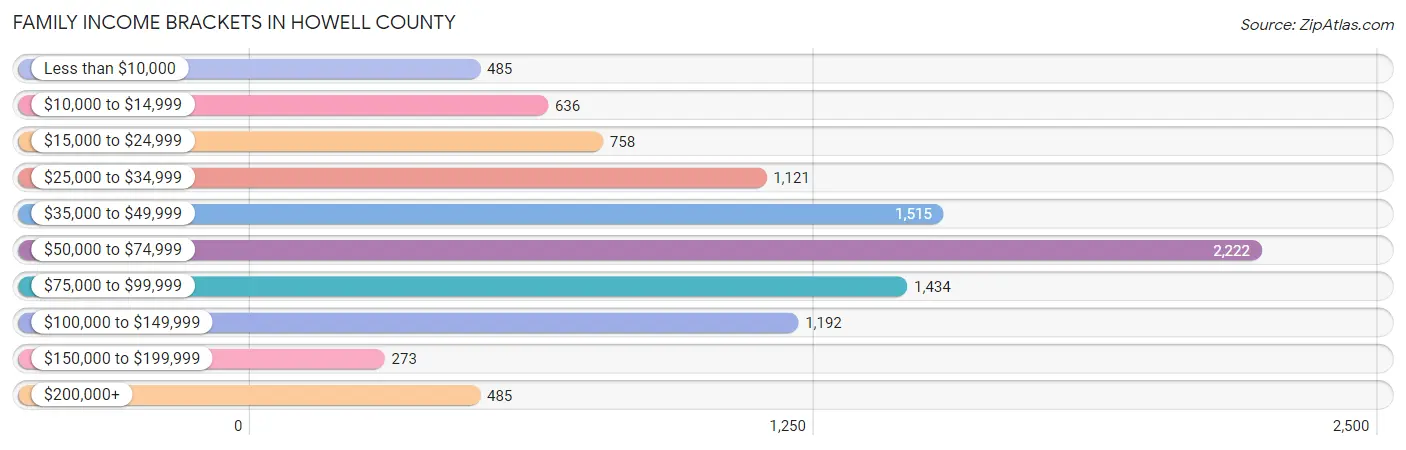
| Income Bracket | # Families | % Families |
| Less than $10,000 | 485 | 4.8% |
| $10,000 to $14,999 | 636 | 6.3% |
| $15,000 to $24,999 | 758 | 7.5% |
| $25,000 to $34,999 | 1,121 | 11.1% |
| $35,000 to $49,999 | 1,515 | 15.0% |
| $50,000 to $74,999 | 2,222 | 22.0% |
| $75,000 to $99,999 | 1,434 | 14.2% |
| $100,000 to $149,999 | 1,192 | 11.8% |
| $150,000 to $199,999 | 273 | 2.7% |
| $200,000+ | 485 | 4.8% |
Family Income by Famaliy Size in Howell County
5-person families (648 | 6.4%) account for the highest median family income in Howell County with $69,922 per family, while 2-person families (5,603 | 55.5%) have the highest median income of $27,507 per family member.
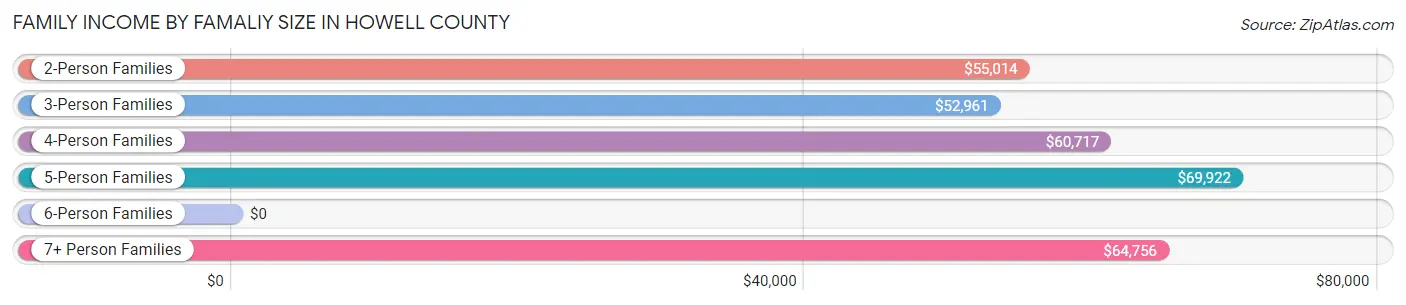
| Income Bracket | # Families | Median Income |
| 2-Person Families | 5,603 (55.5%) | $55,014 |
| 3-Person Families | 1,755 (17.4%) | $52,961 |
| 4-Person Families | 1,533 (15.2%) | $60,717 |
| 5-Person Families | 648 (6.4%) | $69,922 |
| 6-Person Families | 307 (3.0%) | $0 |
| 7+ Person Families | 256 (2.5%) | $64,756 |
| Total | 10,102 (100.0%) | $55,746 |
Family Income by Number of Earners in Howell County
The median family income in Howell County is $55,746, with families comprising 3+ earners (721) having the highest median family income of $116,979, while families with no earners (2,350) have the lowest median family income of $31,548, accounting for 7.1% and 23.3% of families, respectively.
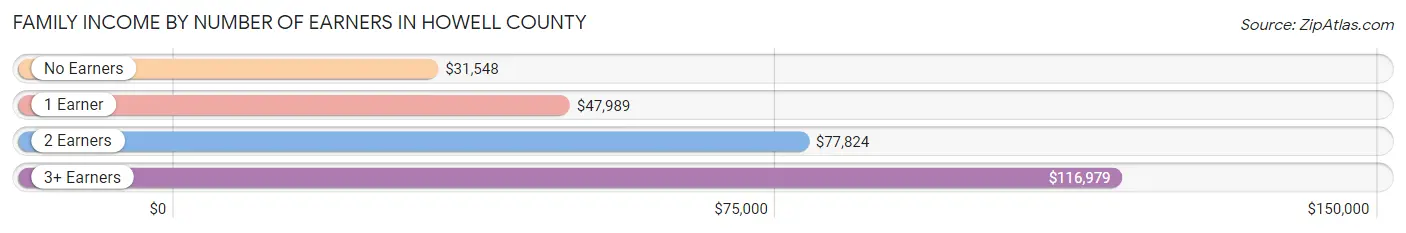
| Number of Earners | # Families | Median Income |
| No Earners | 2,350 (23.3%) | $31,548 |
| 1 Earner | 3,386 (33.5%) | $47,989 |
| 2 Earners | 3,645 (36.1%) | $77,824 |
| 3+ Earners | 721 (7.1%) | $116,979 |
| Total | 10,102 (100.0%) | $55,746 |
Household Income in Howell County
Household Income Brackets in Howell County
With 3,164 households falling in the category, the $50,000 to $74,999 income range is the most frequent in Howell County, accounting for 20.5% of all households. In contrast, only 293 households (1.9%) fall into the $150,000 to $199,999 income bracket, making it the least populous group.
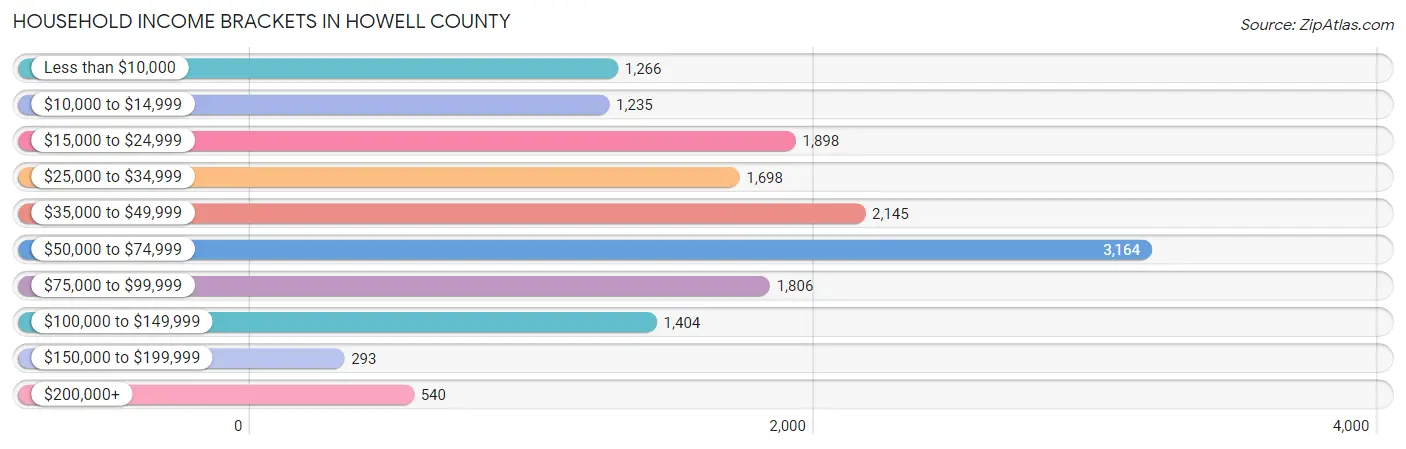
| Income Bracket | # Households | % Households |
| Less than $10,000 | 1,266 | 8.2% |
| $10,000 to $14,999 | 1,235 | 8.0% |
| $15,000 to $24,999 | 1,898 | 12.3% |
| $25,000 to $34,999 | 1,698 | 11.0% |
| $35,000 to $49,999 | 2,145 | 13.9% |
| $50,000 to $74,999 | 3,164 | 20.5% |
| $75,000 to $99,999 | 1,806 | 11.7% |
| $100,000 to $149,999 | 1,404 | 9.1% |
| $150,000 to $199,999 | 293 | 1.9% |
| $200,000+ | 540 | 3.5% |
Household Income by Householder Age in Howell County
The median household income in Howell County is $46,401, with the highest median household income of $59,914 found in the 25 to 44 years age bracket for the primary householder. A total of 4,421 households (28.6%) fall into this category. Meanwhile, the 65+ years age bracket for the primary householder has the lowest median household income of $32,381, with 5,023 households (32.6%) in this group.
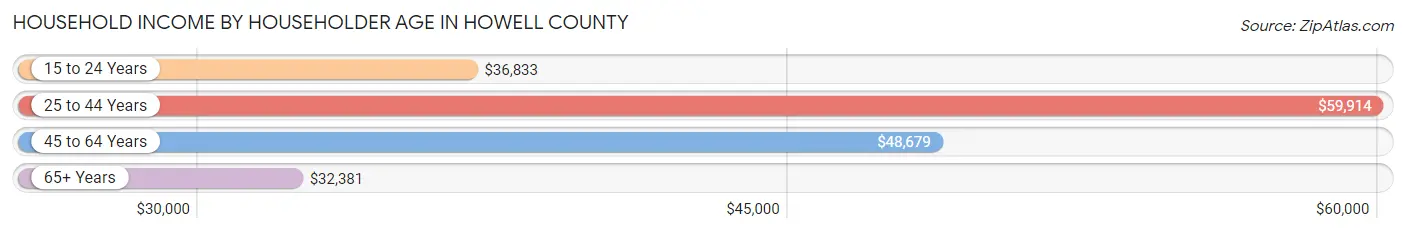
| Income Bracket | # Households | Median Income |
| 15 to 24 Years | 626 (4.1%) | $36,833 |
| 25 to 44 Years | 4,421 (28.6%) | $59,914 |
| 45 to 64 Years | 5,363 (34.7%) | $48,679 |
| 65+ Years | 5,023 (32.6%) | $32,381 |
| Total | 15,433 (100.0%) | $46,401 |
Poverty in Howell County
Income Below Poverty by Sex and Age in Howell County
With 20.3% poverty level for males and 25.5% for females among the residents of Howell County, 6 to 11 year old males and 15 year old females are the most vulnerable to poverty, with 854 males (45.6%) and 85 females (51.5%) in their respective age groups living below the poverty level.
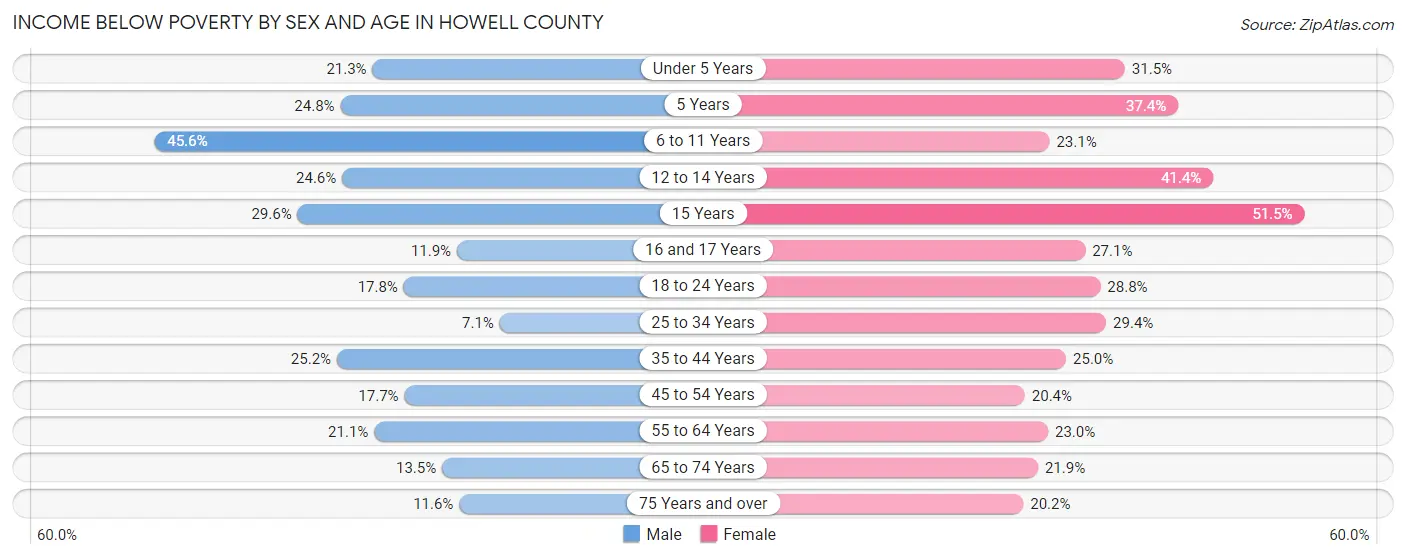
| Age Bracket | Male | Female |
| Under 5 Years | 264 (21.3%) | 367 (31.5%) |
| 5 Years | 37 (24.8%) | 73 (37.4%) |
| 6 to 11 Years | 854 (45.6%) | 356 (23.1%) |
| 12 to 14 Years | 154 (24.6%) | 366 (41.4%) |
| 15 Years | 98 (29.6%) | 85 (51.5%) |
| 16 and 17 Years | 64 (11.8%) | 180 (27.1%) |
| 18 to 24 Years | 279 (17.8%) | 421 (28.8%) |
| 25 to 34 Years | 155 (7.1%) | 685 (29.4%) |
| 35 to 44 Years | 591 (25.2%) | 574 (25.0%) |
| 45 to 54 Years | 418 (17.7%) | 497 (20.4%) |
| 55 to 64 Years | 540 (21.1%) | 641 (23.0%) |
| 65 to 74 Years | 278 (13.5%) | 519 (21.8%) |
| 75 Years and over | 151 (11.6%) | 359 (20.2%) |
| Total | 3,883 (20.3%) | 5,123 (25.5%) |
Income Above Poverty by Sex and Age in Howell County
According to the poverty statistics in Howell County, males aged 25 to 34 years and females aged 75 years and over are the age groups that are most secure financially, with 92.9% of males and 79.8% of females in these age groups living above the poverty line.
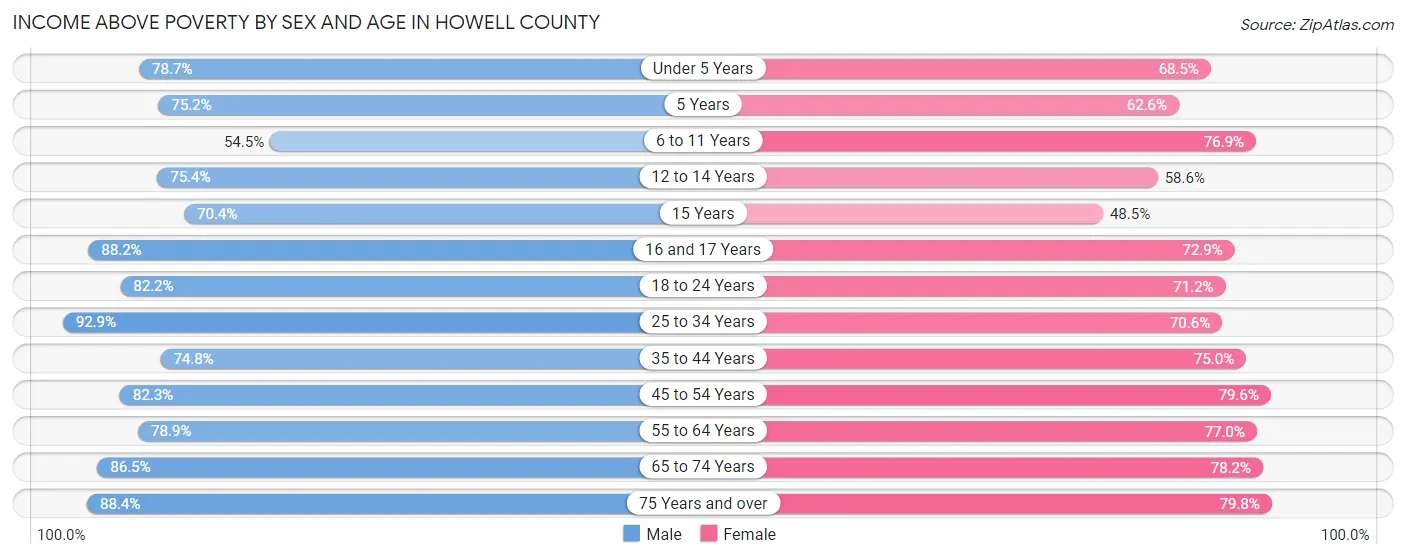
| Age Bracket | Male | Female |
| Under 5 Years | 978 (78.7%) | 797 (68.5%) |
| 5 Years | 112 (75.2%) | 122 (62.6%) |
| 6 to 11 Years | 1,021 (54.4%) | 1,183 (76.9%) |
| 12 to 14 Years | 471 (75.4%) | 519 (58.6%) |
| 15 Years | 233 (70.4%) | 80 (48.5%) |
| 16 and 17 Years | 476 (88.1%) | 484 (72.9%) |
| 18 to 24 Years | 1,290 (82.2%) | 1,041 (71.2%) |
| 25 to 34 Years | 2,031 (92.9%) | 1,642 (70.6%) |
| 35 to 44 Years | 1,752 (74.8%) | 1,724 (75.0%) |
| 45 to 54 Years | 1,943 (82.3%) | 1,940 (79.6%) |
| 55 to 64 Years | 2,023 (78.9%) | 2,150 (77.0%) |
| 65 to 74 Years | 1,780 (86.5%) | 1,856 (78.1%) |
| 75 Years and over | 1,151 (88.4%) | 1,417 (79.8%) |
| Total | 15,261 (79.7%) | 14,955 (74.5%) |
Income Below Poverty Among Married-Couple Families in Howell County
The poverty statistics for married-couple families in Howell County show that 9.6% or 739 of the total 7,675 families live below the poverty line. Families with 5 or more children have the highest poverty rate of 38.4%, comprising of 48 families. On the other hand, families with 1 or 2 children have the lowest poverty rate of 5.4%, which includes 97 families.
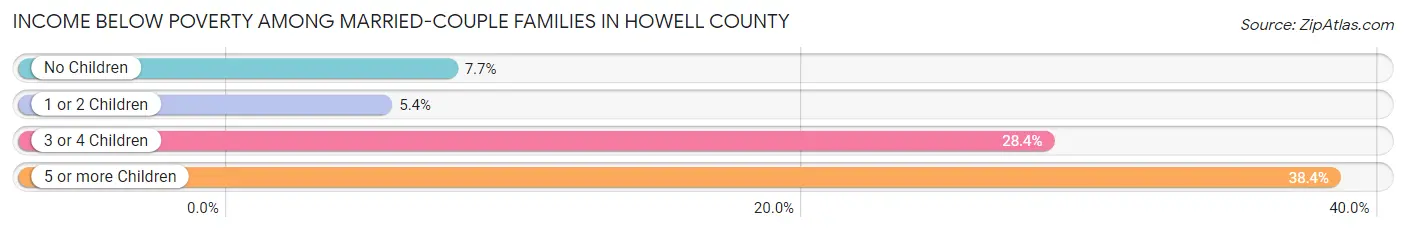
| Children | Above Poverty | Below Poverty |
| No Children | 4,614 (92.3%) | 382 (7.6%) |
| 1 or 2 Children | 1,711 (94.6%) | 97 (5.4%) |
| 3 or 4 Children | 534 (71.6%) | 212 (28.4%) |
| 5 or more Children | 77 (61.6%) | 48 (38.4%) |
| Total | 6,936 (90.4%) | 739 (9.6%) |
Income Below Poverty Among Single-Parent Households in Howell County
According to the poverty data in Howell County, 37.8% or 298 single-father households and 42.2% or 691 single-mother households are living below the poverty line. Among single-father households, those with 5 or more children have the highest poverty rate, with 18 households (100.0%) experiencing poverty. Likewise, among single-mother households, those with 3 or 4 children have the highest poverty rate, with 187 households (66.8%) falling below the poverty line.
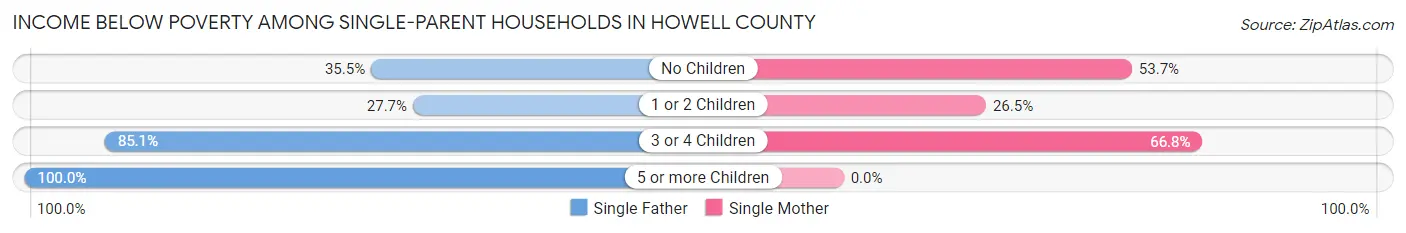
| Children | Single Father | Single Mother |
| No Children | 77 (35.5%) | 284 (53.7%) |
| 1 or 2 Children | 129 (27.7%) | 220 (26.5%) |
| 3 or 4 Children | 74 (85.1%) | 187 (66.8%) |
| 5 or more Children | 18 (100.0%) | 0 (0.0%) |
| Total | 298 (37.8%) | 691 (42.2%) |
Income Below Poverty Among Married-Couple vs Single-Parent Households in Howell County
The poverty data for Howell County shows that 739 of the married-couple family households (9.6%) and 989 of the single-parent households (40.7%) are living below the poverty level. Within the married-couple family households, those with 5 or more children have the highest poverty rate, with 48 households (38.4%) falling below the poverty line. Among the single-parent households, those with 5 or more children have the highest poverty rate, with 18 household (100.0%) living below poverty.
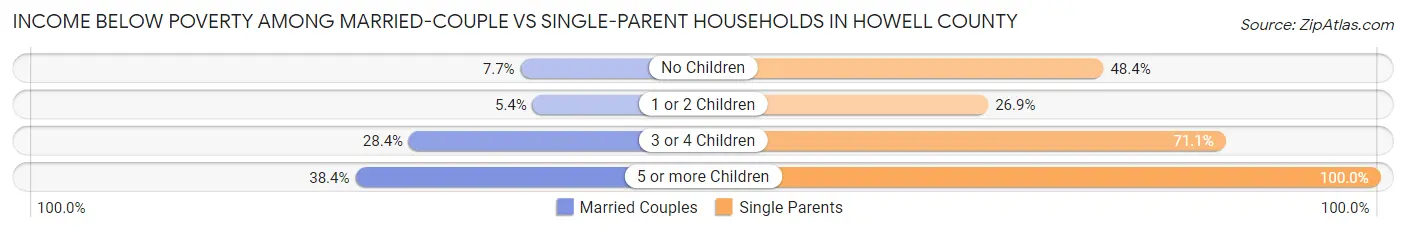
| Children | Married-Couple Families | Single-Parent Households |
| No Children | 382 (7.6%) | 361 (48.4%) |
| 1 or 2 Children | 97 (5.4%) | 349 (26.9%) |
| 3 or 4 Children | 212 (28.4%) | 261 (71.1%) |
| 5 or more Children | 48 (38.4%) | 18 (100.0%) |
| Total | 739 (9.6%) | 989 (40.7%) |
Race in Howell County
The most populous races in Howell County are White / Caucasian (37,521 | 93.9%), Two or more Races (1,587 | 4.0%), and Hispanic or Latino (977 | 2.4%).
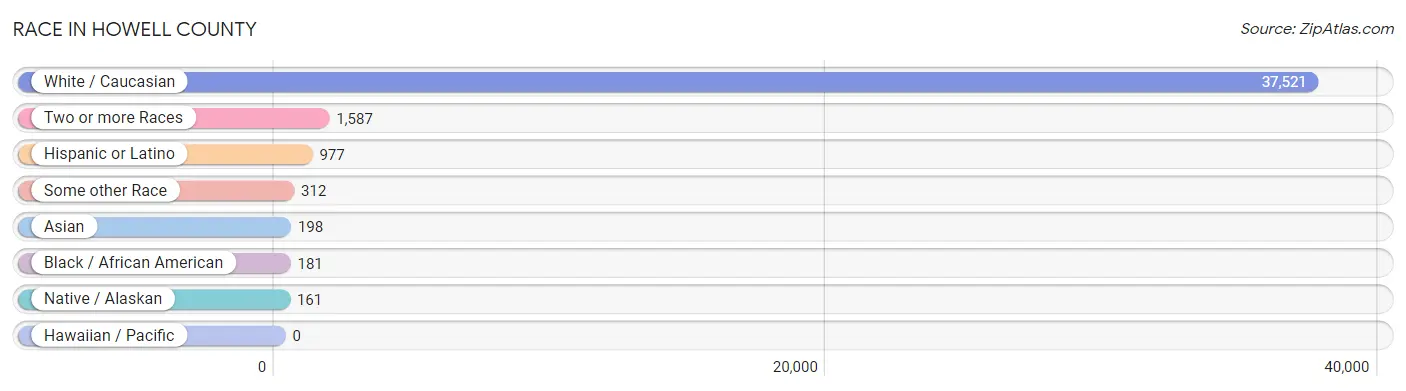
| Race | # Population | % Population |
| Asian | 198 | 0.5% |
| Black / African American | 181 | 0.4% |
| Hawaiian / Pacific | 0 | 0.0% |
| Hispanic or Latino | 977 | 2.4% |
| Native / Alaskan | 161 | 0.4% |
| White / Caucasian | 37,521 | 93.9% |
| Two or more Races | 1,587 | 4.0% |
| Some other Race | 312 | 0.8% |
| Total | 39,960 | 100.0% |
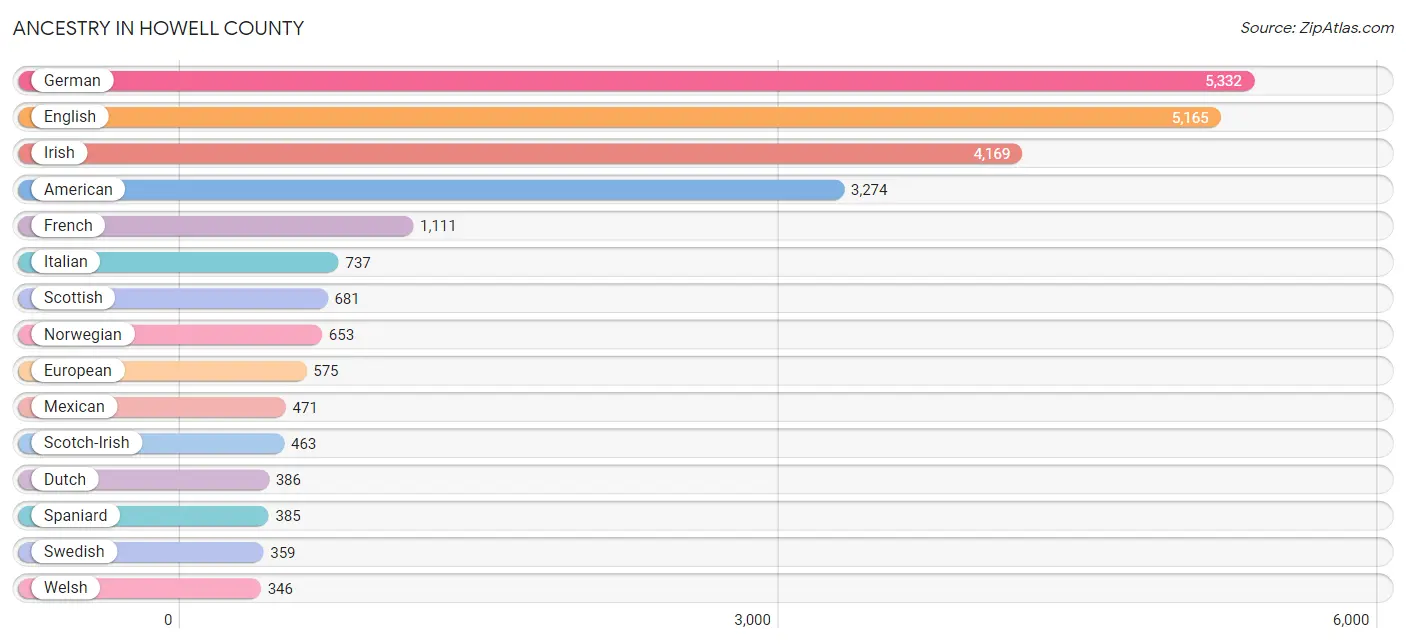
Ancestry in Howell County
The most populous ancestries reported in Howell County are German (5,332 | 13.3%), English (5,165 | 12.9%), Irish (4,169 | 10.4%), American (3,274 | 8.2%), and French (1,111 | 2.8%), together accounting for 47.7% of all Howell County residents.
| Ancestry | # Population | % Population |
| African | 77 | 0.2% |
| American | 3,274 | 8.2% |
| Arab | 13 | 0.0% |
| Argentinean | 19 | 0.1% |
| Armenian | 64 | 0.2% |
| Austrian | 65 | 0.2% |
| Barbadian | 8 | 0.0% |
| Belgian | 24 | 0.1% |
| Bhutanese | 19 | 0.1% |
| British | 79 | 0.2% |
| Bulgarian | 5 | 0.0% |
| Burmese | 4 | 0.0% |
| Cajun | 7 | 0.0% |
| Canadian | 61 | 0.2% |
| Celtic | 4 | 0.0% |
| Cherokee | 333 | 0.8% |
| Choctaw | 84 | 0.2% |
| Comanche | 42 | 0.1% |
| Creek | 6 | 0.0% |
| Czech | 27 | 0.1% |
| Czechoslovakian | 35 | 0.1% |
| Danish | 28 | 0.1% |
| Dutch | 386 | 1.0% |
| Eastern European | 11 | 0.0% |
| English | 5,165 | 12.9% |
| European | 575 | 1.4% |
| Finnish | 45 | 0.1% |
| French | 1,111 | 2.8% |
| French American Indian | 6 | 0.0% |
| French Canadian | 23 | 0.1% |
| German | 5,332 | 13.3% |
| Hungarian | 44 | 0.1% |
| Indian (Asian) | 3 | 0.0% |
| Irish | 4,169 | 10.4% |
| Italian | 737 | 1.8% |
| Korean | 214 | 0.5% |
| Lithuanian | 50 | 0.1% |
| Lumbee | 6 | 0.0% |
| Luxembourger | 6 | 0.0% |
| Maltese | 4 | 0.0% |
| Mexican | 471 | 1.2% |
| Navajo | 35 | 0.1% |
| Northern European | 32 | 0.1% |
| Norwegian | 653 | 1.6% |
| Pennsylvania German | 75 | 0.2% |
| Polish | 269 | 0.7% |
| Portuguese | 23 | 0.1% |
| Potawatomi | 6 | 0.0% |
| Puerto Rican | 11 | 0.0% |
| Romanian | 97 | 0.2% |
| Russian | 59 | 0.2% |
| Samoan | 37 | 0.1% |
| Scandinavian | 85 | 0.2% |
| Scotch-Irish | 463 | 1.2% |
| Scottish | 681 | 1.7% |
| Seminole | 5 | 0.0% |
| South American | 19 | 0.1% |
| Spaniard | 385 | 1.0% |
| Spanish | 91 | 0.2% |
| Sri Lankan | 69 | 0.2% |
| Subsaharan African | 86 | 0.2% |
| Sudanese | 9 | 0.0% |
| Swedish | 359 | 0.9% |
| Swiss | 46 | 0.1% |
| Taiwanese | 10 | 0.0% |
| Thai | 79 | 0.2% |
| Ukrainian | 169 | 0.4% |
| Welsh | 346 | 0.9% | View All 68 Rows |
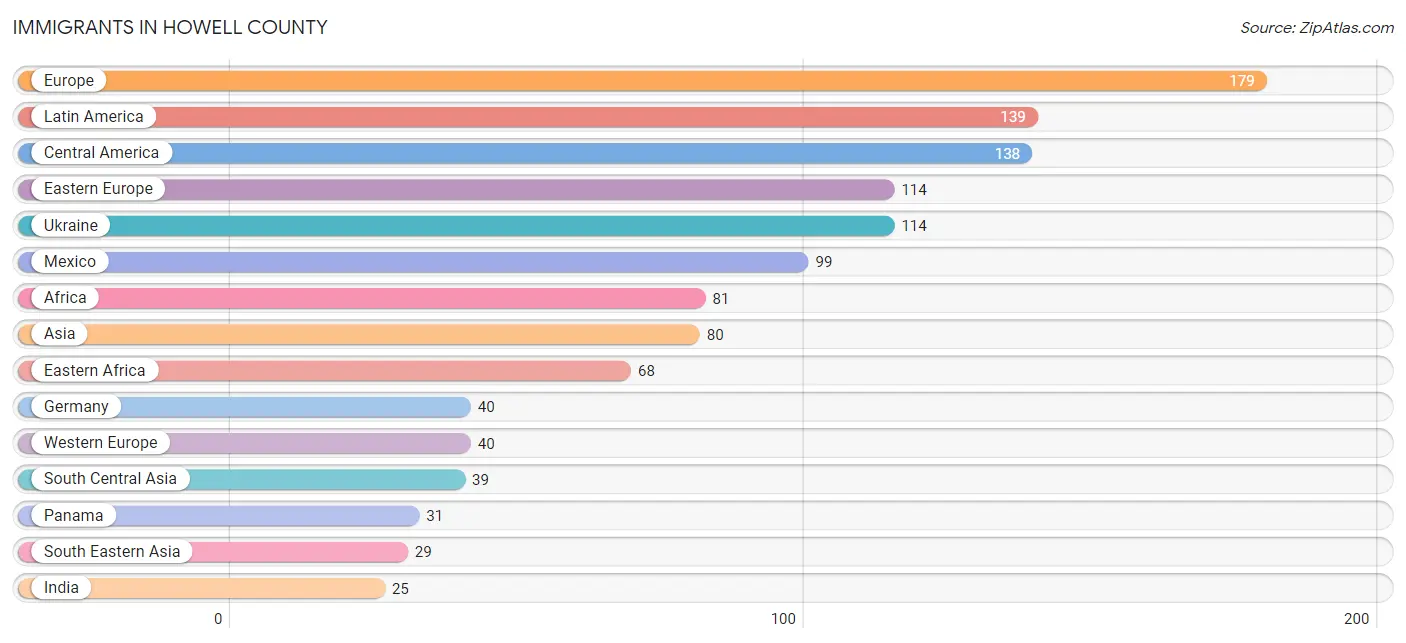
Immigrants in Howell County
The most numerous immigrant groups reported in Howell County came from Europe (179 | 0.4%), Latin America (139 | 0.4%), Central America (138 | 0.4%), Eastern Europe (114 | 0.3%), and Ukraine (114 | 0.3%), together accounting for 1.7% of all Howell County residents.
| Immigration Origin | # Population | % Population |
| Africa | 81 | 0.2% |
| Asia | 80 | 0.2% |
| Canada | 6 | 0.0% |
| Central America | 138 | 0.4% |
| China | 2 | 0.0% |
| Eastern Africa | 68 | 0.2% |
| Eastern Asia | 12 | 0.0% |
| Eastern Europe | 114 | 0.3% |
| Egypt | 13 | 0.0% |
| Europe | 179 | 0.4% |
| Germany | 40 | 0.1% |
| India | 25 | 0.1% |
| Japan | 10 | 0.0% |
| Latin America | 139 | 0.4% |
| Mexico | 99 | 0.3% |
| Nepal | 14 | 0.0% |
| Northern Africa | 13 | 0.0% |
| Northern Europe | 25 | 0.1% |
| Panama | 31 | 0.1% |
| Peru | 1 | 0.0% |
| Philippines | 19 | 0.1% |
| South America | 1 | 0.0% |
| South Central Asia | 39 | 0.1% |
| South Eastern Asia | 29 | 0.1% |
| Ukraine | 114 | 0.3% |
| Vietnam | 10 | 0.0% |
| Western Europe | 40 | 0.1% | View All 27 Rows |
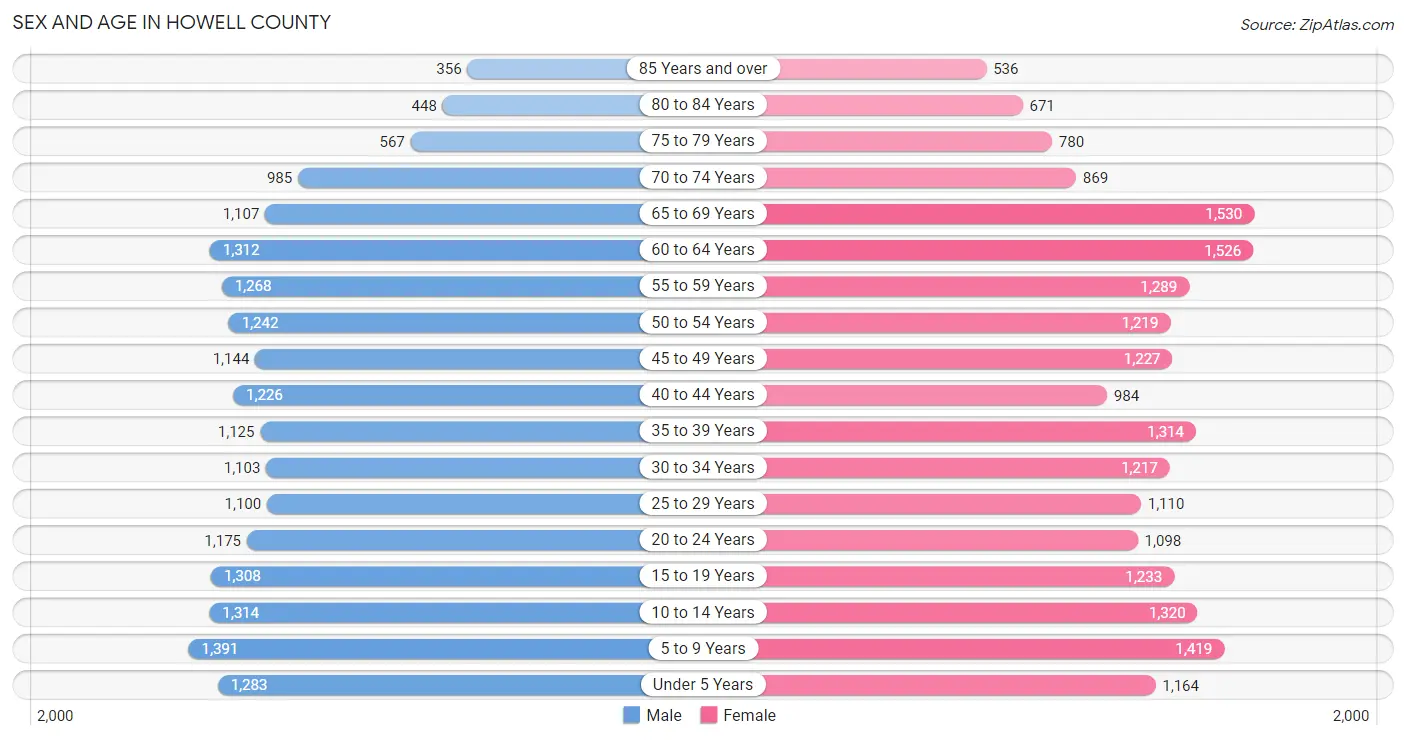
Sex and Age in Howell County
Sex and Age in Howell County
The most populous age groups in Howell County are 5 to 9 Years (1,391 | 7.1%) for men and 65 to 69 Years (1,530 | 7.5%) for women.
| Age Bracket | Male | Female |
| Under 5 Years | 1,283 (6.6%) | 1,164 (5.7%) |
| 5 to 9 Years | 1,391 (7.1%) | 1,419 (6.9%) |
| 10 to 14 Years | 1,314 (6.8%) | 1,320 (6.4%) |
| 15 to 19 Years | 1,308 (6.7%) | 1,233 (6.0%) |
| 20 to 24 Years | 1,175 (6.0%) | 1,098 (5.3%) |
| 25 to 29 Years | 1,100 (5.7%) | 1,110 (5.4%) |
| 30 to 34 Years | 1,103 (5.7%) | 1,217 (5.9%) |
| 35 to 39 Years | 1,125 (5.8%) | 1,314 (6.4%) |
| 40 to 44 Years | 1,226 (6.3%) | 984 (4.8%) |
| 45 to 49 Years | 1,144 (5.9%) | 1,227 (6.0%) |
| 50 to 54 Years | 1,242 (6.4%) | 1,219 (5.9%) |
| 55 to 59 Years | 1,268 (6.5%) | 1,289 (6.3%) |
| 60 to 64 Years | 1,312 (6.7%) | 1,526 (7.4%) |
| 65 to 69 Years | 1,107 (5.7%) | 1,530 (7.5%) |
| 70 to 74 Years | 985 (5.1%) | 869 (4.2%) |
| 75 to 79 Years | 567 (2.9%) | 780 (3.8%) |
| 80 to 84 Years | 448 (2.3%) | 671 (3.3%) |
| 85 Years and over | 356 (1.8%) | 536 (2.6%) |
| Total | 19,454 (100.0%) | 20,506 (100.0%) |
Families and Households in Howell County
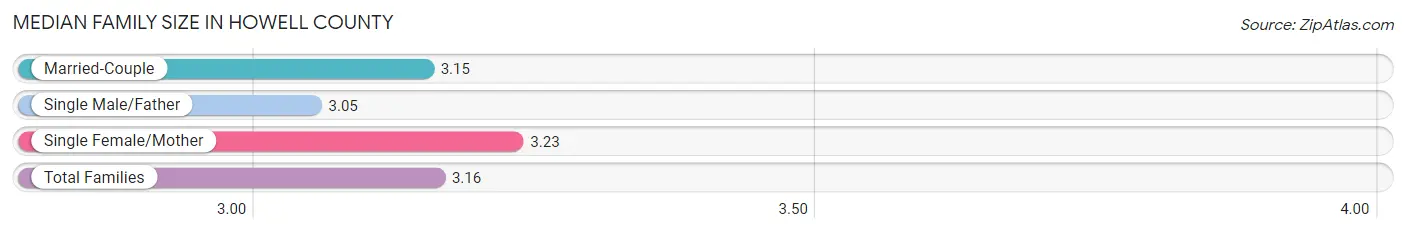
Median Family Size in Howell County
The median family size in Howell County is 3.16 persons per family, with single female/mother families (1,639 | 16.2%) accounting for the largest median family size of 3.23 persons per family. On the other hand, single male/father families (788 | 7.8%) represent the smallest median family size with 3.05 persons per family.
| Family Type | # Families | Family Size |
| Married-Couple | 7,675 (76.0%) | 3.15 |
| Single Male/Father | 788 (7.8%) | 3.05 |
| Single Female/Mother | 1,639 (16.2%) | 3.23 |
| Total Families | 10,102 (100.0%) | 3.16 |
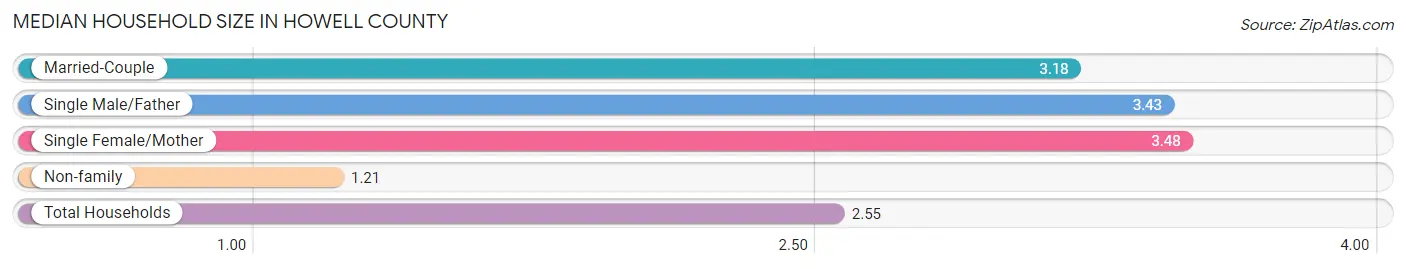
Median Household Size in Howell County
The median household size in Howell County is 2.55 persons per household, with single female/mother households (1,639 | 10.6%) accounting for the largest median household size of 3.48 persons per household. non-family households (5,331 | 34.5%) represent the smallest median household size with 1.21 persons per household.
| Household Type | # Households | Household Size |
| Married-Couple | 7,675 (49.7%) | 3.18 |
| Single Male/Father | 788 (5.1%) | 3.43 |
| Single Female/Mother | 1,639 (10.6%) | 3.48 |
| Non-family | 5,331 (34.5%) | 1.21 |
| Total Households | 15,433 (100.0%) | 2.55 |
Household Size by Marriage Status in Howell County
Out of a total of 15,433 households in Howell County, 10,102 (65.5%) are family households, while 5,331 (34.5%) are nonfamily households. The most numerous type of family households are 2-person households, comprising 5,108, and the most common type of nonfamily households are 1-person households, comprising 4,586.
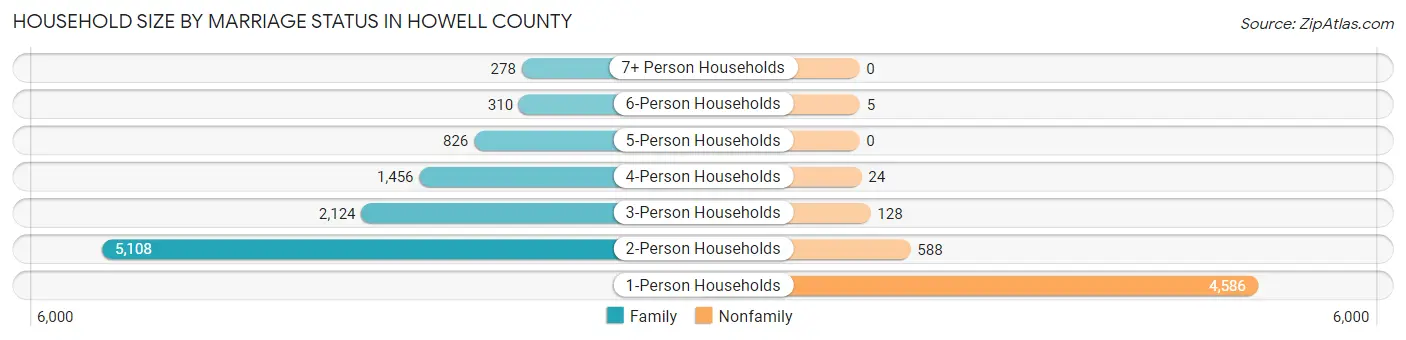
| Household Size | Family Households | Nonfamily Households |
| 1-Person Households | - | 4,586 (29.7%) |
| 2-Person Households | 5,108 (33.1%) | 588 (3.8%) |
| 3-Person Households | 2,124 (13.8%) | 128 (0.8%) |
| 4-Person Households | 1,456 (9.4%) | 24 (0.2%) |
| 5-Person Households | 826 (5.3%) | 0 (0.0%) |
| 6-Person Households | 310 (2.0%) | 5 (0.0%) |
| 7+ Person Households | 278 (1.8%) | 0 (0.0%) |
| Total | 10,102 (65.5%) | 5,331 (34.5%) |
Female Fertility in Howell County
Fertility by Age in Howell County
Average fertility rate in Howell County is 72.0 births per 1,000 women. Women in the age bracket of 20 to 34 years have the highest fertility rate with 137.0 births per 1,000 women. Women in the age bracket of 20 to 34 years acount for 77.6% of all women with births.
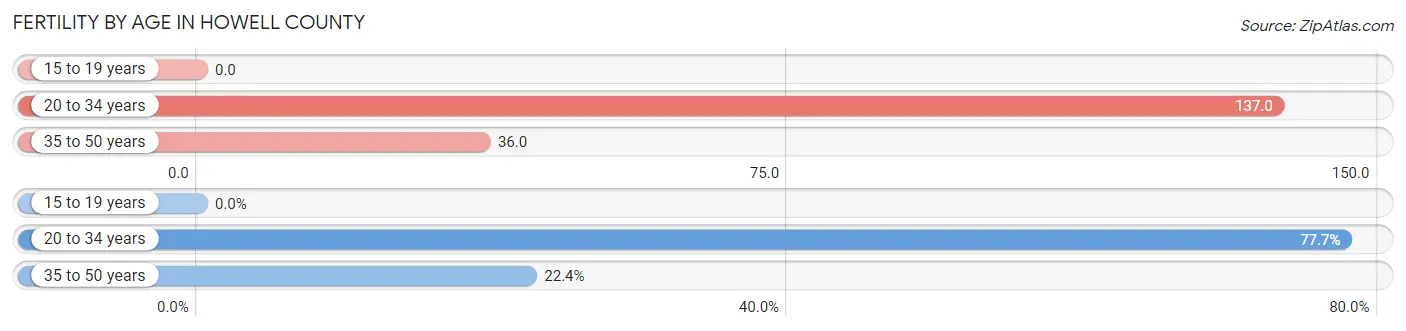
| Age Bracket | Women with Births | Births / 1,000 Women |
| 15 to 19 years | 0 (0.0%) | 0.0 |
| 20 to 34 years | 469 (77.6%) | 137.0 |
| 35 to 50 years | 135 (22.4%) | 36.0 |
| Total | 604 (100.0%) | 72.0 |
Fertility by Age by Marriage Status in Howell County
78.8% of women with births (604) in Howell County are married. The highest percentage of unmarried women with births falls into 35 to 50 years age bracket with 43.7% of them unmarried at the time of birth, while the lowest percentage of unmarried women with births belong to 20 to 34 years age bracket with 14.7% of them unmarried.
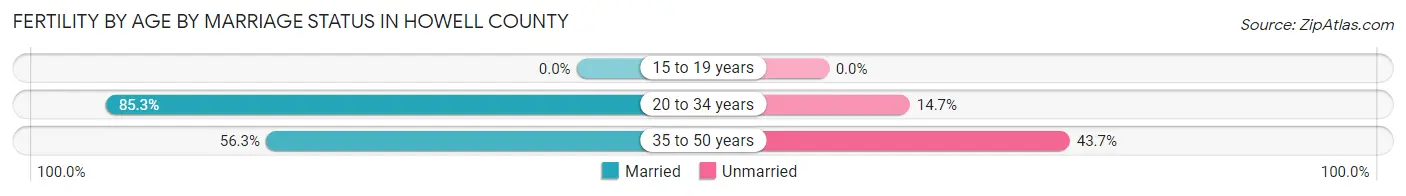
| Age Bracket | Married | Unmarried |
| 15 to 19 years | 0 (0.0%) | 0 (0.0%) |
| 20 to 34 years | 400 (85.3%) | 69 (14.7%) |
| 35 to 50 years | 76 (56.3%) | 59 (43.7%) |
| Total | 476 (78.8%) | 128 (21.2%) |
Fertility by Education in Howell County
Average fertility rate in Howell County is 72.0 births per 1,000 women. Women with the education attainment of graduate degree have the highest fertility rate of 150.0 births per 1,000 women, while women with the education attainment of high school diploma have the lowest fertility at 55.0 births per 1,000 women. Women with the education attainment of college or associate's degree represent 29.6% of all women with births.
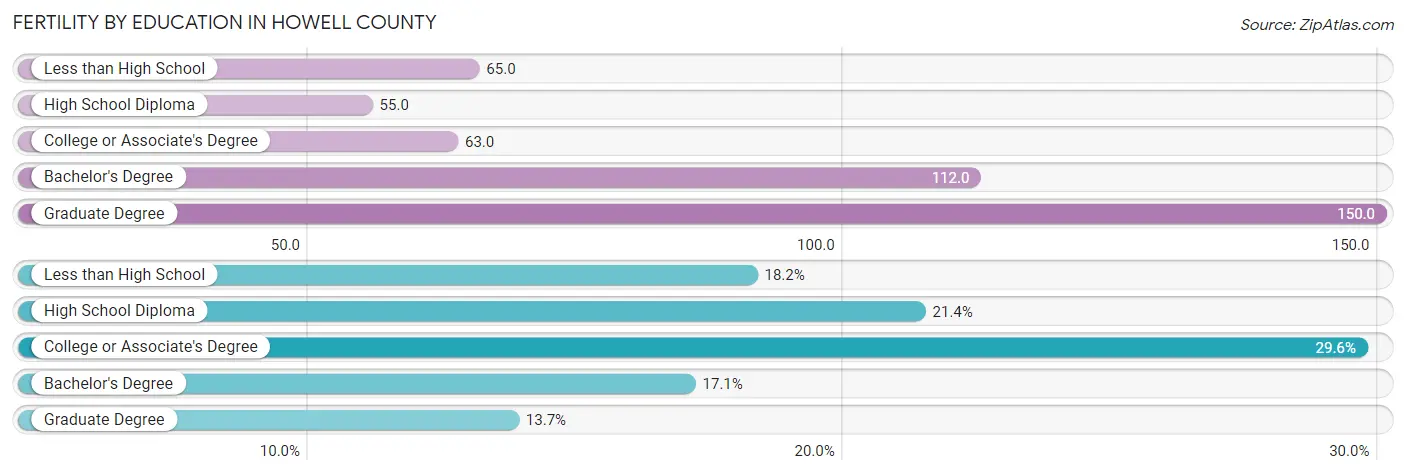
| Educational Attainment | Women with Births | Births / 1,000 Women |
| Less than High School | 110 (18.2%) | 65.0 |
| High School Diploma | 129 (21.4%) | 55.0 |
| College or Associate's Degree | 179 (29.6%) | 63.0 |
| Bachelor's Degree | 103 (17.1%) | 112.0 |
| Graduate Degree | 83 (13.7%) | 150.0 |
| Total | 604 (100.0%) | 72.0 |
Fertility by Education by Marriage Status in Howell County
21.2% of women with births in Howell County are unmarried. Women with the educational attainment of graduate degree are most likely to be married with 100.0% of them married at childbirth, while women with the educational attainment of less than high school are least likely to be married with 78.2% of them unmarried at childbirth.
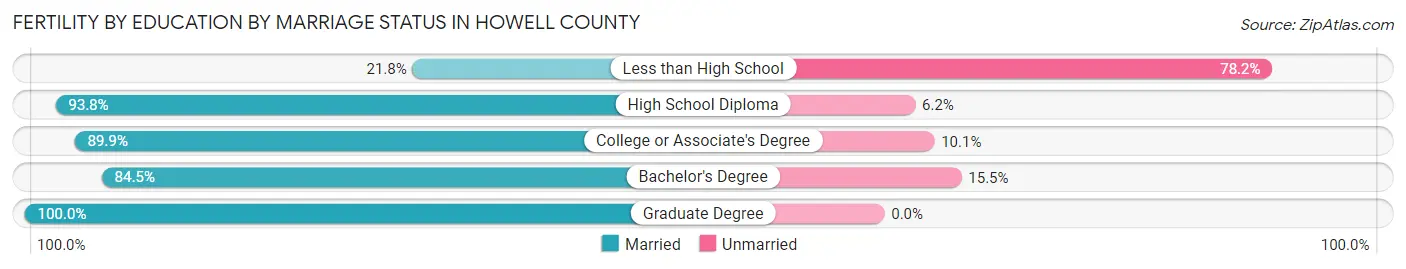
| Educational Attainment | Married | Unmarried |
| Less than High School | 24 (21.8%) | 86 (78.2%) |
| High School Diploma | 121 (93.8%) | 8 (6.2%) |
| College or Associate's Degree | 161 (89.9%) | 18 (10.1%) |
| Bachelor's Degree | 87 (84.5%) | 16 (15.5%) |
| Graduate Degree | 83 (100.0%) | 0 (0.0%) |
| Total | 476 (78.8%) | 128 (21.2%) |
Employment Characteristics in Howell County
Employment by Class of Employer in Howell County
Among the 15,459 employed individuals in Howell County, private company employees (9,130 | 59.1%), not-for-profit organizations (1,710 | 11.1%), and local government employees (1,690 | 10.9%) make up the most common classes of employment.
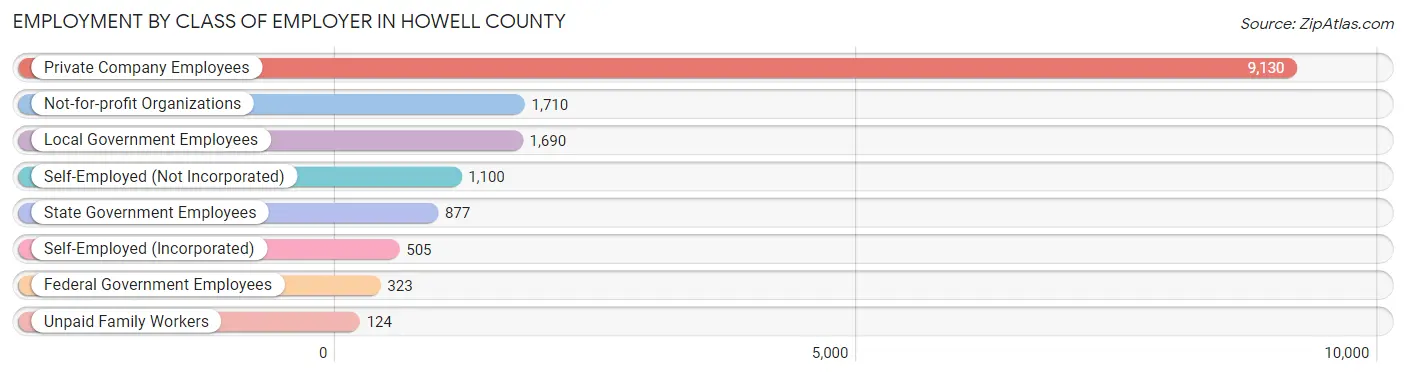
| Employer Class | # Employees | % Employees |
| Private Company Employees | 9,130 | 59.1% |
| Self-Employed (Incorporated) | 505 | 3.3% |
| Self-Employed (Not Incorporated) | 1,100 | 7.1% |
| Not-for-profit Organizations | 1,710 | 11.1% |
| Local Government Employees | 1,690 | 10.9% |
| State Government Employees | 877 | 5.7% |
| Federal Government Employees | 323 | 2.1% |
| Unpaid Family Workers | 124 | 0.8% |
| Total | 15,459 | 100.0% |
Employment Status by Age in Howell County
According to the labor force statistics for Howell County, out of the total population over 16 years of age (31,573), 53.5% or 16,892 individuals are in the labor force, with 5.5% or 929 of them unemployed. The age group with the highest labor force participation rate is 25 to 29 years, with 86.6% or 1,914 individuals in the labor force. Within the labor force, the 30 to 34 years age range has the highest percentage of unemployed individuals, with 9.8% or 183 of them being unemployed.
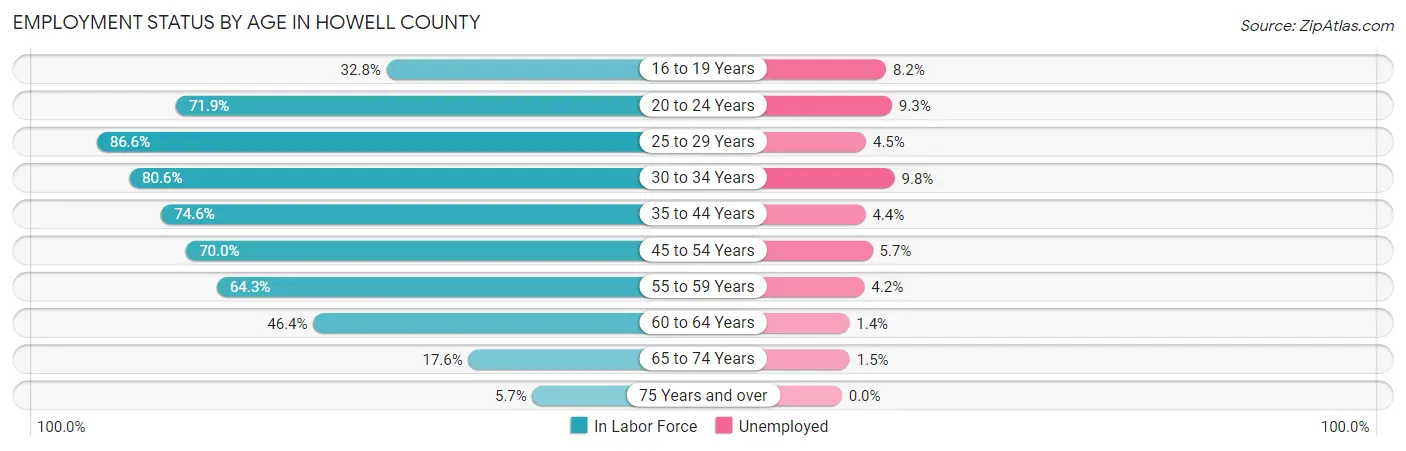
| Age Bracket | In Labor Force | Unemployed |
| 16 to 19 Years | 671 (32.8%) | 55 (8.2%) |
| 20 to 24 Years | 1,634 (71.9%) | 152 (9.3%) |
| 25 to 29 Years | 1,914 (86.6%) | 86 (4.5%) |
| 30 to 34 Years | 1,870 (80.6%) | 183 (9.8%) |
| 35 to 44 Years | 3,468 (74.6%) | 153 (4.4%) |
| 45 to 54 Years | 3,382 (70.0%) | 193 (5.7%) |
| 55 to 59 Years | 1,644 (64.3%) | 69 (4.2%) |
| 60 to 64 Years | 1,317 (46.4%) | 18 (1.4%) |
| 65 to 74 Years | 790 (17.6%) | 12 (1.5%) |
| 75 Years and over | 191 (5.7%) | 0 (0.0%) |
| Total | 16,892 (53.5%) | 929 (5.5%) |
Employment Status by Educational Attainment in Howell County
According to labor force statistics for Howell County, 70.0% of individuals (13,584) out of the total population between 25 and 64 years of age (19,406) are in the labor force, with 5.2% or 706 of them being unemployed. The group with the highest labor force participation rate are those with the educational attainment of bachelor's degree or higher, with 81.1% or 3,216 individuals in the labor force. Within the labor force, individuals with high school diploma education have the highest percentage of unemployment, with 8.1% or 405 of them being unemployed.
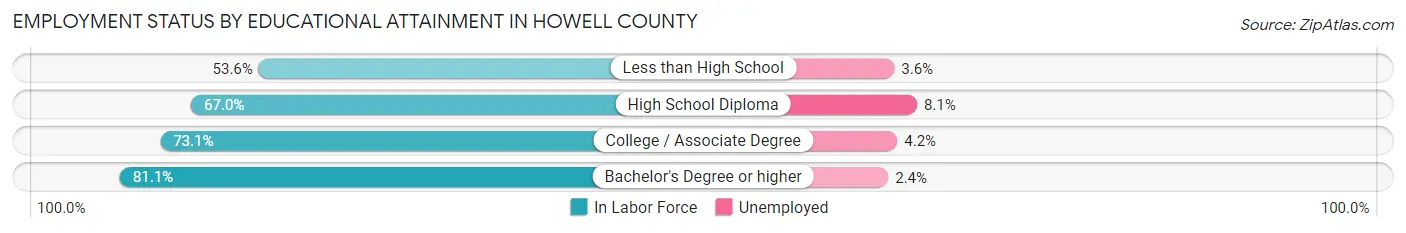
| Educational Attainment | In Labor Force | Unemployed |
| Less than High School | 1,261 (53.6%) | 85 (3.6%) |
| High School Diploma | 4,995 (67.0%) | 604 (8.1%) |
| College / Associate Degree | 4,117 (73.1%) | 237 (4.2%) |
| Bachelor's Degree or higher | 3,216 (81.1%) | 95 (2.4%) |
| Total | 13,584 (70.0%) | 1,009 (5.2%) |
Employment Occupations by Sex in Howell County
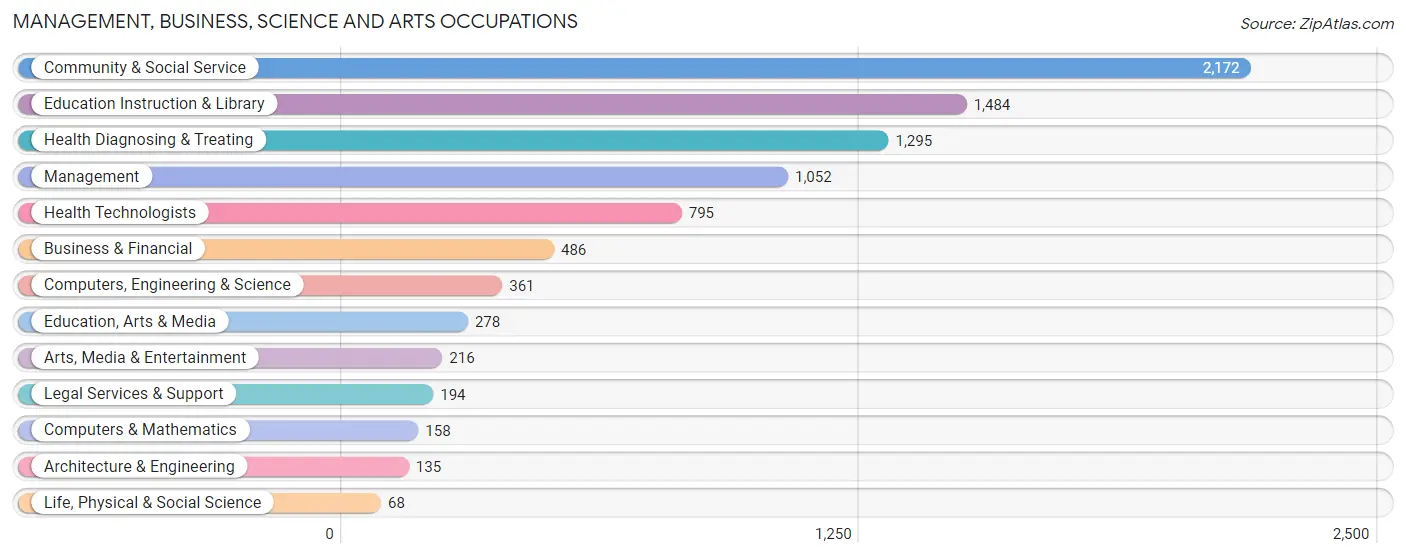
Management, Business, Science and Arts Occupations
The most common Management, Business, Science and Arts occupations in Howell County are Community & Social Service (2,172 | 13.6%), Education Instruction & Library (1,484 | 9.3%), Health Diagnosing & Treating (1,295 | 8.1%), Management (1,052 | 6.6%), and Health Technologists (795 | 5.0%).
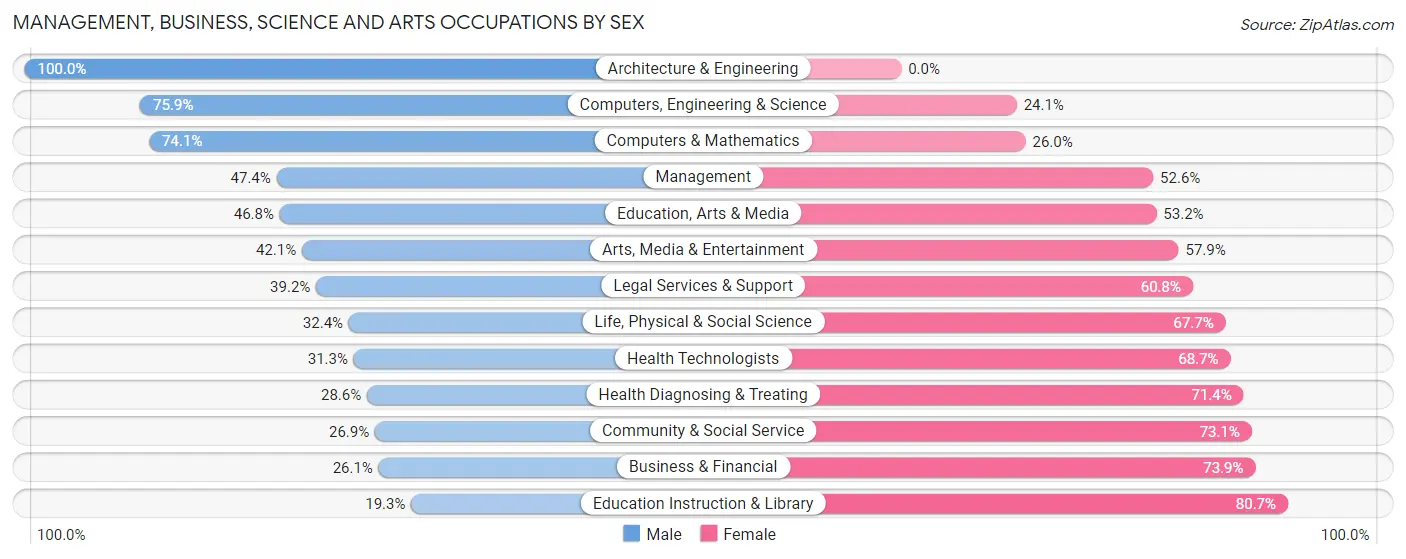
Management, Business, Science and Arts Occupations by Sex
Within the Management, Business, Science and Arts occupations in Howell County, the most male-oriented occupations are Architecture & Engineering (100.0%), Computers, Engineering & Science (75.9%), and Computers & Mathematics (74.1%), while the most female-oriented occupations are Education Instruction & Library (80.7%), Business & Financial (73.9%), and Community & Social Service (73.1%).
| Occupation | Male | Female |
| Management | 499 (47.4%) | 553 (52.6%) |
| Business & Financial | 127 (26.1%) | 359 (73.9%) |
| Computers, Engineering & Science | 274 (75.9%) | 87 (24.1%) |
| Computers & Mathematics | 117 (74.1%) | 41 (26.0%) |
| Architecture & Engineering | 135 (100.0%) | 0 (0.0%) |
| Life, Physical & Social Science | 22 (32.4%) | 46 (67.6%) |
| Community & Social Service | 584 (26.9%) | 1,588 (73.1%) |
| Education, Arts & Media | 130 (46.8%) | 148 (53.2%) |
| Legal Services & Support | 76 (39.2%) | 118 (60.8%) |
| Education Instruction & Library | 287 (19.3%) | 1,197 (80.7%) |
| Arts, Media & Entertainment | 91 (42.1%) | 125 (57.9%) |
| Health Diagnosing & Treating | 370 (28.6%) | 925 (71.4%) |
| Health Technologists | 249 (31.3%) | 546 (68.7%) |
| Total (Category) | 1,854 (34.5%) | 3,512 (65.4%) |
| Total (Overall) | 8,023 (50.3%) | 7,924 (49.7%) |
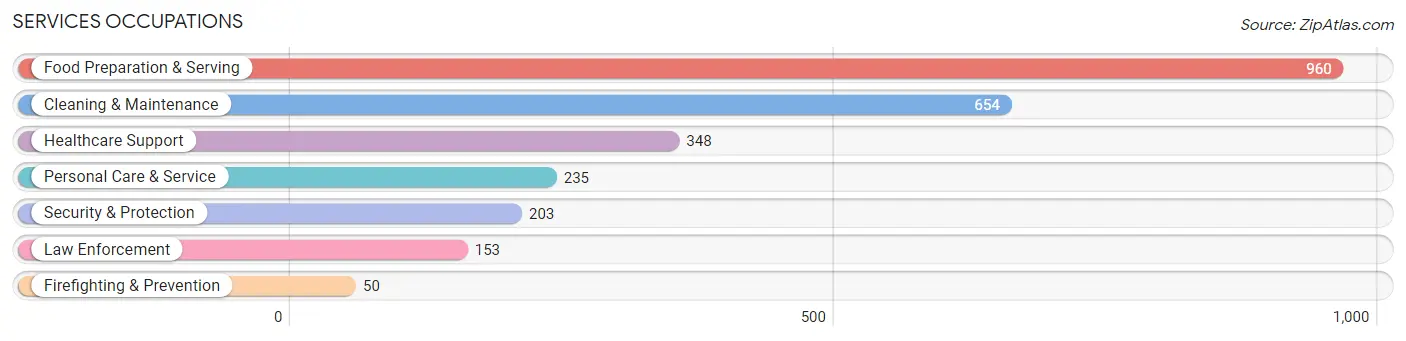
Services Occupations
The most common Services occupations in Howell County are Food Preparation & Serving (960 | 6.0%), Cleaning & Maintenance (654 | 4.1%), Healthcare Support (348 | 2.2%), Personal Care & Service (235 | 1.5%), and Security & Protection (203 | 1.3%).
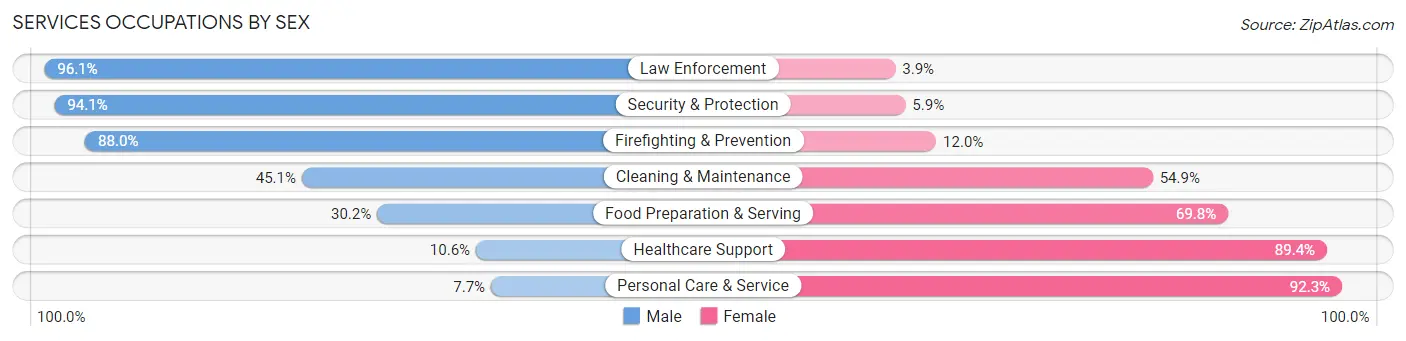
Services Occupations by Sex
Within the Services occupations in Howell County, the most male-oriented occupations are Law Enforcement (96.1%), Security & Protection (94.1%), and Firefighting & Prevention (88.0%), while the most female-oriented occupations are Personal Care & Service (92.3%), Healthcare Support (89.4%), and Food Preparation & Serving (69.8%).
| Occupation | Male | Female |
| Healthcare Support | 37 (10.6%) | 311 (89.4%) |
| Security & Protection | 191 (94.1%) | 12 (5.9%) |
| Firefighting & Prevention | 44 (88.0%) | 6 (12.0%) |
| Law Enforcement | 147 (96.1%) | 6 (3.9%) |
| Food Preparation & Serving | 290 (30.2%) | 670 (69.8%) |
| Cleaning & Maintenance | 295 (45.1%) | 359 (54.9%) |
| Personal Care & Service | 18 (7.7%) | 217 (92.3%) |
| Total (Category) | 831 (34.6%) | 1,569 (65.4%) |
| Total (Overall) | 8,023 (50.3%) | 7,924 (49.7%) |
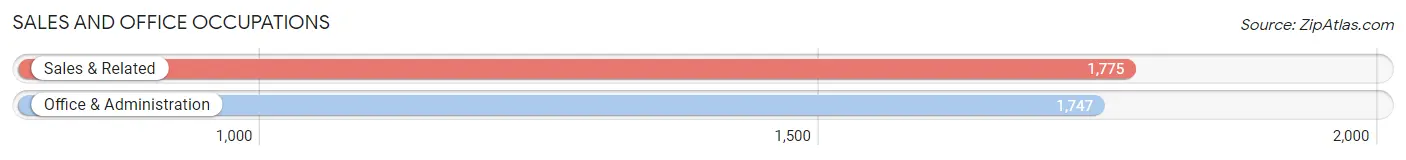
Sales and Office Occupations
The most common Sales and Office occupations in Howell County are Sales & Related (1,775 | 11.1%), and Office & Administration (1,747 | 11.0%).
Sales and Office Occupations by Sex
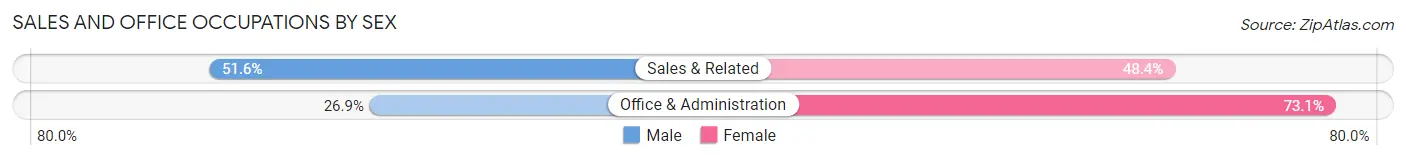
| Occupation | Male | Female |
| Sales & Related | 916 (51.6%) | 859 (48.4%) |
| Office & Administration | 470 (26.9%) | 1,277 (73.1%) |
| Total (Category) | 1,386 (39.4%) | 2,136 (60.7%) |
| Total (Overall) | 8,023 (50.3%) | 7,924 (49.7%) |
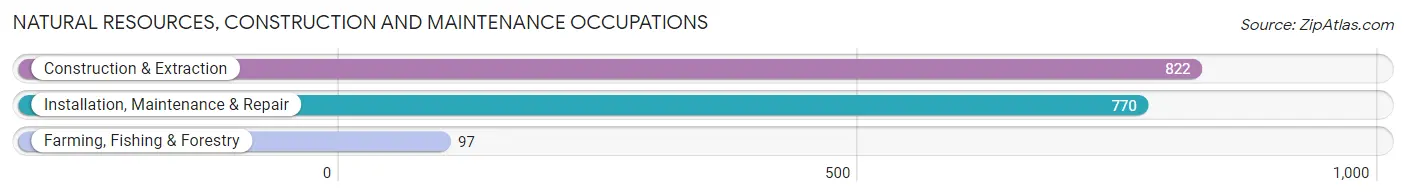
Natural Resources, Construction and Maintenance Occupations
The most common Natural Resources, Construction and Maintenance occupations in Howell County are Construction & Extraction (822 | 5.1%), Installation, Maintenance & Repair (770 | 4.8%), and Farming, Fishing & Forestry (97 | 0.6%).
Natural Resources, Construction and Maintenance Occupations by Sex
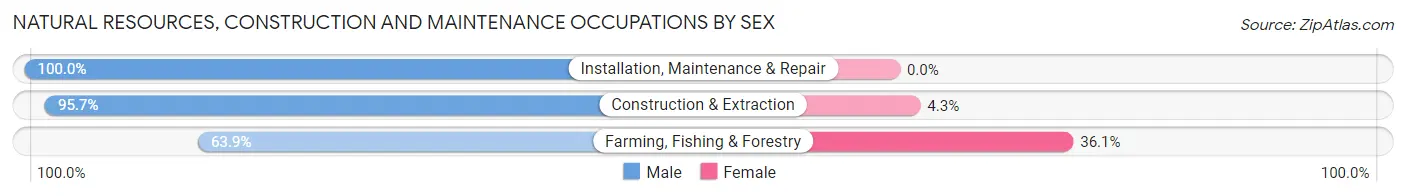
| Occupation | Male | Female |
| Farming, Fishing & Forestry | 62 (63.9%) | 35 (36.1%) |
| Construction & Extraction | 787 (95.7%) | 35 (4.3%) |
| Installation, Maintenance & Repair | 770 (100.0%) | 0 (0.0%) |
| Total (Category) | 1,619 (95.9%) | 70 (4.1%) |
| Total (Overall) | 8,023 (50.3%) | 7,924 (49.7%) |
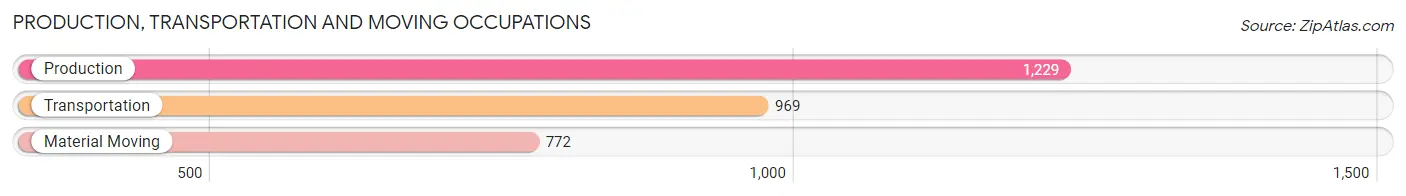
Production, Transportation and Moving Occupations
The most common Production, Transportation and Moving occupations in Howell County are Production (1,229 | 7.7%), Transportation (969 | 6.1%), and Material Moving (772 | 4.8%).
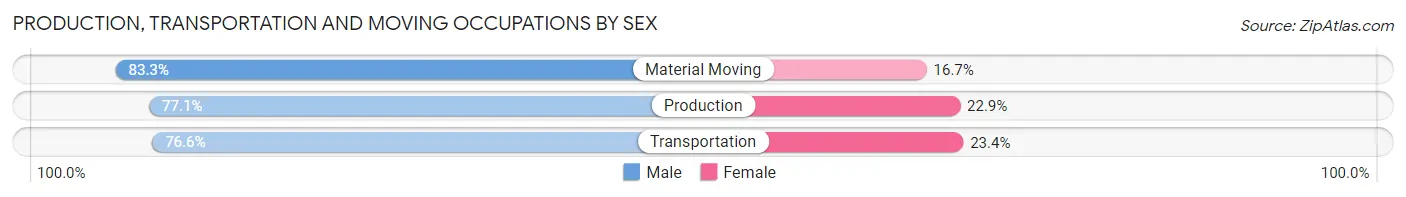
Production, Transportation and Moving Occupations by Sex
| Occupation | Male | Female |
| Production | 948 (77.1%) | 281 (22.9%) |
| Transportation | 742 (76.6%) | 227 (23.4%) |
| Material Moving | 643 (83.3%) | 129 (16.7%) |
| Total (Category) | 2,333 (78.5%) | 637 (21.4%) |
| Total (Overall) | 8,023 (50.3%) | 7,924 (49.7%) |
Employment Industries by Sex in Howell County
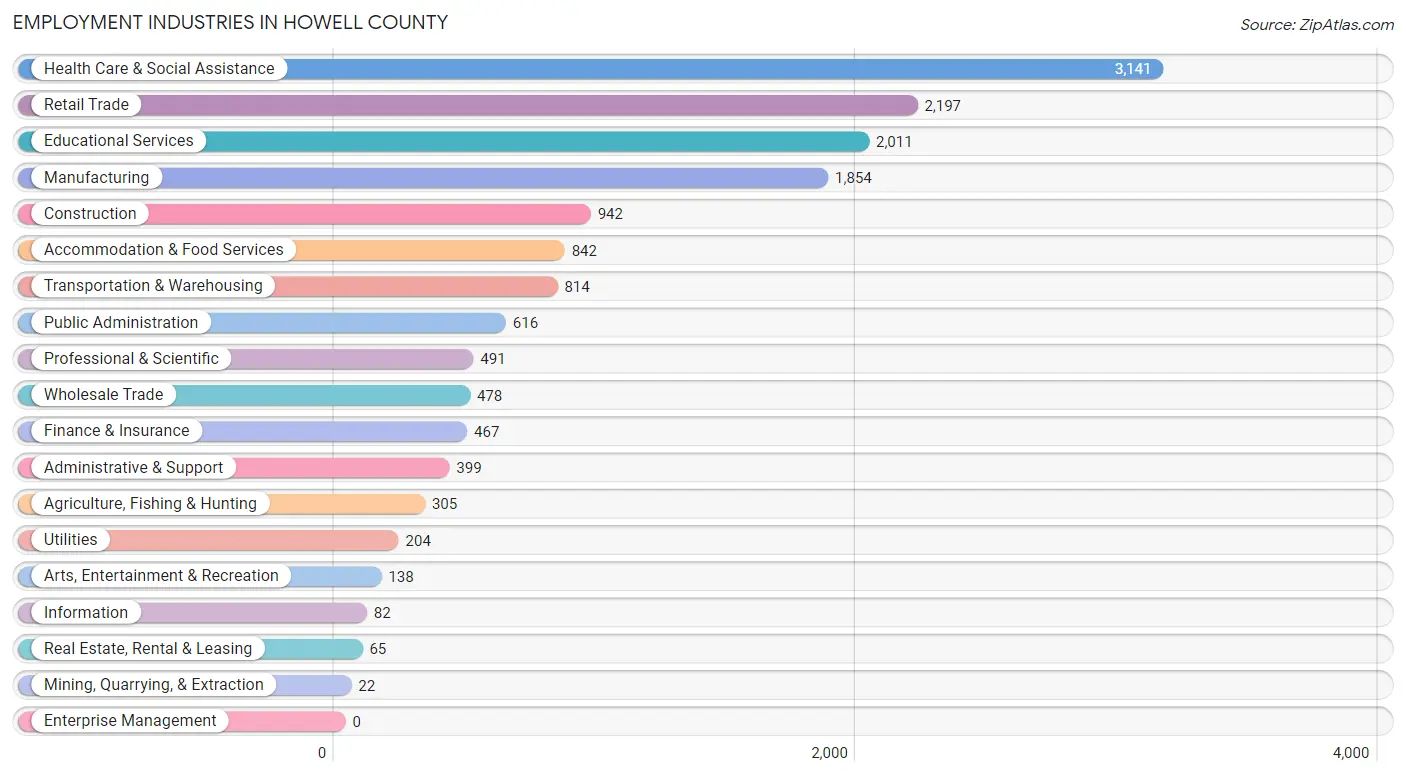
Employment Industries in Howell County
The major employment industries in Howell County include Health Care & Social Assistance (3,141 | 19.7%), Retail Trade (2,197 | 13.8%), Educational Services (2,011 | 12.6%), Manufacturing (1,854 | 11.6%), and Construction (942 | 5.9%).
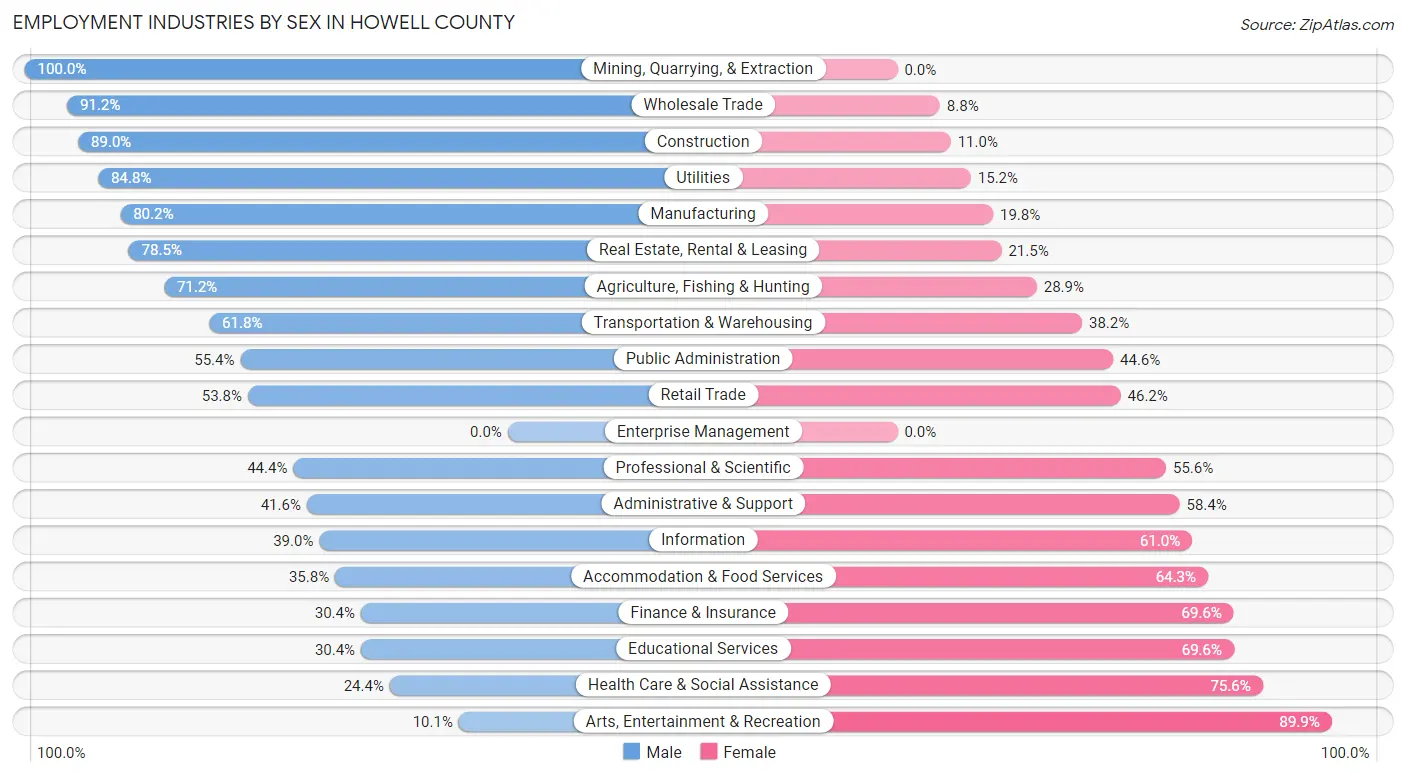
Employment Industries by Sex in Howell County
The Howell County industries that see more men than women are Mining, Quarrying, & Extraction (100.0%), Wholesale Trade (91.2%), and Construction (89.0%), whereas the industries that tend to have a higher number of women are Arts, Entertainment & Recreation (89.9%), Health Care & Social Assistance (75.6%), and Educational Services (69.6%).
| Industry | Male | Female |
| Agriculture, Fishing & Hunting | 217 (71.2%) | 88 (28.8%) |
| Mining, Quarrying, & Extraction | 22 (100.0%) | 0 (0.0%) |
| Construction | 838 (89.0%) | 104 (11.0%) |
| Manufacturing | 1,487 (80.2%) | 367 (19.8%) |
| Wholesale Trade | 436 (91.2%) | 42 (8.8%) |
| Retail Trade | 1,182 (53.8%) | 1,015 (46.2%) |
| Transportation & Warehousing | 503 (61.8%) | 311 (38.2%) |
| Utilities | 173 (84.8%) | 31 (15.2%) |
| Information | 32 (39.0%) | 50 (61.0%) |
| Finance & Insurance | 142 (30.4%) | 325 (69.6%) |
| Real Estate, Rental & Leasing | 51 (78.5%) | 14 (21.5%) |
| Professional & Scientific | 218 (44.4%) | 273 (55.6%) |
| Enterprise Management | 0 (0.0%) | 0 (0.0%) |
| Administrative & Support | 166 (41.6%) | 233 (58.4%) |
| Educational Services | 611 (30.4%) | 1,400 (69.6%) |
| Health Care & Social Assistance | 767 (24.4%) | 2,374 (75.6%) |
| Arts, Entertainment & Recreation | 14 (10.1%) | 124 (89.9%) |
| Accommodation & Food Services | 301 (35.7%) | 541 (64.2%) |
| Public Administration | 341 (55.4%) | 275 (44.6%) |
| Total | 8,023 (50.3%) | 7,924 (49.7%) |
Education in Howell County
School Enrollment in Howell County
The most common levels of schooling among the 9,440 students in Howell County are elementary school (2,690 | 28.5%), high school (2,329 | 24.7%), and middle school (1,882 | 19.9%).
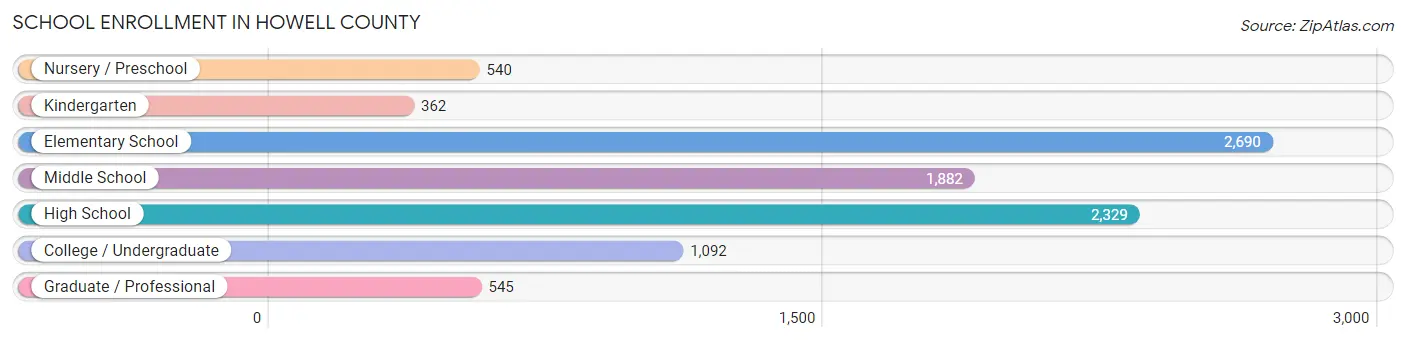
| School Level | # Students | % Students |
| Nursery / Preschool | 540 | 5.7% |
| Kindergarten | 362 | 3.8% |
| Elementary School | 2,690 | 28.5% |
| Middle School | 1,882 | 19.9% |
| High School | 2,329 | 24.7% |
| College / Undergraduate | 1,092 | 11.6% |
| Graduate / Professional | 545 | 5.8% |
| Total | 9,440 | 100.0% |
School Enrollment by Age by Funding Source in Howell County
Out of a total of 9,440 students who are enrolled in schools in Howell County, 1,529 (16.2%) attend a private institution, while the remaining 7,911 (83.8%) are enrolled in public schools. The age group of 25 to 34 year olds has the highest likelihood of being enrolled in private schools, with 185 (43.1% in the age bracket) enrolled. Conversely, the age group of 10 to 14 year olds has the lowest likelihood of being enrolled in a private school, with 2,284 (87.6% in the age bracket) attending a public institution.
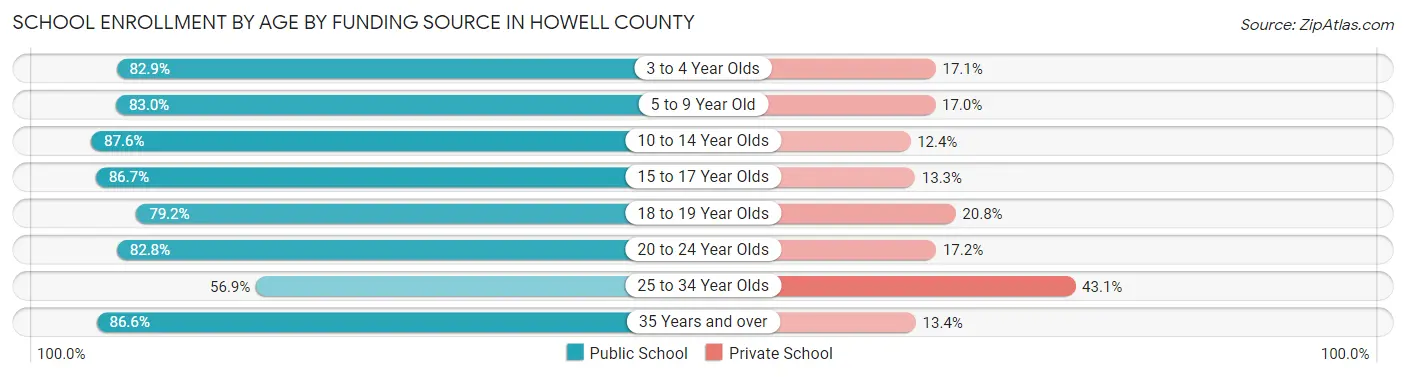
| Age Bracket | Public School | Private School |
| 3 to 4 Year Olds | 276 (82.9%) | 57 (17.1%) |
| 5 to 9 Year Old | 2,297 (83.0%) | 471 (17.0%) |
| 10 to 14 Year Olds | 2,284 (87.6%) | 323 (12.4%) |
| 15 to 17 Year Olds | 1,426 (86.7%) | 218 (13.3%) |
| 18 to 19 Year Olds | 392 (79.2%) | 103 (20.8%) |
| 20 to 24 Year Olds | 371 (82.8%) | 77 (17.2%) |
| 25 to 34 Year Olds | 244 (56.9%) | 185 (43.1%) |
| 35 Years and over | 620 (86.6%) | 96 (13.4%) |
| Total | 7,911 (83.8%) | 1,529 (16.2%) |
Educational Attainment by Field of Study in Howell County
Education (1,435 | 25.8%), business (747 | 13.5%), science & technology (568 | 10.2%), social sciences (506 | 9.1%), and bio, nature & agricultural (486 | 8.7%) are the most common fields of study among 5,553 individuals in Howell County who have obtained a bachelor's degree or higher.
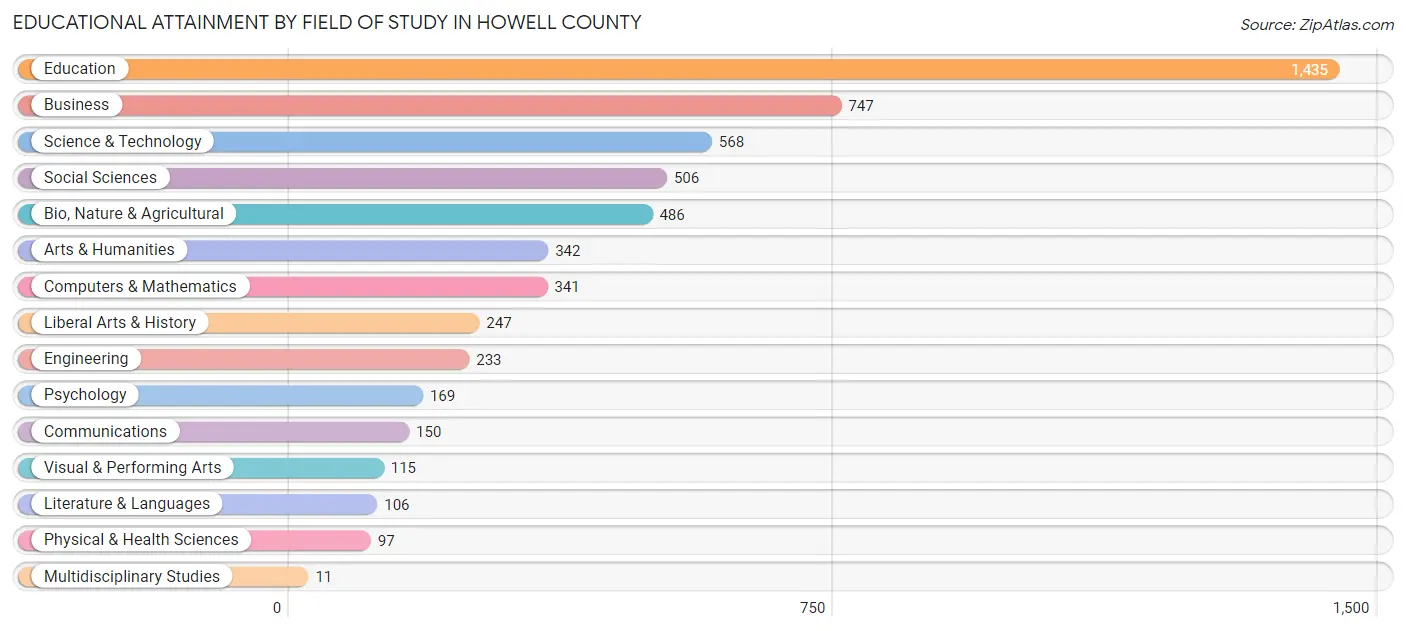
| Field of Study | # Graduates | % Graduates |
| Computers & Mathematics | 341 | 6.1% |
| Bio, Nature & Agricultural | 486 | 8.7% |
| Physical & Health Sciences | 97 | 1.8% |
| Psychology | 169 | 3.0% |
| Social Sciences | 506 | 9.1% |
| Engineering | 233 | 4.2% |
| Multidisciplinary Studies | 11 | 0.2% |
| Science & Technology | 568 | 10.2% |
| Business | 747 | 13.5% |
| Education | 1,435 | 25.8% |
| Literature & Languages | 106 | 1.9% |
| Liberal Arts & History | 247 | 4.4% |
| Visual & Performing Arts | 115 | 2.1% |
| Communications | 150 | 2.7% |
| Arts & Humanities | 342 | 6.2% |
| Total | 5,553 | 100.0% |
Transportation & Commute in Howell County
Vehicle Availability by Sex in Howell County
The most prevalent vehicle ownership categories in Howell County are males with 2 vehicles (2,921, accounting for 38.1%) and females with 2 vehicles (3,124, making up 37.6%).
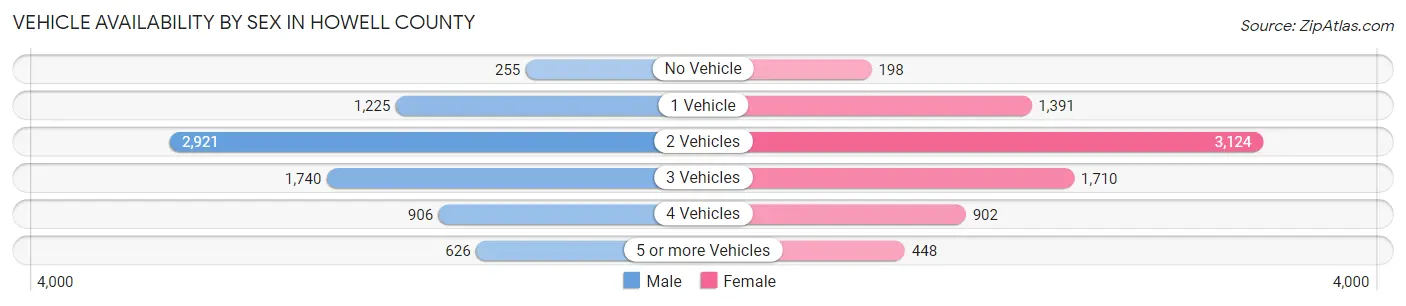
| Vehicles Available | Male | Female |
| No Vehicle | 255 (3.3%) | 198 (2.5%) |
| 1 Vehicle | 1,225 (16.0%) | 1,391 (17.9%) |
| 2 Vehicles | 2,921 (38.1%) | 3,124 (40.2%) |
| 3 Vehicles | 1,740 (22.7%) | 1,710 (22.0%) |
| 4 Vehicles | 906 (11.8%) | 902 (11.6%) |
| 5 or more Vehicles | 626 (8.2%) | 448 (5.8%) |
| Total | 7,673 (100.0%) | 7,773 (100.0%) |
Commute Time in Howell County
The most frequently occuring commute durations in Howell County are 5 to 9 minutes (2,983 commuters, 19.9%), 10 to 14 minutes (2,768 commuters, 18.5%), and 15 to 19 minutes (2,160 commuters, 14.4%).
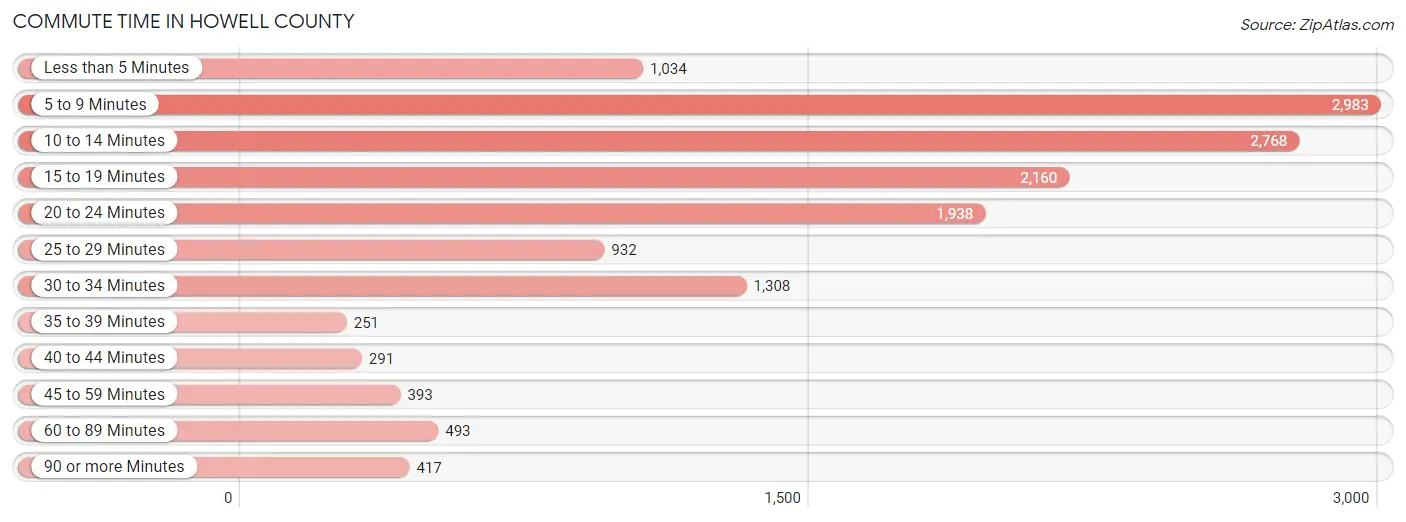
| Commute Time | # Commuters | % Commuters |
| Less than 5 Minutes | 1,034 | 6.9% |
| 5 to 9 Minutes | 2,983 | 19.9% |
| 10 to 14 Minutes | 2,768 | 18.5% |
| 15 to 19 Minutes | 2,160 | 14.4% |
| 20 to 24 Minutes | 1,938 | 13.0% |
| 25 to 29 Minutes | 932 | 6.2% |
| 30 to 34 Minutes | 1,308 | 8.7% |
| 35 to 39 Minutes | 251 | 1.7% |
| 40 to 44 Minutes | 291 | 1.9% |
| 45 to 59 Minutes | 393 | 2.6% |
| 60 to 89 Minutes | 493 | 3.3% |
| 90 or more Minutes | 417 | 2.8% |
Commute Time by Sex in Howell County
The most common commute times in Howell County are 10 to 14 minutes (1,554 commuters, 20.7%) for males and 5 to 9 minutes (1,609 commuters, 21.6%) for females.
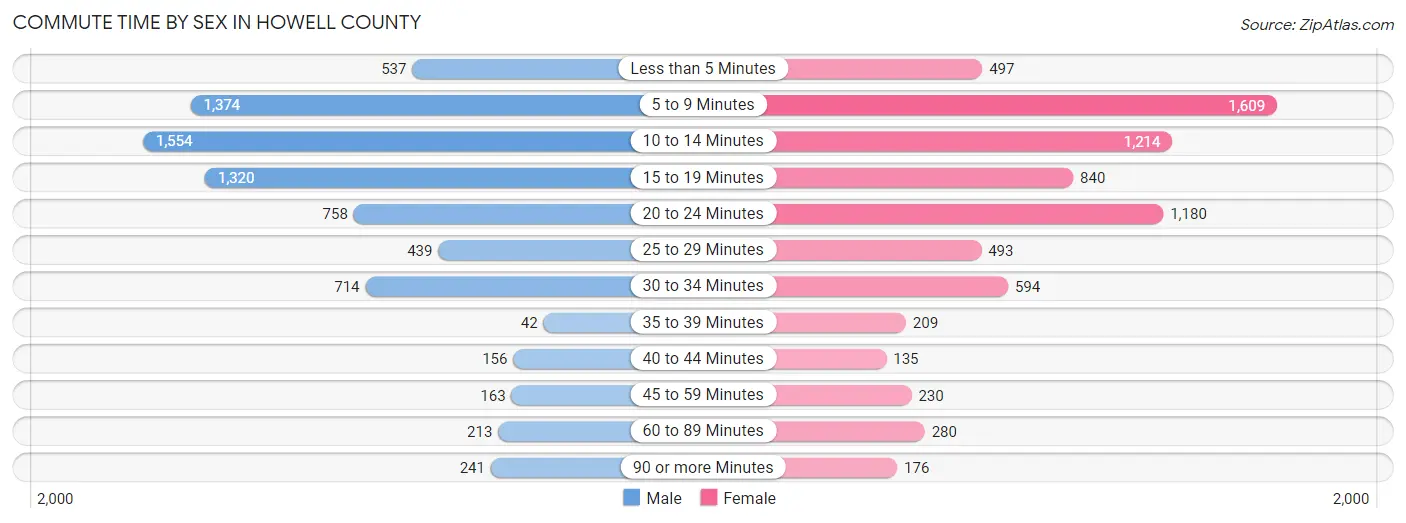
| Commute Time | Male | Female |
| Less than 5 Minutes | 537 (7.1%) | 497 (6.7%) |
| 5 to 9 Minutes | 1,374 (18.3%) | 1,609 (21.6%) |
| 10 to 14 Minutes | 1,554 (20.7%) | 1,214 (16.3%) |
| 15 to 19 Minutes | 1,320 (17.6%) | 840 (11.3%) |
| 20 to 24 Minutes | 758 (10.1%) | 1,180 (15.8%) |
| 25 to 29 Minutes | 439 (5.8%) | 493 (6.6%) |
| 30 to 34 Minutes | 714 (9.5%) | 594 (8.0%) |
| 35 to 39 Minutes | 42 (0.6%) | 209 (2.8%) |
| 40 to 44 Minutes | 156 (2.1%) | 135 (1.8%) |
| 45 to 59 Minutes | 163 (2.2%) | 230 (3.1%) |
| 60 to 89 Minutes | 213 (2.8%) | 280 (3.7%) |
| 90 or more Minutes | 241 (3.2%) | 176 (2.4%) |
Time of Departure to Work by Sex in Howell County
The most frequent times of departure to work in Howell County are 6:00 AM to 6:29 AM (1,151, 15.3%) for males and 7:00 AM to 7:29 AM (1,248, 16.7%) for females.
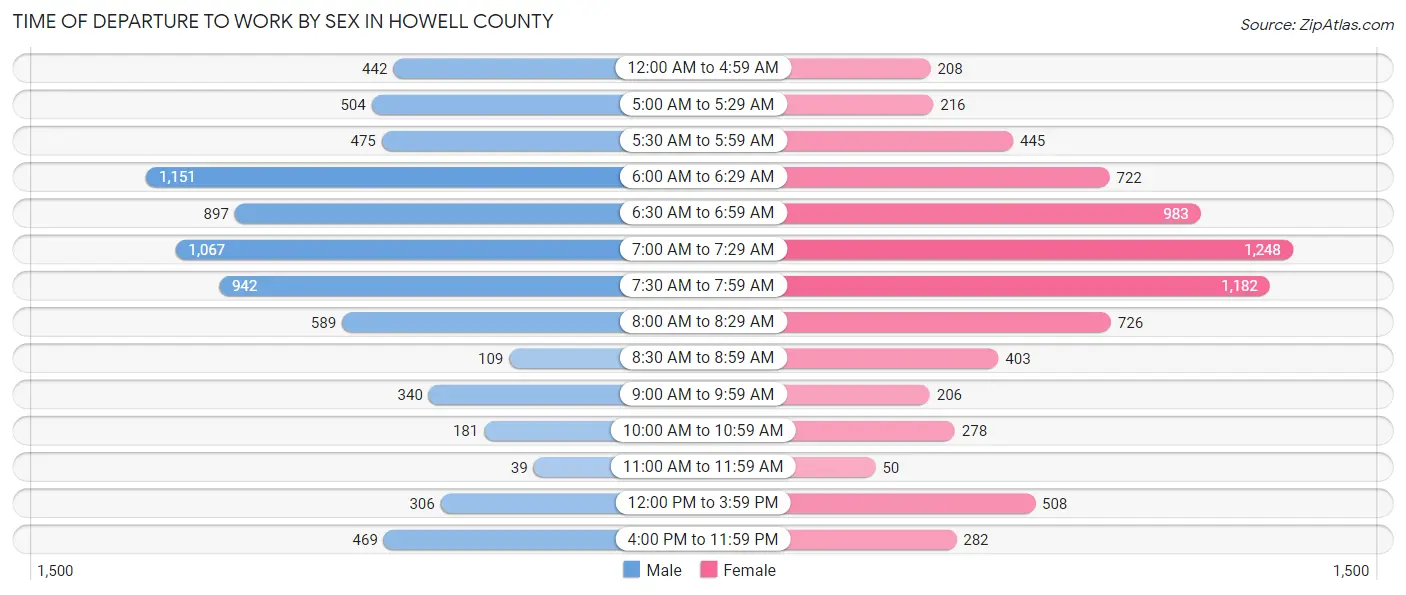
| Time of Departure | Male | Female |
| 12:00 AM to 4:59 AM | 442 (5.9%) | 208 (2.8%) |
| 5:00 AM to 5:29 AM | 504 (6.7%) | 216 (2.9%) |
| 5:30 AM to 5:59 AM | 475 (6.3%) | 445 (6.0%) |
| 6:00 AM to 6:29 AM | 1,151 (15.3%) | 722 (9.7%) |
| 6:30 AM to 6:59 AM | 897 (11.9%) | 983 (13.2%) |
| 7:00 AM to 7:29 AM | 1,067 (14.2%) | 1,248 (16.7%) |
| 7:30 AM to 7:59 AM | 942 (12.5%) | 1,182 (15.9%) |
| 8:00 AM to 8:29 AM | 589 (7.8%) | 726 (9.7%) |
| 8:30 AM to 8:59 AM | 109 (1.5%) | 403 (5.4%) |
| 9:00 AM to 9:59 AM | 340 (4.5%) | 206 (2.8%) |
| 10:00 AM to 10:59 AM | 181 (2.4%) | 278 (3.7%) |
| 11:00 AM to 11:59 AM | 39 (0.5%) | 50 (0.7%) |
| 12:00 PM to 3:59 PM | 306 (4.1%) | 508 (6.8%) |
| 4:00 PM to 11:59 PM | 469 (6.2%) | 282 (3.8%) |
| Total | 7,511 (100.0%) | 7,457 (100.0%) |
Housing Occupancy in Howell County
Occupancy by Ownership in Howell County
Of the total 15,433 dwellings in Howell County, owner-occupied units account for 10,624 (68.8%), while renter-occupied units make up 4,809 (31.2%).
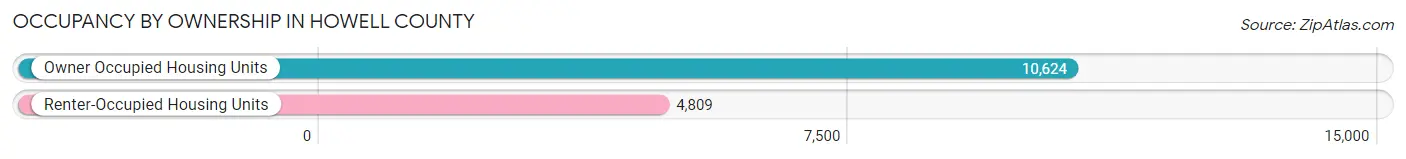
| Occupancy | # Housing Units | % Housing Units |
| Owner Occupied Housing Units | 10,624 | 68.8% |
| Renter-Occupied Housing Units | 4,809 | 31.2% |
| Total Occupied Housing Units | 15,433 | 100.0% |
Occupancy by Household Size in Howell County
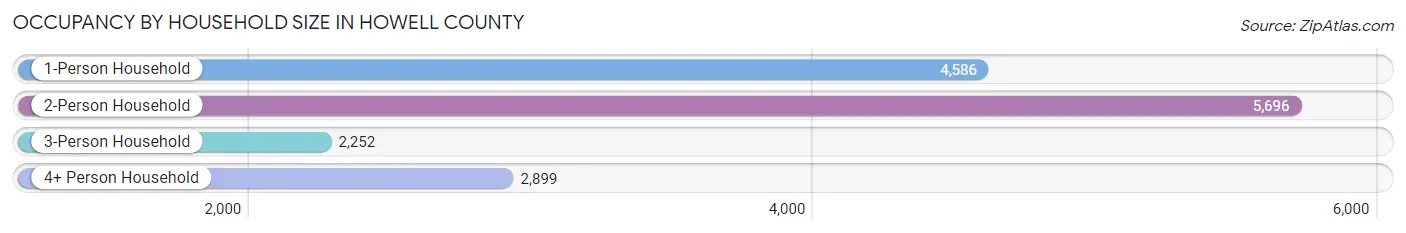
| Household Size | # Housing Units | % Housing Units |
| 1-Person Household | 4,586 | 29.7% |
| 2-Person Household | 5,696 | 36.9% |
| 3-Person Household | 2,252 | 14.6% |
| 4+ Person Household | 2,899 | 18.8% |
| Total Housing Units | 15,433 | 100.0% |
Occupancy by Ownership by Household Size in Howell County
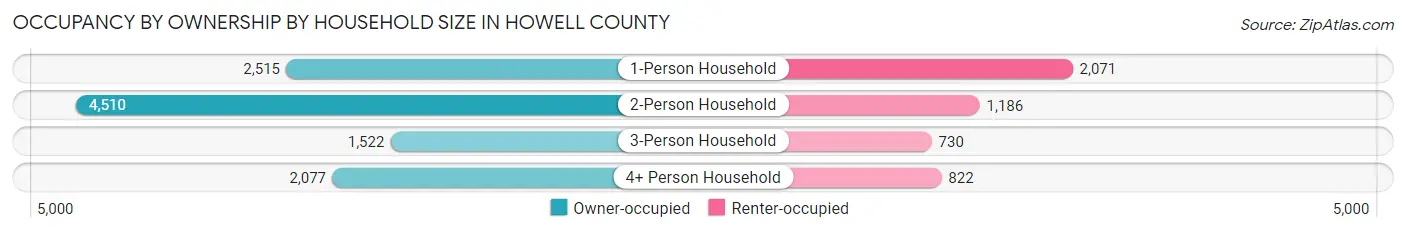
| Household Size | Owner-occupied | Renter-occupied |
| 1-Person Household | 2,515 (54.8%) | 2,071 (45.2%) |
| 2-Person Household | 4,510 (79.2%) | 1,186 (20.8%) |
| 3-Person Household | 1,522 (67.6%) | 730 (32.4%) |
| 4+ Person Household | 2,077 (71.7%) | 822 (28.3%) |
| Total Housing Units | 10,624 (68.8%) | 4,809 (31.2%) |
Occupancy by Educational Attainment in Howell County
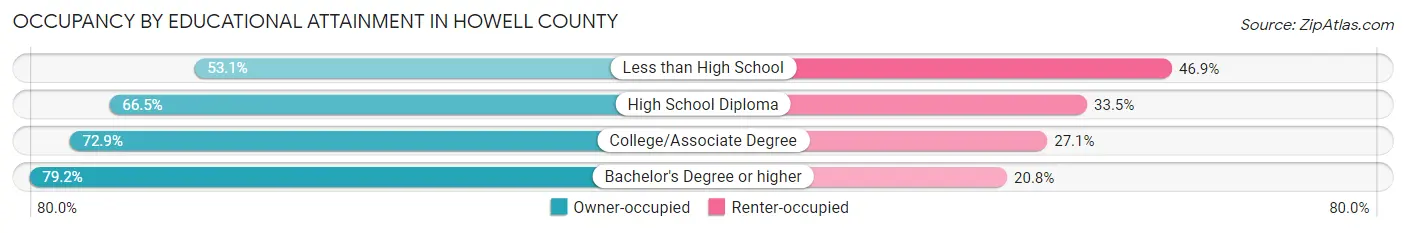
| Household Size | Owner-occupied | Renter-occupied |
| Less than High School | 1,091 (53.1%) | 965 (46.9%) |
| High School Diploma | 4,082 (66.5%) | 2,053 (33.5%) |
| College/Associate Degree | 3,280 (72.9%) | 1,222 (27.1%) |
| Bachelor's Degree or higher | 2,171 (79.2%) | 569 (20.8%) |
Occupancy by Age of Householder in Howell County
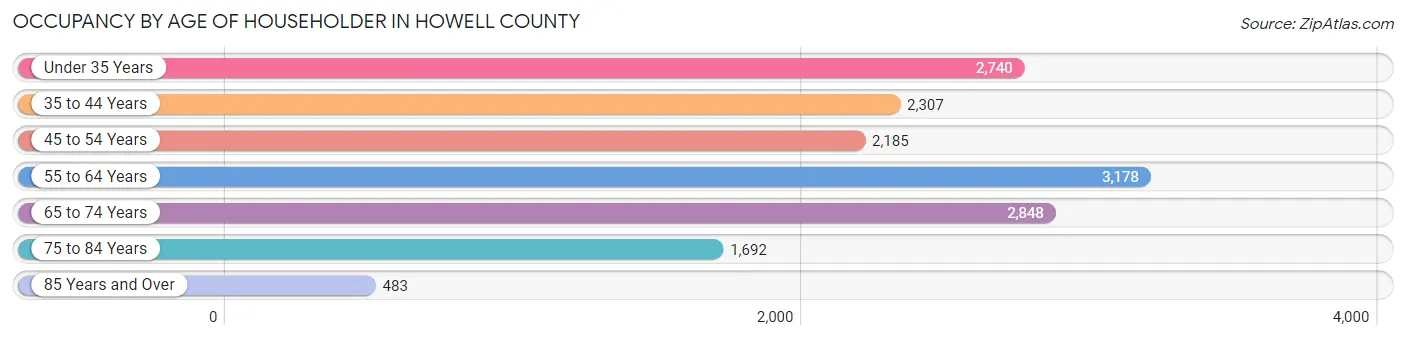
| Age Bracket | # Households | % Households |
| Under 35 Years | 2,740 | 17.7% |
| 35 to 44 Years | 2,307 | 14.9% |
| 45 to 54 Years | 2,185 | 14.2% |
| 55 to 64 Years | 3,178 | 20.6% |
| 65 to 74 Years | 2,848 | 18.4% |
| 75 to 84 Years | 1,692 | 11.0% |
| 85 Years and Over | 483 | 3.1% |
| Total | 15,433 | 100.0% |
Housing Finances in Howell County
Median Income by Occupancy in Howell County
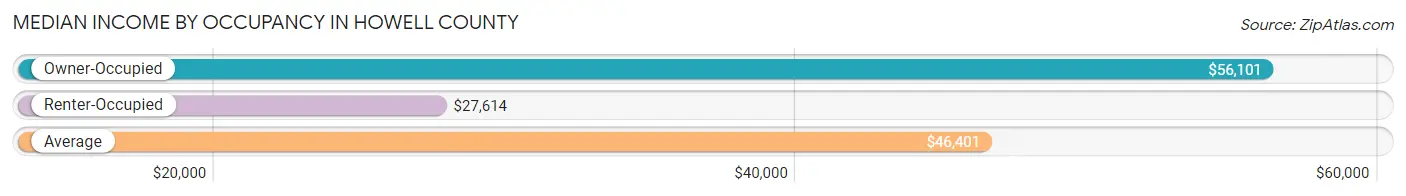
| Occupancy Type | # Households | Median Income |
| Owner-Occupied | 10,624 (68.8%) | $56,101 |
| Renter-Occupied | 4,809 (31.2%) | $27,614 |
| Average | 15,433 (100.0%) | $46,401 |
Occupancy by Householder Income Bracket in Howell County
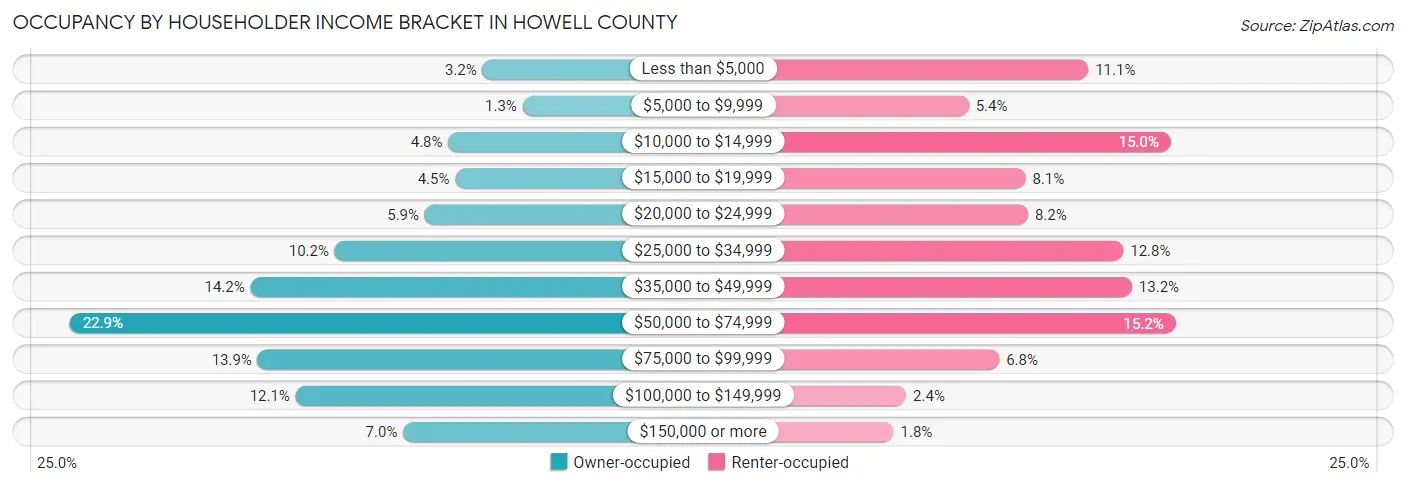
| Income Bracket | Owner-occupied | Renter-occupied |
| Less than $5,000 | 339 (3.2%) | 533 (11.1%) |
| $5,000 to $9,999 | 136 (1.3%) | 259 (5.4%) |
| $10,000 to $14,999 | 512 (4.8%) | 722 (15.0%) |
| $15,000 to $19,999 | 477 (4.5%) | 389 (8.1%) |
| $20,000 to $24,999 | 631 (5.9%) | 395 (8.2%) |
| $25,000 to $34,999 | 1,087 (10.2%) | 613 (12.8%) |
| $35,000 to $49,999 | 1,513 (14.2%) | 633 (13.2%) |
| $50,000 to $74,999 | 2,428 (22.9%) | 733 (15.2%) |
| $75,000 to $99,999 | 1,477 (13.9%) | 329 (6.8%) |
| $100,000 to $149,999 | 1,284 (12.1%) | 116 (2.4%) |
| $150,000 or more | 740 (7.0%) | 87 (1.8%) |
| Total | 10,624 (100.0%) | 4,809 (100.0%) |
Monthly Housing Cost Tiers in Howell County
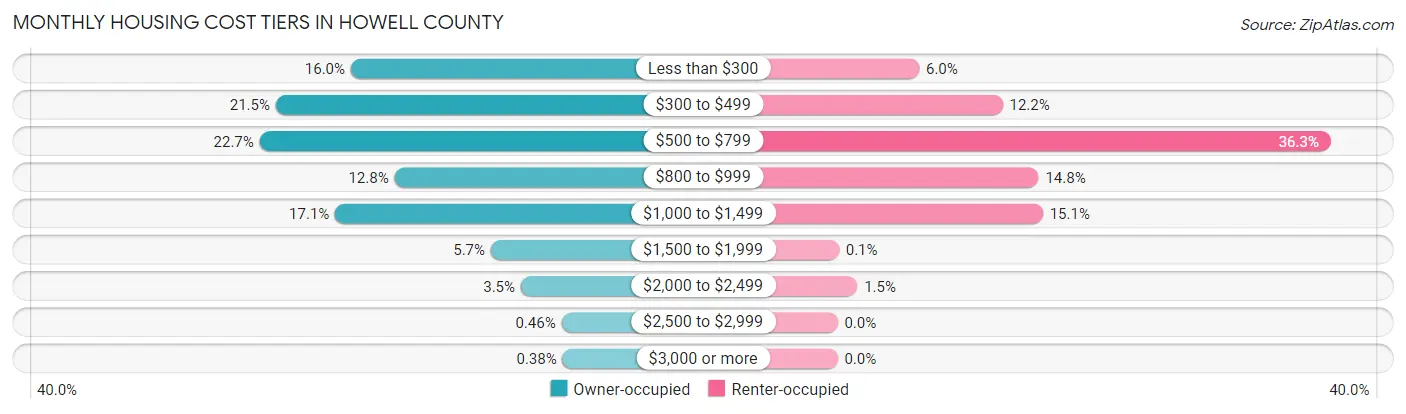
| Monthly Cost | Owner-occupied | Renter-occupied |
| Less than $300 | 1,697 (16.0%) | 289 (6.0%) |
| $300 to $499 | 2,284 (21.5%) | 585 (12.2%) |
| $500 to $799 | 2,411 (22.7%) | 1,747 (36.3%) |
| $800 to $999 | 1,356 (12.8%) | 712 (14.8%) |
| $1,000 to $1,499 | 1,820 (17.1%) | 727 (15.1%) |
| $1,500 to $1,999 | 601 (5.7%) | 5 (0.1%) |
| $2,000 to $2,499 | 366 (3.5%) | 70 (1.5%) |
| $2,500 to $2,999 | 49 (0.5%) | 0 (0.0%) |
| $3,000 or more | 40 (0.4%) | 0 (0.0%) |
| Total | 10,624 (100.0%) | 4,809 (100.0%) |
Physical Housing Characteristics in Howell County
Housing Structures in Howell County
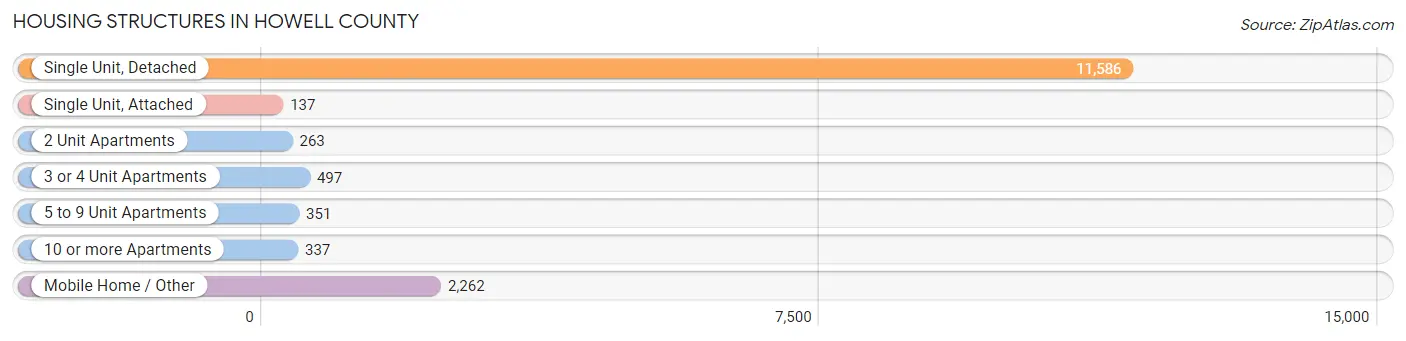
| Structure Type | # Housing Units | % Housing Units |
| Single Unit, Detached | 11,586 | 75.1% |
| Single Unit, Attached | 137 | 0.9% |
| 2 Unit Apartments | 263 | 1.7% |
| 3 or 4 Unit Apartments | 497 | 3.2% |
| 5 to 9 Unit Apartments | 351 | 2.3% |
| 10 or more Apartments | 337 | 2.2% |
| Mobile Home / Other | 2,262 | 14.7% |
| Total | 15,433 | 100.0% |
Housing Structures by Occupancy in Howell County
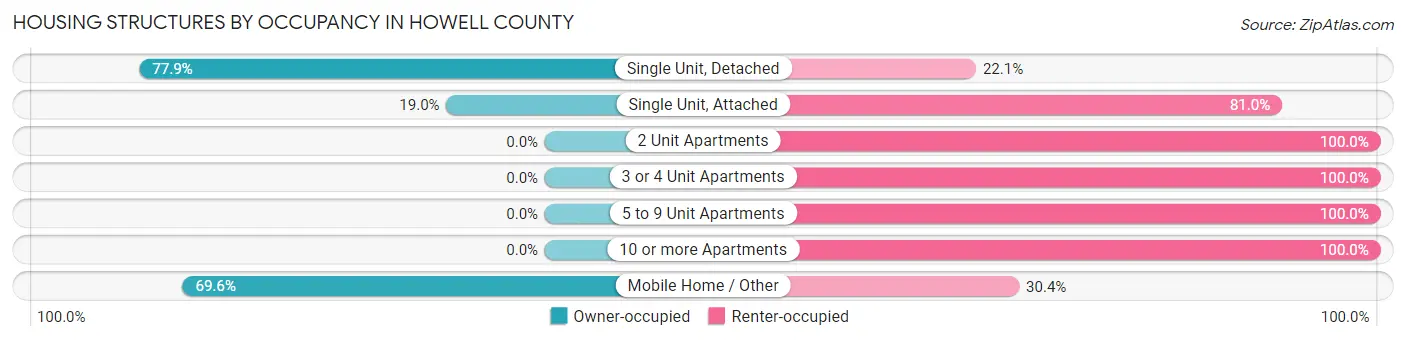
| Structure Type | Owner-occupied | Renter-occupied |
| Single Unit, Detached | 9,024 (77.9%) | 2,562 (22.1%) |
| Single Unit, Attached | 26 (19.0%) | 111 (81.0%) |
| 2 Unit Apartments | 0 (0.0%) | 263 (100.0%) |
| 3 or 4 Unit Apartments | 0 (0.0%) | 497 (100.0%) |
| 5 to 9 Unit Apartments | 0 (0.0%) | 351 (100.0%) |
| 10 or more Apartments | 0 (0.0%) | 337 (100.0%) |
| Mobile Home / Other | 1,574 (69.6%) | 688 (30.4%) |
| Total | 10,624 (68.8%) | 4,809 (31.2%) |
Housing Structures by Number of Rooms in Howell County
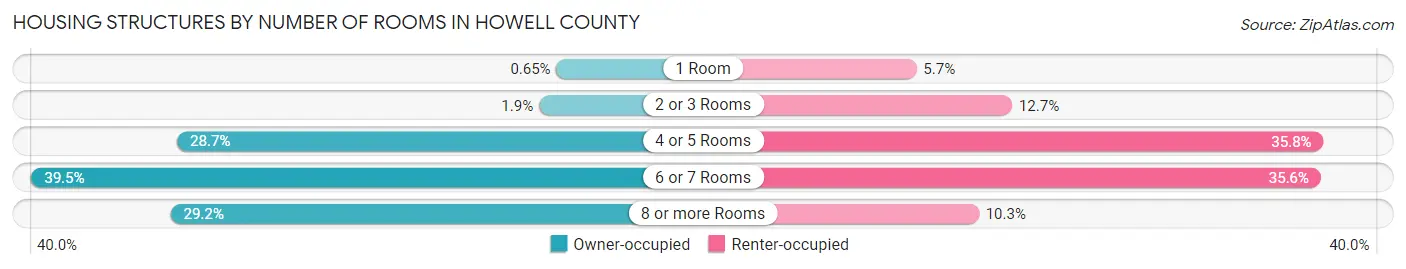
| Number of Rooms | Owner-occupied | Renter-occupied |
| 1 Room | 69 (0.6%) | 272 (5.7%) |
| 2 or 3 Rooms | 206 (1.9%) | 612 (12.7%) |
| 4 or 5 Rooms | 3,050 (28.7%) | 1,720 (35.8%) |
| 6 or 7 Rooms | 4,197 (39.5%) | 1,711 (35.6%) |
| 8 or more Rooms | 3,102 (29.2%) | 494 (10.3%) |
| Total | 10,624 (100.0%) | 4,809 (100.0%) |
Housing Structure by Heating Type in Howell County
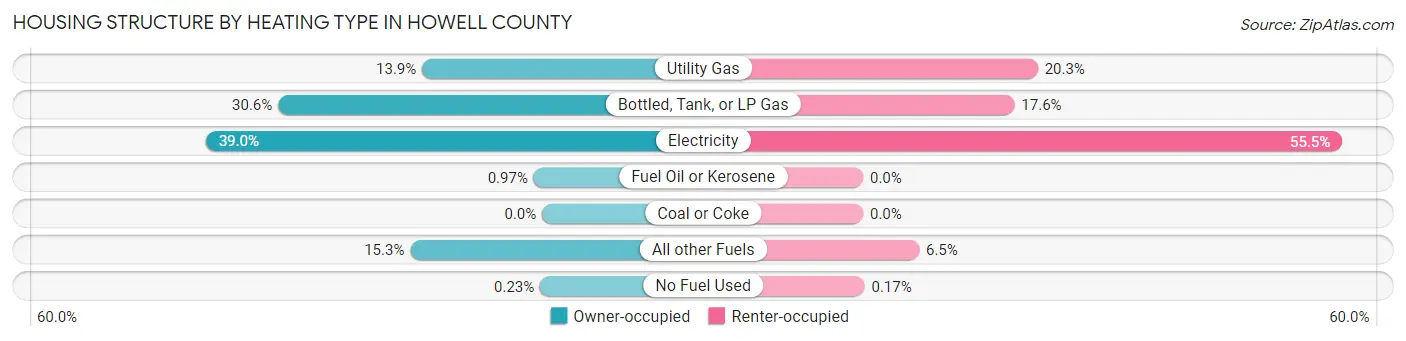
| Heating Type | Owner-occupied | Renter-occupied |
| Utility Gas | 1,478 (13.9%) | 974 (20.3%) |
| Bottled, Tank, or LP Gas | 3,252 (30.6%) | 844 (17.5%) |
| Electricity | 4,143 (39.0%) | 2,671 (55.5%) |
| Fuel Oil or Kerosene | 103 (1.0%) | 0 (0.0%) |
| Coal or Coke | 0 (0.0%) | 0 (0.0%) |
| All other Fuels | 1,624 (15.3%) | 312 (6.5%) |
| No Fuel Used | 24 (0.2%) | 8 (0.2%) |
| Total | 10,624 (100.0%) | 4,809 (100.0%) |
Household Vehicle Usage in Howell County
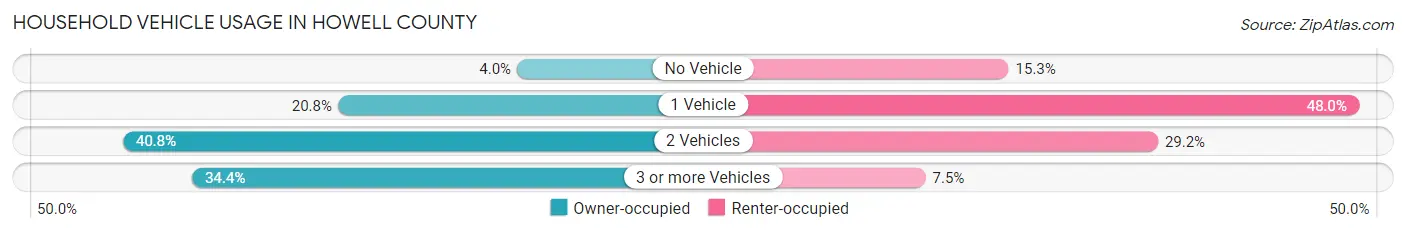
| Vehicles per Household | Owner-occupied | Renter-occupied |
| No Vehicle | 429 (4.0%) | 735 (15.3%) |
| 1 Vehicle | 2,206 (20.8%) | 2,307 (48.0%) |
| 2 Vehicles | 4,338 (40.8%) | 1,405 (29.2%) |
| 3 or more Vehicles | 3,651 (34.4%) | 362 (7.5%) |
| Total | 10,624 (100.0%) | 4,809 (100.0%) |
Real Estate & Mortgages in Howell County
Real Estate and Mortgage Overview in Howell County
| Characteristic | Without Mortgage | With Mortgage |
| Housing Units | 5,437 | 5,187 |
| Median Property Value | $131,000 | $153,700 |
| Median Household Income | $47,806 | $539 |
| Monthly Housing Costs | $380 | $40 |
| Real Estate Taxes | $790 | $60 |
Property Value by Mortgage Status in Howell County
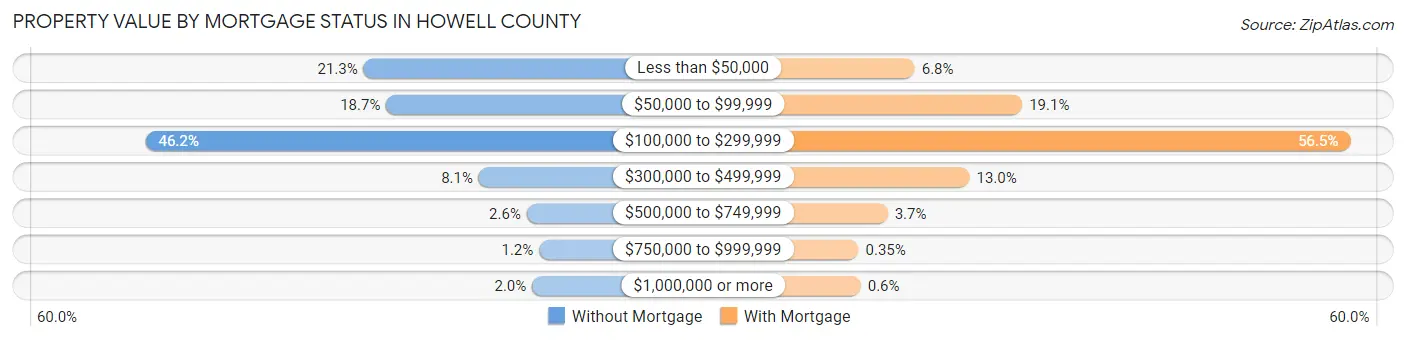
| Property Value | Without Mortgage | With Mortgage |
| Less than $50,000 | 1,156 (21.3%) | 351 (6.8%) |
| $50,000 to $99,999 | 1,015 (18.7%) | 988 (19.1%) |
| $100,000 to $299,999 | 2,510 (46.2%) | 2,932 (56.5%) |
| $300,000 to $499,999 | 440 (8.1%) | 676 (13.0%) |
| $500,000 to $749,999 | 142 (2.6%) | 191 (3.7%) |
| $750,000 to $999,999 | 65 (1.2%) | 18 (0.4%) |
| $1,000,000 or more | 109 (2.0%) | 31 (0.6%) |
| Total | 5,437 (100.0%) | 5,187 (100.0%) |
Household Income by Mortgage Status in Howell County
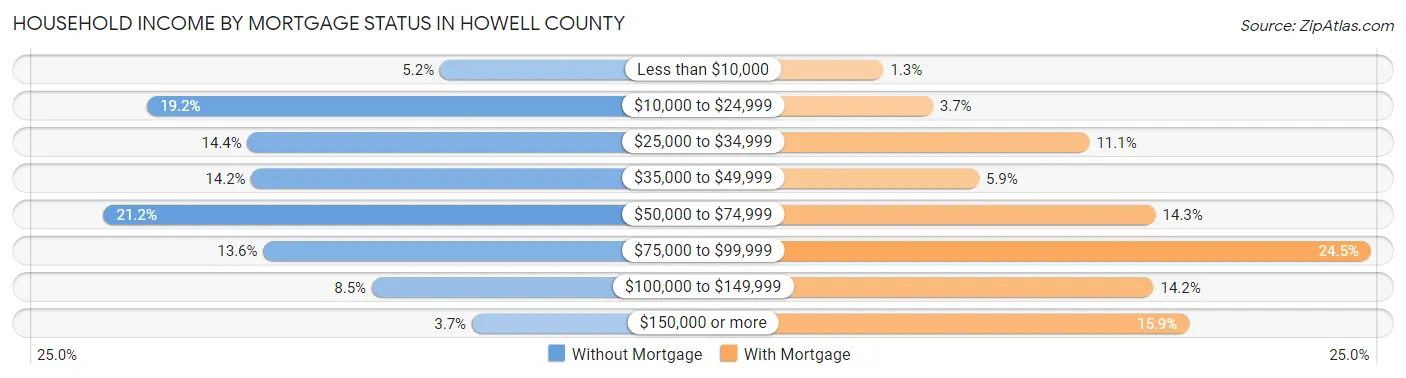
| Household Income | Without Mortgage | With Mortgage |
| Less than $10,000 | 284 (5.2%) | 69 (1.3%) |
| $10,000 to $24,999 | 1,042 (19.2%) | 191 (3.7%) |
| $25,000 to $34,999 | 782 (14.4%) | 578 (11.1%) |
| $35,000 to $49,999 | 772 (14.2%) | 305 (5.9%) |
| $50,000 to $74,999 | 1,155 (21.2%) | 741 (14.3%) |
| $75,000 to $99,999 | 741 (13.6%) | 1,273 (24.5%) |
| $100,000 to $149,999 | 460 (8.5%) | 736 (14.2%) |
| $150,000 or more | 201 (3.7%) | 824 (15.9%) |
| Total | 5,437 (100.0%) | 5,187 (100.0%) |
Property Value to Household Income Ratio in Howell County
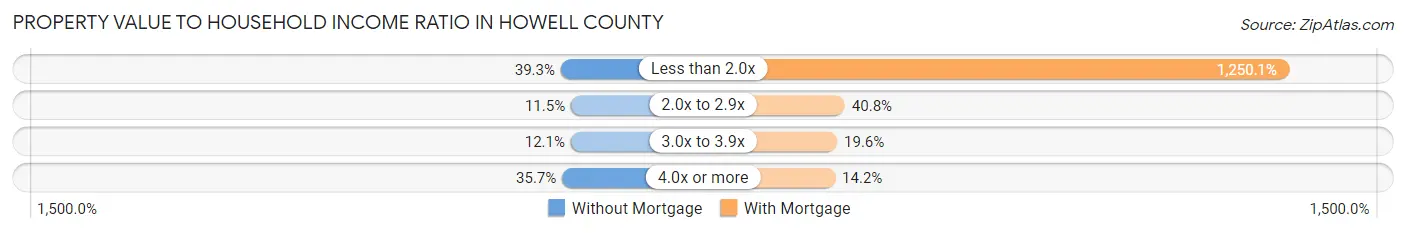
| Value-to-Income Ratio | Without Mortgage | With Mortgage |
| Less than 2.0x | 2,135 (39.3%) | 64,844 (1,250.1%) |
| 2.0x to 2.9x | 626 (11.5%) | 2,114 (40.8%) |
| 3.0x to 3.9x | 657 (12.1%) | 1,015 (19.6%) |
| 4.0x or more | 1,943 (35.7%) | 738 (14.2%) |
| Total | 5,437 (100.0%) | 5,187 (100.0%) |
Real Estate Taxes by Mortgage Status in Howell County
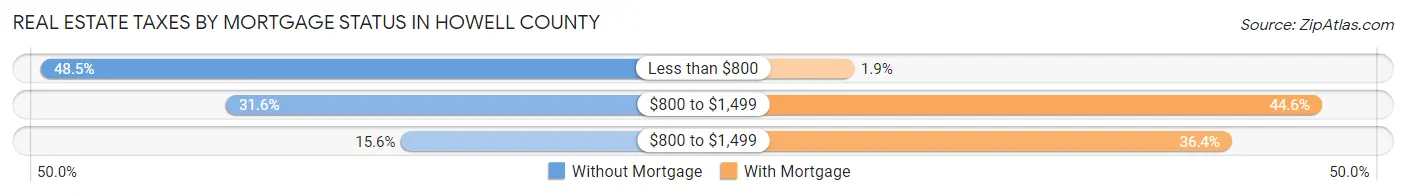
| Property Taxes | Without Mortgage | With Mortgage |
| Less than $800 | 2,637 (48.5%) | 99 (1.9%) |
| $800 to $1,499 | 1,718 (31.6%) | 2,315 (44.6%) |
| $800 to $1,499 | 848 (15.6%) | 1,889 (36.4%) |
| Total | 5,437 (100.0%) | 5,187 (100.0%) |
Health & Disability in Howell County
Health Insurance Coverage by Age in Howell County
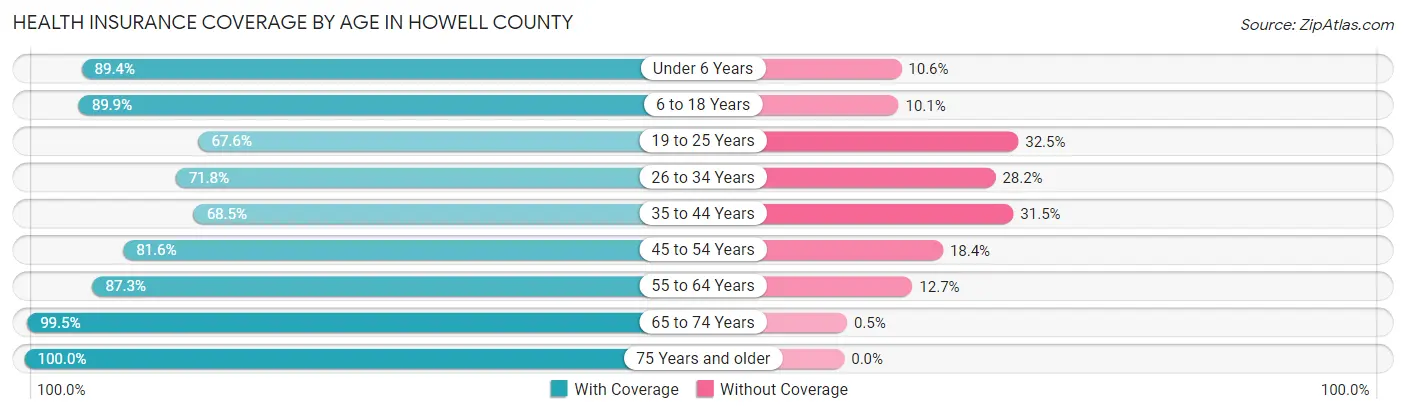
| Age Bracket | With Coverage | Without Coverage |
| Under 6 Years | 2,494 (89.4%) | 297 (10.6%) |
| 6 to 18 Years | 6,518 (89.9%) | 734 (10.1%) |
| 19 to 25 Years | 2,036 (67.5%) | 978 (32.5%) |
| 26 to 34 Years | 2,975 (71.8%) | 1,168 (28.2%) |
| 35 to 44 Years | 3,177 (68.5%) | 1,464 (31.5%) |
| 45 to 54 Years | 3,912 (81.6%) | 882 (18.4%) |
| 55 to 64 Years | 4,674 (87.3%) | 680 (12.7%) |
| 65 to 74 Years | 4,411 (99.5%) | 22 (0.5%) |
| 75 Years and older | 3,078 (100.0%) | 0 (0.0%) |
| Total | 33,275 (84.2%) | 6,225 (15.8%) |
Health Insurance Coverage by Citizenship Status in Howell County
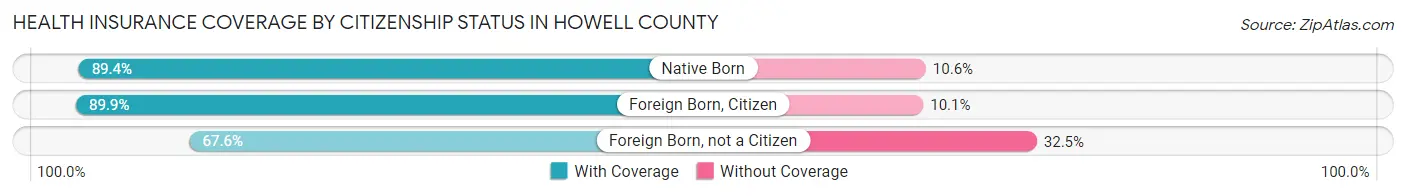
| Citizenship Status | With Coverage | Without Coverage |
| Native Born | 2,494 (89.4%) | 297 (10.6%) |
| Foreign Born, Citizen | 6,518 (89.9%) | 734 (10.1%) |
| Foreign Born, not a Citizen | 2,036 (67.5%) | 978 (32.5%) |
Health Insurance Coverage by Household Income in Howell County
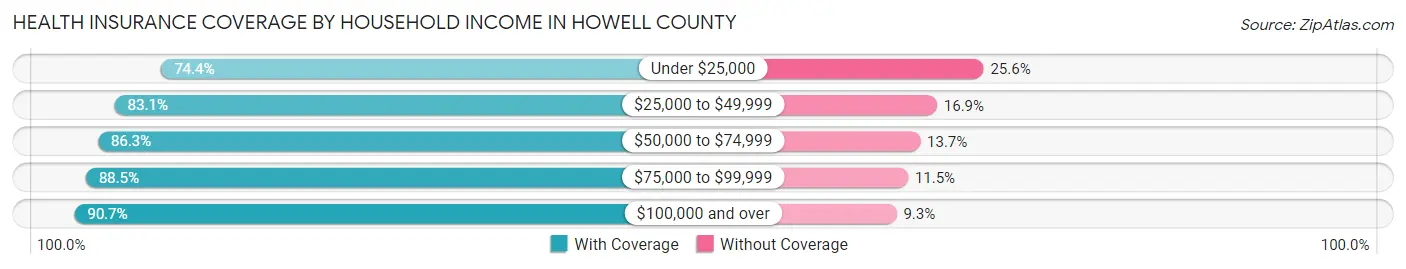
| Household Income | With Coverage | Without Coverage |
| Under $25,000 | 6,010 (74.4%) | 2,069 (25.6%) |
| $25,000 to $49,999 | 8,236 (83.1%) | 1,673 (16.9%) |
| $50,000 to $74,999 | 7,433 (86.3%) | 1,183 (13.7%) |
| $75,000 to $99,999 | 4,559 (88.5%) | 590 (11.5%) |
| $100,000 and over | 6,844 (90.7%) | 703 (9.3%) |
Public vs Private Health Insurance Coverage by Age in Howell County
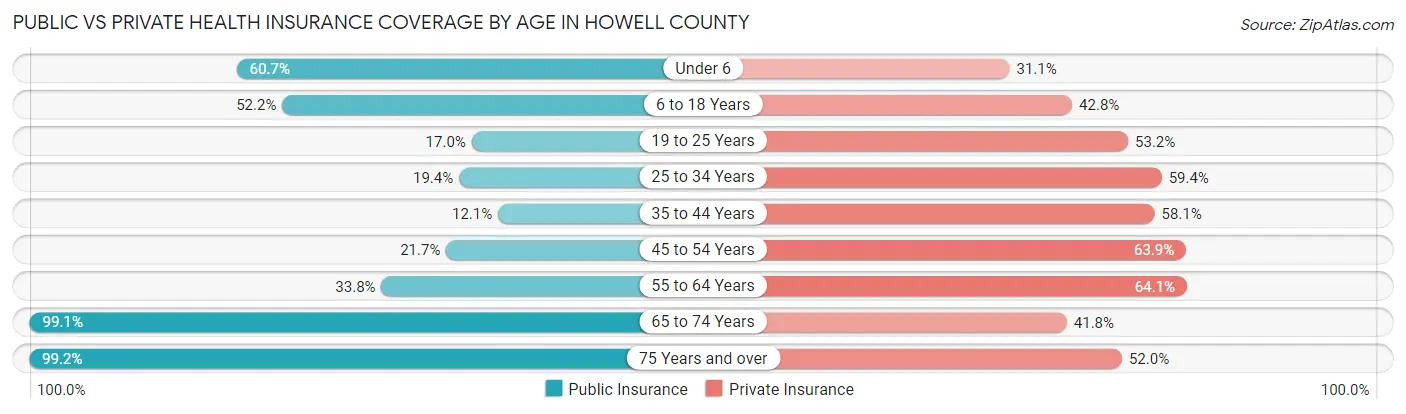
| Age Bracket | Public Insurance | Private Insurance |
| Under 6 | 1,693 (60.7%) | 869 (31.1%) |
| 6 to 18 Years | 3,784 (52.2%) | 3,101 (42.8%) |
| 19 to 25 Years | 513 (17.0%) | 1,602 (53.1%) |
| 25 to 34 Years | 802 (19.4%) | 2,460 (59.4%) |
| 35 to 44 Years | 563 (12.1%) | 2,694 (58.1%) |
| 45 to 54 Years | 1,042 (21.7%) | 3,063 (63.9%) |
| 55 to 64 Years | 1,808 (33.8%) | 3,429 (64.0%) |
| 65 to 74 Years | 4,392 (99.1%) | 1,852 (41.8%) |
| 75 Years and over | 3,052 (99.2%) | 1,601 (52.0%) |
| Total | 17,649 (44.7%) | 20,671 (52.3%) |
Disability Status by Sex by Age in Howell County
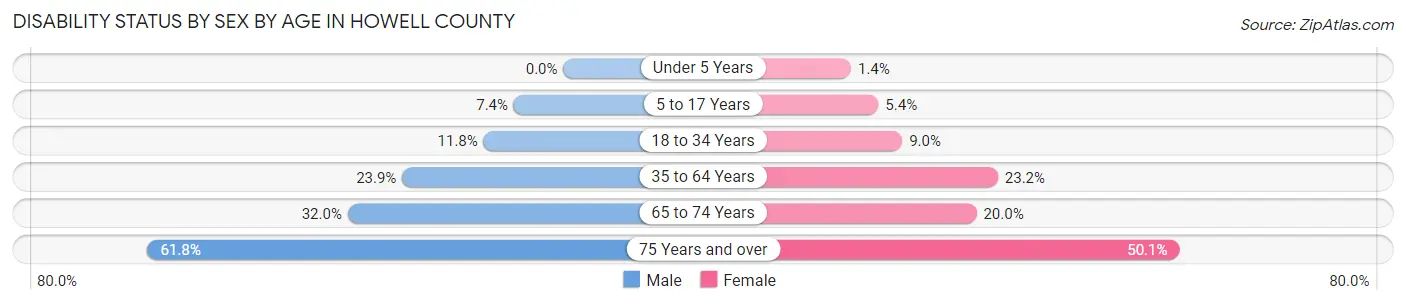
| Age Bracket | Male | Female |
| Under 5 Years | 0 (0.0%) | 16 (1.4%) |
| 5 to 17 Years | 263 (7.3%) | 194 (5.4%) |
| 18 to 34 Years | 448 (11.8%) | 343 (9.0%) |
| 35 to 64 Years | 1,738 (23.9%) | 1,744 (23.2%) |
| 65 to 74 Years | 659 (32.0%) | 475 (20.0%) |
| 75 Years and over | 804 (61.8%) | 890 (50.1%) |
Disability Class by Sex by Age in Howell County
Disability Class: Hearing Difficulty
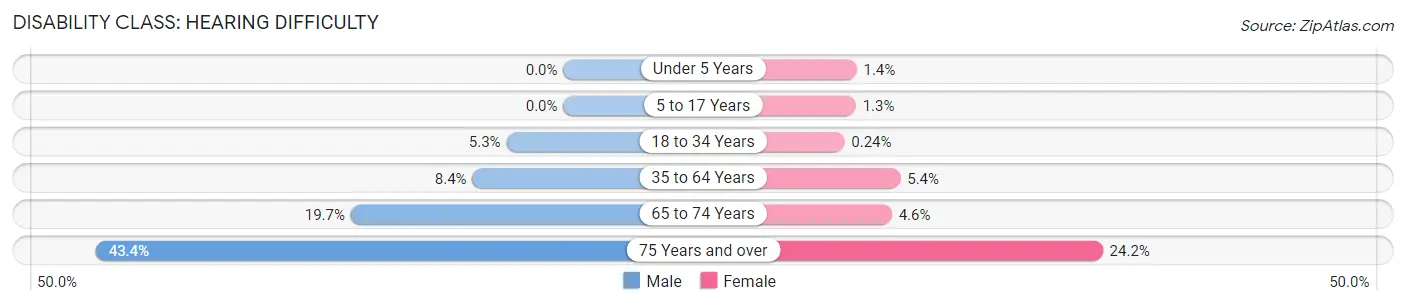
| Age Bracket | Male | Female |
| Under 5 Years | 0 (0.0%) | 16 (1.4%) |
| 5 to 17 Years | 0 (0.0%) | 46 (1.3%) |
| 18 to 34 Years | 200 (5.3%) | 9 (0.2%) |
| 35 to 64 Years | 613 (8.4%) | 409 (5.4%) |
| 65 to 74 Years | 406 (19.7%) | 110 (4.6%) |
| 75 Years and over | 565 (43.4%) | 430 (24.2%) |
Disability Class: Vision Difficulty
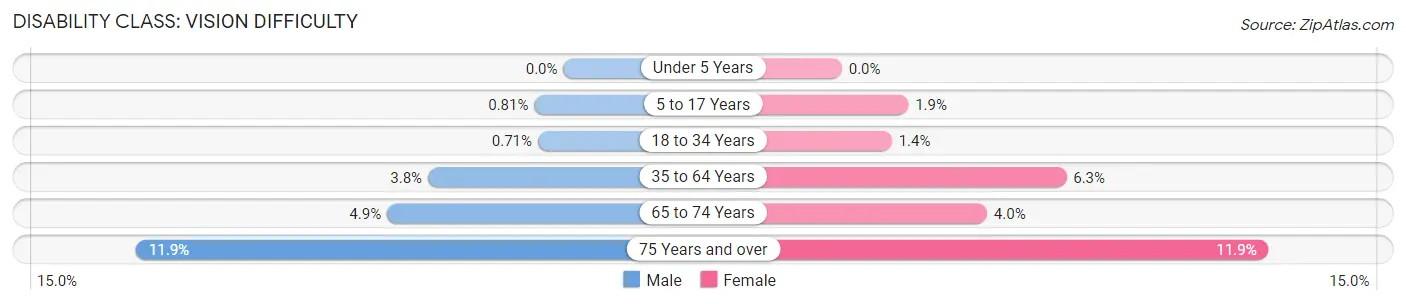
| Age Bracket | Male | Female |
| Under 5 Years | 0 (0.0%) | 0 (0.0%) |
| 5 to 17 Years | 29 (0.8%) | 66 (1.8%) |
| 18 to 34 Years | 27 (0.7%) | 53 (1.4%) |
| 35 to 64 Years | 274 (3.8%) | 470 (6.2%) |
| 65 to 74 Years | 101 (4.9%) | 96 (4.0%) |
| 75 Years and over | 155 (11.9%) | 211 (11.9%) |
Disability Class: Cognitive Difficulty
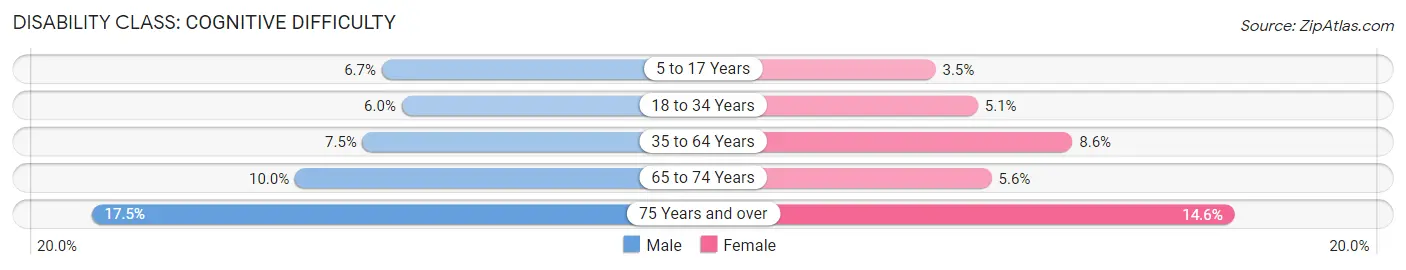
| Age Bracket | Male | Female |
| 5 to 17 Years | 241 (6.7%) | 124 (3.5%) |
| 18 to 34 Years | 227 (6.0%) | 193 (5.1%) |
| 35 to 64 Years | 541 (7.4%) | 644 (8.6%) |
| 65 to 74 Years | 205 (10.0%) | 132 (5.6%) |
| 75 Years and over | 228 (17.5%) | 259 (14.6%) |
Disability Class: Ambulatory Difficulty
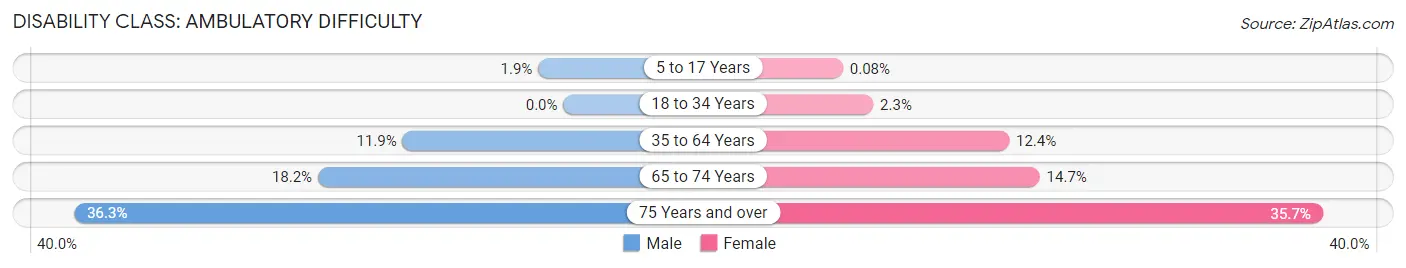
| Age Bracket | Male | Female |
| 5 to 17 Years | 67 (1.9%) | 3 (0.1%) |
| 18 to 34 Years | 0 (0.0%) | 89 (2.3%) |
| 35 to 64 Years | 867 (11.9%) | 935 (12.4%) |
| 65 to 74 Years | 375 (18.2%) | 349 (14.7%) |
| 75 Years and over | 473 (36.3%) | 634 (35.7%) |
Disability Class: Self-Care Difficulty
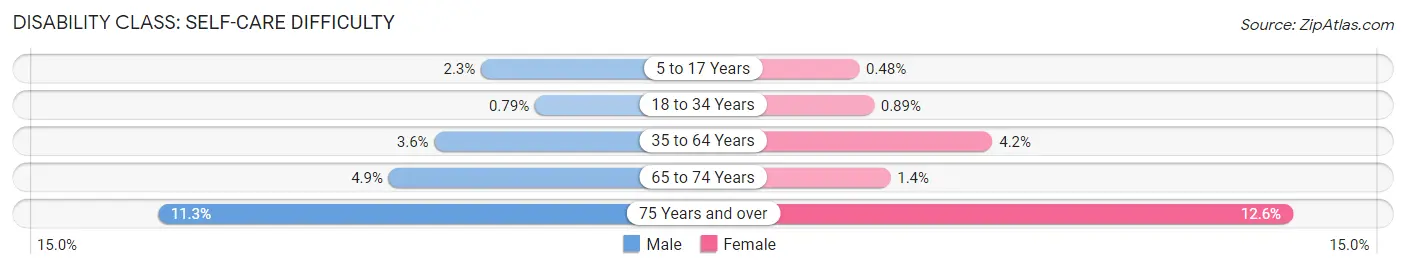
| Age Bracket | Male | Female |
| 5 to 17 Years | 82 (2.3%) | 17 (0.5%) |
| 18 to 34 Years | 30 (0.8%) | 34 (0.9%) |
| 35 to 64 Years | 261 (3.6%) | 315 (4.2%) |
| 65 to 74 Years | 100 (4.9%) | 32 (1.3%) |
| 75 Years and over | 147 (11.3%) | 223 (12.6%) |
Technology Access in Howell County
Computing Device Access in Howell County
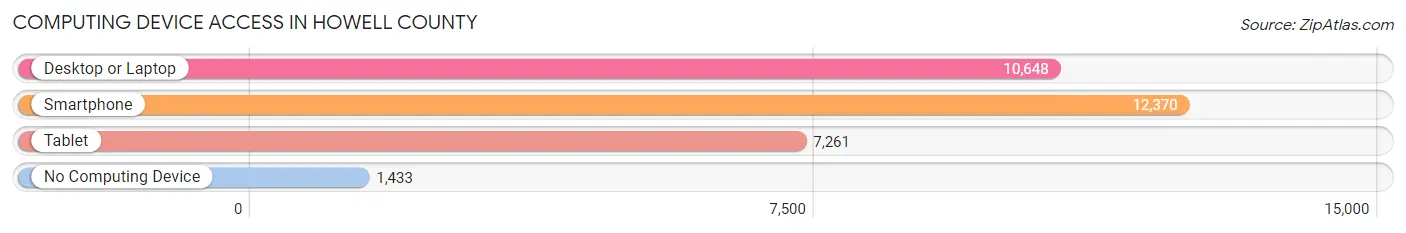
| Device Type | # Households | % Households |
| Desktop or Laptop | 10,648 | 69.0% |
| Smartphone | 12,370 | 80.1% |
| Tablet | 7,261 | 47.0% |
| No Computing Device | 1,433 | 9.3% |
| Total | 15,433 | 100.0% |
Internet Access in Howell County
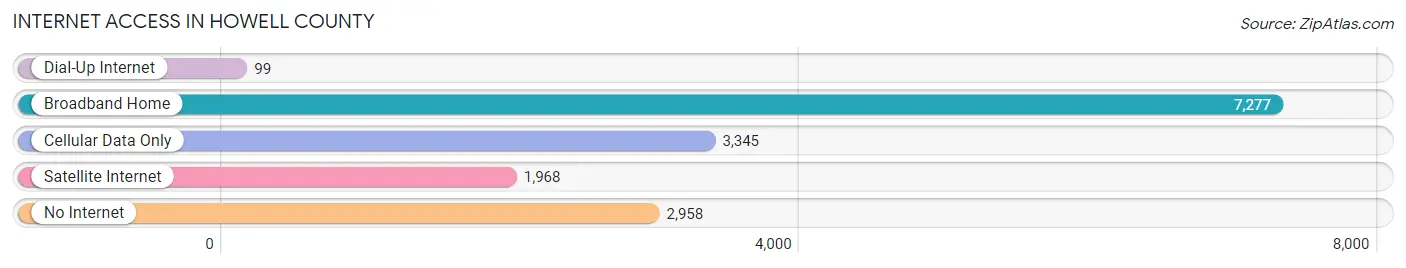
| Internet Type | # Households | % Households |
| Dial-Up Internet | 99 | 0.6% |
| Broadband Home | 7,277 | 47.1% |
| Cellular Data Only | 3,345 | 21.7% |
| Satellite Internet | 1,968 | 12.8% |
| No Internet | 2,958 | 19.2% |
| Total | 15,433 | 100.0% |
Howell County Summary
Howell County, Missouri is located in the southern part of the state, and is bordered by Oregon County to the north, Shannon County to the east, Texas County to the south, and Douglas County to the west. The county seat is West Plains, and the county was established in 1851. The county has a total area of 576 square miles, and a population of 40,400 as of the 2010 census.
History
The area that is now Howell County was originally inhabited by the Osage Indians, who were forced to cede the land to the United States in 1808. The first settlers arrived in the area in the early 1800s, and the county was officially established in 1851. The county was named after Josiah Howell, a prominent local politician.
During the Civil War, Howell County was a divided county, with many residents supporting the Confederacy and others supporting the Union. The county was the site of several skirmishes during the war, and the town of West Plains was burned by Confederate forces in 1863.
After the war, the county experienced a period of growth and development. The county seat of West Plains was established in 1872, and the county's first newspaper, the West Plains Journal, was founded in 1873. The county also saw the establishment of several churches, schools, and businesses.
Geography
Howell County is located in the Ozark Mountains region of Missouri. The county is mostly rural, with rolling hills and valleys. The county is drained by the Eleven Point River, which flows through the county from north to south. The county is also home to several small lakes, including Lake Norfork and Lake Taneycomo.
The county has a total area of 576 square miles, and a population of 40,400 as of the 2010 census. The county seat is West Plains, and the county is divided into twelve townships.
Economy
The economy of Howell County is largely based on agriculture and tourism. The county is home to several large farms, and the county's main crops are corn, soybeans, wheat, and hay. The county is also home to several small businesses, including restaurants, retail stores, and manufacturing plants.
Tourism is also an important part of the county's economy. The county is home to several state parks, including Mark Twain National Forest and Big Spring State Park. The county is also home to several historic sites, including the West Plains Historic District and the Howell County Courthouse.
Demographics
As of the 2010 census, Howell County had a population of 40,400. The racial makeup of the county was 95.3% White, 0.7% African American, 0.5% Native American, 0.3% Asian, 0.1% Pacific Islander, 1.3% from other races, and 1.8% from two or more races. Hispanic or Latino of any race were 3.2% of the population.
The median income for a household in the county was $32,917, and the median income for a family was $41,945. The per capita income for the county was $17,845. About 15.2% of families and 19.7% of the population were below the poverty line, including 25.2% of those under age 18 and 11.2% of those age 65 or over.
Common Questions
What is Per Capita Income in Howell County?
Per Capita income in Howell County is $24,389.
What is the Median Family Income in Howell County?
Median Family Income in Howell County is $55,746.
What is the Median Household income in Howell County?
Median Household Income in Howell County is $46,401.
What is Income or Wage Gap in Howell County?
Income or Wage Gap in Howell County is 32.3%.
Women in Howell County earn 67.7 cents for every dollar earned by a man.
What is Family Income Deficit in Howell County?
Family Income Deficit in Howell County is $10,365.
Families that are below poverty line in Howell County earn $10,365 less on average than the poverty threshold level.
What is Inequality or Gini Index in Howell County?
Inequality or Gini Index in Howell County is 0.47.
What is the Total Population of Howell County?
Total Population of Howell County is 39,960.
What is the Total Male Population of Howell County?
Total Male Population of Howell County is 19,454.
What is the Total Female Population of Howell County?
Total Female Population of Howell County is 20,506.
What is the Ratio of Males per 100 Females in Howell County?
There are 94.87 Males per 100 Females in Howell County.
What is the Ratio of Females per 100 Males in Howell County?
There are 105.41 Females per 100 Males in Howell County.
What is the Median Population Age in Howell County?
Median Population Age in Howell County is 40.7 Years.
What is the Average Family Size in Howell County
Average Family Size in Howell County is 3.2 People.
What is the Average Household Size in Howell County
Average Household Size in Howell County is 2.5 People.
How Large is the Labor Force in Howell County?
There are 16,892 People in the Labor Forcein in Howell County.
What is the Percentage of People in the Labor Force in Howell County?
53.5% of People are in the Labor Force in Howell County.
What is the Unemployment Rate in Howell County?
Unemployment Rate in Howell County is 5.5%.