Grundy County, MO Map & Demographics
Grundy County Map
Grundy County Overview
$27,809
PER CAPITA INCOME
$64,239
AVG FAMILY INCOME
$51,045
AVG HOUSEHOLD INCOME
43.2%
WAGE / INCOME GAP [ % ]
56.8¢/ $1
WAGE / INCOME GAP [ $ ]
$10,188
FAMILY INCOME DEFICIT
0.48
INEQUALITY / GINI INDEX
9,878
TOTAL POPULATION
4,822
MALE POPULATION
5,056
FEMALE POPULATION
95.37
MALES / 100 FEMALES
104.85
FEMALES / 100 MALES
40.2
MEDIAN AGE
3.3
AVG FAMILY SIZE
2.5
AVG HOUSEHOLD SIZE
4,186
LABOR FORCE [ PEOPLE ]
54.7%
PERCENT IN LABOR FORCE
4.1%
UNEMPLOYMENT RATE
Grundy County Area Codes
Income in Grundy County
Income Overview in Grundy County
Per Capita Income in Grundy County is $27,809, while median incomes of families and households are $64,239 and $51,045 respectively.
| Characteristic | Number | Measure |
| Per Capita Income | 9,878 | $27,809 |
| Median Family Income | 2,318 | $64,239 |
| Mean Family Income | 2,318 | $76,524 |
| Median Household Income | 3,806 | $51,045 |
| Mean Household Income | 3,806 | $69,032 |
| Income Deficit | 2,318 | $10,188 |
| Wage / Income Gap (%) | 9,878 | 43.19% |
| Wage / Income Gap ($) | 9,878 | 56.81¢ per $1 |
| Gini / Inequality Index | 9,878 | 0.48 |
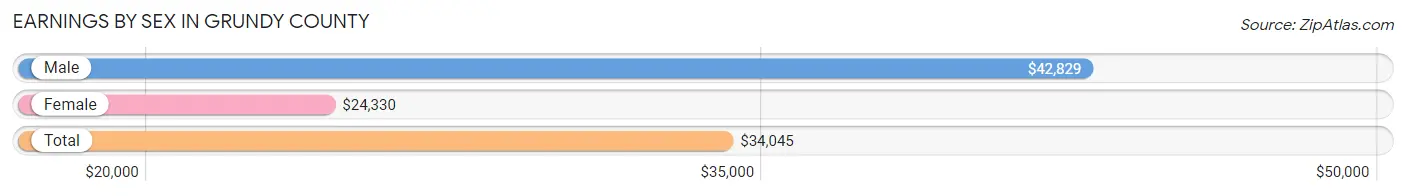
Earnings by Sex in Grundy County
Average Earnings in Grundy County are $34,045, $42,829 for men and $24,330 for women, a difference of 43.2%.
| Sex | Number | Average Earnings |
| Male | 2,346 (52.2%) | $42,829 |
| Female | 2,151 (47.8%) | $24,330 |
| Total | 4,497 (100.0%) | $34,045 |
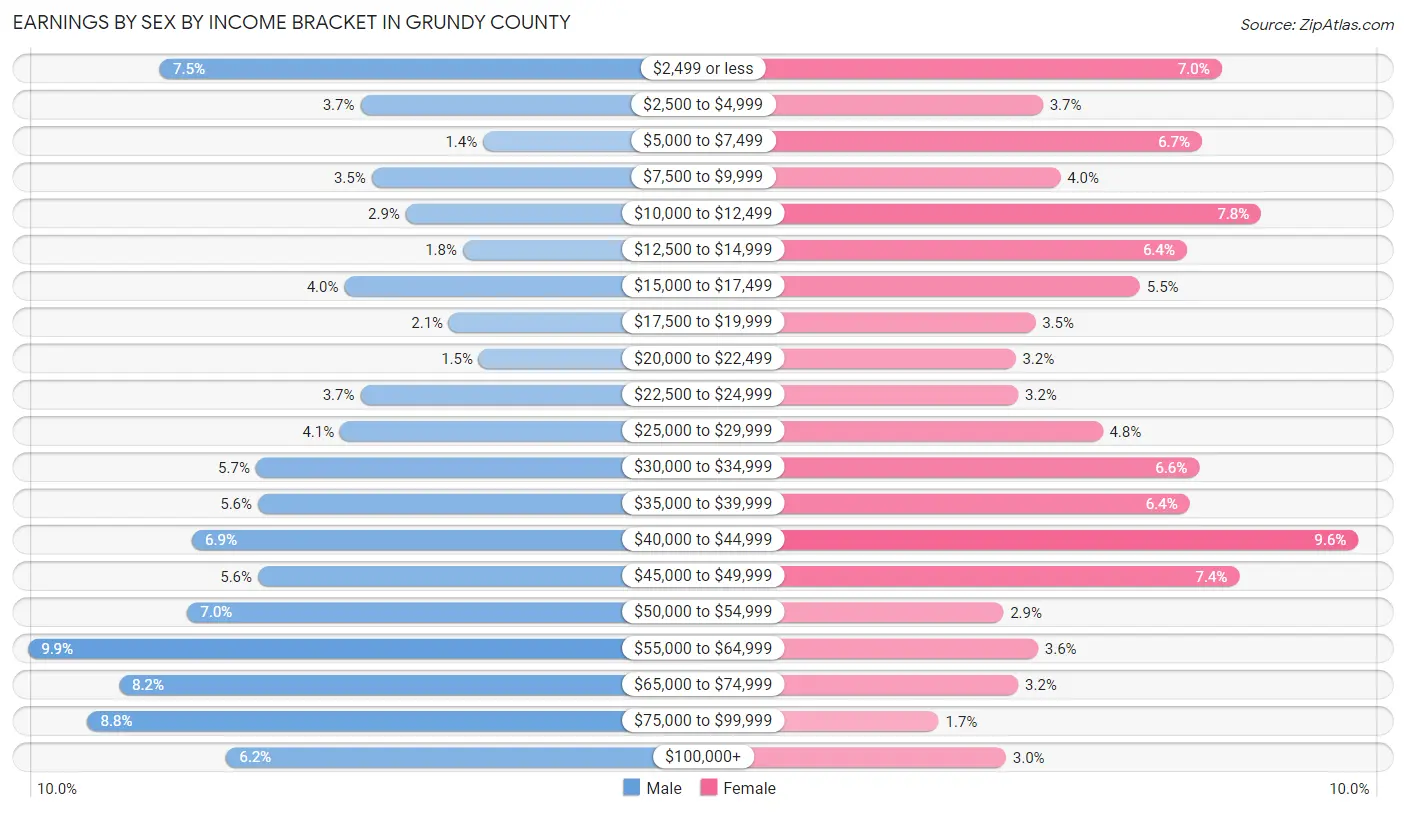
Earnings by Sex by Income Bracket in Grundy County
The most common earnings brackets in Grundy County are $55,000 to $64,999 for men (233 | 9.9%) and $40,000 to $44,999 for women (206 | 9.6%).
| Income | Male | Female |
| $2,499 or less | 175 (7.5%) | 151 (7.0%) |
| $2,500 to $4,999 | 87 (3.7%) | 79 (3.7%) |
| $5,000 to $7,499 | 33 (1.4%) | 143 (6.7%) |
| $7,500 to $9,999 | 82 (3.5%) | 86 (4.0%) |
| $10,000 to $12,499 | 67 (2.9%) | 167 (7.8%) |
| $12,500 to $14,999 | 42 (1.8%) | 137 (6.4%) |
| $15,000 to $17,499 | 94 (4.0%) | 118 (5.5%) |
| $17,500 to $19,999 | 48 (2.1%) | 76 (3.5%) |
| $20,000 to $22,499 | 35 (1.5%) | 68 (3.2%) |
| $22,500 to $24,999 | 87 (3.7%) | 69 (3.2%) |
| $25,000 to $29,999 | 96 (4.1%) | 103 (4.8%) |
| $30,000 to $34,999 | 133 (5.7%) | 142 (6.6%) |
| $35,000 to $39,999 | 132 (5.6%) | 138 (6.4%) |
| $40,000 to $44,999 | 161 (6.9%) | 206 (9.6%) |
| $45,000 to $49,999 | 132 (5.6%) | 158 (7.3%) |
| $50,000 to $54,999 | 163 (7.0%) | 63 (2.9%) |
| $55,000 to $64,999 | 233 (9.9%) | 77 (3.6%) |
| $65,000 to $74,999 | 193 (8.2%) | 69 (3.2%) |
| $75,000 to $99,999 | 207 (8.8%) | 37 (1.7%) |
| $100,000+ | 146 (6.2%) | 64 (3.0%) |
| Total | 2,346 (100.0%) | 2,151 (100.0%) |
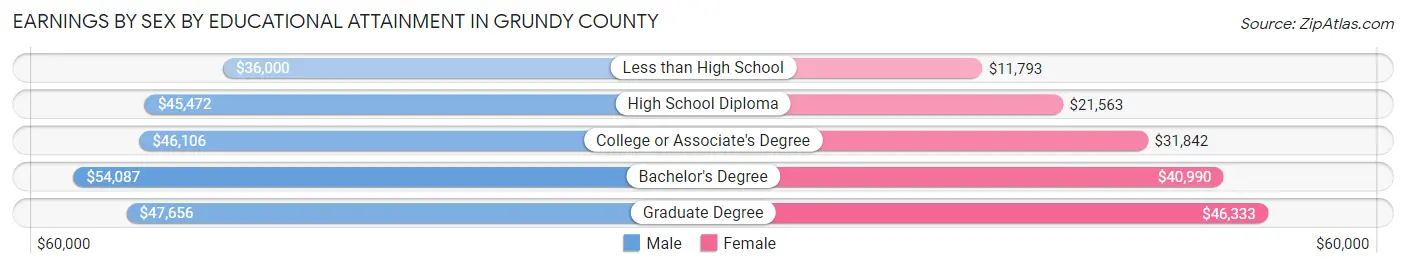
Earnings by Sex by Educational Attainment in Grundy County
Average earnings in Grundy County are $46,063 for men and $28,091 for women, a difference of 39.0%. Men with an educational attainment of bachelor's degree enjoy the highest average annual earnings of $54,087, while those with less than high school education earn the least with $36,000. Women with an educational attainment of graduate degree earn the most with the average annual earnings of $46,333, while those with less than high school education have the smallest earnings of $11,793.
| Educational Attainment | Male Income | Female Income |
| Less than High School | $36,000 | $11,793 |
| High School Diploma | $45,472 | $21,563 |
| College or Associate's Degree | $46,106 | $31,842 |
| Bachelor's Degree | $54,087 | $40,990 |
| Graduate Degree | $47,656 | $46,333 |
| Total | $46,063 | $28,091 |
Family Income in Grundy County
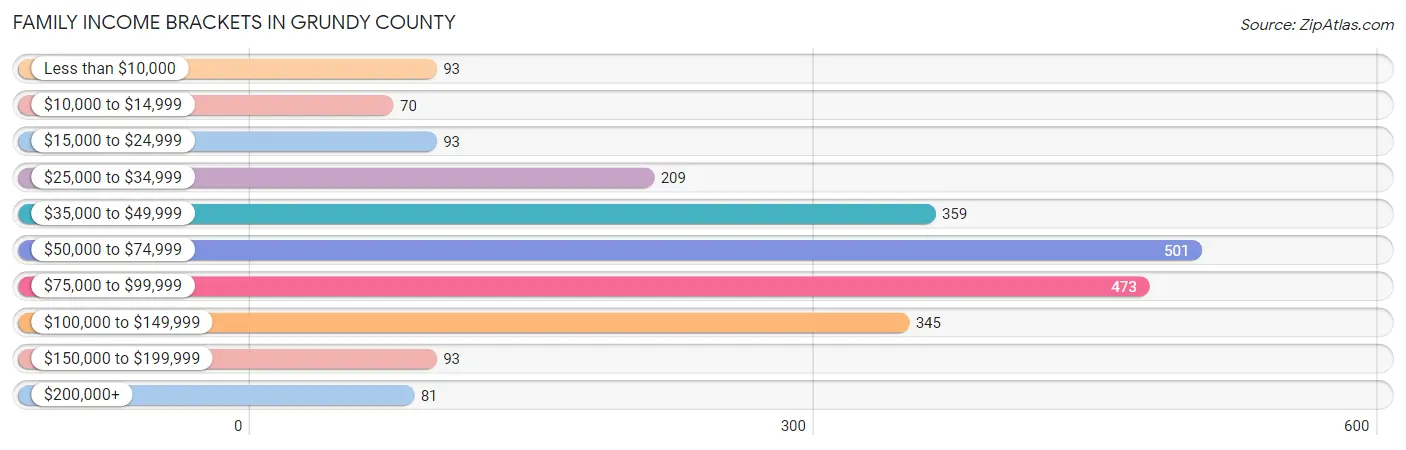
Family Income Brackets in Grundy County
According to the Grundy County family income data, there are 501 families falling into the $50,000 to $74,999 income range, which is the most common income bracket and makes up 21.6% of all families. Conversely, the $10,000 to $14,999 income bracket is the least frequent group with only 70 families (3.0%) belonging to this category.
| Income Bracket | # Families | % Families |
| Less than $10,000 | 93 | 4.0% |
| $10,000 to $14,999 | 70 | 3.0% |
| $15,000 to $24,999 | 93 | 4.0% |
| $25,000 to $34,999 | 209 | 9.0% |
| $35,000 to $49,999 | 359 | 15.5% |
| $50,000 to $74,999 | 501 | 21.6% |
| $75,000 to $99,999 | 473 | 20.4% |
| $100,000 to $149,999 | 345 | 14.9% |
| $150,000 to $199,999 | 93 | 4.0% |
| $200,000+ | 81 | 3.5% |
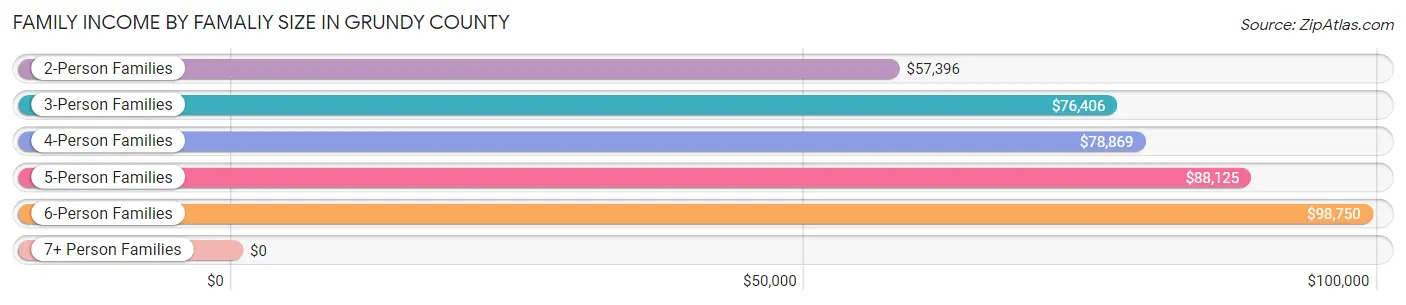
Family Income by Famaliy Size in Grundy County
6-person families (95 | 4.1%) account for the highest median family income in Grundy County with $98,750 per family, while 2-person families (1,313 | 56.6%) have the highest median income of $28,698 per family member.
| Income Bracket | # Families | Median Income |
| 2-Person Families | 1,313 (56.6%) | $57,396 |
| 3-Person Families | 357 (15.4%) | $76,406 |
| 4-Person Families | 351 (15.1%) | $78,869 |
| 5-Person Families | 155 (6.7%) | $88,125 |
| 6-Person Families | 95 (4.1%) | $98,750 |
| 7+ Person Families | 47 (2.0%) | $0 |
| Total | 2,318 (100.0%) | $64,239 |
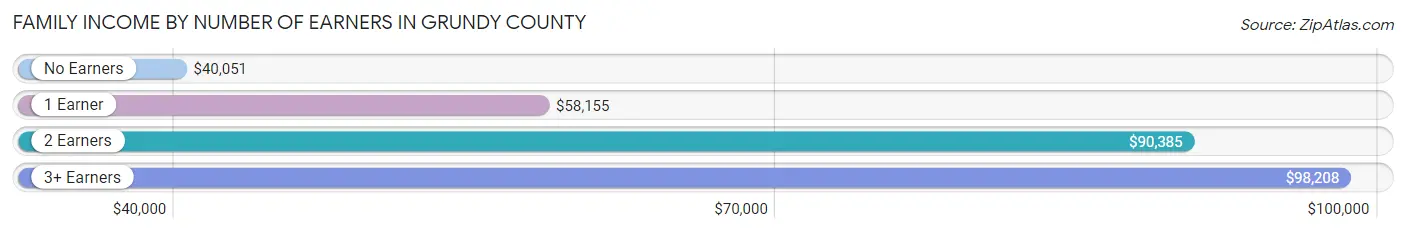
Family Income by Number of Earners in Grundy County
The median family income in Grundy County is $64,239, with families comprising 3+ earners (184) having the highest median family income of $98,208, while families with no earners (463) have the lowest median family income of $40,051, accounting for 7.9% and 20.0% of families, respectively.
| Number of Earners | # Families | Median Income |
| No Earners | 463 (20.0%) | $40,051 |
| 1 Earner | 827 (35.7%) | $58,155 |
| 2 Earners | 844 (36.4%) | $90,385 |
| 3+ Earners | 184 (7.9%) | $98,208 |
| Total | 2,318 (100.0%) | $64,239 |
Household Income in Grundy County
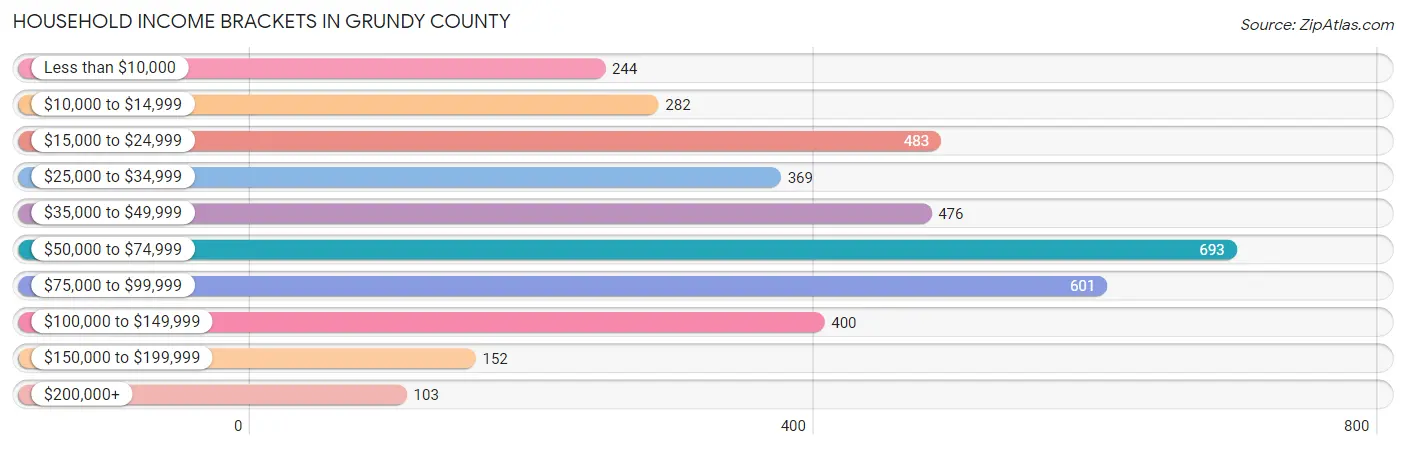
Household Income Brackets in Grundy County
With 693 households falling in the category, the $50,000 to $74,999 income range is the most frequent in Grundy County, accounting for 18.2% of all households. In contrast, only 103 households (2.7%) fall into the $200,000+ income bracket, making it the least populous group.
| Income Bracket | # Households | % Households |
| Less than $10,000 | 244 | 6.4% |
| $10,000 to $14,999 | 282 | 7.4% |
| $15,000 to $24,999 | 483 | 12.7% |
| $25,000 to $34,999 | 369 | 9.7% |
| $35,000 to $49,999 | 476 | 12.5% |
| $50,000 to $74,999 | 693 | 18.2% |
| $75,000 to $99,999 | 601 | 15.8% |
| $100,000 to $149,999 | 400 | 10.5% |
| $150,000 to $199,999 | 152 | 4.0% |
| $200,000+ | 103 | 2.7% |
Household Income by Householder Age in Grundy County
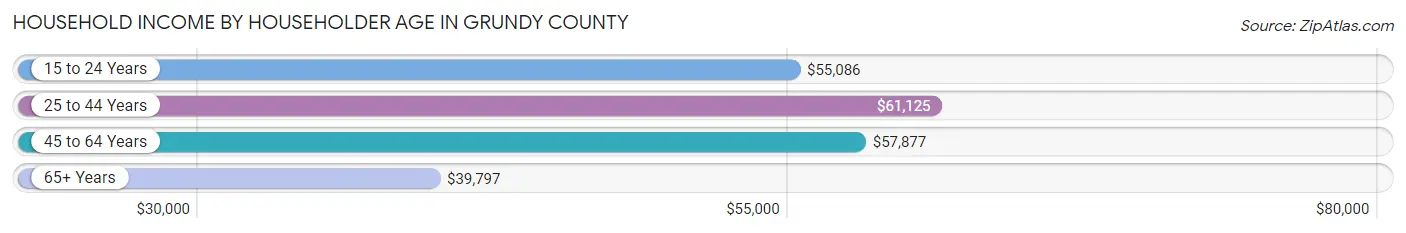
The median household income in Grundy County is $51,045, with the highest median household income of $61,125 found in the 25 to 44 years age bracket for the primary householder. A total of 975 households (25.6%) fall into this category. Meanwhile, the 65+ years age bracket for the primary householder has the lowest median household income of $39,797, with 1,335 households (35.1%) in this group.
| Income Bracket | # Households | Median Income |
| 15 to 24 Years | 136 (3.6%) | $55,086 |
| 25 to 44 Years | 975 (25.6%) | $61,125 |
| 45 to 64 Years | 1,360 (35.7%) | $57,877 |
| 65+ Years | 1,335 (35.1%) | $39,797 |
| Total | 3,806 (100.0%) | $51,045 |
Poverty in Grundy County
Income Below Poverty by Sex and Age in Grundy County
With 12.2% poverty level for males and 20.7% for females among the residents of Grundy County, 5 year old males and 16 and 17 year old females are the most vulnerable to poverty, with 22 males (46.8%) and 37 females (32.2%) in their respective age groups living below the poverty level.
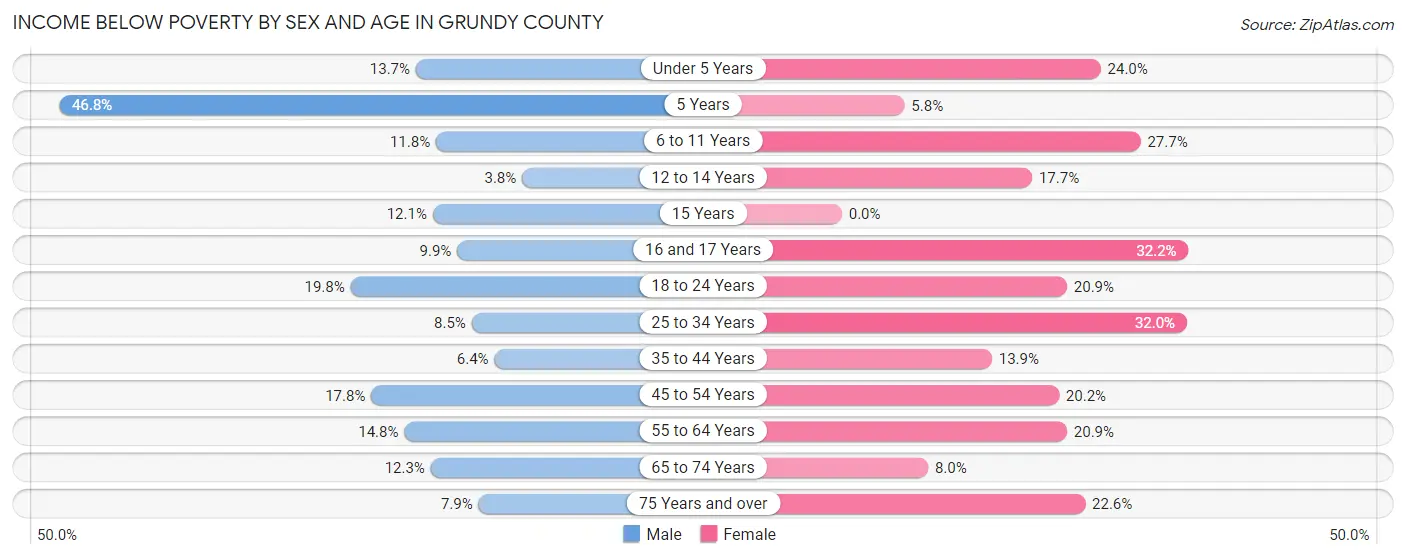
| Age Bracket | Male | Female |
| Under 5 Years | 46 (13.7%) | 86 (24.0%) |
| 5 Years | 22 (46.8%) | 5 (5.8%) |
| 6 to 11 Years | 54 (11.8%) | 130 (27.7%) |
| 12 to 14 Years | 8 (3.8%) | 18 (17.6%) |
| 15 Years | 4 (12.1%) | 0 (0.0%) |
| 16 and 17 Years | 13 (9.9%) | 37 (32.2%) |
| 18 to 24 Years | 63 (19.8%) | 66 (20.9%) |
| 25 to 34 Years | 49 (8.5%) | 196 (32.0%) |
| 35 to 44 Years | 33 (6.4%) | 65 (13.9%) |
| 45 to 54 Years | 87 (17.8%) | 106 (20.2%) |
| 55 to 64 Years | 98 (14.8%) | 132 (20.9%) |
| 65 to 74 Years | 65 (12.3%) | 42 (8.0%) |
| 75 Years and over | 30 (7.9%) | 126 (22.6%) |
| Total | 572 (12.2%) | 1,009 (20.7%) |
Income Above Poverty by Sex and Age in Grundy County
According to the poverty statistics in Grundy County, males aged 12 to 14 years and females aged 15 years are the age groups that are most secure financially, with 96.2% of males and 100.0% of females in these age groups living above the poverty line.
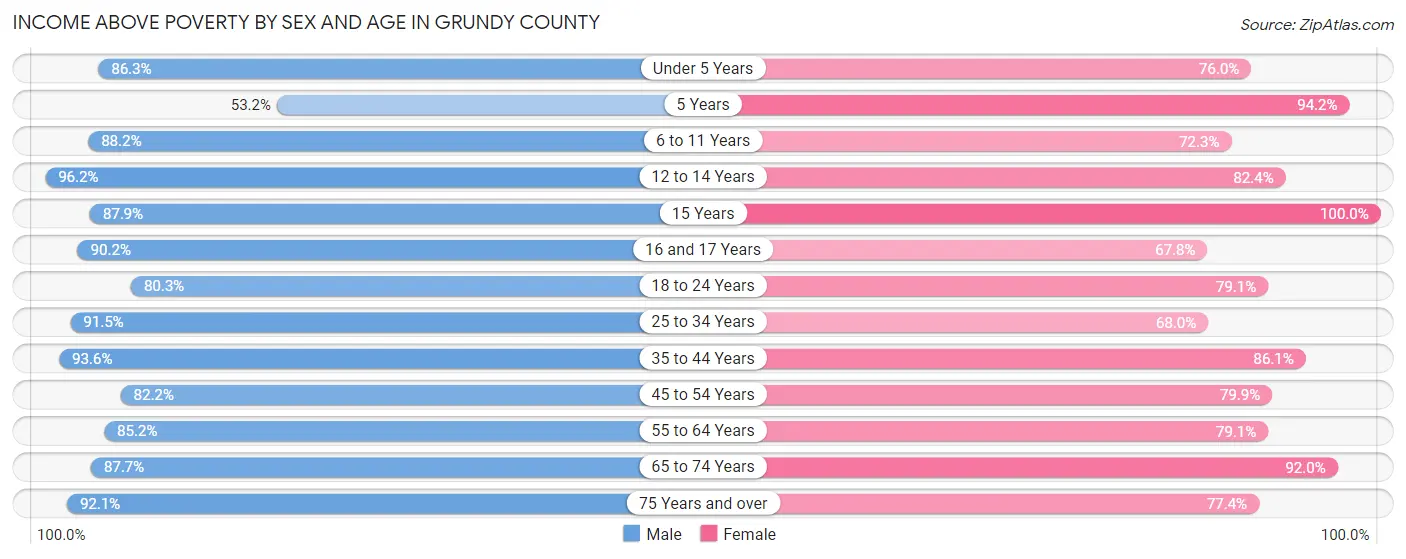
| Age Bracket | Male | Female |
| Under 5 Years | 290 (86.3%) | 272 (76.0%) |
| 5 Years | 25 (53.2%) | 81 (94.2%) |
| 6 to 11 Years | 403 (88.2%) | 339 (72.3%) |
| 12 to 14 Years | 201 (96.2%) | 84 (82.4%) |
| 15 Years | 29 (87.9%) | 112 (100.0%) |
| 16 and 17 Years | 119 (90.1%) | 78 (67.8%) |
| 18 to 24 Years | 256 (80.2%) | 250 (79.1%) |
| 25 to 34 Years | 527 (91.5%) | 416 (68.0%) |
| 35 to 44 Years | 483 (93.6%) | 402 (86.1%) |
| 45 to 54 Years | 401 (82.2%) | 420 (79.8%) |
| 55 to 64 Years | 566 (85.2%) | 500 (79.1%) |
| 65 to 74 Years | 463 (87.7%) | 483 (92.0%) |
| 75 Years and over | 351 (92.1%) | 432 (77.4%) |
| Total | 4,114 (87.8%) | 3,869 (79.3%) |
Income Below Poverty Among Married-Couple Families in Grundy County
The poverty statistics for married-couple families in Grundy County show that 8.9% or 167 of the total 1,884 families live below the poverty line. Families with 5 or more children have the highest poverty rate of 35.7%, comprising of 15 families. On the other hand, families with 1 or 2 children have the lowest poverty rate of 4.3%, which includes 19 families.
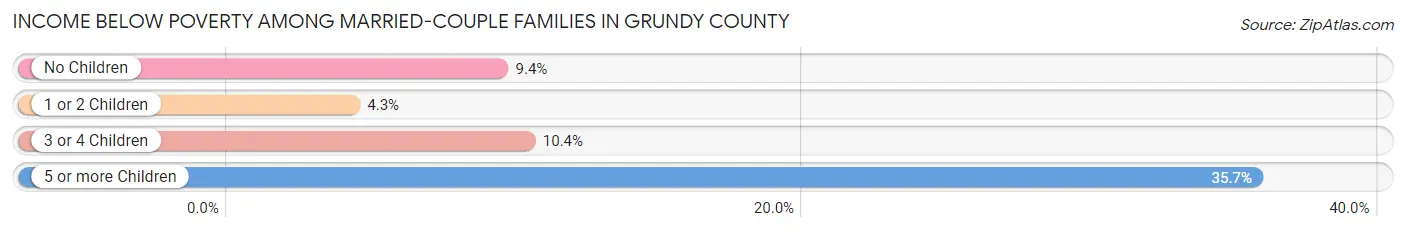
| Children | Above Poverty | Below Poverty |
| No Children | 1,116 (90.6%) | 116 (9.4%) |
| 1 or 2 Children | 427 (95.7%) | 19 (4.3%) |
| 3 or 4 Children | 147 (89.6%) | 17 (10.4%) |
| 5 or more Children | 27 (64.3%) | 15 (35.7%) |
| Total | 1,717 (91.1%) | 167 (8.9%) |
Income Below Poverty Among Single-Parent Households in Grundy County
According to the poverty data in Grundy County, 11.2% or 15 single-father households and 34.0% or 102 single-mother households are living below the poverty line. Among single-father households, those with 1 or 2 children have the highest poverty rate, with 13 households (18.1%) experiencing poverty. Likewise, among single-mother households, those with 3 or 4 children have the highest poverty rate, with 44 households (91.7%) falling below the poverty line.
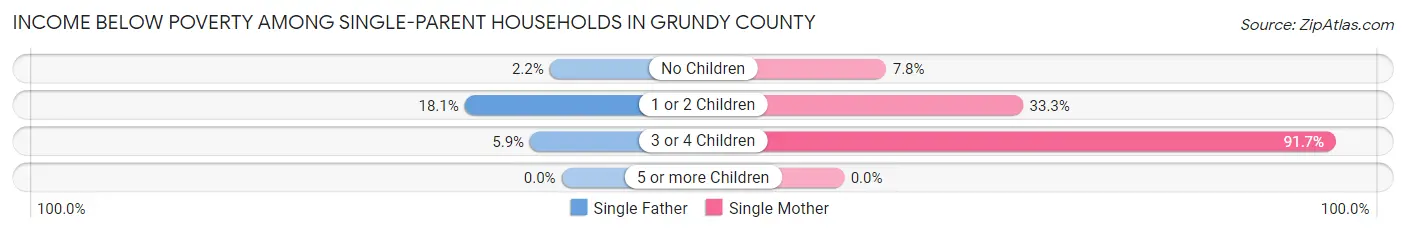
| Children | Single Father | Single Mother |
| No Children | 1 (2.2%) | 8 (7.8%) |
| 1 or 2 Children | 13 (18.1%) | 50 (33.3%) |
| 3 or 4 Children | 1 (5.9%) | 44 (91.7%) |
| 5 or more Children | 0 (0.0%) | 0 (0.0%) |
| Total | 15 (11.2%) | 102 (34.0%) |
Income Below Poverty Among Married-Couple vs Single-Parent Households in Grundy County
The poverty data for Grundy County shows that 167 of the married-couple family households (8.9%) and 117 of the single-parent households (27.0%) are living below the poverty level. Within the married-couple family households, those with 5 or more children have the highest poverty rate, with 15 households (35.7%) falling below the poverty line. Among the single-parent households, those with 3 or 4 children have the highest poverty rate, with 45 household (69.2%) living below poverty.
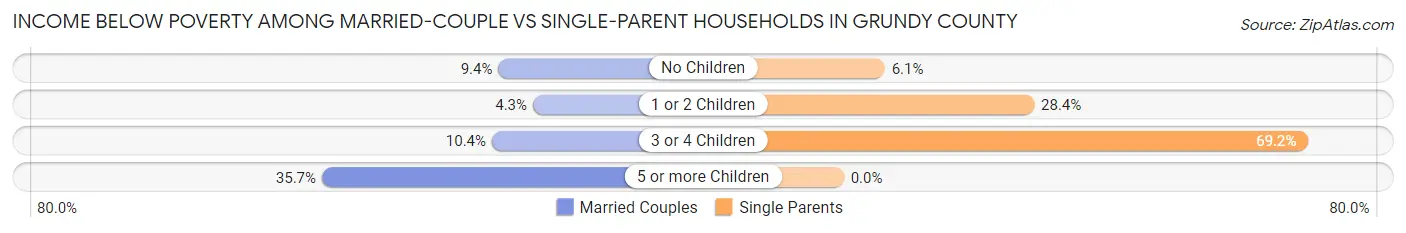
| Children | Married-Couple Families | Single-Parent Households |
| No Children | 116 (9.4%) | 9 (6.1%) |
| 1 or 2 Children | 19 (4.3%) | 63 (28.4%) |
| 3 or 4 Children | 17 (10.4%) | 45 (69.2%) |
| 5 or more Children | 15 (35.7%) | 0 (0.0%) |
| Total | 167 (8.9%) | 117 (27.0%) |
Race in Grundy County
The most populous races in Grundy County are White / Caucasian (9,331 | 94.5%), Two or more Races (298 | 3.0%), and Hispanic or Latino (265 | 2.7%).
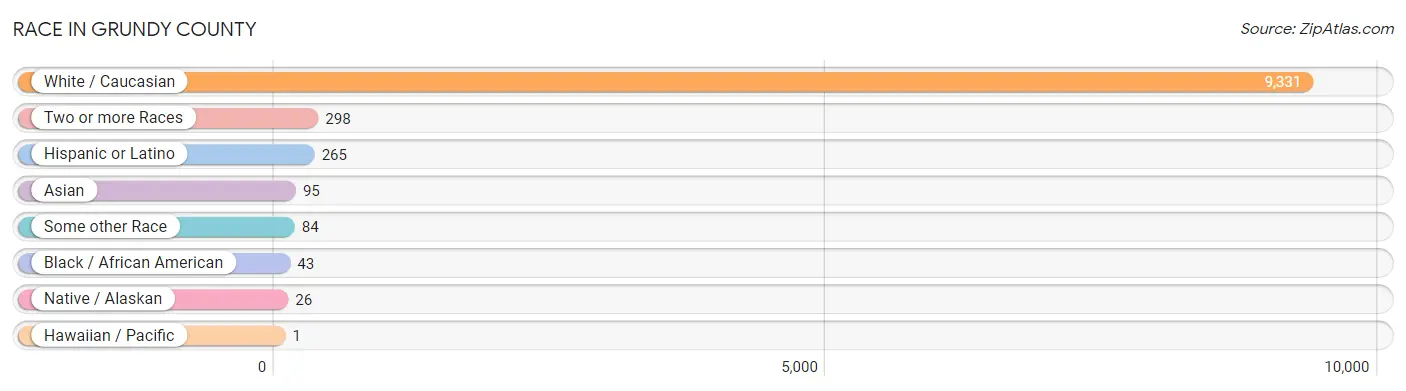
| Race | # Population | % Population |
| Asian | 95 | 1.0% |
| Black / African American | 43 | 0.4% |
| Hawaiian / Pacific | 1 | 0.0% |
| Hispanic or Latino | 265 | 2.7% |
| Native / Alaskan | 26 | 0.3% |
| White / Caucasian | 9,331 | 94.5% |
| Two or more Races | 298 | 3.0% |
| Some other Race | 84 | 0.9% |
| Total | 9,878 | 100.0% |
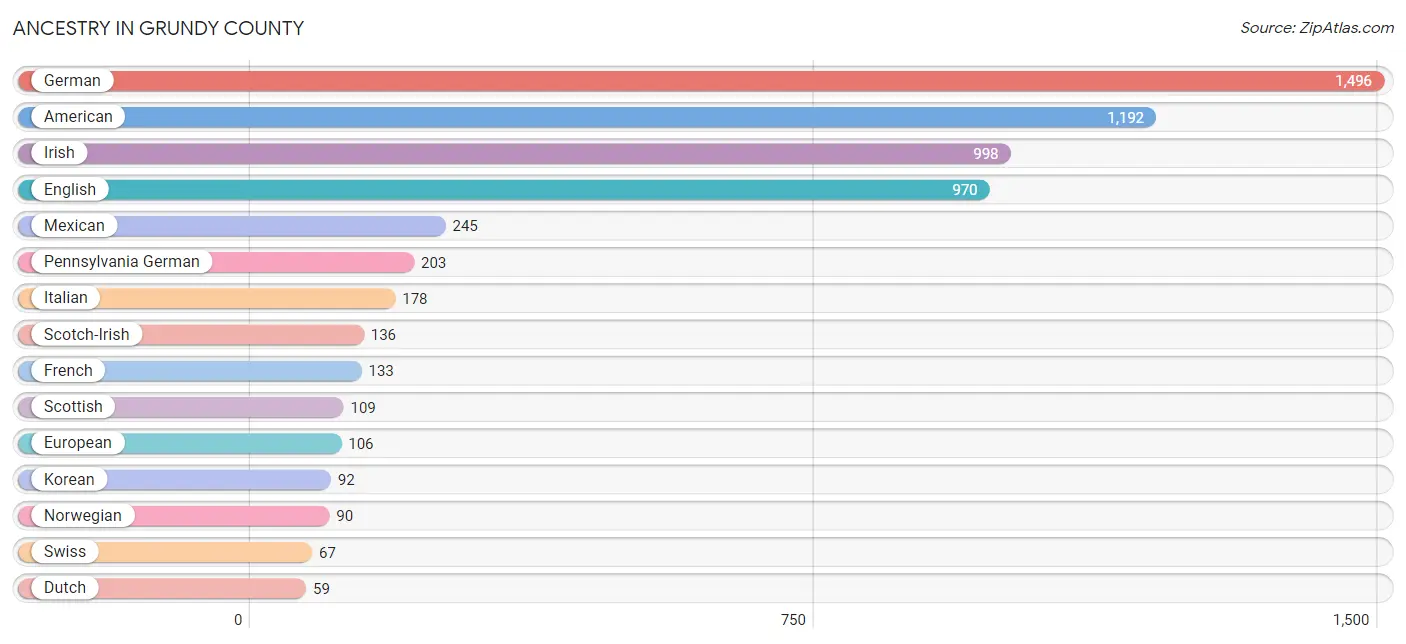
Ancestry in Grundy County
The most populous ancestries reported in Grundy County are German (1,496 | 15.1%), American (1,192 | 12.1%), Irish (998 | 10.1%), English (970 | 9.8%), and Mexican (245 | 2.5%), together accounting for 49.6% of all Grundy County residents.
| Ancestry | # Population | % Population |
| Alaska Native | 2 | 0.0% |
| American | 1,192 | 12.1% |
| Arab | 7 | 0.1% |
| Austrian | 1 | 0.0% |
| Belgian | 14 | 0.1% |
| Bhutanese | 1 | 0.0% |
| Blackfeet | 7 | 0.1% |
| Bolivian | 3 | 0.0% |
| British | 24 | 0.2% |
| Burmese | 5 | 0.1% |
| Cape Verdean | 1 | 0.0% |
| Central American | 11 | 0.1% |
| Cherokee | 39 | 0.4% |
| Croatian | 7 | 0.1% |
| Czech | 24 | 0.2% |
| Czechoslovakian | 16 | 0.2% |
| Danish | 9 | 0.1% |
| Dutch | 59 | 0.6% |
| Dutch West Indian | 2 | 0.0% |
| English | 970 | 9.8% |
| European | 106 | 1.1% |
| Finnish | 3 | 0.0% |
| French | 133 | 1.3% |
| French Canadian | 31 | 0.3% |
| German | 1,496 | 15.1% |
| Guamanian / Chamorro | 1 | 0.0% |
| Haitian | 1 | 0.0% |
| Hungarian | 7 | 0.1% |
| Indian (Asian) | 43 | 0.4% |
| Irish | 998 | 10.1% |
| Italian | 178 | 1.8% |
| Jamaican | 1 | 0.0% |
| Korean | 92 | 0.9% |
| Lebanese | 2 | 0.0% |
| Mexican | 245 | 2.5% |
| Moroccan | 5 | 0.1% |
| Northern European | 2 | 0.0% |
| Norwegian | 90 | 0.9% |
| Panamanian | 11 | 0.1% |
| Pennsylvania German | 203 | 2.1% |
| Polish | 20 | 0.2% |
| Potawatomi | 8 | 0.1% |
| Puerto Rican | 2 | 0.0% |
| Samoan | 3 | 0.0% |
| Scandinavian | 2 | 0.0% |
| Scotch-Irish | 136 | 1.4% |
| Scottish | 109 | 1.1% |
| Slovak | 1 | 0.0% |
| South American | 3 | 0.0% |
| South American Indian | 3 | 0.0% |
| Sri Lankan | 10 | 0.1% |
| Subsaharan African | 1 | 0.0% |
| Swedish | 16 | 0.2% |
| Swiss | 67 | 0.7% |
| Ukrainian | 2 | 0.0% |
| Welsh | 24 | 0.2% |
| Yugoslavian | 8 | 0.1% | View All 57 Rows |
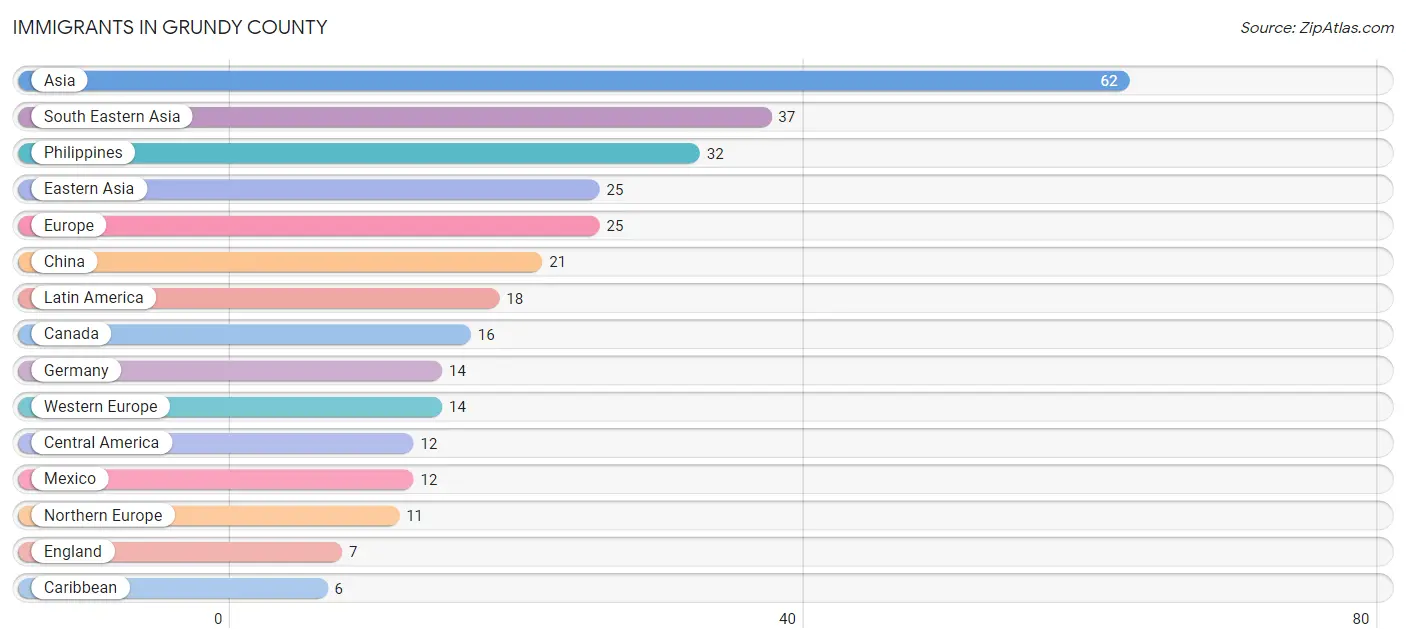
Immigrants in Grundy County
The most numerous immigrant groups reported in Grundy County came from Asia (62 | 0.6%), South Eastern Asia (37 | 0.4%), Philippines (32 | 0.3%), Eastern Asia (25 | 0.3%), and Europe (25 | 0.3%), together accounting for 1.8% of all Grundy County residents.
| Immigration Origin | # Population | % Population |
| Asia | 62 | 0.6% |
| Canada | 16 | 0.2% |
| Caribbean | 6 | 0.1% |
| Central America | 12 | 0.1% |
| China | 21 | 0.2% |
| Eastern Asia | 25 | 0.3% |
| England | 7 | 0.1% |
| Europe | 25 | 0.3% |
| Germany | 14 | 0.1% |
| Ireland | 4 | 0.0% |
| Korea | 4 | 0.0% |
| Latin America | 18 | 0.2% |
| Malaysia | 5 | 0.1% |
| Mexico | 12 | 0.1% |
| Northern Europe | 11 | 0.1% |
| Philippines | 32 | 0.3% |
| South Eastern Asia | 37 | 0.4% |
| West Indies | 4 | 0.0% |
| Western Europe | 14 | 0.1% | View All 19 Rows |
Sex and Age in Grundy County
Sex and Age in Grundy County
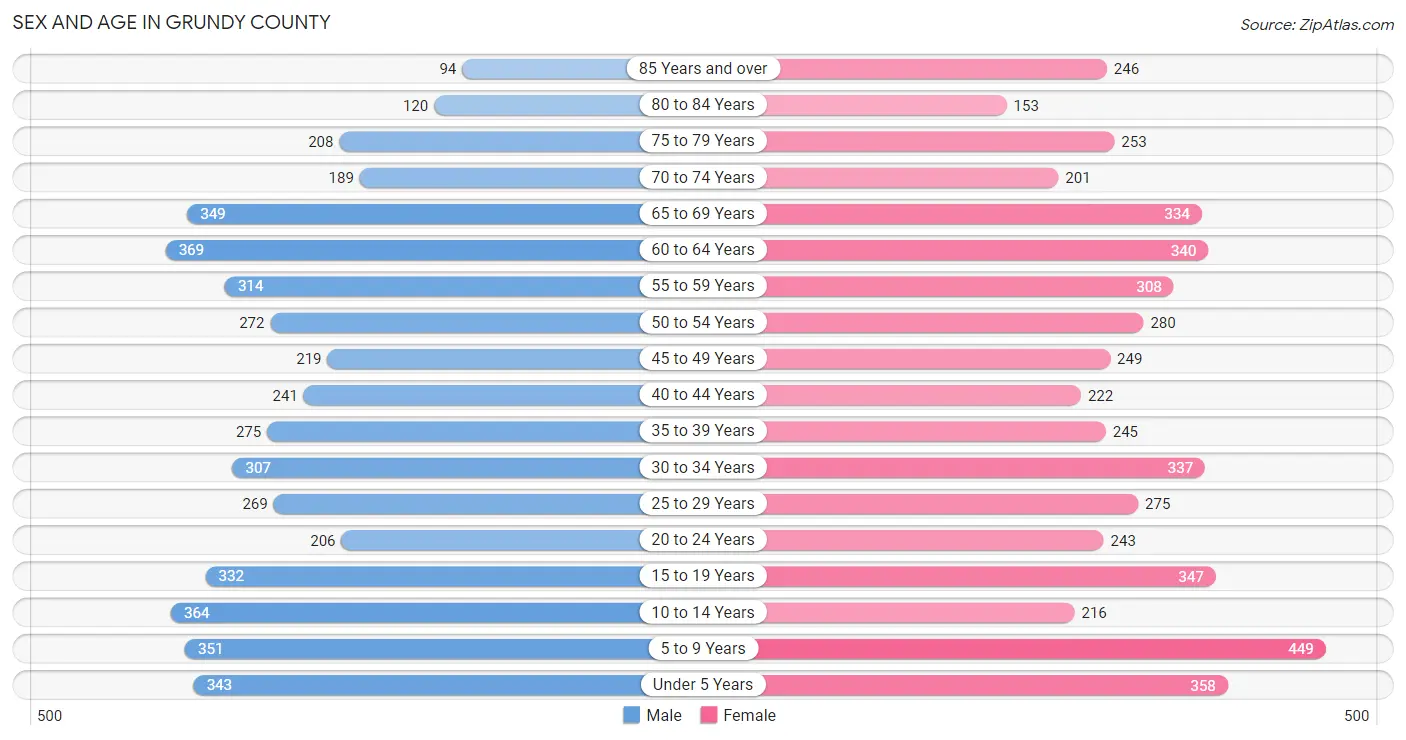
The most populous age groups in Grundy County are 60 to 64 Years (369 | 7.6%) for men and 5 to 9 Years (449 | 8.9%) for women.
| Age Bracket | Male | Female |
| Under 5 Years | 343 (7.1%) | 358 (7.1%) |
| 5 to 9 Years | 351 (7.3%) | 449 (8.9%) |
| 10 to 14 Years | 364 (7.5%) | 216 (4.3%) |
| 15 to 19 Years | 332 (6.9%) | 347 (6.9%) |
| 20 to 24 Years | 206 (4.3%) | 243 (4.8%) |
| 25 to 29 Years | 269 (5.6%) | 275 (5.4%) |
| 30 to 34 Years | 307 (6.4%) | 337 (6.7%) |
| 35 to 39 Years | 275 (5.7%) | 245 (4.9%) |
| 40 to 44 Years | 241 (5.0%) | 222 (4.4%) |
| 45 to 49 Years | 219 (4.5%) | 249 (4.9%) |
| 50 to 54 Years | 272 (5.6%) | 280 (5.5%) |
| 55 to 59 Years | 314 (6.5%) | 308 (6.1%) |
| 60 to 64 Years | 369 (7.6%) | 340 (6.7%) |
| 65 to 69 Years | 349 (7.2%) | 334 (6.6%) |
| 70 to 74 Years | 189 (3.9%) | 201 (4.0%) |
| 75 to 79 Years | 208 (4.3%) | 253 (5.0%) |
| 80 to 84 Years | 120 (2.5%) | 153 (3.0%) |
| 85 Years and over | 94 (1.9%) | 246 (4.9%) |
| Total | 4,822 (100.0%) | 5,056 (100.0%) |
Families and Households in Grundy County
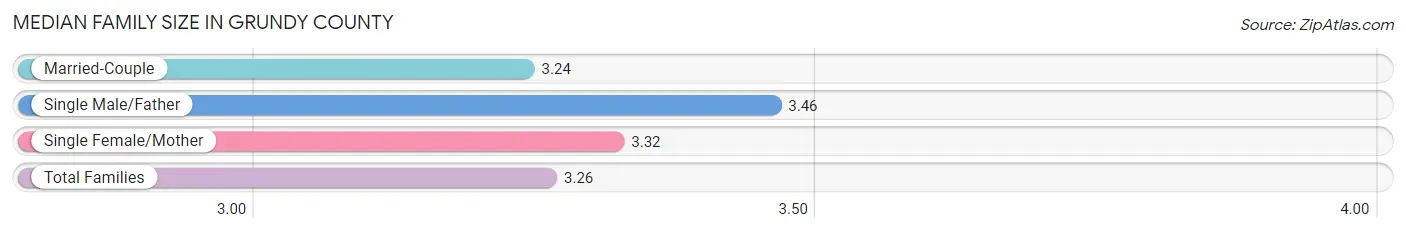
Median Family Size in Grundy County
The median family size in Grundy County is 3.26 persons per family, with single male/father families (134 | 5.8%) accounting for the largest median family size of 3.46 persons per family. On the other hand, married-couple families (1,884 | 81.3%) represent the smallest median family size with 3.24 persons per family.
| Family Type | # Families | Family Size |
| Married-Couple | 1,884 (81.3%) | 3.24 |
| Single Male/Father | 134 (5.8%) | 3.46 |
| Single Female/Mother | 300 (12.9%) | 3.32 |
| Total Families | 2,318 (100.0%) | 3.26 |
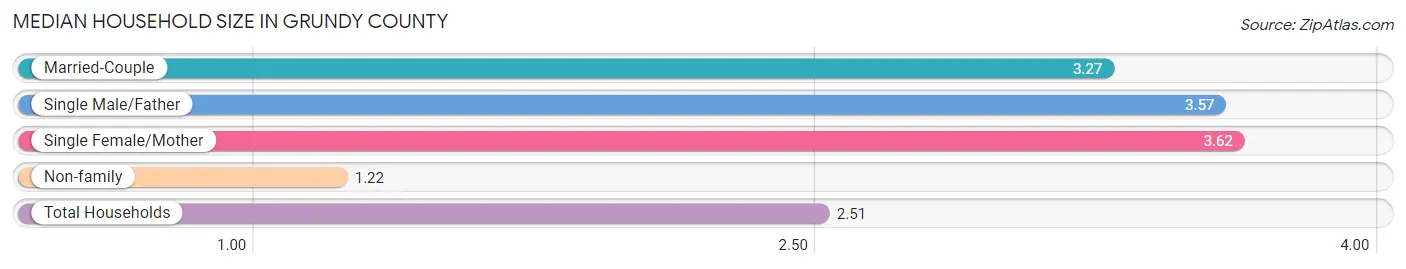
Median Household Size in Grundy County
The median household size in Grundy County is 2.51 persons per household, with single female/mother households (300 | 7.9%) accounting for the largest median household size of 3.62 persons per household. non-family households (1,488 | 39.1%) represent the smallest median household size with 1.22 persons per household.
| Household Type | # Households | Household Size |
| Married-Couple | 1,884 (49.5%) | 3.27 |
| Single Male/Father | 134 (3.5%) | 3.57 |
| Single Female/Mother | 300 (7.9%) | 3.62 |
| Non-family | 1,488 (39.1%) | 1.22 |
| Total Households | 3,806 (100.0%) | 2.51 |
Household Size by Marriage Status in Grundy County
Out of a total of 3,806 households in Grundy County, 2,318 (60.9%) are family households, while 1,488 (39.1%) are nonfamily households. The most numerous type of family households are 2-person households, comprising 1,256, and the most common type of nonfamily households are 1-person households, comprising 1,276.
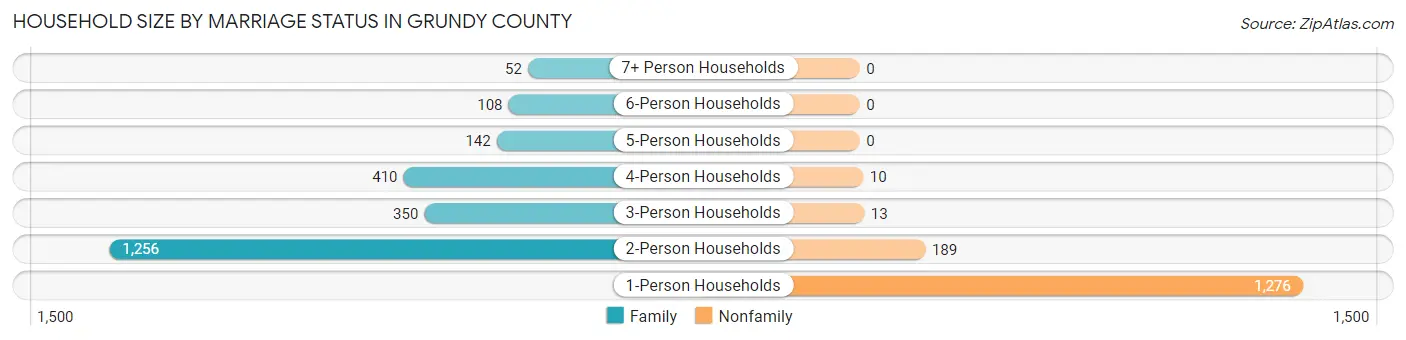
| Household Size | Family Households | Nonfamily Households |
| 1-Person Households | - | 1,276 (33.5%) |
| 2-Person Households | 1,256 (33.0%) | 189 (5.0%) |
| 3-Person Households | 350 (9.2%) | 13 (0.3%) |
| 4-Person Households | 410 (10.8%) | 10 (0.3%) |
| 5-Person Households | 142 (3.7%) | 0 (0.0%) |
| 6-Person Households | 108 (2.8%) | 0 (0.0%) |
| 7+ Person Households | 52 (1.4%) | 0 (0.0%) |
| Total | 2,318 (60.9%) | 1,488 (39.1%) |
Female Fertility in Grundy County
Fertility by Age in Grundy County
Average fertility rate in Grundy County is 45.0 births per 1,000 women. Women in the age bracket of 20 to 34 years have the highest fertility rate with 87.0 births per 1,000 women. Women in the age bracket of 20 to 34 years acount for 79.6% of all women with births.
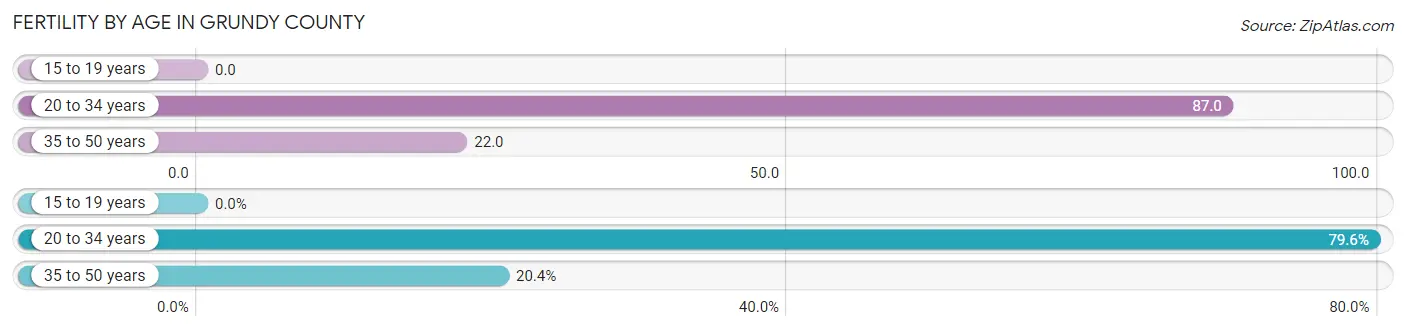
| Age Bracket | Women with Births | Births / 1,000 Women |
| 15 to 19 years | 0 (0.0%) | 0.0 |
| 20 to 34 years | 74 (79.6%) | 87.0 |
| 35 to 50 years | 19 (20.4%) | 22.0 |
| Total | 93 (100.0%) | 45.0 |
Fertility by Age by Marriage Status in Grundy County
75.3% of women with births (93) in Grundy County are married. The highest percentage of unmarried women with births falls into 20 to 34 years age bracket with 31.1% of them unmarried at the time of birth, while the lowest percentage of unmarried women with births belong to 35 to 50 years age bracket with 0.0% of them unmarried.
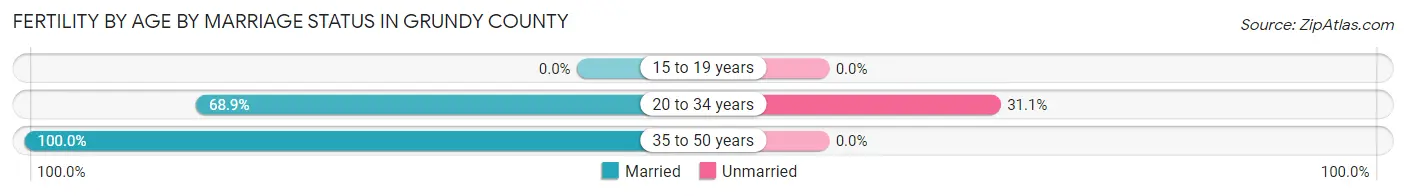
| Age Bracket | Married | Unmarried |
| 15 to 19 years | 0 (0.0%) | 0 (0.0%) |
| 20 to 34 years | 51 (68.9%) | 23 (31.1%) |
| 35 to 50 years | 19 (100.0%) | 0 (0.0%) |
| Total | 70 (75.3%) | 23 (24.7%) |
Fertility by Education in Grundy County
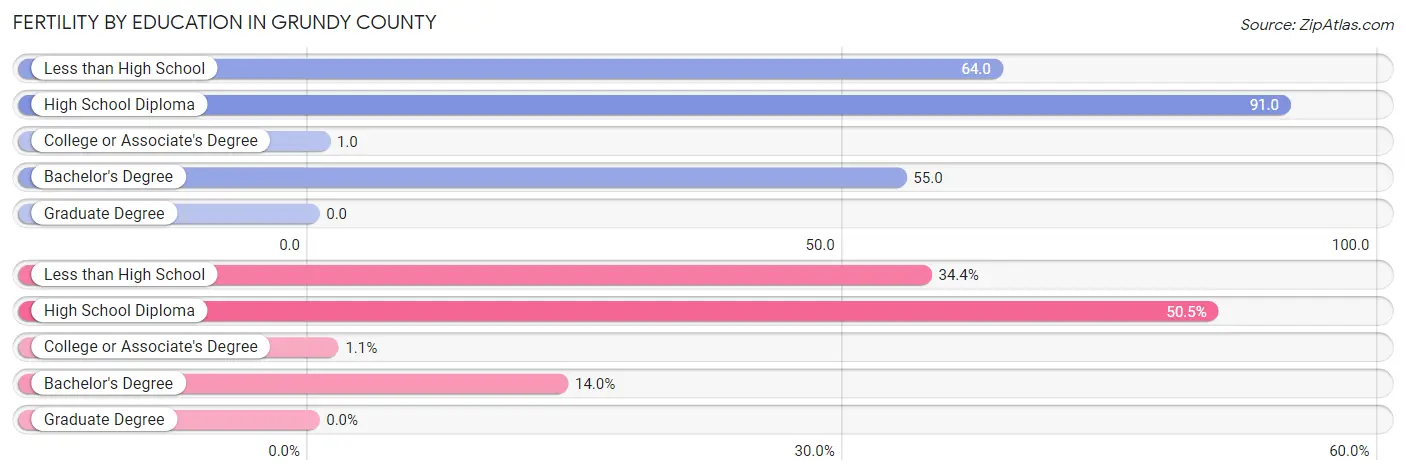
| Educational Attainment | Women with Births | Births / 1,000 Women |
| Less than High School | 32 (34.4%) | 64.0 |
| High School Diploma | 47 (50.5%) | 91.0 |
| College or Associate's Degree | 1 (1.1%) | 1.0 |
| Bachelor's Degree | 13 (14.0%) | 55.0 |
| Graduate Degree | 0 (0.0%) | 0.0 |
| Total | 93 (100.0%) | 45.0 |
Fertility by Education by Marriage Status in Grundy County
24.7% of women with births in Grundy County are unmarried. Women with the educational attainment of less than high school are most likely to be married with 100.0% of them married at childbirth, while women with the educational attainment of college or associate's degree are least likely to be married with 100.0% of them unmarried at childbirth.
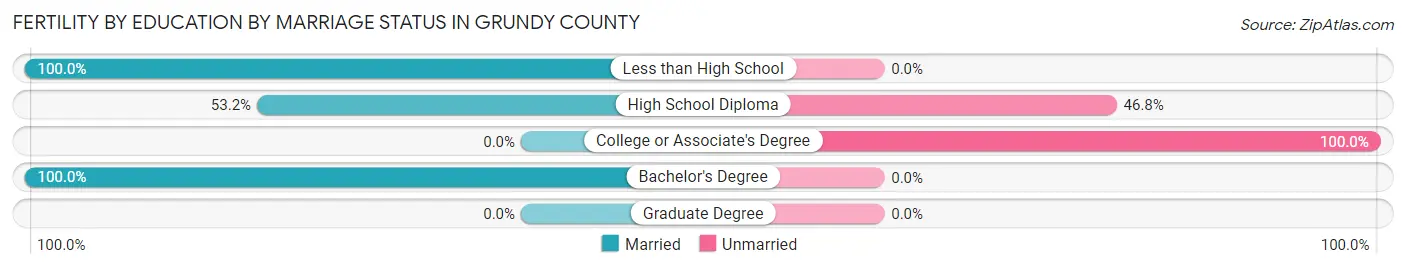
| Educational Attainment | Married | Unmarried |
| Less than High School | 32 (100.0%) | 0 (0.0%) |
| High School Diploma | 25 (53.2%) | 22 (46.8%) |
| College or Associate's Degree | 0 (0.0%) | 1 (100.0%) |
| Bachelor's Degree | 13 (100.0%) | 0 (0.0%) |
| Graduate Degree | 0 (0.0%) | 0 (0.0%) |
| Total | 70 (75.3%) | 23 (24.7%) |
Employment Characteristics in Grundy County
Employment by Class of Employer in Grundy County
Among the 3,979 employed individuals in Grundy County, private company employees (2,436 | 61.2%), not-for-profit organizations (448 | 11.3%), and self-employed (not incorporated) (359 | 9.0%) make up the most common classes of employment.
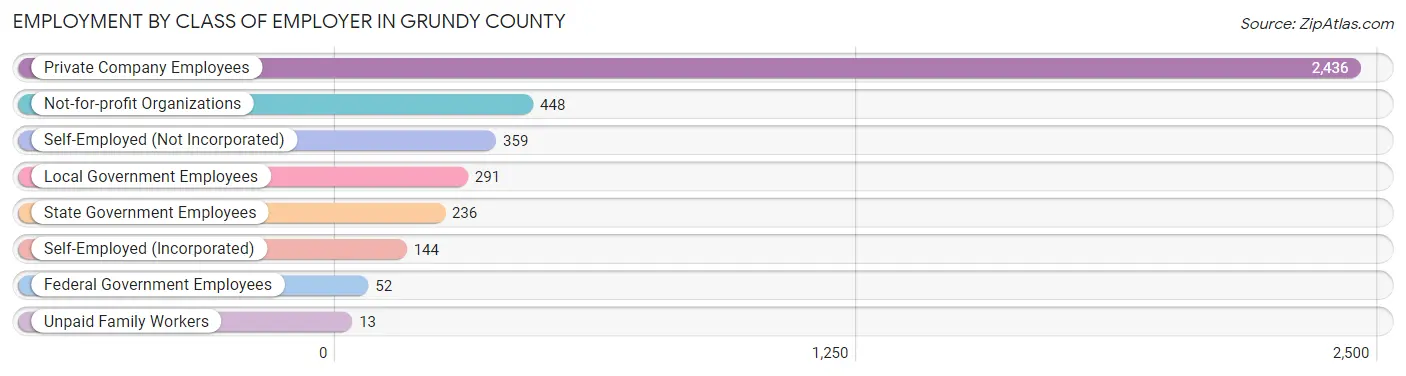
| Employer Class | # Employees | % Employees |
| Private Company Employees | 2,436 | 61.2% |
| Self-Employed (Incorporated) | 144 | 3.6% |
| Self-Employed (Not Incorporated) | 359 | 9.0% |
| Not-for-profit Organizations | 448 | 11.3% |
| Local Government Employees | 291 | 7.3% |
| State Government Employees | 236 | 5.9% |
| Federal Government Employees | 52 | 1.3% |
| Unpaid Family Workers | 13 | 0.3% |
| Total | 3,979 | 100.0% |
Employment Status by Age in Grundy County
According to the labor force statistics for Grundy County, out of the total population over 16 years of age (7,652), 54.7% or 4,186 individuals are in the labor force, with 4.1% or 172 of them unemployed. The age group with the highest labor force participation rate is 20 to 24 years, with 85.7% or 385 individuals in the labor force. Within the labor force, the 30 to 34 years age range has the highest percentage of unemployed individuals, with 15.1% or 80 of them being unemployed.
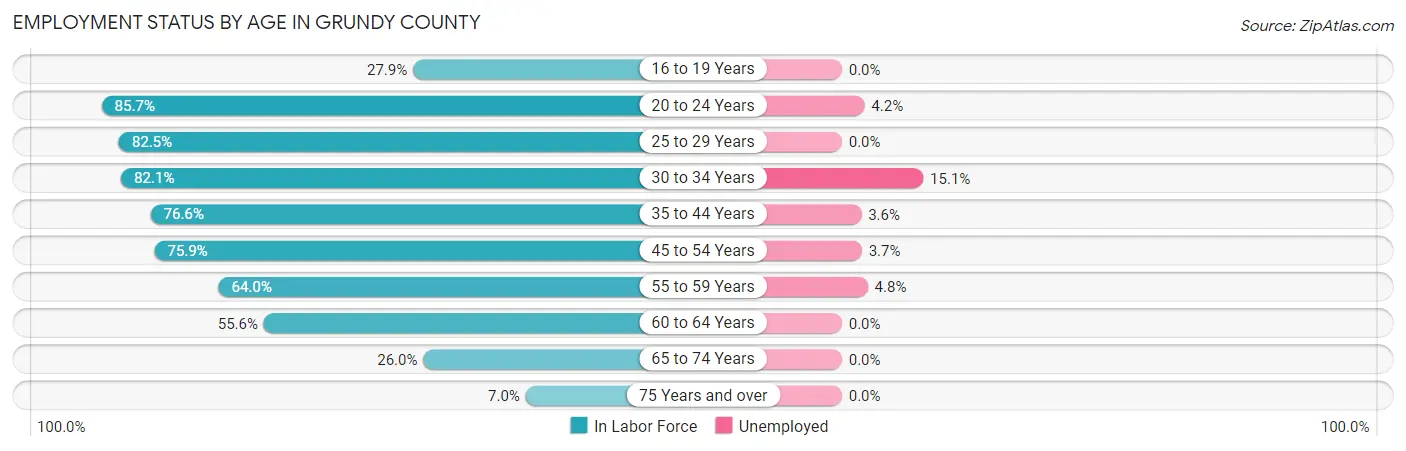
| Age Bracket | In Labor Force | Unemployed |
| 16 to 19 Years | 149 (27.9%) | 0 (0.0%) |
| 20 to 24 Years | 385 (85.7%) | 16 (4.2%) |
| 25 to 29 Years | 449 (82.5%) | 0 (0.0%) |
| 30 to 34 Years | 529 (82.1%) | 80 (15.1%) |
| 35 to 44 Years | 753 (76.6%) | 27 (3.6%) |
| 45 to 54 Years | 774 (75.9%) | 29 (3.7%) |
| 55 to 59 Years | 398 (64.0%) | 19 (4.8%) |
| 60 to 64 Years | 394 (55.6%) | 0 (0.0%) |
| 65 to 74 Years | 279 (26.0%) | 0 (0.0%) |
| 75 Years and over | 75 (7.0%) | 0 (0.0%) |
| Total | 4,186 (54.7%) | 172 (4.1%) |
Employment Status by Educational Attainment in Grundy County
According to labor force statistics for Grundy County, 72.9% of individuals (3,297) out of the total population between 25 and 64 years of age (4,522) are in the labor force, with 4.7% or 155 of them being unemployed. The group with the highest labor force participation rate are those with the educational attainment of bachelor's degree or higher, with 91.4% or 627 individuals in the labor force. Within the labor force, individuals with high school diploma education have the highest percentage of unemployment, with 7.0% or 78 of them being unemployed.
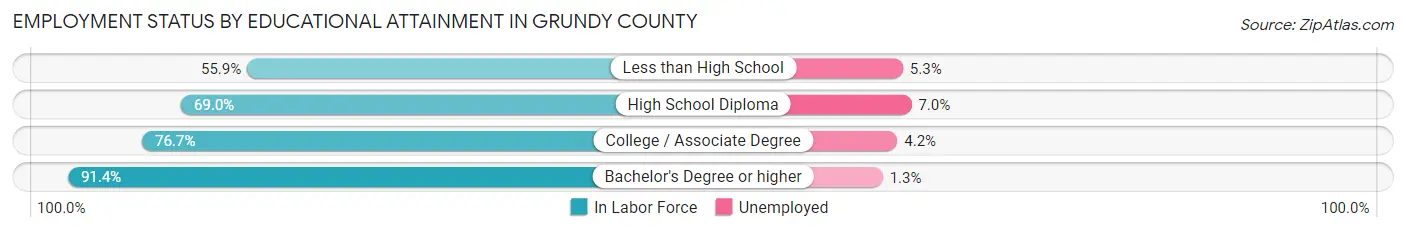
| Educational Attainment | In Labor Force | Unemployed |
| Less than High School | 397 (55.9%) | 38 (5.3%) |
| High School Diploma | 1,116 (69.0%) | 113 (7.0%) |
| College / Associate Degree | 1,157 (76.7%) | 63 (4.2%) |
| Bachelor's Degree or higher | 627 (91.4%) | 9 (1.3%) |
| Total | 3,297 (72.9%) | 213 (4.7%) |
Employment Occupations by Sex in Grundy County
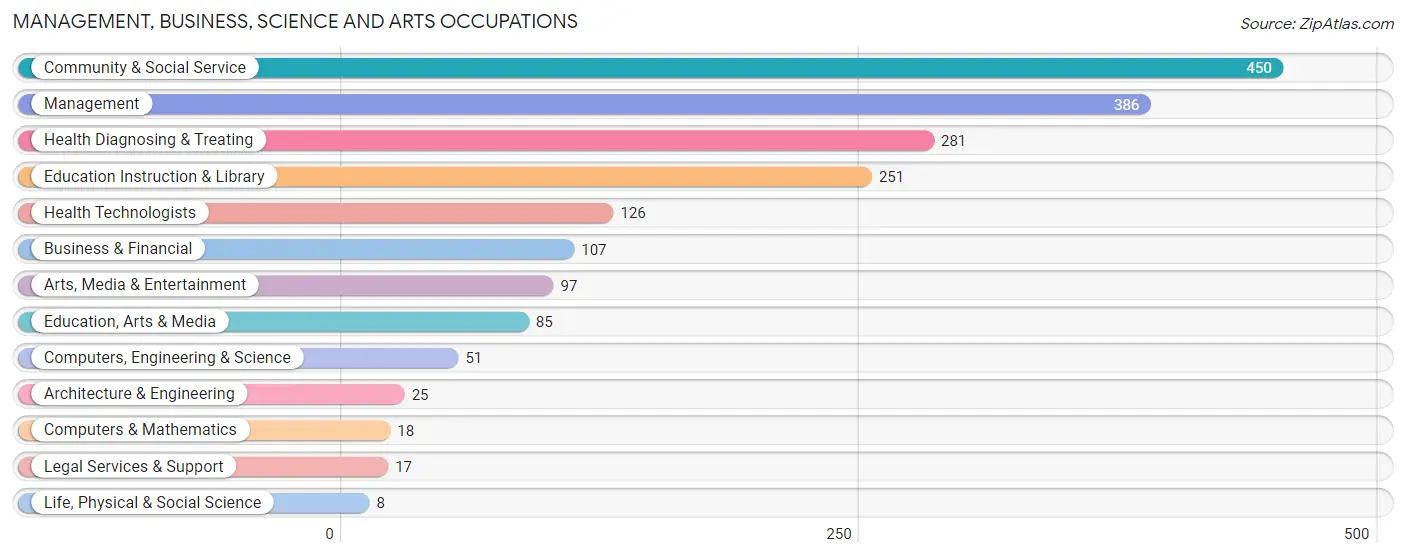
Management, Business, Science and Arts Occupations
The most common Management, Business, Science and Arts occupations in Grundy County are Community & Social Service (450 | 11.2%), Management (386 | 9.6%), Health Diagnosing & Treating (281 | 7.0%), Education Instruction & Library (251 | 6.2%), and Health Technologists (126 | 3.1%).
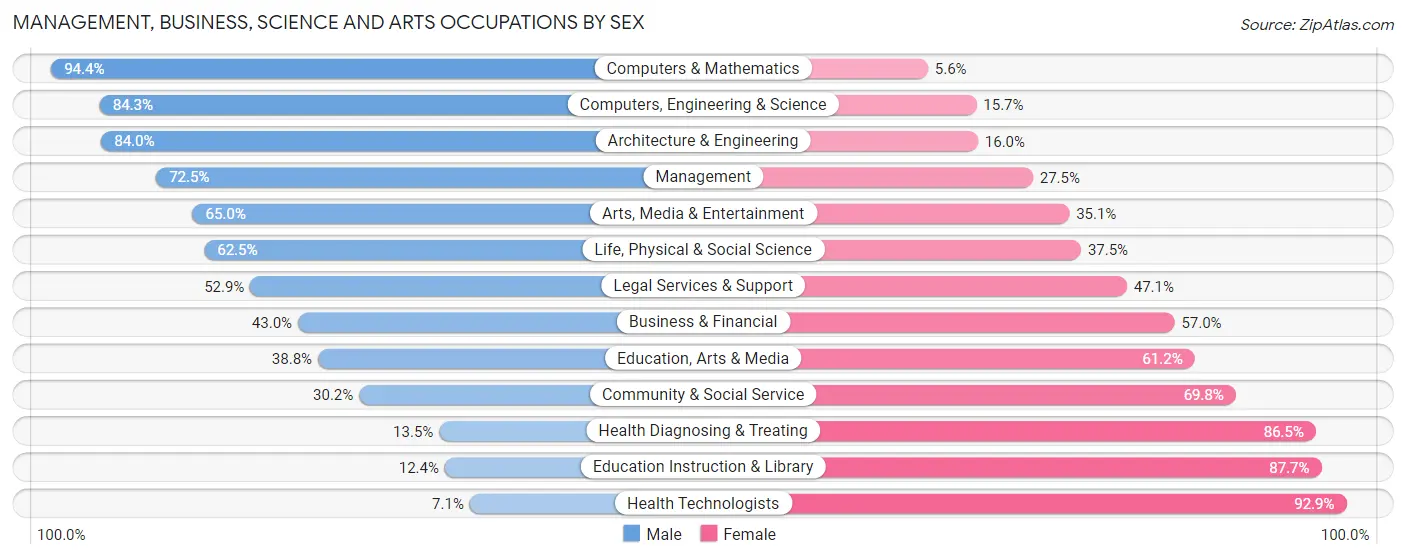
Management, Business, Science and Arts Occupations by Sex
Within the Management, Business, Science and Arts occupations in Grundy County, the most male-oriented occupations are Computers & Mathematics (94.4%), Computers, Engineering & Science (84.3%), and Architecture & Engineering (84.0%), while the most female-oriented occupations are Health Technologists (92.9%), Education Instruction & Library (87.6%), and Health Diagnosing & Treating (86.5%).
| Occupation | Male | Female |
| Management | 280 (72.5%) | 106 (27.5%) |
| Business & Financial | 46 (43.0%) | 61 (57.0%) |
| Computers, Engineering & Science | 43 (84.3%) | 8 (15.7%) |
| Computers & Mathematics | 17 (94.4%) | 1 (5.6%) |
| Architecture & Engineering | 21 (84.0%) | 4 (16.0%) |
| Life, Physical & Social Science | 5 (62.5%) | 3 (37.5%) |
| Community & Social Service | 136 (30.2%) | 314 (69.8%) |
| Education, Arts & Media | 33 (38.8%) | 52 (61.2%) |
| Legal Services & Support | 9 (52.9%) | 8 (47.1%) |
| Education Instruction & Library | 31 (12.3%) | 220 (87.6%) |
| Arts, Media & Entertainment | 63 (64.9%) | 34 (35.0%) |
| Health Diagnosing & Treating | 38 (13.5%) | 243 (86.5%) |
| Health Technologists | 9 (7.1%) | 117 (92.9%) |
| Total (Category) | 543 (42.6%) | 732 (57.4%) |
| Total (Overall) | 2,077 (51.7%) | 1,937 (48.3%) |
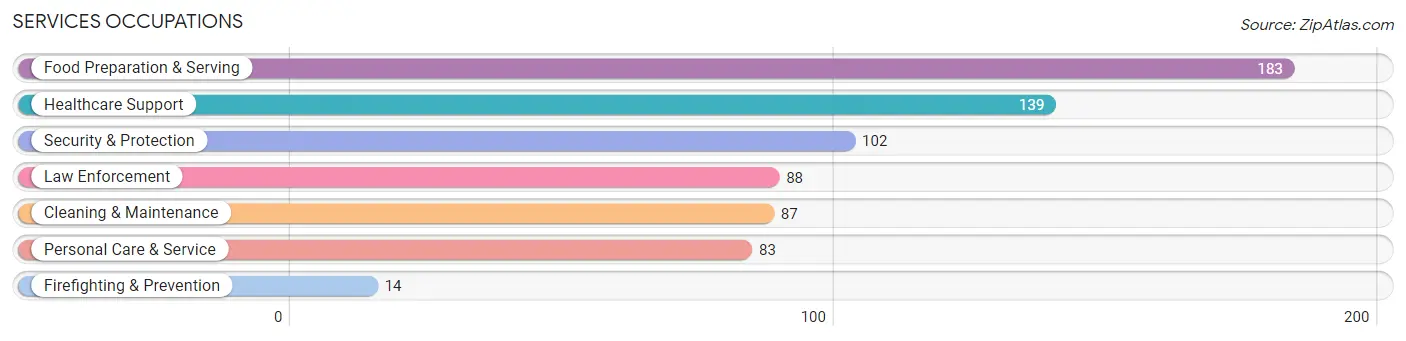
Services Occupations
The most common Services occupations in Grundy County are Food Preparation & Serving (183 | 4.6%), Healthcare Support (139 | 3.5%), Security & Protection (102 | 2.5%), Law Enforcement (88 | 2.2%), and Cleaning & Maintenance (87 | 2.2%).
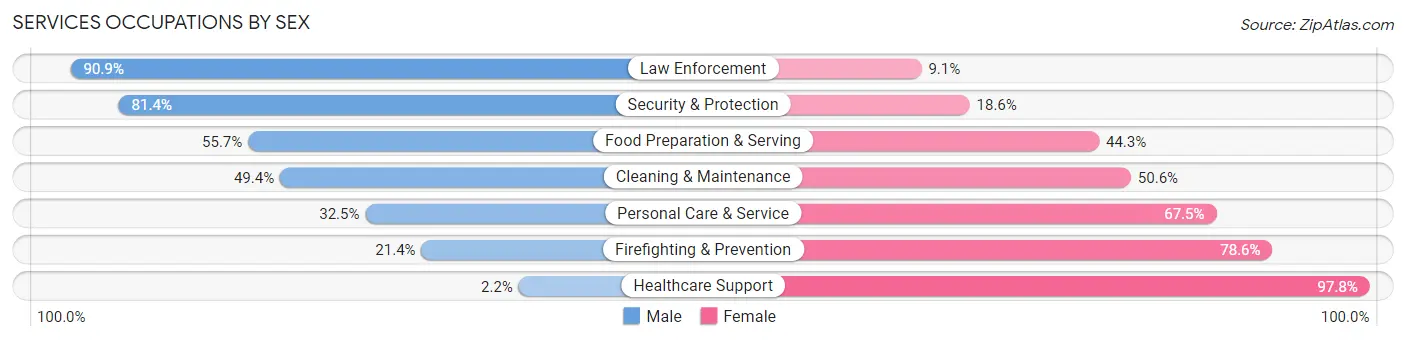
Services Occupations by Sex
Within the Services occupations in Grundy County, the most male-oriented occupations are Law Enforcement (90.9%), Security & Protection (81.4%), and Food Preparation & Serving (55.7%), while the most female-oriented occupations are Healthcare Support (97.8%), Firefighting & Prevention (78.6%), and Personal Care & Service (67.5%).
| Occupation | Male | Female |
| Healthcare Support | 3 (2.2%) | 136 (97.8%) |
| Security & Protection | 83 (81.4%) | 19 (18.6%) |
| Firefighting & Prevention | 3 (21.4%) | 11 (78.6%) |
| Law Enforcement | 80 (90.9%) | 8 (9.1%) |
| Food Preparation & Serving | 102 (55.7%) | 81 (44.3%) |
| Cleaning & Maintenance | 43 (49.4%) | 44 (50.6%) |
| Personal Care & Service | 27 (32.5%) | 56 (67.5%) |
| Total (Category) | 258 (43.4%) | 336 (56.6%) |
| Total (Overall) | 2,077 (51.7%) | 1,937 (48.3%) |
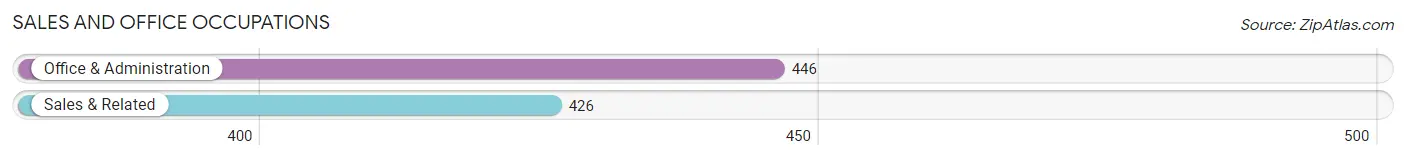
Sales and Office Occupations
The most common Sales and Office occupations in Grundy County are Office & Administration (446 | 11.1%), and Sales & Related (426 | 10.6%).
Sales and Office Occupations by Sex
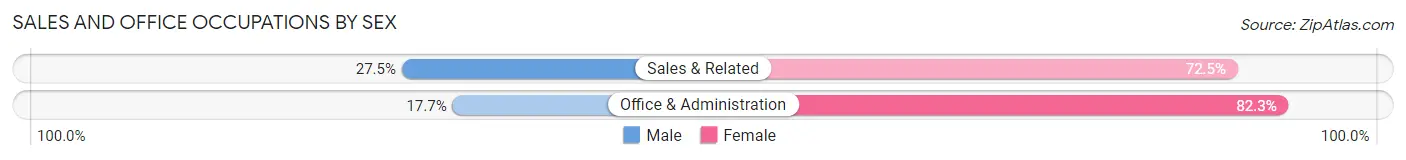
| Occupation | Male | Female |
| Sales & Related | 117 (27.5%) | 309 (72.5%) |
| Office & Administration | 79 (17.7%) | 367 (82.3%) |
| Total (Category) | 196 (22.5%) | 676 (77.5%) |
| Total (Overall) | 2,077 (51.7%) | 1,937 (48.3%) |
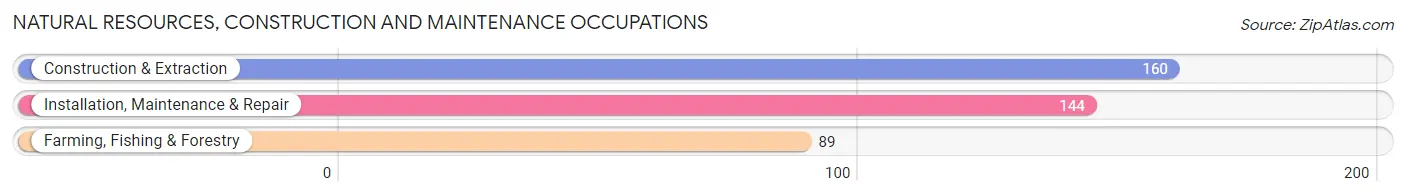
Natural Resources, Construction and Maintenance Occupations
The most common Natural Resources, Construction and Maintenance occupations in Grundy County are Construction & Extraction (160 | 4.0%), Installation, Maintenance & Repair (144 | 3.6%), and Farming, Fishing & Forestry (89 | 2.2%).
Natural Resources, Construction and Maintenance Occupations by Sex
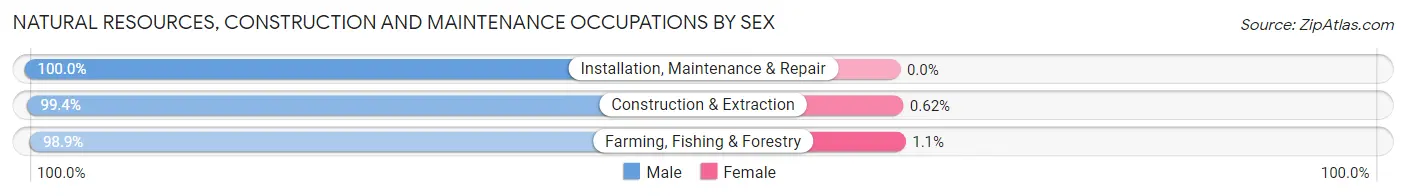
| Occupation | Male | Female |
| Farming, Fishing & Forestry | 88 (98.9%) | 1 (1.1%) |
| Construction & Extraction | 159 (99.4%) | 1 (0.6%) |
| Installation, Maintenance & Repair | 144 (100.0%) | 0 (0.0%) |
| Total (Category) | 391 (99.5%) | 2 (0.5%) |
| Total (Overall) | 2,077 (51.7%) | 1,937 (48.3%) |
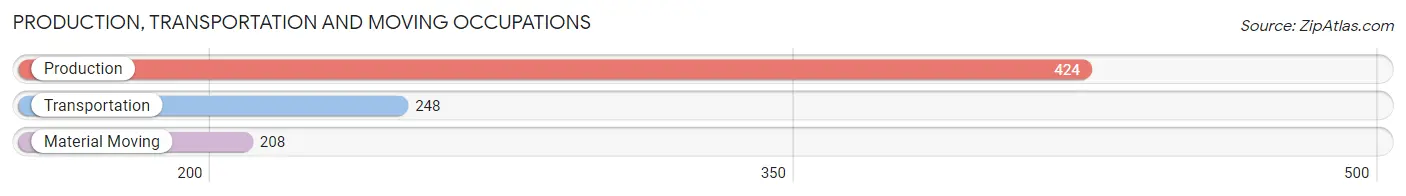
Production, Transportation and Moving Occupations
The most common Production, Transportation and Moving occupations in Grundy County are Production (424 | 10.6%), Transportation (248 | 6.2%), and Material Moving (208 | 5.2%).
Production, Transportation and Moving Occupations by Sex
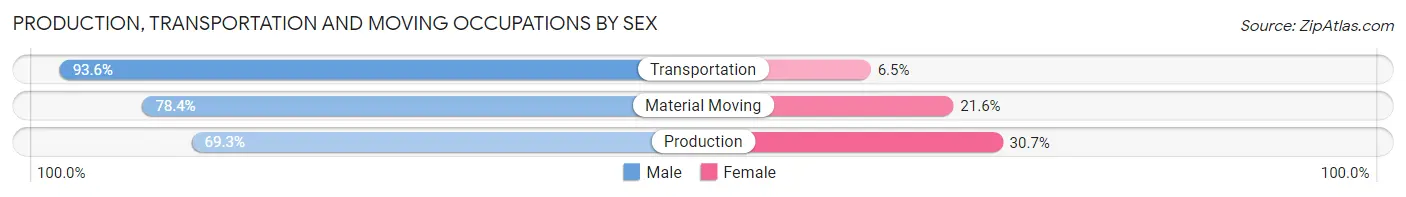
| Occupation | Male | Female |
| Production | 294 (69.3%) | 130 (30.7%) |
| Transportation | 232 (93.5%) | 16 (6.5%) |
| Material Moving | 163 (78.4%) | 45 (21.6%) |
| Total (Category) | 689 (78.3%) | 191 (21.7%) |
| Total (Overall) | 2,077 (51.7%) | 1,937 (48.3%) |
Employment Industries by Sex in Grundy County
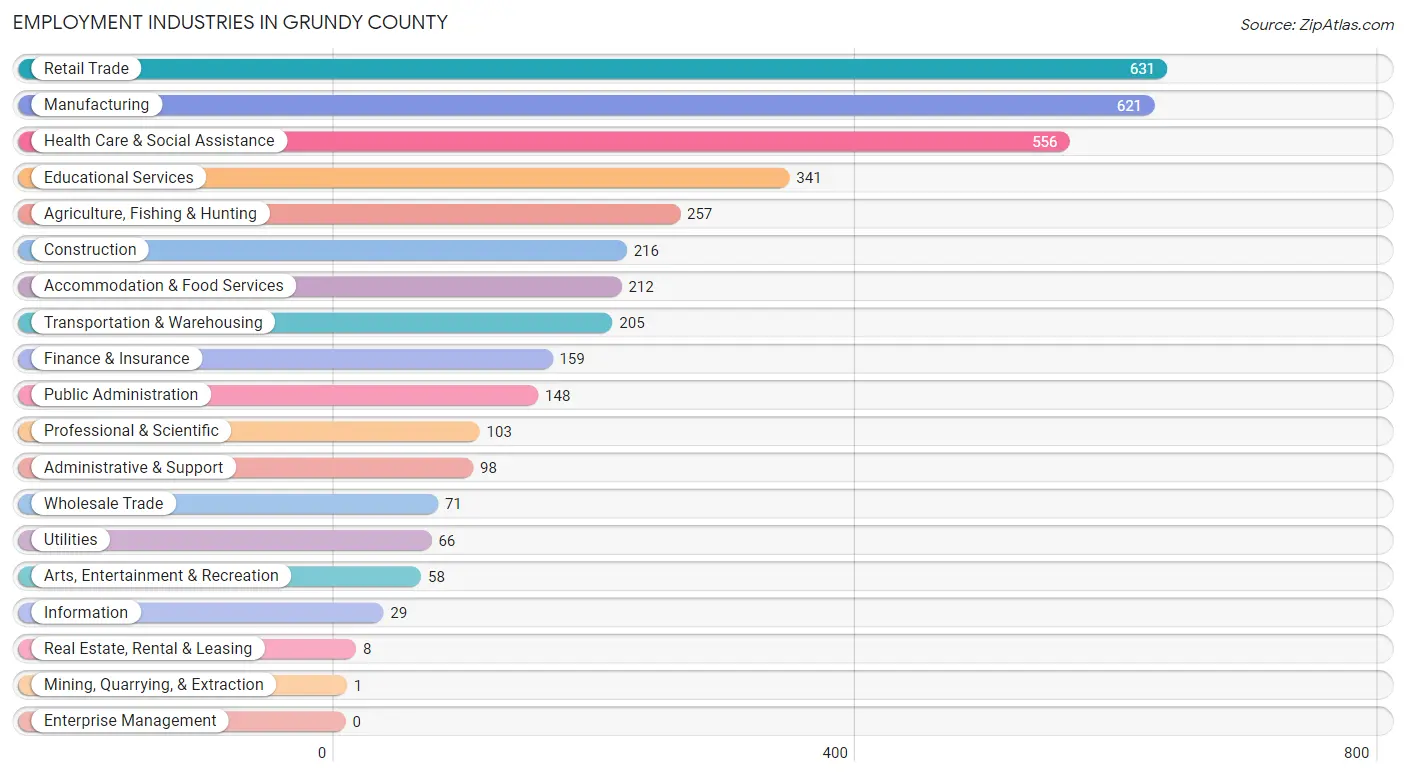
Employment Industries in Grundy County
The major employment industries in Grundy County include Retail Trade (631 | 15.7%), Manufacturing (621 | 15.5%), Health Care & Social Assistance (556 | 13.9%), Educational Services (341 | 8.5%), and Agriculture, Fishing & Hunting (257 | 6.4%).
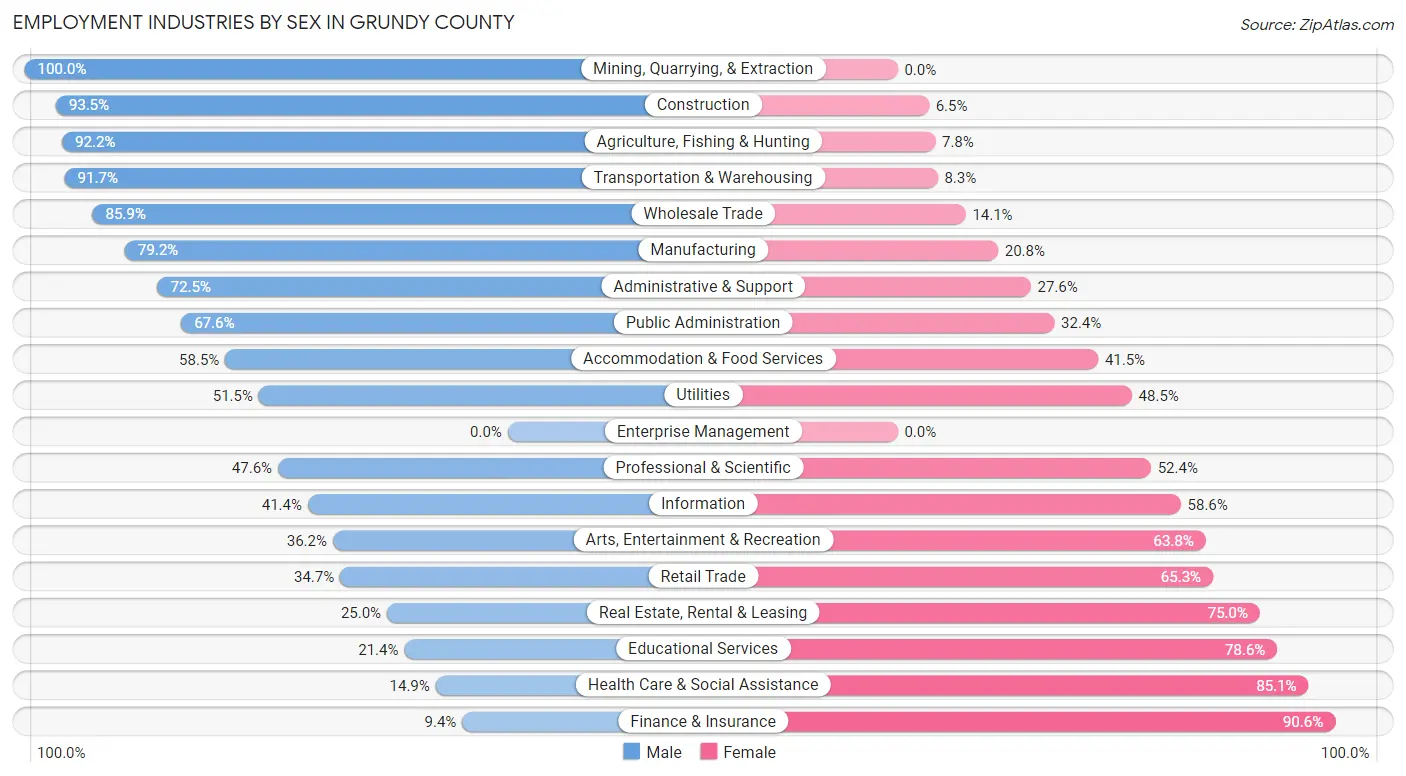
Employment Industries by Sex in Grundy County
The Grundy County industries that see more men than women are Mining, Quarrying, & Extraction (100.0%), Construction (93.5%), and Agriculture, Fishing & Hunting (92.2%), whereas the industries that tend to have a higher number of women are Finance & Insurance (90.6%), Health Care & Social Assistance (85.1%), and Educational Services (78.6%).
| Industry | Male | Female |
| Agriculture, Fishing & Hunting | 237 (92.2%) | 20 (7.8%) |
| Mining, Quarrying, & Extraction | 1 (100.0%) | 0 (0.0%) |
| Construction | 202 (93.5%) | 14 (6.5%) |
| Manufacturing | 492 (79.2%) | 129 (20.8%) |
| Wholesale Trade | 61 (85.9%) | 10 (14.1%) |
| Retail Trade | 219 (34.7%) | 412 (65.3%) |
| Transportation & Warehousing | 188 (91.7%) | 17 (8.3%) |
| Utilities | 34 (51.5%) | 32 (48.5%) |
| Information | 12 (41.4%) | 17 (58.6%) |
| Finance & Insurance | 15 (9.4%) | 144 (90.6%) |
| Real Estate, Rental & Leasing | 2 (25.0%) | 6 (75.0%) |
| Professional & Scientific | 49 (47.6%) | 54 (52.4%) |
| Enterprise Management | 0 (0.0%) | 0 (0.0%) |
| Administrative & Support | 71 (72.5%) | 27 (27.6%) |
| Educational Services | 73 (21.4%) | 268 (78.6%) |
| Health Care & Social Assistance | 83 (14.9%) | 473 (85.1%) |
| Arts, Entertainment & Recreation | 21 (36.2%) | 37 (63.8%) |
| Accommodation & Food Services | 124 (58.5%) | 88 (41.5%) |
| Public Administration | 100 (67.6%) | 48 (32.4%) |
| Total | 2,077 (51.7%) | 1,937 (48.3%) |
Education in Grundy County
School Enrollment in Grundy County
The most common levels of schooling among the 2,407 students in Grundy County are high school (587 | 24.4%), elementary school (560 | 23.3%), and middle school (436 | 18.1%).
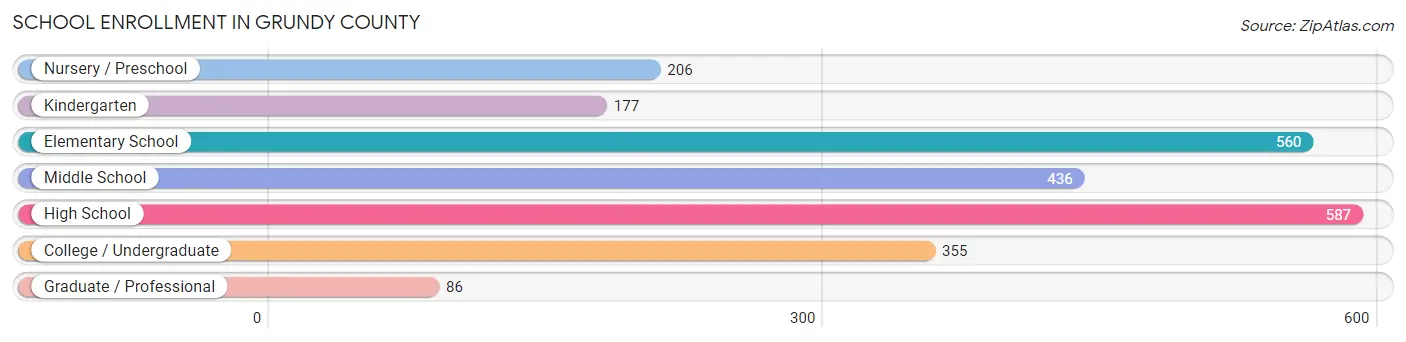
| School Level | # Students | % Students |
| Nursery / Preschool | 206 | 8.6% |
| Kindergarten | 177 | 7.3% |
| Elementary School | 560 | 23.3% |
| Middle School | 436 | 18.1% |
| High School | 587 | 24.4% |
| College / Undergraduate | 355 | 14.7% |
| Graduate / Professional | 86 | 3.6% |
| Total | 2,407 | 100.0% |
School Enrollment by Age by Funding Source in Grundy County
Out of a total of 2,407 students who are enrolled in schools in Grundy County, 354 (14.7%) attend a private institution, while the remaining 2,053 (85.3%) are enrolled in public schools. The age group of 3 to 4 year olds has the highest likelihood of being enrolled in private schools, with 54 (32.3% in the age bracket) enrolled. Conversely, the age group of 18 to 19 year olds has the lowest likelihood of being enrolled in a private school, with 262 (98.9% in the age bracket) attending a public institution.
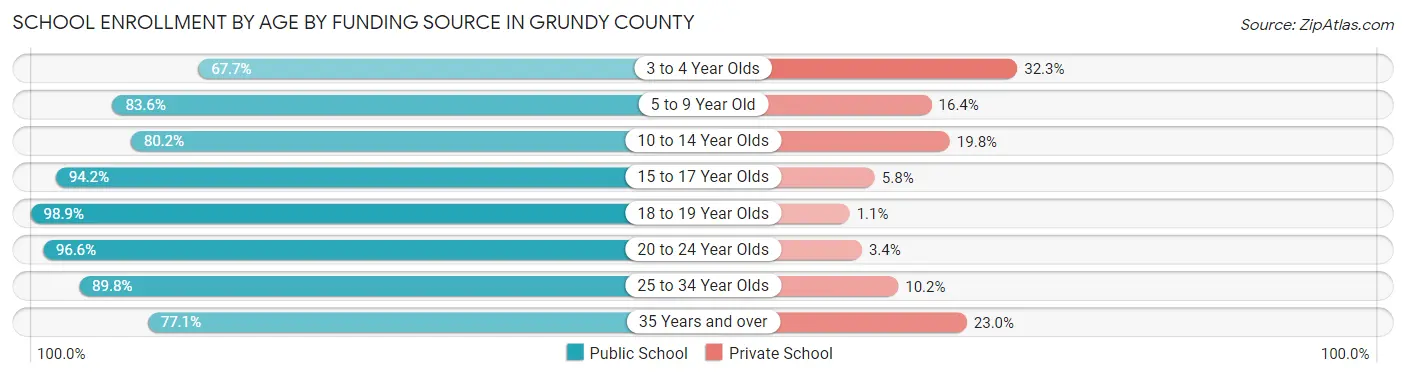
| Age Bracket | Public School | Private School |
| 3 to 4 Year Olds | 113 (67.7%) | 54 (32.3%) |
| 5 to 9 Year Old | 633 (83.6%) | 124 (16.4%) |
| 10 to 14 Year Olds | 458 (80.2%) | 113 (19.8%) |
| 15 to 17 Year Olds | 356 (94.2%) | 22 (5.8%) |
| 18 to 19 Year Olds | 262 (98.9%) | 3 (1.1%) |
| 20 to 24 Year Olds | 85 (96.6%) | 3 (3.4%) |
| 25 to 34 Year Olds | 53 (89.8%) | 6 (10.2%) |
| 35 Years and over | 94 (77.0%) | 28 (23.0%) |
| Total | 2,053 (85.3%) | 354 (14.7%) |
Educational Attainment by Field of Study in Grundy County
Education (269 | 26.5%), business (131 | 12.9%), arts & humanities (118 | 11.6%), bio, nature & agricultural (115 | 11.3%), and science & technology (110 | 10.8%) are the most common fields of study among 1,015 individuals in Grundy County who have obtained a bachelor's degree or higher.
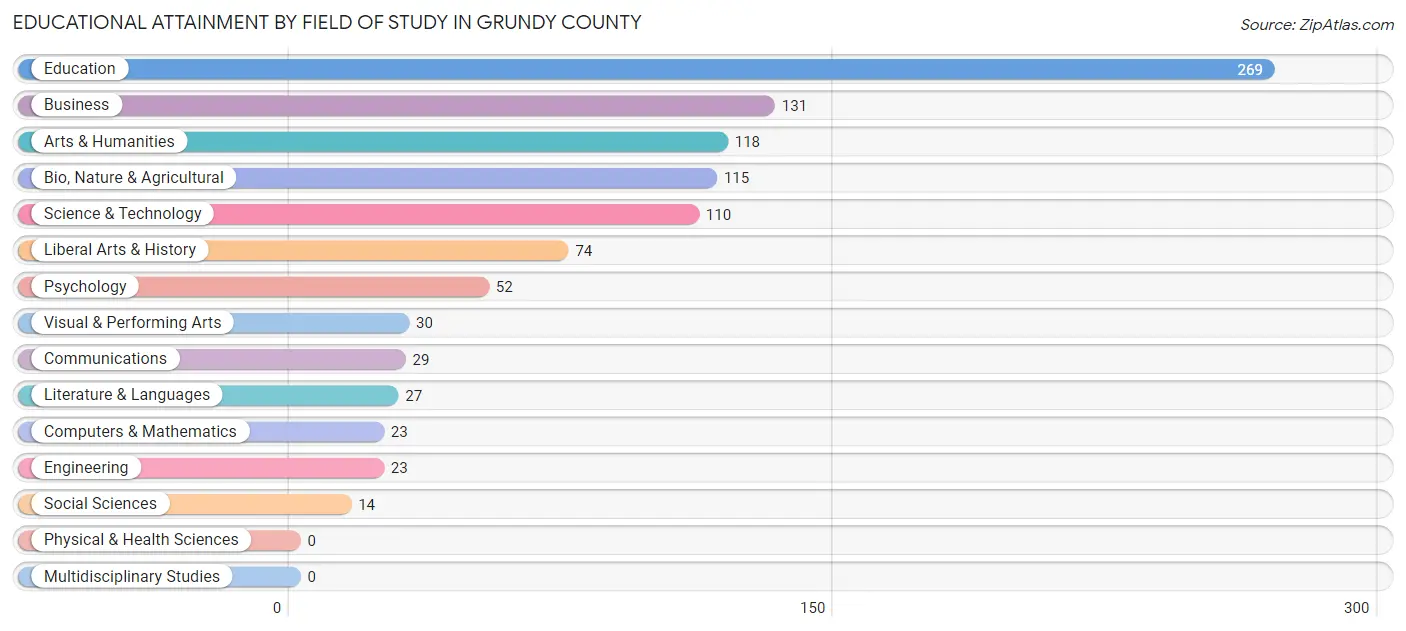
| Field of Study | # Graduates | % Graduates |
| Computers & Mathematics | 23 | 2.3% |
| Bio, Nature & Agricultural | 115 | 11.3% |
| Physical & Health Sciences | 0 | 0.0% |
| Psychology | 52 | 5.1% |
| Social Sciences | 14 | 1.4% |
| Engineering | 23 | 2.3% |
| Multidisciplinary Studies | 0 | 0.0% |
| Science & Technology | 110 | 10.8% |
| Business | 131 | 12.9% |
| Education | 269 | 26.5% |
| Literature & Languages | 27 | 2.7% |
| Liberal Arts & History | 74 | 7.3% |
| Visual & Performing Arts | 30 | 3.0% |
| Communications | 29 | 2.9% |
| Arts & Humanities | 118 | 11.6% |
| Total | 1,015 | 100.0% |
Transportation & Commute in Grundy County
Vehicle Availability by Sex in Grundy County
The most prevalent vehicle ownership categories in Grundy County are males with 2 vehicles (794, accounting for 39.0%) and females with 2 vehicles (652, making up 41.4%).
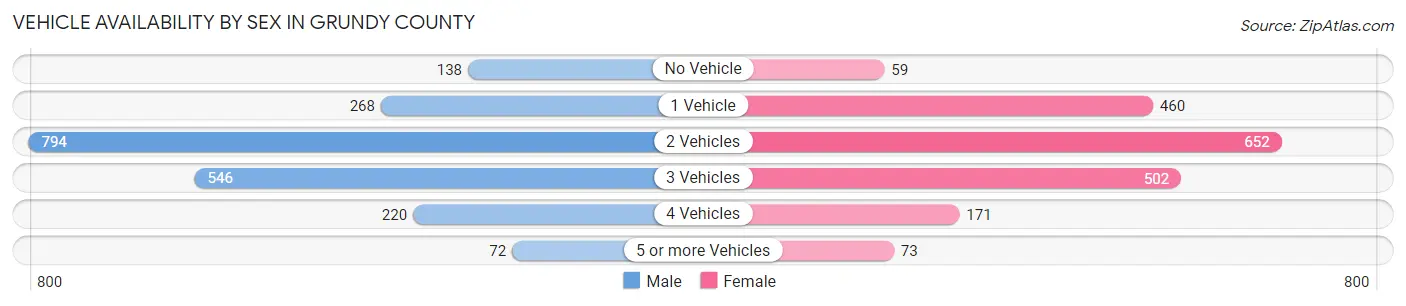
| Vehicles Available | Male | Female |
| No Vehicle | 138 (6.8%) | 59 (3.1%) |
| 1 Vehicle | 268 (13.2%) | 460 (24.0%) |
| 2 Vehicles | 794 (39.0%) | 652 (34.0%) |
| 3 Vehicles | 546 (26.8%) | 502 (26.2%) |
| 4 Vehicles | 220 (10.8%) | 171 (8.9%) |
| 5 or more Vehicles | 72 (3.5%) | 73 (3.8%) |
| Total | 2,038 (100.0%) | 1,917 (100.0%) |
Commute Time in Grundy County
The most frequently occuring commute durations in Grundy County are 5 to 9 minutes (907 commuters, 24.8%), 10 to 14 minutes (639 commuters, 17.5%), and 30 to 34 minutes (498 commuters, 13.6%).
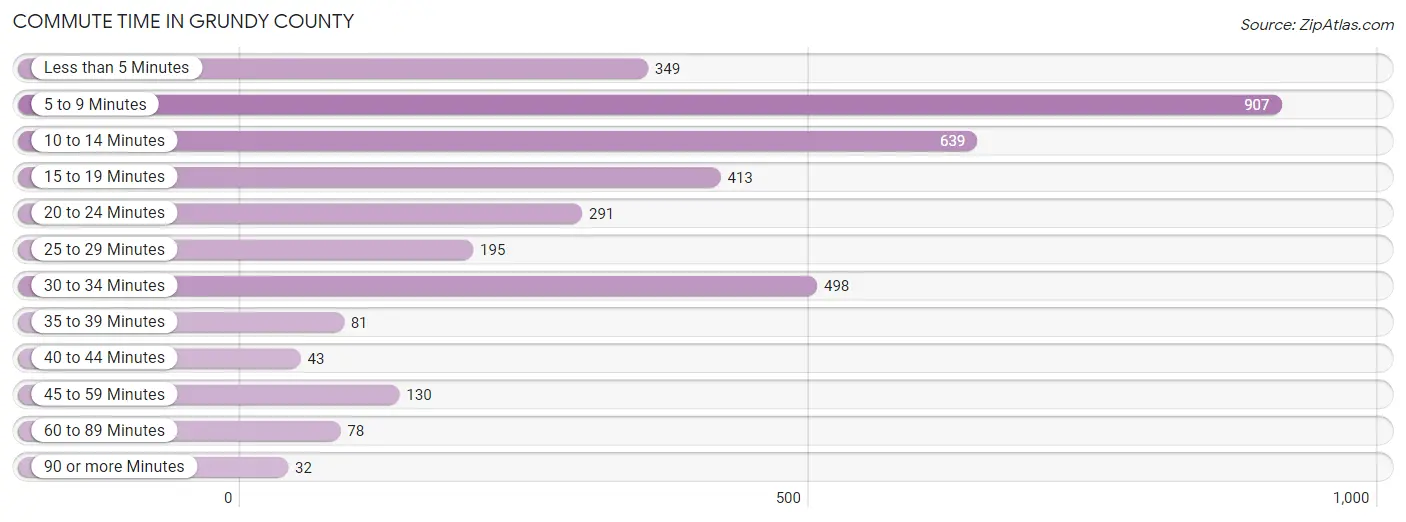
| Commute Time | # Commuters | % Commuters |
| Less than 5 Minutes | 349 | 9.6% |
| 5 to 9 Minutes | 907 | 24.8% |
| 10 to 14 Minutes | 639 | 17.5% |
| 15 to 19 Minutes | 413 | 11.3% |
| 20 to 24 Minutes | 291 | 8.0% |
| 25 to 29 Minutes | 195 | 5.3% |
| 30 to 34 Minutes | 498 | 13.6% |
| 35 to 39 Minutes | 81 | 2.2% |
| 40 to 44 Minutes | 43 | 1.2% |
| 45 to 59 Minutes | 130 | 3.6% |
| 60 to 89 Minutes | 78 | 2.1% |
| 90 or more Minutes | 32 | 0.9% |
Commute Time by Sex in Grundy County
The most common commute times in Grundy County are 5 to 9 minutes (441 commuters, 23.0%) for males and 5 to 9 minutes (466 commuters, 26.8%) for females.
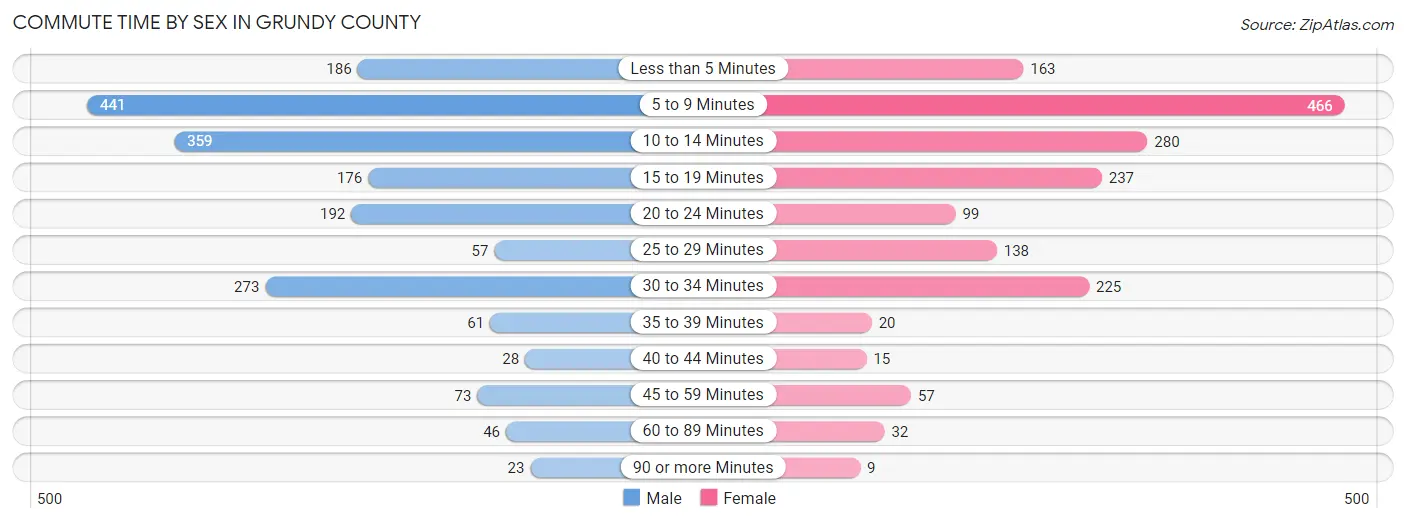
| Commute Time | Male | Female |
| Less than 5 Minutes | 186 (9.7%) | 163 (9.4%) |
| 5 to 9 Minutes | 441 (23.0%) | 466 (26.8%) |
| 10 to 14 Minutes | 359 (18.8%) | 280 (16.1%) |
| 15 to 19 Minutes | 176 (9.2%) | 237 (13.6%) |
| 20 to 24 Minutes | 192 (10.0%) | 99 (5.7%) |
| 25 to 29 Minutes | 57 (3.0%) | 138 (7.9%) |
| 30 to 34 Minutes | 273 (14.3%) | 225 (12.9%) |
| 35 to 39 Minutes | 61 (3.2%) | 20 (1.1%) |
| 40 to 44 Minutes | 28 (1.5%) | 15 (0.9%) |
| 45 to 59 Minutes | 73 (3.8%) | 57 (3.3%) |
| 60 to 89 Minutes | 46 (2.4%) | 32 (1.8%) |
| 90 or more Minutes | 23 (1.2%) | 9 (0.5%) |
Time of Departure to Work by Sex in Grundy County
The most frequent times of departure to work in Grundy County are 7:00 AM to 7:29 AM (362, 18.9%) for males and 7:30 AM to 7:59 AM (380, 21.8%) for females.
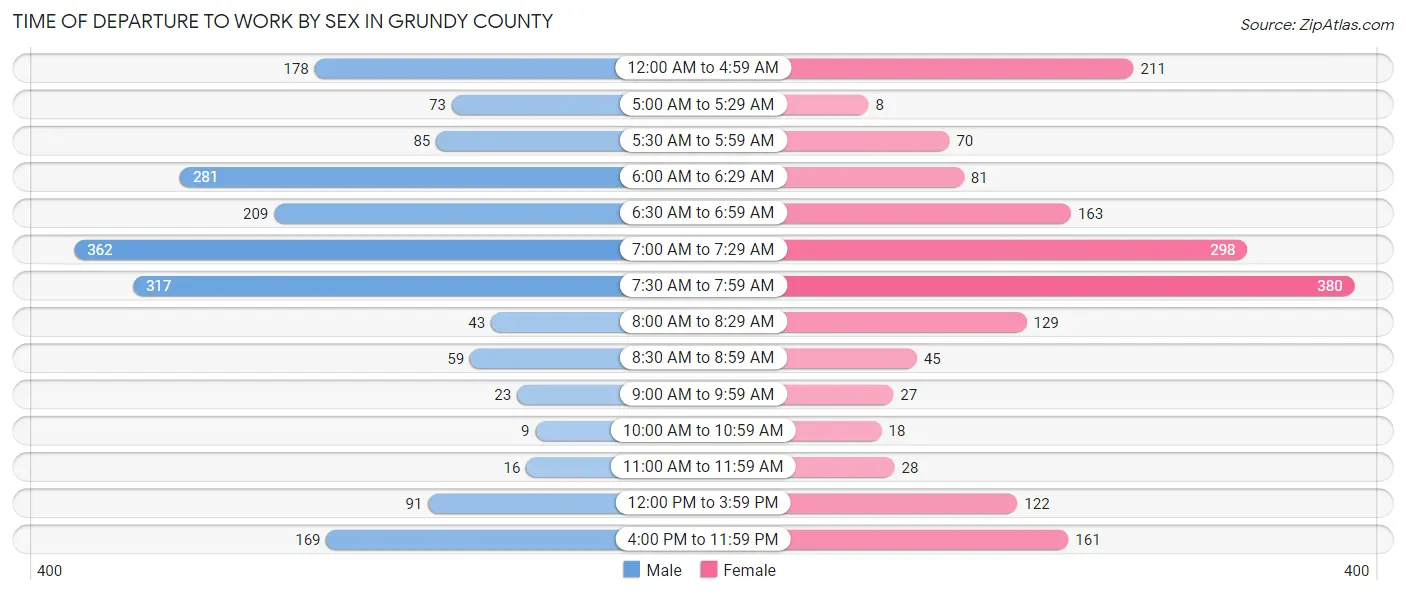
| Time of Departure | Male | Female |
| 12:00 AM to 4:59 AM | 178 (9.3%) | 211 (12.1%) |
| 5:00 AM to 5:29 AM | 73 (3.8%) | 8 (0.5%) |
| 5:30 AM to 5:59 AM | 85 (4.4%) | 70 (4.0%) |
| 6:00 AM to 6:29 AM | 281 (14.7%) | 81 (4.6%) |
| 6:30 AM to 6:59 AM | 209 (10.9%) | 163 (9.4%) |
| 7:00 AM to 7:29 AM | 362 (18.9%) | 298 (17.1%) |
| 7:30 AM to 7:59 AM | 317 (16.6%) | 380 (21.8%) |
| 8:00 AM to 8:29 AM | 43 (2.2%) | 129 (7.4%) |
| 8:30 AM to 8:59 AM | 59 (3.1%) | 45 (2.6%) |
| 9:00 AM to 9:59 AM | 23 (1.2%) | 27 (1.5%) |
| 10:00 AM to 10:59 AM | 9 (0.5%) | 18 (1.0%) |
| 11:00 AM to 11:59 AM | 16 (0.8%) | 28 (1.6%) |
| 12:00 PM to 3:59 PM | 91 (4.8%) | 122 (7.0%) |
| 4:00 PM to 11:59 PM | 169 (8.8%) | 161 (9.2%) |
| Total | 1,915 (100.0%) | 1,741 (100.0%) |
Housing Occupancy in Grundy County
Occupancy by Ownership in Grundy County
Of the total 3,806 dwellings in Grundy County, owner-occupied units account for 2,598 (68.3%), while renter-occupied units make up 1,208 (31.7%).
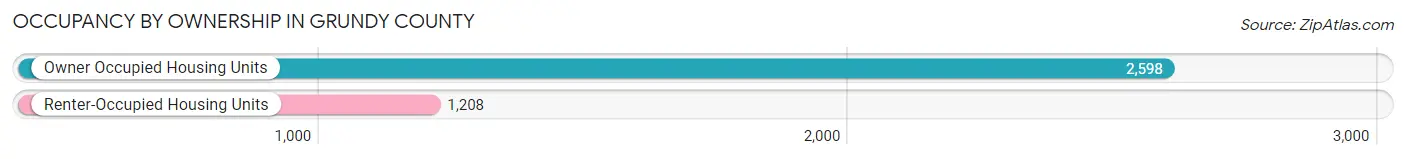
| Occupancy | # Housing Units | % Housing Units |
| Owner Occupied Housing Units | 2,598 | 68.3% |
| Renter-Occupied Housing Units | 1,208 | 31.7% |
| Total Occupied Housing Units | 3,806 | 100.0% |
Occupancy by Household Size in Grundy County
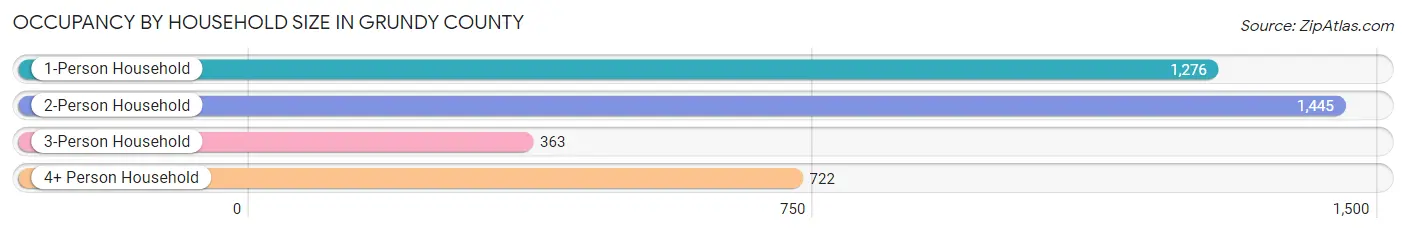
| Household Size | # Housing Units | % Housing Units |
| 1-Person Household | 1,276 | 33.5% |
| 2-Person Household | 1,445 | 38.0% |
| 3-Person Household | 363 | 9.5% |
| 4+ Person Household | 722 | 19.0% |
| Total Housing Units | 3,806 | 100.0% |
Occupancy by Ownership by Household Size in Grundy County
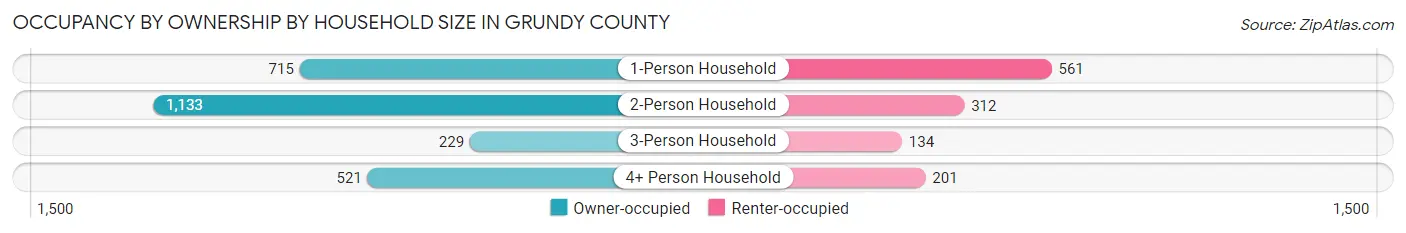
| Household Size | Owner-occupied | Renter-occupied |
| 1-Person Household | 715 (56.0%) | 561 (44.0%) |
| 2-Person Household | 1,133 (78.4%) | 312 (21.6%) |
| 3-Person Household | 229 (63.1%) | 134 (36.9%) |
| 4+ Person Household | 521 (72.2%) | 201 (27.8%) |
| Total Housing Units | 2,598 (68.3%) | 1,208 (31.7%) |
Occupancy by Educational Attainment in Grundy County
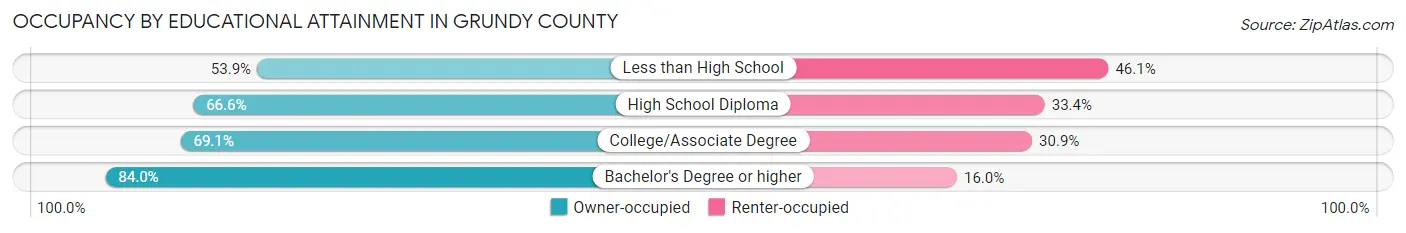
| Household Size | Owner-occupied | Renter-occupied |
| Less than High School | 342 (53.9%) | 292 (46.1%) |
| High School Diploma | 864 (66.6%) | 434 (33.4%) |
| College/Associate Degree | 842 (69.1%) | 377 (30.9%) |
| Bachelor's Degree or higher | 550 (84.0%) | 105 (16.0%) |
Occupancy by Age of Householder in Grundy County
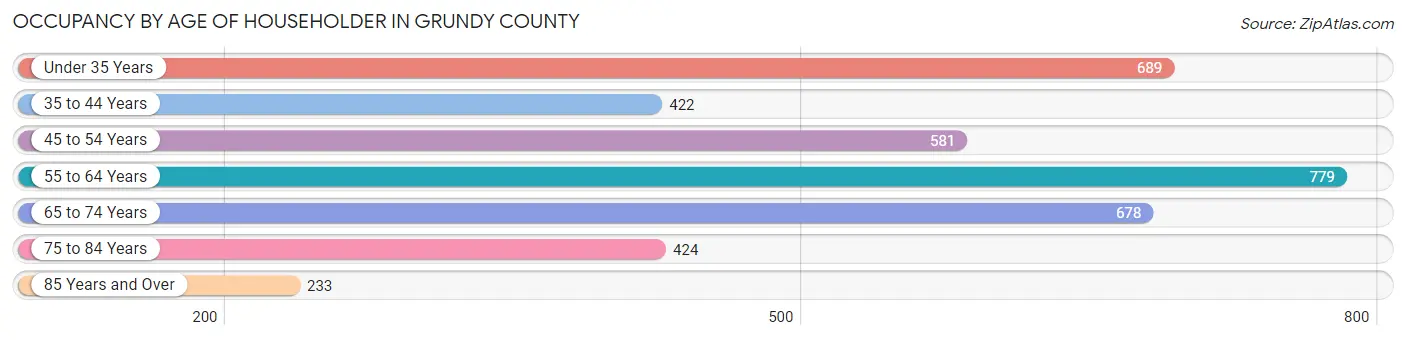
| Age Bracket | # Households | % Households |
| Under 35 Years | 689 | 18.1% |
| 35 to 44 Years | 422 | 11.1% |
| 45 to 54 Years | 581 | 15.3% |
| 55 to 64 Years | 779 | 20.5% |
| 65 to 74 Years | 678 | 17.8% |
| 75 to 84 Years | 424 | 11.1% |
| 85 Years and Over | 233 | 6.1% |
| Total | 3,806 | 100.0% |
Housing Finances in Grundy County
Median Income by Occupancy in Grundy County
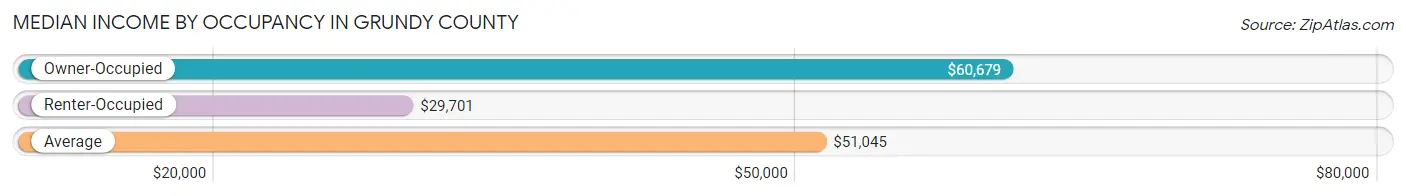
| Occupancy Type | # Households | Median Income |
| Owner-Occupied | 2,598 (68.3%) | $60,679 |
| Renter-Occupied | 1,208 (31.7%) | $29,701 |
| Average | 3,806 (100.0%) | $51,045 |
Occupancy by Householder Income Bracket in Grundy County
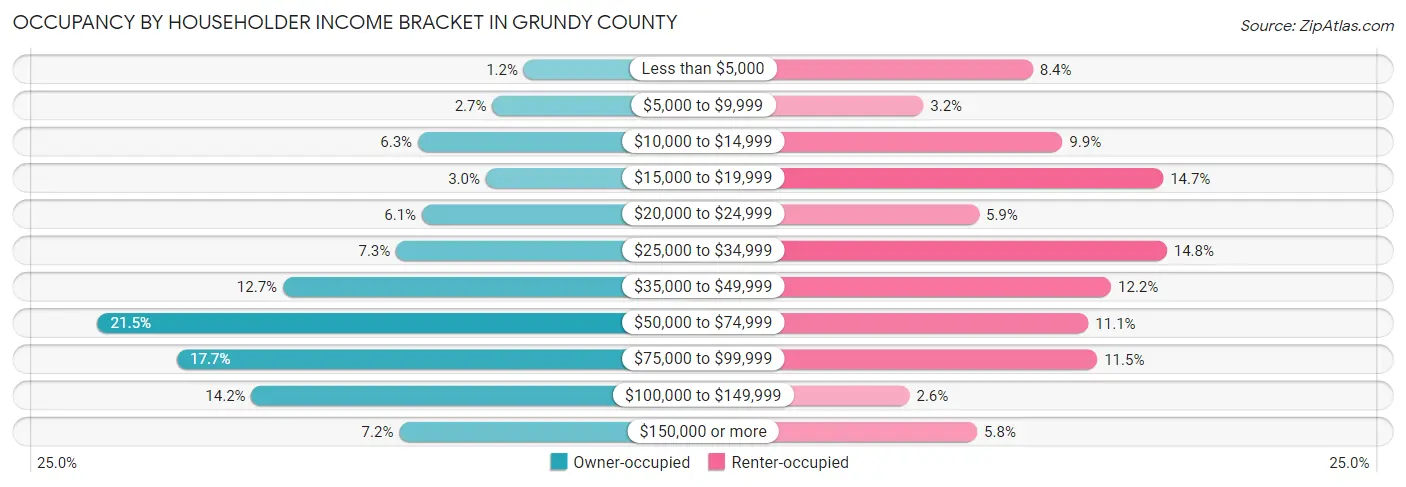
| Income Bracket | Owner-occupied | Renter-occupied |
| Less than $5,000 | 32 (1.2%) | 102 (8.4%) |
| $5,000 to $9,999 | 71 (2.7%) | 39 (3.2%) |
| $10,000 to $14,999 | 163 (6.3%) | 119 (9.9%) |
| $15,000 to $19,999 | 79 (3.0%) | 177 (14.6%) |
| $20,000 to $24,999 | 158 (6.1%) | 71 (5.9%) |
| $25,000 to $34,999 | 190 (7.3%) | 179 (14.8%) |
| $35,000 to $49,999 | 330 (12.7%) | 147 (12.2%) |
| $50,000 to $74,999 | 559 (21.5%) | 134 (11.1%) |
| $75,000 to $99,999 | 461 (17.7%) | 139 (11.5%) |
| $100,000 to $149,999 | 369 (14.2%) | 31 (2.6%) |
| $150,000 or more | 186 (7.2%) | 70 (5.8%) |
| Total | 2,598 (100.0%) | 1,208 (100.0%) |
Monthly Housing Cost Tiers in Grundy County
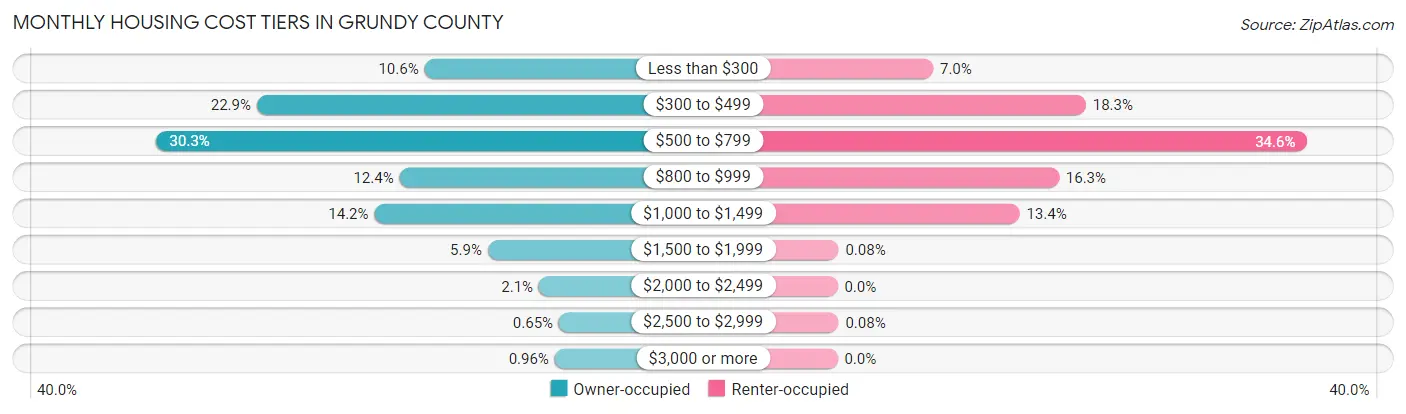
| Monthly Cost | Owner-occupied | Renter-occupied |
| Less than $300 | 274 (10.5%) | 85 (7.0%) |
| $300 to $499 | 595 (22.9%) | 221 (18.3%) |
| $500 to $799 | 787 (30.3%) | 418 (34.6%) |
| $800 to $999 | 322 (12.4%) | 197 (16.3%) |
| $1,000 to $1,499 | 370 (14.2%) | 162 (13.4%) |
| $1,500 to $1,999 | 153 (5.9%) | 1 (0.1%) |
| $2,000 to $2,499 | 55 (2.1%) | 0 (0.0%) |
| $2,500 to $2,999 | 17 (0.6%) | 1 (0.1%) |
| $3,000 or more | 25 (1.0%) | 0 (0.0%) |
| Total | 2,598 (100.0%) | 1,208 (100.0%) |
Physical Housing Characteristics in Grundy County
Housing Structures in Grundy County
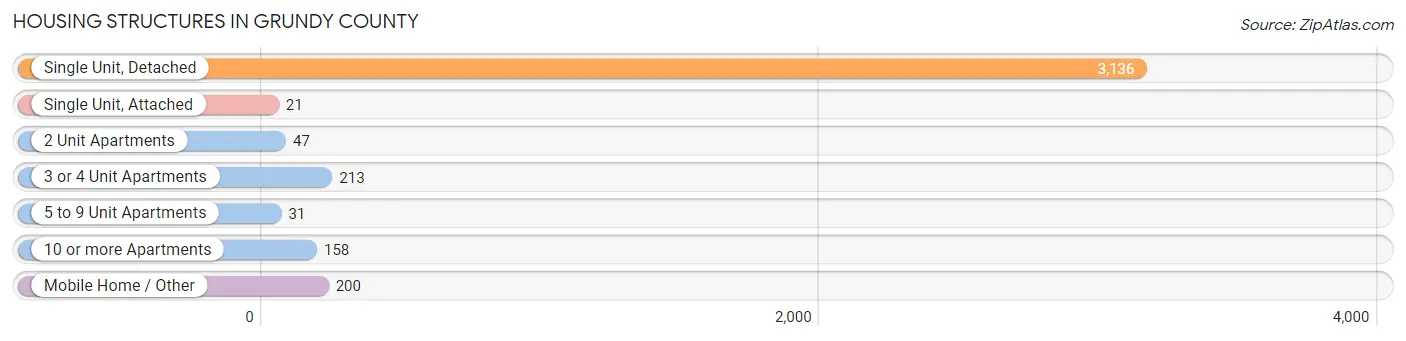
| Structure Type | # Housing Units | % Housing Units |
| Single Unit, Detached | 3,136 | 82.4% |
| Single Unit, Attached | 21 | 0.5% |
| 2 Unit Apartments | 47 | 1.2% |
| 3 or 4 Unit Apartments | 213 | 5.6% |
| 5 to 9 Unit Apartments | 31 | 0.8% |
| 10 or more Apartments | 158 | 4.2% |
| Mobile Home / Other | 200 | 5.2% |
| Total | 3,806 | 100.0% |
Housing Structures by Occupancy in Grundy County
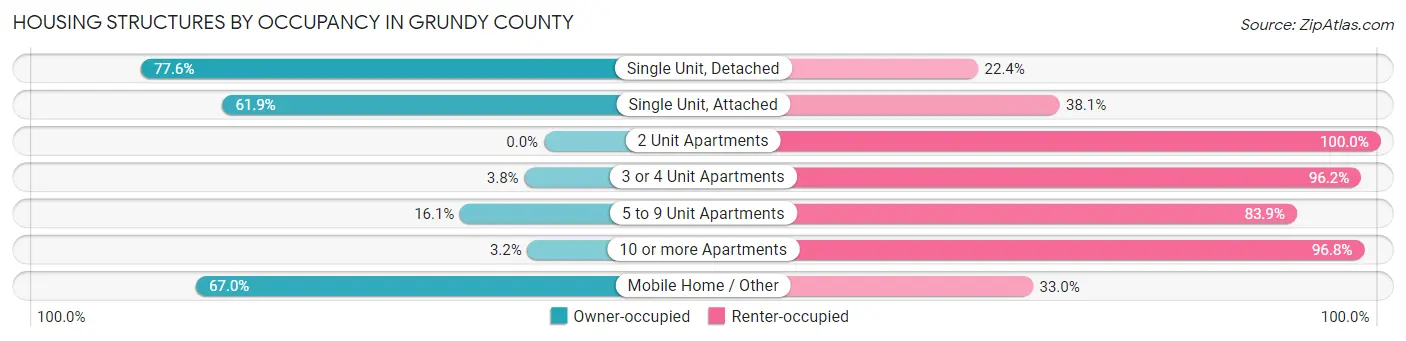
| Structure Type | Owner-occupied | Renter-occupied |
| Single Unit, Detached | 2,433 (77.6%) | 703 (22.4%) |
| Single Unit, Attached | 13 (61.9%) | 8 (38.1%) |
| 2 Unit Apartments | 0 (0.0%) | 47 (100.0%) |
| 3 or 4 Unit Apartments | 8 (3.8%) | 205 (96.2%) |
| 5 to 9 Unit Apartments | 5 (16.1%) | 26 (83.9%) |
| 10 or more Apartments | 5 (3.2%) | 153 (96.8%) |
| Mobile Home / Other | 134 (67.0%) | 66 (33.0%) |
| Total | 2,598 (68.3%) | 1,208 (31.7%) |
Housing Structures by Number of Rooms in Grundy County
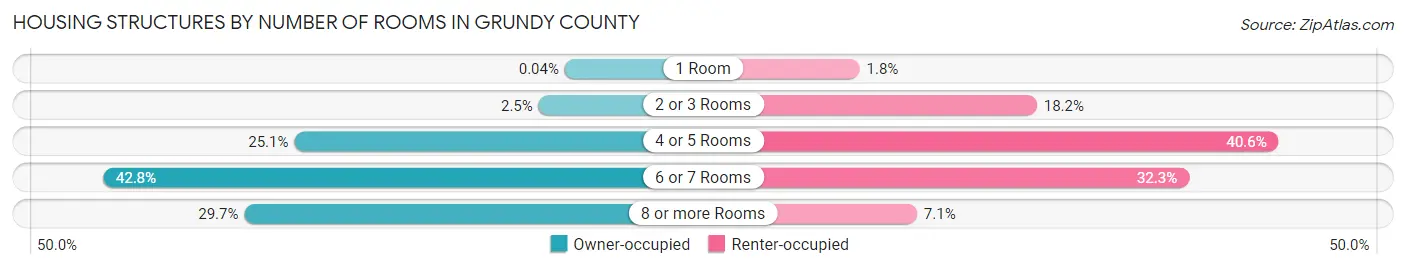
| Number of Rooms | Owner-occupied | Renter-occupied |
| 1 Room | 1 (0.0%) | 22 (1.8%) |
| 2 or 3 Rooms | 64 (2.5%) | 220 (18.2%) |
| 4 or 5 Rooms | 651 (25.1%) | 490 (40.6%) |
| 6 or 7 Rooms | 1,111 (42.8%) | 390 (32.3%) |
| 8 or more Rooms | 771 (29.7%) | 86 (7.1%) |
| Total | 2,598 (100.0%) | 1,208 (100.0%) |
Housing Structure by Heating Type in Grundy County
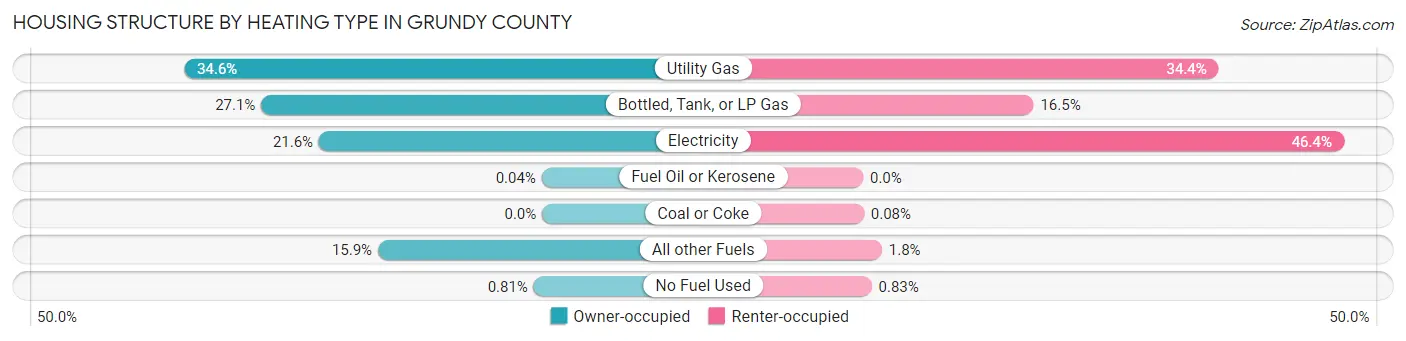
| Heating Type | Owner-occupied | Renter-occupied |
| Utility Gas | 899 (34.6%) | 415 (34.4%) |
| Bottled, Tank, or LP Gas | 705 (27.1%) | 199 (16.5%) |
| Electricity | 560 (21.6%) | 561 (46.4%) |
| Fuel Oil or Kerosene | 1 (0.0%) | 0 (0.0%) |
| Coal or Coke | 0 (0.0%) | 1 (0.1%) |
| All other Fuels | 412 (15.9%) | 22 (1.8%) |
| No Fuel Used | 21 (0.8%) | 10 (0.8%) |
| Total | 2,598 (100.0%) | 1,208 (100.0%) |
Household Vehicle Usage in Grundy County
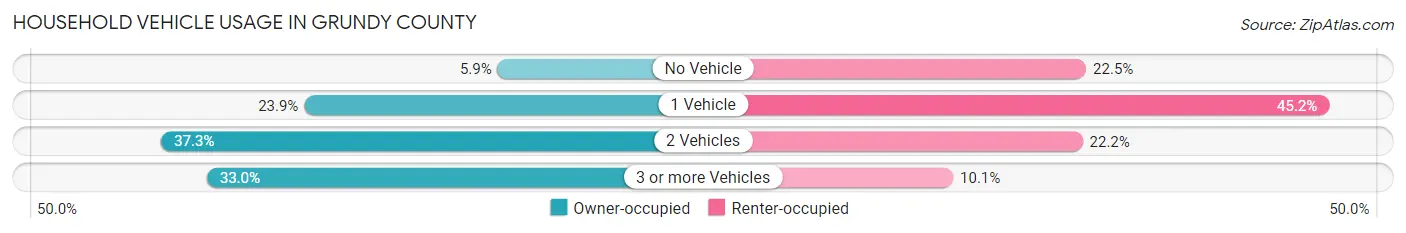
| Vehicles per Household | Owner-occupied | Renter-occupied |
| No Vehicle | 152 (5.9%) | 272 (22.5%) |
| 1 Vehicle | 621 (23.9%) | 546 (45.2%) |
| 2 Vehicles | 968 (37.3%) | 268 (22.2%) |
| 3 or more Vehicles | 857 (33.0%) | 122 (10.1%) |
| Total | 2,598 (100.0%) | 1,208 (100.0%) |
Real Estate & Mortgages in Grundy County
Real Estate and Mortgage Overview in Grundy County
| Characteristic | Without Mortgage | With Mortgage |
| Housing Units | 1,544 | 1,054 |
| Median Property Value | $93,400 | $131,600 |
| Median Household Income | $55,313 | $57 |
| Monthly Housing Costs | $480 | $25 |
| Real Estate Taxes | $1,115 | $10 |
Property Value by Mortgage Status in Grundy County
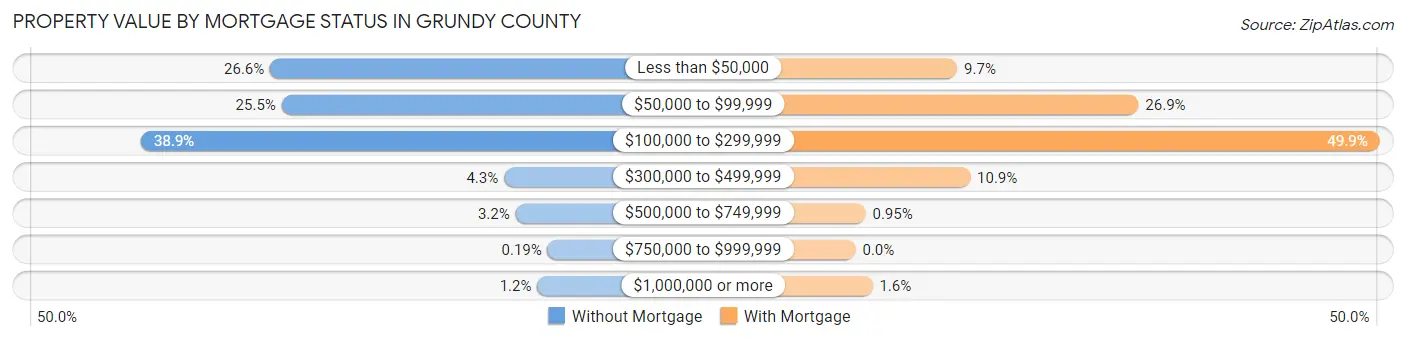
| Property Value | Without Mortgage | With Mortgage |
| Less than $50,000 | 411 (26.6%) | 102 (9.7%) |
| $50,000 to $99,999 | 394 (25.5%) | 284 (26.9%) |
| $100,000 to $299,999 | 601 (38.9%) | 526 (49.9%) |
| $300,000 to $499,999 | 67 (4.3%) | 115 (10.9%) |
| $500,000 to $749,999 | 50 (3.2%) | 10 (0.9%) |
| $750,000 to $999,999 | 3 (0.2%) | 0 (0.0%) |
| $1,000,000 or more | 18 (1.2%) | 17 (1.6%) |
| Total | 1,544 (100.0%) | 1,054 (100.0%) |
Household Income by Mortgage Status in Grundy County
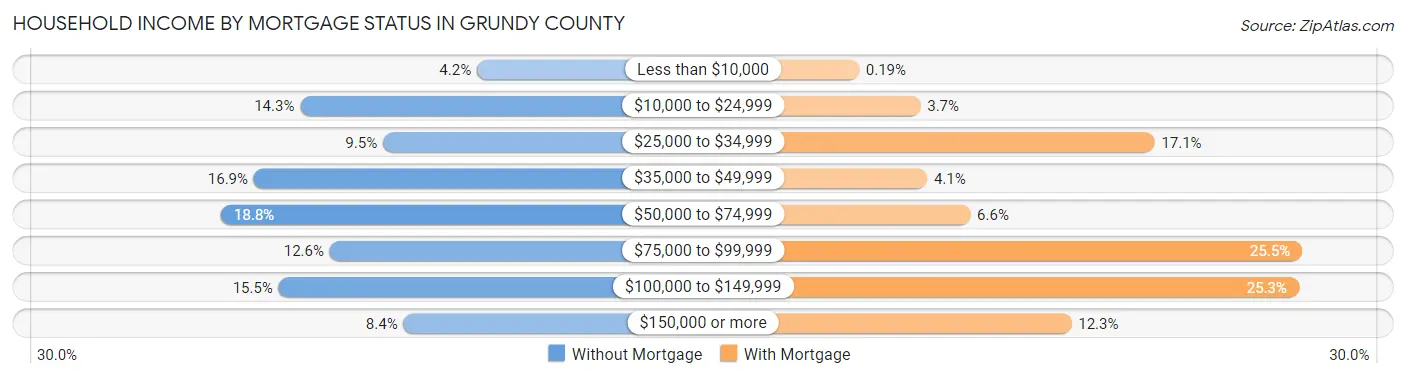
| Household Income | Without Mortgage | With Mortgage |
| Less than $10,000 | 64 (4.2%) | 2 (0.2%) |
| $10,000 to $24,999 | 220 (14.2%) | 39 (3.7%) |
| $25,000 to $34,999 | 147 (9.5%) | 180 (17.1%) |
| $35,000 to $49,999 | 261 (16.9%) | 43 (4.1%) |
| $50,000 to $74,999 | 290 (18.8%) | 69 (6.6%) |
| $75,000 to $99,999 | 194 (12.6%) | 269 (25.5%) |
| $100,000 to $149,999 | 239 (15.5%) | 267 (25.3%) |
| $150,000 or more | 129 (8.4%) | 130 (12.3%) |
| Total | 1,544 (100.0%) | 1,054 (100.0%) |
Property Value to Household Income Ratio in Grundy County
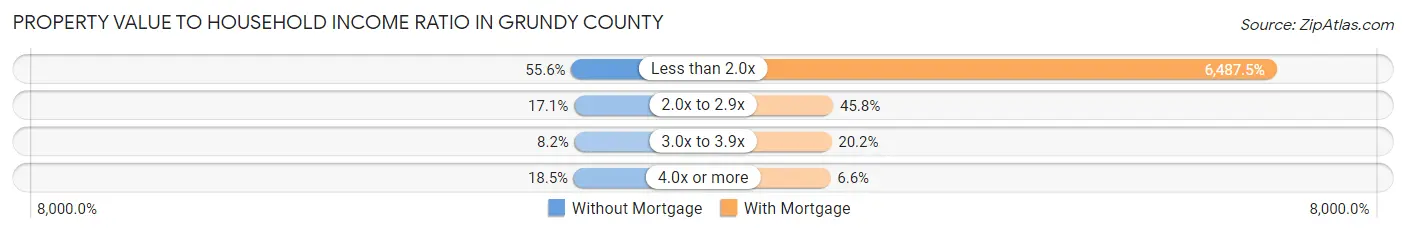
| Value-to-Income Ratio | Without Mortgage | With Mortgage |
| Less than 2.0x | 858 (55.6%) | 68,378 (6,487.5%) |
| 2.0x to 2.9x | 264 (17.1%) | 483 (45.8%) |
| 3.0x to 3.9x | 126 (8.2%) | 213 (20.2%) |
| 4.0x or more | 285 (18.5%) | 70 (6.6%) |
| Total | 1,544 (100.0%) | 1,054 (100.0%) |
Real Estate Taxes by Mortgage Status in Grundy County
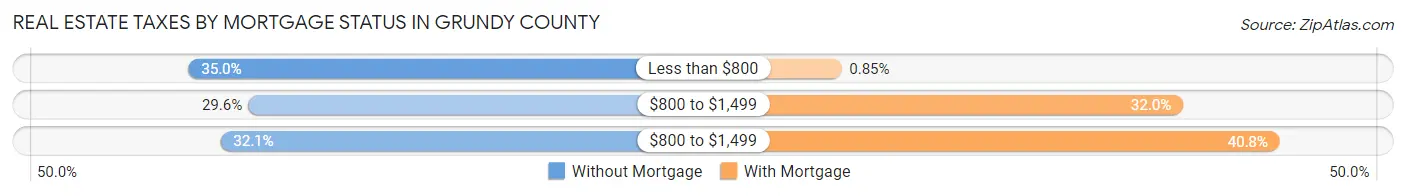
| Property Taxes | Without Mortgage | With Mortgage |
| Less than $800 | 541 (35.0%) | 9 (0.9%) |
| $800 to $1,499 | 457 (29.6%) | 337 (32.0%) |
| $800 to $1,499 | 496 (32.1%) | 430 (40.8%) |
| Total | 1,544 (100.0%) | 1,054 (100.0%) |
Health & Disability in Grundy County
Health Insurance Coverage by Age in Grundy County
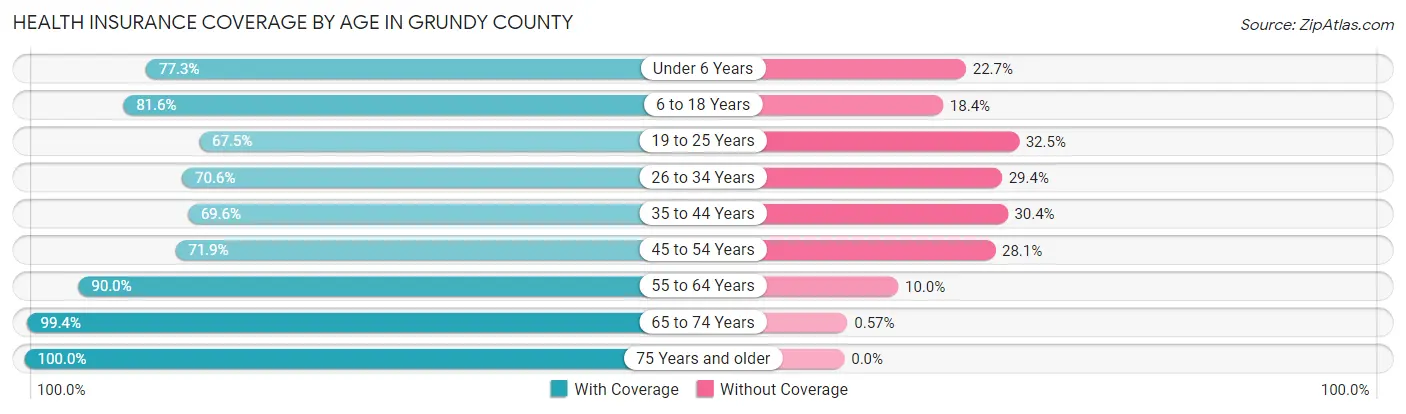
| Age Bracket | With Coverage | Without Coverage |
| Under 6 Years | 645 (77.3%) | 189 (22.7%) |
| 6 to 18 Years | 1,464 (81.6%) | 330 (18.4%) |
| 19 to 25 Years | 446 (67.5%) | 215 (32.5%) |
| 26 to 34 Years | 777 (70.6%) | 323 (29.4%) |
| 35 to 44 Years | 684 (69.6%) | 299 (30.4%) |
| 45 to 54 Years | 729 (71.9%) | 285 (28.1%) |
| 55 to 64 Years | 1,166 (90.0%) | 130 (10.0%) |
| 65 to 74 Years | 1,047 (99.4%) | 6 (0.6%) |
| 75 Years and older | 939 (100.0%) | 0 (0.0%) |
| Total | 7,897 (81.6%) | 1,777 (18.4%) |
Health Insurance Coverage by Citizenship Status in Grundy County
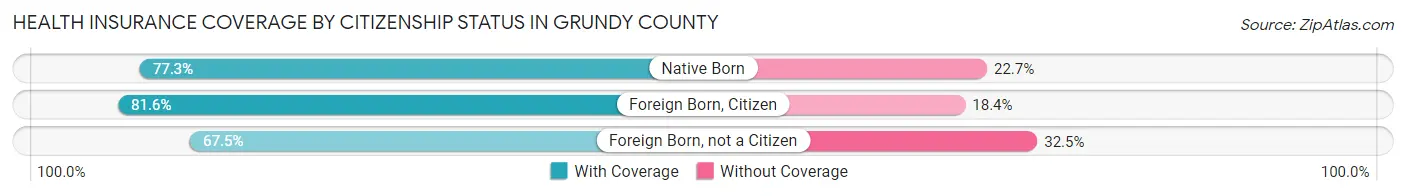
| Citizenship Status | With Coverage | Without Coverage |
| Native Born | 645 (77.3%) | 189 (22.7%) |
| Foreign Born, Citizen | 1,464 (81.6%) | 330 (18.4%) |
| Foreign Born, not a Citizen | 446 (67.5%) | 215 (32.5%) |
Health Insurance Coverage by Household Income in Grundy County
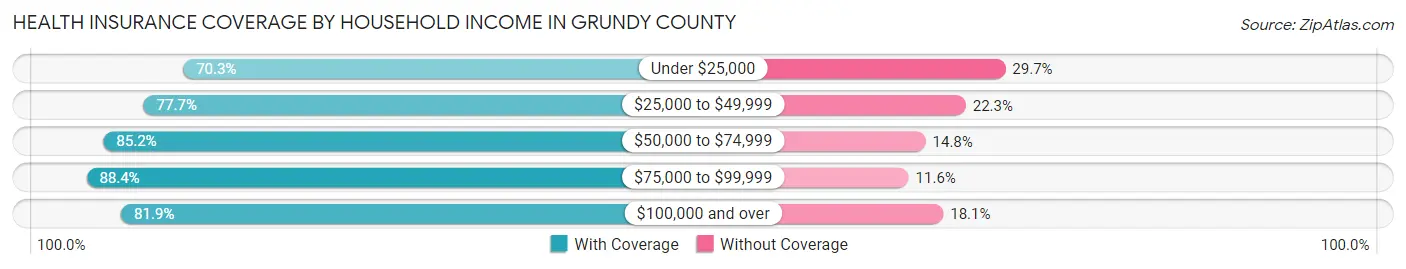
| Household Income | With Coverage | Without Coverage |
| Under $25,000 | 1,057 (70.3%) | 447 (29.7%) |
| $25,000 to $49,999 | 1,408 (77.7%) | 404 (22.3%) |
| $50,000 to $74,999 | 1,685 (85.2%) | 292 (14.8%) |
| $75,000 to $99,999 | 1,937 (88.4%) | 254 (11.6%) |
| $100,000 and over | 1,685 (81.9%) | 372 (18.1%) |
Public vs Private Health Insurance Coverage by Age in Grundy County
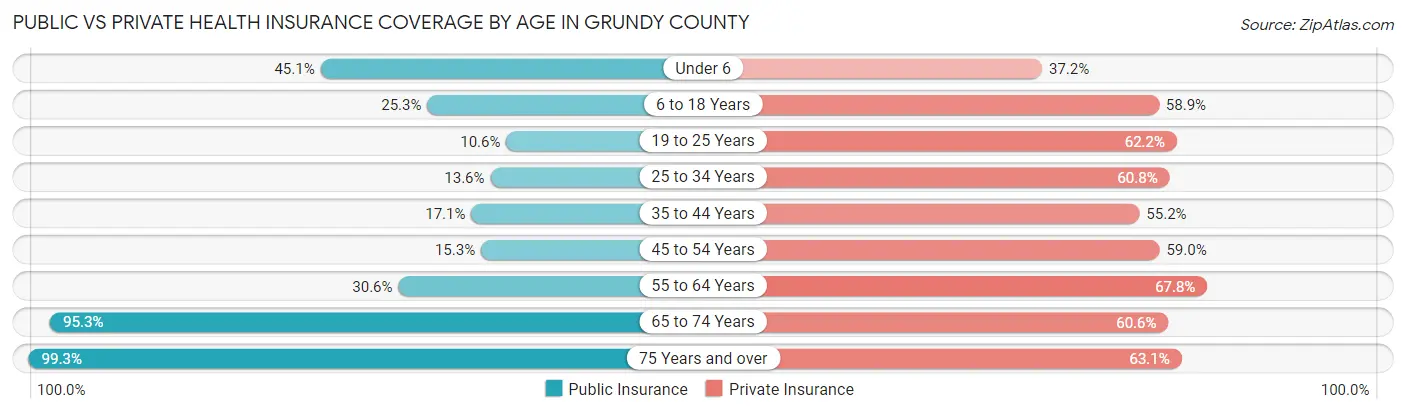
| Age Bracket | Public Insurance | Private Insurance |
| Under 6 | 376 (45.1%) | 310 (37.2%) |
| 6 to 18 Years | 453 (25.3%) | 1,056 (58.9%) |
| 19 to 25 Years | 70 (10.6%) | 411 (62.2%) |
| 25 to 34 Years | 149 (13.6%) | 669 (60.8%) |
| 35 to 44 Years | 168 (17.1%) | 543 (55.2%) |
| 45 to 54 Years | 155 (15.3%) | 598 (59.0%) |
| 55 to 64 Years | 397 (30.6%) | 879 (67.8%) |
| 65 to 74 Years | 1,003 (95.3%) | 638 (60.6%) |
| 75 Years and over | 932 (99.3%) | 592 (63.0%) |
| Total | 3,703 (38.3%) | 5,696 (58.9%) |
Disability Status by Sex by Age in Grundy County
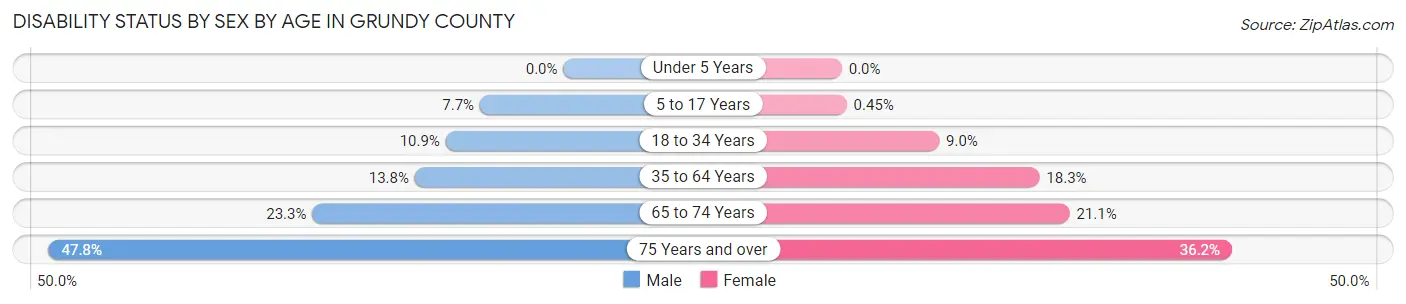
| Age Bracket | Male | Female |
| Under 5 Years | 0 (0.0%) | 0 (0.0%) |
| 5 to 17 Years | 68 (7.7%) | 4 (0.4%) |
| 18 to 34 Years | 103 (10.9%) | 88 (9.0%) |
| 35 to 64 Years | 230 (13.8%) | 298 (18.3%) |
| 65 to 74 Years | 123 (23.3%) | 111 (21.1%) |
| 75 Years and over | 182 (47.8%) | 202 (36.2%) |
Disability Class by Sex by Age in Grundy County
Disability Class: Hearing Difficulty
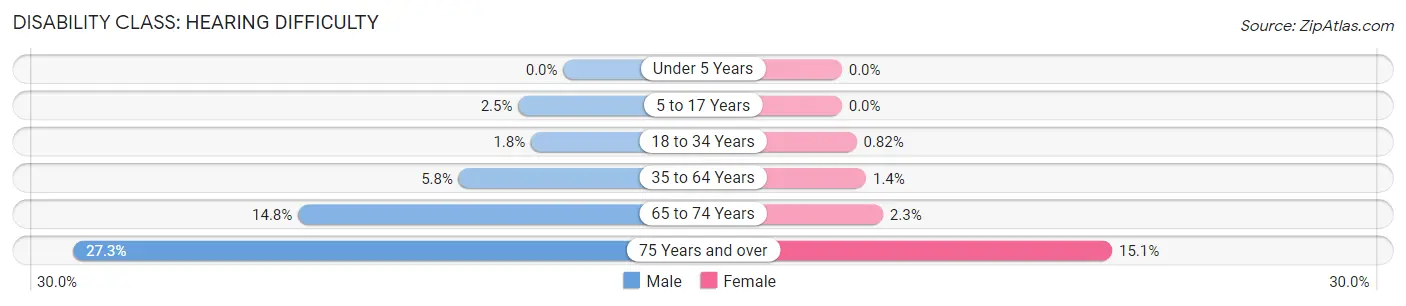
| Age Bracket | Male | Female |
| Under 5 Years | 0 (0.0%) | 0 (0.0%) |
| 5 to 17 Years | 22 (2.5%) | 0 (0.0%) |
| 18 to 34 Years | 17 (1.8%) | 8 (0.8%) |
| 35 to 64 Years | 97 (5.8%) | 22 (1.3%) |
| 65 to 74 Years | 78 (14.8%) | 12 (2.3%) |
| 75 Years and over | 104 (27.3%) | 84 (15.0%) |
Disability Class: Vision Difficulty
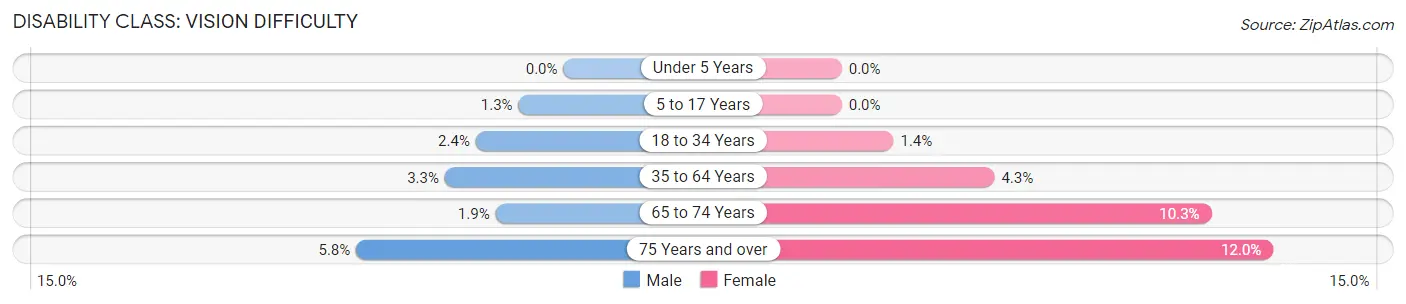
| Age Bracket | Male | Female |
| Under 5 Years | 0 (0.0%) | 0 (0.0%) |
| 5 to 17 Years | 11 (1.3%) | 0 (0.0%) |
| 18 to 34 Years | 23 (2.4%) | 14 (1.4%) |
| 35 to 64 Years | 55 (3.3%) | 69 (4.3%) |
| 65 to 74 Years | 10 (1.9%) | 54 (10.3%) |
| 75 Years and over | 22 (5.8%) | 67 (12.0%) |
Disability Class: Cognitive Difficulty
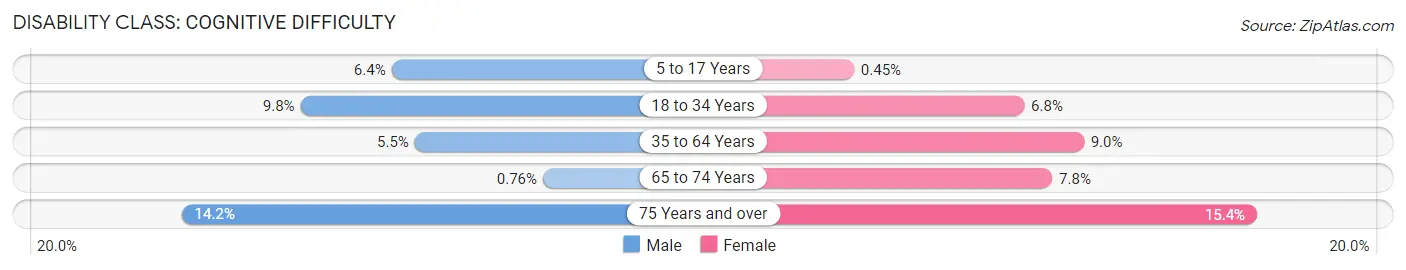
| Age Bracket | Male | Female |
| 5 to 17 Years | 56 (6.4%) | 4 (0.4%) |
| 18 to 34 Years | 92 (9.8%) | 66 (6.8%) |
| 35 to 64 Years | 92 (5.5%) | 146 (9.0%) |
| 65 to 74 Years | 4 (0.8%) | 41 (7.8%) |
| 75 Years and over | 54 (14.2%) | 86 (15.4%) |
Disability Class: Ambulatory Difficulty
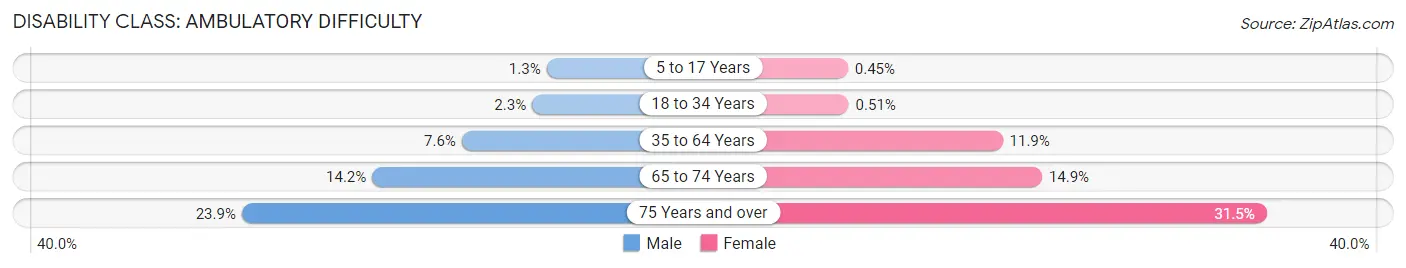
| Age Bracket | Male | Female |
| 5 to 17 Years | 11 (1.3%) | 4 (0.4%) |
| 18 to 34 Years | 22 (2.3%) | 5 (0.5%) |
| 35 to 64 Years | 126 (7.5%) | 194 (11.9%) |
| 65 to 74 Years | 75 (14.2%) | 78 (14.9%) |
| 75 Years and over | 91 (23.9%) | 176 (31.5%) |
Disability Class: Self-Care Difficulty
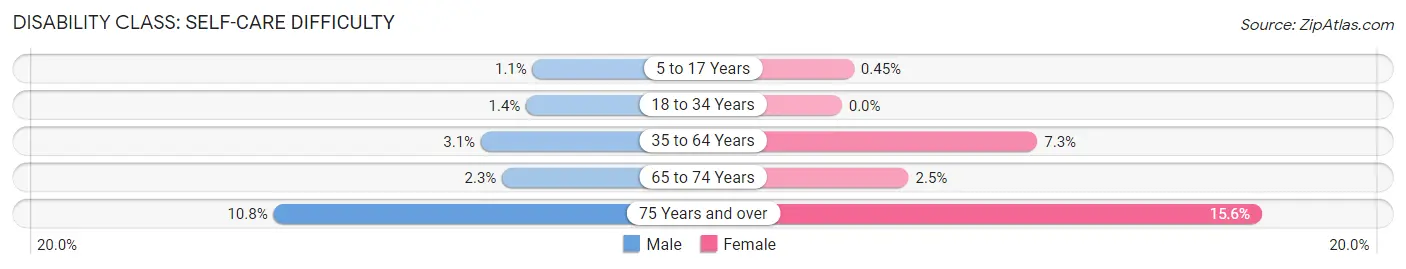
| Age Bracket | Male | Female |
| 5 to 17 Years | 10 (1.1%) | 4 (0.4%) |
| 18 to 34 Years | 13 (1.4%) | 0 (0.0%) |
| 35 to 64 Years | 51 (3.1%) | 118 (7.3%) |
| 65 to 74 Years | 12 (2.3%) | 13 (2.5%) |
| 75 Years and over | 41 (10.8%) | 87 (15.6%) |
Technology Access in Grundy County
Computing Device Access in Grundy County
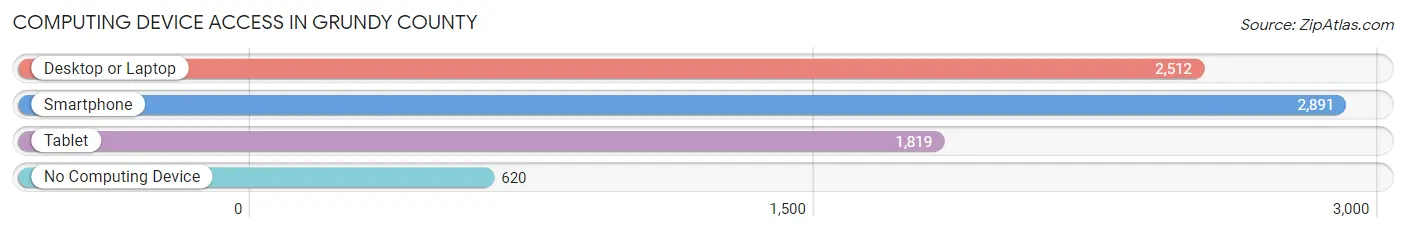
| Device Type | # Households | % Households |
| Desktop or Laptop | 2,512 | 66.0% |
| Smartphone | 2,891 | 76.0% |
| Tablet | 1,819 | 47.8% |
| No Computing Device | 620 | 16.3% |
| Total | 3,806 | 100.0% |
Internet Access in Grundy County
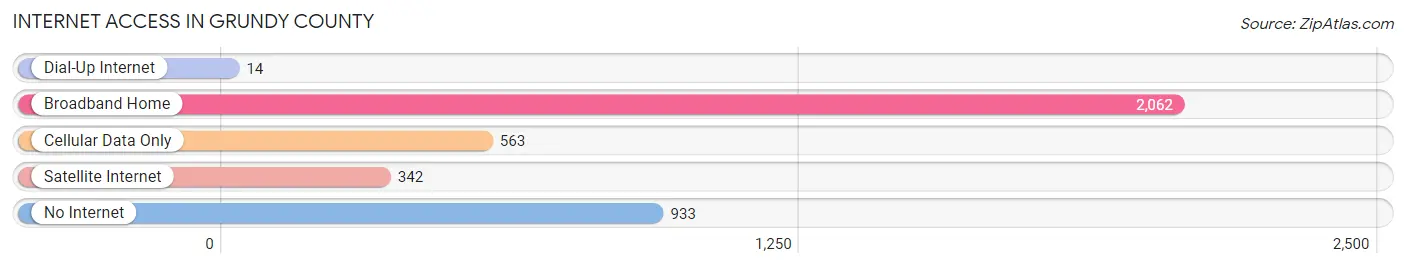
| Internet Type | # Households | % Households |
| Dial-Up Internet | 14 | 0.4% |
| Broadband Home | 2,062 | 54.2% |
| Cellular Data Only | 563 | 14.8% |
| Satellite Internet | 342 | 9.0% |
| No Internet | 933 | 24.5% |
| Total | 3,806 | 100.0% |
Grundy County Summary
Grundy County is located in north-central Missouri, and is part of the Kansas City metropolitan area. It is bordered by Livingston County to the north, Mercer County to the east, Harrison County to the south, and Carroll County to the west. The county seat is Trenton, and the largest city is Spickard.
History
Grundy County was established in 1841 and named after Felix Grundy, a U.S. Senator from Tennessee. The county was originally part of Livingston County, but was split off in 1841. The first settlers arrived in the area in the early 1830s, and the county was officially organized in 1845.
Grundy County was an important agricultural center in the 19th century, and the county seat of Trenton was a major trading center. The county was also home to several Civil War battles, including the Battle of Trenton in 1862.
Geography
Grundy County covers an area of 576 square miles, and is located in the Ozark Plateau region of Missouri. The county is mostly rural, with rolling hills and wooded areas. The Grand River runs through the county, and there are several small lakes and ponds.
The climate of Grundy County is humid continental, with hot summers and cold winters. The average annual temperature is around 50°F, and the average annual precipitation is around 40 inches.
Economy
Grundy County has a diverse economy, with a mix of agriculture, manufacturing, and services. The county is home to several large employers, including the Grundy County Health Center, Grundy County Memorial Hospital, and the Grundy County Sheriff's Office.
Agriculture is an important part of the county's economy, and the main crops are corn, soybeans, wheat, and hay. Livestock production is also important, and the county is home to several large dairy farms.
Manufacturing is also an important part of the county's economy, and the main industries are food processing, metal fabrication, and plastics. The county is also home to several small businesses, including restaurants, retail stores, and service providers.
Demographics
As of the 2010 census, Grundy County had a population of 10,261. The racial makeup of the county was 97.3% White, 0.7% African American, 0.3% Native American, 0.2% Asian, 0.1% Pacific Islander, 0.4% from other races, and 1.0% from two or more races. Hispanic or Latino of any race were 1.3% of the population.
The median household income in Grundy County was $41,945, and the median family income was $50,945. The per capita income was $20,945. About 11.3% of the population was below the poverty line.
Grundy County is served by the Grundy County R-V School District, which includes four elementary schools, one middle school, and one high school. The county is also home to several private schools, including Trenton Christian Academy and Grundy County Christian Academy.
Common Questions
What is Per Capita Income in Grundy County?
Per Capita income in Grundy County is $27,809.
What is the Median Family Income in Grundy County?
Median Family Income in Grundy County is $64,239.
What is the Median Household income in Grundy County?
Median Household Income in Grundy County is $51,045.
What is Income or Wage Gap in Grundy County?
Income or Wage Gap in Grundy County is 43.2%.
Women in Grundy County earn 56.8 cents for every dollar earned by a man.
What is Family Income Deficit in Grundy County?
Family Income Deficit in Grundy County is $10,188.
Families that are below poverty line in Grundy County earn $10,188 less on average than the poverty threshold level.
What is Inequality or Gini Index in Grundy County?
Inequality or Gini Index in Grundy County is 0.48.
What is the Total Population of Grundy County?
Total Population of Grundy County is 9,878.
What is the Total Male Population of Grundy County?
Total Male Population of Grundy County is 4,822.
What is the Total Female Population of Grundy County?
Total Female Population of Grundy County is 5,056.
What is the Ratio of Males per 100 Females in Grundy County?
There are 95.37 Males per 100 Females in Grundy County.
What is the Ratio of Females per 100 Males in Grundy County?
There are 104.85 Females per 100 Males in Grundy County.
What is the Median Population Age in Grundy County?
Median Population Age in Grundy County is 40.2 Years.
What is the Average Family Size in Grundy County
Average Family Size in Grundy County is 3.3 People.
What is the Average Household Size in Grundy County
Average Household Size in Grundy County is 2.5 People.
How Large is the Labor Force in Grundy County?
There are 4,186 People in the Labor Forcein in Grundy County.
What is the Percentage of People in the Labor Force in Grundy County?
54.7% of People are in the Labor Force in Grundy County.
What is the Unemployment Rate in Grundy County?
Unemployment Rate in Grundy County is 4.1%.