Greene County, MO Map & Demographics
Greene County Map
Greene County Overview
$33,275
PER CAPITA INCOME
$74,318
AVG FAMILY INCOME
$54,968
AVG HOUSEHOLD INCOME
23.8%
WAGE / INCOME GAP [ % ]
76.2¢/ $1
WAGE / INCOME GAP [ $ ]
$9,080
FAMILY INCOME DEFICIT
0.47
INEQUALITY / GINI INDEX
299,188
TOTAL POPULATION
146,659
MALE POPULATION
152,529
FEMALE POPULATION
96.15
MALES / 100 FEMALES
104.00
FEMALES / 100 MALES
36.3
MEDIAN AGE
2.8
AVG FAMILY SIZE
2.2
AVG HOUSEHOLD SIZE
151,346
LABOR FORCE [ PEOPLE ]
62.0%
PERCENT IN LABOR FORCE
3.9%
UNEMPLOYMENT RATE
Greene County Area Codes
Income in Greene County
Income Overview in Greene County
Per Capita Income in Greene County is $33,275, while median incomes of families and households are $74,318 and $54,968 respectively.
| Characteristic | Number | Measure |
| Per Capita Income | 299,188 | $33,275 |
| Median Family Income | 74,622 | $74,318 |
| Mean Family Income | 74,622 | $97,885 |
| Median Household Income | 131,109 | $54,968 |
| Mean Household Income | 131,109 | $76,452 |
| Income Deficit | 74,622 | $9,080 |
| Wage / Income Gap (%) | 299,188 | 23.83% |
| Wage / Income Gap ($) | 299,188 | 76.17¢ per $1 |
| Gini / Inequality Index | 299,188 | 0.47 |
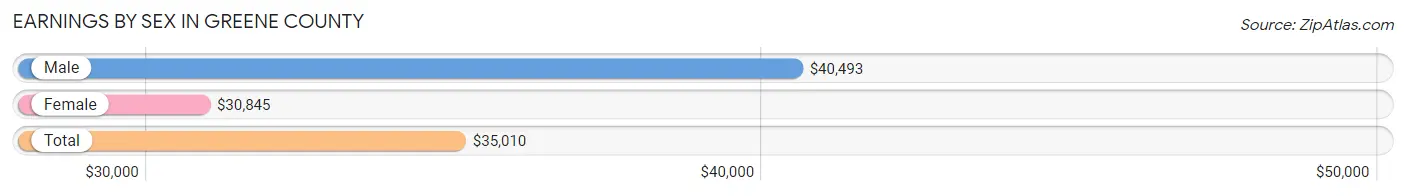
Earnings by Sex in Greene County
Average Earnings in Greene County are $35,010, $40,493 for men and $30,845 for women, a difference of 23.8%.
| Sex | Number | Average Earnings |
| Male | 81,308 (51.5%) | $40,493 |
| Female | 76,683 (48.5%) | $30,845 |
| Total | 157,991 (100.0%) | $35,010 |
Earnings by Sex by Income Bracket in Greene County
The most common earnings brackets in Greene County are $100,000+ for men (9,072 | 11.2%) and $25,000 to $29,999 for women (7,176 | 9.4%).
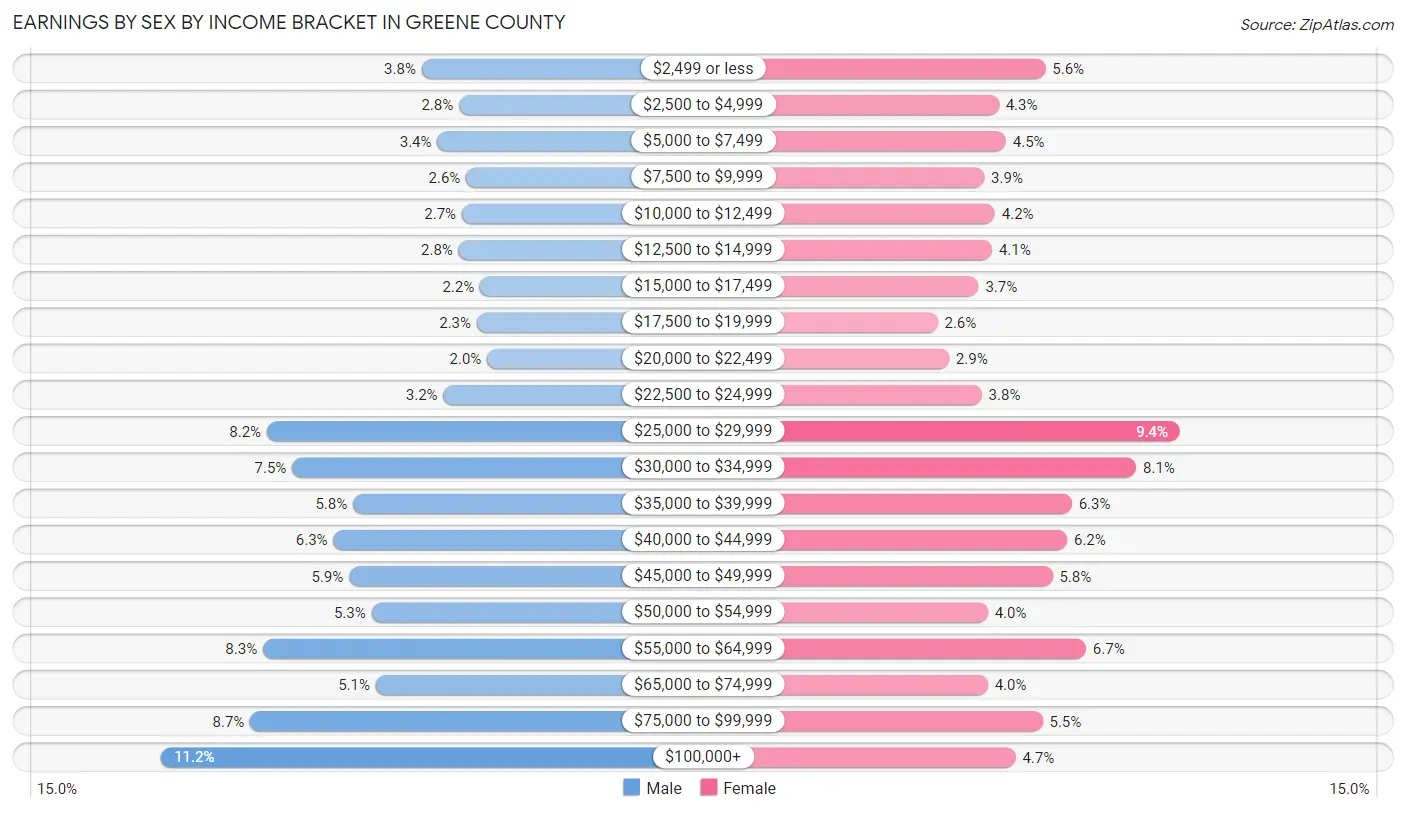
| Income | Male | Female |
| $2,499 or less | 3,125 (3.8%) | 4,282 (5.6%) |
| $2,500 to $4,999 | 2,271 (2.8%) | 3,277 (4.3%) |
| $5,000 to $7,499 | 2,764 (3.4%) | 3,426 (4.5%) |
| $7,500 to $9,999 | 2,109 (2.6%) | 2,957 (3.9%) |
| $10,000 to $12,499 | 2,200 (2.7%) | 3,189 (4.2%) |
| $12,500 to $14,999 | 2,278 (2.8%) | 3,125 (4.1%) |
| $15,000 to $17,499 | 1,792 (2.2%) | 2,839 (3.7%) |
| $17,500 to $19,999 | 1,863 (2.3%) | 1,957 (2.5%) |
| $20,000 to $22,499 | 1,630 (2.0%) | 2,202 (2.9%) |
| $22,500 to $24,999 | 2,624 (3.2%) | 2,908 (3.8%) |
| $25,000 to $29,999 | 6,663 (8.2%) | 7,176 (9.4%) |
| $30,000 to $34,999 | 6,079 (7.5%) | 6,237 (8.1%) |
| $35,000 to $39,999 | 4,694 (5.8%) | 4,847 (6.3%) |
| $40,000 to $44,999 | 5,140 (6.3%) | 4,743 (6.2%) |
| $45,000 to $49,999 | 4,779 (5.9%) | 4,435 (5.8%) |
| $50,000 to $54,999 | 4,268 (5.2%) | 3,033 (4.0%) |
| $55,000 to $64,999 | 6,745 (8.3%) | 5,154 (6.7%) |
| $65,000 to $74,999 | 4,169 (5.1%) | 3,039 (4.0%) |
| $75,000 to $99,999 | 7,043 (8.7%) | 4,221 (5.5%) |
| $100,000+ | 9,072 (11.2%) | 3,636 (4.7%) |
| Total | 81,308 (100.0%) | 76,683 (100.0%) |
Earnings by Sex by Educational Attainment in Greene County
Average earnings in Greene County are $46,864 for men and $36,728 for women, a difference of 21.6%. Men with an educational attainment of graduate degree enjoy the highest average annual earnings of $73,761, while those with less than high school education earn the least with $29,305. Women with an educational attainment of graduate degree earn the most with the average annual earnings of $56,416, while those with less than high school education have the smallest earnings of $21,442.
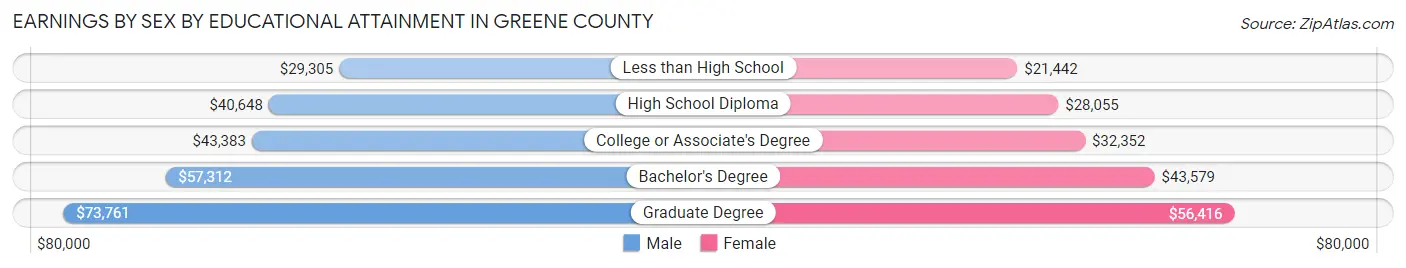
| Educational Attainment | Male Income | Female Income |
| Less than High School | $29,305 | $21,442 |
| High School Diploma | $40,648 | $28,055 |
| College or Associate's Degree | $43,383 | $32,352 |
| Bachelor's Degree | $57,312 | $43,579 |
| Graduate Degree | $73,761 | $56,416 |
| Total | $46,864 | $36,728 |
Family Income in Greene County
Family Income Brackets in Greene County
According to the Greene County family income data, there are 15,372 families falling into the $50,000 to $74,999 income range, which is the most common income bracket and makes up 20.6% of all families. Conversely, the $10,000 to $14,999 income bracket is the least frequent group with only 1,418 families (1.9%) belonging to this category.
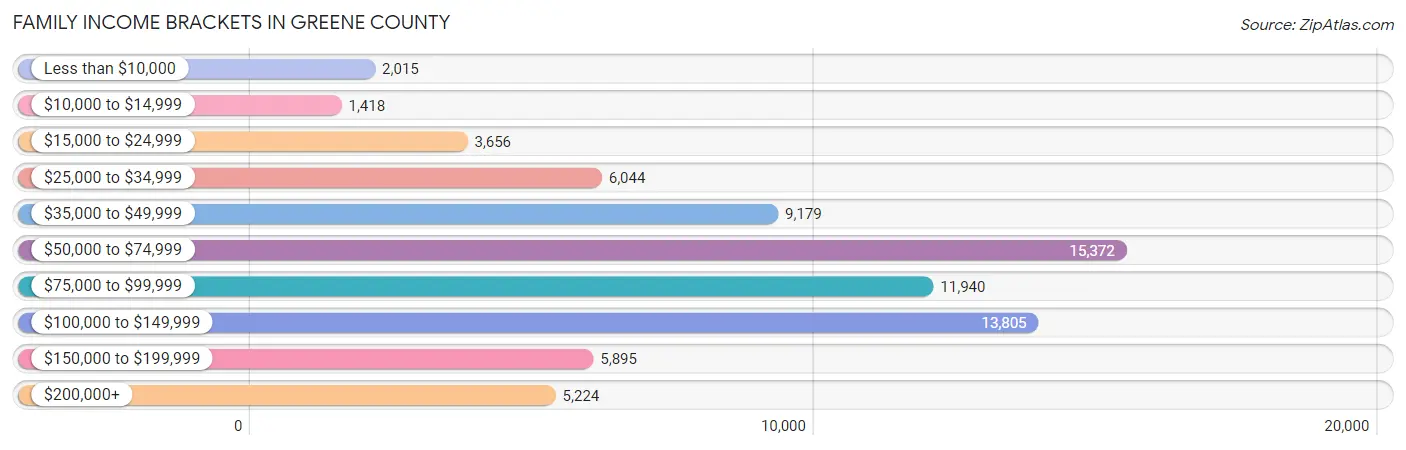
| Income Bracket | # Families | % Families |
| Less than $10,000 | 2,015 | 2.7% |
| $10,000 to $14,999 | 1,418 | 1.9% |
| $15,000 to $24,999 | 3,656 | 4.9% |
| $25,000 to $34,999 | 6,044 | 8.1% |
| $35,000 to $49,999 | 9,179 | 12.3% |
| $50,000 to $74,999 | 15,372 | 20.6% |
| $75,000 to $99,999 | 11,940 | 16.0% |
| $100,000 to $149,999 | 13,805 | 18.5% |
| $150,000 to $199,999 | 5,895 | 7.9% |
| $200,000+ | 5,224 | 7.0% |
Family Income by Famaliy Size in Greene County
7+ person families (787 | 1.1%) account for the highest median family income in Greene County with $116,822 per family, while 2-person families (40,764 | 54.6%) have the highest median income of $33,068 per family member.
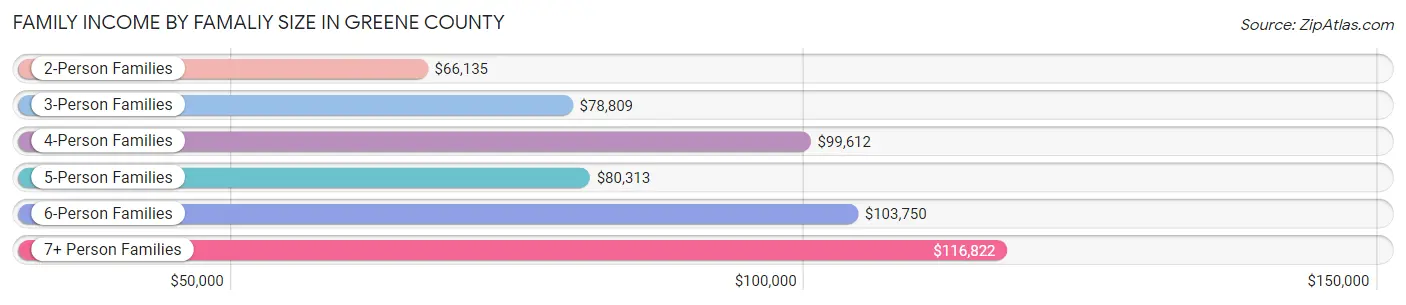
| Income Bracket | # Families | Median Income |
| 2-Person Families | 40,764 (54.6%) | $66,135 |
| 3-Person Families | 15,681 (21.0%) | $78,809 |
| 4-Person Families | 11,180 (15.0%) | $99,612 |
| 5-Person Families | 4,332 (5.8%) | $80,313 |
| 6-Person Families | 1,878 (2.5%) | $103,750 |
| 7+ Person Families | 787 (1.1%) | $116,822 |
| Total | 74,622 (100.0%) | $74,318 |
Family Income by Number of Earners in Greene County
The median family income in Greene County is $74,318, with families comprising 3+ earners (6,089) having the highest median family income of $128,110, while families with no earners (13,140) have the lowest median family income of $44,057, accounting for 8.2% and 17.6% of families, respectively.
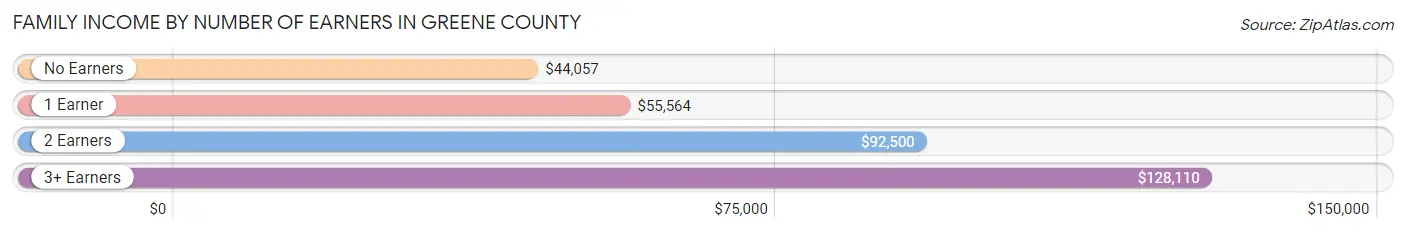
| Number of Earners | # Families | Median Income |
| No Earners | 13,140 (17.6%) | $44,057 |
| 1 Earner | 23,137 (31.0%) | $55,564 |
| 2 Earners | 32,256 (43.2%) | $92,500 |
| 3+ Earners | 6,089 (8.2%) | $128,110 |
| Total | 74,622 (100.0%) | $74,318 |
Household Income in Greene County
Household Income Brackets in Greene County
With 24,255 households falling in the category, the $50,000 to $74,999 income range is the most frequent in Greene County, accounting for 18.5% of all households. In contrast, only 6,031 households (4.6%) fall into the $200,000+ income bracket, making it the least populous group.
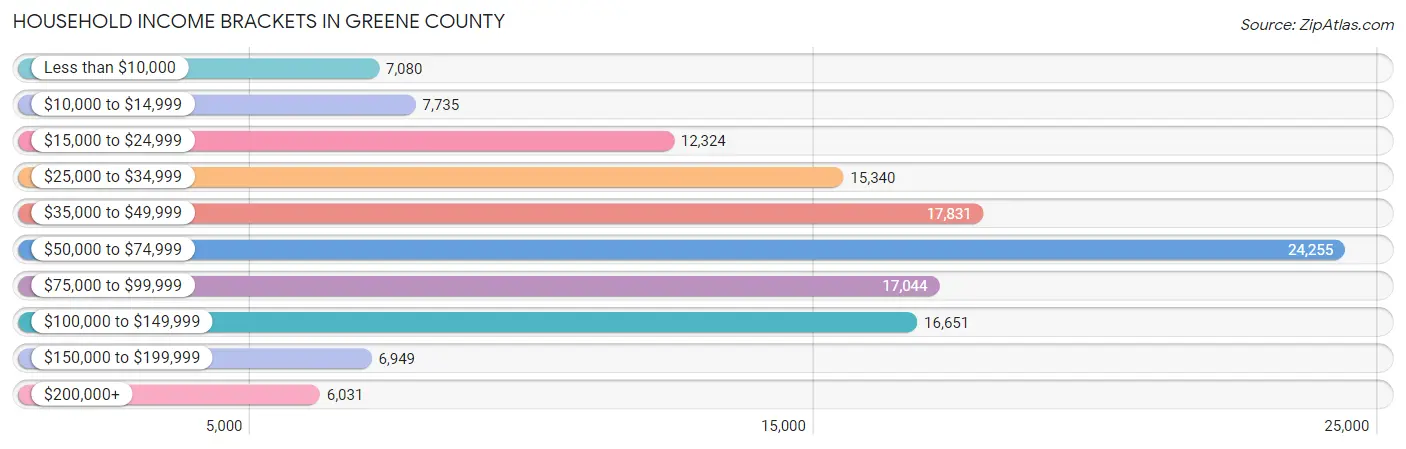
| Income Bracket | # Households | % Households |
| Less than $10,000 | 7,080 | 5.4% |
| $10,000 to $14,999 | 7,735 | 5.9% |
| $15,000 to $24,999 | 12,324 | 9.4% |
| $25,000 to $34,999 | 15,340 | 11.7% |
| $35,000 to $49,999 | 17,831 | 13.6% |
| $50,000 to $74,999 | 24,255 | 18.5% |
| $75,000 to $99,999 | 17,044 | 13.0% |
| $100,000 to $149,999 | 16,651 | 12.7% |
| $150,000 to $199,999 | 6,949 | 5.3% |
| $200,000+ | 6,031 | 4.6% |
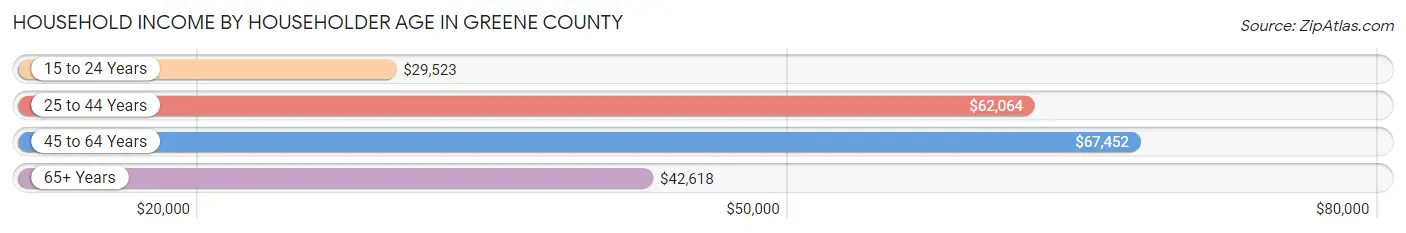
Household Income by Householder Age in Greene County
The median household income in Greene County is $54,968, with the highest median household income of $67,452 found in the 45 to 64 years age bracket for the primary householder. A total of 41,090 households (31.3%) fall into this category. Meanwhile, the 15 to 24 years age bracket for the primary householder has the lowest median household income of $29,523, with 14,103 households (10.8%) in this group.
| Income Bracket | # Households | Median Income |
| 15 to 24 Years | 14,103 (10.8%) | $29,523 |
| 25 to 44 Years | 42,911 (32.7%) | $62,064 |
| 45 to 64 Years | 41,090 (31.3%) | $67,452 |
| 65+ Years | 33,005 (25.2%) | $42,618 |
| Total | 131,109 (100.0%) | $54,968 |
Poverty in Greene County
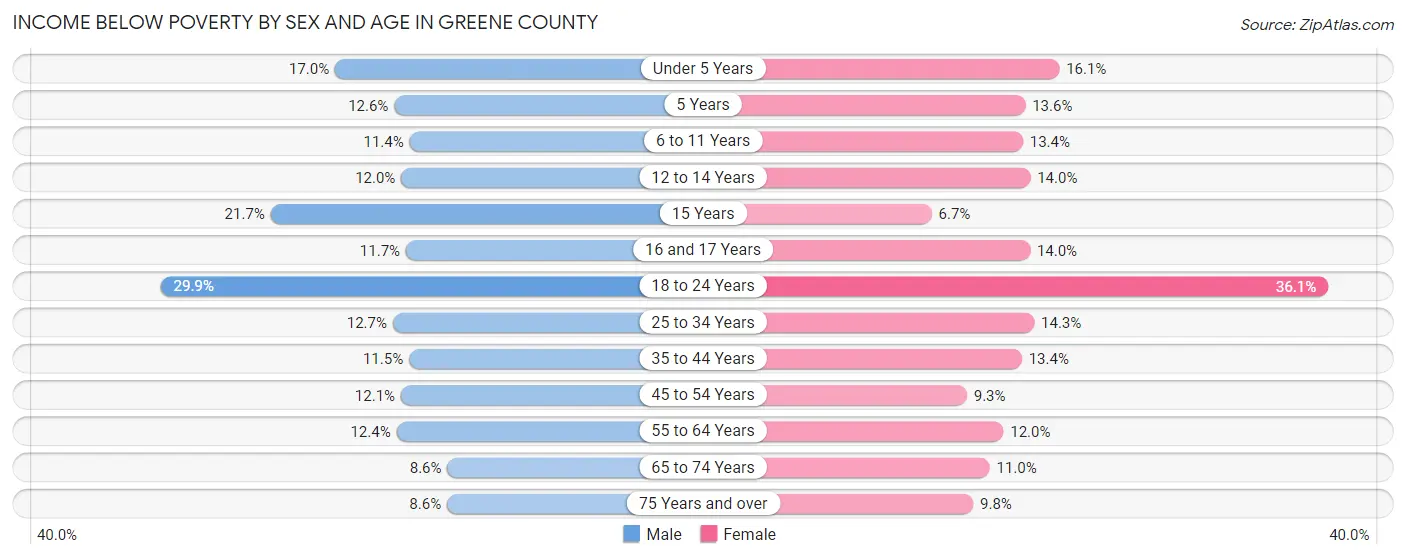
Income Below Poverty by Sex and Age in Greene County
With 14.1% poverty level for males and 15.1% for females among the residents of Greene County, 18 to 24 year old males and 18 to 24 year old females are the most vulnerable to poverty, with 5,014 males (29.9%) and 6,115 females (36.1%) in their respective age groups living below the poverty level.
| Age Bracket | Male | Female |
| Under 5 Years | 1,478 (17.0%) | 1,285 (16.1%) |
| 5 Years | 218 (12.6%) | 164 (13.6%) |
| 6 to 11 Years | 1,164 (11.4%) | 1,341 (13.4%) |
| 12 to 14 Years | 665 (12.0%) | 736 (14.0%) |
| 15 Years | 380 (21.7%) | 104 (6.7%) |
| 16 and 17 Years | 417 (11.7%) | 465 (14.0%) |
| 18 to 24 Years | 5,014 (29.9%) | 6,115 (36.1%) |
| 25 to 34 Years | 2,637 (12.7%) | 2,930 (14.3%) |
| 35 to 44 Years | 2,082 (11.5%) | 2,380 (13.4%) |
| 45 to 54 Years | 1,972 (12.1%) | 1,527 (9.3%) |
| 55 to 64 Years | 2,069 (12.4%) | 2,173 (12.0%) |
| 65 to 74 Years | 1,093 (8.6%) | 1,689 (11.0%) |
| 75 Years and over | 707 (8.6%) | 1,182 (9.8%) |
| Total | 19,896 (14.1%) | 22,091 (15.1%) |
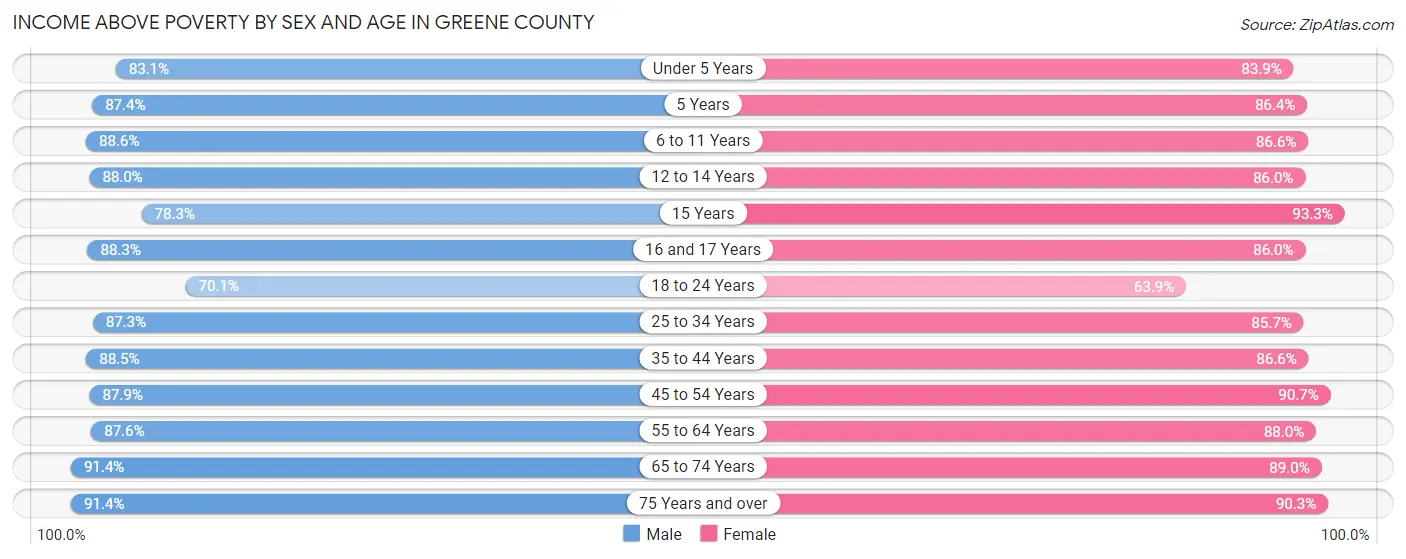
Income Above Poverty by Sex and Age in Greene County
According to the poverty statistics in Greene County, males aged 65 to 74 years and females aged 15 years are the age groups that are most secure financially, with 91.4% of males and 93.3% of females in these age groups living above the poverty line.
| Age Bracket | Male | Female |
| Under 5 Years | 7,243 (83.1%) | 6,676 (83.9%) |
| 5 Years | 1,517 (87.4%) | 1,040 (86.4%) |
| 6 to 11 Years | 9,028 (88.6%) | 8,639 (86.6%) |
| 12 to 14 Years | 4,856 (88.0%) | 4,525 (86.0%) |
| 15 Years | 1,369 (78.3%) | 1,455 (93.3%) |
| 16 and 17 Years | 3,149 (88.3%) | 2,864 (86.0%) |
| 18 to 24 Years | 11,754 (70.1%) | 10,823 (63.9%) |
| 25 to 34 Years | 18,189 (87.3%) | 17,587 (85.7%) |
| 35 to 44 Years | 16,088 (88.5%) | 15,434 (86.6%) |
| 45 to 54 Years | 14,378 (87.9%) | 14,934 (90.7%) |
| 55 to 64 Years | 14,630 (87.6%) | 15,956 (88.0%) |
| 65 to 74 Years | 11,606 (91.4%) | 13,712 (89.0%) |
| 75 Years and over | 7,473 (91.4%) | 10,939 (90.2%) |
| Total | 121,280 (85.9%) | 124,584 (84.9%) |
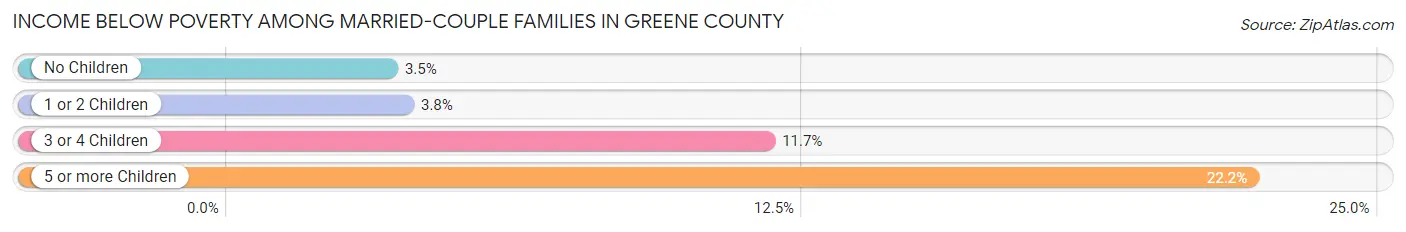
Income Below Poverty Among Married-Couple Families in Greene County
The poverty statistics for married-couple families in Greene County show that 4.4% or 2,488 of the total 57,053 families live below the poverty line. Families with 5 or more children have the highest poverty rate of 22.2%, comprising of 78 families. On the other hand, families with no children have the lowest poverty rate of 3.5%, which includes 1,241 families.
| Children | Above Poverty | Below Poverty |
| No Children | 34,388 (96.5%) | 1,241 (3.5%) |
| 1 or 2 Children | 15,831 (96.2%) | 630 (3.8%) |
| 3 or 4 Children | 4,073 (88.3%) | 539 (11.7%) |
| 5 or more Children | 273 (77.8%) | 78 (22.2%) |
| Total | 54,565 (95.6%) | 2,488 (4.4%) |
Income Below Poverty Among Single-Parent Households in Greene County
According to the poverty data in Greene County, 17.0% or 973 single-father households and 24.1% or 2,861 single-mother households are living below the poverty line. Among single-father households, those with 3 or 4 children have the highest poverty rate, with 129 households (50.6%) experiencing poverty. Likewise, among single-mother households, those with 5 or more children have the highest poverty rate, with 51 households (65.4%) falling below the poverty line.
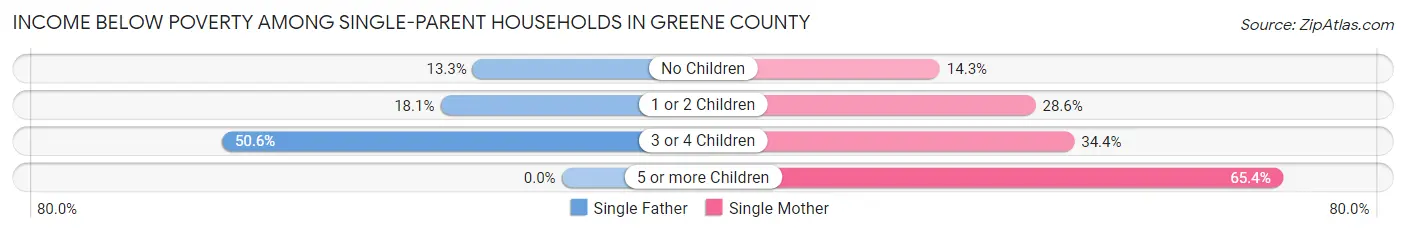
| Children | Single Father | Single Mother |
| No Children | 387 (13.3%) | 624 (14.3%) |
| 1 or 2 Children | 457 (18.1%) | 1,806 (28.6%) |
| 3 or 4 Children | 129 (50.6%) | 380 (34.4%) |
| 5 or more Children | 0 (0.0%) | 51 (65.4%) |
| Total | 973 (17.0%) | 2,861 (24.1%) |
Income Below Poverty Among Married-Couple vs Single-Parent Households in Greene County
The poverty data for Greene County shows that 2,488 of the married-couple family households (4.4%) and 3,834 of the single-parent households (21.8%) are living below the poverty level. Within the married-couple family households, those with 5 or more children have the highest poverty rate, with 78 households (22.2%) falling below the poverty line. Among the single-parent households, those with 5 or more children have the highest poverty rate, with 51 household (55.4%) living below poverty.
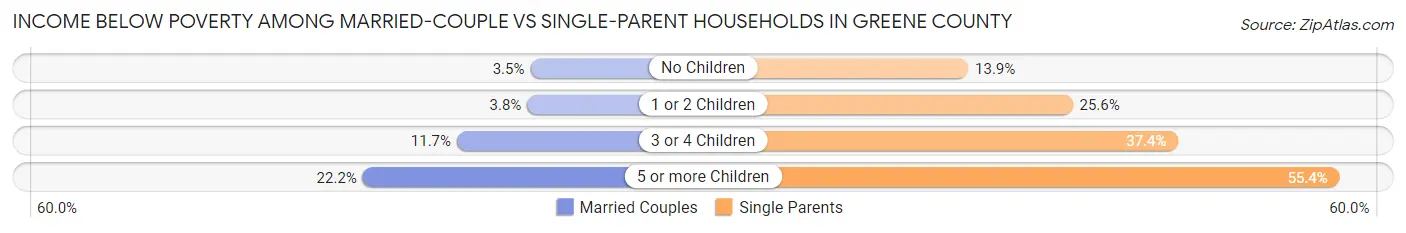
| Children | Married-Couple Families | Single-Parent Households |
| No Children | 1,241 (3.5%) | 1,011 (13.9%) |
| 1 or 2 Children | 630 (3.8%) | 2,263 (25.6%) |
| 3 or 4 Children | 539 (11.7%) | 509 (37.4%) |
| 5 or more Children | 78 (22.2%) | 51 (55.4%) |
| Total | 2,488 (4.4%) | 3,834 (21.8%) |
Race in Greene County
The most populous races in Greene County are White / Caucasian (262,675 | 87.8%), Two or more Races (16,127 | 5.4%), and Hispanic or Latino (12,382 | 4.1%).
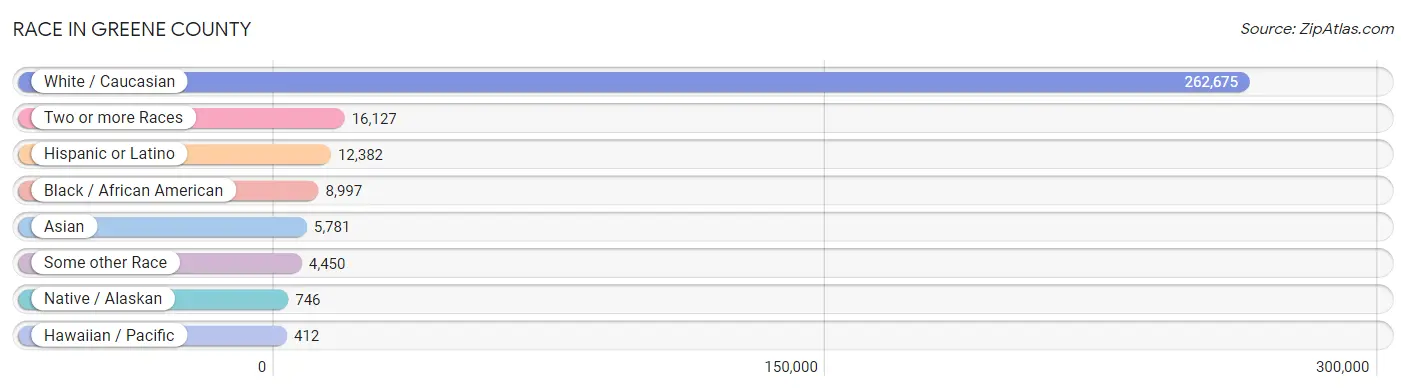
| Race | # Population | % Population |
| Asian | 5,781 | 1.9% |
| Black / African American | 8,997 | 3.0% |
| Hawaiian / Pacific | 412 | 0.1% |
| Hispanic or Latino | 12,382 | 4.1% |
| Native / Alaskan | 746 | 0.3% |
| White / Caucasian | 262,675 | 87.8% |
| Two or more Races | 16,127 | 5.4% |
| Some other Race | 4,450 | 1.5% |
| Total | 299,188 | 100.0% |
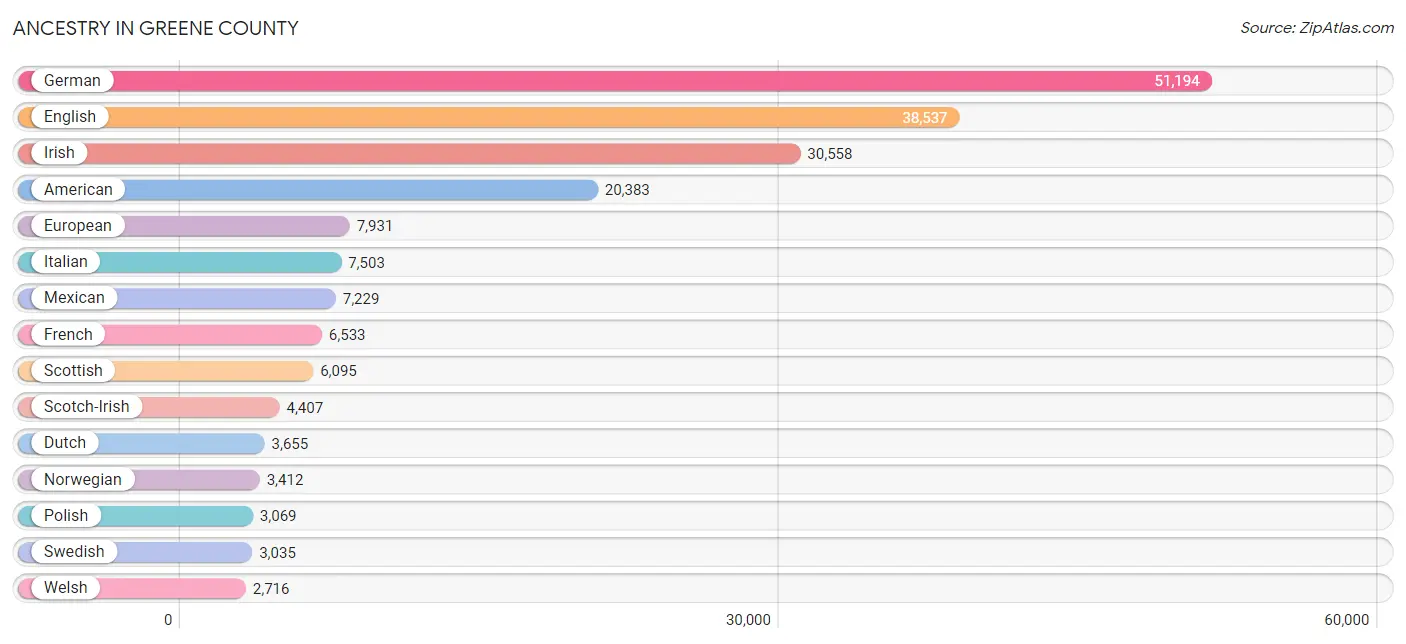
Ancestry in Greene County
The most populous ancestries reported in Greene County are German (51,194 | 17.1%), English (38,537 | 12.9%), Irish (30,558 | 10.2%), American (20,383 | 6.8%), and European (7,931 | 2.6%), together accounting for 49.7% of all Greene County residents.
| Ancestry | # Population | % Population |
| African | 1,169 | 0.4% |
| Albanian | 33 | 0.0% |
| Alsatian | 44 | 0.0% |
| American | 20,383 | 6.8% |
| Apache | 74 | 0.0% |
| Arab | 1,223 | 0.4% |
| Arapaho | 8 | 0.0% |
| Argentinean | 72 | 0.0% |
| Armenian | 59 | 0.0% |
| Australian | 51 | 0.0% |
| Austrian | 612 | 0.2% |
| Bahamian | 12 | 0.0% |
| Bangladeshi | 302 | 0.1% |
| Belgian | 138 | 0.1% |
| Bhutanese | 554 | 0.2% |
| Blackfeet | 366 | 0.1% |
| Bolivian | 10 | 0.0% |
| Brazilian | 39 | 0.0% |
| British | 1,530 | 0.5% |
| Bulgarian | 281 | 0.1% |
| Burmese | 1,336 | 0.4% |
| Cajun | 8 | 0.0% |
| Canadian | 281 | 0.1% |
| Celtic | 38 | 0.0% |
| Central American | 1,288 | 0.4% |
| Central American Indian | 17 | 0.0% |
| Cherokee | 2,139 | 0.7% |
| Cheyenne | 2 | 0.0% |
| Chickasaw | 43 | 0.0% |
| Chilean | 50 | 0.0% |
| Chinese | 24 | 0.0% |
| Chippewa | 120 | 0.0% |
| Choctaw | 167 | 0.1% |
| Colombian | 123 | 0.0% |
| Comanche | 9 | 0.0% |
| Costa Rican | 287 | 0.1% |
| Cree | 38 | 0.0% |
| Creek | 122 | 0.0% |
| Croatian | 357 | 0.1% |
| Cuban | 195 | 0.1% |
| Czech | 1,044 | 0.4% |
| Czechoslovakian | 141 | 0.1% |
| Danish | 1,094 | 0.4% |
| Delaware | 9 | 0.0% |
| Dominican | 56 | 0.0% |
| Dutch | 3,655 | 1.2% |
| Dutch West Indian | 11 | 0.0% |
| Eastern European | 464 | 0.2% |
| Ecuadorian | 167 | 0.1% |
| Egyptian | 19 | 0.0% |
| English | 38,537 | 12.9% |
| Estonian | 4 | 0.0% |
| Ethiopian | 171 | 0.1% |
| European | 7,931 | 2.6% |
| Finnish | 242 | 0.1% |
| French | 6,533 | 2.2% |
| French Canadian | 601 | 0.2% |
| German | 51,194 | 17.1% |
| German Russian | 16 | 0.0% |
| Ghanaian | 55 | 0.0% |
| Greek | 491 | 0.2% |
| Guamanian / Chamorro | 26 | 0.0% |
| Guatemalan | 217 | 0.1% |
| Haitian | 70 | 0.0% |
| Honduran | 213 | 0.1% |
| Hopi | 4 | 0.0% |
| Hungarian | 552 | 0.2% |
| Icelander | 19 | 0.0% |
| Indian (Asian) | 1,763 | 0.6% |
| Inupiat | 11 | 0.0% |
| Iranian | 16 | 0.0% |
| Iraqi | 12 | 0.0% |
| Irish | 30,558 | 10.2% |
| Iroquois | 154 | 0.1% |
| Israeli | 77 | 0.0% |
| Italian | 7,503 | 2.5% |
| Jamaican | 156 | 0.1% |
| Japanese | 324 | 0.1% |
| Kenyan | 202 | 0.1% |
| Kiowa | 8 | 0.0% |
| Korean | 1,559 | 0.5% |
| Latvian | 65 | 0.0% |
| Lebanese | 642 | 0.2% |
| Lithuanian | 137 | 0.1% |
| Luxembourger | 48 | 0.0% |
| Malaysian | 12 | 0.0% |
| Marshallese | 75 | 0.0% |
| Mexican | 7,229 | 2.4% |
| Mexican American Indian | 53 | 0.0% |
| Moroccan | 9 | 0.0% |
| Native Hawaiian | 222 | 0.1% |
| Navajo | 114 | 0.0% |
| New Zealander | 47 | 0.0% |
| Nicaraguan | 123 | 0.0% |
| Nigerian | 159 | 0.1% |
| Northern European | 637 | 0.2% |
| Norwegian | 3,412 | 1.1% |
| Osage | 178 | 0.1% |
| Ottawa | 43 | 0.0% |
| Pakistani | 309 | 0.1% |
| Panamanian | 81 | 0.0% |
| Pennsylvania German | 62 | 0.0% |
| Peruvian | 54 | 0.0% |
| Polish | 3,069 | 1.0% |
| Portuguese | 346 | 0.1% |
| Potawatomi | 10 | 0.0% |
| Puerto Rican | 1,927 | 0.6% |
| Romanian | 1,155 | 0.4% |
| Russian | 887 | 0.3% |
| Salvadoran | 367 | 0.1% |
| Samoan | 465 | 0.2% |
| Scandinavian | 887 | 0.3% |
| Scotch-Irish | 4,407 | 1.5% |
| Scottish | 6,095 | 2.0% |
| Serbian | 31 | 0.0% |
| Sioux | 194 | 0.1% |
| Slavic | 102 | 0.0% |
| Slovak | 145 | 0.1% |
| Slovene | 7 | 0.0% |
| South African | 52 | 0.0% |
| South American | 527 | 0.2% |
| South American Indian | 6 | 0.0% |
| Spaniard | 272 | 0.1% |
| Spanish | 105 | 0.0% |
| Sri Lankan | 1,152 | 0.4% |
| Subsaharan African | 1,972 | 0.7% |
| Swedish | 3,035 | 1.0% |
| Swiss | 515 | 0.2% |
| Syrian | 63 | 0.0% |
| Thai | 831 | 0.3% |
| Turkish | 19 | 0.0% |
| Ugandan | 9 | 0.0% |
| Ukrainian | 631 | 0.2% |
| Ute | 38 | 0.0% |
| Venezuelan | 51 | 0.0% |
| Vietnamese | 18 | 0.0% |
| Welsh | 2,716 | 0.9% |
| Yugoslavian | 93 | 0.0% | View All 138 Rows |
Immigrants in Greene County
The most numerous immigrant groups reported in Greene County came from Asia (4,477 | 1.5%), Latin America (2,441 | 0.8%), Europe (1,949 | 0.6%), Central America (1,931 | 0.6%), and South Eastern Asia (1,870 | 0.6%), together accounting for 4.2% of all Greene County residents.
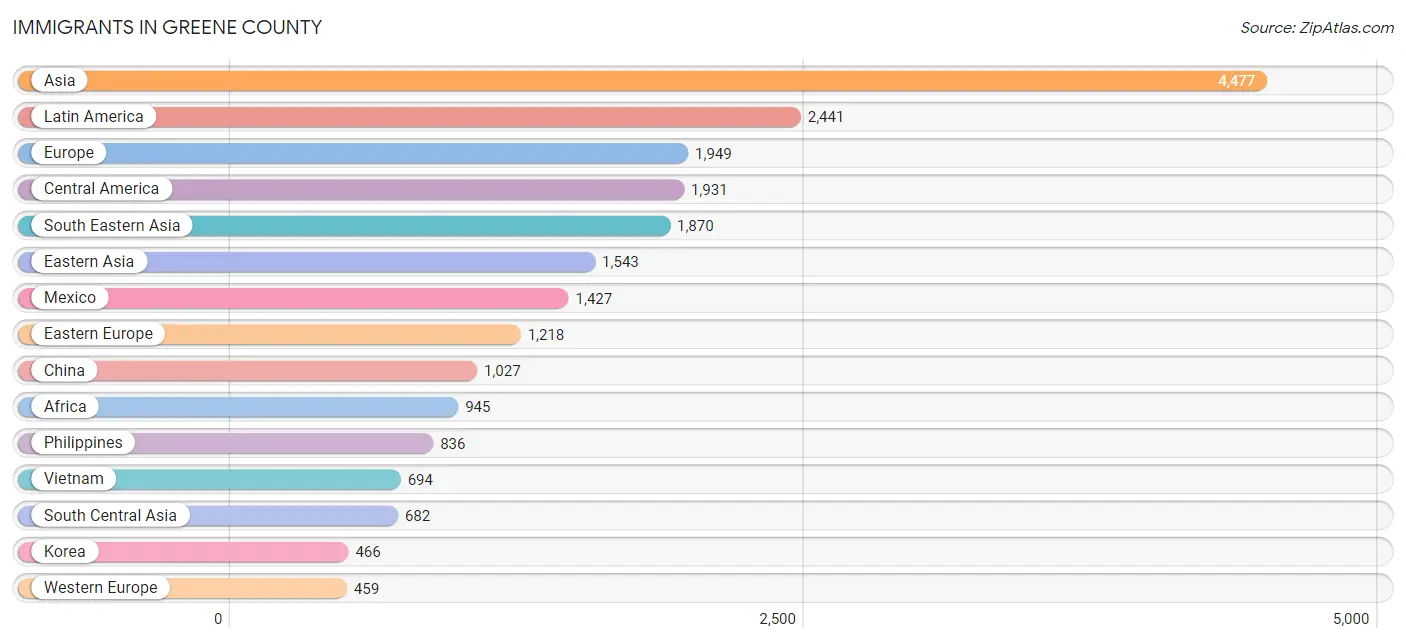
| Immigration Origin | # Population | % Population |
| Africa | 945 | 0.3% |
| Argentina | 72 | 0.0% |
| Asia | 4,477 | 1.5% |
| Australia | 51 | 0.0% |
| Bangladesh | 48 | 0.0% |
| Bolivia | 10 | 0.0% |
| Brazil | 27 | 0.0% |
| Bulgaria | 88 | 0.0% |
| Cambodia | 88 | 0.0% |
| Canada | 210 | 0.1% |
| Caribbean | 175 | 0.1% |
| Central America | 1,931 | 0.6% |
| China | 1,027 | 0.3% |
| Colombia | 39 | 0.0% |
| Costa Rica | 67 | 0.0% |
| Cuba | 81 | 0.0% |
| Dominican Republic | 14 | 0.0% |
| Eastern Africa | 375 | 0.1% |
| Eastern Asia | 1,543 | 0.5% |
| Eastern Europe | 1,218 | 0.4% |
| Ecuador | 85 | 0.0% |
| Egypt | 35 | 0.0% |
| El Salvador | 114 | 0.0% |
| England | 79 | 0.0% |
| Eritrea | 8 | 0.0% |
| Ethiopia | 41 | 0.0% |
| Europe | 1,949 | 0.6% |
| France | 13 | 0.0% |
| Germany | 408 | 0.1% |
| Ghana | 55 | 0.0% |
| Guatemala | 142 | 0.1% |
| Haiti | 19 | 0.0% |
| Honduras | 158 | 0.1% |
| Hong Kong | 13 | 0.0% |
| Hungary | 51 | 0.0% |
| India | 454 | 0.2% |
| Iran | 4 | 0.0% |
| Iraq | 25 | 0.0% |
| Ireland | 13 | 0.0% |
| Israel | 13 | 0.0% |
| Italy | 38 | 0.0% |
| Jamaica | 61 | 0.0% |
| Japan | 50 | 0.0% |
| Kazakhstan | 33 | 0.0% |
| Kenya | 226 | 0.1% |
| Korea | 466 | 0.2% |
| Kuwait | 111 | 0.0% |
| Laos | 47 | 0.0% |
| Latin America | 2,441 | 0.8% |
| Malaysia | 5 | 0.0% |
| Mexico | 1,427 | 0.5% |
| Middle Africa | 131 | 0.0% |
| Moldova | 29 | 0.0% |
| Nepal | 37 | 0.0% |
| Netherlands | 13 | 0.0% |
| Nicaragua | 23 | 0.0% |
| Nigeria | 206 | 0.1% |
| Northern Africa | 52 | 0.0% |
| Northern Europe | 223 | 0.1% |
| Oceania | 109 | 0.0% |
| Pakistan | 30 | 0.0% |
| Peru | 54 | 0.0% |
| Philippines | 836 | 0.3% |
| Poland | 14 | 0.0% |
| Romania | 442 | 0.2% |
| Russia | 206 | 0.1% |
| Saudi Arabia | 199 | 0.1% |
| Scotland | 19 | 0.0% |
| South Africa | 62 | 0.0% |
| South America | 335 | 0.1% |
| South Central Asia | 682 | 0.2% |
| South Eastern Asia | 1,870 | 0.6% |
| Southern Europe | 49 | 0.0% |
| Spain | 11 | 0.0% |
| Sri Lanka | 41 | 0.0% |
| Sweden | 12 | 0.0% |
| Switzerland | 25 | 0.0% |
| Taiwan | 118 | 0.0% |
| Thailand | 200 | 0.1% |
| Uganda | 42 | 0.0% |
| Ukraine | 384 | 0.1% |
| Venezuela | 34 | 0.0% |
| Vietnam | 694 | 0.2% |
| Western Africa | 270 | 0.1% |
| Western Asia | 348 | 0.1% |
| Western Europe | 459 | 0.2% |
| Zaire | 131 | 0.0% |
| Zimbabwe | 37 | 0.0% | View All 88 Rows |
Sex and Age in Greene County
Sex and Age in Greene County
The most populous age groups in Greene County are 20 to 24 Years (15,240 | 10.4%) for men and 20 to 24 Years (15,660 | 10.3%) for women.
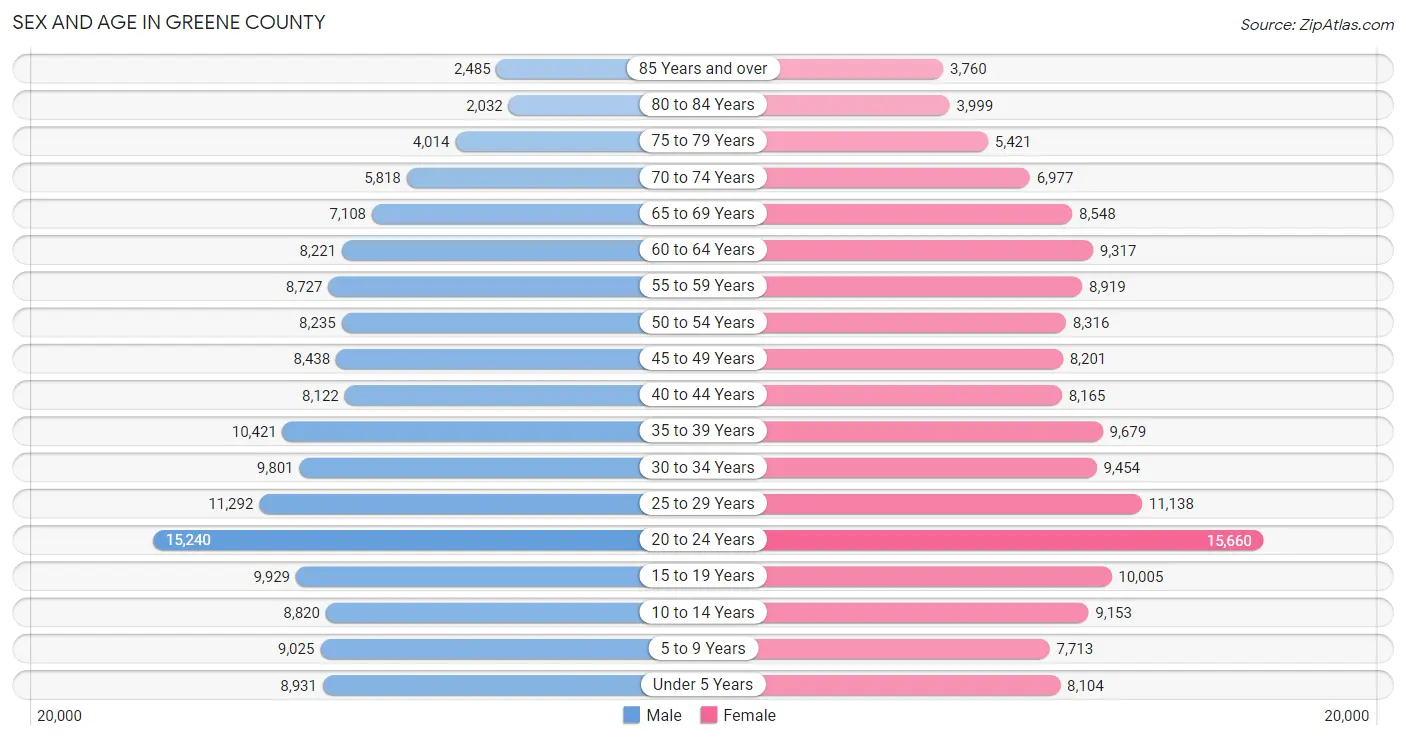
| Age Bracket | Male | Female |
| Under 5 Years | 8,931 (6.1%) | 8,104 (5.3%) |
| 5 to 9 Years | 9,025 (6.1%) | 7,713 (5.1%) |
| 10 to 14 Years | 8,820 (6.0%) | 9,153 (6.0%) |
| 15 to 19 Years | 9,929 (6.8%) | 10,005 (6.6%) |
| 20 to 24 Years | 15,240 (10.4%) | 15,660 (10.3%) |
| 25 to 29 Years | 11,292 (7.7%) | 11,138 (7.3%) |
| 30 to 34 Years | 9,801 (6.7%) | 9,454 (6.2%) |
| 35 to 39 Years | 10,421 (7.1%) | 9,679 (6.4%) |
| 40 to 44 Years | 8,122 (5.5%) | 8,165 (5.3%) |
| 45 to 49 Years | 8,438 (5.8%) | 8,201 (5.4%) |
| 50 to 54 Years | 8,235 (5.6%) | 8,316 (5.4%) |
| 55 to 59 Years | 8,727 (5.9%) | 8,919 (5.9%) |
| 60 to 64 Years | 8,221 (5.6%) | 9,317 (6.1%) |
| 65 to 69 Years | 7,108 (4.9%) | 8,548 (5.6%) |
| 70 to 74 Years | 5,818 (4.0%) | 6,977 (4.6%) |
| 75 to 79 Years | 4,014 (2.7%) | 5,421 (3.5%) |
| 80 to 84 Years | 2,032 (1.4%) | 3,999 (2.6%) |
| 85 Years and over | 2,485 (1.7%) | 3,760 (2.5%) |
| Total | 146,659 (100.0%) | 152,529 (100.0%) |
Families and Households in Greene County
Median Family Size in Greene County
The median family size in Greene County is 2.83 persons per family, with married-couple families (57,053 | 76.5%) accounting for the largest median family size of 2.92 persons per family. On the other hand, single male/father families (5,718 | 7.7%) represent the smallest median family size with 2.41 persons per family.
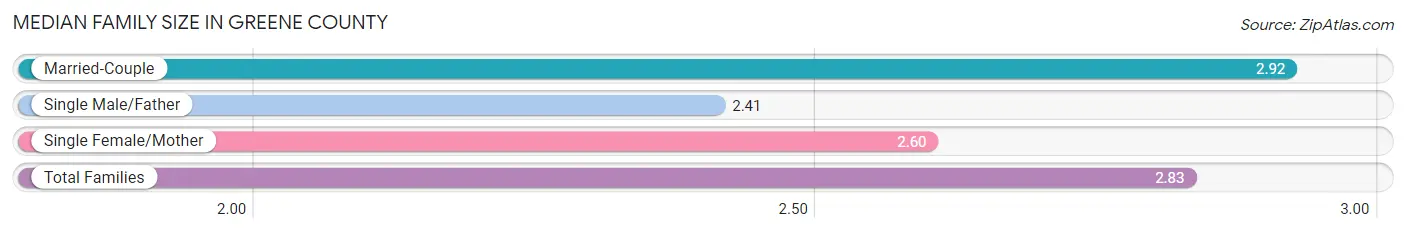
| Family Type | # Families | Family Size |
| Married-Couple | 57,053 (76.5%) | 2.92 |
| Single Male/Father | 5,718 (7.7%) | 2.41 |
| Single Female/Mother | 11,851 (15.9%) | 2.60 |
| Total Families | 74,622 (100.0%) | 2.83 |
Median Household Size in Greene County
The median household size in Greene County is 2.20 persons per household, with married-couple households (57,053 | 43.5%) accounting for the largest median household size of 2.94 persons per household. non-family households (56,487 | 43.1%) represent the smallest median household size with 1.26 persons per household.
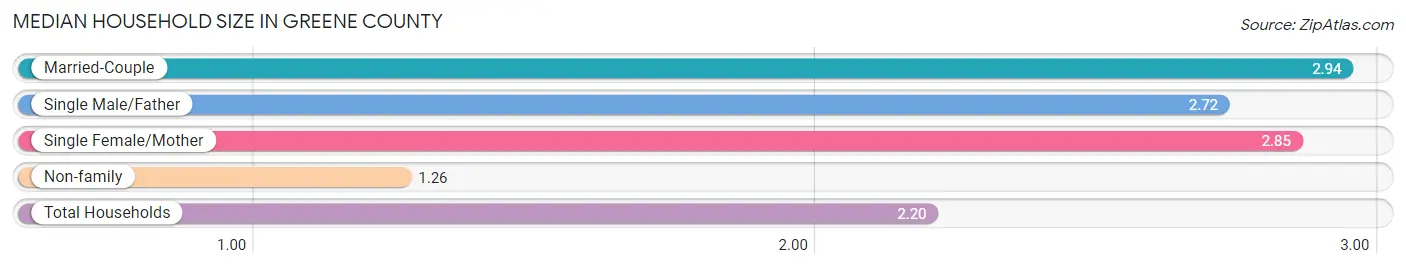
| Household Type | # Households | Household Size |
| Married-Couple | 57,053 (43.5%) | 2.94 |
| Single Male/Father | 5,718 (4.4%) | 2.72 |
| Single Female/Mother | 11,851 (9.0%) | 2.85 |
| Non-family | 56,487 (43.1%) | 1.26 |
| Total Households | 131,109 (100.0%) | 2.20 |
Household Size by Marriage Status in Greene County
Out of a total of 131,109 households in Greene County, 74,622 (56.9%) are family households, while 56,487 (43.1%) are nonfamily households. The most numerous type of family households are 2-person households, comprising 38,090, and the most common type of nonfamily households are 1-person households, comprising 43,555.
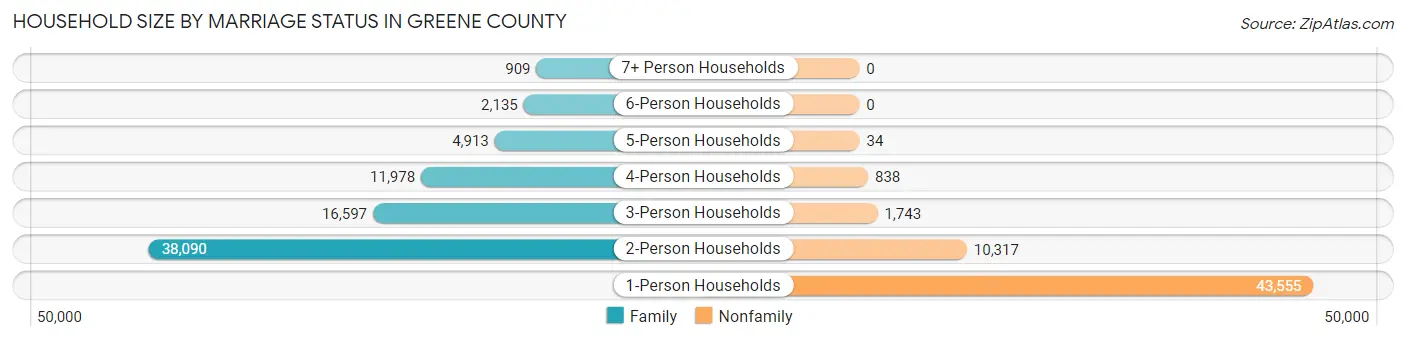
| Household Size | Family Households | Nonfamily Households |
| 1-Person Households | - | 43,555 (33.2%) |
| 2-Person Households | 38,090 (29.0%) | 10,317 (7.9%) |
| 3-Person Households | 16,597 (12.7%) | 1,743 (1.3%) |
| 4-Person Households | 11,978 (9.1%) | 838 (0.6%) |
| 5-Person Households | 4,913 (3.7%) | 34 (0.0%) |
| 6-Person Households | 2,135 (1.6%) | 0 (0.0%) |
| 7+ Person Households | 909 (0.7%) | 0 (0.0%) |
| Total | 74,622 (56.9%) | 56,487 (43.1%) |
Female Fertility in Greene County
Fertility by Age in Greene County
Average fertility rate in Greene County is 56.0 births per 1,000 women. Women in the age bracket of 20 to 34 years have the highest fertility rate with 88.0 births per 1,000 women. Women in the age bracket of 20 to 34 years acount for 77.4% of all women with births.
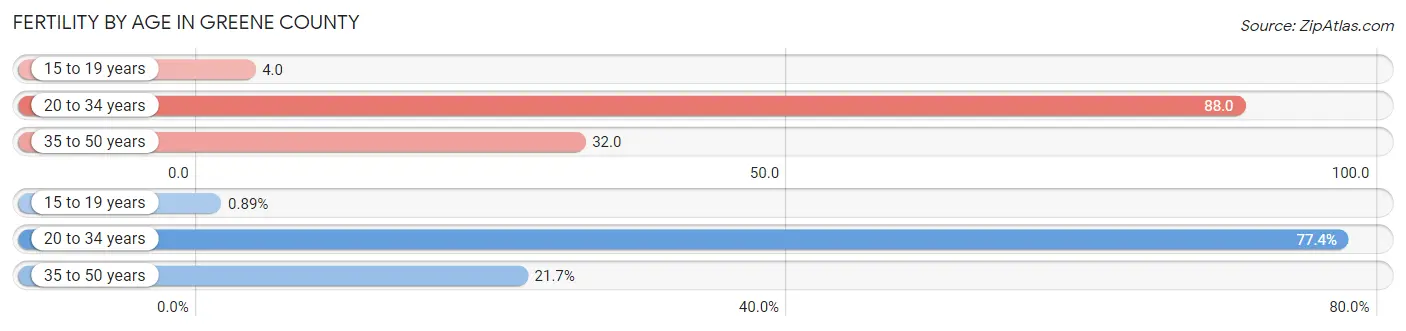
| Age Bracket | Women with Births | Births / 1,000 Women |
| 15 to 19 years | 37 (0.9%) | 4.0 |
| 20 to 34 years | 3,201 (77.4%) | 88.0 |
| 35 to 50 years | 897 (21.7%) | 32.0 |
| Total | 4,135 (100.0%) | 56.0 |
Fertility by Age by Marriage Status in Greene County
68.4% of women with births (4,135) in Greene County are married. The highest percentage of unmarried women with births falls into 15 to 19 years age bracket with 94.6% of them unmarried at the time of birth, while the lowest percentage of unmarried women with births belong to 35 to 50 years age bracket with 14.4% of them unmarried.
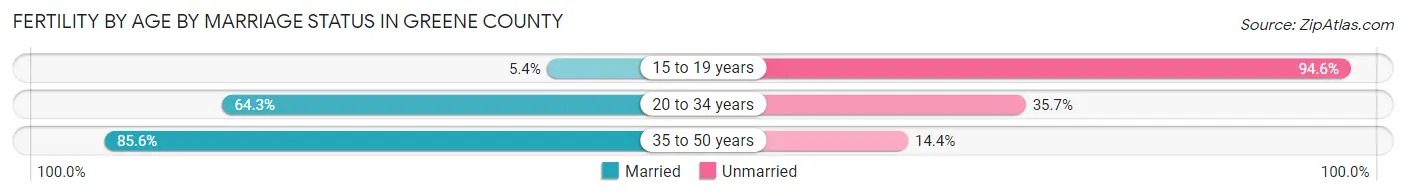
| Age Bracket | Married | Unmarried |
| 15 to 19 years | 2 (5.4%) | 35 (94.6%) |
| 20 to 34 years | 2,058 (64.3%) | 1,143 (35.7%) |
| 35 to 50 years | 768 (85.6%) | 129 (14.4%) |
| Total | 2,828 (68.4%) | 1,307 (31.6%) |
Fertility by Education in Greene County
Average fertility rate in Greene County is 56.0 births per 1,000 women. Women with the education attainment of high school diploma have the highest fertility rate of 64.0 births per 1,000 women, while women with the education attainment of college or associate's degree have the lowest fertility at 47.0 births per 1,000 women. Women with the education attainment of college or associate's degree represent 32.9% of all women with births.
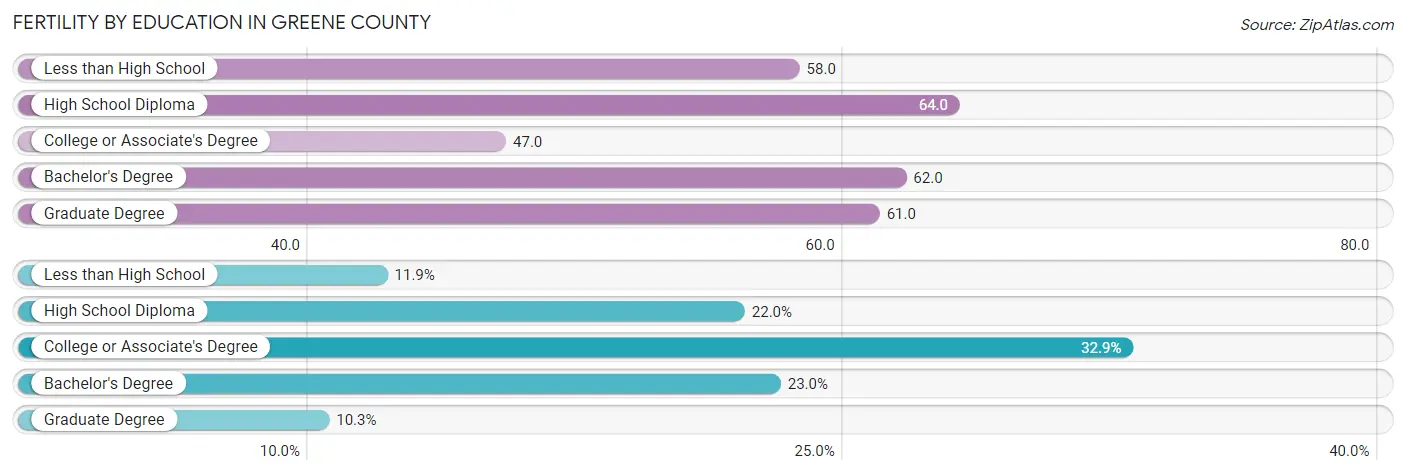
| Educational Attainment | Women with Births | Births / 1,000 Women |
| Less than High School | 493 (11.9%) | 58.0 |
| High School Diploma | 908 (22.0%) | 64.0 |
| College or Associate's Degree | 1,359 (32.9%) | 47.0 |
| Bachelor's Degree | 950 (23.0%) | 62.0 |
| Graduate Degree | 425 (10.3%) | 61.0 |
| Total | 4,135 (100.0%) | 56.0 |
Fertility by Education by Marriage Status in Greene County
31.6% of women with births in Greene County are unmarried. Women with the educational attainment of graduate degree are most likely to be married with 95.3% of them married at childbirth, while women with the educational attainment of less than high school are least likely to be married with 52.3% of them unmarried at childbirth.
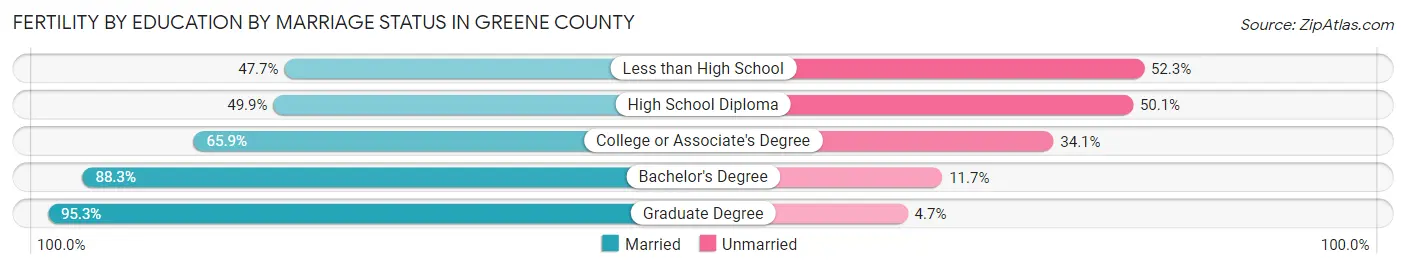
| Educational Attainment | Married | Unmarried |
| Less than High School | 235 (47.7%) | 258 (52.3%) |
| High School Diploma | 453 (49.9%) | 455 (50.1%) |
| College or Associate's Degree | 896 (65.9%) | 463 (34.1%) |
| Bachelor's Degree | 839 (88.3%) | 111 (11.7%) |
| Graduate Degree | 405 (95.3%) | 20 (4.7%) |
| Total | 2,828 (68.4%) | 1,307 (31.6%) |
Employment Characteristics in Greene County
Employment by Class of Employer in Greene County
Among the 142,571 employed individuals in Greene County, private company employees (97,129 | 68.1%), not-for-profit organizations (16,426 | 11.5%), and local government employees (8,486 | 5.9%) make up the most common classes of employment.
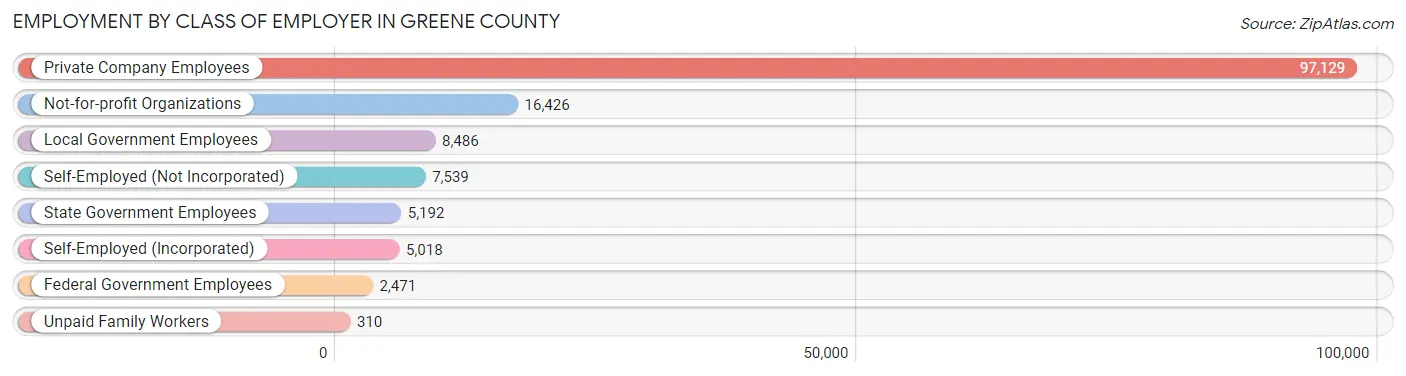
| Employer Class | # Employees | % Employees |
| Private Company Employees | 97,129 | 68.1% |
| Self-Employed (Incorporated) | 5,018 | 3.5% |
| Self-Employed (Not Incorporated) | 7,539 | 5.3% |
| Not-for-profit Organizations | 16,426 | 11.5% |
| Local Government Employees | 8,486 | 5.9% |
| State Government Employees | 5,192 | 3.6% |
| Federal Government Employees | 2,471 | 1.7% |
| Unpaid Family Workers | 310 | 0.2% |
| Total | 142,571 | 100.0% |
Employment Status by Age in Greene County
According to the labor force statistics for Greene County, out of the total population over 16 years of age (244,106), 62.0% or 151,346 individuals are in the labor force, with 3.9% or 5,902 of them unemployed. The age group with the highest labor force participation rate is 25 to 29 years, with 86.8% or 19,469 individuals in the labor force. Within the labor force, the 16 to 19 years age range has the highest percentage of unemployed individuals, with 11.4% or 753 of them being unemployed.
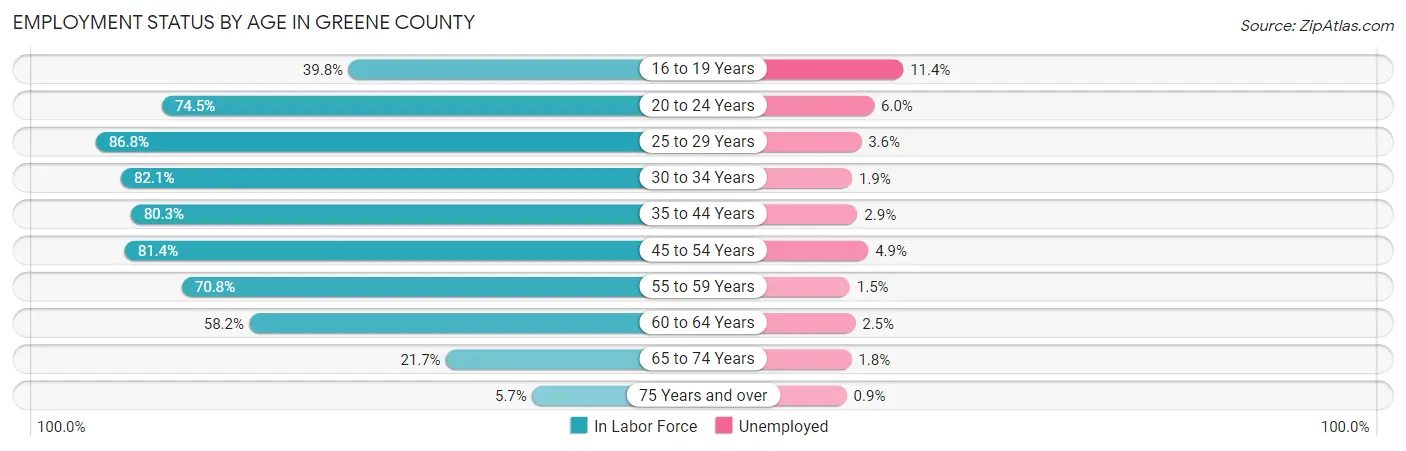
| Age Bracket | In Labor Force | Unemployed |
| 16 to 19 Years | 6,606 (39.8%) | 753 (11.4%) |
| 20 to 24 Years | 23,020 (74.5%) | 1,381 (6.0%) |
| 25 to 29 Years | 19,469 (86.8%) | 701 (3.6%) |
| 30 to 34 Years | 15,808 (82.1%) | 300 (1.9%) |
| 35 to 44 Years | 29,219 (80.3%) | 847 (2.9%) |
| 45 to 54 Years | 27,017 (81.4%) | 1,324 (4.9%) |
| 55 to 59 Years | 12,493 (70.8%) | 187 (1.5%) |
| 60 to 64 Years | 10,207 (58.2%) | 255 (2.5%) |
| 65 to 74 Years | 6,174 (21.7%) | 111 (1.8%) |
| 75 Years and over | 1,238 (5.7%) | 11 (0.9%) |
| Total | 151,346 (62.0%) | 5,902 (3.9%) |
Employment Status by Educational Attainment in Greene County
According to labor force statistics for Greene County, 78.0% of individuals (114,228) out of the total population between 25 and 64 years of age (146,446) are in the labor force, with 3.2% or 3,655 of them being unemployed. The group with the highest labor force participation rate are those with the educational attainment of bachelor's degree or higher, with 88.4% or 43,655 individuals in the labor force. Within the labor force, individuals with less than high school education have the highest percentage of unemployment, with 9.5% or 438 of them being unemployed.
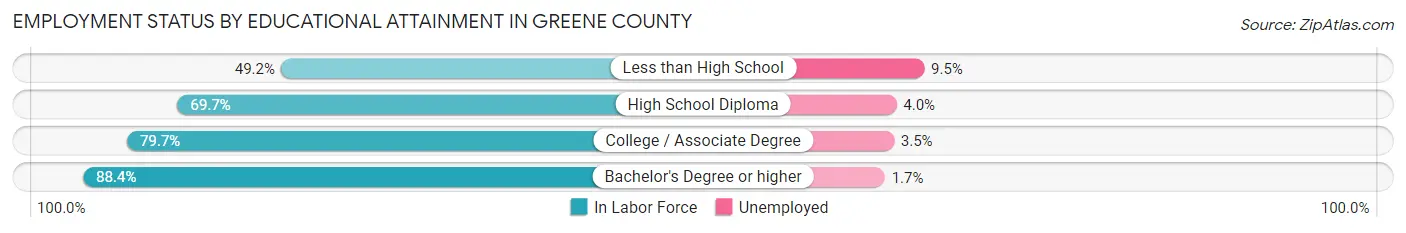
| Educational Attainment | In Labor Force | Unemployed |
| Less than High School | 4,614 (49.2%) | 891 (9.5%) |
| High School Diploma | 27,517 (69.7%) | 1,579 (4.0%) |
| College / Associate Degree | 38,419 (79.7%) | 1,687 (3.5%) |
| Bachelor's Degree or higher | 43,655 (88.4%) | 840 (1.7%) |
| Total | 114,228 (78.0%) | 4,686 (3.2%) |
Employment Occupations by Sex in Greene County
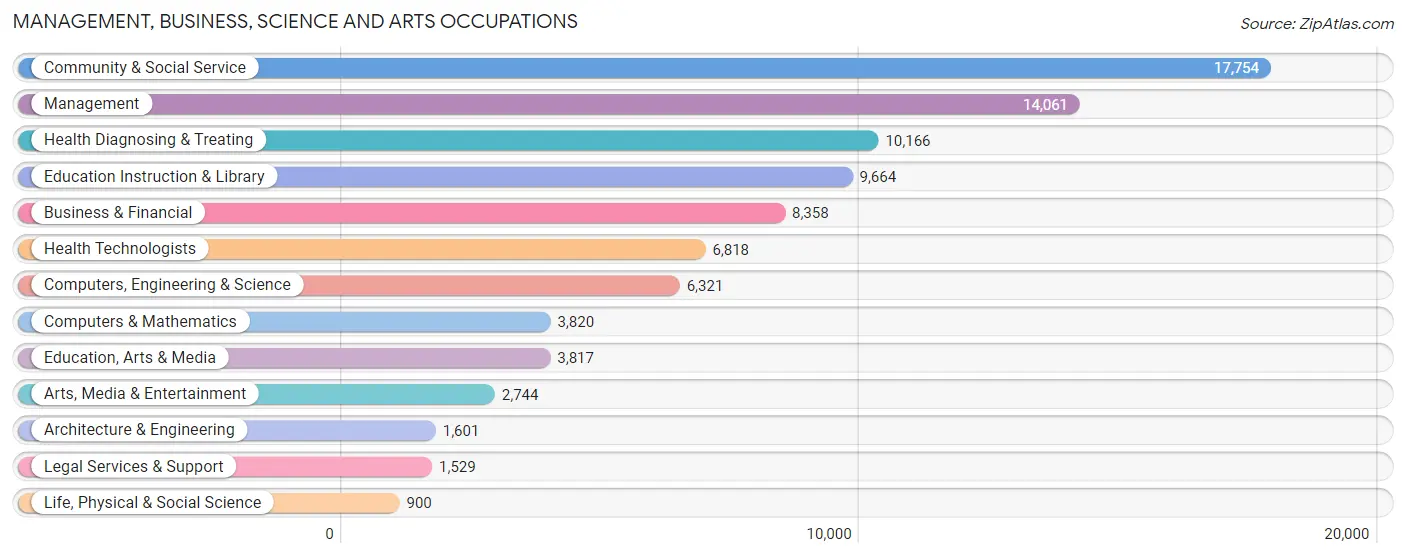
Management, Business, Science and Arts Occupations
The most common Management, Business, Science and Arts occupations in Greene County are Community & Social Service (17,754 | 12.2%), Management (14,061 | 9.7%), Health Diagnosing & Treating (10,166 | 7.0%), Education Instruction & Library (9,664 | 6.7%), and Business & Financial (8,358 | 5.8%).
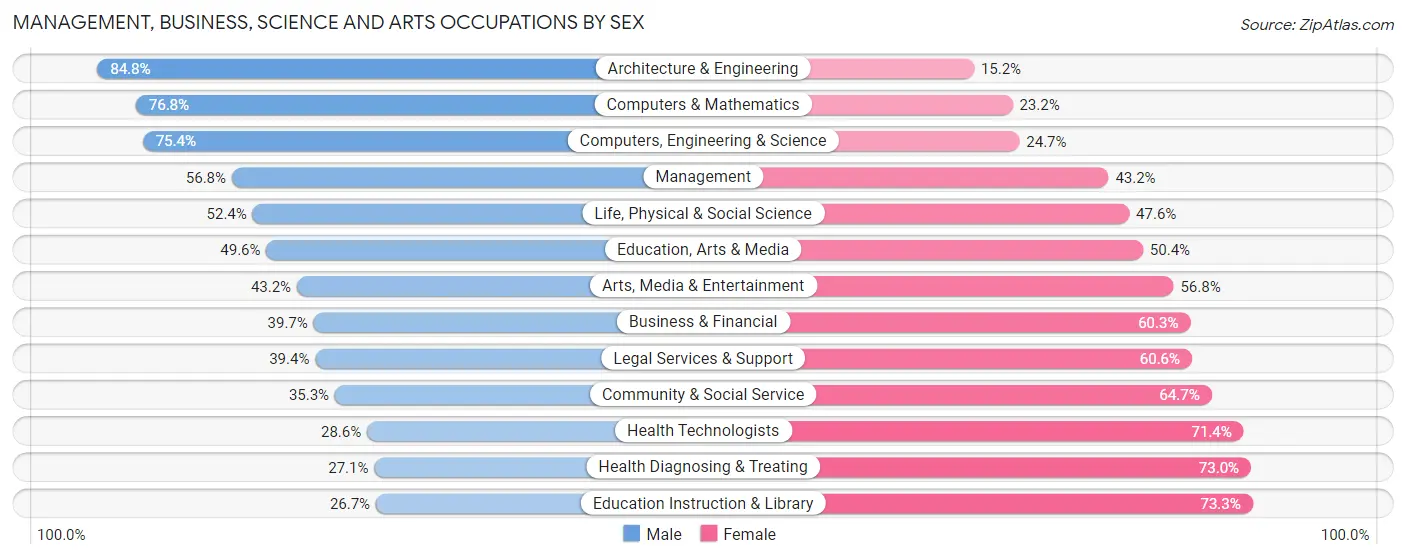
Management, Business, Science and Arts Occupations by Sex
Within the Management, Business, Science and Arts occupations in Greene County, the most male-oriented occupations are Architecture & Engineering (84.8%), Computers & Mathematics (76.8%), and Computers, Engineering & Science (75.3%), while the most female-oriented occupations are Education Instruction & Library (73.3%), Health Diagnosing & Treating (73.0%), and Health Technologists (71.4%).
| Occupation | Male | Female |
| Management | 7,981 (56.8%) | 6,080 (43.2%) |
| Business & Financial | 3,319 (39.7%) | 5,039 (60.3%) |
| Computers, Engineering & Science | 4,763 (75.3%) | 1,558 (24.6%) |
| Computers & Mathematics | 2,933 (76.8%) | 887 (23.2%) |
| Architecture & Engineering | 1,358 (84.8%) | 243 (15.2%) |
| Life, Physical & Social Science | 472 (52.4%) | 428 (47.6%) |
| Community & Social Service | 6,260 (35.3%) | 11,494 (64.7%) |
| Education, Arts & Media | 1,892 (49.6%) | 1,925 (50.4%) |
| Legal Services & Support | 602 (39.4%) | 927 (60.6%) |
| Education Instruction & Library | 2,581 (26.7%) | 7,083 (73.3%) |
| Arts, Media & Entertainment | 1,185 (43.2%) | 1,559 (56.8%) |
| Health Diagnosing & Treating | 2,750 (27.1%) | 7,416 (73.0%) |
| Health Technologists | 1,948 (28.6%) | 4,870 (71.4%) |
| Total (Category) | 25,073 (44.3%) | 31,587 (55.7%) |
| Total (Overall) | 75,156 (51.8%) | 69,926 (48.2%) |
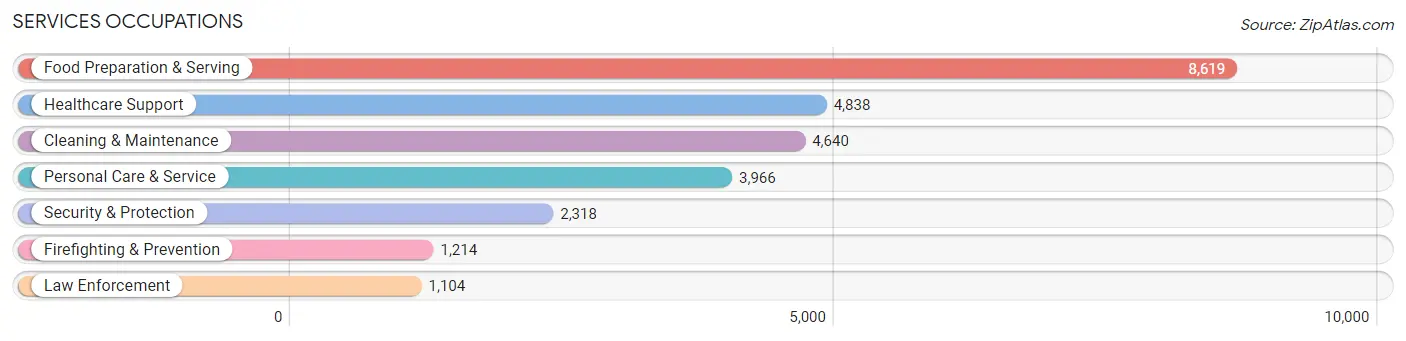
Services Occupations
The most common Services occupations in Greene County are Food Preparation & Serving (8,619 | 5.9%), Healthcare Support (4,838 | 3.3%), Cleaning & Maintenance (4,640 | 3.2%), Personal Care & Service (3,966 | 2.7%), and Security & Protection (2,318 | 1.6%).
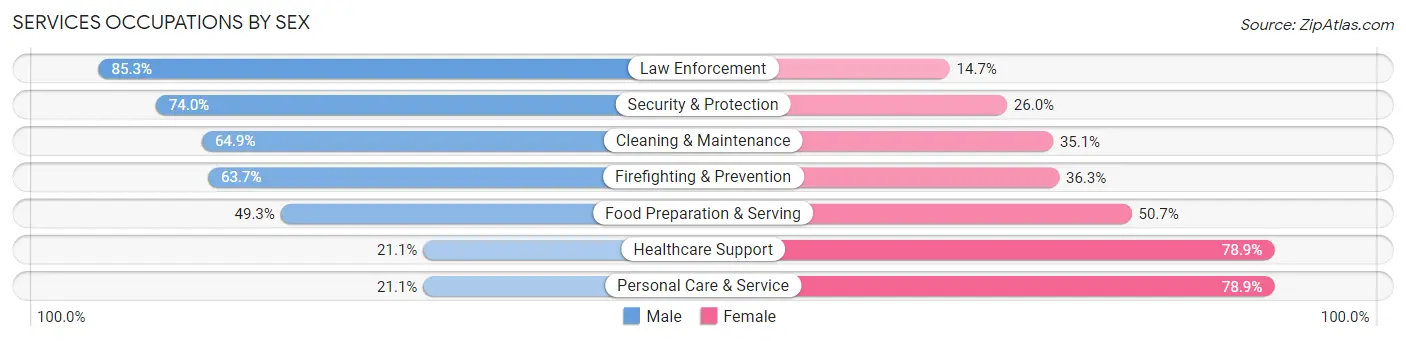
Services Occupations by Sex
Within the Services occupations in Greene County, the most male-oriented occupations are Law Enforcement (85.3%), Security & Protection (74.0%), and Cleaning & Maintenance (64.9%), while the most female-oriented occupations are Healthcare Support (78.9%), Personal Care & Service (78.9%), and Food Preparation & Serving (50.7%).
| Occupation | Male | Female |
| Healthcare Support | 1,020 (21.1%) | 3,818 (78.9%) |
| Security & Protection | 1,715 (74.0%) | 603 (26.0%) |
| Firefighting & Prevention | 773 (63.7%) | 441 (36.3%) |
| Law Enforcement | 942 (85.3%) | 162 (14.7%) |
| Food Preparation & Serving | 4,250 (49.3%) | 4,369 (50.7%) |
| Cleaning & Maintenance | 3,010 (64.9%) | 1,630 (35.1%) |
| Personal Care & Service | 836 (21.1%) | 3,130 (78.9%) |
| Total (Category) | 10,831 (44.4%) | 13,550 (55.6%) |
| Total (Overall) | 75,156 (51.8%) | 69,926 (48.2%) |
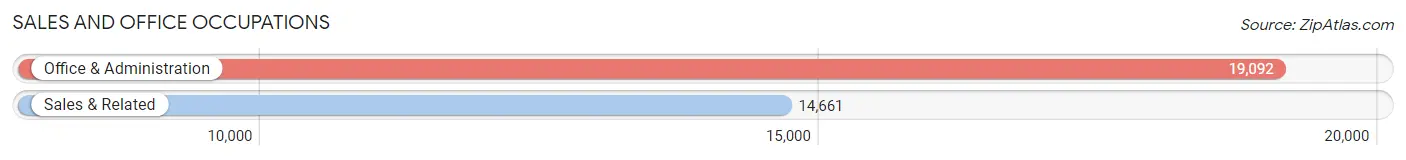
Sales and Office Occupations
The most common Sales and Office occupations in Greene County are Office & Administration (19,092 | 13.2%), and Sales & Related (14,661 | 10.1%).
Sales and Office Occupations by Sex
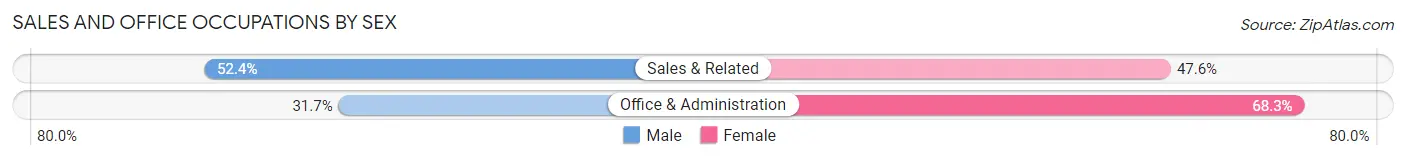
| Occupation | Male | Female |
| Sales & Related | 7,682 (52.4%) | 6,979 (47.6%) |
| Office & Administration | 6,055 (31.7%) | 13,037 (68.3%) |
| Total (Category) | 13,737 (40.7%) | 20,016 (59.3%) |
| Total (Overall) | 75,156 (51.8%) | 69,926 (48.2%) |
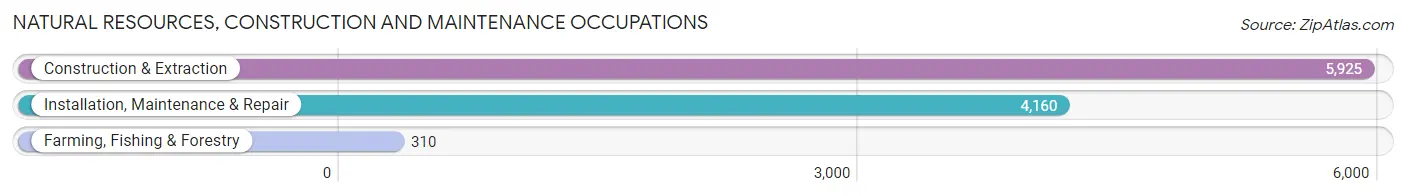
Natural Resources, Construction and Maintenance Occupations
The most common Natural Resources, Construction and Maintenance occupations in Greene County are Construction & Extraction (5,925 | 4.1%), Installation, Maintenance & Repair (4,160 | 2.9%), and Farming, Fishing & Forestry (310 | 0.2%).
Natural Resources, Construction and Maintenance Occupations by Sex
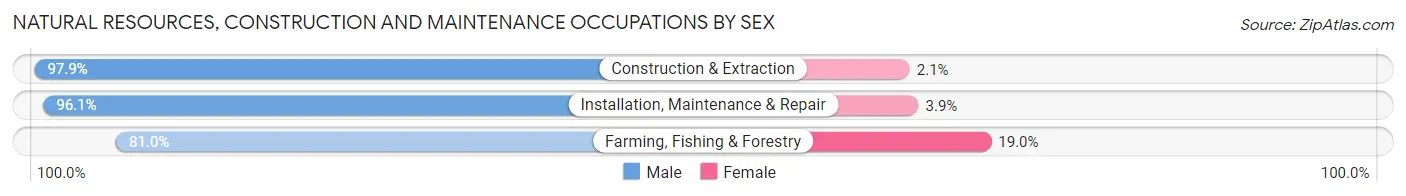
| Occupation | Male | Female |
| Farming, Fishing & Forestry | 251 (81.0%) | 59 (19.0%) |
| Construction & Extraction | 5,803 (97.9%) | 122 (2.1%) |
| Installation, Maintenance & Repair | 3,998 (96.1%) | 162 (3.9%) |
| Total (Category) | 10,052 (96.7%) | 343 (3.3%) |
| Total (Overall) | 75,156 (51.8%) | 69,926 (48.2%) |
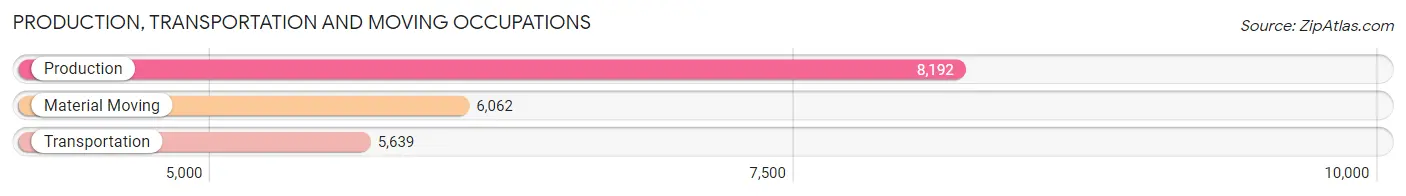
Production, Transportation and Moving Occupations
The most common Production, Transportation and Moving occupations in Greene County are Production (8,192 | 5.7%), Material Moving (6,062 | 4.2%), and Transportation (5,639 | 3.9%).
Production, Transportation and Moving Occupations by Sex
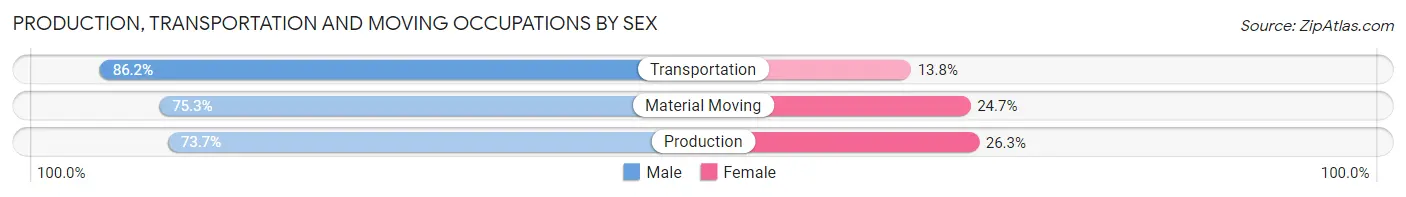
| Occupation | Male | Female |
| Production | 6,038 (73.7%) | 2,154 (26.3%) |
| Transportation | 4,861 (86.2%) | 778 (13.8%) |
| Material Moving | 4,564 (75.3%) | 1,498 (24.7%) |
| Total (Category) | 15,463 (77.7%) | 4,430 (22.3%) |
| Total (Overall) | 75,156 (51.8%) | 69,926 (48.2%) |
Employment Industries by Sex in Greene County
Employment Industries in Greene County
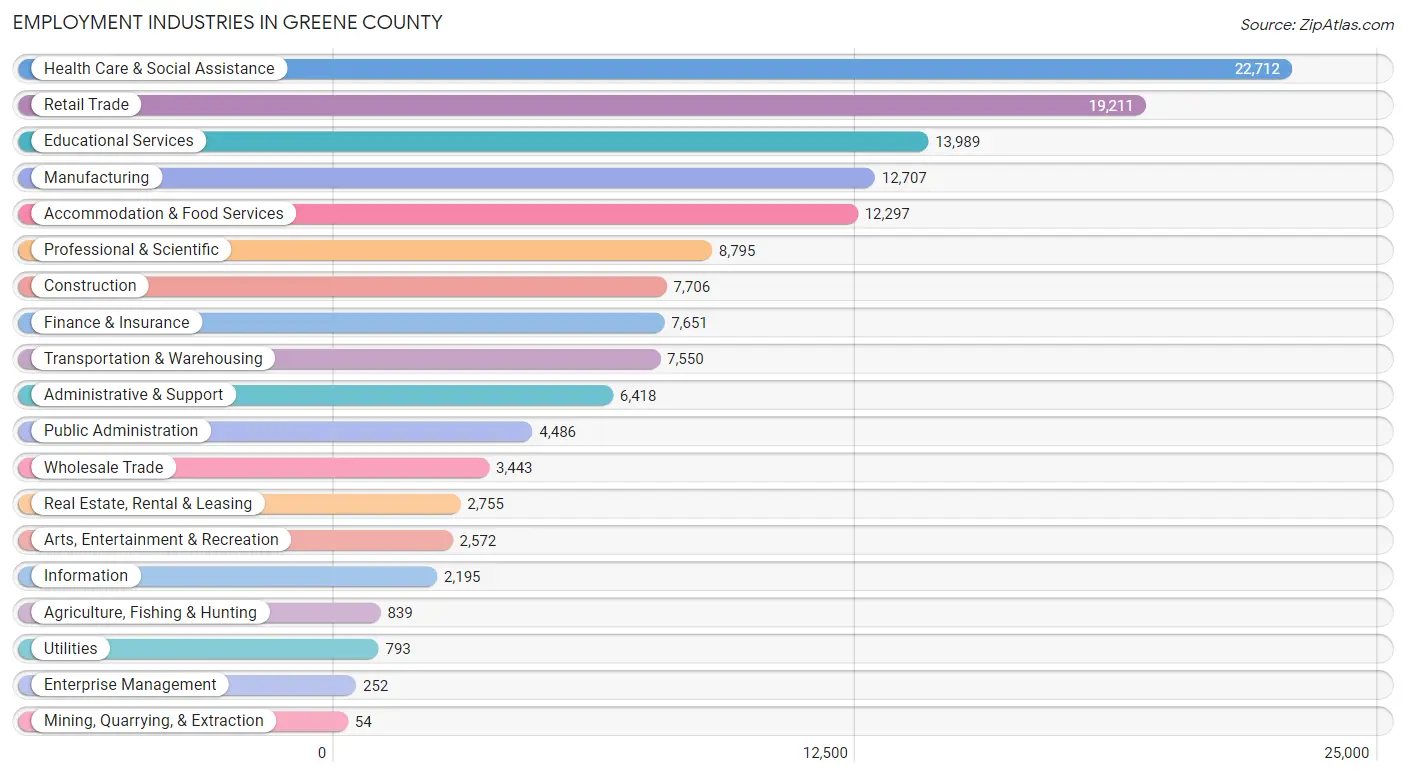
The major employment industries in Greene County include Health Care & Social Assistance (22,712 | 15.7%), Retail Trade (19,211 | 13.2%), Educational Services (13,989 | 9.6%), Manufacturing (12,707 | 8.8%), and Accommodation & Food Services (12,297 | 8.5%).
Employment Industries by Sex in Greene County
The Greene County industries that see more men than women are Mining, Quarrying, & Extraction (100.0%), Construction (88.6%), and Utilities (82.4%), whereas the industries that tend to have a higher number of women are Enterprise Management (75.8%), Health Care & Social Assistance (74.6%), and Educational Services (65.6%).
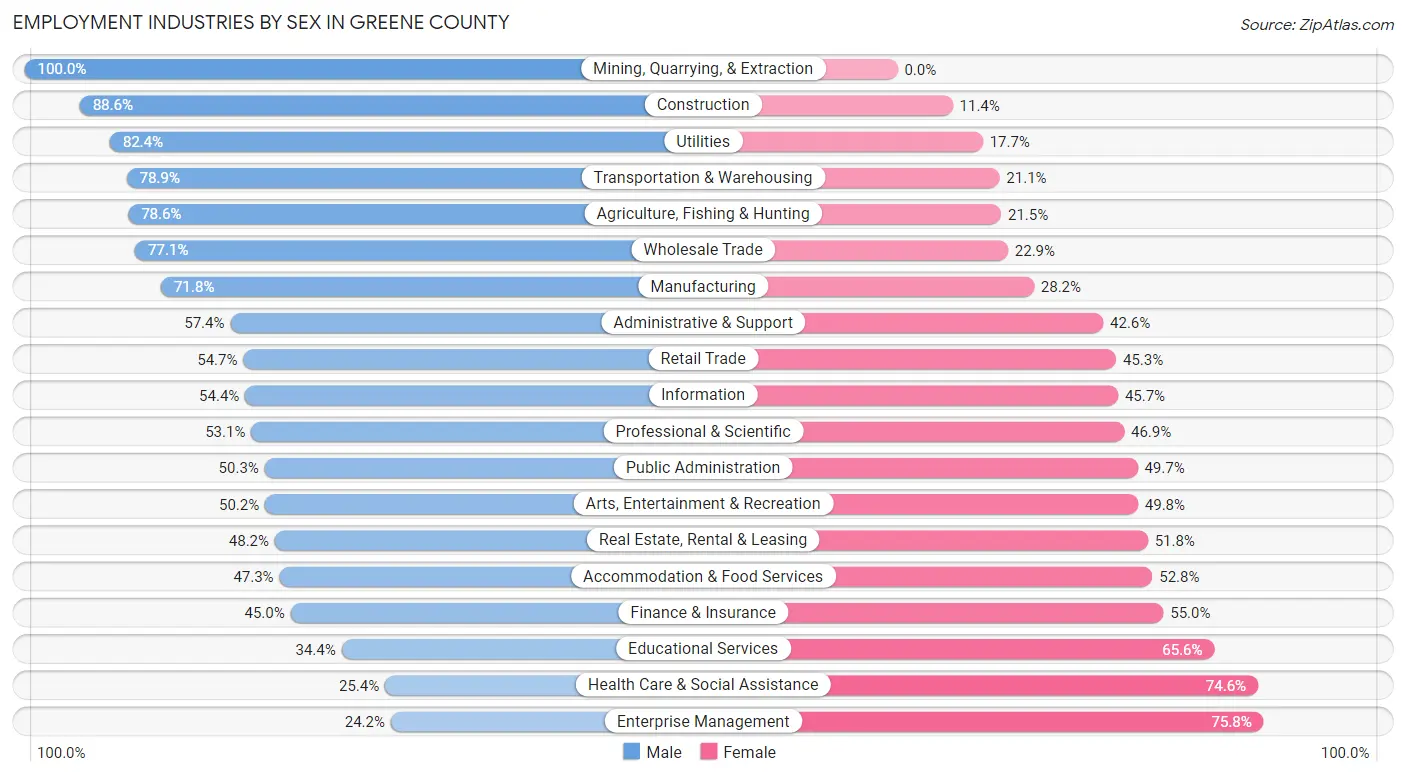
| Industry | Male | Female |
| Agriculture, Fishing & Hunting | 659 (78.5%) | 180 (21.4%) |
| Mining, Quarrying, & Extraction | 54 (100.0%) | 0 (0.0%) |
| Construction | 6,826 (88.6%) | 880 (11.4%) |
| Manufacturing | 9,119 (71.8%) | 3,588 (28.2%) |
| Wholesale Trade | 2,656 (77.1%) | 787 (22.9%) |
| Retail Trade | 10,517 (54.7%) | 8,694 (45.3%) |
| Transportation & Warehousing | 5,956 (78.9%) | 1,594 (21.1%) |
| Utilities | 653 (82.4%) | 140 (17.6%) |
| Information | 1,193 (54.3%) | 1,002 (45.7%) |
| Finance & Insurance | 3,440 (45.0%) | 4,211 (55.0%) |
| Real Estate, Rental & Leasing | 1,328 (48.2%) | 1,427 (51.8%) |
| Professional & Scientific | 4,669 (53.1%) | 4,126 (46.9%) |
| Enterprise Management | 61 (24.2%) | 191 (75.8%) |
| Administrative & Support | 3,686 (57.4%) | 2,732 (42.6%) |
| Educational Services | 4,812 (34.4%) | 9,177 (65.6%) |
| Health Care & Social Assistance | 5,766 (25.4%) | 16,946 (74.6%) |
| Arts, Entertainment & Recreation | 1,292 (50.2%) | 1,280 (49.8%) |
| Accommodation & Food Services | 5,810 (47.2%) | 6,487 (52.7%) |
| Public Administration | 2,257 (50.3%) | 2,229 (49.7%) |
| Total | 75,156 (51.8%) | 69,926 (48.2%) |
Education in Greene County
School Enrollment in Greene County
The most common levels of schooling among the 76,799 students in Greene County are college / undergraduate (25,684 | 33.4%), middle school (13,819 | 18.0%), and elementary school (12,469 | 16.2%).
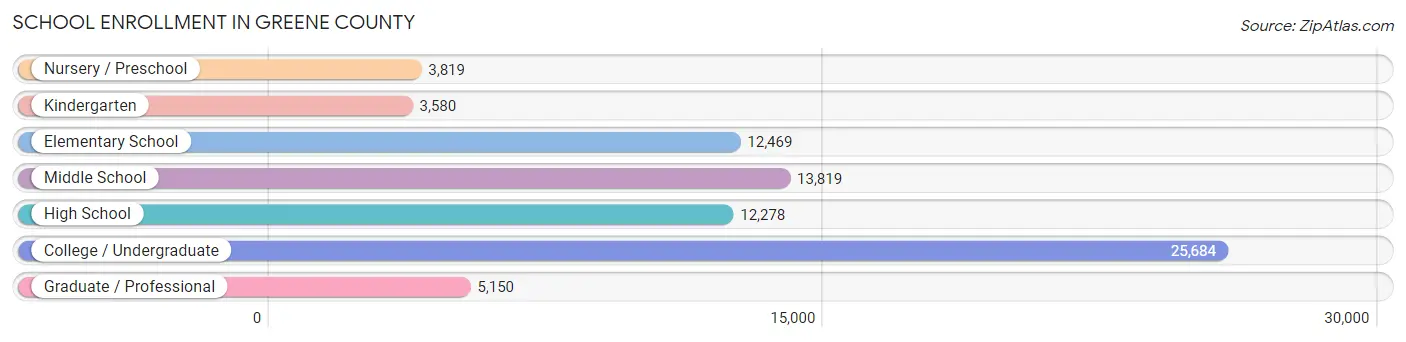
| School Level | # Students | % Students |
| Nursery / Preschool | 3,819 | 5.0% |
| Kindergarten | 3,580 | 4.7% |
| Elementary School | 12,469 | 16.2% |
| Middle School | 13,819 | 18.0% |
| High School | 12,278 | 16.0% |
| College / Undergraduate | 25,684 | 33.4% |
| Graduate / Professional | 5,150 | 6.7% |
| Total | 76,799 | 100.0% |
School Enrollment by Age by Funding Source in Greene County
Out of a total of 76,799 students who are enrolled in schools in Greene County, 12,441 (16.2%) attend a private institution, while the remaining 64,358 (83.8%) are enrolled in public schools. The age group of 3 to 4 year olds has the highest likelihood of being enrolled in private schools, with 988 (34.4% in the age bracket) enrolled. Conversely, the age group of 15 to 17 year olds has the lowest likelihood of being enrolled in a private school, with 8,131 (89.0% in the age bracket) attending a public institution.
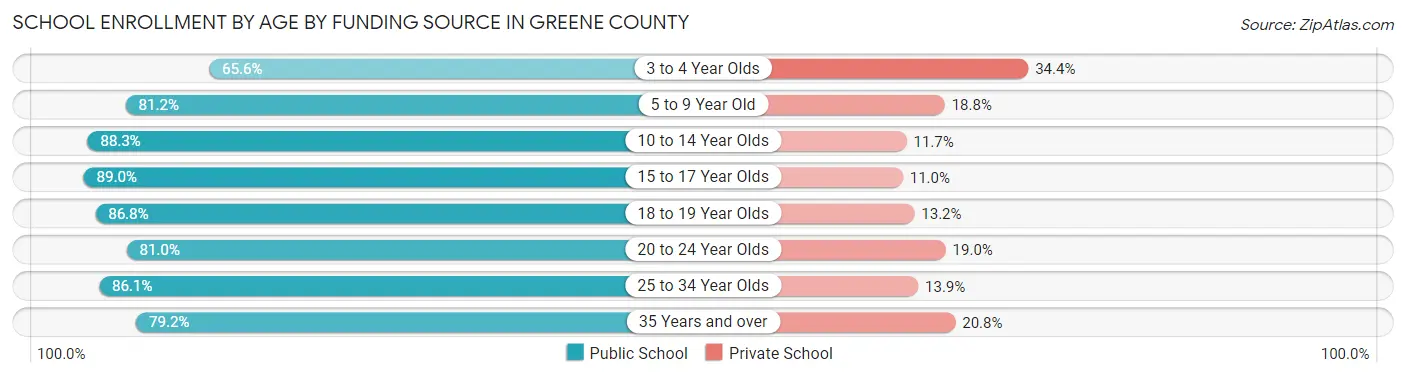
| Age Bracket | Public School | Private School |
| 3 to 4 Year Olds | 1,886 (65.6%) | 988 (34.4%) |
| 5 to 9 Year Old | 12,316 (81.2%) | 2,857 (18.8%) |
| 10 to 14 Year Olds | 14,893 (88.3%) | 1,975 (11.7%) |
| 15 to 17 Year Olds | 8,131 (89.0%) | 1,006 (11.0%) |
| 18 to 19 Year Olds | 6,630 (86.8%) | 1,006 (13.2%) |
| 20 to 24 Year Olds | 12,232 (81.0%) | 2,870 (19.0%) |
| 25 to 34 Year Olds | 4,602 (86.1%) | 741 (13.9%) |
| 35 Years and over | 3,696 (79.2%) | 970 (20.8%) |
| Total | 64,358 (83.8%) | 12,441 (16.2%) |
Educational Attainment by Field of Study in Greene County
Business (13,825 | 20.0%), education (10,662 | 15.4%), science & technology (8,288 | 12.0%), bio, nature & agricultural (5,088 | 7.3%), and arts & humanities (4,263 | 6.1%) are the most common fields of study among 69,265 individuals in Greene County who have obtained a bachelor's degree or higher.
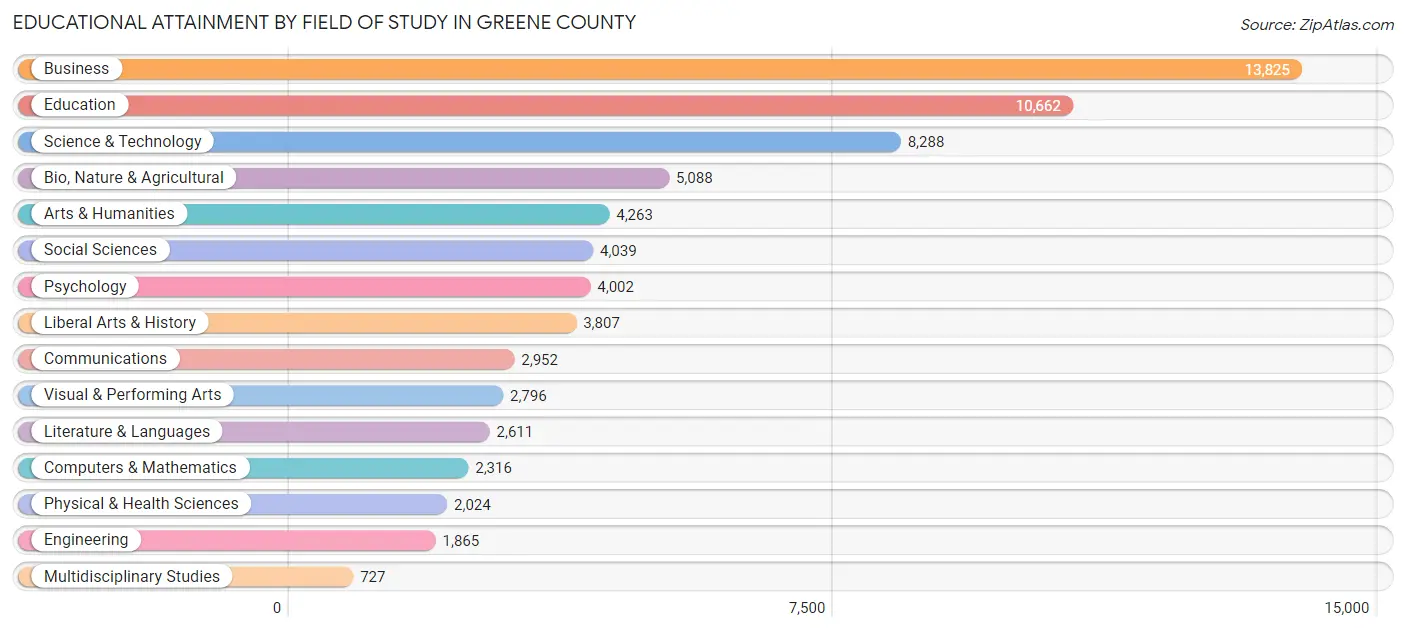
| Field of Study | # Graduates | % Graduates |
| Computers & Mathematics | 2,316 | 3.3% |
| Bio, Nature & Agricultural | 5,088 | 7.3% |
| Physical & Health Sciences | 2,024 | 2.9% |
| Psychology | 4,002 | 5.8% |
| Social Sciences | 4,039 | 5.8% |
| Engineering | 1,865 | 2.7% |
| Multidisciplinary Studies | 727 | 1.1% |
| Science & Technology | 8,288 | 12.0% |
| Business | 13,825 | 20.0% |
| Education | 10,662 | 15.4% |
| Literature & Languages | 2,611 | 3.8% |
| Liberal Arts & History | 3,807 | 5.5% |
| Visual & Performing Arts | 2,796 | 4.0% |
| Communications | 2,952 | 4.3% |
| Arts & Humanities | 4,263 | 6.1% |
| Total | 69,265 | 100.0% |
Transportation & Commute in Greene County
Vehicle Availability by Sex in Greene County
The most prevalent vehicle ownership categories in Greene County are males with 2 vehicles (32,803, accounting for 44.5%) and females with 2 vehicles (28,818, making up 48.6%).
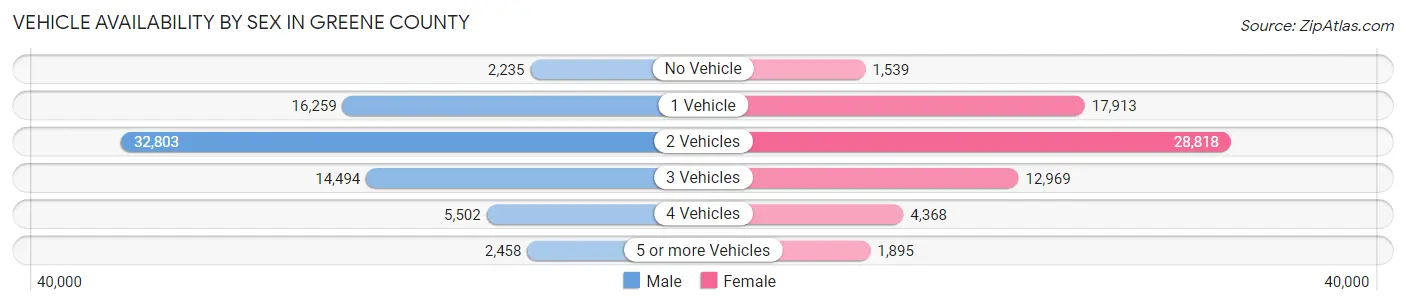
| Vehicles Available | Male | Female |
| No Vehicle | 2,235 (3.0%) | 1,539 (2.3%) |
| 1 Vehicle | 16,259 (22.1%) | 17,913 (26.5%) |
| 2 Vehicles | 32,803 (44.5%) | 28,818 (42.7%) |
| 3 Vehicles | 14,494 (19.7%) | 12,969 (19.2%) |
| 4 Vehicles | 5,502 (7.5%) | 4,368 (6.5%) |
| 5 or more Vehicles | 2,458 (3.3%) | 1,895 (2.8%) |
| Total | 73,751 (100.0%) | 67,502 (100.0%) |
Commute Time in Greene County
The most frequently occuring commute durations in Greene County are 20 to 24 minutes (26,887 commuters, 20.6%), 15 to 19 minutes (26,706 commuters, 20.5%), and 10 to 14 minutes (24,349 commuters, 18.7%).
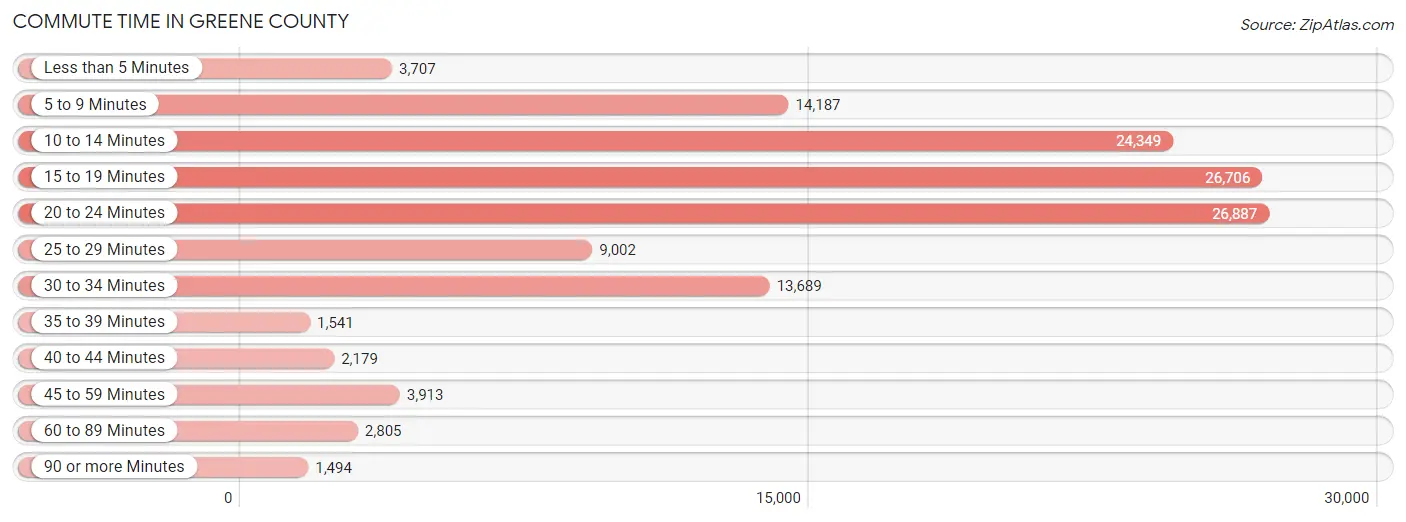
| Commute Time | # Commuters | % Commuters |
| Less than 5 Minutes | 3,707 | 2.8% |
| 5 to 9 Minutes | 14,187 | 10.9% |
| 10 to 14 Minutes | 24,349 | 18.7% |
| 15 to 19 Minutes | 26,706 | 20.5% |
| 20 to 24 Minutes | 26,887 | 20.6% |
| 25 to 29 Minutes | 9,002 | 6.9% |
| 30 to 34 Minutes | 13,689 | 10.5% |
| 35 to 39 Minutes | 1,541 | 1.2% |
| 40 to 44 Minutes | 2,179 | 1.7% |
| 45 to 59 Minutes | 3,913 | 3.0% |
| 60 to 89 Minutes | 2,805 | 2.1% |
| 90 or more Minutes | 1,494 | 1.1% |
Commute Time by Sex in Greene County
The most common commute times in Greene County are 15 to 19 minutes (14,187 commuters, 20.7%) for males and 20 to 24 minutes (13,159 commuters, 21.2%) for females.
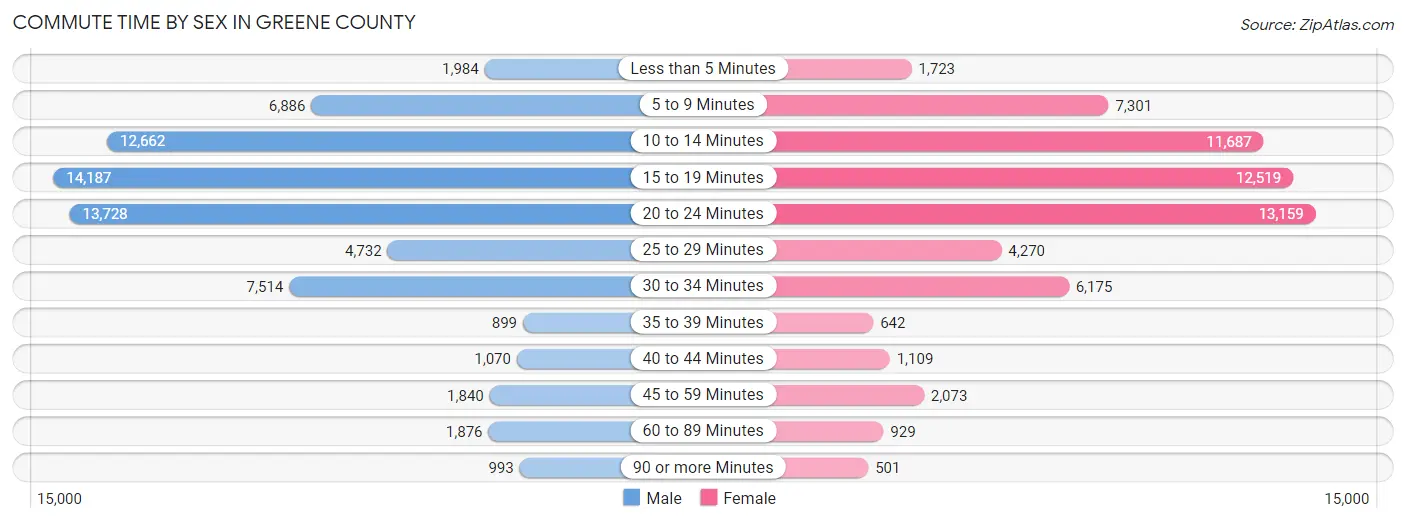
| Commute Time | Male | Female |
| Less than 5 Minutes | 1,984 (2.9%) | 1,723 (2.8%) |
| 5 to 9 Minutes | 6,886 (10.1%) | 7,301 (11.8%) |
| 10 to 14 Minutes | 12,662 (18.5%) | 11,687 (18.8%) |
| 15 to 19 Minutes | 14,187 (20.7%) | 12,519 (20.2%) |
| 20 to 24 Minutes | 13,728 (20.1%) | 13,159 (21.2%) |
| 25 to 29 Minutes | 4,732 (6.9%) | 4,270 (6.9%) |
| 30 to 34 Minutes | 7,514 (11.0%) | 6,175 (10.0%) |
| 35 to 39 Minutes | 899 (1.3%) | 642 (1.0%) |
| 40 to 44 Minutes | 1,070 (1.6%) | 1,109 (1.8%) |
| 45 to 59 Minutes | 1,840 (2.7%) | 2,073 (3.3%) |
| 60 to 89 Minutes | 1,876 (2.7%) | 929 (1.5%) |
| 90 or more Minutes | 993 (1.5%) | 501 (0.8%) |
Time of Departure to Work by Sex in Greene County
The most frequent times of departure to work in Greene County are 7:00 AM to 7:29 AM (10,671, 15.6%) for males and 7:00 AM to 7:29 AM (11,318, 18.2%) for females.
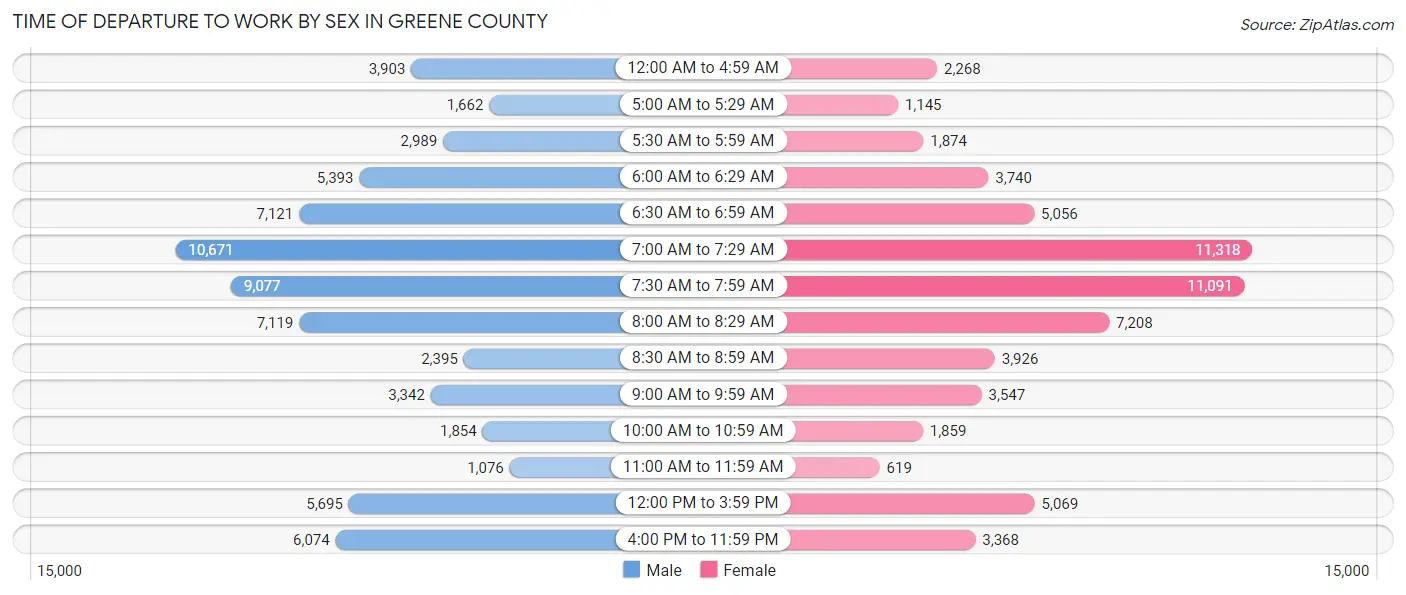
| Time of Departure | Male | Female |
| 12:00 AM to 4:59 AM | 3,903 (5.7%) | 2,268 (3.6%) |
| 5:00 AM to 5:29 AM | 1,662 (2.4%) | 1,145 (1.8%) |
| 5:30 AM to 5:59 AM | 2,989 (4.4%) | 1,874 (3.0%) |
| 6:00 AM to 6:29 AM | 5,393 (7.9%) | 3,740 (6.0%) |
| 6:30 AM to 6:59 AM | 7,121 (10.4%) | 5,056 (8.1%) |
| 7:00 AM to 7:29 AM | 10,671 (15.6%) | 11,318 (18.2%) |
| 7:30 AM to 7:59 AM | 9,077 (13.3%) | 11,091 (17.9%) |
| 8:00 AM to 8:29 AM | 7,119 (10.4%) | 7,208 (11.6%) |
| 8:30 AM to 8:59 AM | 2,395 (3.5%) | 3,926 (6.3%) |
| 9:00 AM to 9:59 AM | 3,342 (4.9%) | 3,547 (5.7%) |
| 10:00 AM to 10:59 AM | 1,854 (2.7%) | 1,859 (3.0%) |
| 11:00 AM to 11:59 AM | 1,076 (1.6%) | 619 (1.0%) |
| 12:00 PM to 3:59 PM | 5,695 (8.3%) | 5,069 (8.2%) |
| 4:00 PM to 11:59 PM | 6,074 (8.9%) | 3,368 (5.4%) |
| Total | 68,371 (100.0%) | 62,088 (100.0%) |
Housing Occupancy in Greene County
Occupancy by Ownership in Greene County
Of the total 131,109 dwellings in Greene County, owner-occupied units account for 74,398 (56.8%), while renter-occupied units make up 56,711 (43.2%).
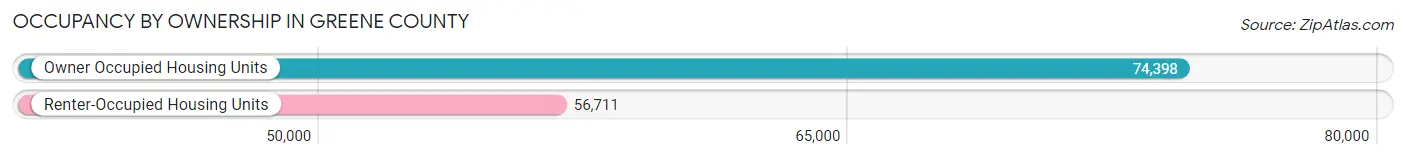
| Occupancy | # Housing Units | % Housing Units |
| Owner Occupied Housing Units | 74,398 | 56.8% |
| Renter-Occupied Housing Units | 56,711 | 43.2% |
| Total Occupied Housing Units | 131,109 | 100.0% |
Occupancy by Household Size in Greene County
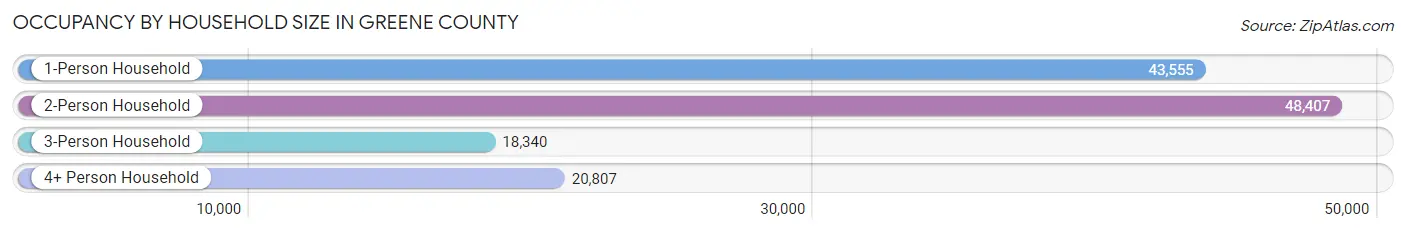
| Household Size | # Housing Units | % Housing Units |
| 1-Person Household | 43,555 | 33.2% |
| 2-Person Household | 48,407 | 36.9% |
| 3-Person Household | 18,340 | 14.0% |
| 4+ Person Household | 20,807 | 15.9% |
| Total Housing Units | 131,109 | 100.0% |
Occupancy by Ownership by Household Size in Greene County
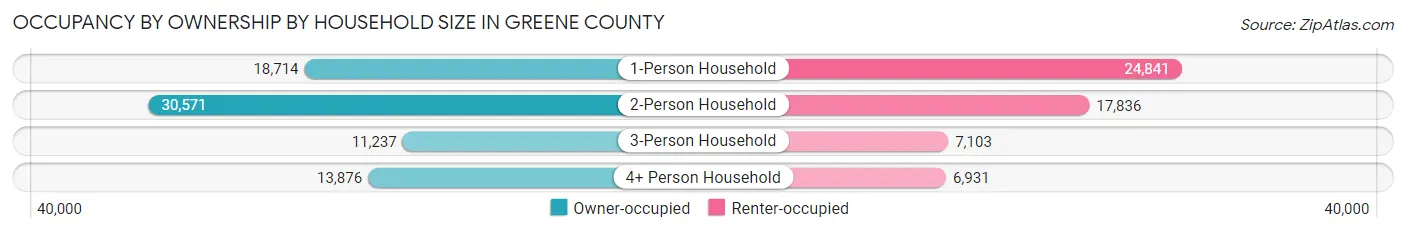
| Household Size | Owner-occupied | Renter-occupied |
| 1-Person Household | 18,714 (43.0%) | 24,841 (57.0%) |
| 2-Person Household | 30,571 (63.1%) | 17,836 (36.8%) |
| 3-Person Household | 11,237 (61.3%) | 7,103 (38.7%) |
| 4+ Person Household | 13,876 (66.7%) | 6,931 (33.3%) |
| Total Housing Units | 74,398 (56.8%) | 56,711 (43.2%) |
Occupancy by Educational Attainment in Greene County
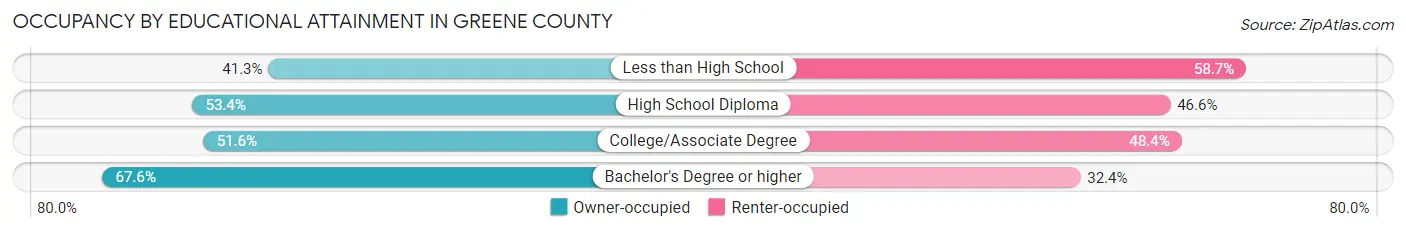
| Household Size | Owner-occupied | Renter-occupied |
| Less than High School | 3,367 (41.3%) | 4,778 (58.7%) |
| High School Diploma | 17,277 (53.4%) | 15,102 (46.6%) |
| College/Associate Degree | 24,116 (51.6%) | 22,645 (48.4%) |
| Bachelor's Degree or higher | 29,638 (67.6%) | 14,186 (32.4%) |
Occupancy by Age of Householder in Greene County
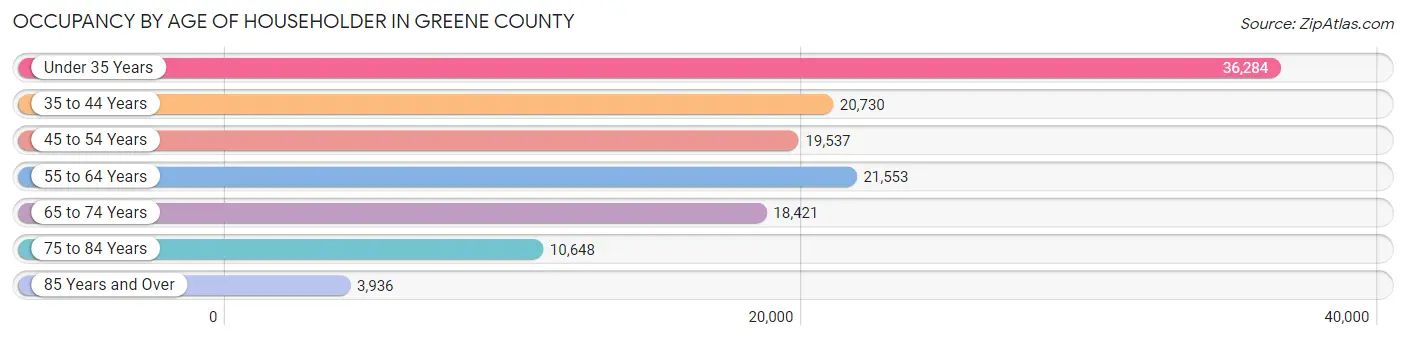
| Age Bracket | # Households | % Households |
| Under 35 Years | 36,284 | 27.7% |
| 35 to 44 Years | 20,730 | 15.8% |
| 45 to 54 Years | 19,537 | 14.9% |
| 55 to 64 Years | 21,553 | 16.4% |
| 65 to 74 Years | 18,421 | 14.1% |
| 75 to 84 Years | 10,648 | 8.1% |
| 85 Years and Over | 3,936 | 3.0% |
| Total | 131,109 | 100.0% |
Housing Finances in Greene County
Median Income by Occupancy in Greene County
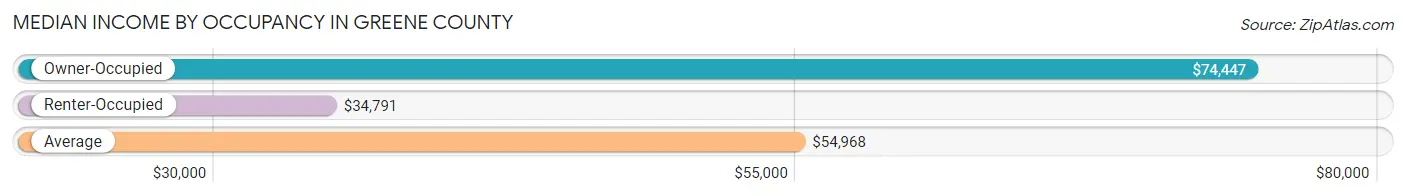
| Occupancy Type | # Households | Median Income |
| Owner-Occupied | 74,398 (56.8%) | $74,447 |
| Renter-Occupied | 56,711 (43.2%) | $34,791 |
| Average | 131,109 (100.0%) | $54,968 |
Occupancy by Householder Income Bracket in Greene County
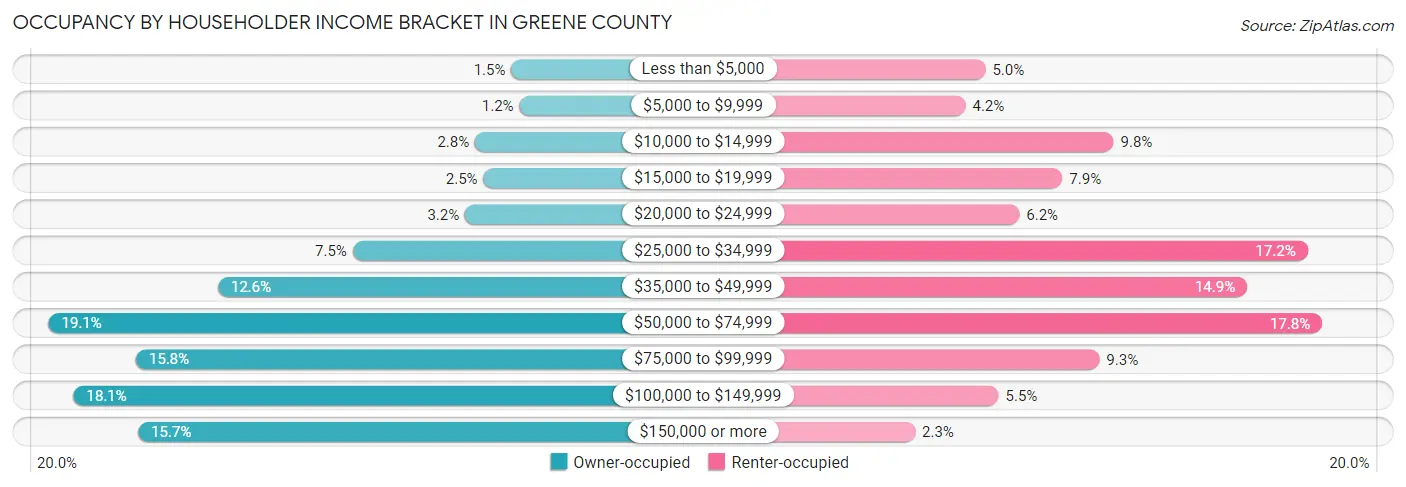
| Income Bracket | Owner-occupied | Renter-occupied |
| Less than $5,000 | 1,089 (1.5%) | 2,805 (5.0%) |
| $5,000 to $9,999 | 856 (1.1%) | 2,379 (4.2%) |
| $10,000 to $14,999 | 2,116 (2.8%) | 5,575 (9.8%) |
| $15,000 to $19,999 | 1,876 (2.5%) | 4,467 (7.9%) |
| $20,000 to $24,999 | 2,393 (3.2%) | 3,540 (6.2%) |
| $25,000 to $34,999 | 5,583 (7.5%) | 9,766 (17.2%) |
| $35,000 to $49,999 | 9,401 (12.6%) | 8,456 (14.9%) |
| $50,000 to $74,999 | 14,200 (19.1%) | 10,078 (17.8%) |
| $75,000 to $99,999 | 11,722 (15.8%) | 5,267 (9.3%) |
| $100,000 to $149,999 | 13,496 (18.1%) | 3,092 (5.4%) |
| $150,000 or more | 11,666 (15.7%) | 1,286 (2.3%) |
| Total | 74,398 (100.0%) | 56,711 (100.0%) |
Monthly Housing Cost Tiers in Greene County
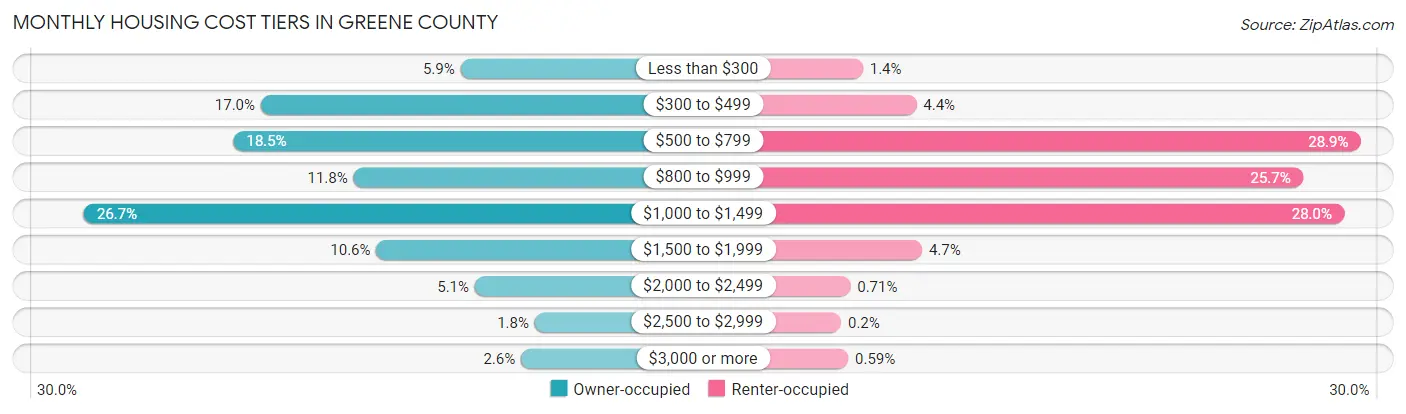
| Monthly Cost | Owner-occupied | Renter-occupied |
| Less than $300 | 4,408 (5.9%) | 793 (1.4%) |
| $300 to $499 | 12,607 (17.0%) | 2,470 (4.4%) |
| $500 to $799 | 13,743 (18.5%) | 16,377 (28.9%) |
| $800 to $999 | 8,799 (11.8%) | 14,571 (25.7%) |
| $1,000 to $1,499 | 19,885 (26.7%) | 15,861 (28.0%) |
| $1,500 to $1,999 | 7,865 (10.6%) | 2,648 (4.7%) |
| $2,000 to $2,499 | 3,817 (5.1%) | 403 (0.7%) |
| $2,500 to $2,999 | 1,354 (1.8%) | 112 (0.2%) |
| $3,000 or more | 1,920 (2.6%) | 333 (0.6%) |
| Total | 74,398 (100.0%) | 56,711 (100.0%) |
Physical Housing Characteristics in Greene County
Housing Structures in Greene County
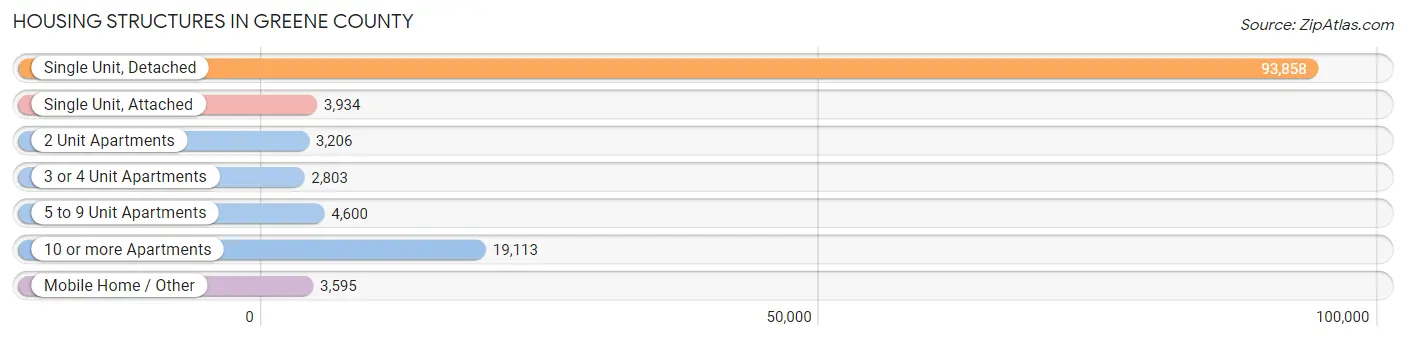
| Structure Type | # Housing Units | % Housing Units |
| Single Unit, Detached | 93,858 | 71.6% |
| Single Unit, Attached | 3,934 | 3.0% |
| 2 Unit Apartments | 3,206 | 2.5% |
| 3 or 4 Unit Apartments | 2,803 | 2.1% |
| 5 to 9 Unit Apartments | 4,600 | 3.5% |
| 10 or more Apartments | 19,113 | 14.6% |
| Mobile Home / Other | 3,595 | 2.7% |
| Total | 131,109 | 100.0% |
Housing Structures by Occupancy in Greene County
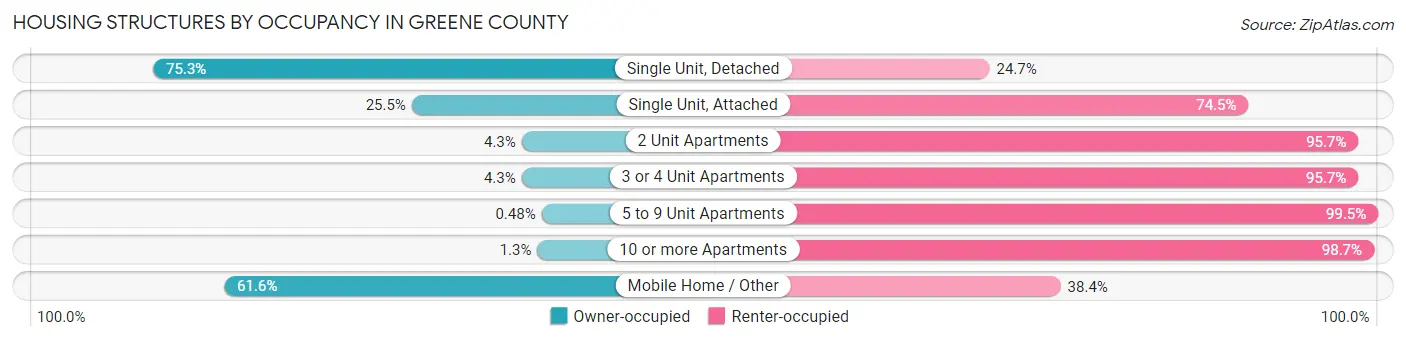
| Structure Type | Owner-occupied | Renter-occupied |
| Single Unit, Detached | 70,655 (75.3%) | 23,203 (24.7%) |
| Single Unit, Attached | 1,002 (25.5%) | 2,932 (74.5%) |
| 2 Unit Apartments | 138 (4.3%) | 3,068 (95.7%) |
| 3 or 4 Unit Apartments | 121 (4.3%) | 2,682 (95.7%) |
| 5 to 9 Unit Apartments | 22 (0.5%) | 4,578 (99.5%) |
| 10 or more Apartments | 246 (1.3%) | 18,867 (98.7%) |
| Mobile Home / Other | 2,214 (61.6%) | 1,381 (38.4%) |
| Total | 74,398 (56.8%) | 56,711 (43.2%) |
Housing Structures by Number of Rooms in Greene County
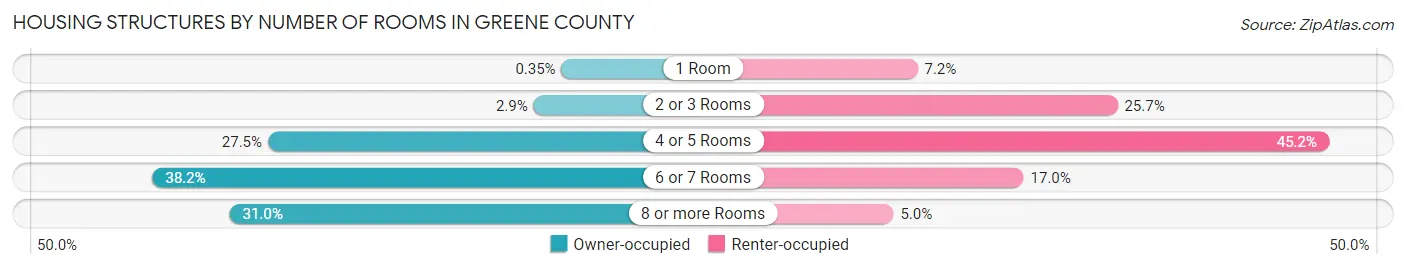
| Number of Rooms | Owner-occupied | Renter-occupied |
| 1 Room | 258 (0.4%) | 4,072 (7.2%) |
| 2 or 3 Rooms | 2,179 (2.9%) | 14,556 (25.7%) |
| 4 or 5 Rooms | 20,460 (27.5%) | 25,639 (45.2%) |
| 6 or 7 Rooms | 28,409 (38.2%) | 9,635 (17.0%) |
| 8 or more Rooms | 23,092 (31.0%) | 2,809 (5.0%) |
| Total | 74,398 (100.0%) | 56,711 (100.0%) |
Housing Structure by Heating Type in Greene County
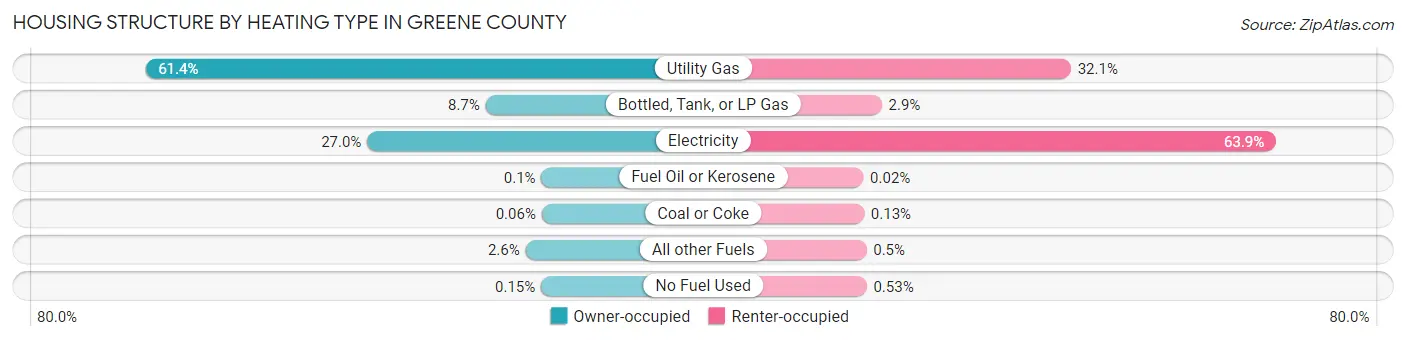
| Heating Type | Owner-occupied | Renter-occupied |
| Utility Gas | 45,646 (61.4%) | 18,211 (32.1%) |
| Bottled, Tank, or LP Gas | 6,495 (8.7%) | 1,627 (2.9%) |
| Electricity | 20,116 (27.0%) | 36,209 (63.8%) |
| Fuel Oil or Kerosene | 74 (0.1%) | 9 (0.0%) |
| Coal or Coke | 48 (0.1%) | 75 (0.1%) |
| All other Fuels | 1,907 (2.6%) | 281 (0.5%) |
| No Fuel Used | 112 (0.2%) | 299 (0.5%) |
| Total | 74,398 (100.0%) | 56,711 (100.0%) |
Household Vehicle Usage in Greene County
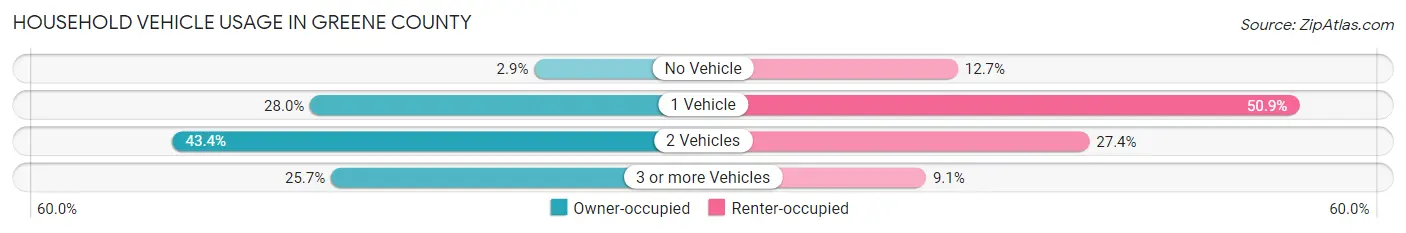
| Vehicles per Household | Owner-occupied | Renter-occupied |
| No Vehicle | 2,162 (2.9%) | 7,173 (12.7%) |
| 1 Vehicle | 20,842 (28.0%) | 28,857 (50.9%) |
| 2 Vehicles | 32,294 (43.4%) | 15,529 (27.4%) |
| 3 or more Vehicles | 19,100 (25.7%) | 5,152 (9.1%) |
| Total | 74,398 (100.0%) | 56,711 (100.0%) |
Real Estate & Mortgages in Greene County
Real Estate and Mortgage Overview in Greene County
| Characteristic | Without Mortgage | With Mortgage |
| Housing Units | 28,451 | 45,947 |
| Median Property Value | $172,600 | $188,200 |
| Median Household Income | $56,117 | $8,201 |
| Monthly Housing Costs | $468 | $1,920 |
| Real Estate Taxes | $1,396 | $927 |
Property Value by Mortgage Status in Greene County
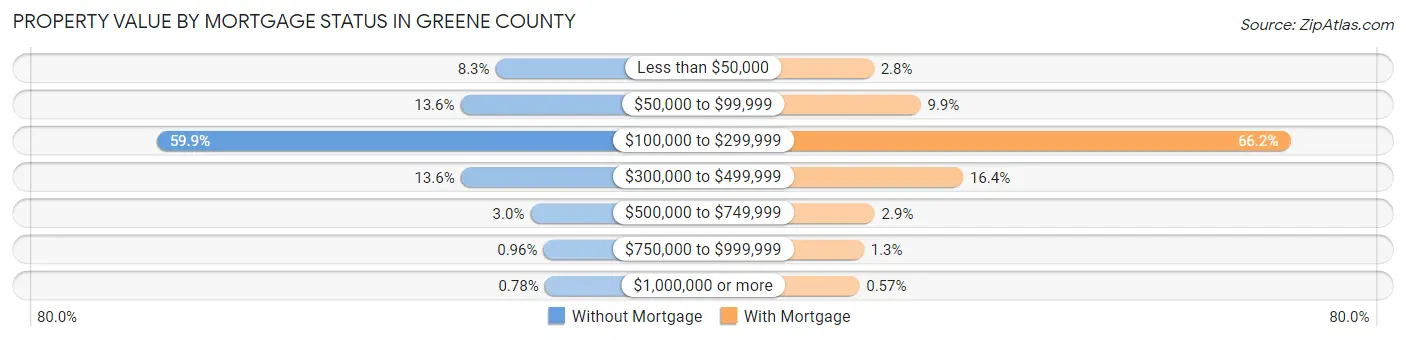
| Property Value | Without Mortgage | With Mortgage |
| Less than $50,000 | 2,351 (8.3%) | 1,275 (2.8%) |
| $50,000 to $99,999 | 3,871 (13.6%) | 4,549 (9.9%) |
| $100,000 to $299,999 | 17,031 (59.9%) | 30,430 (66.2%) |
| $300,000 to $499,999 | 3,863 (13.6%) | 7,522 (16.4%) |
| $500,000 to $749,999 | 840 (2.9%) | 1,335 (2.9%) |
| $750,000 to $999,999 | 274 (1.0%) | 575 (1.3%) |
| $1,000,000 or more | 221 (0.8%) | 261 (0.6%) |
| Total | 28,451 (100.0%) | 45,947 (100.0%) |
Household Income by Mortgage Status in Greene County
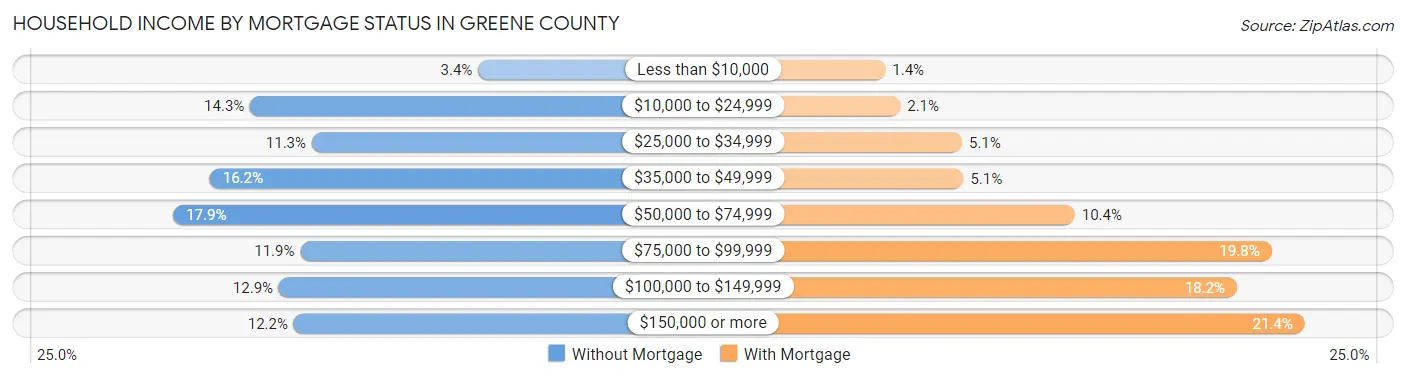
| Household Income | Without Mortgage | With Mortgage |
| Less than $10,000 | 966 (3.4%) | 652 (1.4%) |
| $10,000 to $24,999 | 4,056 (14.3%) | 979 (2.1%) |
| $25,000 to $34,999 | 3,221 (11.3%) | 2,329 (5.1%) |
| $35,000 to $49,999 | 4,603 (16.2%) | 2,362 (5.1%) |
| $50,000 to $74,999 | 5,098 (17.9%) | 4,798 (10.4%) |
| $75,000 to $99,999 | 3,376 (11.9%) | 9,102 (19.8%) |
| $100,000 to $149,999 | 3,666 (12.9%) | 8,346 (18.2%) |
| $150,000 or more | 3,465 (12.2%) | 9,830 (21.4%) |
| Total | 28,451 (100.0%) | 45,947 (100.0%) |
Property Value to Household Income Ratio in Greene County
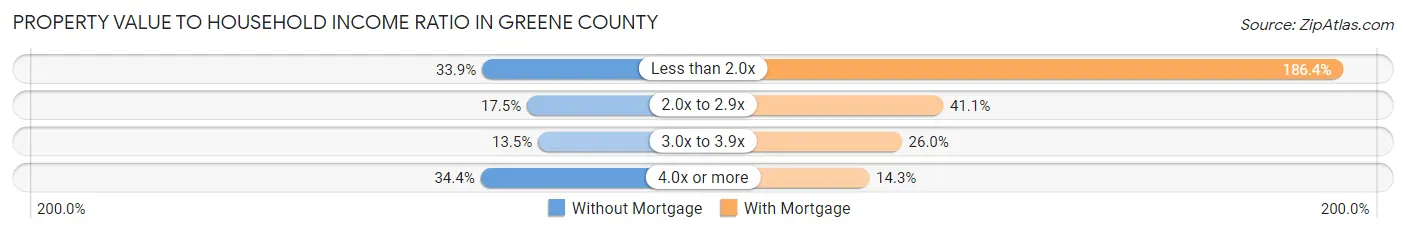
| Value-to-Income Ratio | Without Mortgage | With Mortgage |
| Less than 2.0x | 9,632 (33.9%) | 85,662 (186.4%) |
| 2.0x to 2.9x | 4,980 (17.5%) | 18,881 (41.1%) |
| 3.0x to 3.9x | 3,847 (13.5%) | 11,964 (26.0%) |
| 4.0x or more | 9,794 (34.4%) | 6,548 (14.2%) |
| Total | 28,451 (100.0%) | 45,947 (100.0%) |
Real Estate Taxes by Mortgage Status in Greene County
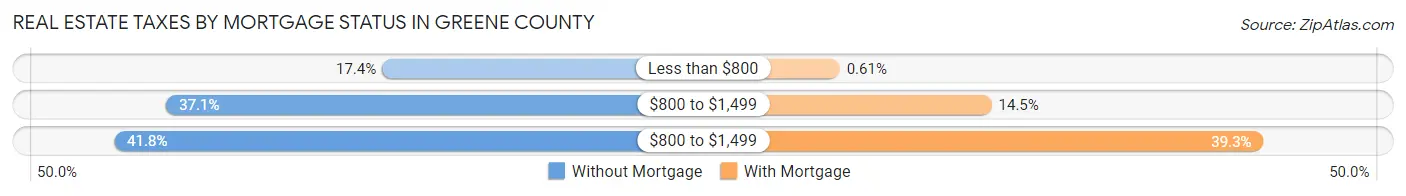
| Property Taxes | Without Mortgage | With Mortgage |
| Less than $800 | 4,938 (17.4%) | 278 (0.6%) |
| $800 to $1,499 | 10,550 (37.1%) | 6,654 (14.5%) |
| $800 to $1,499 | 11,901 (41.8%) | 18,058 (39.3%) |
| Total | 28,451 (100.0%) | 45,947 (100.0%) |
Health & Disability in Greene County
Health Insurance Coverage by Age in Greene County
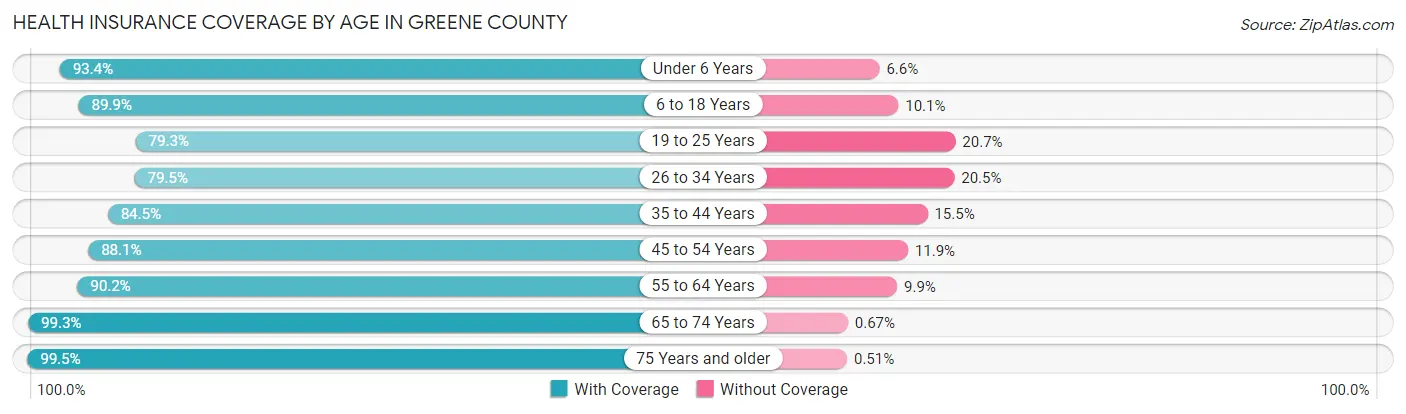
| Age Bracket | With Coverage | Without Coverage |
| Under 6 Years | 18,711 (93.4%) | 1,314 (6.6%) |
| 6 to 18 Years | 42,158 (89.9%) | 4,720 (10.1%) |
| 19 to 25 Years | 31,517 (79.3%) | 8,238 (20.7%) |
| 26 to 34 Years | 29,301 (79.5%) | 7,559 (20.5%) |
| 35 to 44 Years | 30,384 (84.5%) | 5,578 (15.5%) |
| 45 to 54 Years | 28,816 (88.1%) | 3,882 (11.9%) |
| 55 to 64 Years | 31,396 (90.1%) | 3,432 (9.9%) |
| 65 to 74 Years | 27,913 (99.3%) | 187 (0.7%) |
| 75 Years and older | 20,197 (99.5%) | 104 (0.5%) |
| Total | 260,393 (88.1%) | 35,014 (11.8%) |
Health Insurance Coverage by Citizenship Status in Greene County
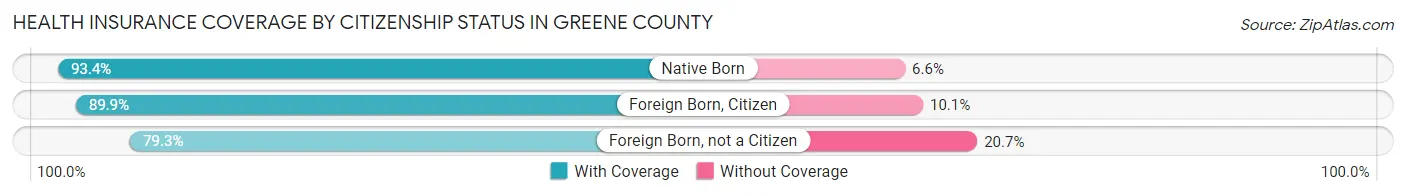
| Citizenship Status | With Coverage | Without Coverage |
| Native Born | 18,711 (93.4%) | 1,314 (6.6%) |
| Foreign Born, Citizen | 42,158 (89.9%) | 4,720 (10.1%) |
| Foreign Born, not a Citizen | 31,517 (79.3%) | 8,238 (20.7%) |
Health Insurance Coverage by Household Income in Greene County
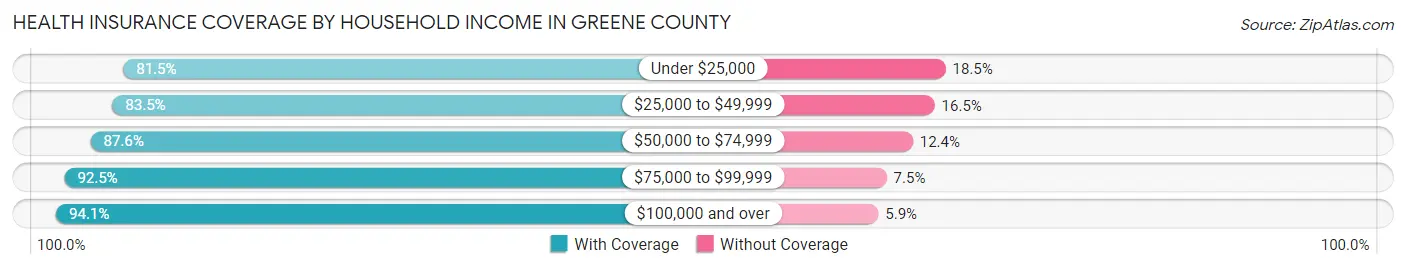
| Household Income | With Coverage | Without Coverage |
| Under $25,000 | 32,463 (81.5%) | 7,367 (18.5%) |
| $25,000 to $49,999 | 52,495 (83.5%) | 10,340 (16.5%) |
| $50,000 to $74,999 | 49,019 (87.6%) | 6,911 (12.4%) |
| $75,000 to $99,999 | 38,554 (92.5%) | 3,112 (7.5%) |
| $100,000 and over | 82,394 (94.1%) | 5,177 (5.9%) |
Public vs Private Health Insurance Coverage by Age in Greene County
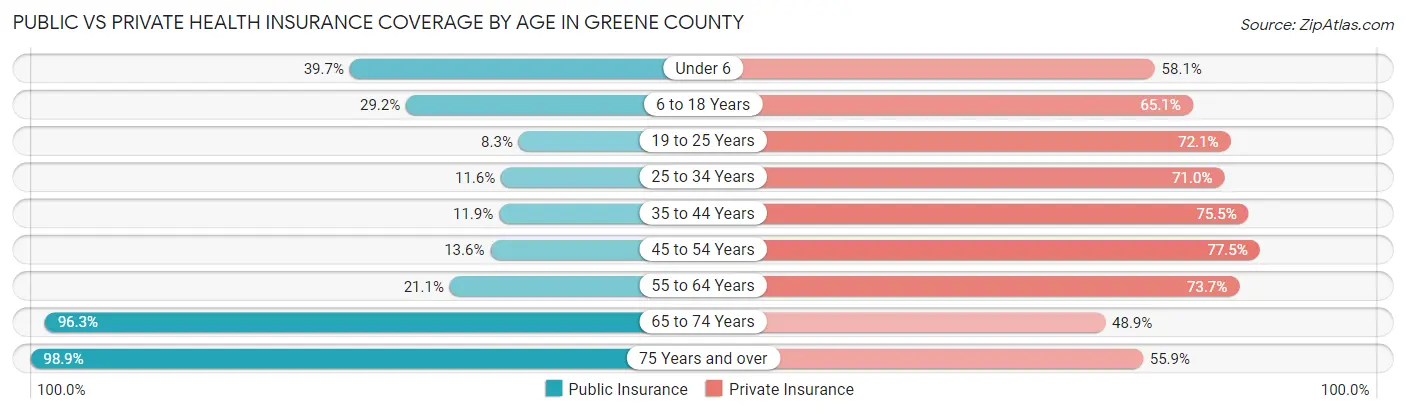
| Age Bracket | Public Insurance | Private Insurance |
| Under 6 | 7,939 (39.7%) | 11,628 (58.1%) |
| 6 to 18 Years | 13,688 (29.2%) | 30,523 (65.1%) |
| 19 to 25 Years | 3,291 (8.3%) | 28,668 (72.1%) |
| 25 to 34 Years | 4,261 (11.6%) | 26,165 (71.0%) |
| 35 to 44 Years | 4,290 (11.9%) | 27,153 (75.5%) |
| 45 to 54 Years | 4,438 (13.6%) | 25,354 (77.5%) |
| 55 to 64 Years | 7,344 (21.1%) | 25,683 (73.7%) |
| 65 to 74 Years | 27,050 (96.3%) | 13,733 (48.9%) |
| 75 Years and over | 20,083 (98.9%) | 11,343 (55.9%) |
| Total | 92,384 (31.3%) | 200,250 (67.8%) |
Disability Status by Sex by Age in Greene County
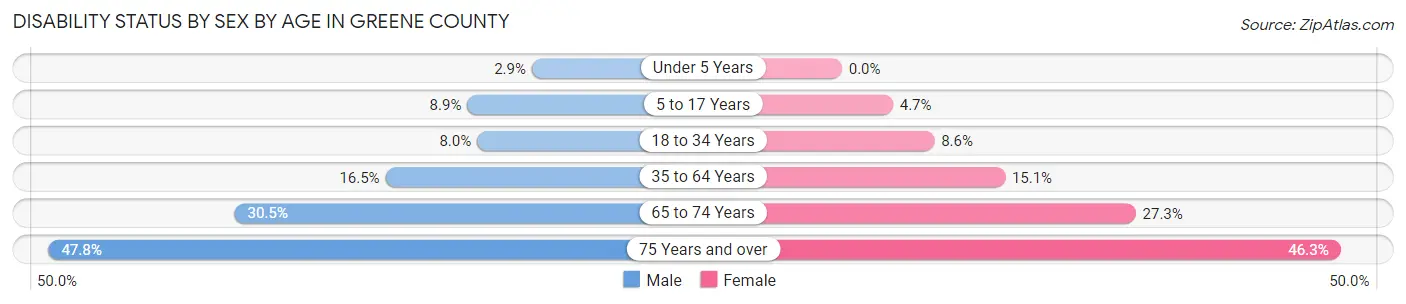
| Age Bracket | Male | Female |
| Under 5 Years | 262 (2.9%) | 0 (0.0%) |
| 5 to 17 Years | 2,064 (8.9%) | 1,031 (4.7%) |
| 18 to 34 Years | 3,235 (8.0%) | 3,532 (8.6%) |
| 35 to 64 Years | 8,438 (16.5%) | 7,931 (15.1%) |
| 65 to 74 Years | 3,874 (30.5%) | 4,200 (27.3%) |
| 75 Years and over | 3,908 (47.8%) | 5,609 (46.3%) |
Disability Class by Sex by Age in Greene County
Disability Class: Hearing Difficulty
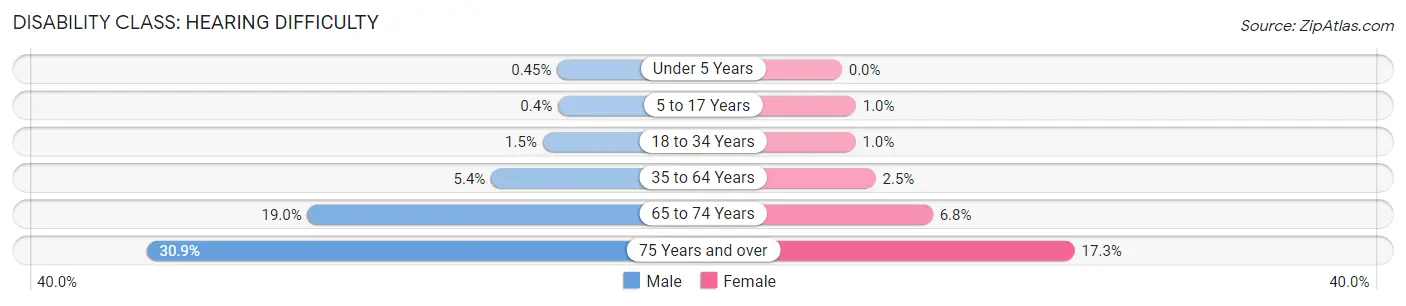
| Age Bracket | Male | Female |
| Under 5 Years | 40 (0.4%) | 0 (0.0%) |
| 5 to 17 Years | 93 (0.4%) | 227 (1.0%) |
| 18 to 34 Years | 619 (1.5%) | 421 (1.0%) |
| 35 to 64 Years | 2,741 (5.4%) | 1,315 (2.5%) |
| 65 to 74 Years | 2,411 (19.0%) | 1,040 (6.8%) |
| 75 Years and over | 2,531 (30.9%) | 2,096 (17.3%) |
Disability Class: Vision Difficulty
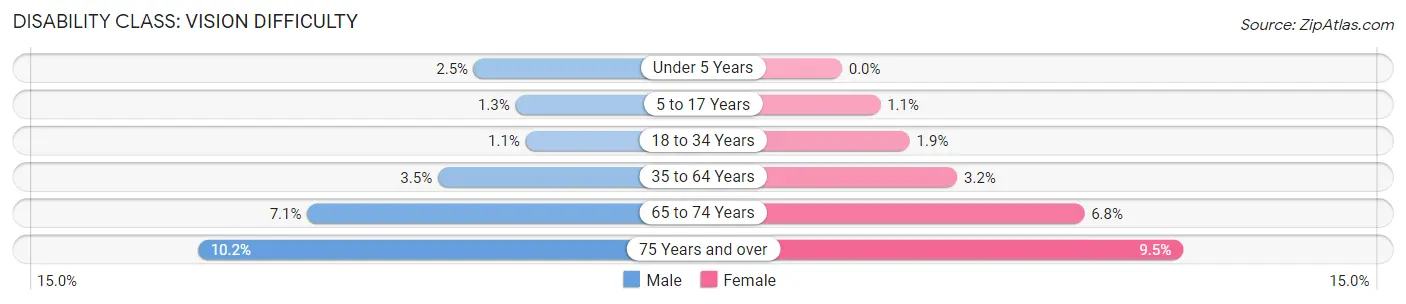
| Age Bracket | Male | Female |
| Under 5 Years | 222 (2.5%) | 0 (0.0%) |
| 5 to 17 Years | 308 (1.3%) | 232 (1.1%) |
| 18 to 34 Years | 424 (1.1%) | 778 (1.9%) |
| 35 to 64 Years | 1,785 (3.5%) | 1,679 (3.2%) |
| 65 to 74 Years | 906 (7.1%) | 1,039 (6.8%) |
| 75 Years and over | 833 (10.2%) | 1,151 (9.5%) |
Disability Class: Cognitive Difficulty
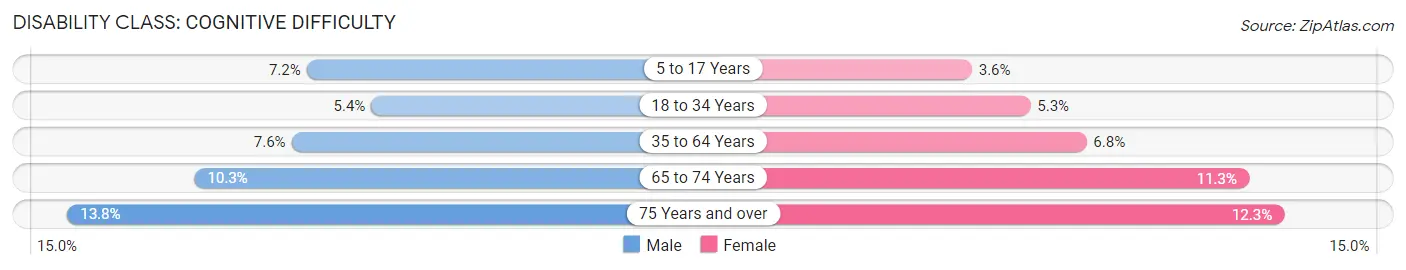
| Age Bracket | Male | Female |
| 5 to 17 Years | 1,654 (7.1%) | 788 (3.6%) |
| 18 to 34 Years | 2,160 (5.3%) | 2,162 (5.2%) |
| 35 to 64 Years | 3,867 (7.6%) | 3,566 (6.8%) |
| 65 to 74 Years | 1,304 (10.3%) | 1,745 (11.3%) |
| 75 Years and over | 1,130 (13.8%) | 1,492 (12.3%) |
Disability Class: Ambulatory Difficulty
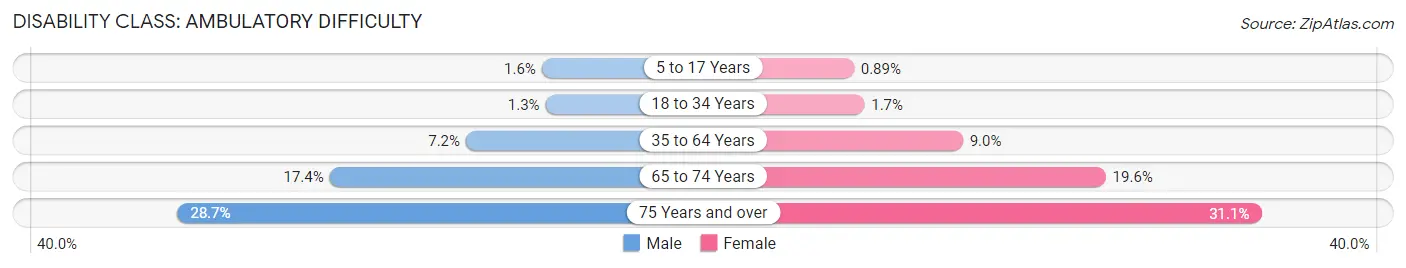
| Age Bracket | Male | Female |
| 5 to 17 Years | 373 (1.6%) | 193 (0.9%) |
| 18 to 34 Years | 537 (1.3%) | 687 (1.7%) |
| 35 to 64 Years | 3,699 (7.2%) | 4,703 (9.0%) |
| 65 to 74 Years | 2,205 (17.4%) | 3,017 (19.6%) |
| 75 Years and over | 2,344 (28.7%) | 3,774 (31.1%) |
Disability Class: Self-Care Difficulty
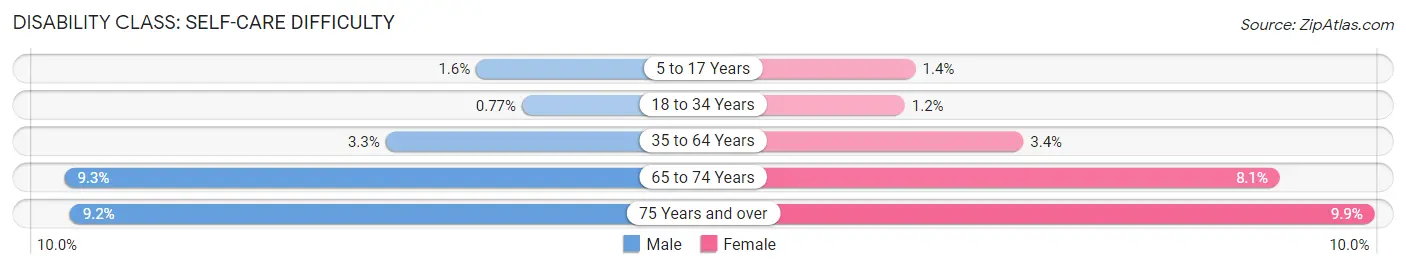
| Age Bracket | Male | Female |
| 5 to 17 Years | 375 (1.6%) | 298 (1.4%) |
| 18 to 34 Years | 313 (0.8%) | 480 (1.2%) |
| 35 to 64 Years | 1,687 (3.3%) | 1,767 (3.4%) |
| 65 to 74 Years | 1,176 (9.3%) | 1,252 (8.1%) |
| 75 Years and over | 749 (9.2%) | 1,199 (9.9%) |
Technology Access in Greene County
Computing Device Access in Greene County
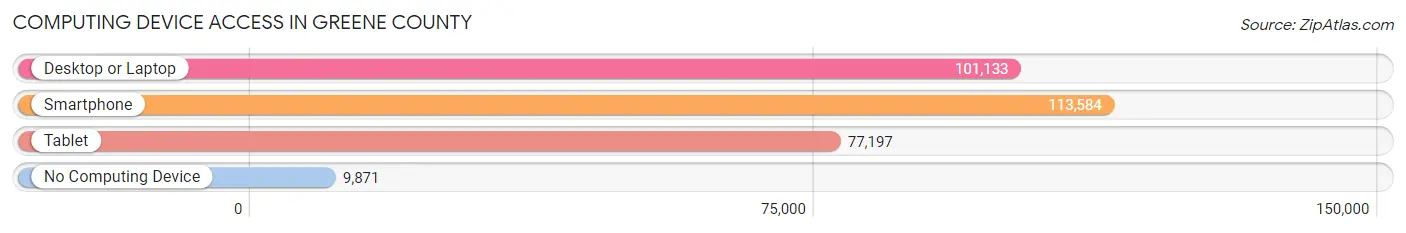
| Device Type | # Households | % Households |
| Desktop or Laptop | 101,133 | 77.1% |
| Smartphone | 113,584 | 86.6% |
| Tablet | 77,197 | 58.9% |
| No Computing Device | 9,871 | 7.5% |
| Total | 131,109 | 100.0% |
Internet Access in Greene County
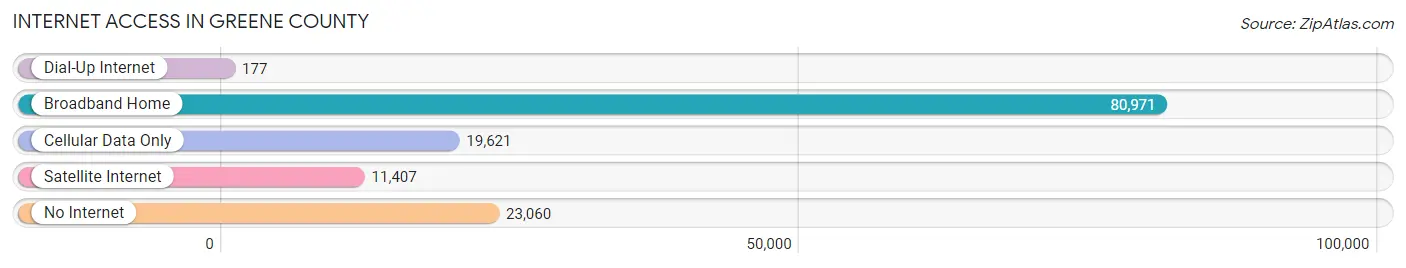
| Internet Type | # Households | % Households |
| Dial-Up Internet | 177 | 0.1% |
| Broadband Home | 80,971 | 61.8% |
| Cellular Data Only | 19,621 | 15.0% |
| Satellite Internet | 11,407 | 8.7% |
| No Internet | 23,060 | 17.6% |
| Total | 131,109 | 100.0% |
Greene County Summary
Greene County, Missouri is located in the southwestern corner of the state and is part of the Springfield Metropolitan Statistical Area. It is bordered by Christian County to the north, Webster County to the east, Lawrence County to the south, and Newton and McDonald counties to the west. The county seat is Springfield, the third-largest city in Missouri.
History
Greene County was established in 1833 and named after Revolutionary War hero General Nathanael Greene. The county was originally part of Crawford County, which was divided into Greene and Christian counties in 1833. The county was largely rural until the late 19th century, when the city of Springfield began to grow rapidly. The county was also home to several small towns, including Ash Grove, Bois D'Arc, Brookline, Fair Grove, and Willard.
Geography
Greene County covers an area of 576 square miles and is located in the Ozark Plateau region of Missouri. The county is mostly hilly and is drained by the James River and its tributaries. The highest point in the county is located in the northwest corner, at an elevation of 1,400 feet. The county is home to several state parks, including Wilson's Creek National Battlefield, which preserves the site of the first major Civil War battle west of the Mississippi River.
Economy
Greene County has a diverse economy, with a mix of manufacturing, retail, and service industries. The county is home to several large employers, including Mercy Hospital, CoxHealth, and the Springfield-Greene County Health Department. The county is also home to several major manufacturing companies, including Kraft Foods, Nestle, and Tyson Foods. Agriculture is also an important part of the county's economy, with corn, soybeans, and wheat being the main crops.
Demographics
As of the 2010 census, Greene County had a population of 295,326, making it the fifth-most populous county in Missouri. The population was spread out, with 24.3% under the age of 18, 10.2% from 18 to 24, 28.2% from 25 to 44, 24.2% from 45 to 64, and 13.1% who were 65 years of age or older. The median age was 35.4 years. The median income for a household in the county was $45,945, and the median income for a family was $54,945.
Greene County is predominantly white, with 82.3% of the population identifying as such. Other racial groups include African Americans (11.2%), Hispanics (3.2%), and Asians (2.2%). The county is also home to a large number of Native Americans, with 1.2% of the population identifying as such. The county is also home to a large number of immigrants, with 8.2% of the population being foreign-born.
Conclusion
Greene County, Missouri is a diverse and vibrant county located in the southwestern corner of the state. It has a rich history and a diverse economy, with a mix of manufacturing, retail, and service industries. The county is also home to a large and diverse population, with a mix of racial and ethnic groups. Greene County is an important part of the state of Missouri and is an attractive place to live and work.
Common Questions
What is Per Capita Income in Greene County?
Per Capita income in Greene County is $33,275.
What is the Median Family Income in Greene County?
Median Family Income in Greene County is $74,318.
What is the Median Household income in Greene County?
Median Household Income in Greene County is $54,968.
What is Income or Wage Gap in Greene County?
Income or Wage Gap in Greene County is 23.8%.
Women in Greene County earn 76.2 cents for every dollar earned by a man.
What is Family Income Deficit in Greene County?
Family Income Deficit in Greene County is $9,080.
Families that are below poverty line in Greene County earn $9,080 less on average than the poverty threshold level.
What is Inequality or Gini Index in Greene County?
Inequality or Gini Index in Greene County is 0.47.
What is the Total Population of Greene County?
Total Population of Greene County is 299,188.
What is the Total Male Population of Greene County?
Total Male Population of Greene County is 146,659.
What is the Total Female Population of Greene County?
Total Female Population of Greene County is 152,529.
What is the Ratio of Males per 100 Females in Greene County?
There are 96.15 Males per 100 Females in Greene County.
What is the Ratio of Females per 100 Males in Greene County?
There are 104.00 Females per 100 Males in Greene County.
What is the Median Population Age in Greene County?
Median Population Age in Greene County is 36.3 Years.
What is the Average Family Size in Greene County
Average Family Size in Greene County is 2.8 People.
What is the Average Household Size in Greene County
Average Household Size in Greene County is 2.2 People.
How Large is the Labor Force in Greene County?
There are 151,346 People in the Labor Forcein in Greene County.
What is the Percentage of People in the Labor Force in Greene County?
62.0% of People are in the Labor Force in Greene County.
What is the Unemployment Rate in Greene County?
Unemployment Rate in Greene County is 3.9%.