Gentry County, MO Map & Demographics
Gentry County Map
Gentry County Overview
$28,968
PER CAPITA INCOME
$71,996
AVG FAMILY INCOME
$53,799
AVG HOUSEHOLD INCOME
29.7%
WAGE / INCOME GAP [ % ]
70.3¢/ $1
WAGE / INCOME GAP [ $ ]
$9,817
FAMILY INCOME DEFICIT
0.46
INEQUALITY / GINI INDEX
6,219
TOTAL POPULATION
3,034
MALE POPULATION
3,185
FEMALE POPULATION
95.26
MALES / 100 FEMALES
104.98
FEMALES / 100 MALES
40.2
MEDIAN AGE
3.3
AVG FAMILY SIZE
2.6
AVG HOUSEHOLD SIZE
2,890
LABOR FORCE [ PEOPLE ]
59.8%
PERCENT IN LABOR FORCE
2.9%
UNEMPLOYMENT RATE
Gentry County Area Codes
Income in Gentry County
Income Overview in Gentry County
Per Capita Income in Gentry County is $28,968, while median incomes of families and households are $71,996 and $53,799 respectively.
| Characteristic | Number | Measure |
| Per Capita Income | 6,219 | $28,968 |
| Median Family Income | 1,471 | $71,996 |
| Mean Family Income | 1,471 | $92,271 |
| Median Household Income | 2,347 | $53,799 |
| Mean Household Income | 2,347 | $73,748 |
| Income Deficit | 1,471 | $9,817 |
| Wage / Income Gap (%) | 6,219 | 29.73% |
| Wage / Income Gap ($) | 6,219 | 70.27¢ per $1 |
| Gini / Inequality Index | 6,219 | 0.46 |
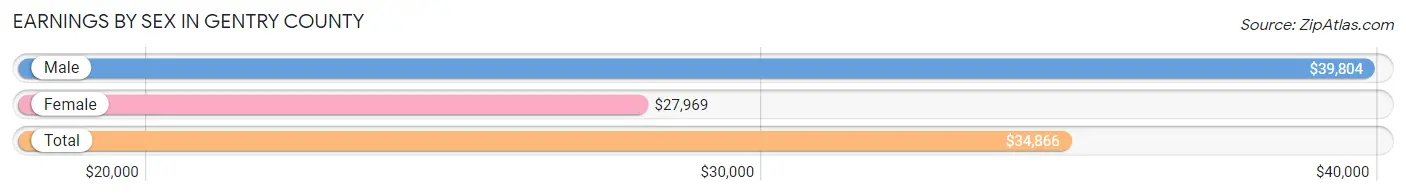
Earnings by Sex in Gentry County
Average Earnings in Gentry County are $34,866, $39,804 for men and $27,969 for women, a difference of 29.7%.
| Sex | Number | Average Earnings |
| Male | 1,746 (56.3%) | $39,804 |
| Female | 1,355 (43.7%) | $27,969 |
| Total | 3,101 (100.0%) | $34,866 |
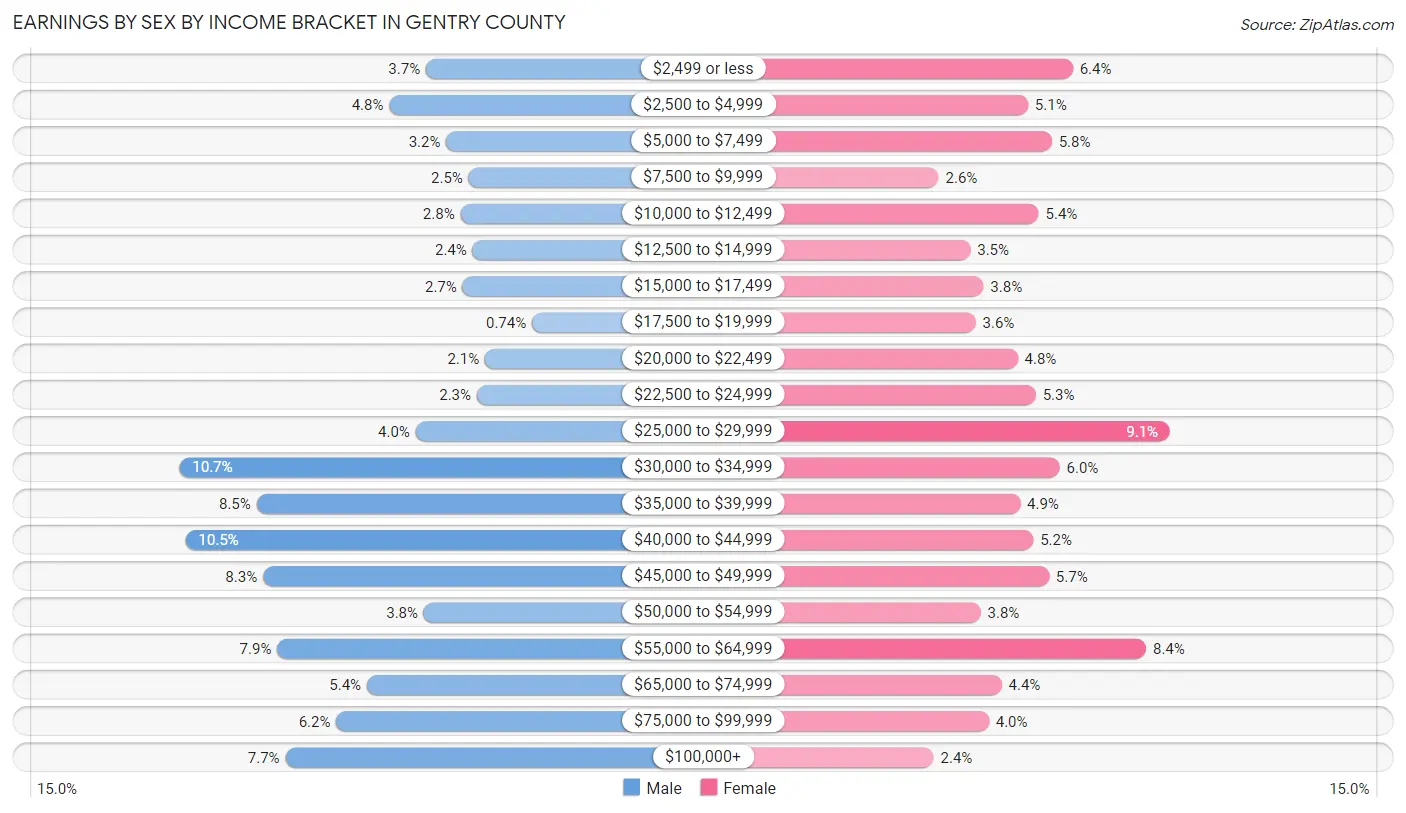
Earnings by Sex by Income Bracket in Gentry County
The most common earnings brackets in Gentry County are $30,000 to $34,999 for men (186 | 10.6%) and $25,000 to $29,999 for women (123 | 9.1%).
| Income | Male | Female |
| $2,499 or less | 65 (3.7%) | 86 (6.4%) |
| $2,500 to $4,999 | 83 (4.8%) | 69 (5.1%) |
| $5,000 to $7,499 | 55 (3.2%) | 78 (5.8%) |
| $7,500 to $9,999 | 44 (2.5%) | 35 (2.6%) |
| $10,000 to $12,499 | 48 (2.8%) | 73 (5.4%) |
| $12,500 to $14,999 | 42 (2.4%) | 47 (3.5%) |
| $15,000 to $17,499 | 47 (2.7%) | 52 (3.8%) |
| $17,500 to $19,999 | 13 (0.7%) | 49 (3.6%) |
| $20,000 to $22,499 | 36 (2.1%) | 65 (4.8%) |
| $22,500 to $24,999 | 40 (2.3%) | 72 (5.3%) |
| $25,000 to $29,999 | 70 (4.0%) | 123 (9.1%) |
| $30,000 to $34,999 | 186 (10.6%) | 81 (6.0%) |
| $35,000 to $39,999 | 148 (8.5%) | 66 (4.9%) |
| $40,000 to $44,999 | 183 (10.5%) | 71 (5.2%) |
| $45,000 to $49,999 | 145 (8.3%) | 77 (5.7%) |
| $50,000 to $54,999 | 66 (3.8%) | 51 (3.8%) |
| $55,000 to $64,999 | 138 (7.9%) | 114 (8.4%) |
| $65,000 to $74,999 | 94 (5.4%) | 59 (4.3%) |
| $75,000 to $99,999 | 109 (6.2%) | 54 (4.0%) |
| $100,000+ | 134 (7.7%) | 33 (2.4%) |
| Total | 1,746 (100.0%) | 1,355 (100.0%) |
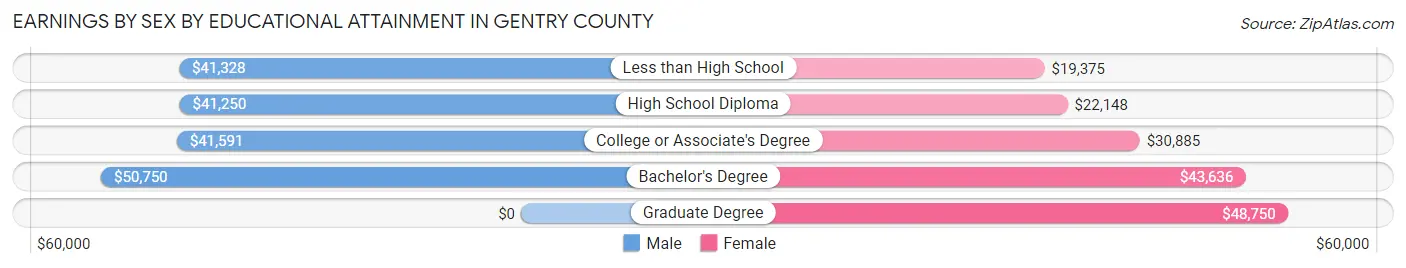
Earnings by Sex by Educational Attainment in Gentry County
Average earnings in Gentry County are $41,973 for men and $30,147 for women, a difference of 28.2%. Men with an educational attainment of bachelor's degree enjoy the highest average annual earnings of $50,750, while those with high school diploma education earn the least with $41,250. Women with an educational attainment of graduate degree earn the most with the average annual earnings of $48,750, while those with less than high school education have the smallest earnings of $19,375.
| Educational Attainment | Male Income | Female Income |
| Less than High School | $41,328 | $19,375 |
| High School Diploma | $41,250 | $22,148 |
| College or Associate's Degree | $41,591 | $30,885 |
| Bachelor's Degree | $50,750 | $43,636 |
| Graduate Degree | - | - |
| Total | $41,973 | $30,147 |
Family Income in Gentry County
Family Income Brackets in Gentry County
According to the Gentry County family income data, there are 309 families falling into the $50,000 to $74,999 income range, which is the most common income bracket and makes up 21.0% of all families. Conversely, the $10,000 to $14,999 income bracket is the least frequent group with only 25 families (1.7%) belonging to this category.
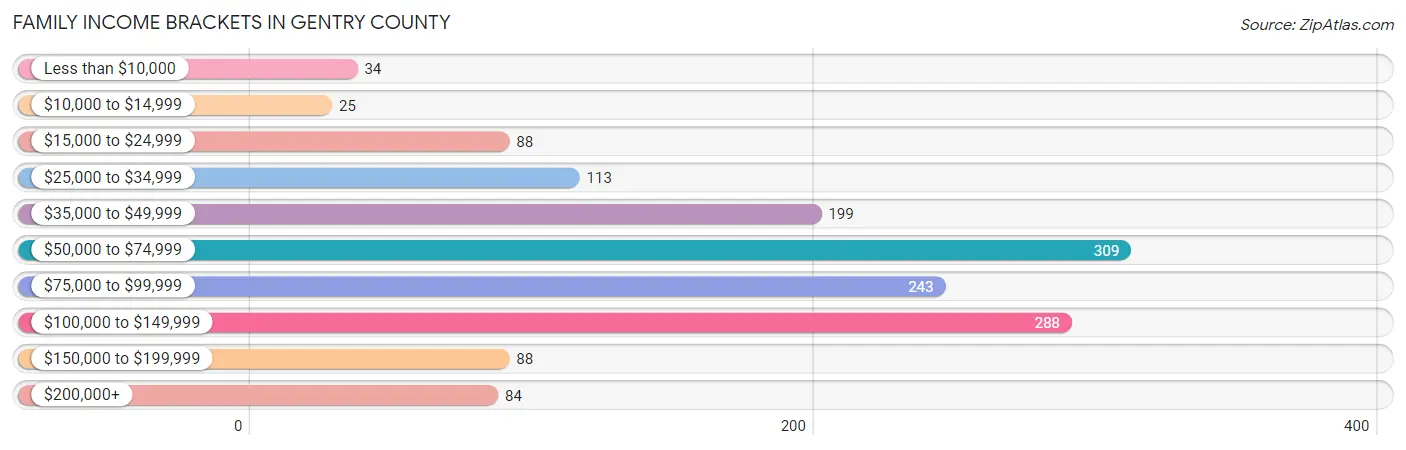
| Income Bracket | # Families | % Families |
| Less than $10,000 | 34 | 2.3% |
| $10,000 to $14,999 | 25 | 1.7% |
| $15,000 to $24,999 | 88 | 6.0% |
| $25,000 to $34,999 | 113 | 7.7% |
| $35,000 to $49,999 | 199 | 13.5% |
| $50,000 to $74,999 | 309 | 21.0% |
| $75,000 to $99,999 | 243 | 16.5% |
| $100,000 to $149,999 | 288 | 19.6% |
| $150,000 to $199,999 | 88 | 6.0% |
| $200,000+ | 84 | 5.7% |
Family Income by Famaliy Size in Gentry County
4-person families (200 | 13.6%) account for the highest median family income in Gentry County with $93,125 per family, while 2-person families (756 | 51.4%) have the highest median income of $35,694 per family member.
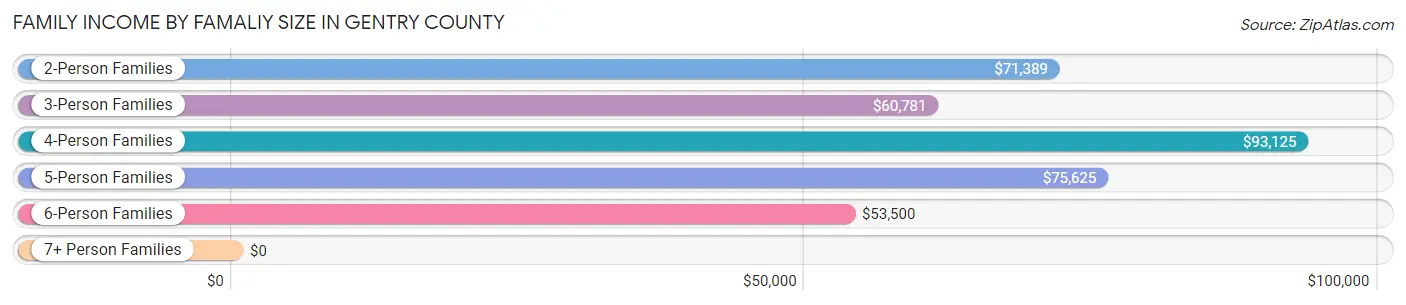
| Income Bracket | # Families | Median Income |
| 2-Person Families | 756 (51.4%) | $71,389 |
| 3-Person Families | 276 (18.8%) | $60,781 |
| 4-Person Families | 200 (13.6%) | $93,125 |
| 5-Person Families | 129 (8.8%) | $75,625 |
| 6-Person Families | 80 (5.4%) | $53,500 |
| 7+ Person Families | 30 (2.0%) | $0 |
| Total | 1,471 (100.0%) | $71,996 |
Family Income by Number of Earners in Gentry County
The median family income in Gentry County is $71,996, with families comprising 3+ earners (172) having the highest median family income of $103,587, while families with no earners (228) have the lowest median family income of $42,500, accounting for 11.7% and 15.5% of families, respectively.
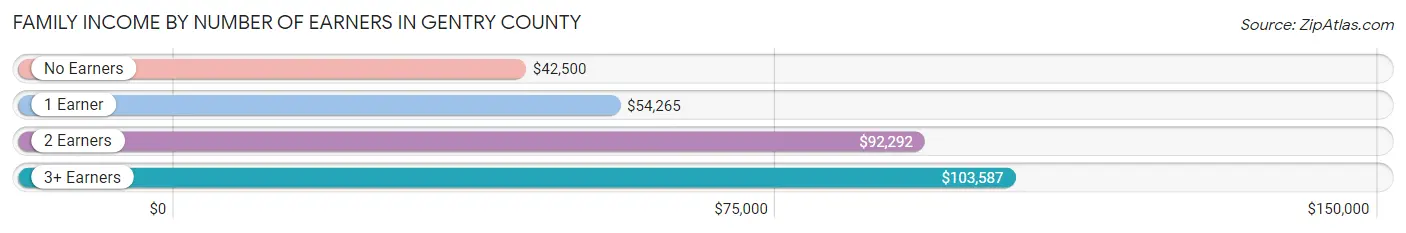
| Number of Earners | # Families | Median Income |
| No Earners | 228 (15.5%) | $42,500 |
| 1 Earner | 474 (32.2%) | $54,265 |
| 2 Earners | 597 (40.6%) | $92,292 |
| 3+ Earners | 172 (11.7%) | $103,587 |
| Total | 1,471 (100.0%) | $71,996 |
Household Income in Gentry County
Household Income Brackets in Gentry County
With 413 households falling in the category, the $50,000 to $74,999 income range is the most frequent in Gentry County, accounting for 17.6% of all households. In contrast, only 84 households (3.6%) fall into the $200,000+ income bracket, making it the least populous group.
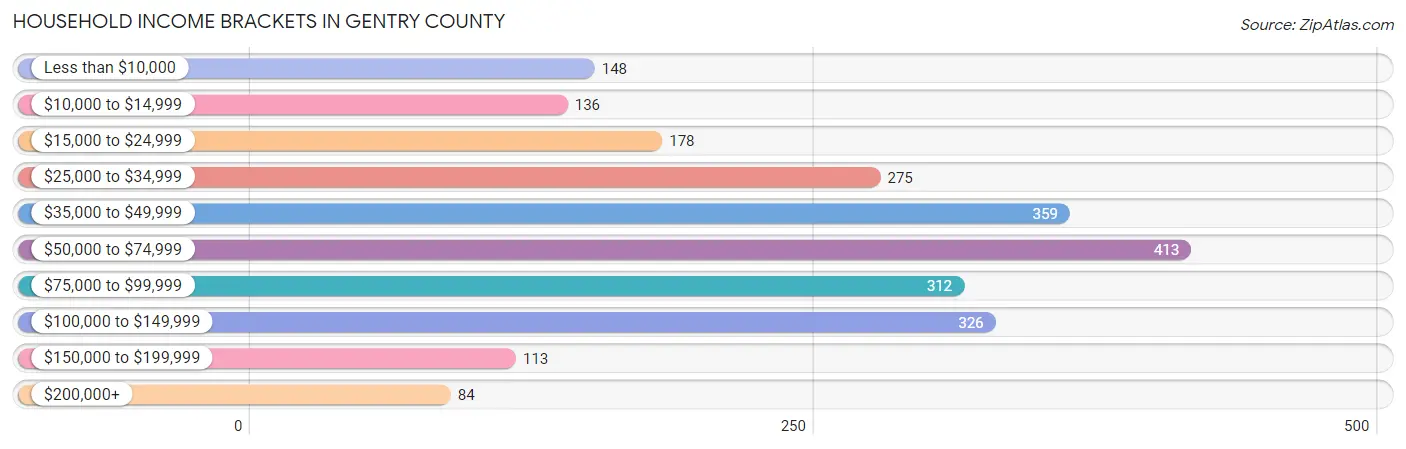
| Income Bracket | # Households | % Households |
| Less than $10,000 | 148 | 6.3% |
| $10,000 to $14,999 | 136 | 5.8% |
| $15,000 to $24,999 | 178 | 7.6% |
| $25,000 to $34,999 | 275 | 11.7% |
| $35,000 to $49,999 | 359 | 15.3% |
| $50,000 to $74,999 | 413 | 17.6% |
| $75,000 to $99,999 | 312 | 13.3% |
| $100,000 to $149,999 | 326 | 13.9% |
| $150,000 to $199,999 | 113 | 4.8% |
| $200,000+ | 84 | 3.6% |
Household Income by Householder Age in Gentry County
The median household income in Gentry County is $53,799, with the highest median household income of $70,592 found in the 25 to 44 years age bracket for the primary householder. A total of 645 households (27.5%) fall into this category. Meanwhile, the 15 to 24 years age bracket for the primary householder has the lowest median household income of $33,472, with 79 households (3.4%) in this group.
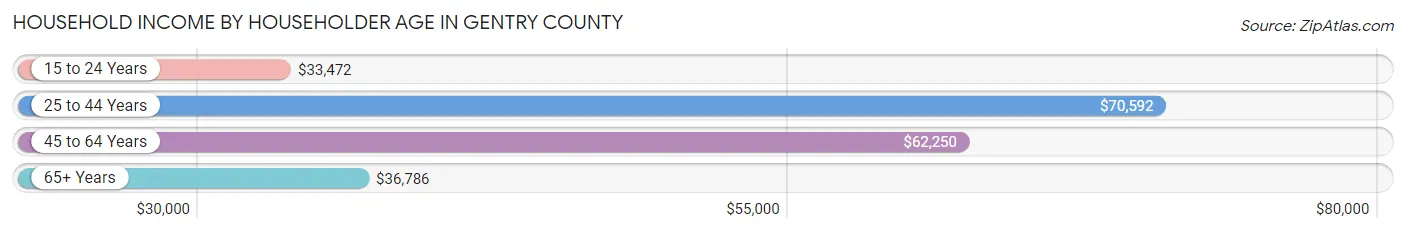
| Income Bracket | # Households | Median Income |
| 15 to 24 Years | 79 (3.4%) | $33,472 |
| 25 to 44 Years | 645 (27.5%) | $70,592 |
| 45 to 64 Years | 899 (38.3%) | $62,250 |
| 65+ Years | 724 (30.8%) | $36,786 |
| Total | 2,347 (100.0%) | $53,799 |
Poverty in Gentry County
Income Below Poverty by Sex and Age in Gentry County
With 12.9% poverty level for males and 17.4% for females among the residents of Gentry County, 75 year old and over males and 18 to 24 year old females are the most vulnerable to poverty, with 47 males (25.8%) and 67 females (31.5%) in their respective age groups living below the poverty level.
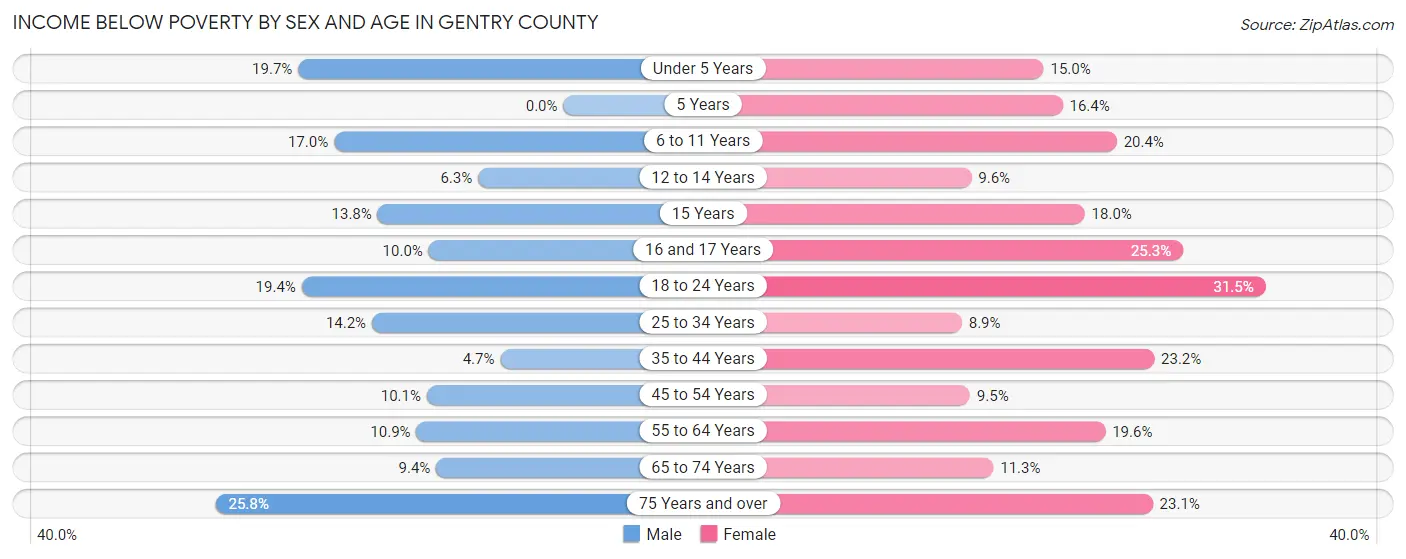
| Age Bracket | Male | Female |
| Under 5 Years | 38 (19.7%) | 34 (15.0%) |
| 5 Years | 0 (0.0%) | 10 (16.4%) |
| 6 to 11 Years | 47 (17.0%) | 60 (20.4%) |
| 12 to 14 Years | 5 (6.3%) | 10 (9.6%) |
| 15 Years | 4 (13.8%) | 11 (18.0%) |
| 16 and 17 Years | 9 (10.0%) | 19 (25.3%) |
| 18 to 24 Years | 48 (19.4%) | 67 (31.5%) |
| 25 to 34 Years | 56 (14.2%) | 31 (8.9%) |
| 35 to 44 Years | 16 (4.7%) | 80 (23.2%) |
| 45 to 54 Years | 35 (10.1%) | 33 (9.5%) |
| 55 to 64 Years | 48 (10.9%) | 89 (19.6%) |
| 65 to 74 Years | 27 (9.4%) | 36 (11.3%) |
| 75 Years and over | 47 (25.8%) | 63 (23.1%) |
| Total | 380 (12.9%) | 543 (17.4%) |
Income Above Poverty by Sex and Age in Gentry County
According to the poverty statistics in Gentry County, males aged 5 years and females aged 25 to 34 years are the age groups that are most secure financially, with 100.0% of males and 91.1% of females in these age groups living above the poverty line.
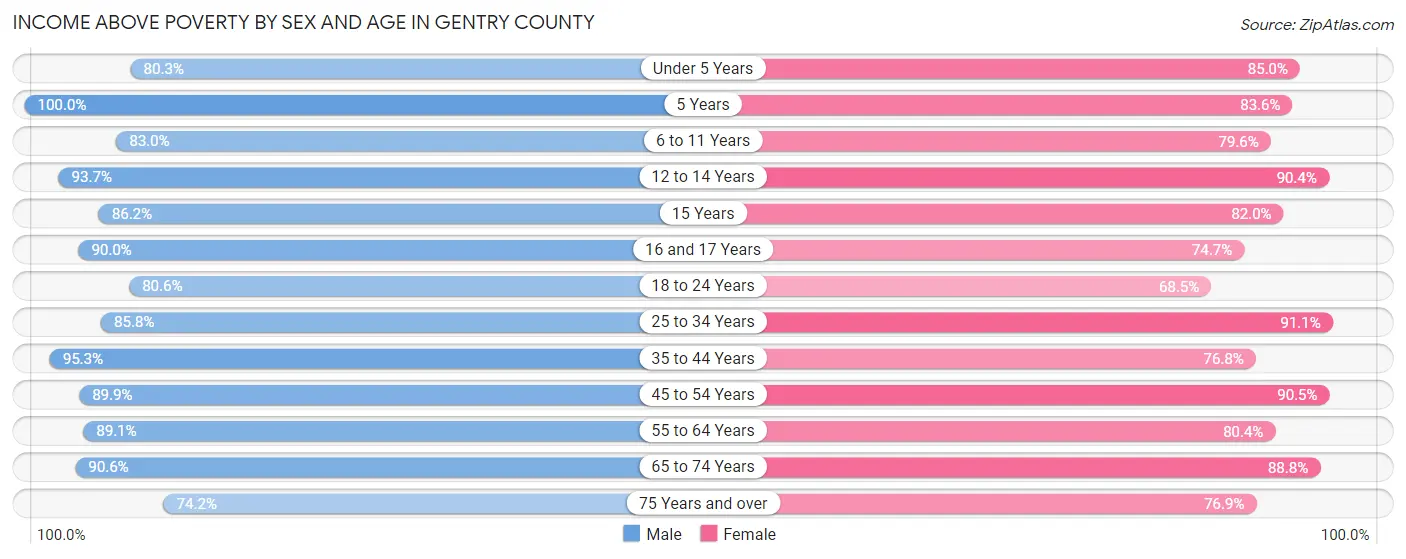
| Age Bracket | Male | Female |
| Under 5 Years | 155 (80.3%) | 193 (85.0%) |
| 5 Years | 45 (100.0%) | 51 (83.6%) |
| 6 to 11 Years | 229 (83.0%) | 234 (79.6%) |
| 12 to 14 Years | 74 (93.7%) | 94 (90.4%) |
| 15 Years | 25 (86.2%) | 50 (82.0%) |
| 16 and 17 Years | 81 (90.0%) | 56 (74.7%) |
| 18 to 24 Years | 199 (80.6%) | 146 (68.5%) |
| 25 to 34 Years | 338 (85.8%) | 317 (91.1%) |
| 35 to 44 Years | 326 (95.3%) | 265 (76.8%) |
| 45 to 54 Years | 310 (89.9%) | 314 (90.5%) |
| 55 to 64 Years | 392 (89.1%) | 366 (80.4%) |
| 65 to 74 Years | 259 (90.6%) | 284 (88.7%) |
| 75 Years and over | 135 (74.2%) | 210 (76.9%) |
| Total | 2,568 (87.1%) | 2,580 (82.6%) |
Income Below Poverty Among Married-Couple Families in Gentry County
The poverty statistics for married-couple families in Gentry County show that 5.9% or 71 of the total 1,211 families live below the poverty line. Families with 5 or more children have the highest poverty rate of 17.6%, comprising of 3 families. On the other hand, families with no children have the lowest poverty rate of 4.1%, which includes 30 families.
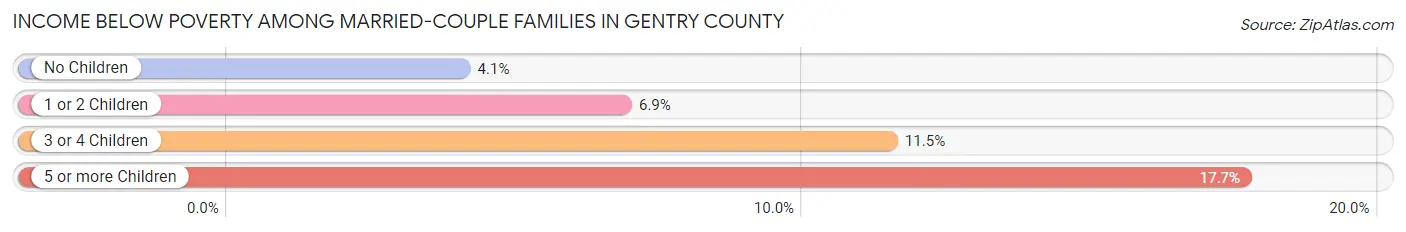
| Children | Above Poverty | Below Poverty |
| No Children | 710 (96.0%) | 30 (4.1%) |
| 1 or 2 Children | 285 (93.1%) | 21 (6.9%) |
| 3 or 4 Children | 131 (88.5%) | 17 (11.5%) |
| 5 or more Children | 14 (82.4%) | 3 (17.6%) |
| Total | 1,140 (94.1%) | 71 (5.9%) |
Income Below Poverty Among Single-Parent Households in Gentry County
According to the poverty data in Gentry County, 20.5% or 17 single-father households and 38.4% or 68 single-mother households are living below the poverty line. Among single-father households, those with 1 or 2 children have the highest poverty rate, with 17 households (27.9%) experiencing poverty. Likewise, among single-mother households, those with 3 or 4 children have the highest poverty rate, with 11 households (73.3%) falling below the poverty line.
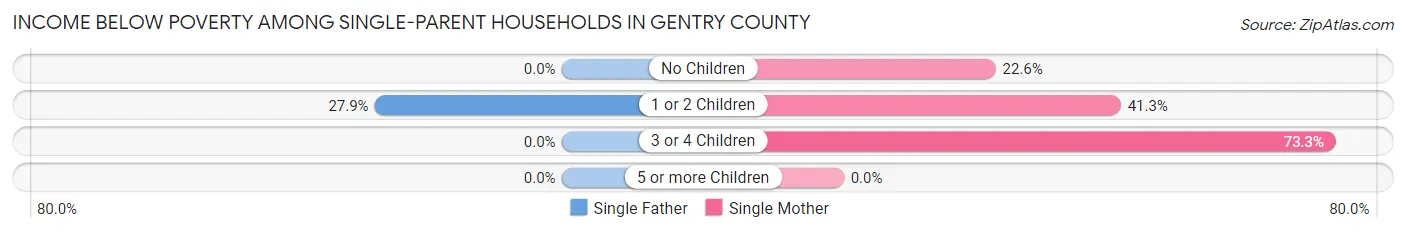
| Children | Single Father | Single Mother |
| No Children | 0 (0.0%) | 12 (22.6%) |
| 1 or 2 Children | 17 (27.9%) | 45 (41.3%) |
| 3 or 4 Children | 0 (0.0%) | 11 (73.3%) |
| 5 or more Children | 0 (0.0%) | 0 (0.0%) |
| Total | 17 (20.5%) | 68 (38.4%) |
Income Below Poverty Among Married-Couple vs Single-Parent Households in Gentry County
The poverty data for Gentry County shows that 71 of the married-couple family households (5.9%) and 85 of the single-parent households (32.7%) are living below the poverty level. Within the married-couple family households, those with 5 or more children have the highest poverty rate, with 3 households (17.6%) falling below the poverty line. Among the single-parent households, those with 3 or 4 children have the highest poverty rate, with 11 household (52.4%) living below poverty.
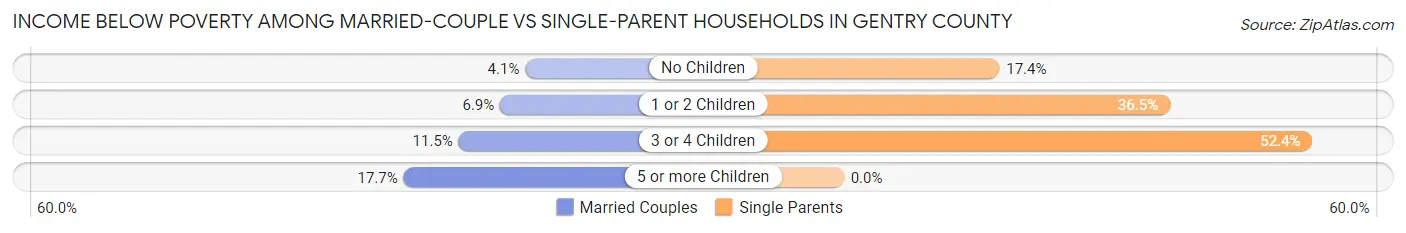
| Children | Married-Couple Families | Single-Parent Households |
| No Children | 30 (4.1%) | 12 (17.4%) |
| 1 or 2 Children | 21 (6.9%) | 62 (36.5%) |
| 3 or 4 Children | 17 (11.5%) | 11 (52.4%) |
| 5 or more Children | 3 (17.6%) | 0 (0.0%) |
| Total | 71 (5.9%) | 85 (32.7%) |
Race in Gentry County
The most populous races in Gentry County are White / Caucasian (5,974 | 96.1%), Hispanic or Latino (128 | 2.1%), and Asian (98 | 1.6%).
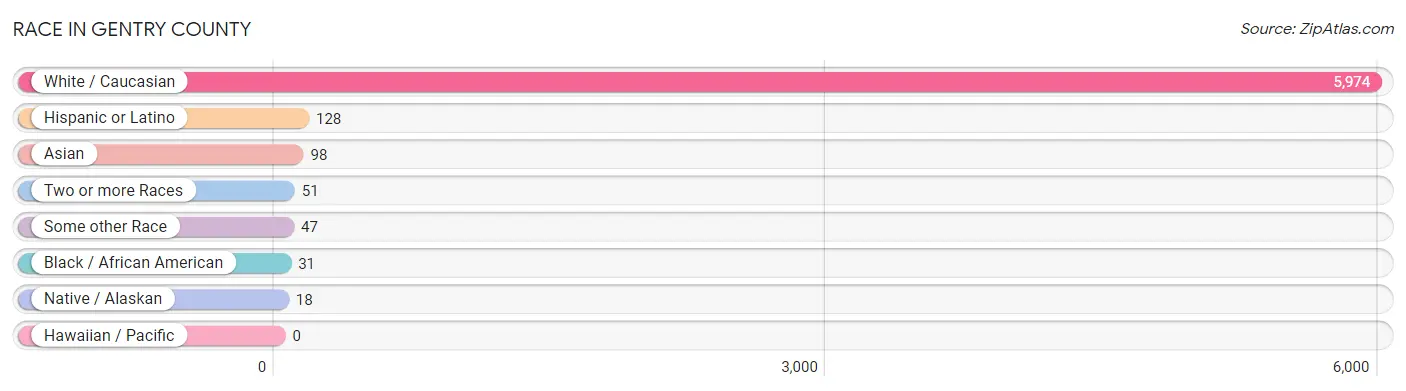
| Race | # Population | % Population |
| Asian | 98 | 1.6% |
| Black / African American | 31 | 0.5% |
| Hawaiian / Pacific | 0 | 0.0% |
| Hispanic or Latino | 128 | 2.1% |
| Native / Alaskan | 18 | 0.3% |
| White / Caucasian | 5,974 | 96.1% |
| Two or more Races | 51 | 0.8% |
| Some other Race | 47 | 0.8% |
| Total | 6,219 | 100.0% |
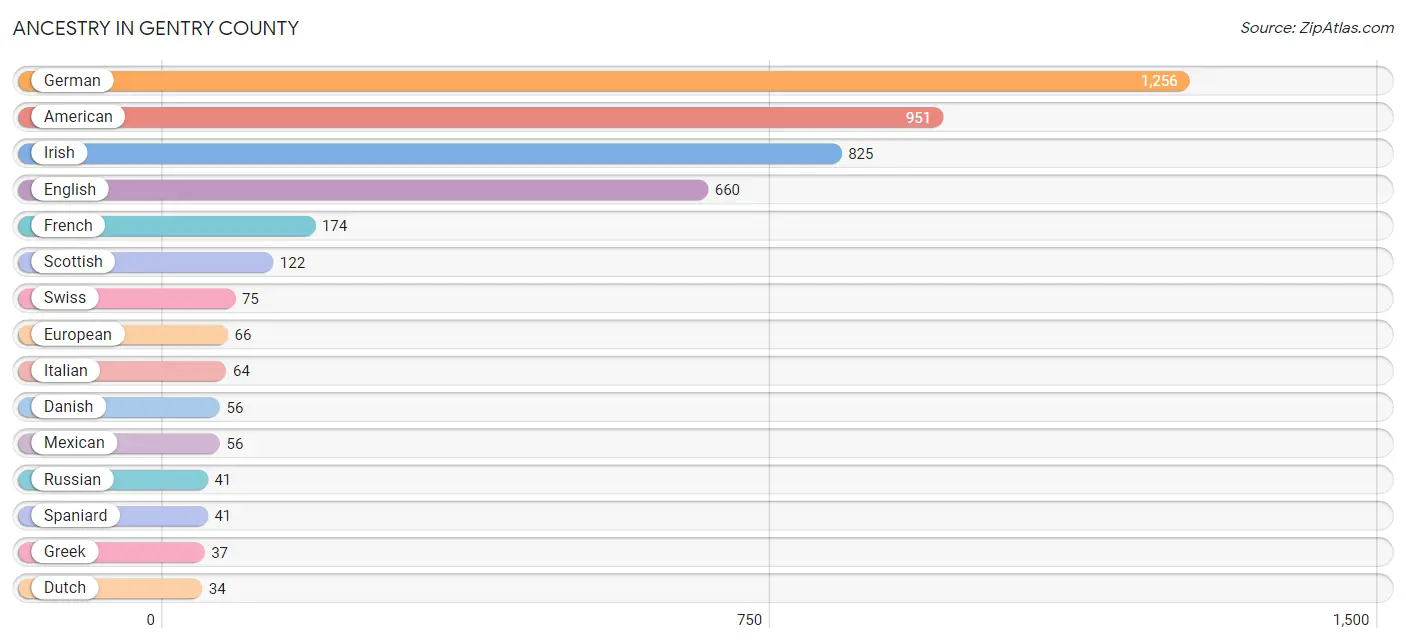
Ancestry in Gentry County
The most populous ancestries reported in Gentry County are German (1,256 | 20.2%), American (951 | 15.3%), Irish (825 | 13.3%), English (660 | 10.6%), and French (174 | 2.8%), together accounting for 62.2% of all Gentry County residents.
| Ancestry | # Population | % Population |
| African | 6 | 0.1% |
| American | 951 | 15.3% |
| Austrian | 3 | 0.1% |
| Bhutanese | 19 | 0.3% |
| Burmese | 22 | 0.4% |
| Central American | 6 | 0.1% |
| Croatian | 4 | 0.1% |
| Czech | 14 | 0.2% |
| Danish | 56 | 0.9% |
| Dutch | 34 | 0.5% |
| Eastern European | 19 | 0.3% |
| English | 660 | 10.6% |
| European | 66 | 1.1% |
| French | 174 | 2.8% |
| German | 1,256 | 20.2% |
| Greek | 37 | 0.6% |
| Icelander | 3 | 0.1% |
| Indian (Asian) | 21 | 0.3% |
| Irish | 825 | 13.3% |
| Italian | 64 | 1.0% |
| Korean | 21 | 0.3% |
| Mexican | 56 | 0.9% |
| Northern European | 2 | 0.0% |
| Norwegian | 24 | 0.4% |
| Pennsylvania German | 2 | 0.0% |
| Polish | 29 | 0.5% |
| Puerto Rican | 10 | 0.2% |
| Romanian | 8 | 0.1% |
| Russian | 41 | 0.7% |
| Salvadoran | 6 | 0.1% |
| Scandinavian | 2 | 0.0% |
| Scotch-Irish | 30 | 0.5% |
| Scottish | 122 | 2.0% |
| Slavic | 4 | 0.1% |
| South African | 7 | 0.1% |
| Spaniard | 41 | 0.7% |
| Spanish | 8 | 0.1% |
| Subsaharan African | 13 | 0.2% |
| Swedish | 28 | 0.4% |
| Swiss | 75 | 1.2% |
| Ukrainian | 2 | 0.0% |
| Welsh | 22 | 0.4% |
| Yuman | 1 | 0.0% | View All 43 Rows |
Immigrants in Gentry County
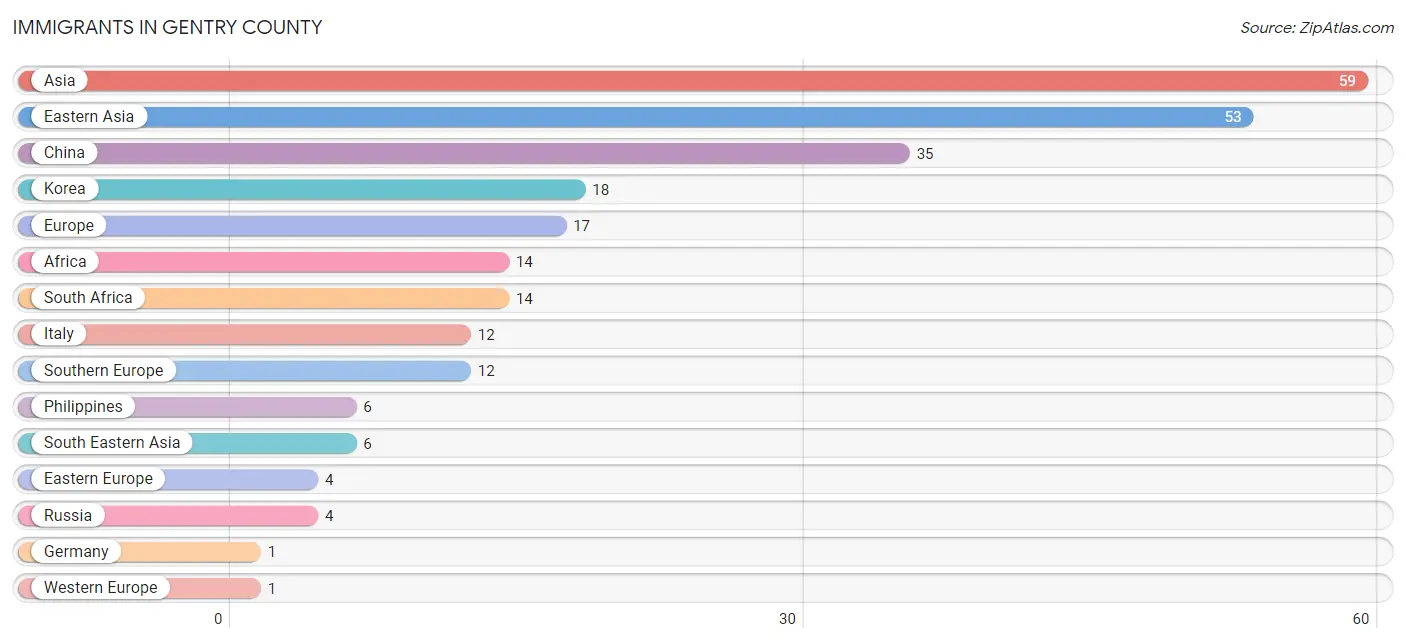
The most numerous immigrant groups reported in Gentry County came from Asia (59 | 0.9%), Eastern Asia (53 | 0.9%), China (35 | 0.6%), Korea (18 | 0.3%), and Europe (17 | 0.3%), together accounting for 2.9% of all Gentry County residents.
| Immigration Origin | # Population | % Population |
| Africa | 14 | 0.2% |
| Asia | 59 | 0.9% |
| China | 35 | 0.6% |
| Eastern Asia | 53 | 0.9% |
| Eastern Europe | 4 | 0.1% |
| Europe | 17 | 0.3% |
| Germany | 1 | 0.0% |
| Italy | 12 | 0.2% |
| Korea | 18 | 0.3% |
| Philippines | 6 | 0.1% |
| Russia | 4 | 0.1% |
| South Africa | 14 | 0.2% |
| South Eastern Asia | 6 | 0.1% |
| Southern Europe | 12 | 0.2% |
| Western Europe | 1 | 0.0% | View All 15 Rows |
Sex and Age in Gentry County
Sex and Age in Gentry County
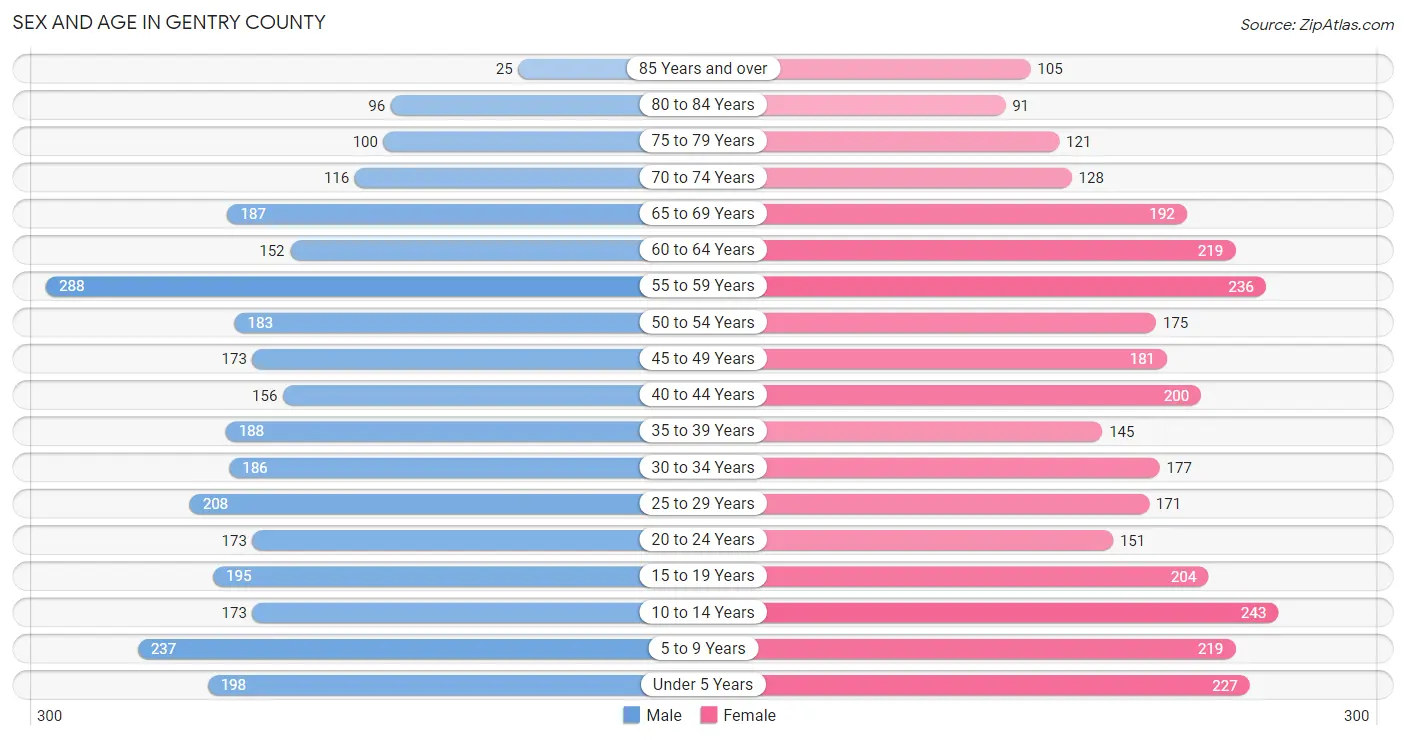
The most populous age groups in Gentry County are 55 to 59 Years (288 | 9.5%) for men and 10 to 14 Years (243 | 7.6%) for women.
| Age Bracket | Male | Female |
| Under 5 Years | 198 (6.5%) | 227 (7.1%) |
| 5 to 9 Years | 237 (7.8%) | 219 (6.9%) |
| 10 to 14 Years | 173 (5.7%) | 243 (7.6%) |
| 15 to 19 Years | 195 (6.4%) | 204 (6.4%) |
| 20 to 24 Years | 173 (5.7%) | 151 (4.7%) |
| 25 to 29 Years | 208 (6.9%) | 171 (5.4%) |
| 30 to 34 Years | 186 (6.1%) | 177 (5.6%) |
| 35 to 39 Years | 188 (6.2%) | 145 (4.5%) |
| 40 to 44 Years | 156 (5.1%) | 200 (6.3%) |
| 45 to 49 Years | 173 (5.7%) | 181 (5.7%) |
| 50 to 54 Years | 183 (6.0%) | 175 (5.5%) |
| 55 to 59 Years | 288 (9.5%) | 236 (7.4%) |
| 60 to 64 Years | 152 (5.0%) | 219 (6.9%) |
| 65 to 69 Years | 187 (6.2%) | 192 (6.0%) |
| 70 to 74 Years | 116 (3.8%) | 128 (4.0%) |
| 75 to 79 Years | 100 (3.3%) | 121 (3.8%) |
| 80 to 84 Years | 96 (3.2%) | 91 (2.9%) |
| 85 Years and over | 25 (0.8%) | 105 (3.3%) |
| Total | 3,034 (100.0%) | 3,185 (100.0%) |
Families and Households in Gentry County
Median Family Size in Gentry County
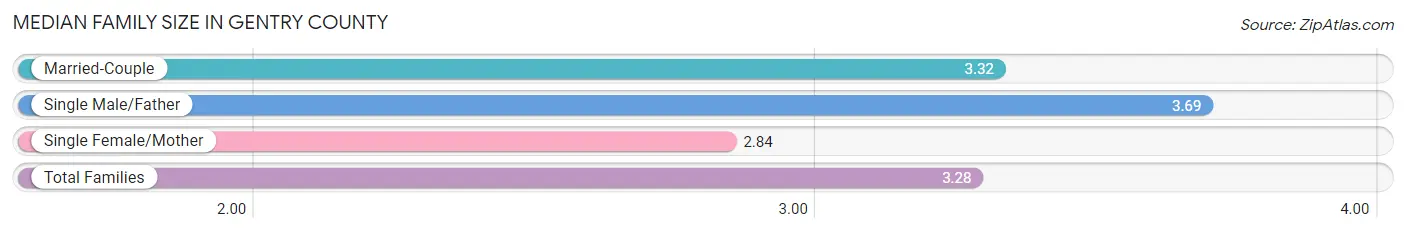
The median family size in Gentry County is 3.28 persons per family, with single male/father families (83 | 5.6%) accounting for the largest median family size of 3.69 persons per family. On the other hand, single female/mother families (177 | 12.0%) represent the smallest median family size with 2.84 persons per family.
| Family Type | # Families | Family Size |
| Married-Couple | 1,211 (82.3%) | 3.32 |
| Single Male/Father | 83 (5.6%) | 3.69 |
| Single Female/Mother | 177 (12.0%) | 2.84 |
| Total Families | 1,471 (100.0%) | 3.28 |
Median Household Size in Gentry County
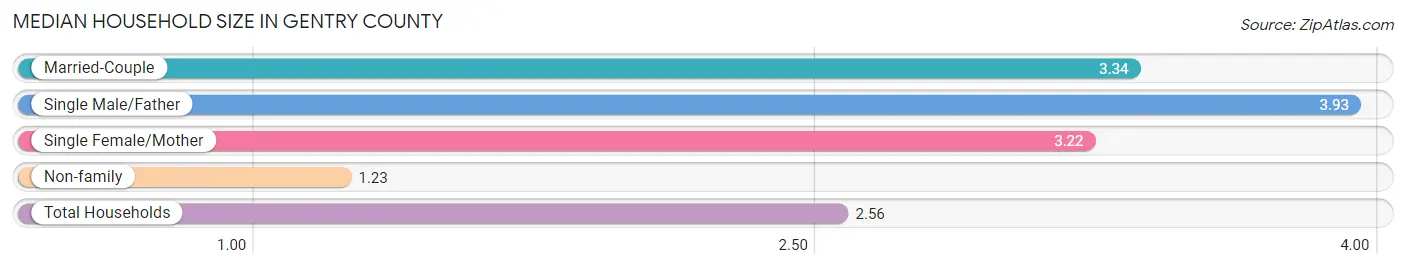
The median household size in Gentry County is 2.56 persons per household, with single male/father households (83 | 3.5%) accounting for the largest median household size of 3.93 persons per household. non-family households (876 | 37.3%) represent the smallest median household size with 1.23 persons per household.
| Household Type | # Households | Household Size |
| Married-Couple | 1,211 (51.6%) | 3.34 |
| Single Male/Father | 83 (3.5%) | 3.93 |
| Single Female/Mother | 177 (7.5%) | 3.22 |
| Non-family | 876 (37.3%) | 1.23 |
| Total Households | 2,347 (100.0%) | 2.56 |
Household Size by Marriage Status in Gentry County
Out of a total of 2,347 households in Gentry County, 1,471 (62.7%) are family households, while 876 (37.3%) are nonfamily households. The most numerous type of family households are 2-person households, comprising 691, and the most common type of nonfamily households are 1-person households, comprising 789.
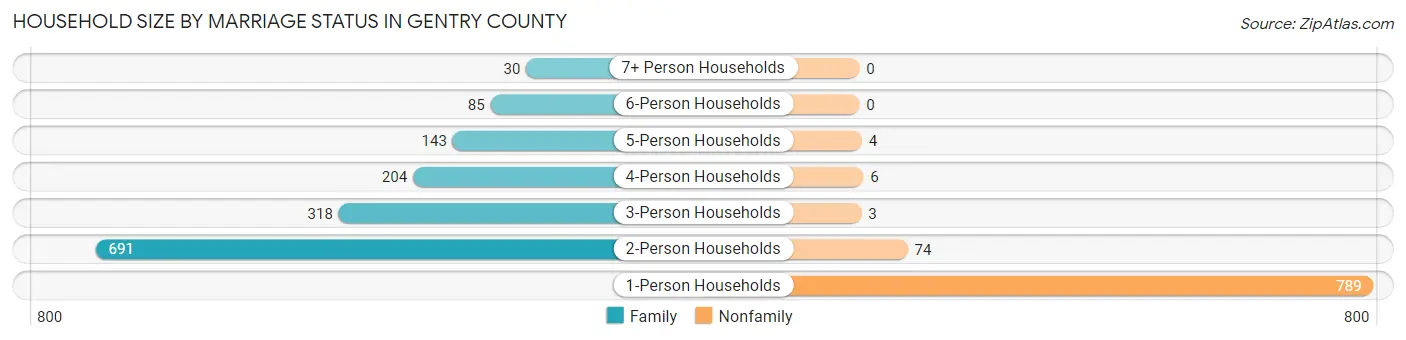
| Household Size | Family Households | Nonfamily Households |
| 1-Person Households | - | 789 (33.6%) |
| 2-Person Households | 691 (29.4%) | 74 (3.2%) |
| 3-Person Households | 318 (13.6%) | 3 (0.1%) |
| 4-Person Households | 204 (8.7%) | 6 (0.3%) |
| 5-Person Households | 143 (6.1%) | 4 (0.2%) |
| 6-Person Households | 85 (3.6%) | 0 (0.0%) |
| 7+ Person Households | 30 (1.3%) | 0 (0.0%) |
| Total | 1,471 (62.7%) | 876 (37.3%) |
Female Fertility in Gentry County
Fertility by Age in Gentry County
Average fertility rate in Gentry County is 108.0 births per 1,000 women. Women in the age bracket of 20 to 34 years have the highest fertility rate with 257.0 births per 1,000 women. Women in the age bracket of 20 to 34 years acount for 91.4% of all women with births.
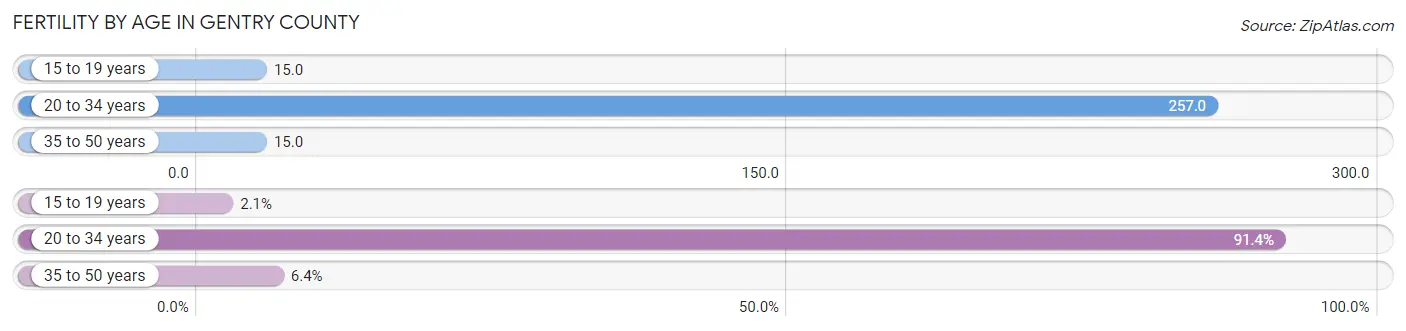
| Age Bracket | Women with Births | Births / 1,000 Women |
| 15 to 19 years | 3 (2.1%) | 15.0 |
| 20 to 34 years | 128 (91.4%) | 257.0 |
| 35 to 50 years | 9 (6.4%) | 15.0 |
| Total | 140 (100.0%) | 108.0 |
Fertility by Age by Marriage Status in Gentry County
81.4% of women with births (140) in Gentry County are married. The highest percentage of unmarried women with births falls into 15 to 19 years age bracket with 100.0% of them unmarried at the time of birth, while the lowest percentage of unmarried women with births belong to 35 to 50 years age bracket with 0.0% of them unmarried.
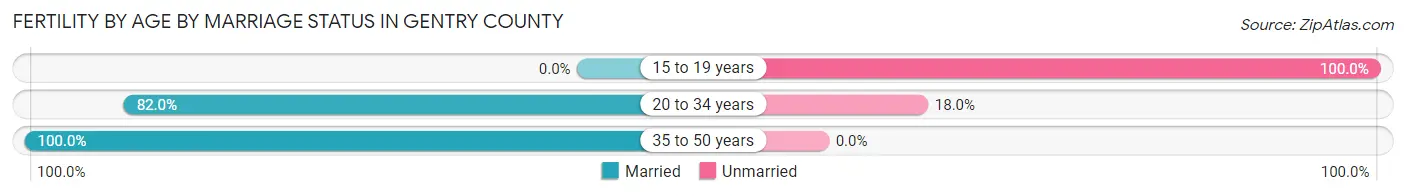
| Age Bracket | Married | Unmarried |
| 15 to 19 years | 0 (0.0%) | 3 (100.0%) |
| 20 to 34 years | 105 (82.0%) | 23 (18.0%) |
| 35 to 50 years | 9 (100.0%) | 0 (0.0%) |
| Total | 114 (81.4%) | 26 (18.6%) |
Fertility by Education in Gentry County
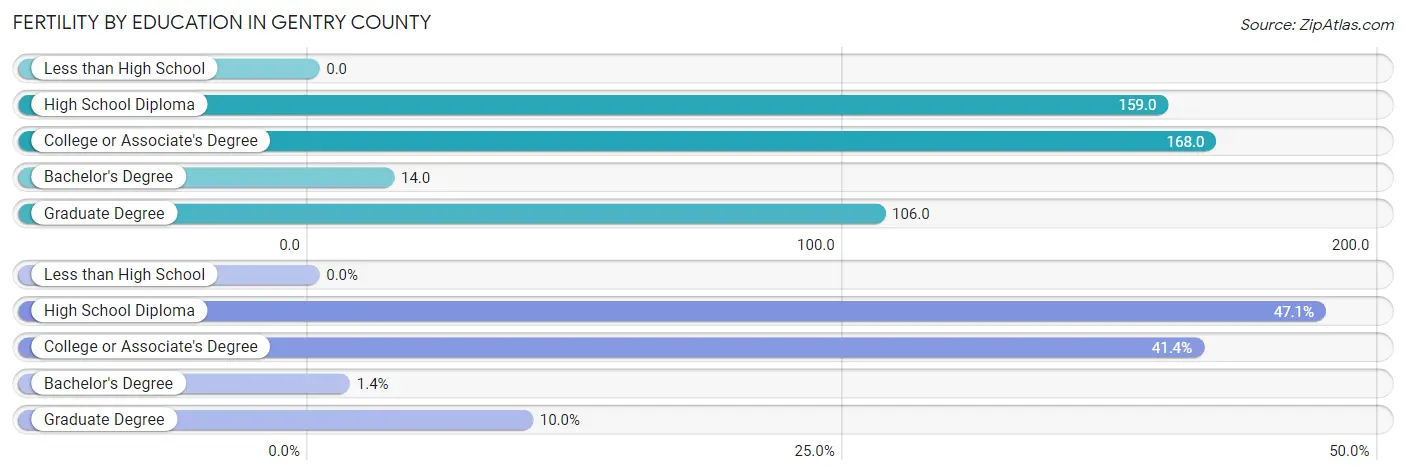
| Educational Attainment | Women with Births | Births / 1,000 Women |
| Less than High School | 0 (0.0%) | 0.0 |
| High School Diploma | 66 (47.1%) | 159.0 |
| College or Associate's Degree | 58 (41.4%) | 168.0 |
| Bachelor's Degree | 2 (1.4%) | 14.0 |
| Graduate Degree | 14 (10.0%) | 106.0 |
| Total | 140 (100.0%) | 108.0 |
Fertility by Education by Marriage Status in Gentry County
18.6% of women with births in Gentry County are unmarried. Women with the educational attainment of bachelor's degree are most likely to be married with 100.0% of them married at childbirth, while women with the educational attainment of college or associate's degree are least likely to be married with 34.5% of them unmarried at childbirth.
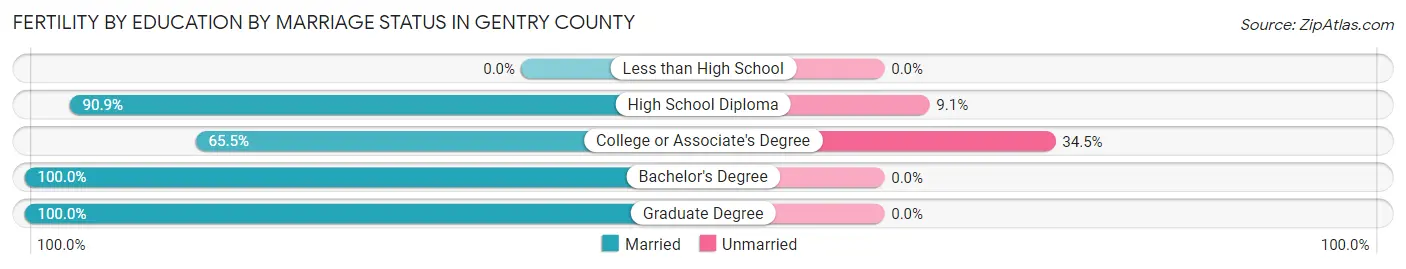
| Educational Attainment | Married | Unmarried |
| Less than High School | 0 (0.0%) | 0 (0.0%) |
| High School Diploma | 60 (90.9%) | 6 (9.1%) |
| College or Associate's Degree | 38 (65.5%) | 20 (34.5%) |
| Bachelor's Degree | 2 (100.0%) | 0 (0.0%) |
| Graduate Degree | 14 (100.0%) | 0 (0.0%) |
| Total | 114 (81.4%) | 26 (18.6%) |
Employment Characteristics in Gentry County
Employment by Class of Employer in Gentry County
Among the 2,781 employed individuals in Gentry County, private company employees (1,707 | 61.4%), self-employed (not incorporated) (298 | 10.7%), and not-for-profit organizations (293 | 10.5%) make up the most common classes of employment.
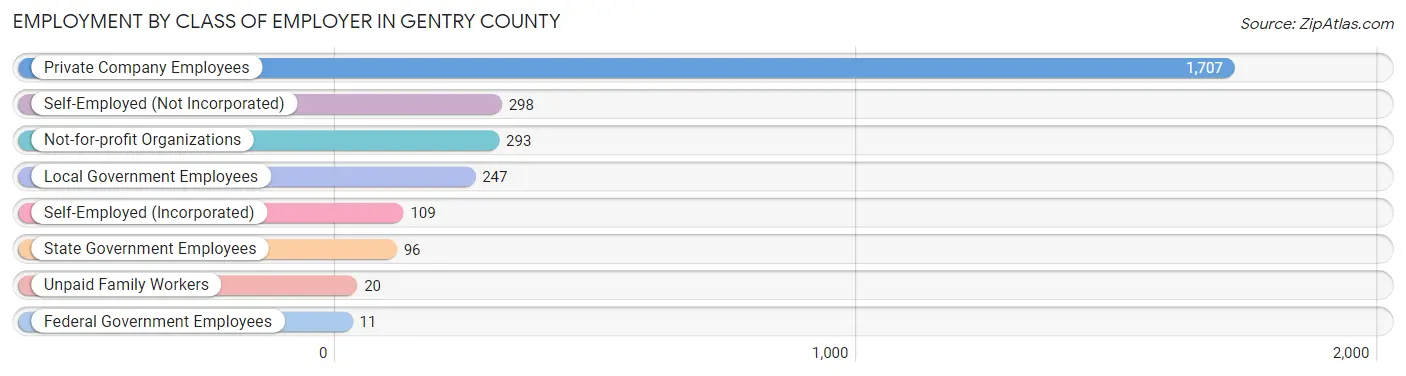
| Employer Class | # Employees | % Employees |
| Private Company Employees | 1,707 | 61.4% |
| Self-Employed (Incorporated) | 109 | 3.9% |
| Self-Employed (Not Incorporated) | 298 | 10.7% |
| Not-for-profit Organizations | 293 | 10.5% |
| Local Government Employees | 247 | 8.9% |
| State Government Employees | 96 | 3.5% |
| Federal Government Employees | 11 | 0.4% |
| Unpaid Family Workers | 20 | 0.7% |
| Total | 2,781 | 100.0% |
Employment Status by Age in Gentry County
According to the labor force statistics for Gentry County, out of the total population over 16 years of age (4,832), 59.8% or 2,890 individuals are in the labor force, with 2.9% or 84 of them unemployed. The age group with the highest labor force participation rate is 30 to 34 years, with 88.7% or 322 individuals in the labor force. Within the labor force, the 20 to 24 years age range has the highest percentage of unemployed individuals, with 7.2% or 17 of them being unemployed.
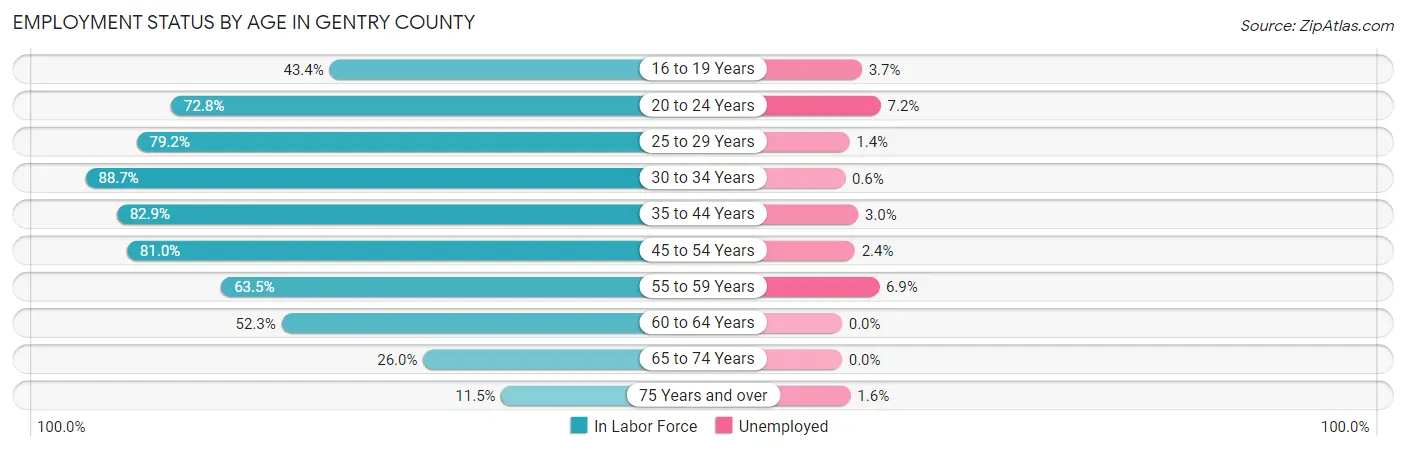
| Age Bracket | In Labor Force | Unemployed |
| 16 to 19 Years | 134 (43.4%) | 5 (3.7%) |
| 20 to 24 Years | 236 (72.8%) | 17 (7.2%) |
| 25 to 29 Years | 300 (79.2%) | 4 (1.4%) |
| 30 to 34 Years | 322 (88.7%) | 2 (0.6%) |
| 35 to 44 Years | 571 (82.9%) | 17 (3.0%) |
| 45 to 54 Years | 577 (81.0%) | 14 (2.4%) |
| 55 to 59 Years | 333 (63.5%) | 23 (6.9%) |
| 60 to 64 Years | 194 (52.3%) | 0 (0.0%) |
| 65 to 74 Years | 162 (26.0%) | 0 (0.0%) |
| 75 Years and over | 62 (11.5%) | 1 (1.6%) |
| Total | 2,890 (59.8%) | 84 (2.9%) |
Employment Status by Educational Attainment in Gentry County
According to labor force statistics for Gentry County, 75.6% of individuals (2,297) out of the total population between 25 and 64 years of age (3,038) are in the labor force, with 2.6% or 60 of them being unemployed. The group with the highest labor force participation rate are those with the educational attainment of bachelor's degree or higher, with 88.3% or 595 individuals in the labor force. Within the labor force, individuals with high school diploma education have the highest percentage of unemployment, with 4.2% or 38 of them being unemployed.
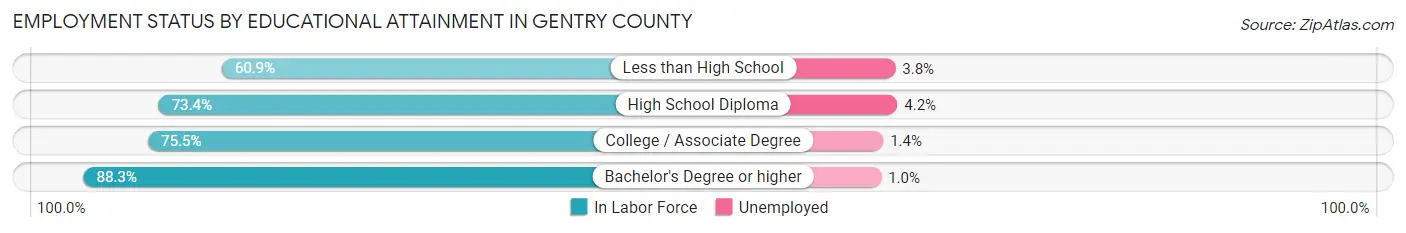
| Educational Attainment | In Labor Force | Unemployed |
| Less than High School | 240 (60.9%) | 15 (3.8%) |
| High School Diploma | 895 (73.4%) | 51 (4.2%) |
| College / Associate Degree | 566 (75.5%) | 10 (1.4%) |
| Bachelor's Degree or higher | 595 (88.3%) | 7 (1.0%) |
| Total | 2,297 (75.6%) | 79 (2.6%) |
Employment Occupations by Sex in Gentry County
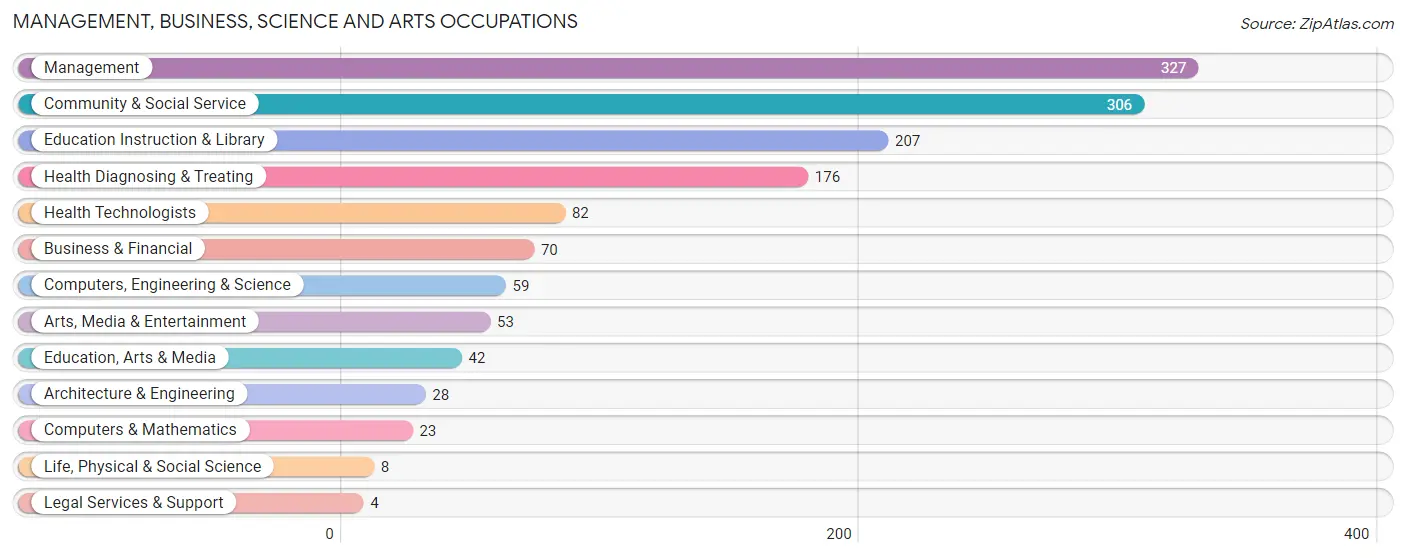
Management, Business, Science and Arts Occupations
The most common Management, Business, Science and Arts occupations in Gentry County are Management (327 | 11.7%), Community & Social Service (306 | 10.9%), Education Instruction & Library (207 | 7.4%), Health Diagnosing & Treating (176 | 6.3%), and Health Technologists (82 | 2.9%).
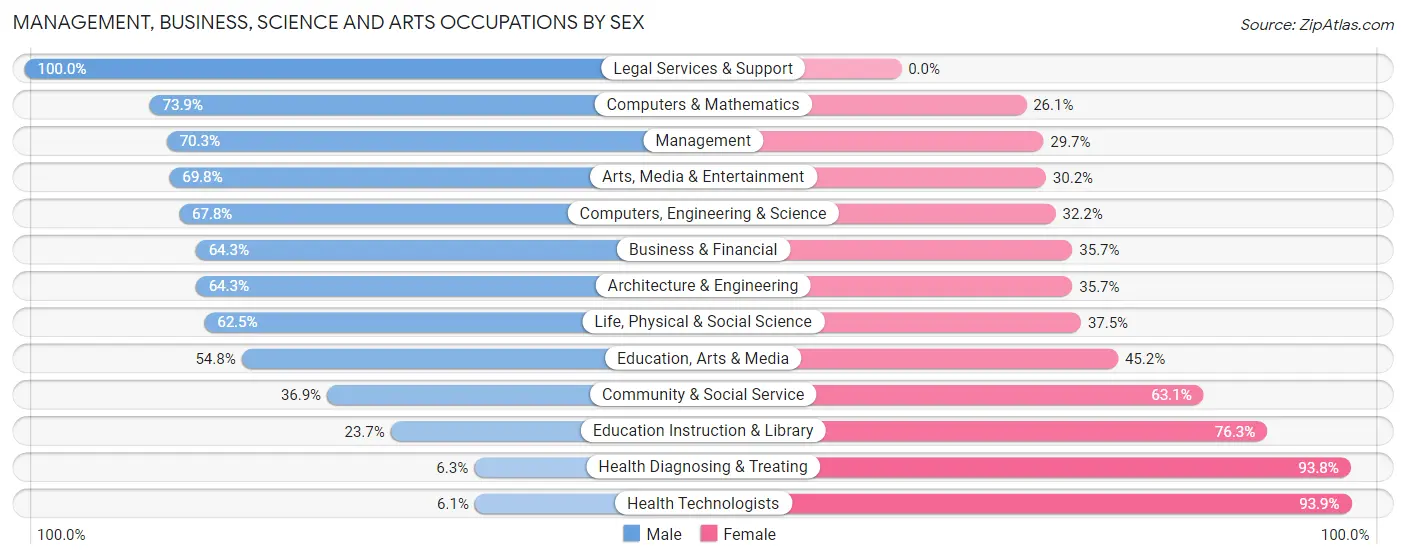
Management, Business, Science and Arts Occupations by Sex
Within the Management, Business, Science and Arts occupations in Gentry County, the most male-oriented occupations are Legal Services & Support (100.0%), Computers & Mathematics (73.9%), and Management (70.3%), while the most female-oriented occupations are Health Technologists (93.9%), Health Diagnosing & Treating (93.8%), and Education Instruction & Library (76.3%).
| Occupation | Male | Female |
| Management | 230 (70.3%) | 97 (29.7%) |
| Business & Financial | 45 (64.3%) | 25 (35.7%) |
| Computers, Engineering & Science | 40 (67.8%) | 19 (32.2%) |
| Computers & Mathematics | 17 (73.9%) | 6 (26.1%) |
| Architecture & Engineering | 18 (64.3%) | 10 (35.7%) |
| Life, Physical & Social Science | 5 (62.5%) | 3 (37.5%) |
| Community & Social Service | 113 (36.9%) | 193 (63.1%) |
| Education, Arts & Media | 23 (54.8%) | 19 (45.2%) |
| Legal Services & Support | 4 (100.0%) | 0 (0.0%) |
| Education Instruction & Library | 49 (23.7%) | 158 (76.3%) |
| Arts, Media & Entertainment | 37 (69.8%) | 16 (30.2%) |
| Health Diagnosing & Treating | 11 (6.2%) | 165 (93.8%) |
| Health Technologists | 5 (6.1%) | 77 (93.9%) |
| Total (Category) | 439 (46.8%) | 499 (53.2%) |
| Total (Overall) | 1,553 (55.4%) | 1,248 (44.6%) |
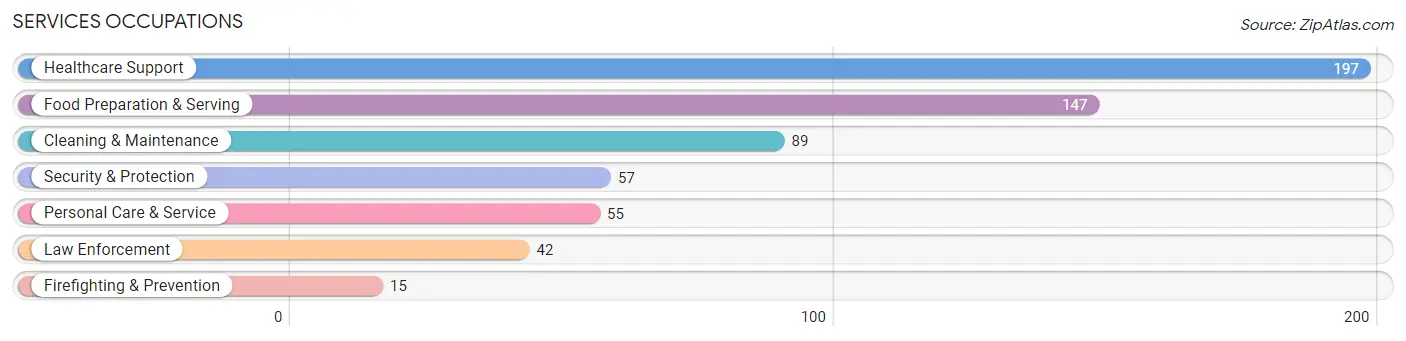
Services Occupations
The most common Services occupations in Gentry County are Healthcare Support (197 | 7.0%), Food Preparation & Serving (147 | 5.2%), Cleaning & Maintenance (89 | 3.2%), Security & Protection (57 | 2.0%), and Personal Care & Service (55 | 2.0%).
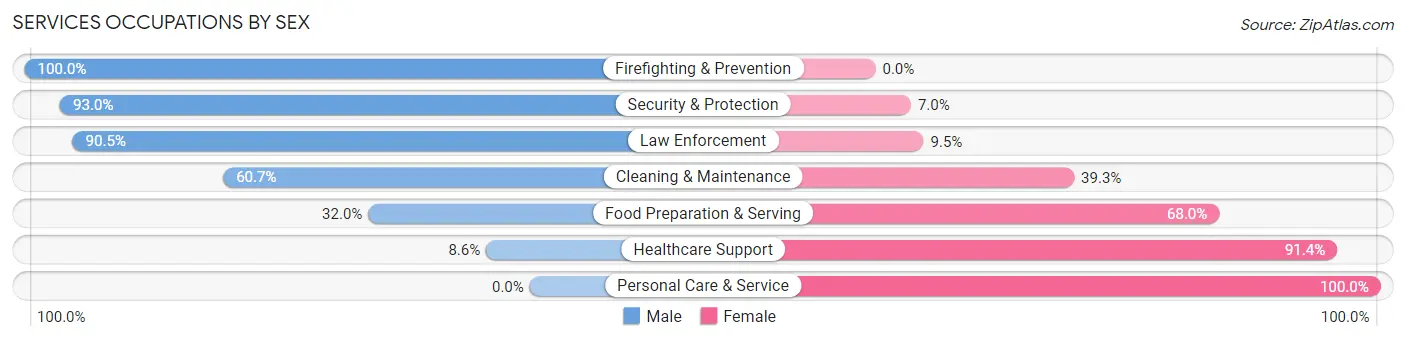
Services Occupations by Sex
Within the Services occupations in Gentry County, the most male-oriented occupations are Firefighting & Prevention (100.0%), Security & Protection (93.0%), and Law Enforcement (90.5%), while the most female-oriented occupations are Personal Care & Service (100.0%), Healthcare Support (91.4%), and Food Preparation & Serving (68.0%).
| Occupation | Male | Female |
| Healthcare Support | 17 (8.6%) | 180 (91.4%) |
| Security & Protection | 53 (93.0%) | 4 (7.0%) |
| Firefighting & Prevention | 15 (100.0%) | 0 (0.0%) |
| Law Enforcement | 38 (90.5%) | 4 (9.5%) |
| Food Preparation & Serving | 47 (32.0%) | 100 (68.0%) |
| Cleaning & Maintenance | 54 (60.7%) | 35 (39.3%) |
| Personal Care & Service | 0 (0.0%) | 55 (100.0%) |
| Total (Category) | 171 (31.4%) | 374 (68.6%) |
| Total (Overall) | 1,553 (55.4%) | 1,248 (44.6%) |
Sales and Office Occupations
The most common Sales and Office occupations in Gentry County are Office & Administration (215 | 7.7%), and Sales & Related (190 | 6.8%).
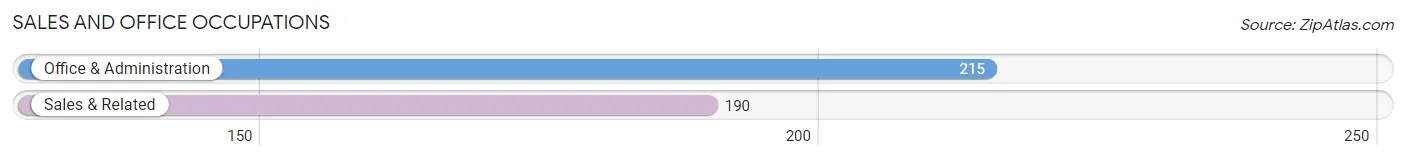
Sales and Office Occupations by Sex
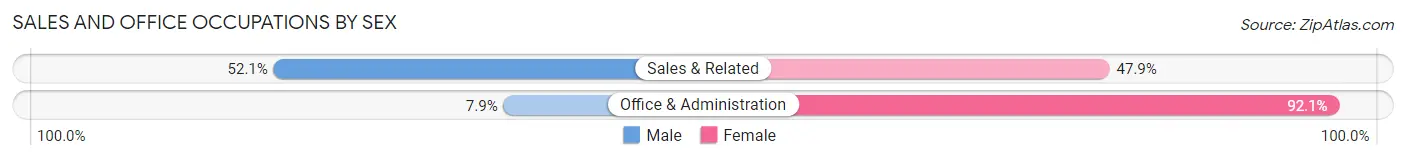
| Occupation | Male | Female |
| Sales & Related | 99 (52.1%) | 91 (47.9%) |
| Office & Administration | 17 (7.9%) | 198 (92.1%) |
| Total (Category) | 116 (28.6%) | 289 (71.4%) |
| Total (Overall) | 1,553 (55.4%) | 1,248 (44.6%) |
Natural Resources, Construction and Maintenance Occupations
The most common Natural Resources, Construction and Maintenance occupations in Gentry County are Installation, Maintenance & Repair (160 | 5.7%), Construction & Extraction (136 | 4.9%), and Farming, Fishing & Forestry (77 | 2.8%).
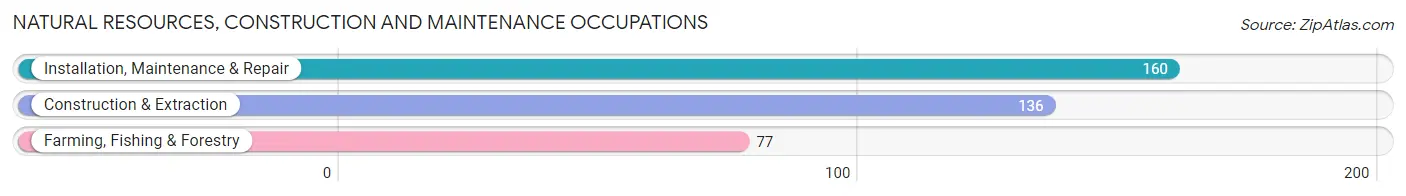
Natural Resources, Construction and Maintenance Occupations by Sex
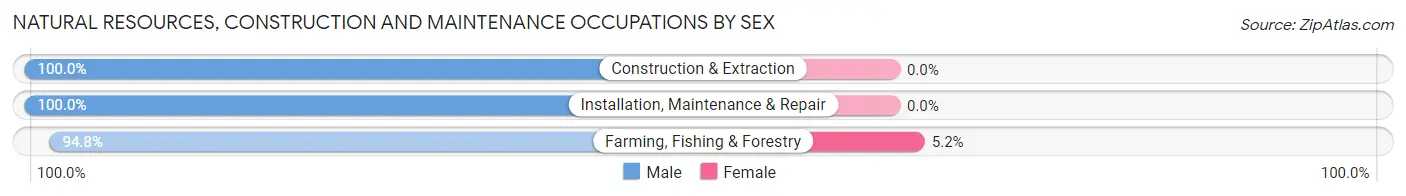
| Occupation | Male | Female |
| Farming, Fishing & Forestry | 73 (94.8%) | 4 (5.2%) |
| Construction & Extraction | 136 (100.0%) | 0 (0.0%) |
| Installation, Maintenance & Repair | 160 (100.0%) | 0 (0.0%) |
| Total (Category) | 369 (98.9%) | 4 (1.1%) |
| Total (Overall) | 1,553 (55.4%) | 1,248 (44.6%) |
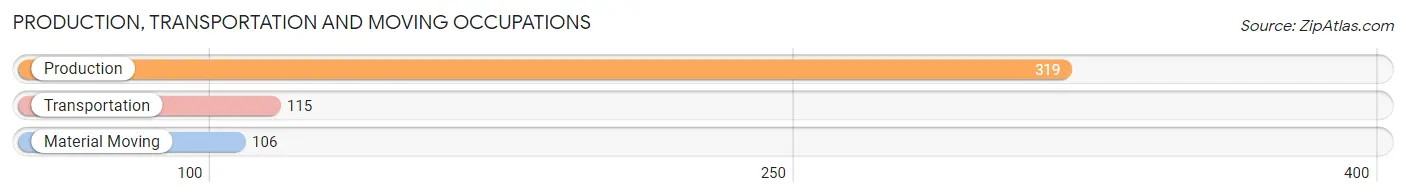
Production, Transportation and Moving Occupations
The most common Production, Transportation and Moving occupations in Gentry County are Production (319 | 11.4%), Transportation (115 | 4.1%), and Material Moving (106 | 3.8%).
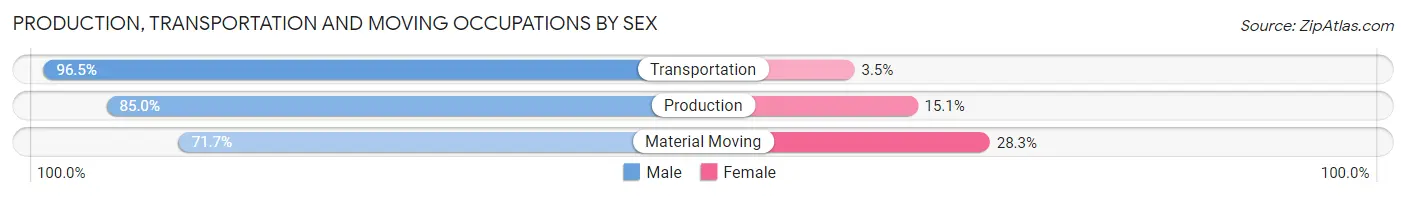
Production, Transportation and Moving Occupations by Sex
| Occupation | Male | Female |
| Production | 271 (85.0%) | 48 (15.0%) |
| Transportation | 111 (96.5%) | 4 (3.5%) |
| Material Moving | 76 (71.7%) | 30 (28.3%) |
| Total (Category) | 458 (84.8%) | 82 (15.2%) |
| Total (Overall) | 1,553 (55.4%) | 1,248 (44.6%) |
Employment Industries by Sex in Gentry County
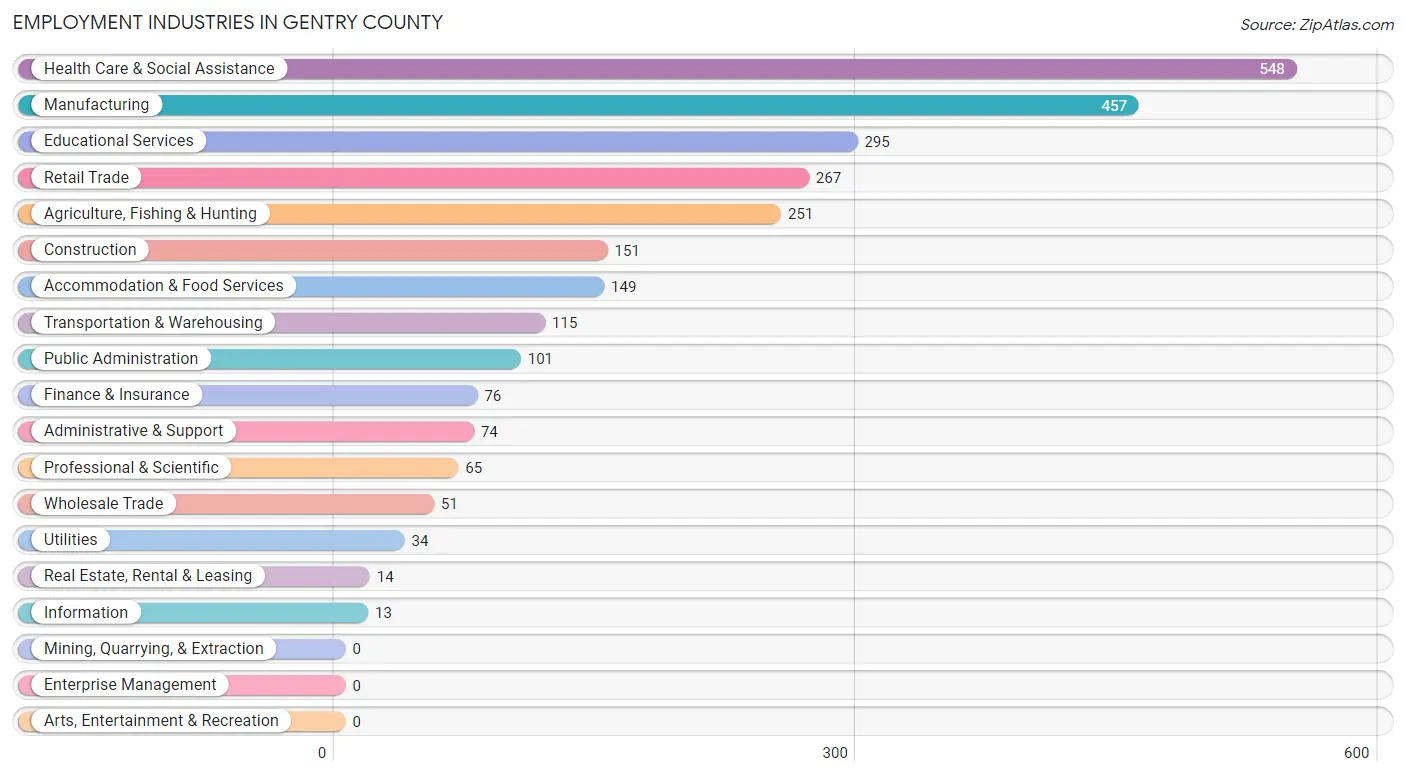
Employment Industries in Gentry County
The major employment industries in Gentry County include Health Care & Social Assistance (548 | 19.6%), Manufacturing (457 | 16.3%), Educational Services (295 | 10.5%), Retail Trade (267 | 9.5%), and Agriculture, Fishing & Hunting (251 | 9.0%).
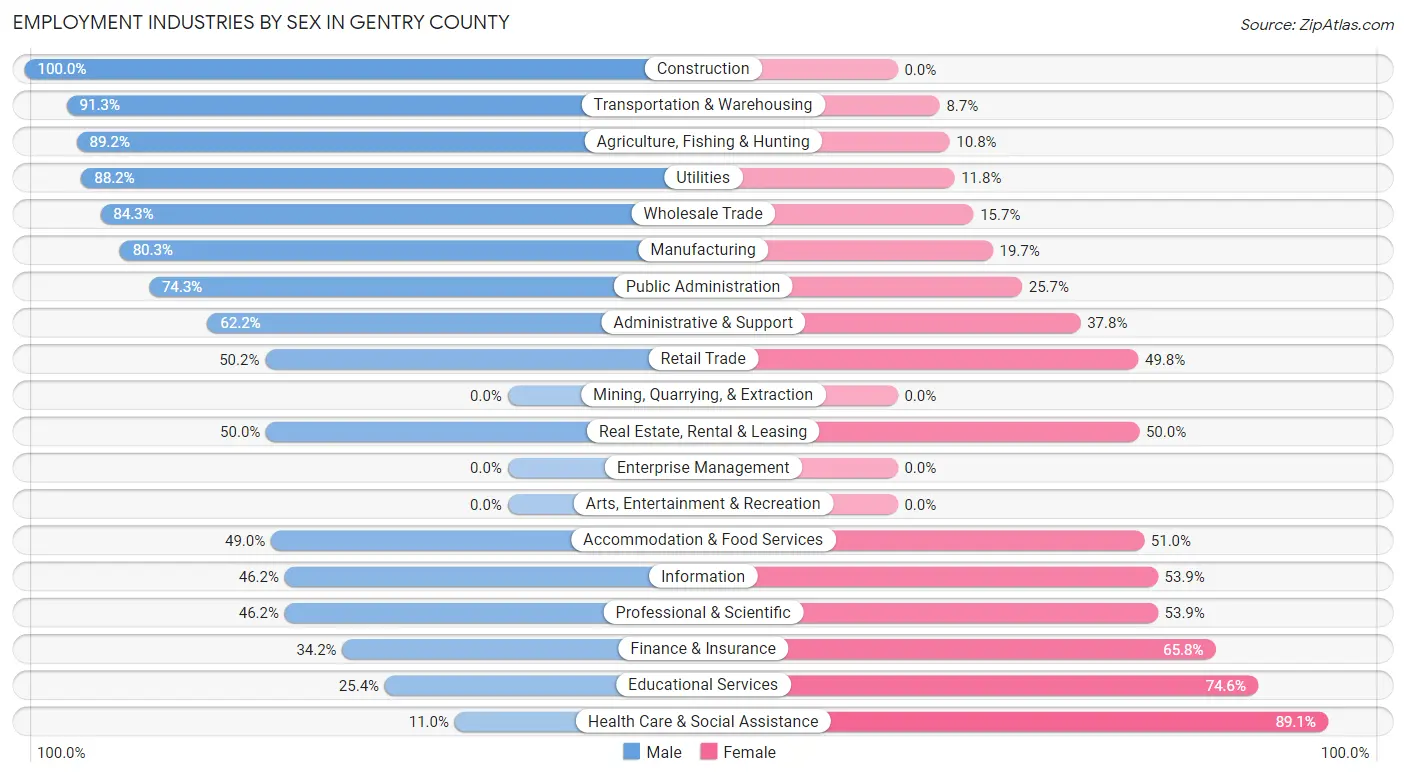
Employment Industries by Sex in Gentry County
The Gentry County industries that see more men than women are Construction (100.0%), Transportation & Warehousing (91.3%), and Agriculture, Fishing & Hunting (89.2%), whereas the industries that tend to have a higher number of women are Health Care & Social Assistance (89.0%), Educational Services (74.6%), and Finance & Insurance (65.8%).
| Industry | Male | Female |
| Agriculture, Fishing & Hunting | 224 (89.2%) | 27 (10.8%) |
| Mining, Quarrying, & Extraction | 0 (0.0%) | 0 (0.0%) |
| Construction | 151 (100.0%) | 0 (0.0%) |
| Manufacturing | 367 (80.3%) | 90 (19.7%) |
| Wholesale Trade | 43 (84.3%) | 8 (15.7%) |
| Retail Trade | 134 (50.2%) | 133 (49.8%) |
| Transportation & Warehousing | 105 (91.3%) | 10 (8.7%) |
| Utilities | 30 (88.2%) | 4 (11.8%) |
| Information | 6 (46.2%) | 7 (53.8%) |
| Finance & Insurance | 26 (34.2%) | 50 (65.8%) |
| Real Estate, Rental & Leasing | 7 (50.0%) | 7 (50.0%) |
| Professional & Scientific | 30 (46.2%) | 35 (53.8%) |
| Enterprise Management | 0 (0.0%) | 0 (0.0%) |
| Administrative & Support | 46 (62.2%) | 28 (37.8%) |
| Educational Services | 75 (25.4%) | 220 (74.6%) |
| Health Care & Social Assistance | 60 (11.0%) | 488 (89.0%) |
| Arts, Entertainment & Recreation | 0 (0.0%) | 0 (0.0%) |
| Accommodation & Food Services | 73 (49.0%) | 76 (51.0%) |
| Public Administration | 75 (74.3%) | 26 (25.7%) |
| Total | 1,553 (55.4%) | 1,248 (44.6%) |
Education in Gentry County
School Enrollment in Gentry County
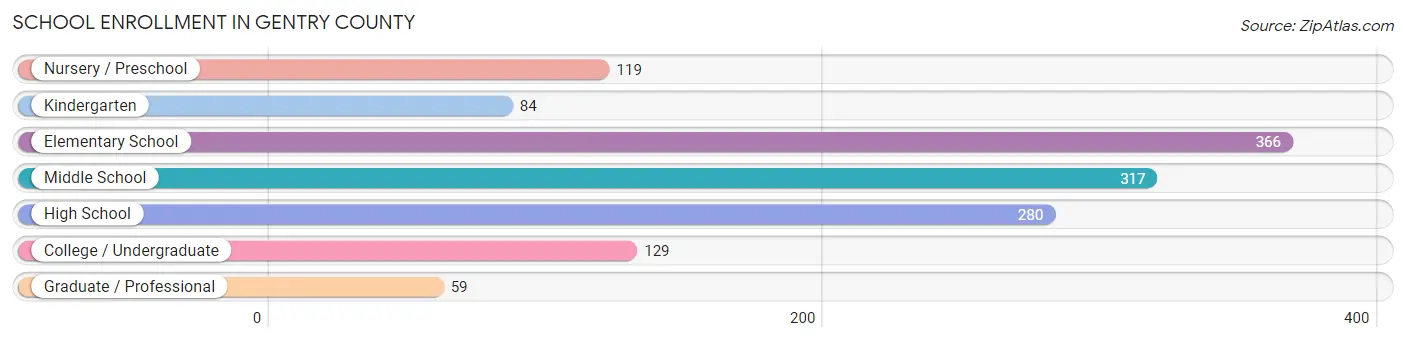
The most common levels of schooling among the 1,354 students in Gentry County are elementary school (366 | 27.0%), middle school (317 | 23.4%), and high school (280 | 20.7%).
| School Level | # Students | % Students |
| Nursery / Preschool | 119 | 8.8% |
| Kindergarten | 84 | 6.2% |
| Elementary School | 366 | 27.0% |
| Middle School | 317 | 23.4% |
| High School | 280 | 20.7% |
| College / Undergraduate | 129 | 9.5% |
| Graduate / Professional | 59 | 4.4% |
| Total | 1,354 | 100.0% |
School Enrollment by Age by Funding Source in Gentry County
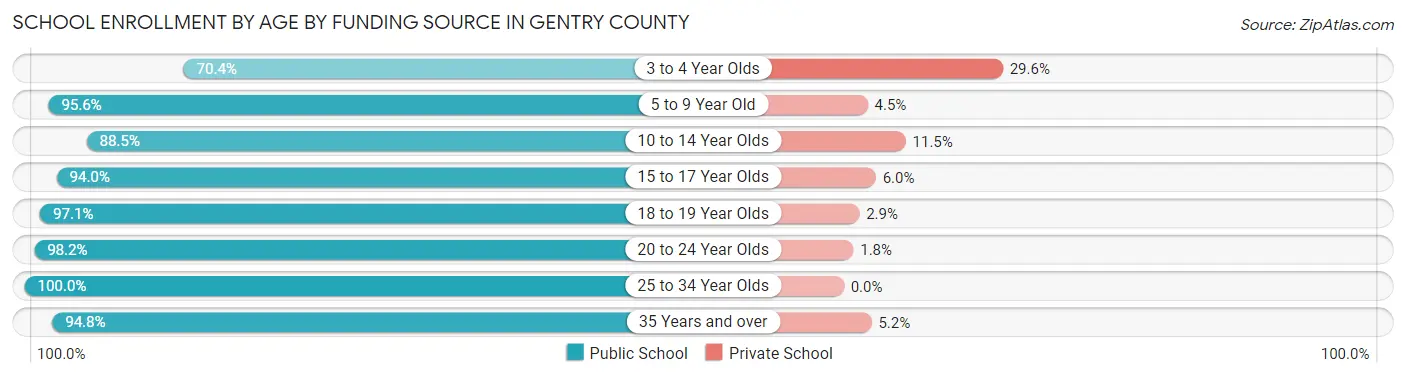
Out of a total of 1,354 students who are enrolled in schools in Gentry County, 102 (7.5%) attend a private institution, while the remaining 1,252 (92.5%) are enrolled in public schools. The age group of 3 to 4 year olds has the highest likelihood of being enrolled in private schools, with 16 (29.6% in the age bracket) enrolled. Conversely, the age group of 25 to 34 year olds has the lowest likelihood of being enrolled in a private school, with 73 (100.0% in the age bracket) attending a public institution.
| Age Bracket | Public School | Private School |
| 3 to 4 Year Olds | 38 (70.4%) | 16 (29.6%) |
| 5 to 9 Year Old | 408 (95.6%) | 19 (4.4%) |
| 10 to 14 Year Olds | 368 (88.5%) | 48 (11.5%) |
| 15 to 17 Year Olds | 189 (94.0%) | 12 (6.0%) |
| 18 to 19 Year Olds | 67 (97.1%) | 2 (2.9%) |
| 20 to 24 Year Olds | 55 (98.2%) | 1 (1.8%) |
| 25 to 34 Year Olds | 73 (100.0%) | 0 (0.0%) |
| 35 Years and over | 55 (94.8%) | 3 (5.2%) |
| Total | 1,252 (92.5%) | 102 (7.5%) |
Educational Attainment by Field of Study in Gentry County
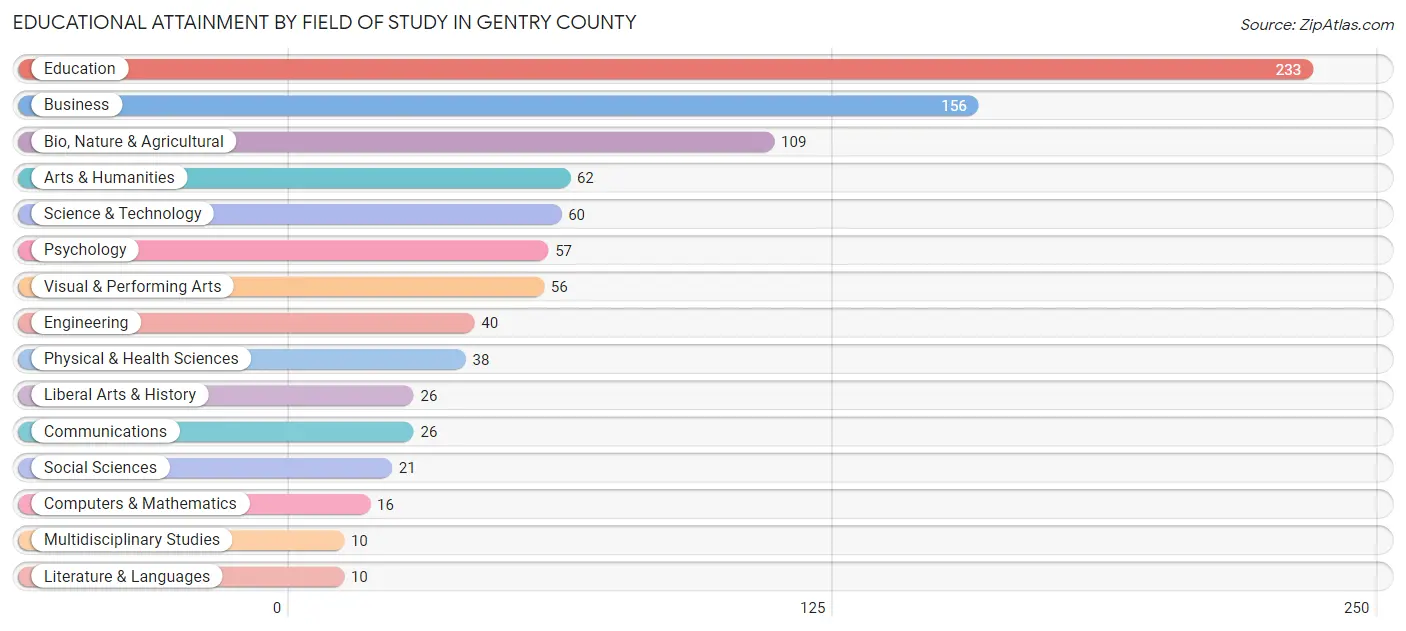
Education (233 | 25.3%), business (156 | 17.0%), bio, nature & agricultural (109 | 11.8%), arts & humanities (62 | 6.7%), and science & technology (60 | 6.5%) are the most common fields of study among 920 individuals in Gentry County who have obtained a bachelor's degree or higher.
| Field of Study | # Graduates | % Graduates |
| Computers & Mathematics | 16 | 1.7% |
| Bio, Nature & Agricultural | 109 | 11.8% |
| Physical & Health Sciences | 38 | 4.1% |
| Psychology | 57 | 6.2% |
| Social Sciences | 21 | 2.3% |
| Engineering | 40 | 4.3% |
| Multidisciplinary Studies | 10 | 1.1% |
| Science & Technology | 60 | 6.5% |
| Business | 156 | 17.0% |
| Education | 233 | 25.3% |
| Literature & Languages | 10 | 1.1% |
| Liberal Arts & History | 26 | 2.8% |
| Visual & Performing Arts | 56 | 6.1% |
| Communications | 26 | 2.8% |
| Arts & Humanities | 62 | 6.7% |
| Total | 920 | 100.0% |
Transportation & Commute in Gentry County
Vehicle Availability by Sex in Gentry County
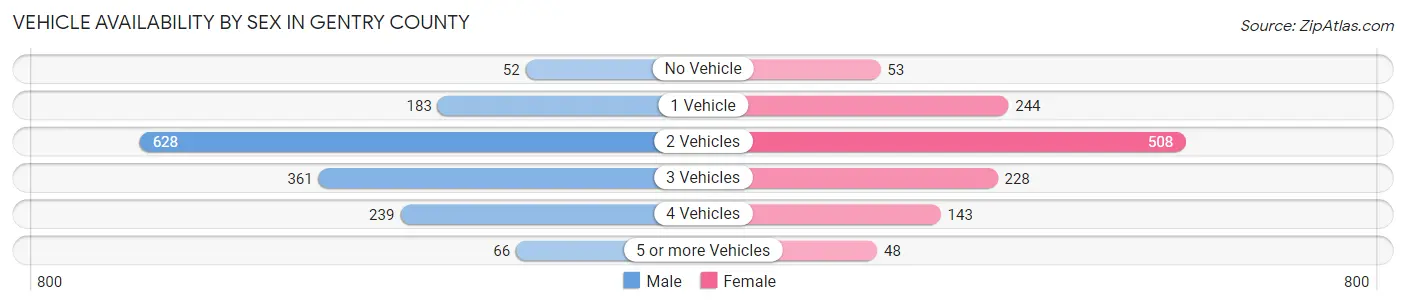
The most prevalent vehicle ownership categories in Gentry County are males with 2 vehicles (628, accounting for 41.1%) and females with 2 vehicles (508, making up 51.3%).
| Vehicles Available | Male | Female |
| No Vehicle | 52 (3.4%) | 53 (4.3%) |
| 1 Vehicle | 183 (12.0%) | 244 (19.9%) |
| 2 Vehicles | 628 (41.1%) | 508 (41.5%) |
| 3 Vehicles | 361 (23.6%) | 228 (18.6%) |
| 4 Vehicles | 239 (15.6%) | 143 (11.7%) |
| 5 or more Vehicles | 66 (4.3%) | 48 (3.9%) |
| Total | 1,529 (100.0%) | 1,224 (100.0%) |
Commute Time in Gentry County
The most frequently occuring commute durations in Gentry County are 5 to 9 minutes (632 commuters, 24.9%), less than 5 minutes (350 commuters, 13.8%), and 15 to 19 minutes (231 commuters, 9.1%).
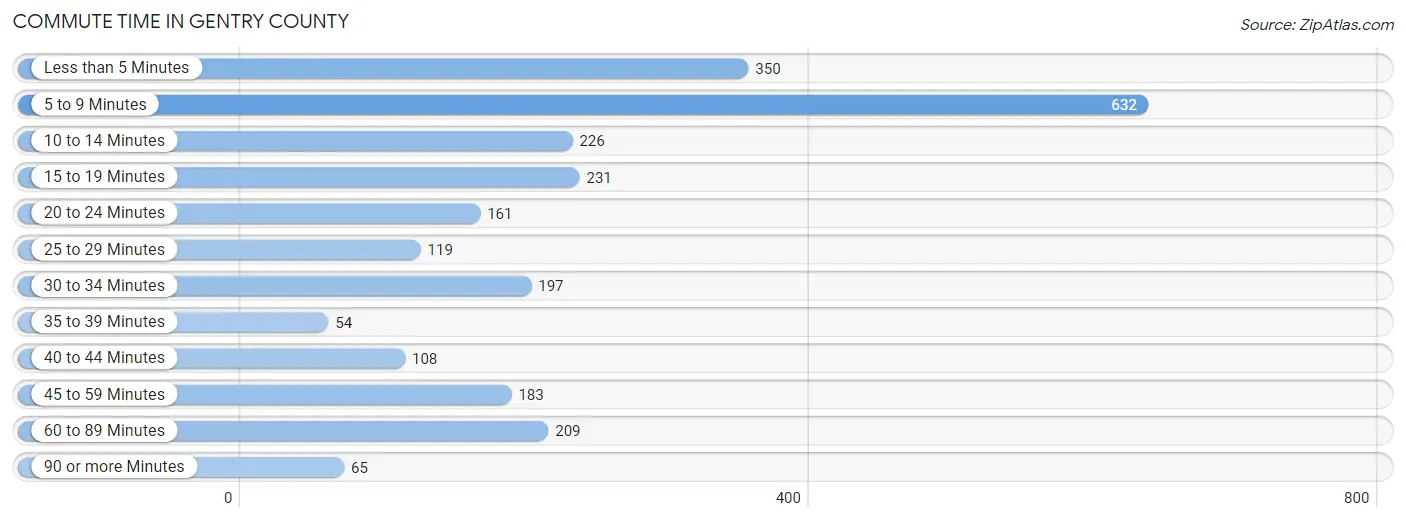
| Commute Time | # Commuters | % Commuters |
| Less than 5 Minutes | 350 | 13.8% |
| 5 to 9 Minutes | 632 | 24.9% |
| 10 to 14 Minutes | 226 | 8.9% |
| 15 to 19 Minutes | 231 | 9.1% |
| 20 to 24 Minutes | 161 | 6.4% |
| 25 to 29 Minutes | 119 | 4.7% |
| 30 to 34 Minutes | 197 | 7.8% |
| 35 to 39 Minutes | 54 | 2.1% |
| 40 to 44 Minutes | 108 | 4.3% |
| 45 to 59 Minutes | 183 | 7.2% |
| 60 to 89 Minutes | 209 | 8.2% |
| 90 or more Minutes | 65 | 2.6% |
Commute Time by Sex in Gentry County
The most common commute times in Gentry County are 5 to 9 minutes (286 commuters, 20.7%) for males and 5 to 9 minutes (346 commuters, 30.0%) for females.
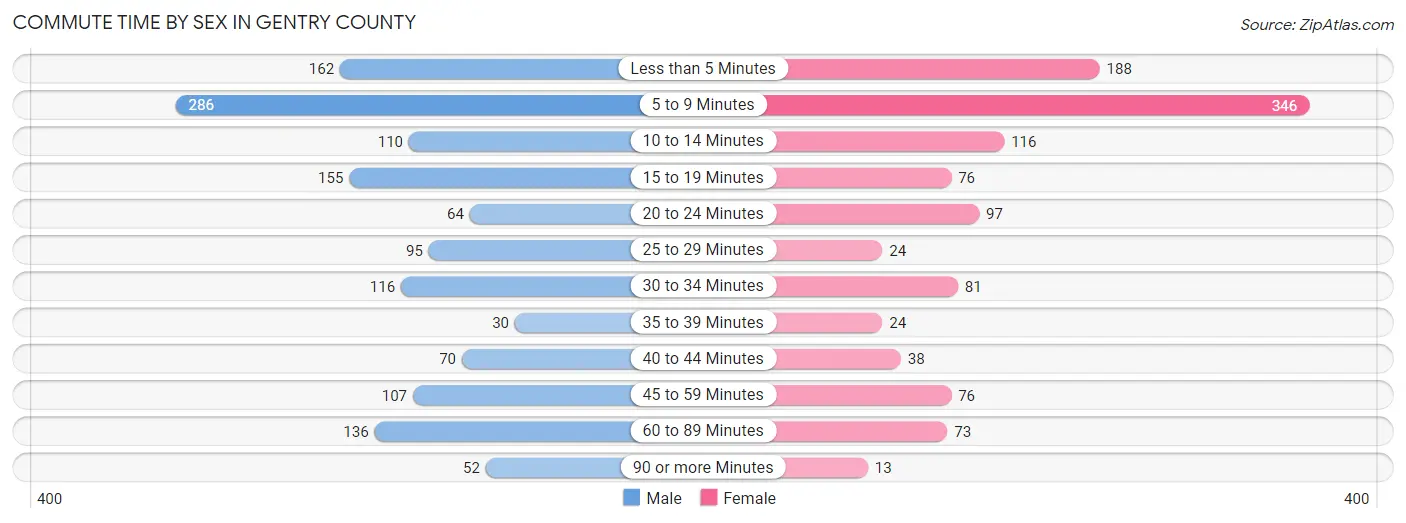
| Commute Time | Male | Female |
| Less than 5 Minutes | 162 (11.7%) | 188 (16.3%) |
| 5 to 9 Minutes | 286 (20.7%) | 346 (30.0%) |
| 10 to 14 Minutes | 110 (8.0%) | 116 (10.1%) |
| 15 to 19 Minutes | 155 (11.2%) | 76 (6.6%) |
| 20 to 24 Minutes | 64 (4.6%) | 97 (8.4%) |
| 25 to 29 Minutes | 95 (6.9%) | 24 (2.1%) |
| 30 to 34 Minutes | 116 (8.4%) | 81 (7.0%) |
| 35 to 39 Minutes | 30 (2.2%) | 24 (2.1%) |
| 40 to 44 Minutes | 70 (5.1%) | 38 (3.3%) |
| 45 to 59 Minutes | 107 (7.7%) | 76 (6.6%) |
| 60 to 89 Minutes | 136 (9.8%) | 73 (6.3%) |
| 90 or more Minutes | 52 (3.8%) | 13 (1.1%) |
Time of Departure to Work by Sex in Gentry County
The most frequent times of departure to work in Gentry County are 7:00 AM to 7:29 AM (308, 22.3%) for males and 7:00 AM to 7:29 AM (306, 26.6%) for females.
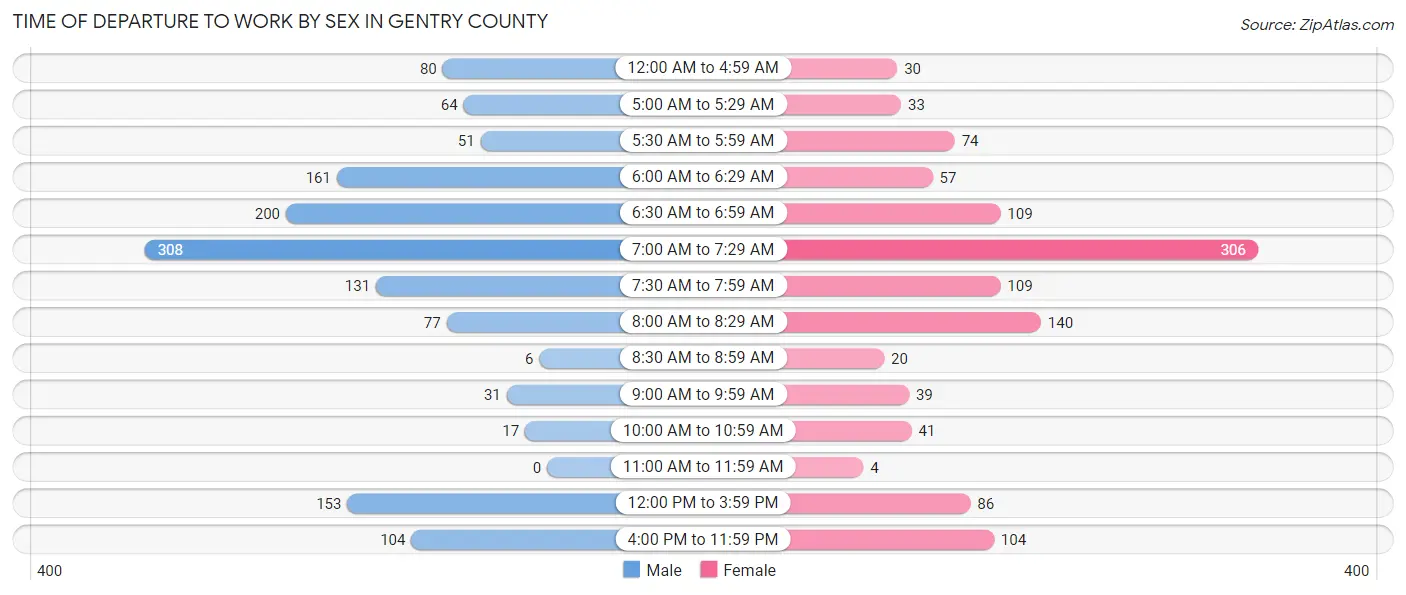
| Time of Departure | Male | Female |
| 12:00 AM to 4:59 AM | 80 (5.8%) | 30 (2.6%) |
| 5:00 AM to 5:29 AM | 64 (4.6%) | 33 (2.9%) |
| 5:30 AM to 5:59 AM | 51 (3.7%) | 74 (6.4%) |
| 6:00 AM to 6:29 AM | 161 (11.6%) | 57 (5.0%) |
| 6:30 AM to 6:59 AM | 200 (14.5%) | 109 (9.5%) |
| 7:00 AM to 7:29 AM | 308 (22.3%) | 306 (26.6%) |
| 7:30 AM to 7:59 AM | 131 (9.5%) | 109 (9.5%) |
| 8:00 AM to 8:29 AM | 77 (5.6%) | 140 (12.1%) |
| 8:30 AM to 8:59 AM | 6 (0.4%) | 20 (1.7%) |
| 9:00 AM to 9:59 AM | 31 (2.2%) | 39 (3.4%) |
| 10:00 AM to 10:59 AM | 17 (1.2%) | 41 (3.6%) |
| 11:00 AM to 11:59 AM | 0 (0.0%) | 4 (0.4%) |
| 12:00 PM to 3:59 PM | 153 (11.1%) | 86 (7.5%) |
| 4:00 PM to 11:59 PM | 104 (7.5%) | 104 (9.0%) |
| Total | 1,383 (100.0%) | 1,152 (100.0%) |
Housing Occupancy in Gentry County
Occupancy by Ownership in Gentry County
Of the total 2,347 dwellings in Gentry County, owner-occupied units account for 1,775 (75.6%), while renter-occupied units make up 572 (24.4%).
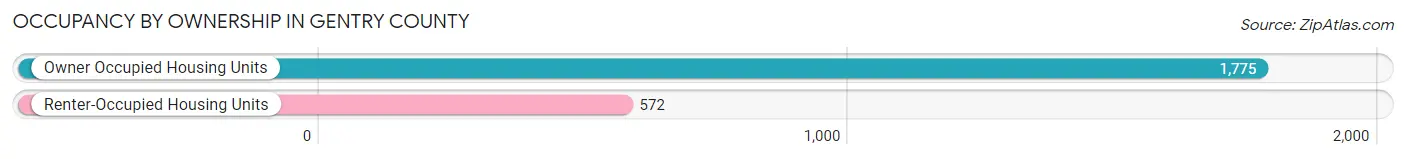
| Occupancy | # Housing Units | % Housing Units |
| Owner Occupied Housing Units | 1,775 | 75.6% |
| Renter-Occupied Housing Units | 572 | 24.4% |
| Total Occupied Housing Units | 2,347 | 100.0% |
Occupancy by Household Size in Gentry County
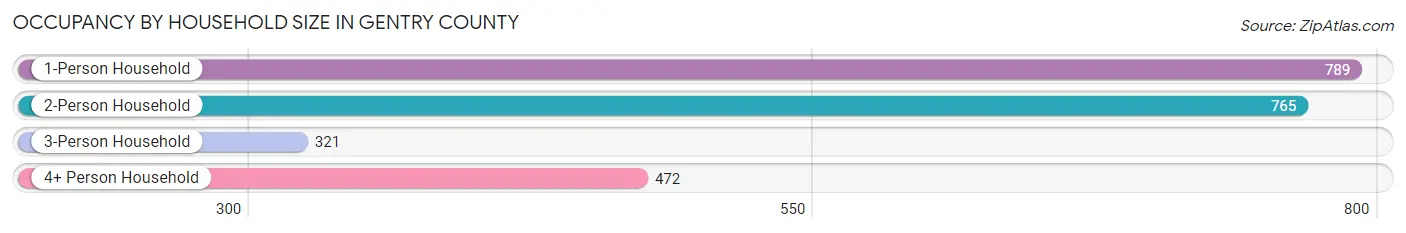
| Household Size | # Housing Units | % Housing Units |
| 1-Person Household | 789 | 33.6% |
| 2-Person Household | 765 | 32.6% |
| 3-Person Household | 321 | 13.7% |
| 4+ Person Household | 472 | 20.1% |
| Total Housing Units | 2,347 | 100.0% |
Occupancy by Ownership by Household Size in Gentry County
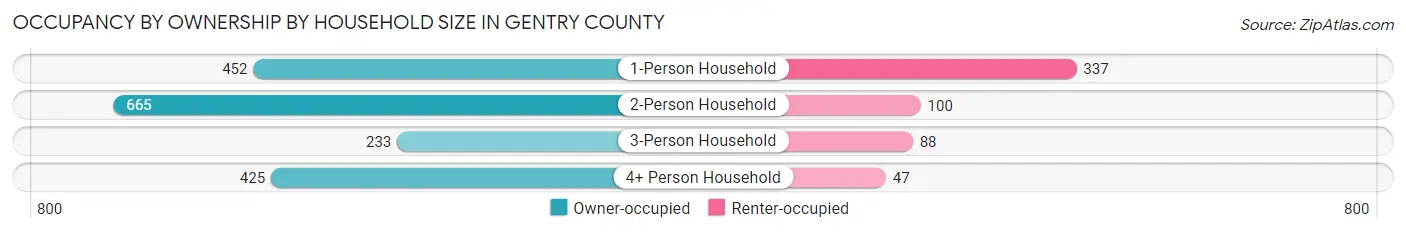
| Household Size | Owner-occupied | Renter-occupied |
| 1-Person Household | 452 (57.3%) | 337 (42.7%) |
| 2-Person Household | 665 (86.9%) | 100 (13.1%) |
| 3-Person Household | 233 (72.6%) | 88 (27.4%) |
| 4+ Person Household | 425 (90.0%) | 47 (10.0%) |
| Total Housing Units | 1,775 (75.6%) | 572 (24.4%) |
Occupancy by Educational Attainment in Gentry County
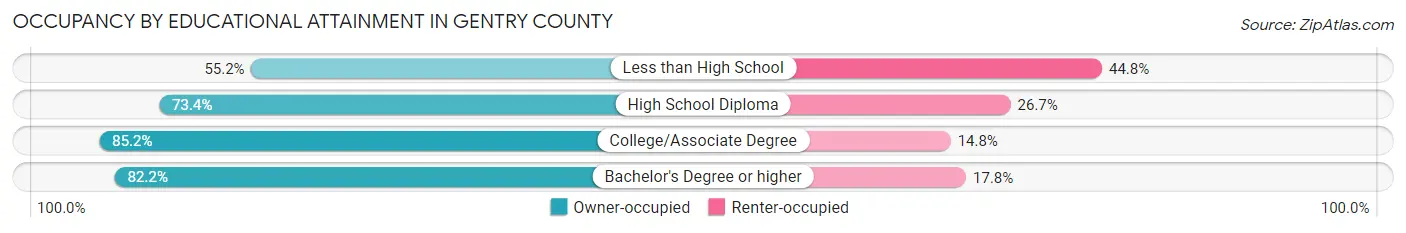
| Household Size | Owner-occupied | Renter-occupied |
| Less than High School | 164 (55.2%) | 133 (44.8%) |
| High School Diploma | 743 (73.4%) | 270 (26.7%) |
| College/Associate Degree | 444 (85.2%) | 77 (14.8%) |
| Bachelor's Degree or higher | 424 (82.2%) | 92 (17.8%) |
Occupancy by Age of Householder in Gentry County
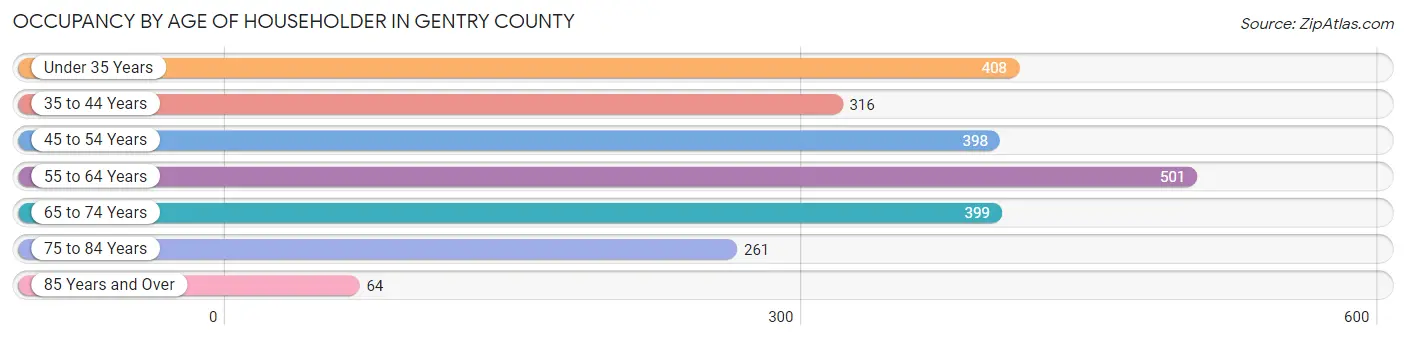
| Age Bracket | # Households | % Households |
| Under 35 Years | 408 | 17.4% |
| 35 to 44 Years | 316 | 13.5% |
| 45 to 54 Years | 398 | 17.0% |
| 55 to 64 Years | 501 | 21.3% |
| 65 to 74 Years | 399 | 17.0% |
| 75 to 84 Years | 261 | 11.1% |
| 85 Years and Over | 64 | 2.7% |
| Total | 2,347 | 100.0% |
Housing Finances in Gentry County
Median Income by Occupancy in Gentry County
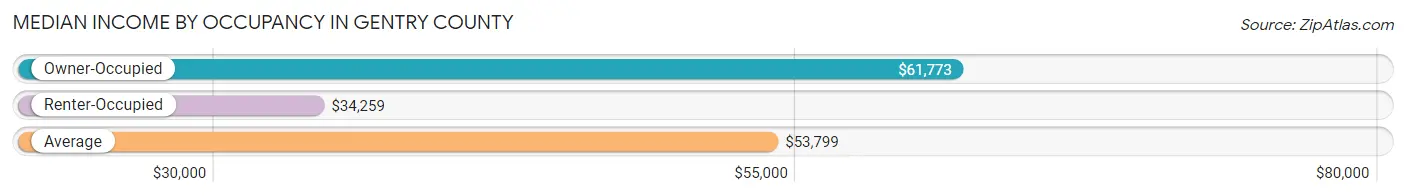
| Occupancy Type | # Households | Median Income |
| Owner-Occupied | 1,775 (75.6%) | $61,773 |
| Renter-Occupied | 572 (24.4%) | $34,259 |
| Average | 2,347 (100.0%) | $53,799 |
Occupancy by Householder Income Bracket in Gentry County
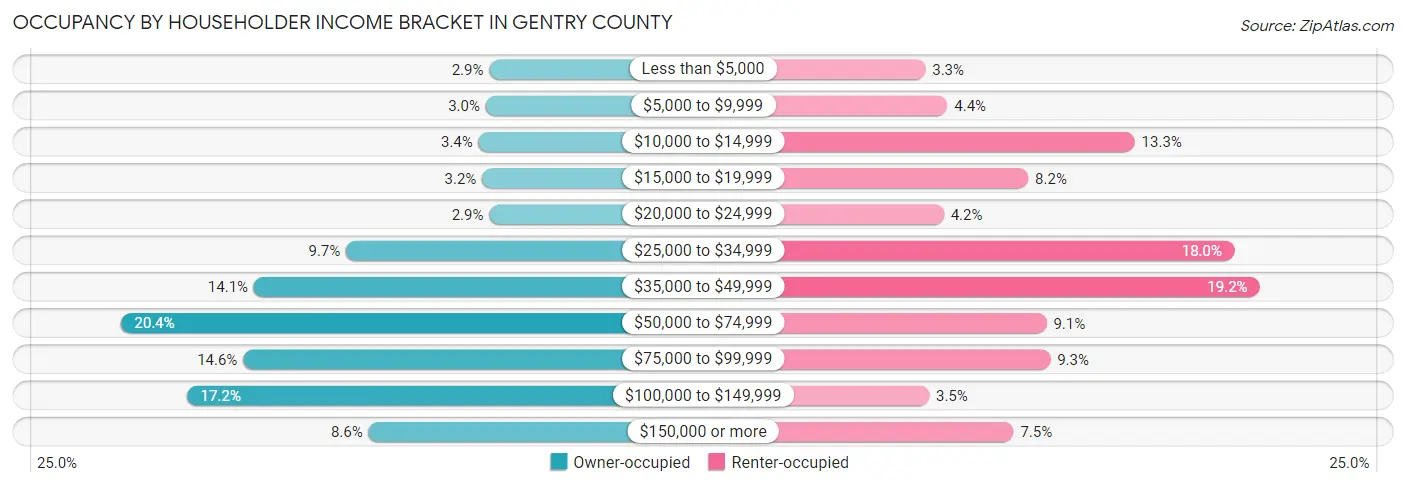
| Income Bracket | Owner-occupied | Renter-occupied |
| Less than $5,000 | 51 (2.9%) | 19 (3.3%) |
| $5,000 to $9,999 | 54 (3.0%) | 25 (4.4%) |
| $10,000 to $14,999 | 60 (3.4%) | 76 (13.3%) |
| $15,000 to $19,999 | 57 (3.2%) | 47 (8.2%) |
| $20,000 to $24,999 | 51 (2.9%) | 24 (4.2%) |
| $25,000 to $34,999 | 172 (9.7%) | 103 (18.0%) |
| $35,000 to $49,999 | 250 (14.1%) | 110 (19.2%) |
| $50,000 to $74,999 | 362 (20.4%) | 52 (9.1%) |
| $75,000 to $99,999 | 259 (14.6%) | 53 (9.3%) |
| $100,000 to $149,999 | 306 (17.2%) | 20 (3.5%) |
| $150,000 or more | 153 (8.6%) | 43 (7.5%) |
| Total | 1,775 (100.0%) | 572 (100.0%) |
Monthly Housing Cost Tiers in Gentry County
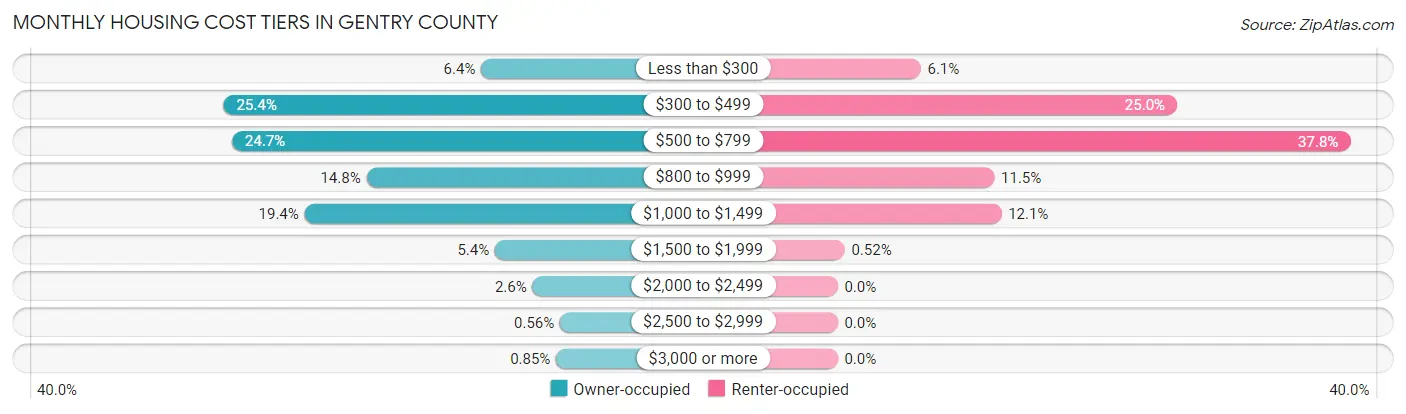
| Monthly Cost | Owner-occupied | Renter-occupied |
| Less than $300 | 113 (6.4%) | 35 (6.1%) |
| $300 to $499 | 450 (25.4%) | 143 (25.0%) |
| $500 to $799 | 439 (24.7%) | 216 (37.8%) |
| $800 to $999 | 263 (14.8%) | 66 (11.5%) |
| $1,000 to $1,499 | 344 (19.4%) | 69 (12.1%) |
| $1,500 to $1,999 | 95 (5.3%) | 3 (0.5%) |
| $2,000 to $2,499 | 46 (2.6%) | 0 (0.0%) |
| $2,500 to $2,999 | 10 (0.6%) | 0 (0.0%) |
| $3,000 or more | 15 (0.9%) | 0 (0.0%) |
| Total | 1,775 (100.0%) | 572 (100.0%) |
Physical Housing Characteristics in Gentry County
Housing Structures in Gentry County
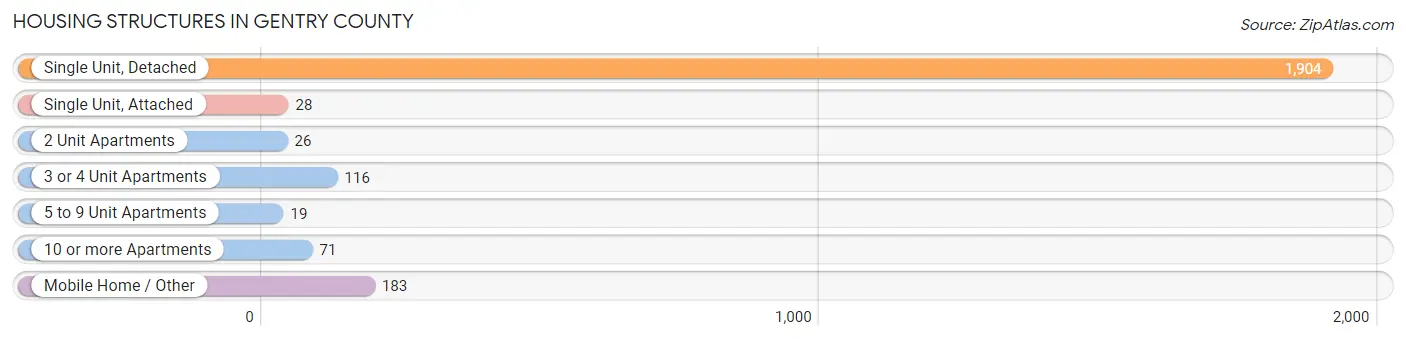
| Structure Type | # Housing Units | % Housing Units |
| Single Unit, Detached | 1,904 | 81.1% |
| Single Unit, Attached | 28 | 1.2% |
| 2 Unit Apartments | 26 | 1.1% |
| 3 or 4 Unit Apartments | 116 | 4.9% |
| 5 to 9 Unit Apartments | 19 | 0.8% |
| 10 or more Apartments | 71 | 3.0% |
| Mobile Home / Other | 183 | 7.8% |
| Total | 2,347 | 100.0% |
Housing Structures by Occupancy in Gentry County
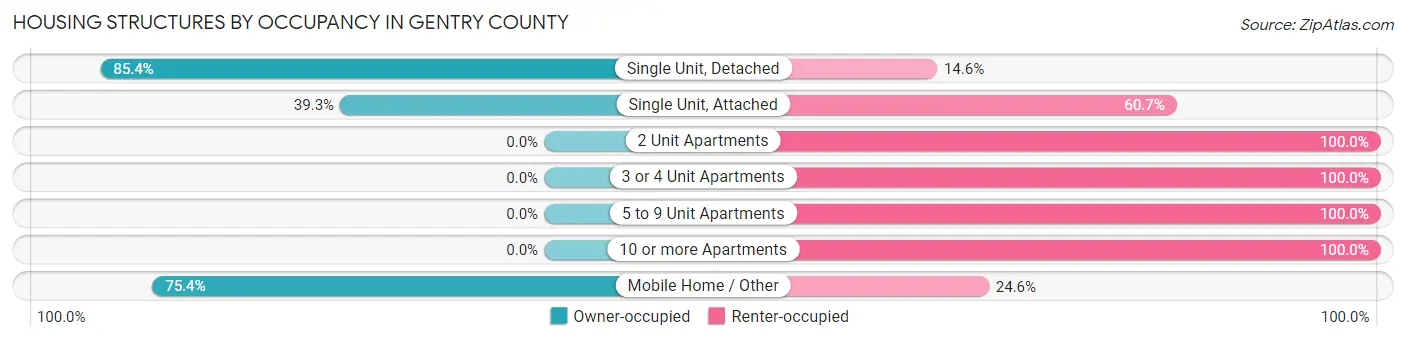
| Structure Type | Owner-occupied | Renter-occupied |
| Single Unit, Detached | 1,626 (85.4%) | 278 (14.6%) |
| Single Unit, Attached | 11 (39.3%) | 17 (60.7%) |
| 2 Unit Apartments | 0 (0.0%) | 26 (100.0%) |
| 3 or 4 Unit Apartments | 0 (0.0%) | 116 (100.0%) |
| 5 to 9 Unit Apartments | 0 (0.0%) | 19 (100.0%) |
| 10 or more Apartments | 0 (0.0%) | 71 (100.0%) |
| Mobile Home / Other | 138 (75.4%) | 45 (24.6%) |
| Total | 1,775 (75.6%) | 572 (24.4%) |
Housing Structures by Number of Rooms in Gentry County
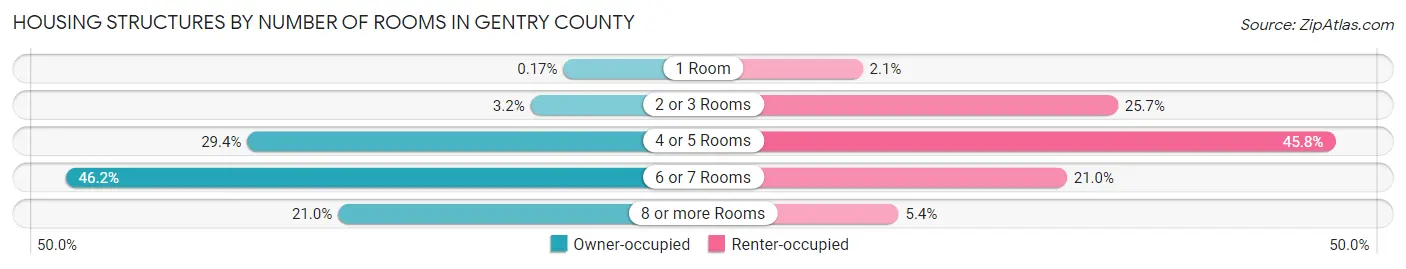
| Number of Rooms | Owner-occupied | Renter-occupied |
| 1 Room | 3 (0.2%) | 12 (2.1%) |
| 2 or 3 Rooms | 57 (3.2%) | 147 (25.7%) |
| 4 or 5 Rooms | 522 (29.4%) | 262 (45.8%) |
| 6 or 7 Rooms | 820 (46.2%) | 120 (21.0%) |
| 8 or more Rooms | 373 (21.0%) | 31 (5.4%) |
| Total | 1,775 (100.0%) | 572 (100.0%) |
Housing Structure by Heating Type in Gentry County
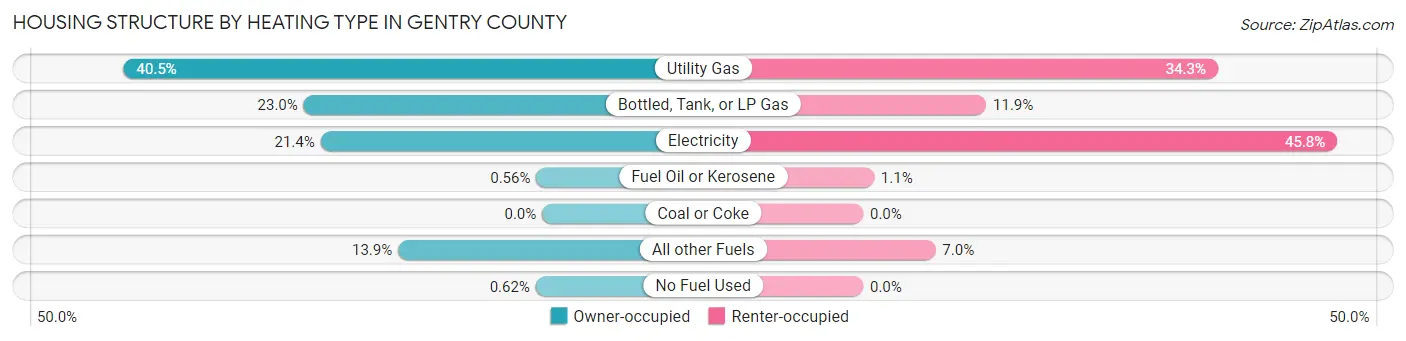
| Heating Type | Owner-occupied | Renter-occupied |
| Utility Gas | 718 (40.5%) | 196 (34.3%) |
| Bottled, Tank, or LP Gas | 409 (23.0%) | 68 (11.9%) |
| Electricity | 380 (21.4%) | 262 (45.8%) |
| Fuel Oil or Kerosene | 10 (0.6%) | 6 (1.1%) |
| Coal or Coke | 0 (0.0%) | 0 (0.0%) |
| All other Fuels | 247 (13.9%) | 40 (7.0%) |
| No Fuel Used | 11 (0.6%) | 0 (0.0%) |
| Total | 1,775 (100.0%) | 572 (100.0%) |
Household Vehicle Usage in Gentry County
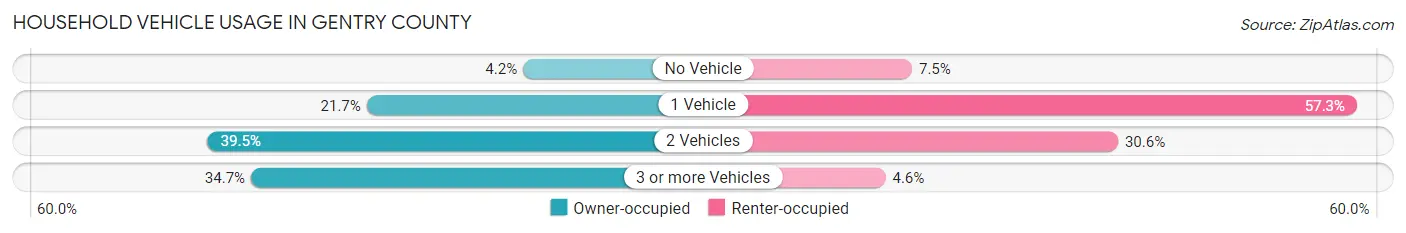
| Vehicles per Household | Owner-occupied | Renter-occupied |
| No Vehicle | 74 (4.2%) | 43 (7.5%) |
| 1 Vehicle | 385 (21.7%) | 328 (57.3%) |
| 2 Vehicles | 701 (39.5%) | 175 (30.6%) |
| 3 or more Vehicles | 615 (34.6%) | 26 (4.5%) |
| Total | 1,775 (100.0%) | 572 (100.0%) |
Real Estate & Mortgages in Gentry County
Real Estate and Mortgage Overview in Gentry County
| Characteristic | Without Mortgage | With Mortgage |
| Housing Units | 940 | 835 |
| Median Property Value | $106,100 | $124,200 |
| Median Household Income | $47,944 | $114 |
| Monthly Housing Costs | $460 | $15 |
| Real Estate Taxes | $1,208 | $17 |
Property Value by Mortgage Status in Gentry County
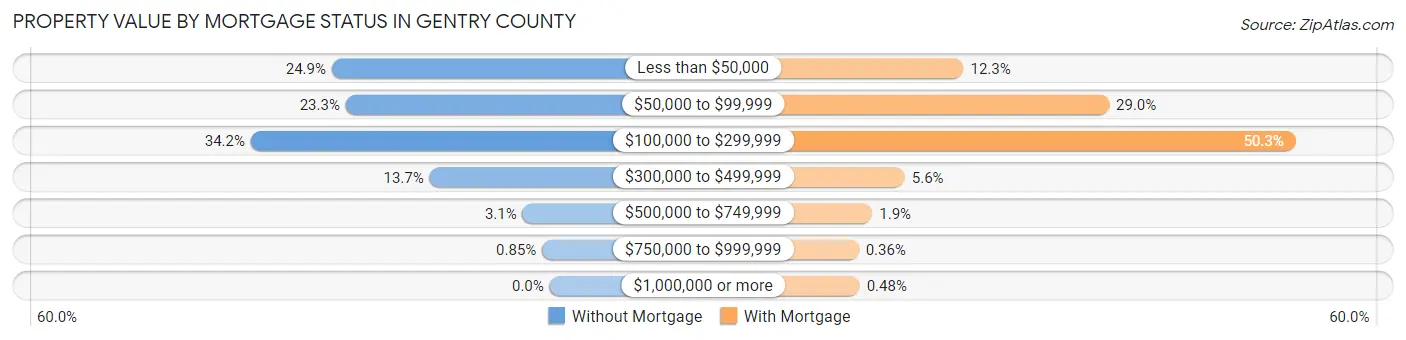
| Property Value | Without Mortgage | With Mortgage |
| Less than $50,000 | 234 (24.9%) | 103 (12.3%) |
| $50,000 to $99,999 | 219 (23.3%) | 242 (29.0%) |
| $100,000 to $299,999 | 321 (34.2%) | 420 (50.3%) |
| $300,000 to $499,999 | 129 (13.7%) | 47 (5.6%) |
| $500,000 to $749,999 | 29 (3.1%) | 16 (1.9%) |
| $750,000 to $999,999 | 8 (0.9%) | 3 (0.4%) |
| $1,000,000 or more | 0 (0.0%) | 4 (0.5%) |
| Total | 940 (100.0%) | 835 (100.0%) |
Household Income by Mortgage Status in Gentry County
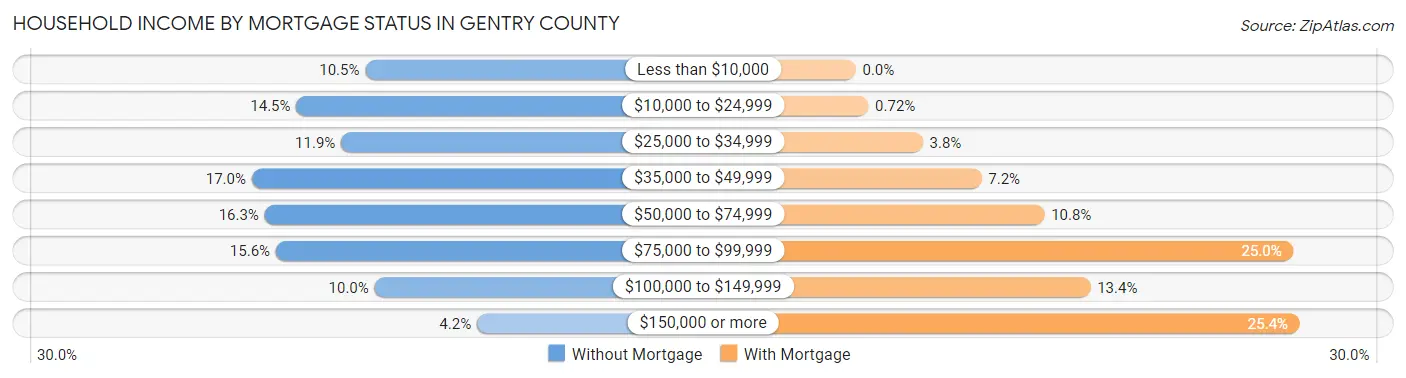
| Household Income | Without Mortgage | With Mortgage |
| Less than $10,000 | 99 (10.5%) | 0 (0.0%) |
| $10,000 to $24,999 | 136 (14.5%) | 6 (0.7%) |
| $25,000 to $34,999 | 112 (11.9%) | 32 (3.8%) |
| $35,000 to $49,999 | 160 (17.0%) | 60 (7.2%) |
| $50,000 to $74,999 | 153 (16.3%) | 90 (10.8%) |
| $75,000 to $99,999 | 147 (15.6%) | 209 (25.0%) |
| $100,000 to $149,999 | 94 (10.0%) | 112 (13.4%) |
| $150,000 or more | 39 (4.2%) | 212 (25.4%) |
| Total | 940 (100.0%) | 835 (100.0%) |
Property Value to Household Income Ratio in Gentry County
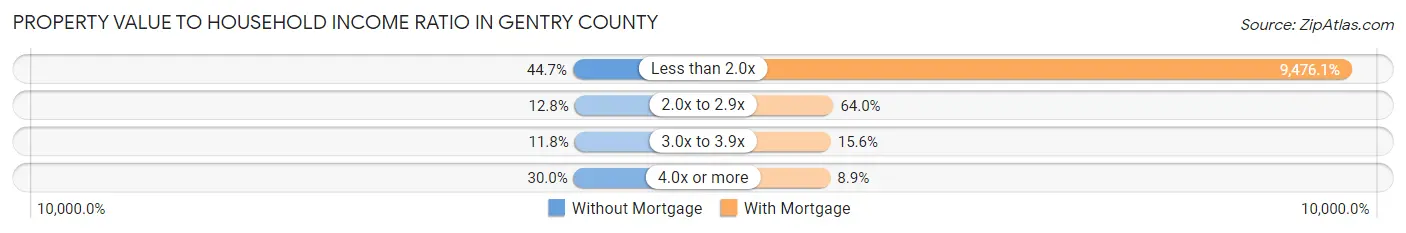
| Value-to-Income Ratio | Without Mortgage | With Mortgage |
| Less than 2.0x | 420 (44.7%) | 79,125 (9,476.0%) |
| 2.0x to 2.9x | 120 (12.8%) | 534 (63.9%) |
| 3.0x to 3.9x | 111 (11.8%) | 130 (15.6%) |
| 4.0x or more | 282 (30.0%) | 74 (8.9%) |
| Total | 940 (100.0%) | 835 (100.0%) |
Real Estate Taxes by Mortgage Status in Gentry County
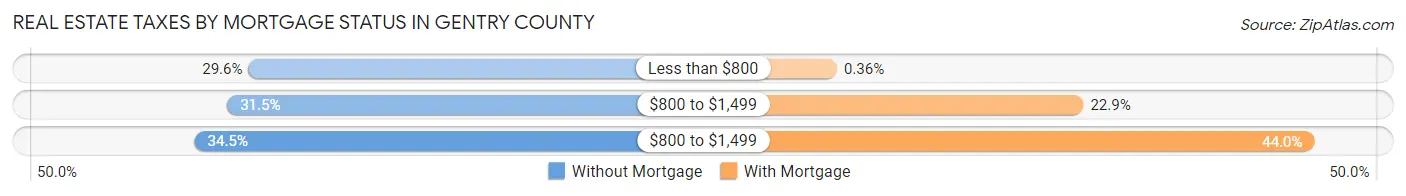
| Property Taxes | Without Mortgage | With Mortgage |
| Less than $800 | 278 (29.6%) | 3 (0.4%) |
| $800 to $1,499 | 296 (31.5%) | 191 (22.9%) |
| $800 to $1,499 | 324 (34.5%) | 367 (44.0%) |
| Total | 940 (100.0%) | 835 (100.0%) |
Health & Disability in Gentry County
Health Insurance Coverage by Age in Gentry County
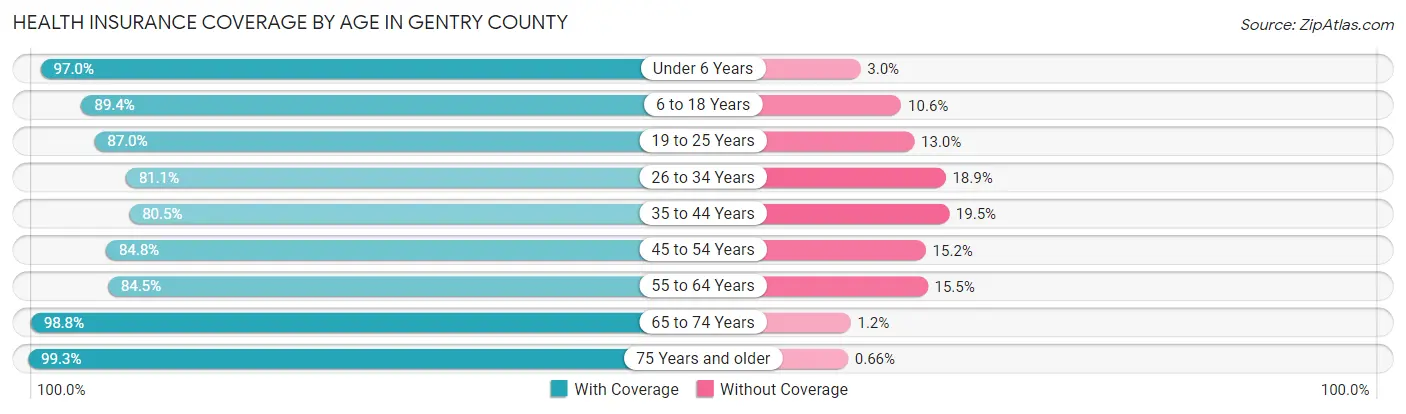
| Age Bracket | With Coverage | Without Coverage |
| Under 6 Years | 519 (97.0%) | 16 (3.0%) |
| 6 to 18 Years | 978 (89.4%) | 116 (10.6%) |
| 19 to 25 Years | 374 (87.0%) | 56 (13.0%) |
| 26 to 34 Years | 559 (81.1%) | 130 (18.9%) |
| 35 to 44 Years | 553 (80.5%) | 134 (19.5%) |
| 45 to 54 Years | 587 (84.8%) | 105 (15.2%) |
| 55 to 64 Years | 756 (84.5%) | 139 (15.5%) |
| 65 to 74 Years | 599 (98.8%) | 7 (1.2%) |
| 75 Years and older | 452 (99.3%) | 3 (0.7%) |
| Total | 5,377 (88.4%) | 706 (11.6%) |
Health Insurance Coverage by Citizenship Status in Gentry County
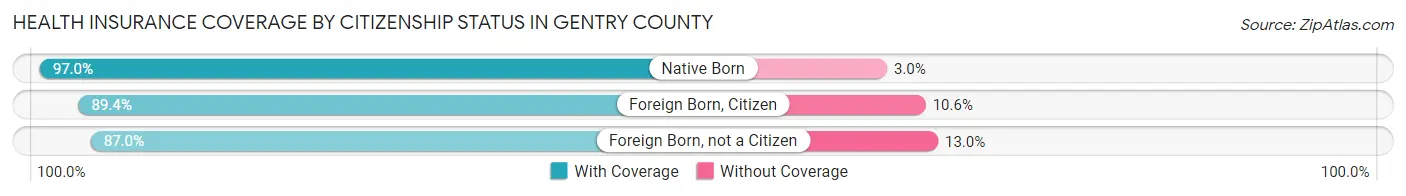
| Citizenship Status | With Coverage | Without Coverage |
| Native Born | 519 (97.0%) | 16 (3.0%) |
| Foreign Born, Citizen | 978 (89.4%) | 116 (10.6%) |
| Foreign Born, not a Citizen | 374 (87.0%) | 56 (13.0%) |
Health Insurance Coverage by Household Income in Gentry County
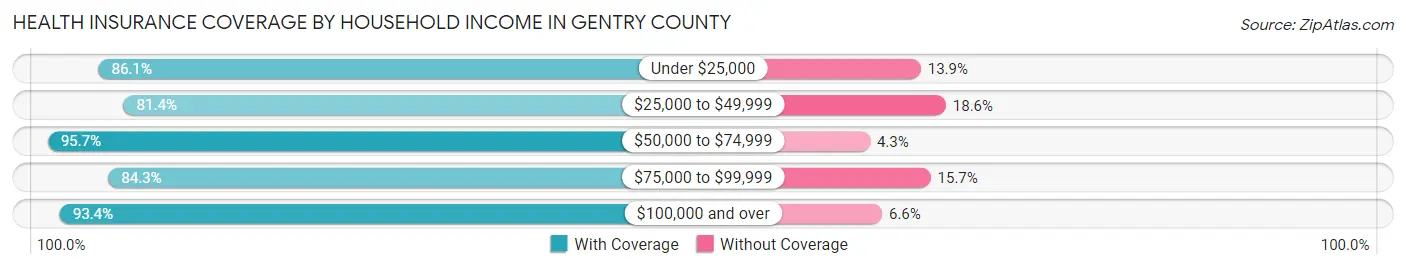
| Household Income | With Coverage | Without Coverage |
| Under $25,000 | 634 (86.1%) | 102 (13.9%) |
| $25,000 to $49,999 | 1,110 (81.4%) | 253 (18.6%) |
| $50,000 to $74,999 | 1,059 (95.7%) | 48 (4.3%) |
| $75,000 to $99,999 | 891 (84.3%) | 166 (15.7%) |
| $100,000 and over | 1,628 (93.4%) | 115 (6.6%) |
Public vs Private Health Insurance Coverage by Age in Gentry County
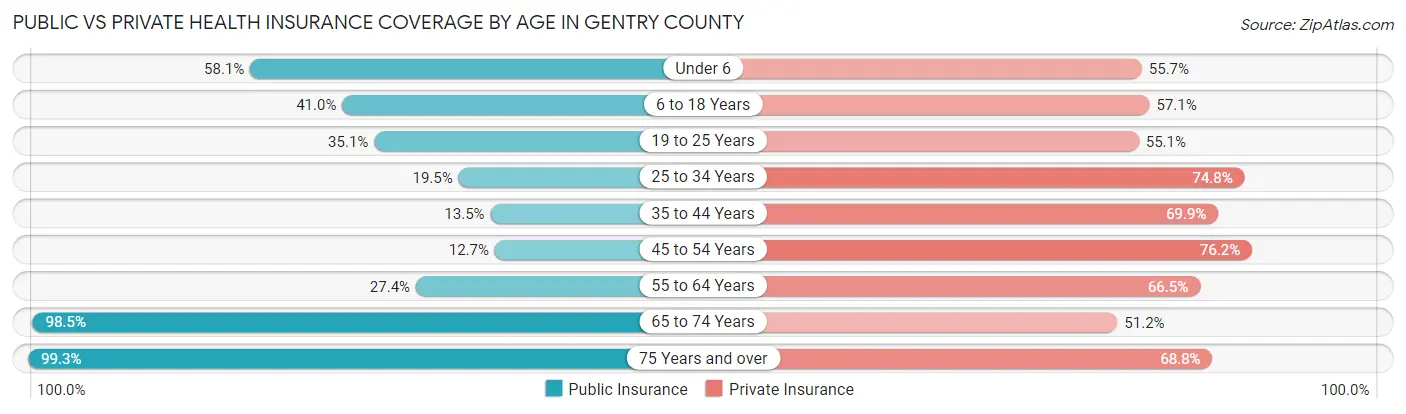
| Age Bracket | Public Insurance | Private Insurance |
| Under 6 | 311 (58.1%) | 298 (55.7%) |
| 6 to 18 Years | 449 (41.0%) | 625 (57.1%) |
| 19 to 25 Years | 151 (35.1%) | 237 (55.1%) |
| 25 to 34 Years | 134 (19.5%) | 515 (74.8%) |
| 35 to 44 Years | 93 (13.5%) | 480 (69.9%) |
| 45 to 54 Years | 88 (12.7%) | 527 (76.2%) |
| 55 to 64 Years | 245 (27.4%) | 595 (66.5%) |
| 65 to 74 Years | 597 (98.5%) | 310 (51.2%) |
| 75 Years and over | 452 (99.3%) | 313 (68.8%) |
| Total | 2,520 (41.4%) | 3,900 (64.1%) |
Disability Status by Sex by Age in Gentry County
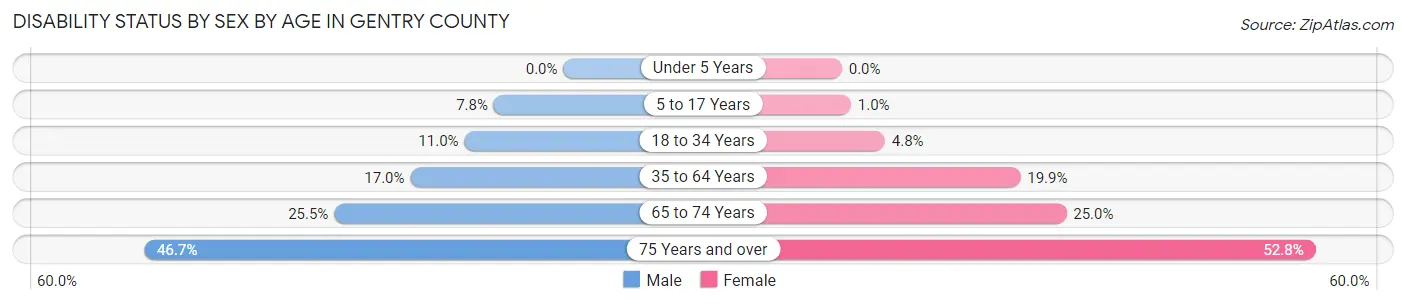
| Age Bracket | Male | Female |
| Under 5 Years | 0 (0.0%) | 0 (0.0%) |
| 5 to 17 Years | 41 (7.7%) | 6 (1.0%) |
| 18 to 34 Years | 70 (11.0%) | 27 (4.8%) |
| 35 to 64 Years | 192 (17.0%) | 228 (19.9%) |
| 65 to 74 Years | 73 (25.5%) | 80 (25.0%) |
| 75 Years and over | 85 (46.7%) | 144 (52.7%) |
Disability Class by Sex by Age in Gentry County
Disability Class: Hearing Difficulty
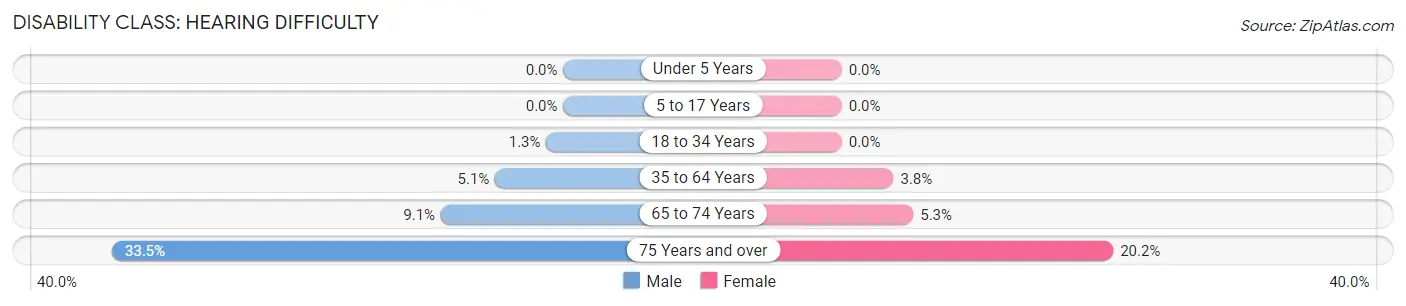
| Age Bracket | Male | Female |
| Under 5 Years | 0 (0.0%) | 0 (0.0%) |
| 5 to 17 Years | 0 (0.0%) | 0 (0.0%) |
| 18 to 34 Years | 8 (1.3%) | 0 (0.0%) |
| 35 to 64 Years | 57 (5.1%) | 44 (3.8%) |
| 65 to 74 Years | 26 (9.1%) | 17 (5.3%) |
| 75 Years and over | 61 (33.5%) | 55 (20.2%) |
Disability Class: Vision Difficulty
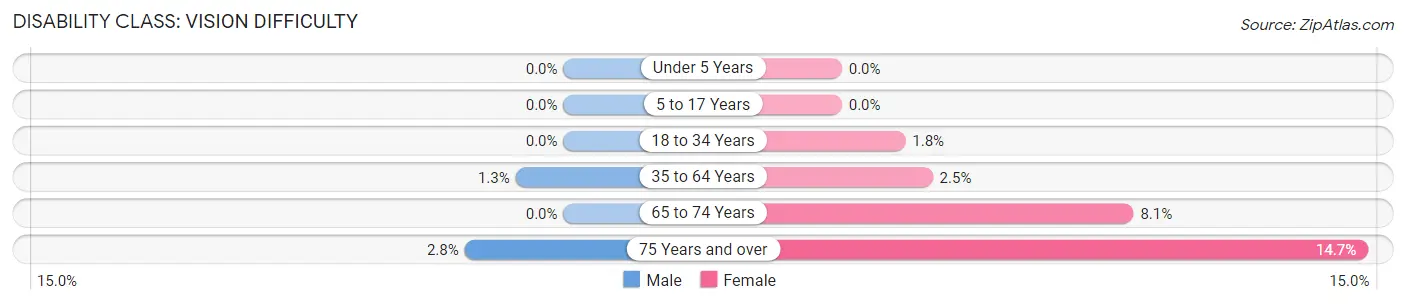
| Age Bracket | Male | Female |
| Under 5 Years | 0 (0.0%) | 0 (0.0%) |
| 5 to 17 Years | 0 (0.0%) | 0 (0.0%) |
| 18 to 34 Years | 0 (0.0%) | 10 (1.8%) |
| 35 to 64 Years | 15 (1.3%) | 29 (2.5%) |
| 65 to 74 Years | 0 (0.0%) | 26 (8.1%) |
| 75 Years and over | 5 (2.8%) | 40 (14.6%) |
Disability Class: Cognitive Difficulty
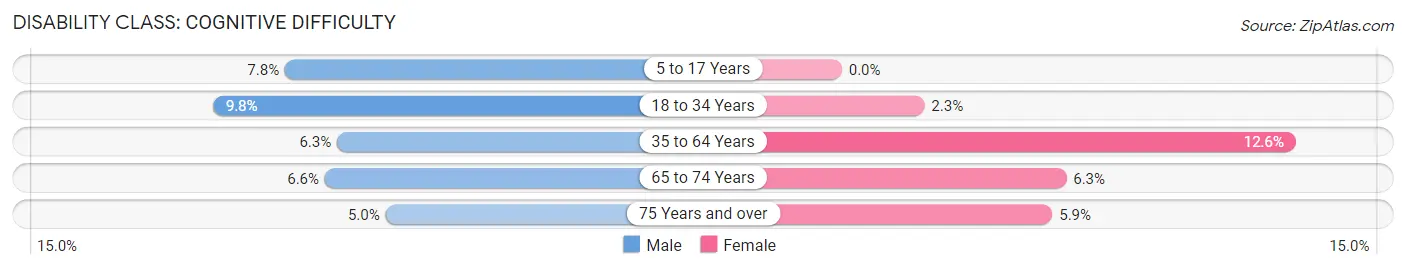
| Age Bracket | Male | Female |
| 5 to 17 Years | 41 (7.7%) | 0 (0.0%) |
| 18 to 34 Years | 62 (9.8%) | 13 (2.3%) |
| 35 to 64 Years | 71 (6.3%) | 145 (12.6%) |
| 65 to 74 Years | 19 (6.6%) | 20 (6.2%) |
| 75 Years and over | 9 (5.0%) | 16 (5.9%) |
Disability Class: Ambulatory Difficulty
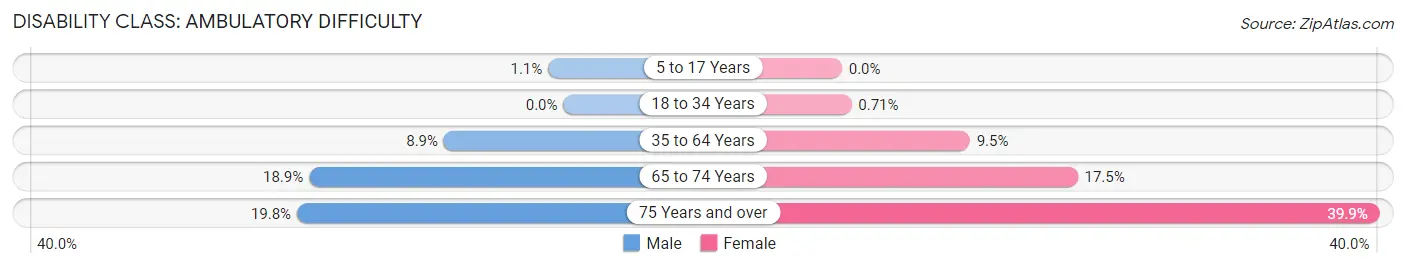
| Age Bracket | Male | Female |
| 5 to 17 Years | 6 (1.1%) | 0 (0.0%) |
| 18 to 34 Years | 0 (0.0%) | 4 (0.7%) |
| 35 to 64 Years | 100 (8.9%) | 109 (9.5%) |
| 65 to 74 Years | 54 (18.9%) | 56 (17.5%) |
| 75 Years and over | 36 (19.8%) | 109 (39.9%) |
Disability Class: Self-Care Difficulty
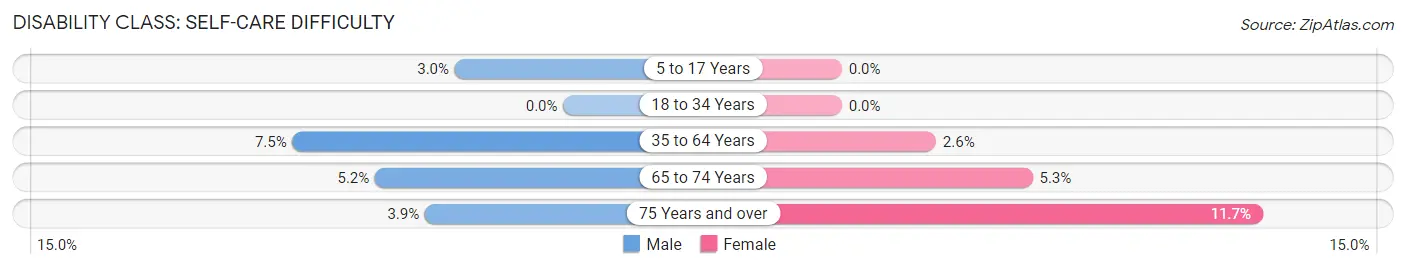
| Age Bracket | Male | Female |
| 5 to 17 Years | 16 (3.0%) | 0 (0.0%) |
| 18 to 34 Years | 0 (0.0%) | 0 (0.0%) |
| 35 to 64 Years | 85 (7.5%) | 30 (2.6%) |
| 65 to 74 Years | 15 (5.2%) | 17 (5.3%) |
| 75 Years and over | 7 (3.8%) | 32 (11.7%) |
Technology Access in Gentry County
Computing Device Access in Gentry County
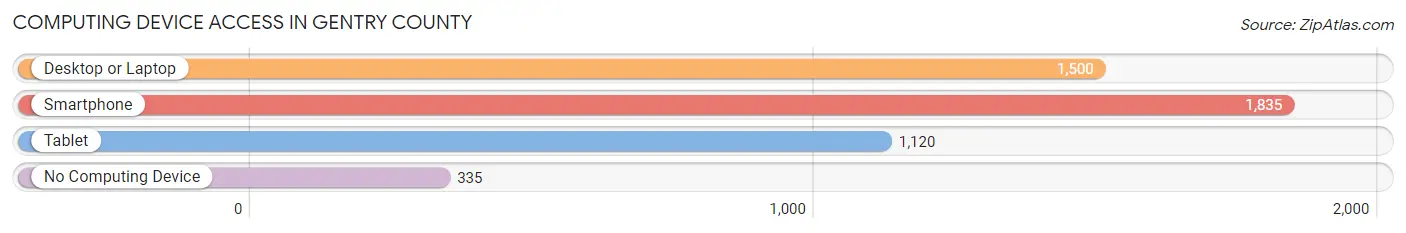
| Device Type | # Households | % Households |
| Desktop or Laptop | 1,500 | 63.9% |
| Smartphone | 1,835 | 78.2% |
| Tablet | 1,120 | 47.7% |
| No Computing Device | 335 | 14.3% |
| Total | 2,347 | 100.0% |
Internet Access in Gentry County
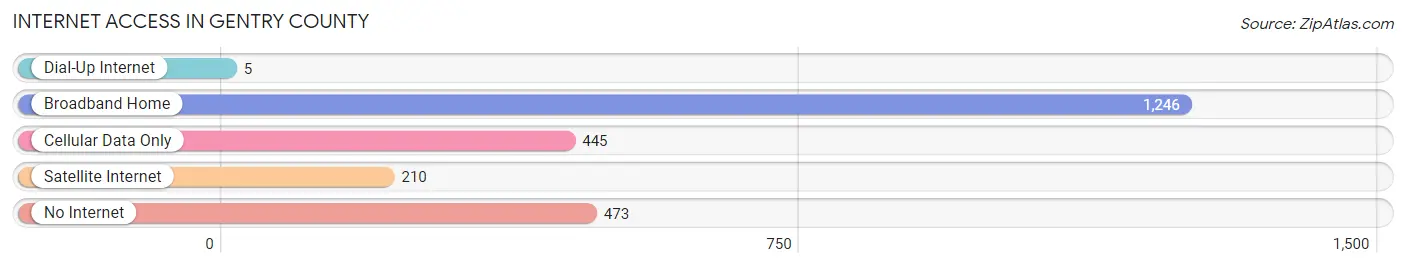
| Internet Type | # Households | % Households |
| Dial-Up Internet | 5 | 0.2% |
| Broadband Home | 1,246 | 53.1% |
| Cellular Data Only | 445 | 19.0% |
| Satellite Internet | 210 | 8.9% |
| No Internet | 473 | 20.2% |
| Total | 2,347 | 100.0% |
Gentry County Summary
Gentry County is located in the northwest corner of Missouri and is part of the St. Joseph Metropolitan Statistical Area. The county was established in 1841 and named after Richard Gentry, a pioneer settler in the area. The county seat is Albany, and the population was 6,743 at the 2010 census.
Geography
Gentry County is located in the northwest corner of Missouri and is bordered by Iowa to the north, Nodaway County to the east, Worth County to the south, and Atchison County, Kansas to the west. The county has a total area of 517 square miles, of which 514 square miles is land and 3 square miles (0.6%) is water. The highest point in the county is located in the northwest corner, at an elevation of 1,068 feet.
The county is mostly rural, with the majority of the land being used for agriculture. The main crops grown in the county are corn, soybeans, and wheat. The county also has a large number of livestock, including cattle, hogs, and sheep.
The county is home to several small towns, including Albany, Stanberry, Gentry, and King City. The county also has several unincorporated communities, including Darlington, McFall, and Rea.
Demographics
As of the 2010 census, there were 6,743 people, 2,717 households, and 1,845 families residing in the county. The population density was 13 people per square mile. There were 3,072 housing units at an average density of 6 per square mile. The racial makeup of the county was 97.3% White, 0.3% African American, 0.2% Native American, 0.2% Asian, 0.1% Pacific Islander, 0.7% from other races, and 1.2% from two or more races. Hispanic or Latino of any race were 1.7% of the population.
There were 2,717 households, out of which 30.2% had children under the age of 18 living with them, 56.2% were married couples living together, 8.2% had a female householder with no husband present, and 31.7% were non-families. 27.2% of all households were made up of individuals, and 14.2% had someone living alone who was 65 years of age or older. The average household size was 2.45 and the average family size was 2.97.
The median age in the county was 41.3 years. 24.2% of residents were under the age of 18; 7.2% were between the ages of 18 and 24; 22.7% were from 25 to 44; 27.2% were from 45 to 64; and 18.7% were 65 years of age or older. The gender makeup of the county was 48.3% male and 51.7% female.
Economy
Gentry County has a largely agricultural economy, with the majority of the land being used for farming. The main crops grown in the county are corn, soybeans, and wheat. The county also has a large number of livestock, including cattle, hogs, and sheep.
The county is also home to several small businesses, including manufacturing, retail, and service industries. The county is home to several small manufacturing companies, including a furniture manufacturer, a metal fabrication company, and a plastics manufacturer. The county also has several retail stores, including grocery stores, hardware stores, and clothing stores.
The county is also home to several service industries, including health care, education, and tourism. The county is home to several hospitals and medical centers, as well as several schools and universities. The county is also home to several tourist attractions, including the Gentry County Historical Museum and the Gentry County Fairgrounds.
Conclusion
Gentry County is a rural county located in the northwest corner of Missouri. The county has a largely agricultural economy, with the majority of the land being used for farming. The county is also home to several small businesses, including manufacturing, retail, and service industries. The county is home to several hospitals and medical centers, as well as several schools and universities. The county is also home to several tourist attractions, including the Gentry County Historical Museum and the Gentry County Fairgrounds. The population of the county was 6,743 at the 2010 census.
Common Questions
What is Per Capita Income in Gentry County?
Per Capita income in Gentry County is $28,968.
What is the Median Family Income in Gentry County?
Median Family Income in Gentry County is $71,996.
What is the Median Household income in Gentry County?
Median Household Income in Gentry County is $53,799.
What is Income or Wage Gap in Gentry County?
Income or Wage Gap in Gentry County is 29.7%.
Women in Gentry County earn 70.3 cents for every dollar earned by a man.
What is Family Income Deficit in Gentry County?
Family Income Deficit in Gentry County is $9,817.
Families that are below poverty line in Gentry County earn $9,817 less on average than the poverty threshold level.
What is Inequality or Gini Index in Gentry County?
Inequality or Gini Index in Gentry County is 0.46.
What is the Total Population of Gentry County?
Total Population of Gentry County is 6,219.
What is the Total Male Population of Gentry County?
Total Male Population of Gentry County is 3,034.
What is the Total Female Population of Gentry County?
Total Female Population of Gentry County is 3,185.
What is the Ratio of Males per 100 Females in Gentry County?
There are 95.26 Males per 100 Females in Gentry County.
What is the Ratio of Females per 100 Males in Gentry County?
There are 104.98 Females per 100 Males in Gentry County.
What is the Median Population Age in Gentry County?
Median Population Age in Gentry County is 40.2 Years.
What is the Average Family Size in Gentry County
Average Family Size in Gentry County is 3.3 People.
What is the Average Household Size in Gentry County
Average Household Size in Gentry County is 2.6 People.
How Large is the Labor Force in Gentry County?
There are 2,890 People in the Labor Forcein in Gentry County.
What is the Percentage of People in the Labor Force in Gentry County?
59.8% of People are in the Labor Force in Gentry County.
What is the Unemployment Rate in Gentry County?
Unemployment Rate in Gentry County is 2.9%.