DeKalb County, MO Map & Demographics
DeKalb County Overview
$25,591
PER CAPITA INCOME
$86,402
AVG FAMILY INCOME
$67,910
AVG HOUSEHOLD INCOME
22.6%
WAGE / INCOME GAP [ % ]
77.4¢/ $1
WAGE / INCOME GAP [ $ ]
$12,812
FAMILY INCOME DEFICIT
0.40
INEQUALITY / GINI INDEX
11,838
TOTAL POPULATION
7,127
MALE POPULATION
4,711
FEMALE POPULATION
151.28
MALES / 100 FEMALES
66.10
FEMALES / 100 MALES
41.7
MEDIAN AGE
3.2
AVG FAMILY SIZE
2.5
AVG HOUSEHOLD SIZE
4,394
LABOR FORCE [ PEOPLE ]
44.2%
PERCENT IN LABOR FORCE
3.1%
UNEMPLOYMENT RATE
DeKalb County Area Codes
Income in DeKalb County
Income Overview in DeKalb County
Per Capita Income in DeKalb County is $25,591, while median incomes of families and households are $86,402 and $67,910 respectively.
| Characteristic | Number | Measure |
| Per Capita Income | 11,838 | $25,591 |
| Median Family Income | 2,240 | $86,402 |
| Mean Family Income | 2,240 | $95,953 |
| Median Household Income | 3,715 | $67,910 |
| Mean Household Income | 3,715 | $77,432 |
| Income Deficit | 2,240 | $12,812 |
| Wage / Income Gap (%) | 11,838 | 22.62% |
| Wage / Income Gap ($) | 11,838 | 77.38¢ per $1 |
| Gini / Inequality Index | 11,838 | 0.40 |
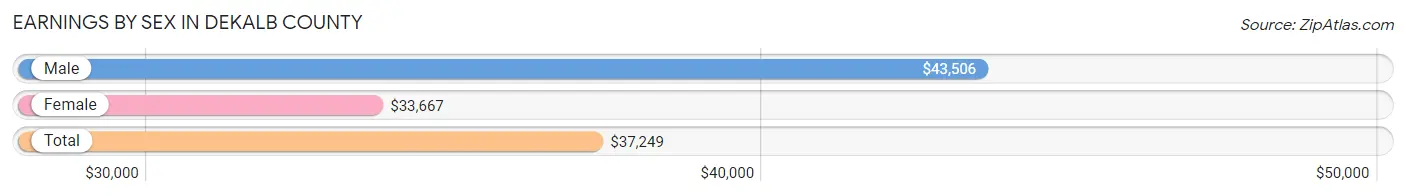
Earnings by Sex in DeKalb County
Average Earnings in DeKalb County are $37,249, $43,506 for men and $33,667 for women, a difference of 22.6%.
| Sex | Number | Average Earnings |
| Male | 2,766 (57.6%) | $43,506 |
| Female | 2,039 (42.4%) | $33,667 |
| Total | 4,805 (100.0%) | $37,249 |
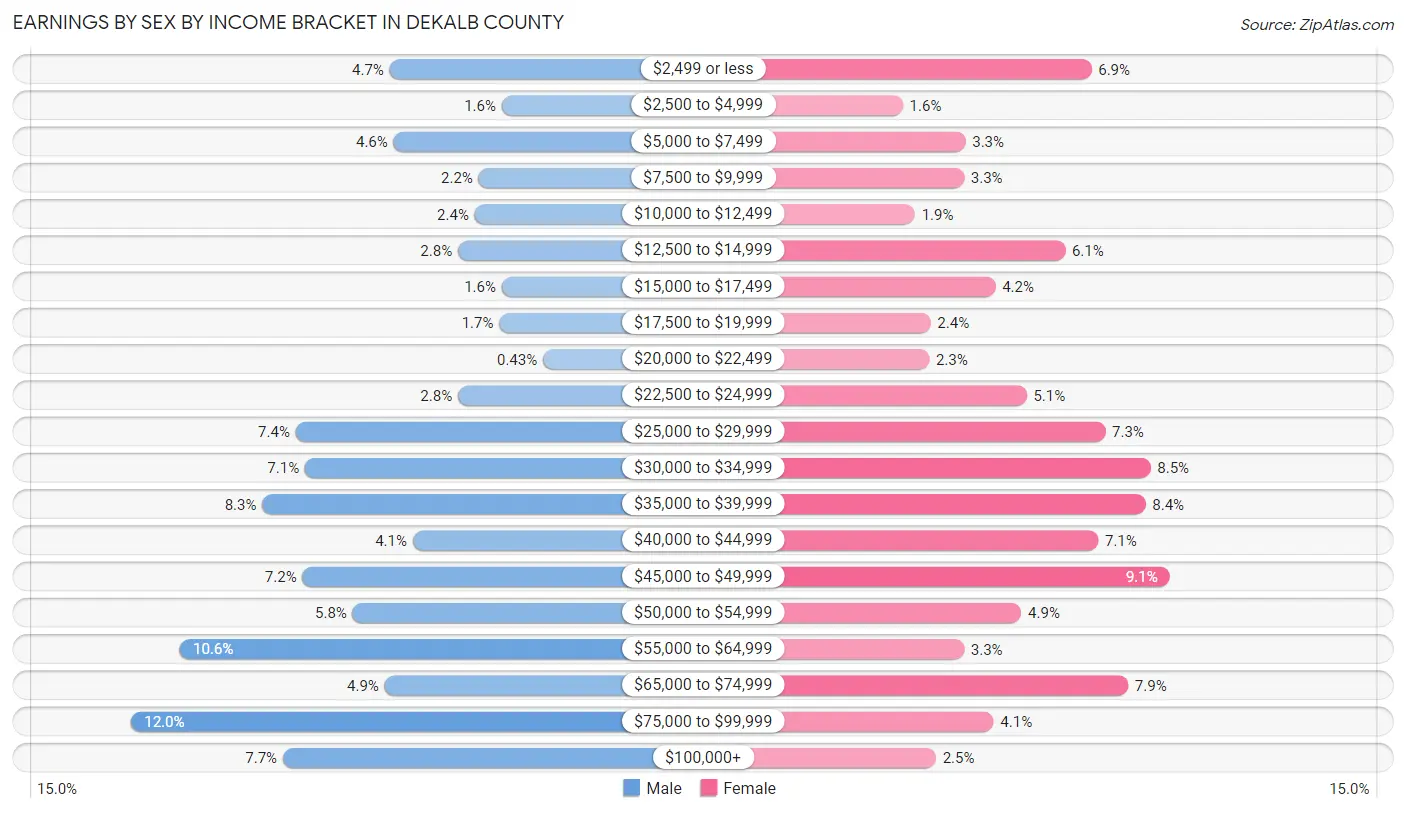
Earnings by Sex by Income Bracket in DeKalb County
The most common earnings brackets in DeKalb County are $75,000 to $99,999 for men (332 | 12.0%) and $45,000 to $49,999 for women (185 | 9.1%).
| Income | Male | Female |
| $2,499 or less | 131 (4.7%) | 140 (6.9%) |
| $2,500 to $4,999 | 44 (1.6%) | 32 (1.6%) |
| $5,000 to $7,499 | 128 (4.6%) | 68 (3.3%) |
| $7,500 to $9,999 | 62 (2.2%) | 67 (3.3%) |
| $10,000 to $12,499 | 65 (2.4%) | 39 (1.9%) |
| $12,500 to $14,999 | 78 (2.8%) | 125 (6.1%) |
| $15,000 to $17,499 | 44 (1.6%) | 85 (4.2%) |
| $17,500 to $19,999 | 46 (1.7%) | 48 (2.4%) |
| $20,000 to $22,499 | 12 (0.4%) | 47 (2.3%) |
| $22,500 to $24,999 | 78 (2.8%) | 103 (5.1%) |
| $25,000 to $29,999 | 204 (7.4%) | 148 (7.3%) |
| $30,000 to $34,999 | 197 (7.1%) | 174 (8.5%) |
| $35,000 to $39,999 | 230 (8.3%) | 171 (8.4%) |
| $40,000 to $44,999 | 113 (4.1%) | 144 (7.1%) |
| $45,000 to $49,999 | 199 (7.2%) | 185 (9.1%) |
| $50,000 to $54,999 | 160 (5.8%) | 100 (4.9%) |
| $55,000 to $64,999 | 294 (10.6%) | 67 (3.3%) |
| $65,000 to $74,999 | 135 (4.9%) | 161 (7.9%) |
| $75,000 to $99,999 | 332 (12.0%) | 84 (4.1%) |
| $100,000+ | 214 (7.7%) | 51 (2.5%) |
| Total | 2,766 (100.0%) | 2,039 (100.0%) |
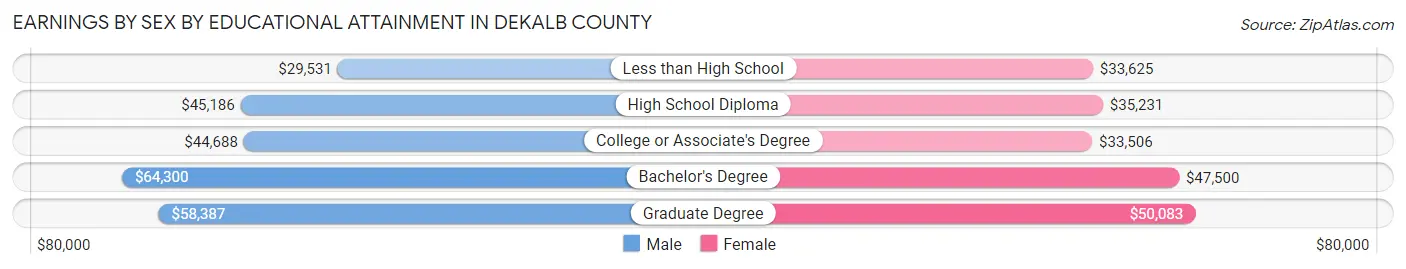
Earnings by Sex by Educational Attainment in DeKalb County
Average earnings in DeKalb County are $47,210 for men and $36,778 for women, a difference of 22.1%. Men with an educational attainment of bachelor's degree enjoy the highest average annual earnings of $64,300, while those with less than high school education earn the least with $29,531. Women with an educational attainment of graduate degree earn the most with the average annual earnings of $50,083, while those with college or associate's degree education have the smallest earnings of $33,506.
| Educational Attainment | Male Income | Female Income |
| Less than High School | $29,531 | $33,625 |
| High School Diploma | $45,186 | $35,231 |
| College or Associate's Degree | $44,688 | $33,506 |
| Bachelor's Degree | $64,300 | $47,500 |
| Graduate Degree | $58,387 | $50,083 |
| Total | $47,210 | $36,778 |
Family Income in DeKalb County
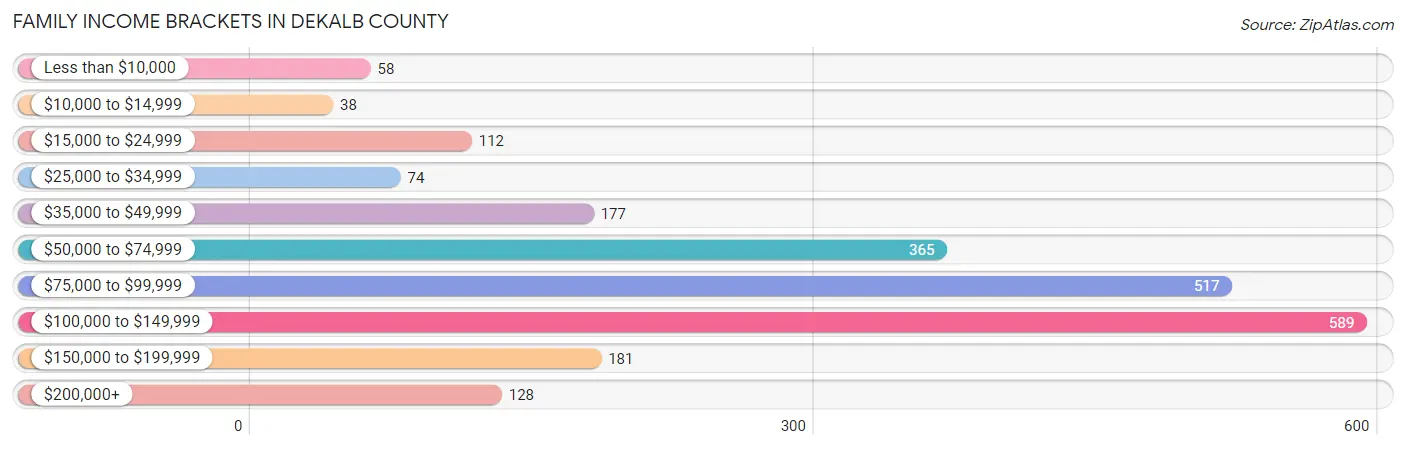
Family Income Brackets in DeKalb County
According to the DeKalb County family income data, there are 589 families falling into the $100,000 to $149,999 income range, which is the most common income bracket and makes up 26.3% of all families. Conversely, the $10,000 to $14,999 income bracket is the least frequent group with only 38 families (1.7%) belonging to this category.
| Income Bracket | # Families | % Families |
| Less than $10,000 | 58 | 2.6% |
| $10,000 to $14,999 | 38 | 1.7% |
| $15,000 to $24,999 | 112 | 5.0% |
| $25,000 to $34,999 | 74 | 3.3% |
| $35,000 to $49,999 | 177 | 7.9% |
| $50,000 to $74,999 | 365 | 16.3% |
| $75,000 to $99,999 | 517 | 23.1% |
| $100,000 to $149,999 | 589 | 26.3% |
| $150,000 to $199,999 | 181 | 8.1% |
| $200,000+ | 128 | 5.7% |
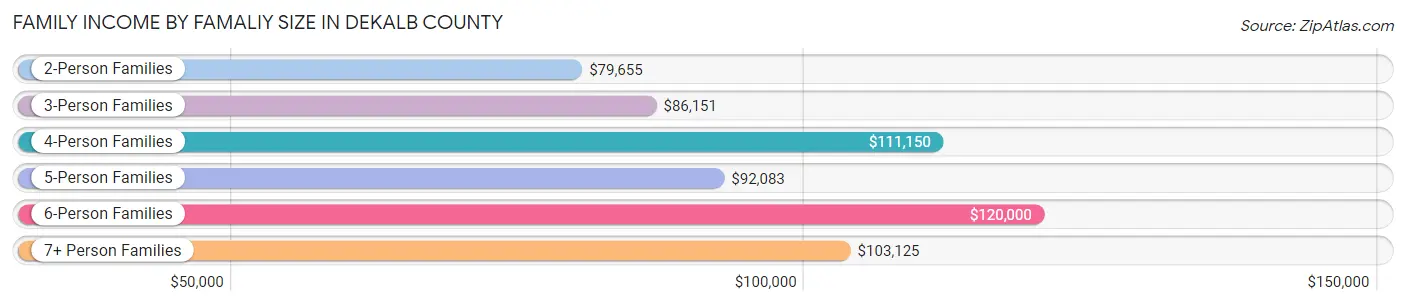
Family Income by Famaliy Size in DeKalb County
6-person families (88 | 3.9%) account for the highest median family income in DeKalb County with $120,000 per family, while 2-person families (1,238 | 55.3%) have the highest median income of $39,828 per family member.
| Income Bracket | # Families | Median Income |
| 2-Person Families | 1,238 (55.3%) | $79,655 |
| 3-Person Families | 404 (18.0%) | $86,151 |
| 4-Person Families | 320 (14.3%) | $111,150 |
| 5-Person Families | 149 (6.7%) | $92,083 |
| 6-Person Families | 88 (3.9%) | $120,000 |
| 7+ Person Families | 41 (1.8%) | $103,125 |
| Total | 2,240 (100.0%) | $86,402 |
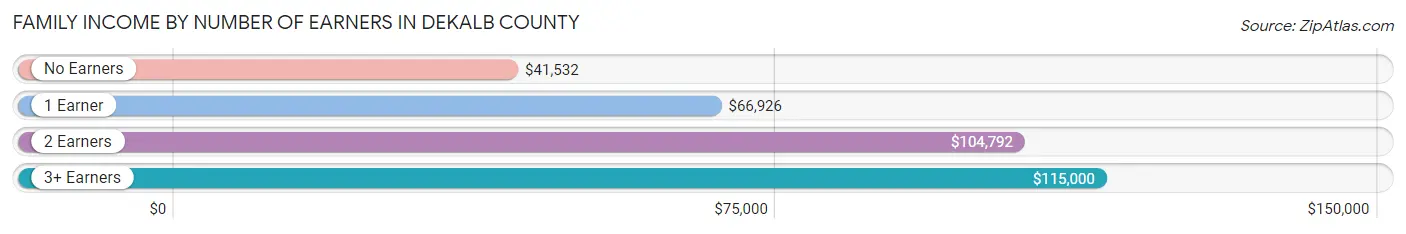
Family Income by Number of Earners in DeKalb County
The median family income in DeKalb County is $86,402, with families comprising 3+ earners (220) having the highest median family income of $115,000, while families with no earners (362) have the lowest median family income of $41,532, accounting for 9.8% and 16.2% of families, respectively.
| Number of Earners | # Families | Median Income |
| No Earners | 362 (16.2%) | $41,532 |
| 1 Earner | 703 (31.4%) | $66,926 |
| 2 Earners | 955 (42.6%) | $104,792 |
| 3+ Earners | 220 (9.8%) | $115,000 |
| Total | 2,240 (100.0%) | $86,402 |
Household Income in DeKalb County
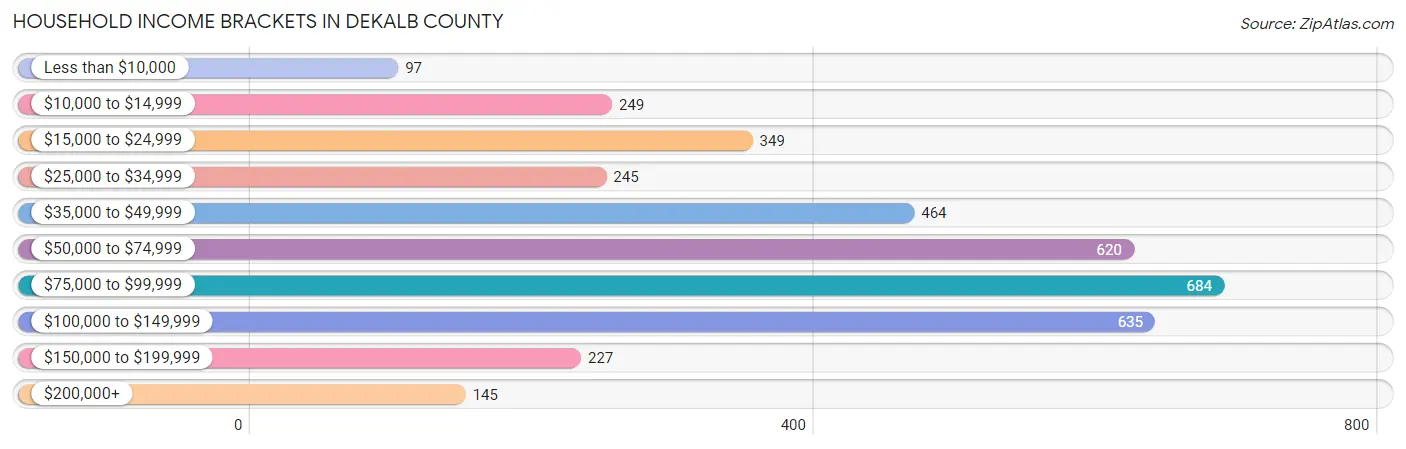
Household Income Brackets in DeKalb County
With 684 households falling in the category, the $75,000 to $99,999 income range is the most frequent in DeKalb County, accounting for 18.4% of all households. In contrast, only 97 households (2.6%) fall into the less than $10,000 income bracket, making it the least populous group.
| Income Bracket | # Households | % Households |
| Less than $10,000 | 97 | 2.6% |
| $10,000 to $14,999 | 249 | 6.7% |
| $15,000 to $24,999 | 349 | 9.4% |
| $25,000 to $34,999 | 245 | 6.6% |
| $35,000 to $49,999 | 464 | 12.5% |
| $50,000 to $74,999 | 620 | 16.7% |
| $75,000 to $99,999 | 684 | 18.4% |
| $100,000 to $149,999 | 635 | 17.1% |
| $150,000 to $199,999 | 227 | 6.1% |
| $200,000+ | 145 | 3.9% |
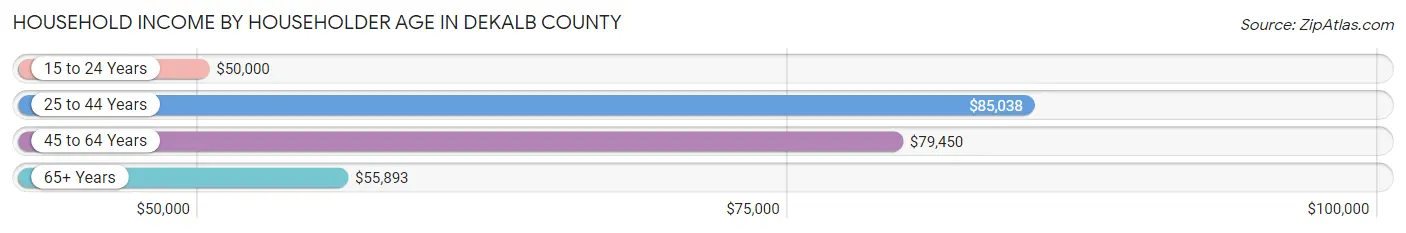
Household Income by Householder Age in DeKalb County
The median household income in DeKalb County is $67,910, with the highest median household income of $85,038 found in the 25 to 44 years age bracket for the primary householder. A total of 908 households (24.4%) fall into this category. Meanwhile, the 15 to 24 years age bracket for the primary householder has the lowest median household income of $50,000, with 128 households (3.5%) in this group.
| Income Bracket | # Households | Median Income |
| 15 to 24 Years | 128 (3.5%) | $50,000 |
| 25 to 44 Years | 908 (24.4%) | $85,038 |
| 45 to 64 Years | 1,395 (37.6%) | $79,450 |
| 65+ Years | 1,284 (34.6%) | $55,893 |
| Total | 3,715 (100.0%) | $67,910 |
Poverty in DeKalb County
Income Below Poverty by Sex and Age in DeKalb County
With 8.5% poverty level for males and 12.2% for females among the residents of DeKalb County, 6 to 11 year old males and under 5 year old females are the most vulnerable to poverty, with 52 males (13.9%) and 66 females (25.8%) in their respective age groups living below the poverty level.
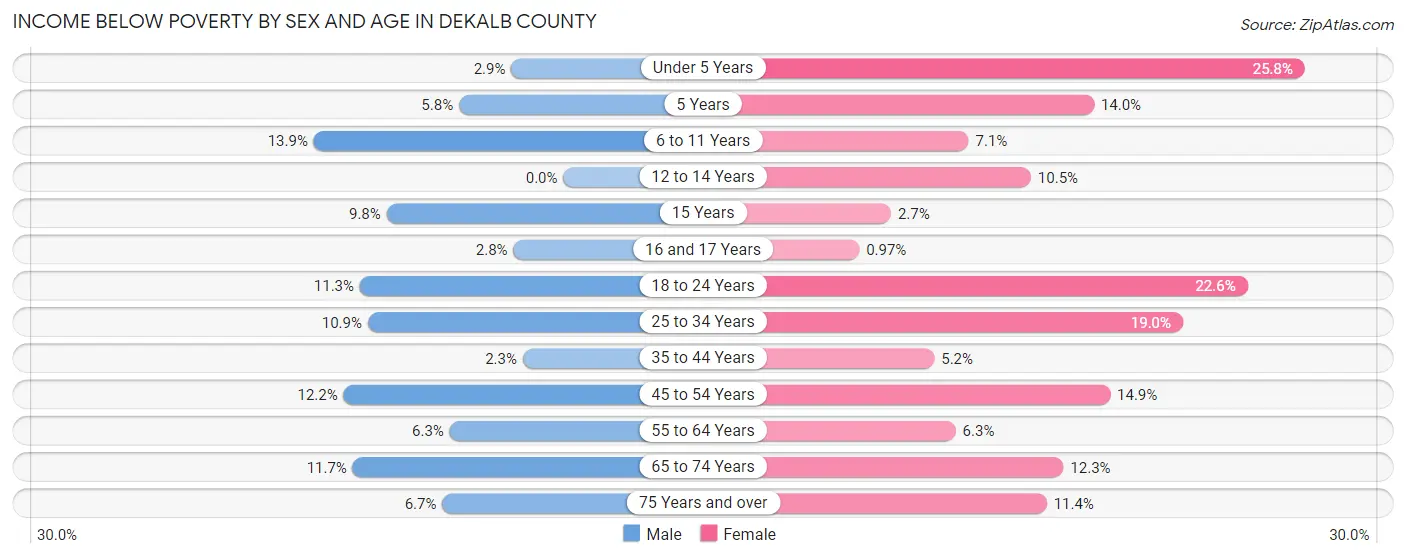
| Age Bracket | Male | Female |
| Under 5 Years | 8 (2.9%) | 66 (25.8%) |
| 5 Years | 5 (5.8%) | 8 (14.0%) |
| 6 to 11 Years | 52 (13.9%) | 25 (7.1%) |
| 12 to 14 Years | 0 (0.0%) | 16 (10.5%) |
| 15 Years | 6 (9.8%) | 2 (2.7%) |
| 16 and 17 Years | 4 (2.8%) | 1 (1.0%) |
| 18 to 24 Years | 46 (11.3%) | 75 (22.6%) |
| 25 to 34 Years | 66 (10.9%) | 90 (19.0%) |
| 35 to 44 Years | 12 (2.3%) | 26 (5.1%) |
| 45 to 54 Years | 87 (12.2%) | 81 (14.9%) |
| 55 to 64 Years | 30 (6.3%) | 42 (6.3%) |
| 65 to 74 Years | 59 (11.7%) | 66 (12.3%) |
| 75 Years and over | 26 (6.7%) | 60 (11.4%) |
| Total | 401 (8.5%) | 558 (12.2%) |
Income Above Poverty by Sex and Age in DeKalb County
According to the poverty statistics in DeKalb County, males aged 12 to 14 years and females aged 16 and 17 years are the age groups that are most secure financially, with 100.0% of males and 99.0% of females in these age groups living above the poverty line.
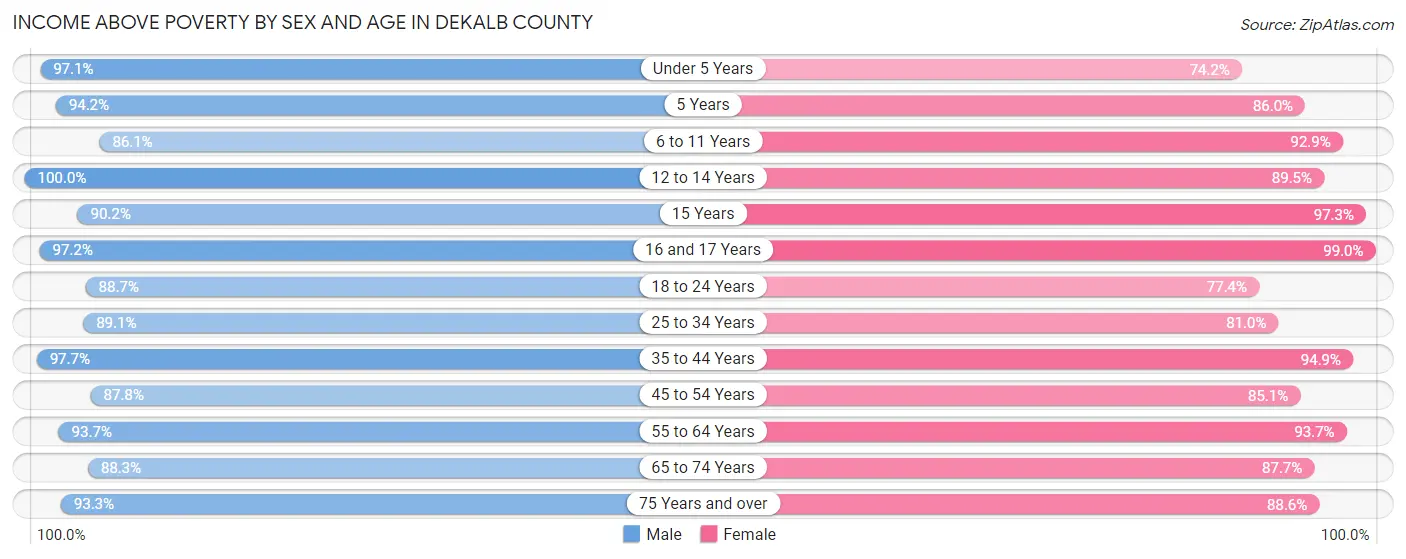
| Age Bracket | Male | Female |
| Under 5 Years | 268 (97.1%) | 190 (74.2%) |
| 5 Years | 81 (94.2%) | 49 (86.0%) |
| 6 to 11 Years | 322 (86.1%) | 329 (92.9%) |
| 12 to 14 Years | 143 (100.0%) | 136 (89.5%) |
| 15 Years | 55 (90.2%) | 71 (97.3%) |
| 16 and 17 Years | 140 (97.2%) | 102 (99.0%) |
| 18 to 24 Years | 360 (88.7%) | 257 (77.4%) |
| 25 to 34 Years | 540 (89.1%) | 384 (81.0%) |
| 35 to 44 Years | 519 (97.7%) | 479 (94.9%) |
| 45 to 54 Years | 624 (87.8%) | 461 (85.1%) |
| 55 to 64 Years | 444 (93.7%) | 620 (93.7%) |
| 65 to 74 Years | 444 (88.3%) | 469 (87.7%) |
| 75 Years and over | 360 (93.3%) | 466 (88.6%) |
| Total | 4,300 (91.5%) | 4,013 (87.8%) |
Income Below Poverty Among Married-Couple Families in DeKalb County
The poverty statistics for married-couple families in DeKalb County show that 2.8% or 51 of the total 1,832 families live below the poverty line. Families with 3 or 4 children have the highest poverty rate of 4.0%, comprising of 7 families. On the other hand, families with 5 or more children have the lowest poverty rate of 0.0%, which includes 0 families.
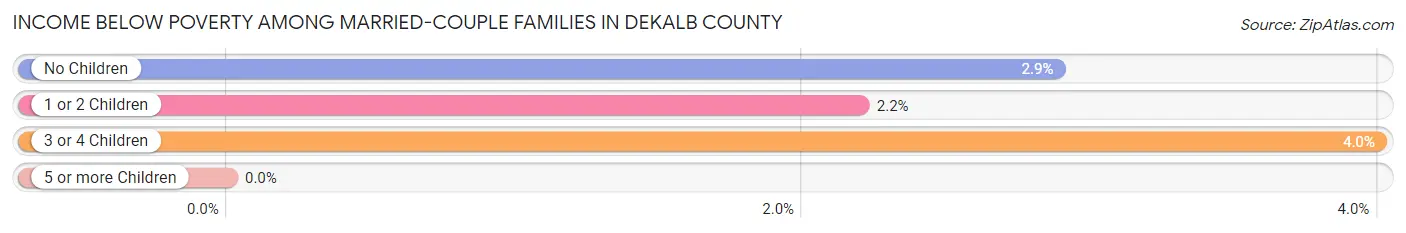
| Children | Above Poverty | Below Poverty |
| No Children | 1,182 (97.1%) | 35 (2.9%) |
| 1 or 2 Children | 401 (97.8%) | 9 (2.2%) |
| 3 or 4 Children | 168 (96.0%) | 7 (4.0%) |
| 5 or more Children | 30 (100.0%) | 0 (0.0%) |
| Total | 1,781 (97.2%) | 51 (2.8%) |
Income Below Poverty Among Single-Parent Households in DeKalb County
According to the poverty data in DeKalb County, 4.4% or 3 single-father households and 20.3% or 69 single-mother households are living below the poverty line. Among single-father households, those with 3 or 4 children have the highest poverty rate, with 1 households (33.3%) experiencing poverty. Likewise, among single-mother households, those with 3 or 4 children have the highest poverty rate, with 15 households (41.7%) falling below the poverty line.
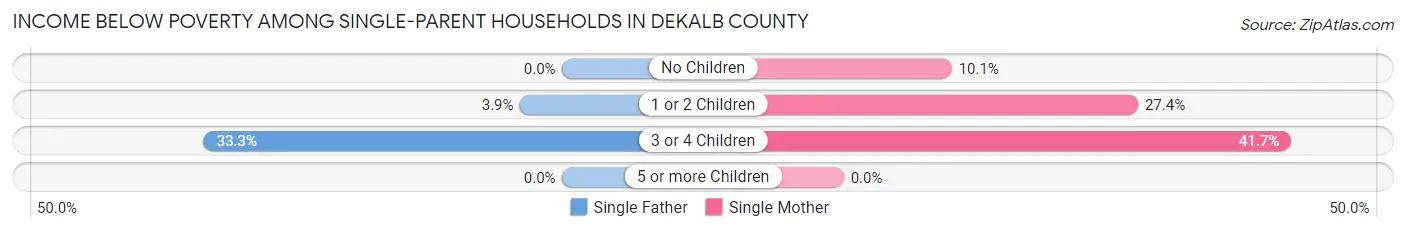
| Children | Single Father | Single Mother |
| No Children | 0 (0.0%) | 17 (10.1%) |
| 1 or 2 Children | 2 (3.9%) | 37 (27.4%) |
| 3 or 4 Children | 1 (33.3%) | 15 (41.7%) |
| 5 or more Children | 0 (0.0%) | 0 (0.0%) |
| Total | 3 (4.4%) | 69 (20.3%) |
Income Below Poverty Among Married-Couple vs Single-Parent Households in DeKalb County
The poverty data for DeKalb County shows that 51 of the married-couple family households (2.8%) and 72 of the single-parent households (17.6%) are living below the poverty level. Within the married-couple family households, those with 3 or 4 children have the highest poverty rate, with 7 households (4.0%) falling below the poverty line. Among the single-parent households, those with 3 or 4 children have the highest poverty rate, with 16 household (41.0%) living below poverty.
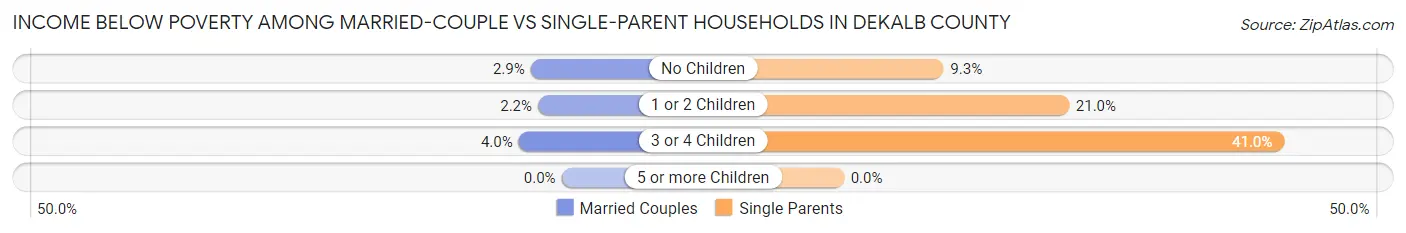
| Children | Married-Couple Families | Single-Parent Households |
| No Children | 35 (2.9%) | 17 (9.3%) |
| 1 or 2 Children | 9 (2.2%) | 39 (21.0%) |
| 3 or 4 Children | 7 (4.0%) | 16 (41.0%) |
| 5 or more Children | 0 (0.0%) | 0 (0.0%) |
| Total | 51 (2.8%) | 72 (17.6%) |
Race in DeKalb County
The most populous races in DeKalb County are White / Caucasian (10,222 | 86.4%), Black / African American (974 | 8.2%), and Two or more Races (420 | 3.5%).
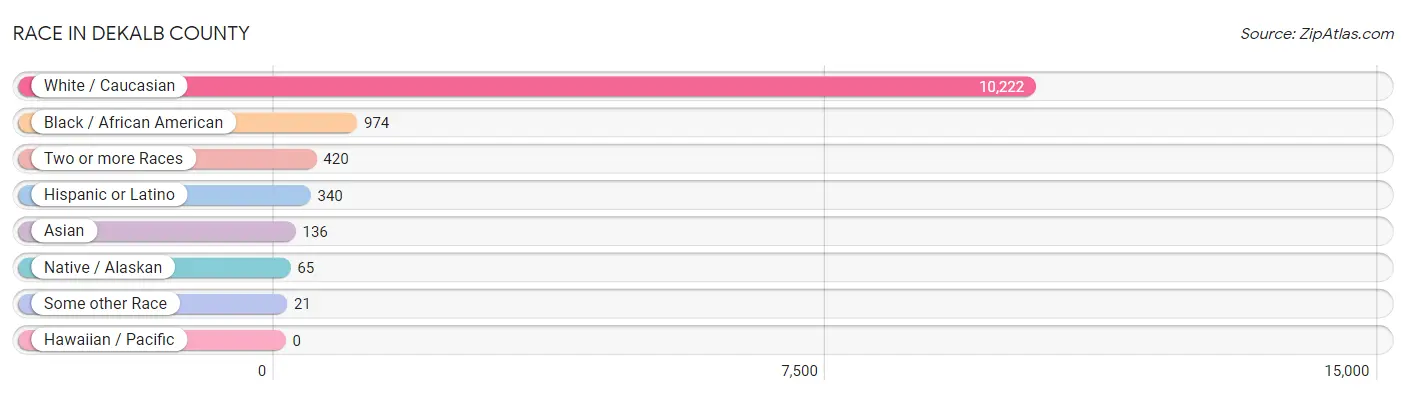
| Race | # Population | % Population |
| Asian | 136 | 1.1% |
| Black / African American | 974 | 8.2% |
| Hawaiian / Pacific | 0 | 0.0% |
| Hispanic or Latino | 340 | 2.9% |
| Native / Alaskan | 65 | 0.5% |
| White / Caucasian | 10,222 | 86.4% |
| Two or more Races | 420 | 3.5% |
| Some other Race | 21 | 0.2% |
| Total | 11,838 | 100.0% |
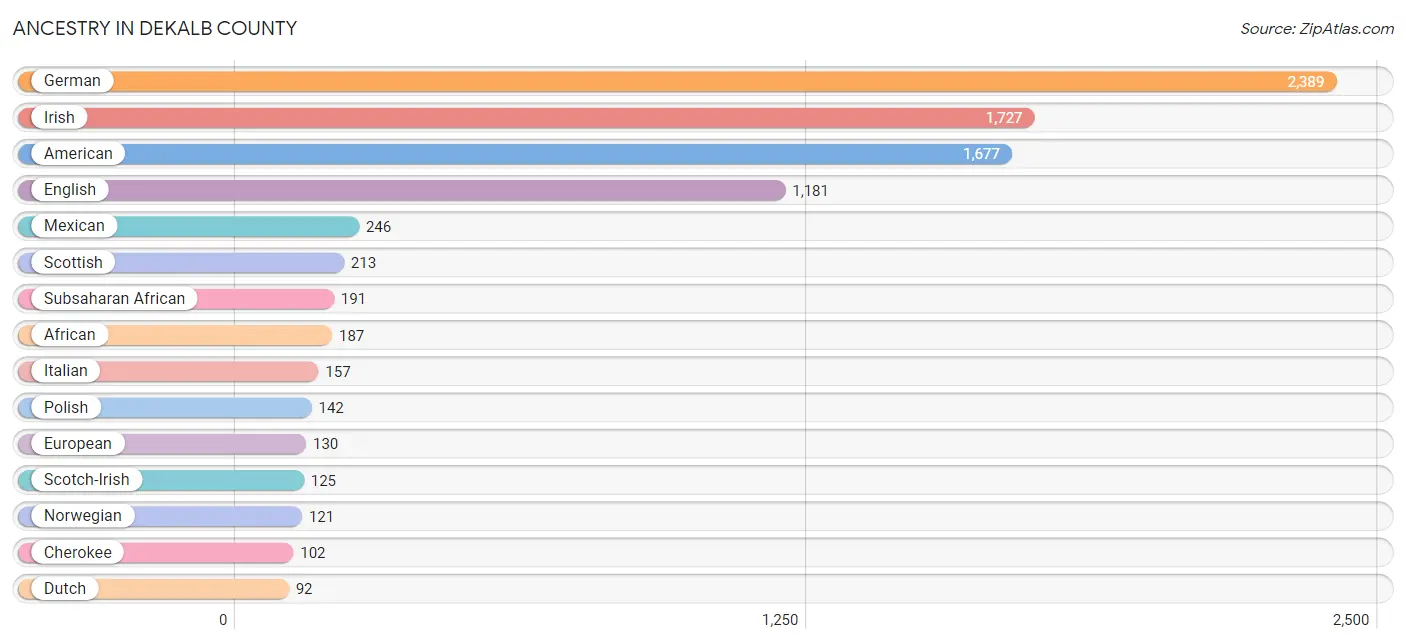
Ancestry in DeKalb County
The most populous ancestries reported in DeKalb County are German (2,389 | 20.2%), Irish (1,727 | 14.6%), American (1,677 | 14.2%), English (1,181 | 10.0%), and Mexican (246 | 2.1%), together accounting for 61.0% of all DeKalb County residents.
| Ancestry | # Population | % Population |
| African | 187 | 1.6% |
| American | 1,677 | 14.2% |
| Apache | 4 | 0.0% |
| Arab | 14 | 0.1% |
| Blackfeet | 22 | 0.2% |
| British | 43 | 0.4% |
| Bulgarian | 38 | 0.3% |
| Canadian | 8 | 0.1% |
| Central American | 18 | 0.2% |
| Cherokee | 102 | 0.9% |
| Chippewa | 31 | 0.3% |
| Croatian | 5 | 0.0% |
| Cuban | 23 | 0.2% |
| Czech | 13 | 0.1% |
| Czechoslovakian | 11 | 0.1% |
| Danish | 11 | 0.1% |
| Dutch | 92 | 0.8% |
| Eastern European | 11 | 0.1% |
| English | 1,181 | 10.0% |
| European | 130 | 1.1% |
| Finnish | 6 | 0.1% |
| French | 91 | 0.8% |
| French Canadian | 3 | 0.0% |
| German | 2,389 | 20.2% |
| Greek | 14 | 0.1% |
| Guyanese | 24 | 0.2% |
| Haitian | 4 | 0.0% |
| Honduran | 4 | 0.0% |
| Hungarian | 2 | 0.0% |
| Indian (Asian) | 9 | 0.1% |
| Irish | 1,727 | 14.6% |
| Italian | 157 | 1.3% |
| Jamaican | 5 | 0.0% |
| Kiowa | 3 | 0.0% |
| Korean | 88 | 0.7% |
| Lithuanian | 4 | 0.0% |
| Mexican | 246 | 2.1% |
| Moroccan | 14 | 0.1% |
| Navajo | 17 | 0.1% |
| Nicaraguan | 9 | 0.1% |
| Northern European | 1 | 0.0% |
| Norwegian | 121 | 1.0% |
| Panamanian | 5 | 0.0% |
| Pennsylvania German | 52 | 0.4% |
| Polish | 142 | 1.2% |
| Portuguese | 1 | 0.0% |
| Potawatomi | 4 | 0.0% |
| Puerto Rican | 40 | 0.3% |
| Russian | 5 | 0.0% |
| Samoan | 47 | 0.4% |
| Scandinavian | 28 | 0.2% |
| Scotch-Irish | 125 | 1.1% |
| Scottish | 213 | 1.8% |
| Sioux | 14 | 0.1% |
| Spanish | 13 | 0.1% |
| Sri Lankan | 15 | 0.1% |
| Subsaharan African | 191 | 1.6% |
| Swedish | 92 | 0.8% |
| Swiss | 52 | 0.4% |
| Thai | 26 | 0.2% |
| Ukrainian | 11 | 0.1% |
| Welsh | 67 | 0.6% | View All 62 Rows |
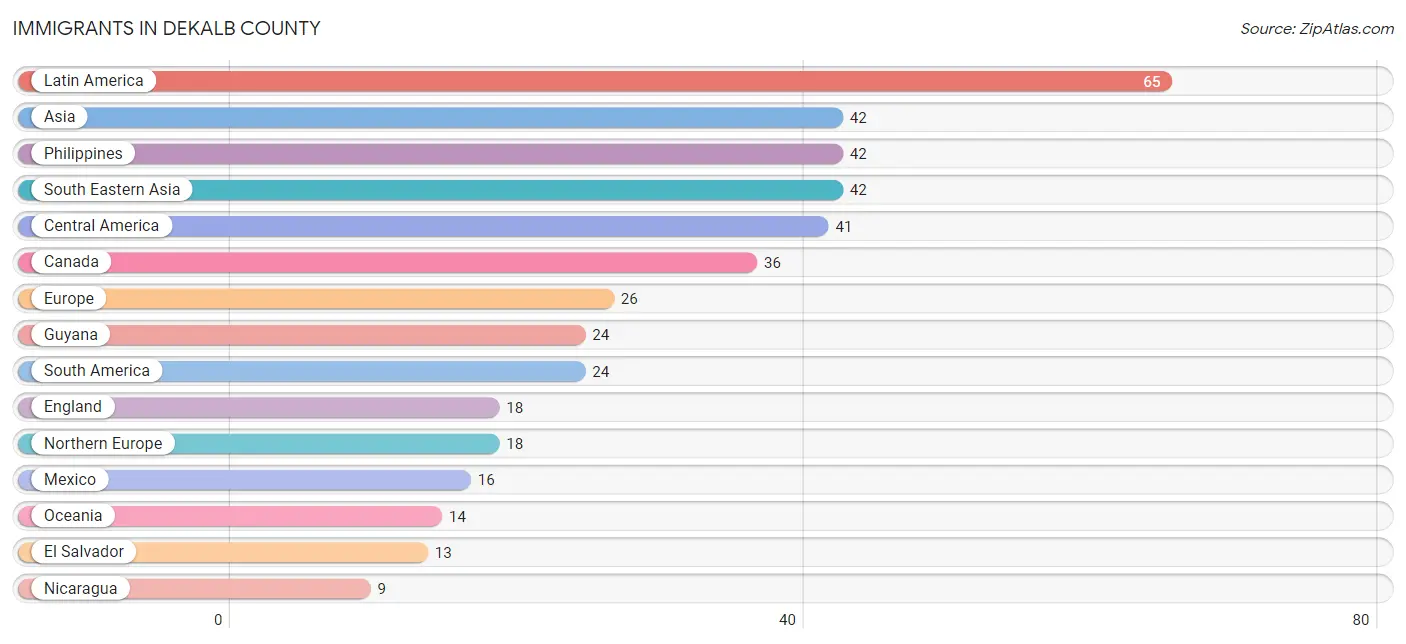
Immigrants in DeKalb County
The most numerous immigrant groups reported in DeKalb County came from Latin America (65 | 0.5%), Asia (42 | 0.4%), Philippines (42 | 0.4%), South Eastern Asia (42 | 0.4%), and Central America (41 | 0.4%), together accounting for 1.9% of all DeKalb County residents.
| Immigration Origin | # Population | % Population |
| Africa | 4 | 0.0% |
| Asia | 42 | 0.4% |
| Canada | 36 | 0.3% |
| Central America | 41 | 0.4% |
| Eastern Europe | 6 | 0.1% |
| El Salvador | 13 | 0.1% |
| England | 18 | 0.2% |
| Europe | 26 | 0.2% |
| Germany | 2 | 0.0% |
| Guyana | 24 | 0.2% |
| Latin America | 65 | 0.5% |
| Mexico | 16 | 0.1% |
| Nicaragua | 9 | 0.1% |
| Northern Europe | 18 | 0.2% |
| Oceania | 14 | 0.1% |
| Panama | 3 | 0.0% |
| Philippines | 42 | 0.4% |
| South America | 24 | 0.2% |
| South Eastern Asia | 42 | 0.4% |
| Ukraine | 6 | 0.1% |
| Western Europe | 2 | 0.0% | View All 21 Rows |
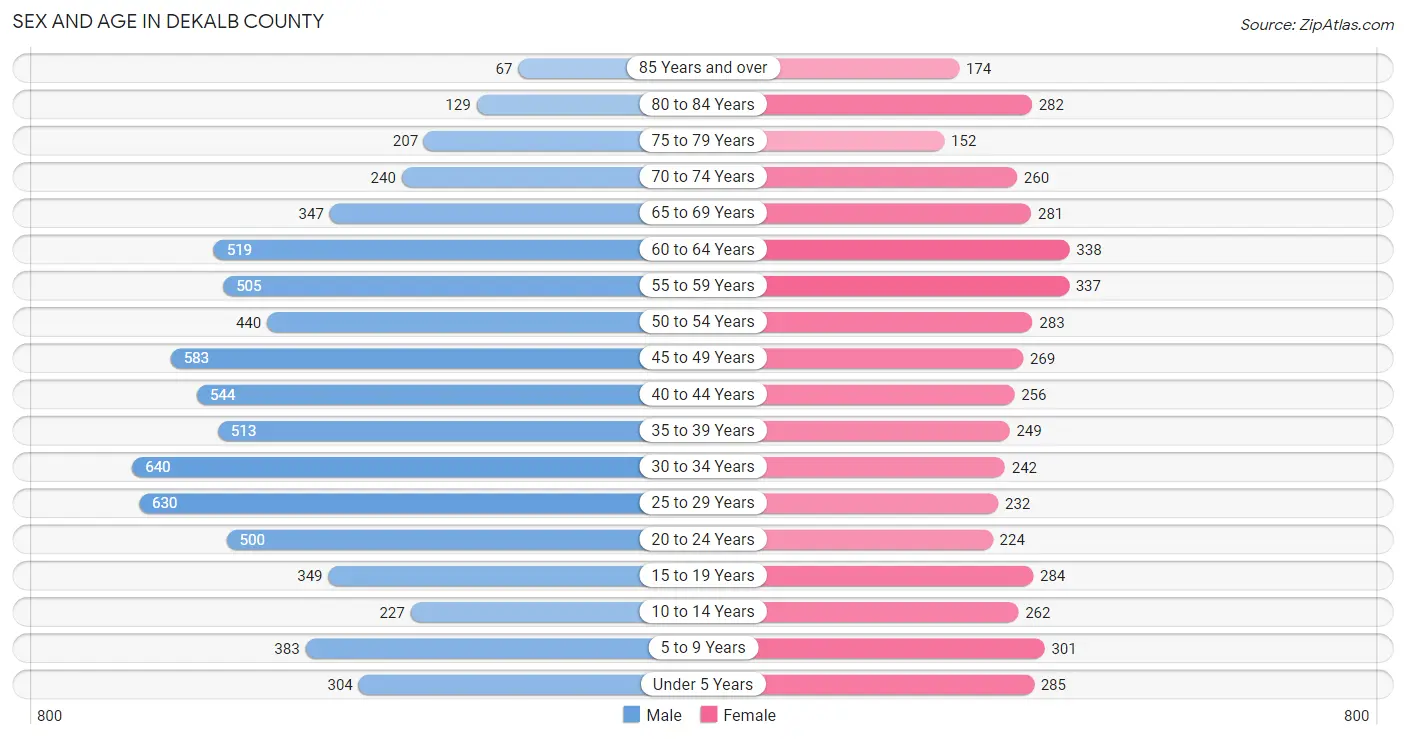
Sex and Age in DeKalb County
Sex and Age in DeKalb County
The most populous age groups in DeKalb County are 30 to 34 Years (640 | 9.0%) for men and 60 to 64 Years (338 | 7.2%) for women.
| Age Bracket | Male | Female |
| Under 5 Years | 304 (4.3%) | 285 (6.0%) |
| 5 to 9 Years | 383 (5.4%) | 301 (6.4%) |
| 10 to 14 Years | 227 (3.2%) | 262 (5.6%) |
| 15 to 19 Years | 349 (4.9%) | 284 (6.0%) |
| 20 to 24 Years | 500 (7.0%) | 224 (4.8%) |
| 25 to 29 Years | 630 (8.8%) | 232 (4.9%) |
| 30 to 34 Years | 640 (9.0%) | 242 (5.1%) |
| 35 to 39 Years | 513 (7.2%) | 249 (5.3%) |
| 40 to 44 Years | 544 (7.6%) | 256 (5.4%) |
| 45 to 49 Years | 583 (8.2%) | 269 (5.7%) |
| 50 to 54 Years | 440 (6.2%) | 283 (6.0%) |
| 55 to 59 Years | 505 (7.1%) | 337 (7.1%) |
| 60 to 64 Years | 519 (7.3%) | 338 (7.2%) |
| 65 to 69 Years | 347 (4.9%) | 281 (6.0%) |
| 70 to 74 Years | 240 (3.4%) | 260 (5.5%) |
| 75 to 79 Years | 207 (2.9%) | 152 (3.2%) |
| 80 to 84 Years | 129 (1.8%) | 282 (6.0%) |
| 85 Years and over | 67 (0.9%) | 174 (3.7%) |
| Total | 7,127 (100.0%) | 4,711 (100.0%) |
Families and Households in DeKalb County
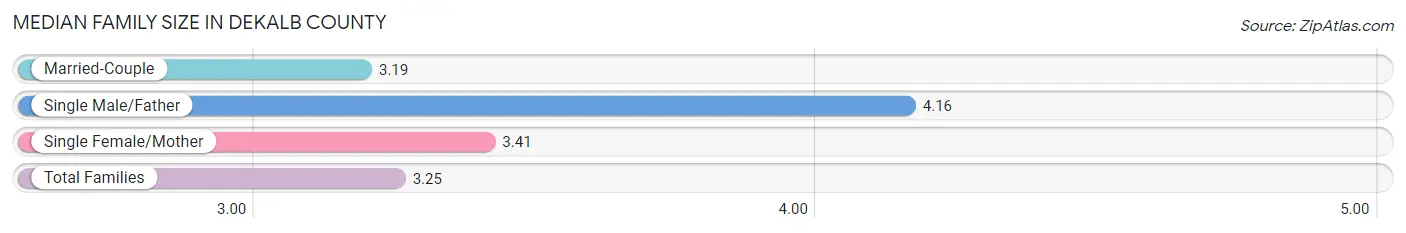
Median Family Size in DeKalb County
The median family size in DeKalb County is 3.25 persons per family, with single male/father families (68 | 3.0%) accounting for the largest median family size of 4.16 persons per family. On the other hand, married-couple families (1,832 | 81.8%) represent the smallest median family size with 3.19 persons per family.
| Family Type | # Families | Family Size |
| Married-Couple | 1,832 (81.8%) | 3.19 |
| Single Male/Father | 68 (3.0%) | 4.16 |
| Single Female/Mother | 340 (15.2%) | 3.41 |
| Total Families | 2,240 (100.0%) | 3.25 |
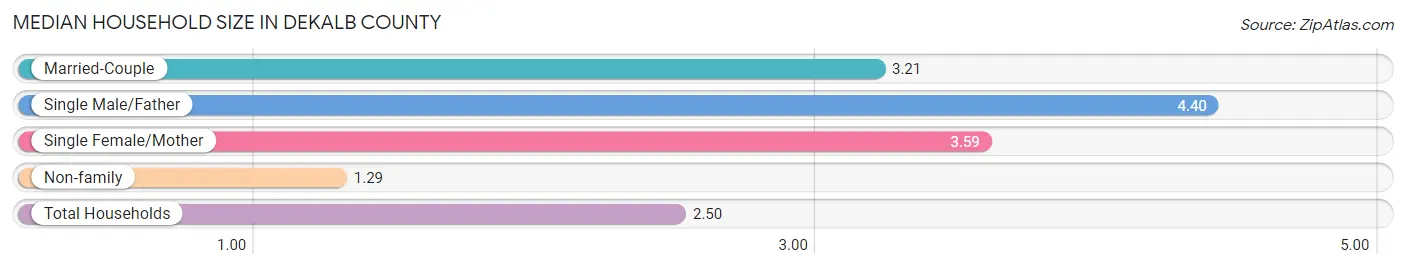
Median Household Size in DeKalb County
The median household size in DeKalb County is 2.50 persons per household, with single male/father households (68 | 1.8%) accounting for the largest median household size of 4.4 persons per household. non-family households (1,475 | 39.7%) represent the smallest median household size with 1.29 persons per household.
| Household Type | # Households | Household Size |
| Married-Couple | 1,832 (49.3%) | 3.21 |
| Single Male/Father | 68 (1.8%) | 4.40 |
| Single Female/Mother | 340 (9.1%) | 3.59 |
| Non-family | 1,475 (39.7%) | 1.29 |
| Total Households | 3,715 (100.0%) | 2.50 |
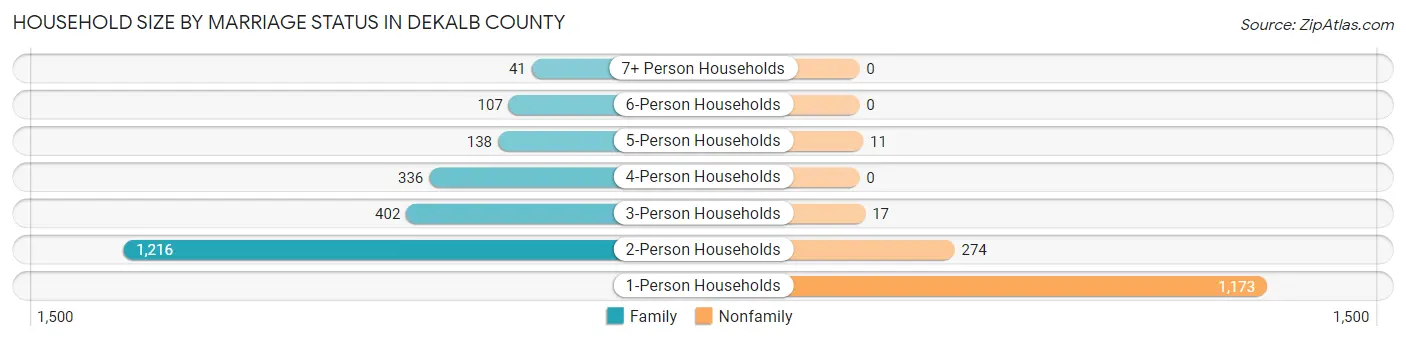
Household Size by Marriage Status in DeKalb County
Out of a total of 3,715 households in DeKalb County, 2,240 (60.3%) are family households, while 1,475 (39.7%) are nonfamily households. The most numerous type of family households are 2-person households, comprising 1,216, and the most common type of nonfamily households are 1-person households, comprising 1,173.
| Household Size | Family Households | Nonfamily Households |
| 1-Person Households | - | 1,173 (31.6%) |
| 2-Person Households | 1,216 (32.7%) | 274 (7.4%) |
| 3-Person Households | 402 (10.8%) | 17 (0.5%) |
| 4-Person Households | 336 (9.0%) | 0 (0.0%) |
| 5-Person Households | 138 (3.7%) | 11 (0.3%) |
| 6-Person Households | 107 (2.9%) | 0 (0.0%) |
| 7+ Person Households | 41 (1.1%) | 0 (0.0%) |
| Total | 2,240 (60.3%) | 1,475 (39.7%) |
Female Fertility in DeKalb County
Fertility by Age in DeKalb County
Average fertility rate in DeKalb County is 81.0 births per 1,000 women. Women in the age bracket of 20 to 34 years have the highest fertility rate with 153.0 births per 1,000 women. Women in the age bracket of 20 to 34 years acount for 73.8% of all women with births.
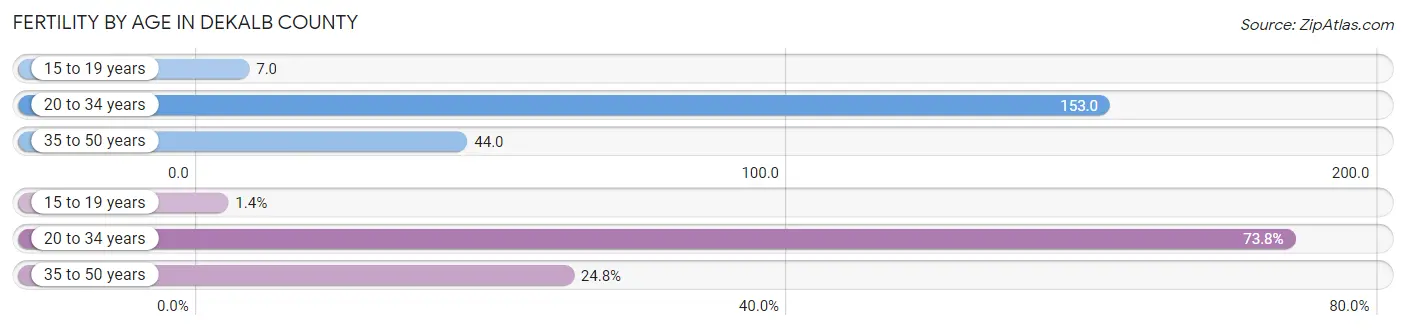
| Age Bracket | Women with Births | Births / 1,000 Women |
| 15 to 19 years | 2 (1.4%) | 7.0 |
| 20 to 34 years | 107 (73.8%) | 153.0 |
| 35 to 50 years | 36 (24.8%) | 44.0 |
| Total | 145 (100.0%) | 81.0 |
Fertility by Age by Marriage Status in DeKalb County
55.9% of women with births (145) in DeKalb County are married. The highest percentage of unmarried women with births falls into 20 to 34 years age bracket with 56.1% of them unmarried at the time of birth, while the lowest percentage of unmarried women with births belong to 15 to 19 years age bracket with 0.0% of them unmarried.
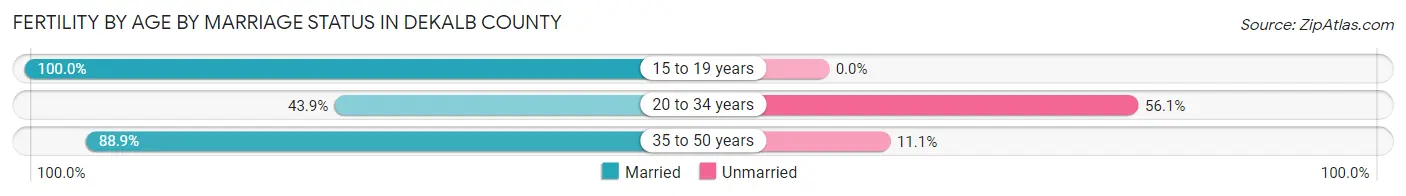
| Age Bracket | Married | Unmarried |
| 15 to 19 years | 2 (100.0%) | 0 (0.0%) |
| 20 to 34 years | 47 (43.9%) | 60 (56.1%) |
| 35 to 50 years | 32 (88.9%) | 4 (11.1%) |
| Total | 81 (55.9%) | 64 (44.1%) |
Fertility by Education in DeKalb County
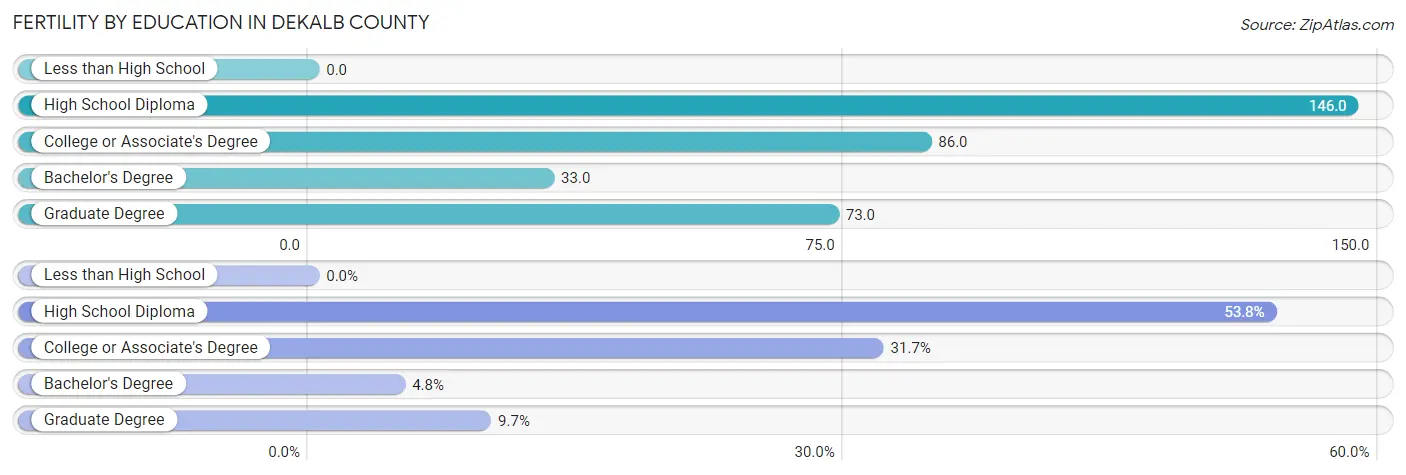
| Educational Attainment | Women with Births | Births / 1,000 Women |
| Less than High School | 0 (0.0%) | 0.0 |
| High School Diploma | 78 (53.8%) | 146.0 |
| College or Associate's Degree | 46 (31.7%) | 86.0 |
| Bachelor's Degree | 7 (4.8%) | 33.0 |
| Graduate Degree | 14 (9.7%) | 73.0 |
| Total | 145 (100.0%) | 81.0 |
Fertility by Education by Marriage Status in DeKalb County
44.1% of women with births in DeKalb County are unmarried. Women with the educational attainment of bachelor's degree are most likely to be married with 100.0% of them married at childbirth, while women with the educational attainment of high school diploma are least likely to be married with 76.9% of them unmarried at childbirth.
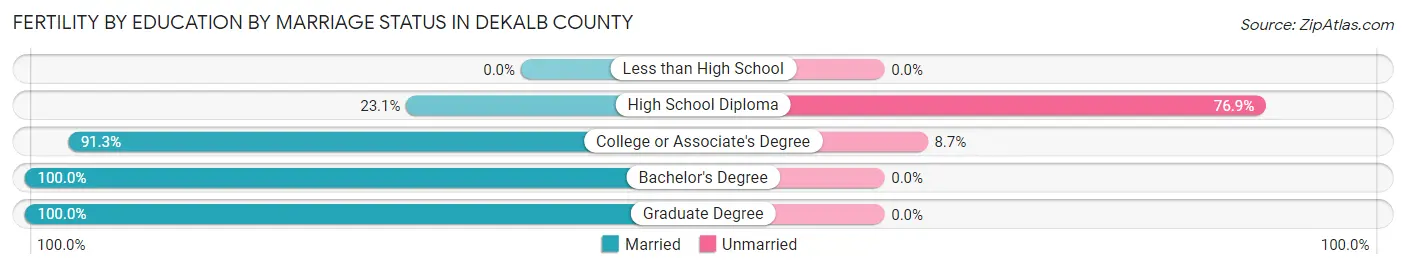
| Educational Attainment | Married | Unmarried |
| Less than High School | 0 (0.0%) | 0 (0.0%) |
| High School Diploma | 18 (23.1%) | 60 (76.9%) |
| College or Associate's Degree | 42 (91.3%) | 4 (8.7%) |
| Bachelor's Degree | 7 (100.0%) | 0 (0.0%) |
| Graduate Degree | 14 (100.0%) | 0 (0.0%) |
| Total | 81 (55.9%) | 64 (44.1%) |
Employment Characteristics in DeKalb County
Employment by Class of Employer in DeKalb County
Among the 4,208 employed individuals in DeKalb County, private company employees (2,498 | 59.4%), state government employees (408 | 9.7%), and self-employed (not incorporated) (363 | 8.6%) make up the most common classes of employment.
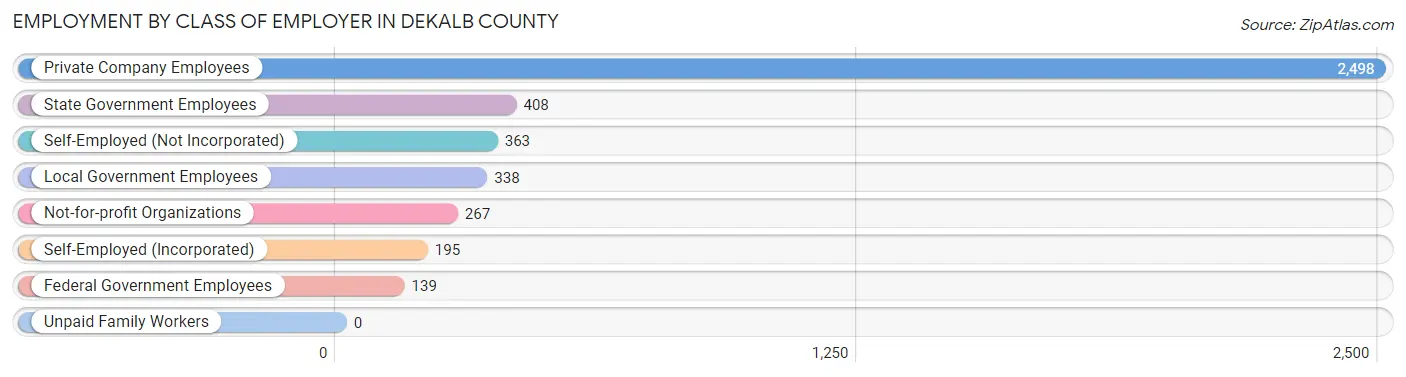
| Employer Class | # Employees | % Employees |
| Private Company Employees | 2,498 | 59.4% |
| Self-Employed (Incorporated) | 195 | 4.6% |
| Self-Employed (Not Incorporated) | 363 | 8.6% |
| Not-for-profit Organizations | 267 | 6.4% |
| Local Government Employees | 338 | 8.0% |
| State Government Employees | 408 | 9.7% |
| Federal Government Employees | 139 | 3.3% |
| Unpaid Family Workers | 0 | 0.0% |
| Total | 4,208 | 100.0% |
Employment Status by Age in DeKalb County
According to the labor force statistics for DeKalb County, out of the total population over 16 years of age (9,942), 44.2% or 4,394 individuals are in the labor force, with 3.1% or 136 of them unemployed. The age group with the highest labor force participation rate is 45 to 54 years, with 67.4% or 1,062 individuals in the labor force. Within the labor force, the 25 to 29 years age range has the highest percentage of unemployed individuals, with 9.4% or 42 of them being unemployed.
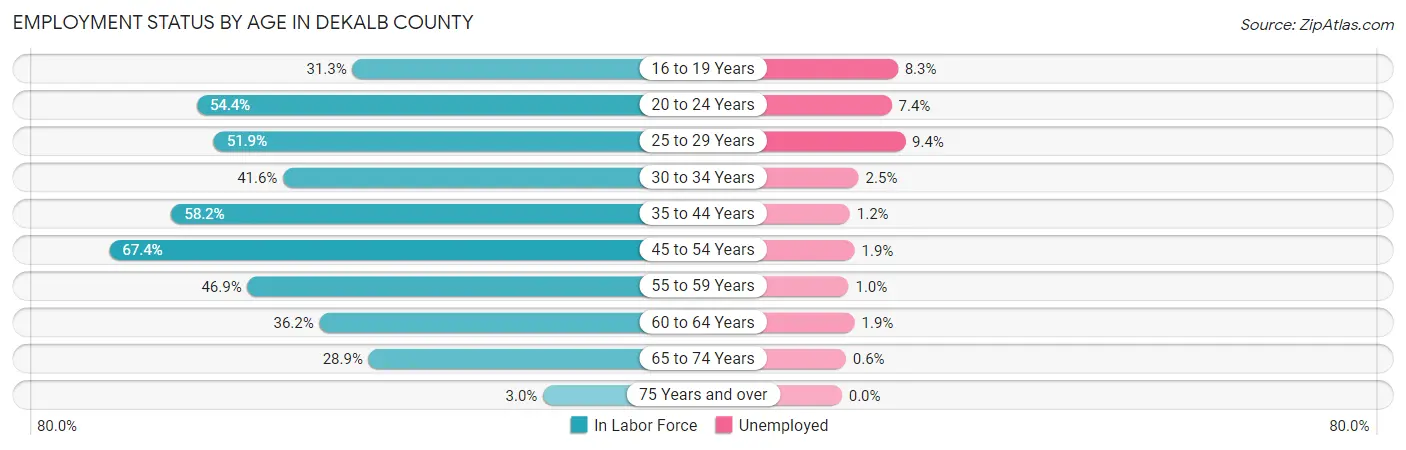
| Age Bracket | In Labor Force | Unemployed |
| 16 to 19 Years | 156 (31.3%) | 13 (8.3%) |
| 20 to 24 Years | 394 (54.4%) | 29 (7.4%) |
| 25 to 29 Years | 447 (51.9%) | 42 (9.4%) |
| 30 to 34 Years | 367 (41.6%) | 9 (2.5%) |
| 35 to 44 Years | 909 (58.2%) | 11 (1.2%) |
| 45 to 54 Years | 1,062 (67.4%) | 20 (1.9%) |
| 55 to 59 Years | 395 (46.9%) | 4 (1.0%) |
| 60 to 64 Years | 310 (36.2%) | 6 (1.9%) |
| 65 to 74 Years | 326 (28.9%) | 2 (0.6%) |
| 75 Years and over | 30 (3.0%) | 0 (0.0%) |
| Total | 4,394 (44.2%) | 136 (3.1%) |
Employment Status by Educational Attainment in DeKalb County
According to labor force statistics for DeKalb County, 53.0% of individuals (3,487) out of the total population between 25 and 64 years of age (6,580) are in the labor force, with 2.6% or 91 of them being unemployed. The group with the highest labor force participation rate are those with the educational attainment of bachelor's degree or higher, with 83.2% or 764 individuals in the labor force. Within the labor force, individuals with college / associate degree education have the highest percentage of unemployment, with 3.6% or 40 of them being unemployed.
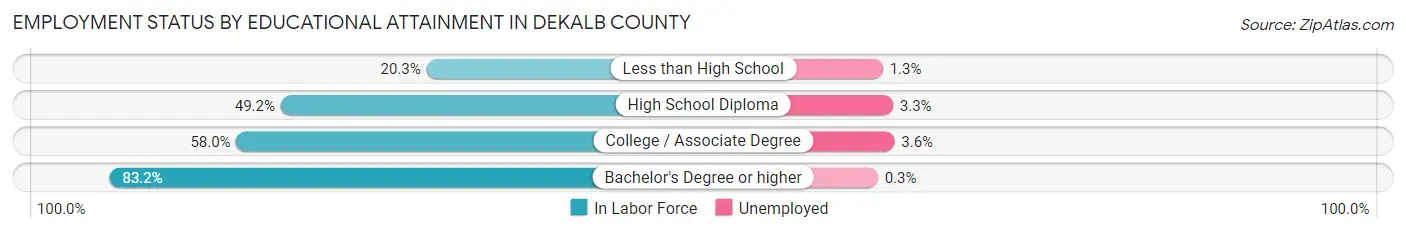
| Educational Attainment | In Labor Force | Unemployed |
| Less than High School | 160 (20.3%) | 10 (1.3%) |
| High School Diploma | 1,454 (49.2%) | 98 (3.3%) |
| College / Associate Degree | 1,112 (58.0%) | 69 (3.6%) |
| Bachelor's Degree or higher | 764 (83.2%) | 3 (0.3%) |
| Total | 3,487 (53.0%) | 171 (2.6%) |
Employment Occupations by Sex in DeKalb County
Management, Business, Science and Arts Occupations
The most common Management, Business, Science and Arts occupations in DeKalb County are Management (697 | 16.4%), Community & Social Service (326 | 7.7%), Health Diagnosing & Treating (230 | 5.4%), Education Instruction & Library (214 | 5.0%), and Business & Financial (154 | 3.6%).
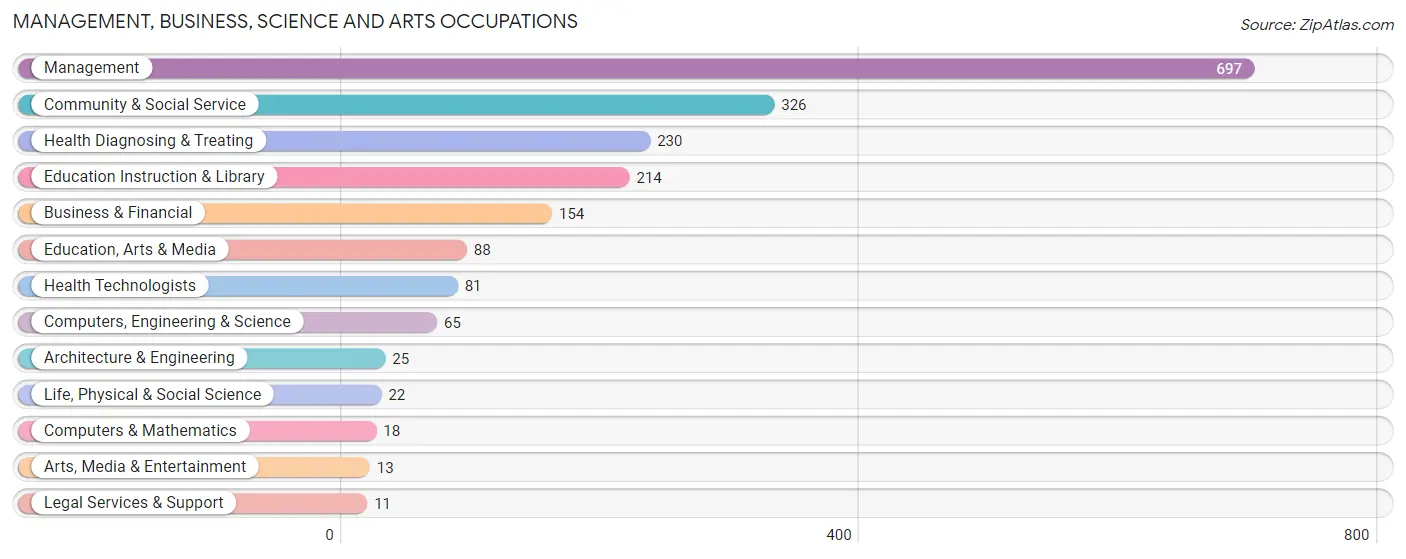
Management, Business, Science and Arts Occupations by Sex
Within the Management, Business, Science and Arts occupations in DeKalb County, the most male-oriented occupations are Management (78.6%), Architecture & Engineering (72.0%), and Computers & Mathematics (44.4%), while the most female-oriented occupations are Health Technologists (93.8%), Life, Physical & Social Science (90.9%), and Health Diagnosing & Treating (87.4%).
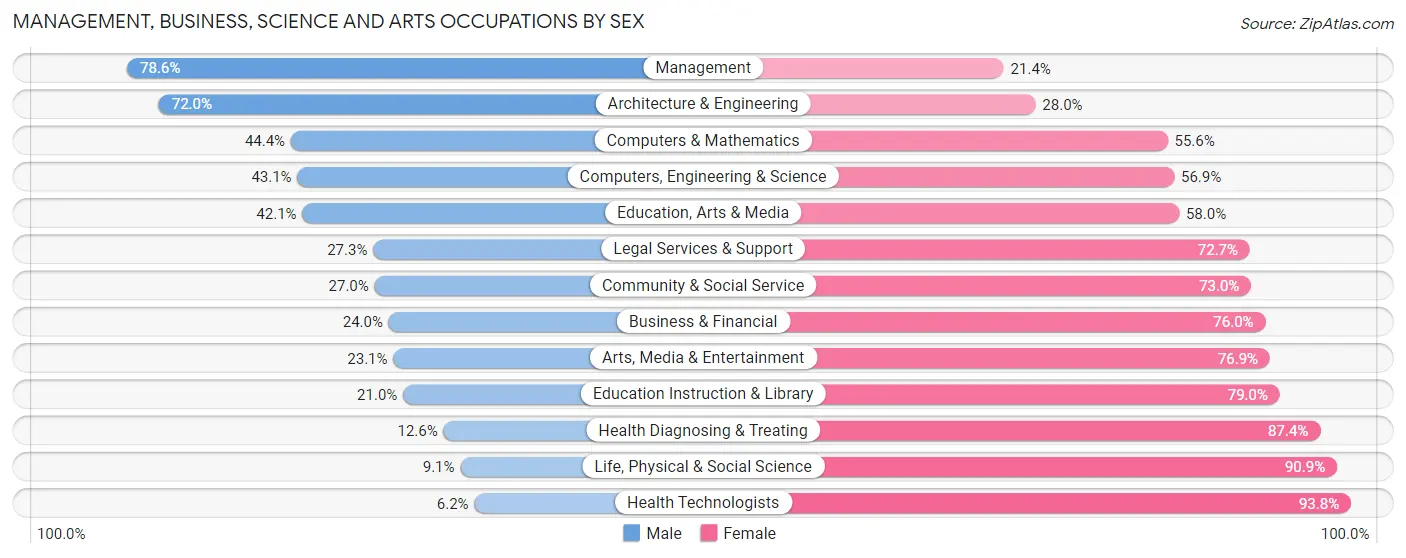
| Occupation | Male | Female |
| Management | 548 (78.6%) | 149 (21.4%) |
| Business & Financial | 37 (24.0%) | 117 (76.0%) |
| Computers, Engineering & Science | 28 (43.1%) | 37 (56.9%) |
| Computers & Mathematics | 8 (44.4%) | 10 (55.6%) |
| Architecture & Engineering | 18 (72.0%) | 7 (28.0%) |
| Life, Physical & Social Science | 2 (9.1%) | 20 (90.9%) |
| Community & Social Service | 88 (27.0%) | 238 (73.0%) |
| Education, Arts & Media | 37 (42.0%) | 51 (58.0%) |
| Legal Services & Support | 3 (27.3%) | 8 (72.7%) |
| Education Instruction & Library | 45 (21.0%) | 169 (79.0%) |
| Arts, Media & Entertainment | 3 (23.1%) | 10 (76.9%) |
| Health Diagnosing & Treating | 29 (12.6%) | 201 (87.4%) |
| Health Technologists | 5 (6.2%) | 76 (93.8%) |
| Total (Category) | 730 (49.6%) | 742 (50.4%) |
| Total (Overall) | 2,415 (56.9%) | 1,830 (43.1%) |
Services Occupations
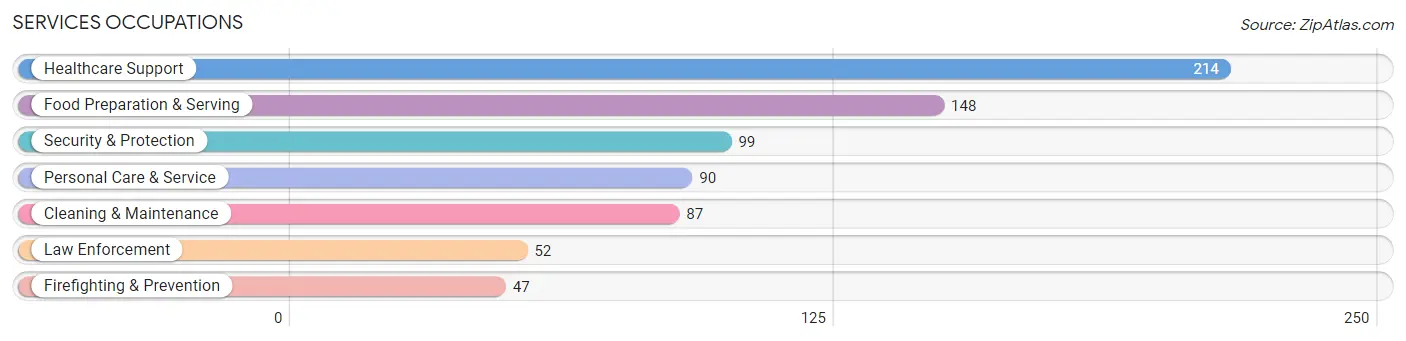
The most common Services occupations in DeKalb County are Healthcare Support (214 | 5.0%), Food Preparation & Serving (148 | 3.5%), Security & Protection (99 | 2.3%), Personal Care & Service (90 | 2.1%), and Cleaning & Maintenance (87 | 2.1%).
Services Occupations by Sex
Within the Services occupations in DeKalb County, the most male-oriented occupations are Law Enforcement (90.4%), Cleaning & Maintenance (88.5%), and Security & Protection (82.8%), while the most female-oriented occupations are Personal Care & Service (95.6%), Healthcare Support (59.4%), and Food Preparation & Serving (49.3%).
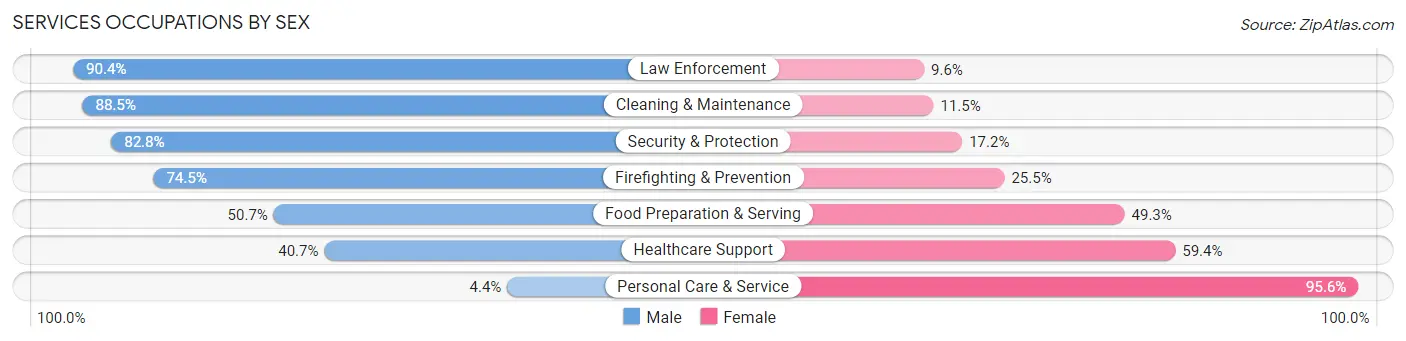
| Occupation | Male | Female |
| Healthcare Support | 87 (40.6%) | 127 (59.4%) |
| Security & Protection | 82 (82.8%) | 17 (17.2%) |
| Firefighting & Prevention | 35 (74.5%) | 12 (25.5%) |
| Law Enforcement | 47 (90.4%) | 5 (9.6%) |
| Food Preparation & Serving | 75 (50.7%) | 73 (49.3%) |
| Cleaning & Maintenance | 77 (88.5%) | 10 (11.5%) |
| Personal Care & Service | 4 (4.4%) | 86 (95.6%) |
| Total (Category) | 325 (50.9%) | 313 (49.1%) |
| Total (Overall) | 2,415 (56.9%) | 1,830 (43.1%) |
Sales and Office Occupations
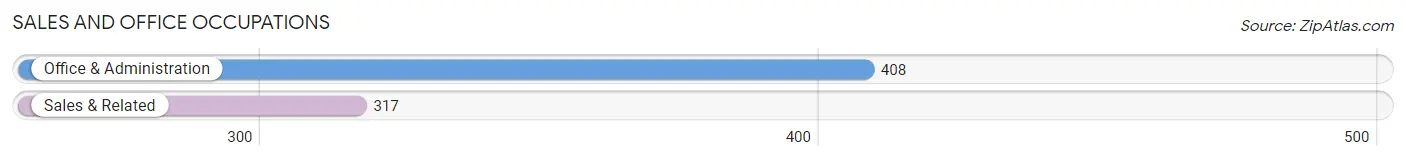
The most common Sales and Office occupations in DeKalb County are Office & Administration (408 | 9.6%), and Sales & Related (317 | 7.5%).
Sales and Office Occupations by Sex
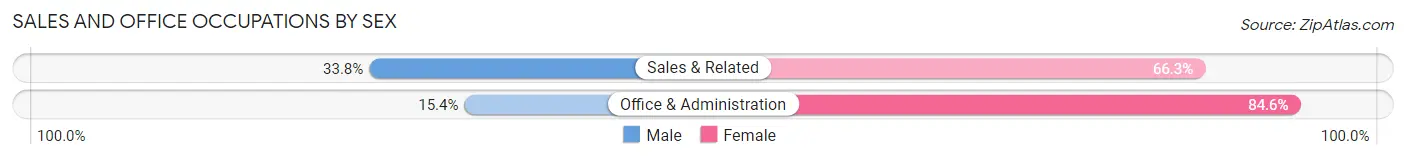
| Occupation | Male | Female |
| Sales & Related | 107 (33.8%) | 210 (66.2%) |
| Office & Administration | 63 (15.4%) | 345 (84.6%) |
| Total (Category) | 170 (23.4%) | 555 (76.5%) |
| Total (Overall) | 2,415 (56.9%) | 1,830 (43.1%) |
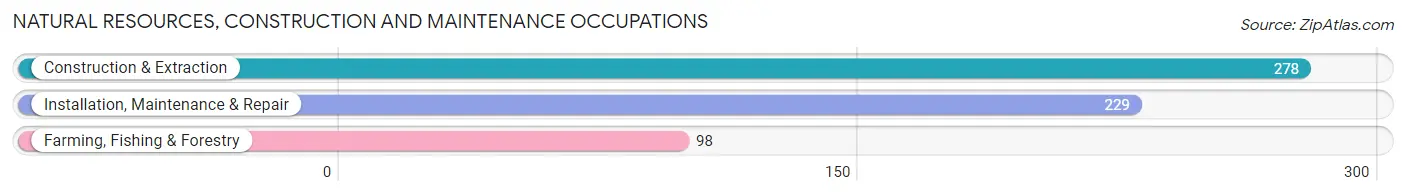
Natural Resources, Construction and Maintenance Occupations
The most common Natural Resources, Construction and Maintenance occupations in DeKalb County are Construction & Extraction (278 | 6.6%), Installation, Maintenance & Repair (229 | 5.4%), and Farming, Fishing & Forestry (98 | 2.3%).
Natural Resources, Construction and Maintenance Occupations by Sex
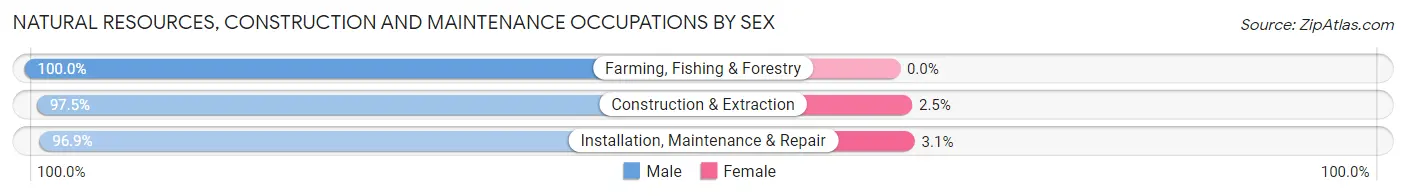
| Occupation | Male | Female |
| Farming, Fishing & Forestry | 98 (100.0%) | 0 (0.0%) |
| Construction & Extraction | 271 (97.5%) | 7 (2.5%) |
| Installation, Maintenance & Repair | 222 (96.9%) | 7 (3.1%) |
| Total (Category) | 591 (97.7%) | 14 (2.3%) |
| Total (Overall) | 2,415 (56.9%) | 1,830 (43.1%) |
Production, Transportation and Moving Occupations
The most common Production, Transportation and Moving occupations in DeKalb County are Production (476 | 11.2%), Material Moving (176 | 4.2%), and Transportation (153 | 3.6%).
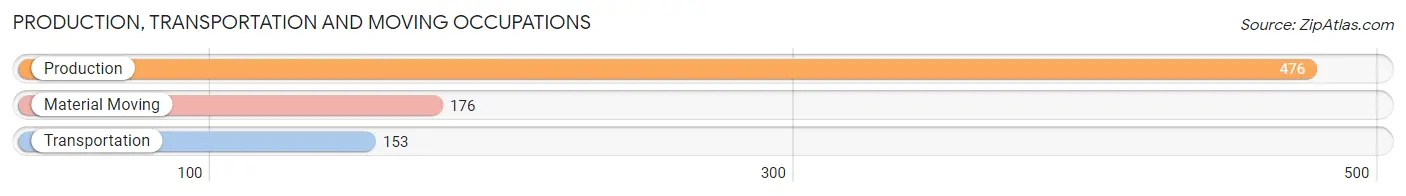
Production, Transportation and Moving Occupations by Sex
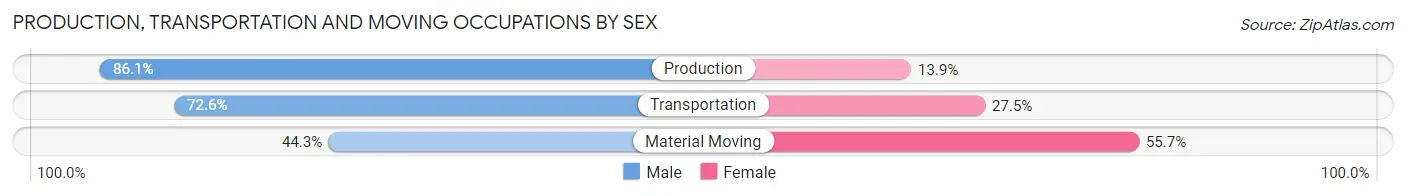
| Occupation | Male | Female |
| Production | 410 (86.1%) | 66 (13.9%) |
| Transportation | 111 (72.6%) | 42 (27.5%) |
| Material Moving | 78 (44.3%) | 98 (55.7%) |
| Total (Category) | 599 (74.4%) | 206 (25.6%) |
| Total (Overall) | 2,415 (56.9%) | 1,830 (43.1%) |
Employment Industries by Sex in DeKalb County
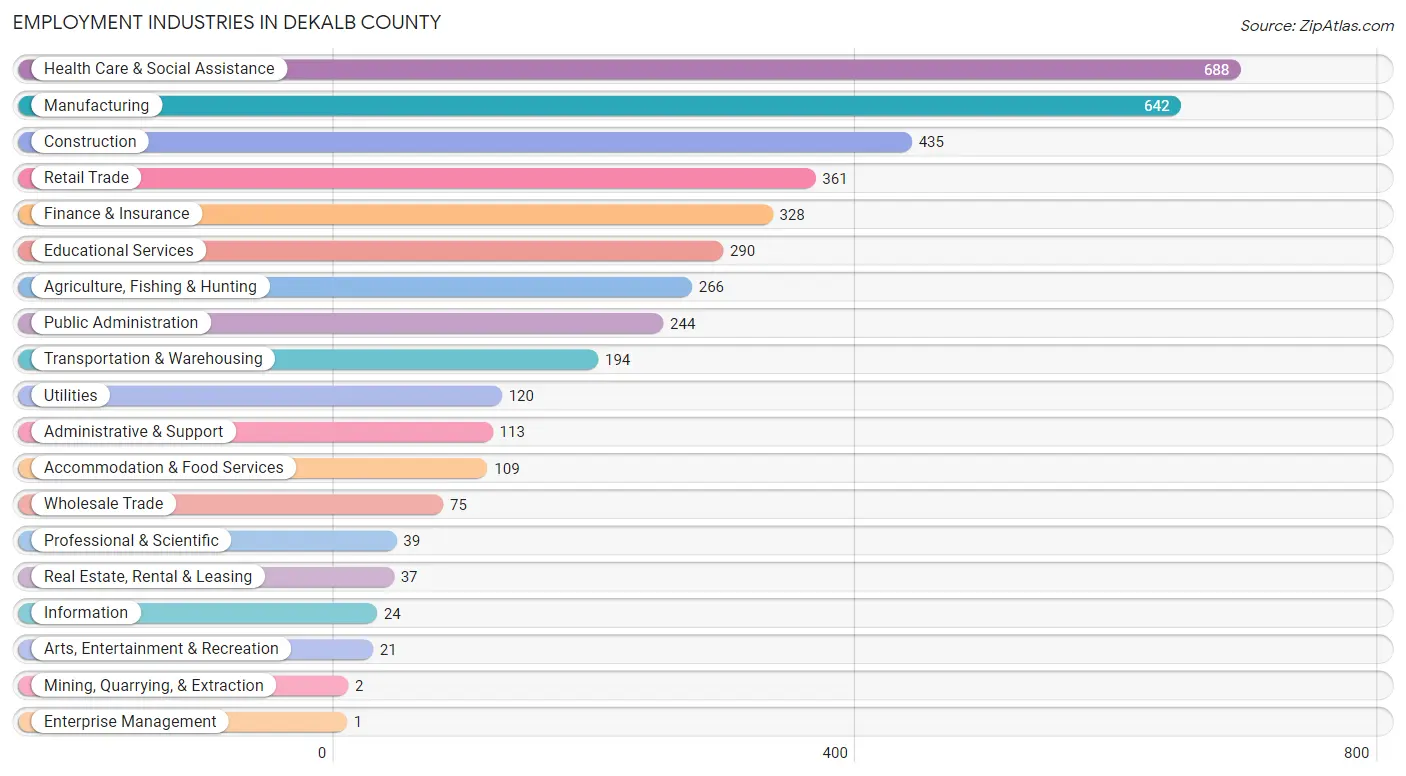
Employment Industries in DeKalb County
The major employment industries in DeKalb County include Health Care & Social Assistance (688 | 16.2%), Manufacturing (642 | 15.1%), Construction (435 | 10.2%), Retail Trade (361 | 8.5%), and Finance & Insurance (328 | 7.7%).
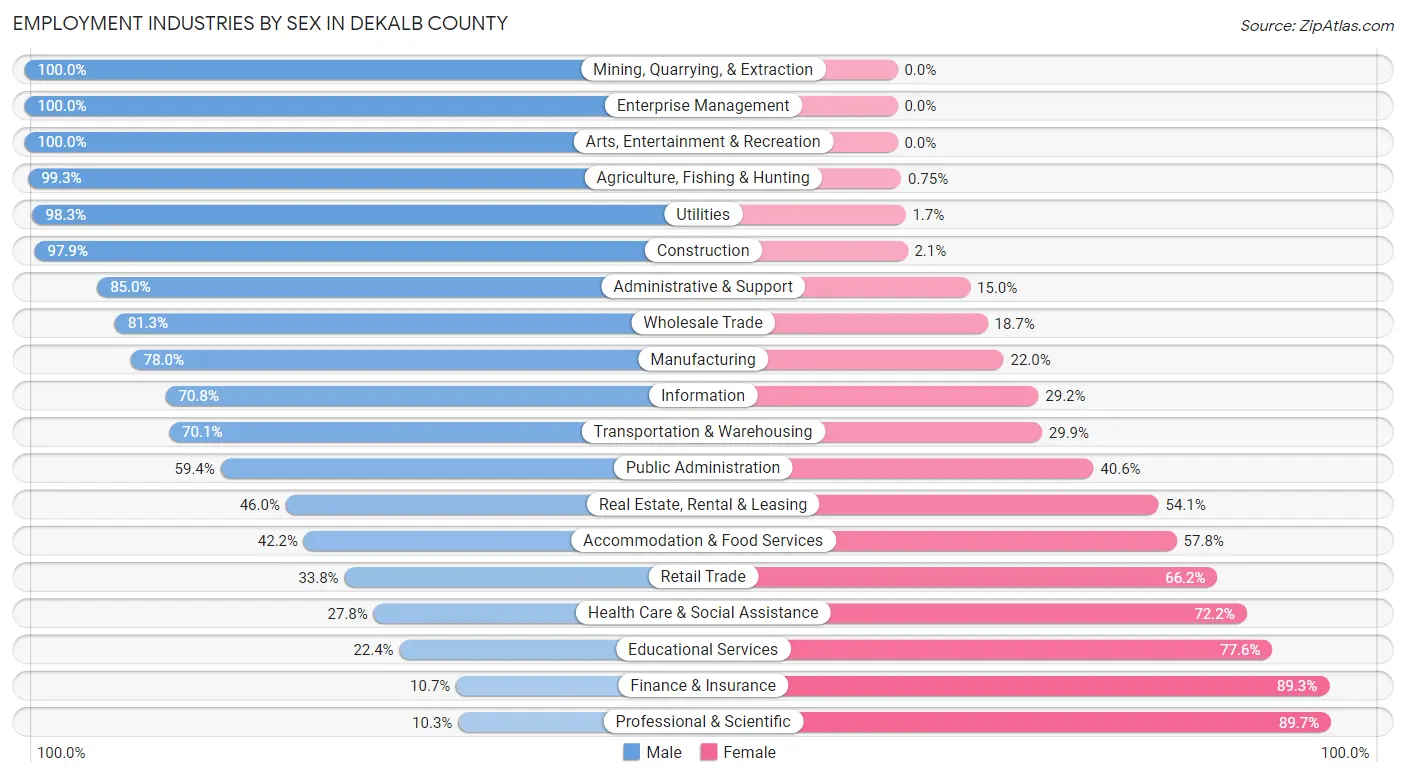
Employment Industries by Sex in DeKalb County
The DeKalb County industries that see more men than women are Mining, Quarrying, & Extraction (100.0%), Enterprise Management (100.0%), and Arts, Entertainment & Recreation (100.0%), whereas the industries that tend to have a higher number of women are Professional & Scientific (89.7%), Finance & Insurance (89.3%), and Educational Services (77.6%).
| Industry | Male | Female |
| Agriculture, Fishing & Hunting | 264 (99.3%) | 2 (0.7%) |
| Mining, Quarrying, & Extraction | 2 (100.0%) | 0 (0.0%) |
| Construction | 426 (97.9%) | 9 (2.1%) |
| Manufacturing | 501 (78.0%) | 141 (22.0%) |
| Wholesale Trade | 61 (81.3%) | 14 (18.7%) |
| Retail Trade | 122 (33.8%) | 239 (66.2%) |
| Transportation & Warehousing | 136 (70.1%) | 58 (29.9%) |
| Utilities | 118 (98.3%) | 2 (1.7%) |
| Information | 17 (70.8%) | 7 (29.2%) |
| Finance & Insurance | 35 (10.7%) | 293 (89.3%) |
| Real Estate, Rental & Leasing | 17 (46.0%) | 20 (54.0%) |
| Professional & Scientific | 4 (10.3%) | 35 (89.7%) |
| Enterprise Management | 1 (100.0%) | 0 (0.0%) |
| Administrative & Support | 96 (85.0%) | 17 (15.0%) |
| Educational Services | 65 (22.4%) | 225 (77.6%) |
| Health Care & Social Assistance | 191 (27.8%) | 497 (72.2%) |
| Arts, Entertainment & Recreation | 21 (100.0%) | 0 (0.0%) |
| Accommodation & Food Services | 46 (42.2%) | 63 (57.8%) |
| Public Administration | 145 (59.4%) | 99 (40.6%) |
| Total | 2,415 (56.9%) | 1,830 (43.1%) |
Education in DeKalb County
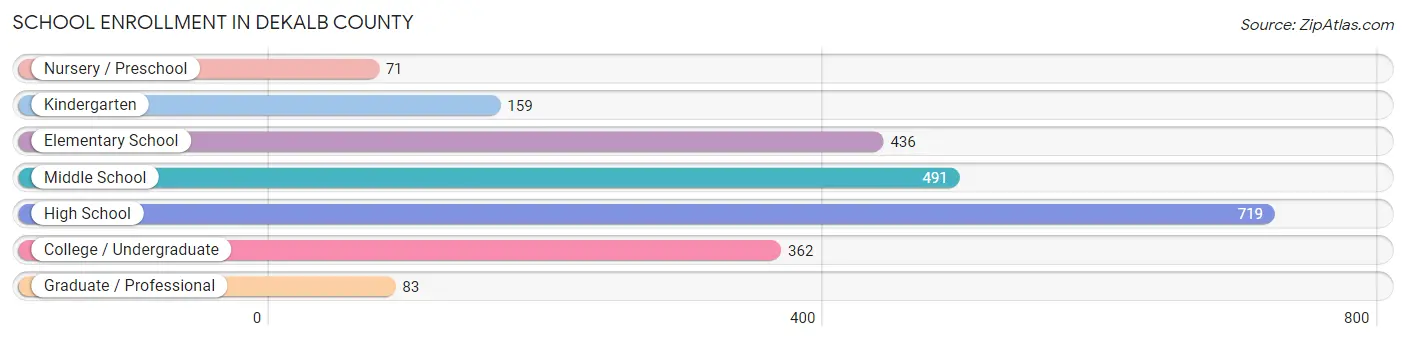
School Enrollment in DeKalb County
The most common levels of schooling among the 2,321 students in DeKalb County are high school (719 | 31.0%), middle school (491 | 21.1%), and elementary school (436 | 18.8%).
| School Level | # Students | % Students |
| Nursery / Preschool | 71 | 3.1% |
| Kindergarten | 159 | 6.9% |
| Elementary School | 436 | 18.8% |
| Middle School | 491 | 21.1% |
| High School | 719 | 31.0% |
| College / Undergraduate | 362 | 15.6% |
| Graduate / Professional | 83 | 3.6% |
| Total | 2,321 | 100.0% |
School Enrollment by Age by Funding Source in DeKalb County
Out of a total of 2,321 students who are enrolled in schools in DeKalb County, 353 (15.2%) attend a private institution, while the remaining 1,968 (84.8%) are enrolled in public schools. The age group of 35 years and over has the highest likelihood of being enrolled in private schools, with 73 (35.6% in the age bracket) enrolled. Conversely, the age group of 18 to 19 year olds has the lowest likelihood of being enrolled in a private school, with 151 (100.0% in the age bracket) attending a public institution.
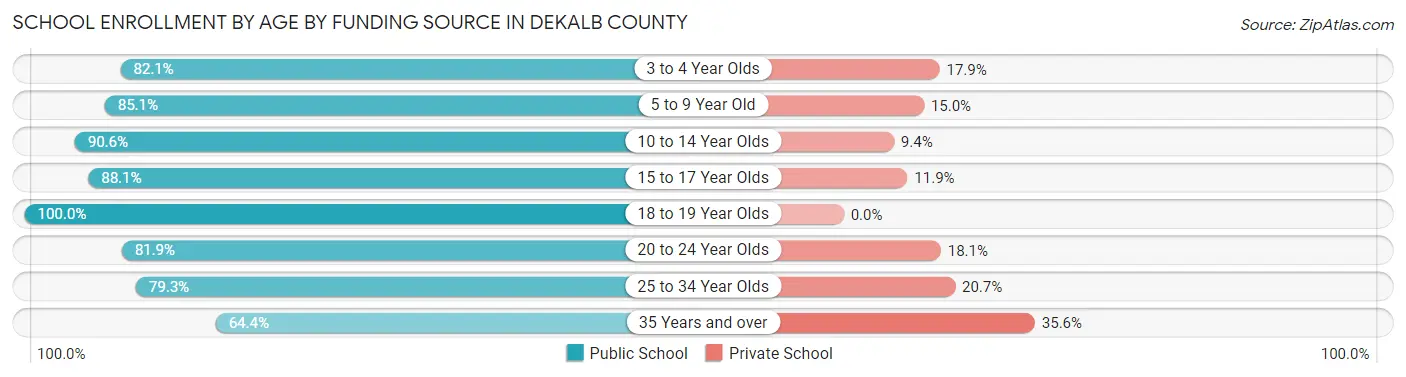
| Age Bracket | Public School | Private School |
| 3 to 4 Year Olds | 46 (82.1%) | 10 (17.9%) |
| 5 to 9 Year Old | 512 (85.1%) | 90 (14.9%) |
| 10 to 14 Year Olds | 426 (90.6%) | 44 (9.4%) |
| 15 to 17 Year Olds | 334 (88.1%) | 45 (11.9%) |
| 18 to 19 Year Olds | 151 (100.0%) | 0 (0.0%) |
| 20 to 24 Year Olds | 154 (81.9%) | 34 (18.1%) |
| 25 to 34 Year Olds | 214 (79.3%) | 56 (20.7%) |
| 35 Years and over | 132 (64.4%) | 73 (35.6%) |
| Total | 1,968 (84.8%) | 353 (15.2%) |
Educational Attainment by Field of Study in DeKalb County
Education (275 | 20.6%), business (259 | 19.4%), science & technology (211 | 15.8%), bio, nature & agricultural (166 | 12.4%), and psychology (88 | 6.6%) are the most common fields of study among 1,336 individuals in DeKalb County who have obtained a bachelor's degree or higher.
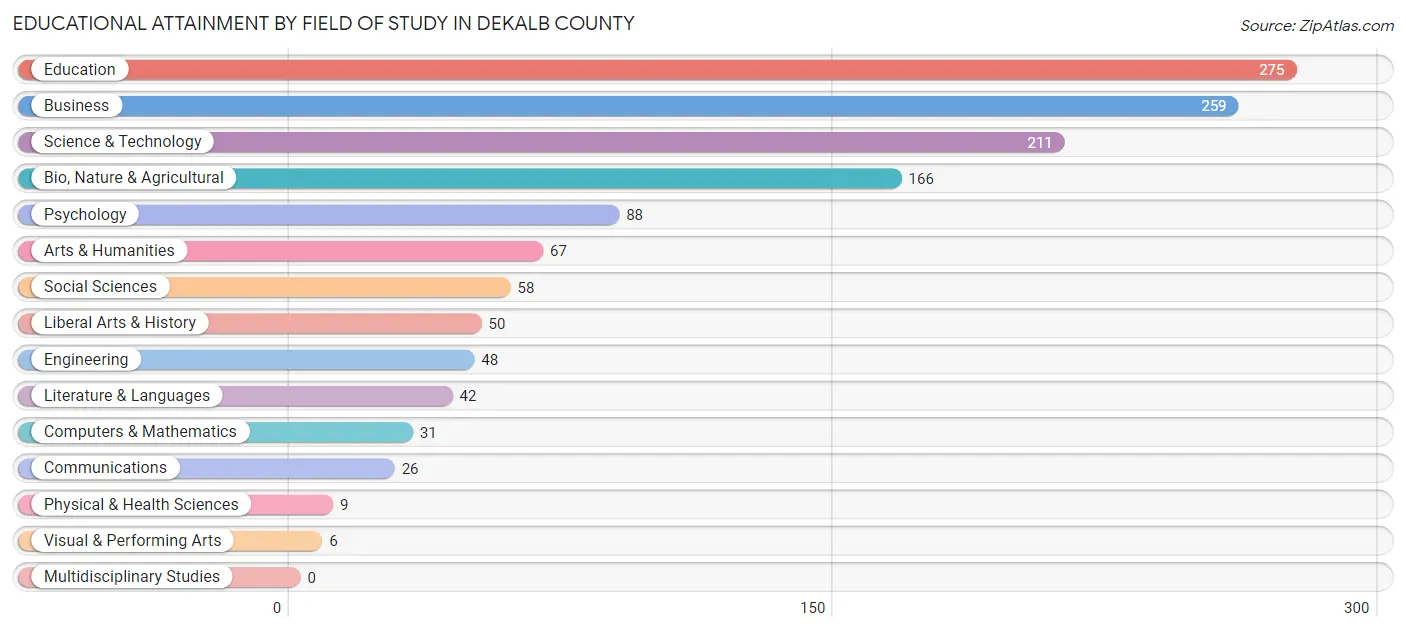
| Field of Study | # Graduates | % Graduates |
| Computers & Mathematics | 31 | 2.3% |
| Bio, Nature & Agricultural | 166 | 12.4% |
| Physical & Health Sciences | 9 | 0.7% |
| Psychology | 88 | 6.6% |
| Social Sciences | 58 | 4.3% |
| Engineering | 48 | 3.6% |
| Multidisciplinary Studies | 0 | 0.0% |
| Science & Technology | 211 | 15.8% |
| Business | 259 | 19.4% |
| Education | 275 | 20.6% |
| Literature & Languages | 42 | 3.1% |
| Liberal Arts & History | 50 | 3.7% |
| Visual & Performing Arts | 6 | 0.4% |
| Communications | 26 | 1.9% |
| Arts & Humanities | 67 | 5.0% |
| Total | 1,336 | 100.0% |
Transportation & Commute in DeKalb County
Vehicle Availability by Sex in DeKalb County
The most prevalent vehicle ownership categories in DeKalb County are males with 2 vehicles (806, accounting for 34.1%) and females with 2 vehicles (623, making up 44.1%).
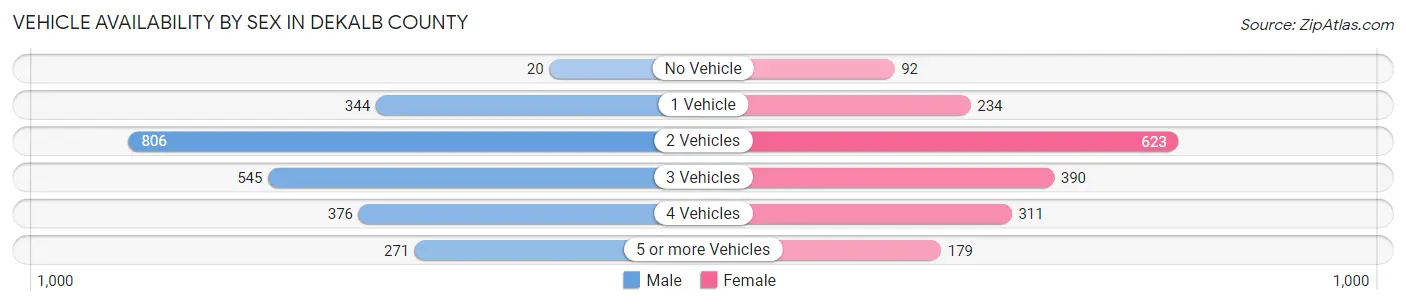
| Vehicles Available | Male | Female |
| No Vehicle | 20 (0.9%) | 92 (5.0%) |
| 1 Vehicle | 344 (14.6%) | 234 (12.8%) |
| 2 Vehicles | 806 (34.1%) | 623 (34.1%) |
| 3 Vehicles | 545 (23.1%) | 390 (21.3%) |
| 4 Vehicles | 376 (15.9%) | 311 (17.0%) |
| 5 or more Vehicles | 271 (11.5%) | 179 (9.8%) |
| Total | 2,362 (100.0%) | 1,829 (100.0%) |
Commute Time in DeKalb County
The most frequently occuring commute durations in DeKalb County are 20 to 24 minutes (565 commuters, 14.8%), 30 to 34 minutes (477 commuters, 12.5%), and 5 to 9 minutes (428 commuters, 11.2%).
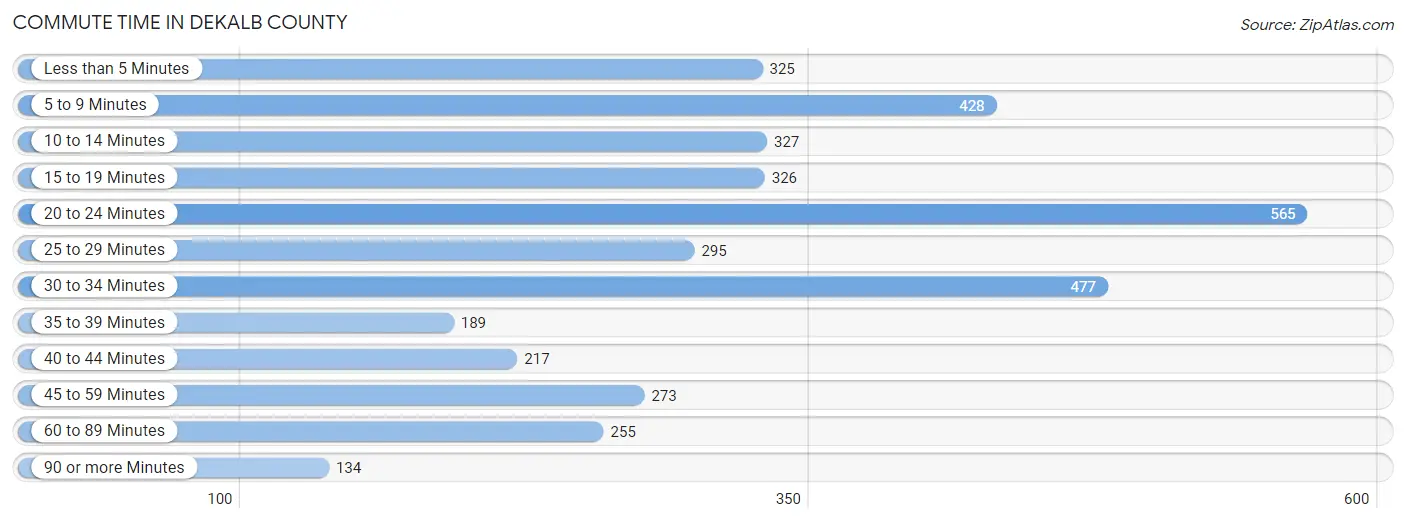
| Commute Time | # Commuters | % Commuters |
| Less than 5 Minutes | 325 | 8.5% |
| 5 to 9 Minutes | 428 | 11.2% |
| 10 to 14 Minutes | 327 | 8.6% |
| 15 to 19 Minutes | 326 | 8.6% |
| 20 to 24 Minutes | 565 | 14.8% |
| 25 to 29 Minutes | 295 | 7.7% |
| 30 to 34 Minutes | 477 | 12.5% |
| 35 to 39 Minutes | 189 | 5.0% |
| 40 to 44 Minutes | 217 | 5.7% |
| 45 to 59 Minutes | 273 | 7.2% |
| 60 to 89 Minutes | 255 | 6.7% |
| 90 or more Minutes | 134 | 3.5% |
Commute Time by Sex in DeKalb County
The most common commute times in DeKalb County are 30 to 34 minutes (321 commuters, 14.8%) for males and 20 to 24 minutes (253 commuters, 15.5%) for females.
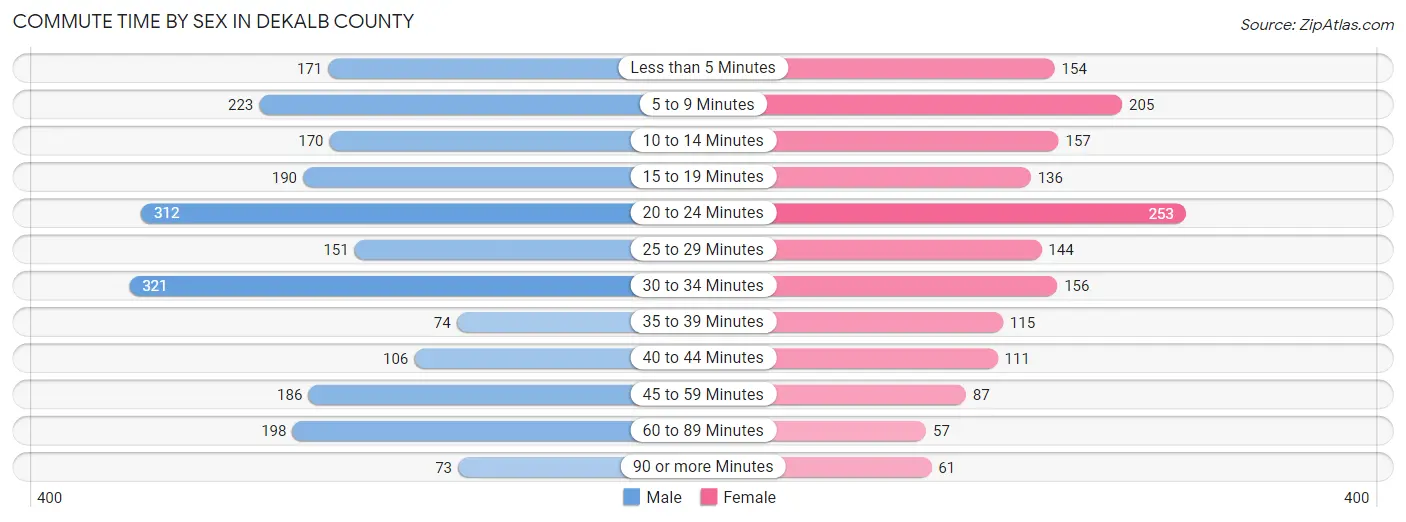
| Commute Time | Male | Female |
| Less than 5 Minutes | 171 (7.9%) | 154 (9.4%) |
| 5 to 9 Minutes | 223 (10.2%) | 205 (12.5%) |
| 10 to 14 Minutes | 170 (7.8%) | 157 (9.6%) |
| 15 to 19 Minutes | 190 (8.7%) | 136 (8.3%) |
| 20 to 24 Minutes | 312 (14.3%) | 253 (15.5%) |
| 25 to 29 Minutes | 151 (6.9%) | 144 (8.8%) |
| 30 to 34 Minutes | 321 (14.8%) | 156 (9.5%) |
| 35 to 39 Minutes | 74 (3.4%) | 115 (7.0%) |
| 40 to 44 Minutes | 106 (4.9%) | 111 (6.8%) |
| 45 to 59 Minutes | 186 (8.6%) | 87 (5.3%) |
| 60 to 89 Minutes | 198 (9.1%) | 57 (3.5%) |
| 90 or more Minutes | 73 (3.4%) | 61 (3.7%) |
Time of Departure to Work by Sex in DeKalb County
The most frequent times of departure to work in DeKalb County are 7:00 AM to 7:29 AM (342, 15.7%) for males and 7:00 AM to 7:29 AM (316, 19.3%) for females.
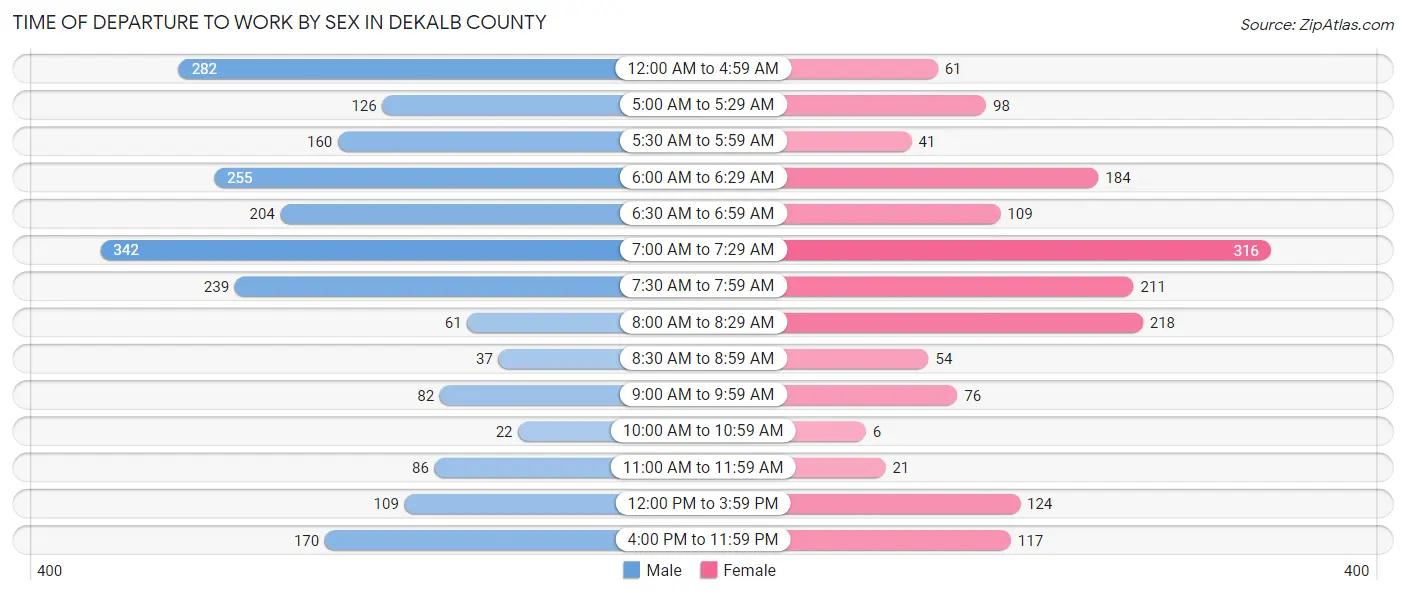
| Time of Departure | Male | Female |
| 12:00 AM to 4:59 AM | 282 (13.0%) | 61 (3.7%) |
| 5:00 AM to 5:29 AM | 126 (5.8%) | 98 (6.0%) |
| 5:30 AM to 5:59 AM | 160 (7.4%) | 41 (2.5%) |
| 6:00 AM to 6:29 AM | 255 (11.7%) | 184 (11.3%) |
| 6:30 AM to 6:59 AM | 204 (9.4%) | 109 (6.7%) |
| 7:00 AM to 7:29 AM | 342 (15.7%) | 316 (19.3%) |
| 7:30 AM to 7:59 AM | 239 (11.0%) | 211 (12.9%) |
| 8:00 AM to 8:29 AM | 61 (2.8%) | 218 (13.3%) |
| 8:30 AM to 8:59 AM | 37 (1.7%) | 54 (3.3%) |
| 9:00 AM to 9:59 AM | 82 (3.8%) | 76 (4.6%) |
| 10:00 AM to 10:59 AM | 22 (1.0%) | 6 (0.4%) |
| 11:00 AM to 11:59 AM | 86 (4.0%) | 21 (1.3%) |
| 12:00 PM to 3:59 PM | 109 (5.0%) | 124 (7.6%) |
| 4:00 PM to 11:59 PM | 170 (7.8%) | 117 (7.1%) |
| Total | 2,175 (100.0%) | 1,636 (100.0%) |
Housing Occupancy in DeKalb County
Occupancy by Ownership in DeKalb County
Of the total 3,715 dwellings in DeKalb County, owner-occupied units account for 2,595 (69.9%), while renter-occupied units make up 1,120 (30.1%).
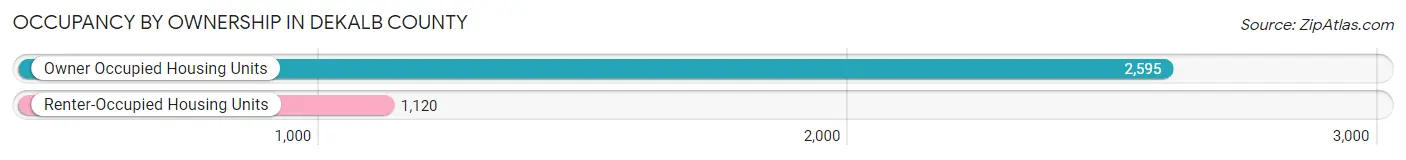
| Occupancy | # Housing Units | % Housing Units |
| Owner Occupied Housing Units | 2,595 | 69.9% |
| Renter-Occupied Housing Units | 1,120 | 30.1% |
| Total Occupied Housing Units | 3,715 | 100.0% |
Occupancy by Household Size in DeKalb County
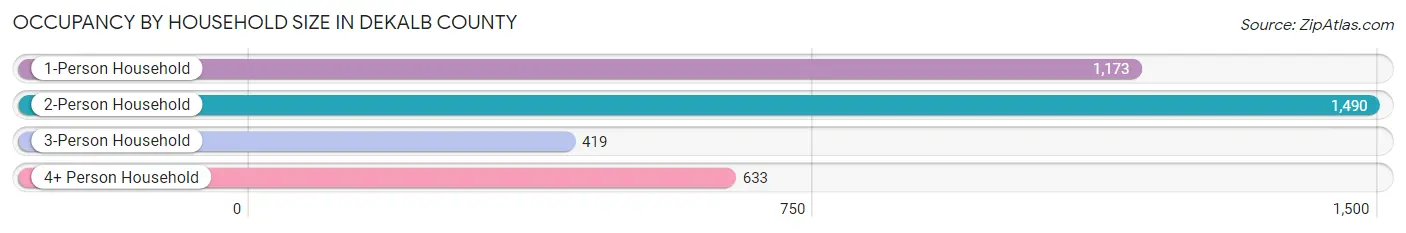
| Household Size | # Housing Units | % Housing Units |
| 1-Person Household | 1,173 | 31.6% |
| 2-Person Household | 1,490 | 40.1% |
| 3-Person Household | 419 | 11.3% |
| 4+ Person Household | 633 | 17.0% |
| Total Housing Units | 3,715 | 100.0% |
Occupancy by Ownership by Household Size in DeKalb County
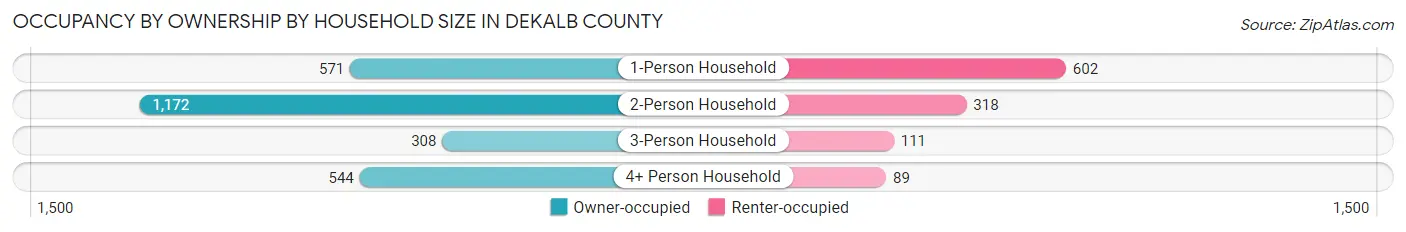
| Household Size | Owner-occupied | Renter-occupied |
| 1-Person Household | 571 (48.7%) | 602 (51.3%) |
| 2-Person Household | 1,172 (78.7%) | 318 (21.3%) |
| 3-Person Household | 308 (73.5%) | 111 (26.5%) |
| 4+ Person Household | 544 (85.9%) | 89 (14.1%) |
| Total Housing Units | 2,595 (69.9%) | 1,120 (30.1%) |
Occupancy by Educational Attainment in DeKalb County
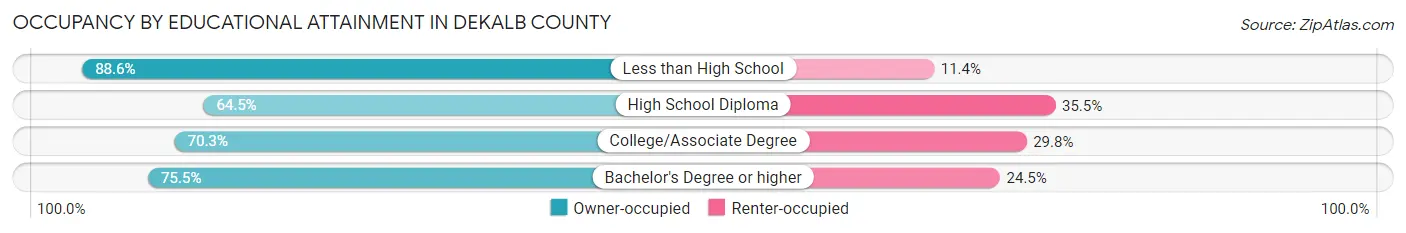
| Household Size | Owner-occupied | Renter-occupied |
| Less than High School | 155 (88.6%) | 20 (11.4%) |
| High School Diploma | 948 (64.5%) | 521 (35.5%) |
| College/Associate Degree | 961 (70.3%) | 407 (29.7%) |
| Bachelor's Degree or higher | 531 (75.5%) | 172 (24.5%) |
Occupancy by Age of Householder in DeKalb County
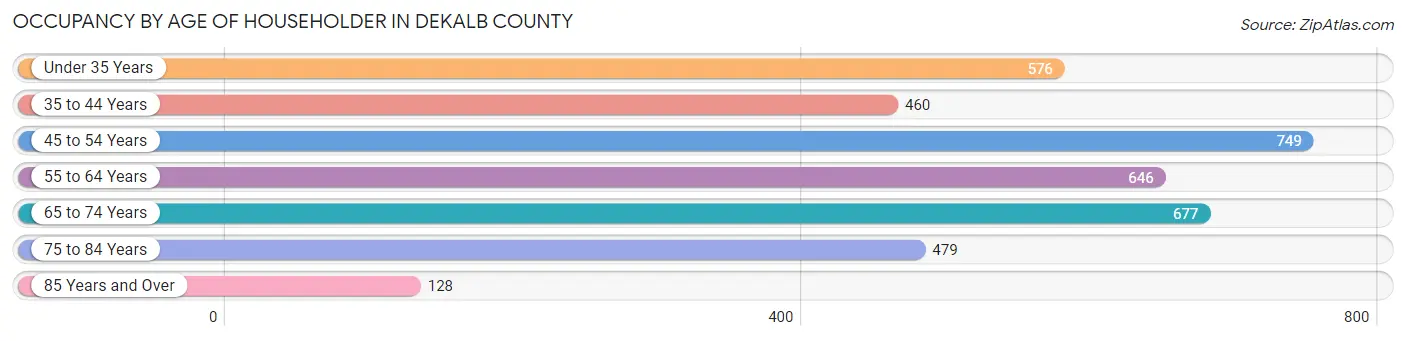
| Age Bracket | # Households | % Households |
| Under 35 Years | 576 | 15.5% |
| 35 to 44 Years | 460 | 12.4% |
| 45 to 54 Years | 749 | 20.2% |
| 55 to 64 Years | 646 | 17.4% |
| 65 to 74 Years | 677 | 18.2% |
| 75 to 84 Years | 479 | 12.9% |
| 85 Years and Over | 128 | 3.5% |
| Total | 3,715 | 100.0% |
Housing Finances in DeKalb County
Median Income by Occupancy in DeKalb County
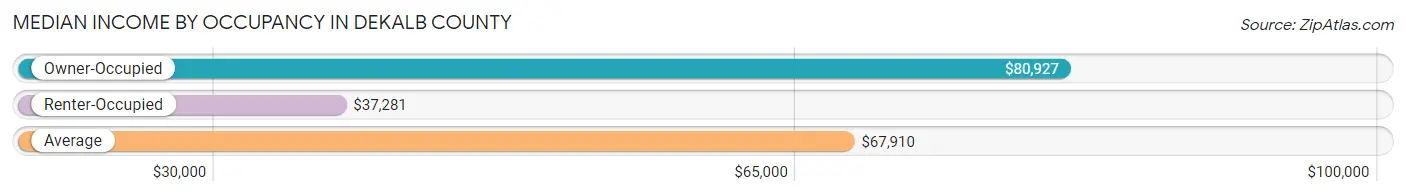
| Occupancy Type | # Households | Median Income |
| Owner-Occupied | 2,595 (69.9%) | $80,927 |
| Renter-Occupied | 1,120 (30.1%) | $37,281 |
| Average | 3,715 (100.0%) | $67,910 |
Occupancy by Householder Income Bracket in DeKalb County
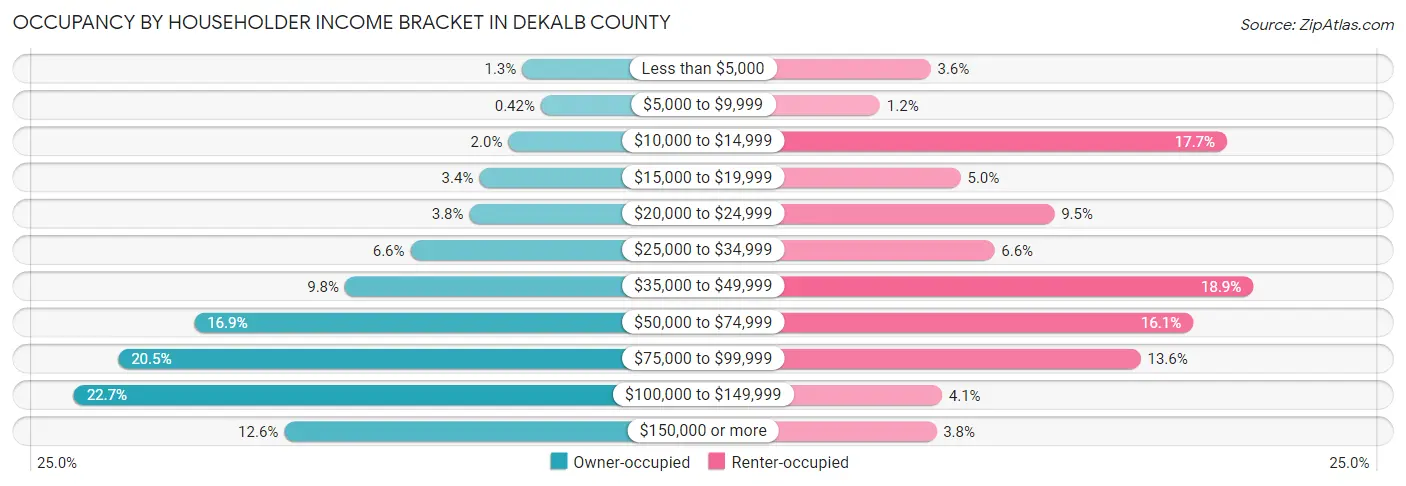
| Income Bracket | Owner-occupied | Renter-occupied |
| Less than $5,000 | 34 (1.3%) | 40 (3.6%) |
| $5,000 to $9,999 | 11 (0.4%) | 13 (1.2%) |
| $10,000 to $14,999 | 51 (2.0%) | 198 (17.7%) |
| $15,000 to $19,999 | 87 (3.4%) | 56 (5.0%) |
| $20,000 to $24,999 | 99 (3.8%) | 106 (9.5%) |
| $25,000 to $34,999 | 172 (6.6%) | 74 (6.6%) |
| $35,000 to $49,999 | 253 (9.8%) | 212 (18.9%) |
| $50,000 to $74,999 | 439 (16.9%) | 180 (16.1%) |
| $75,000 to $99,999 | 533 (20.5%) | 152 (13.6%) |
| $100,000 to $149,999 | 588 (22.7%) | 46 (4.1%) |
| $150,000 or more | 328 (12.6%) | 43 (3.8%) |
| Total | 2,595 (100.0%) | 1,120 (100.0%) |
Monthly Housing Cost Tiers in DeKalb County
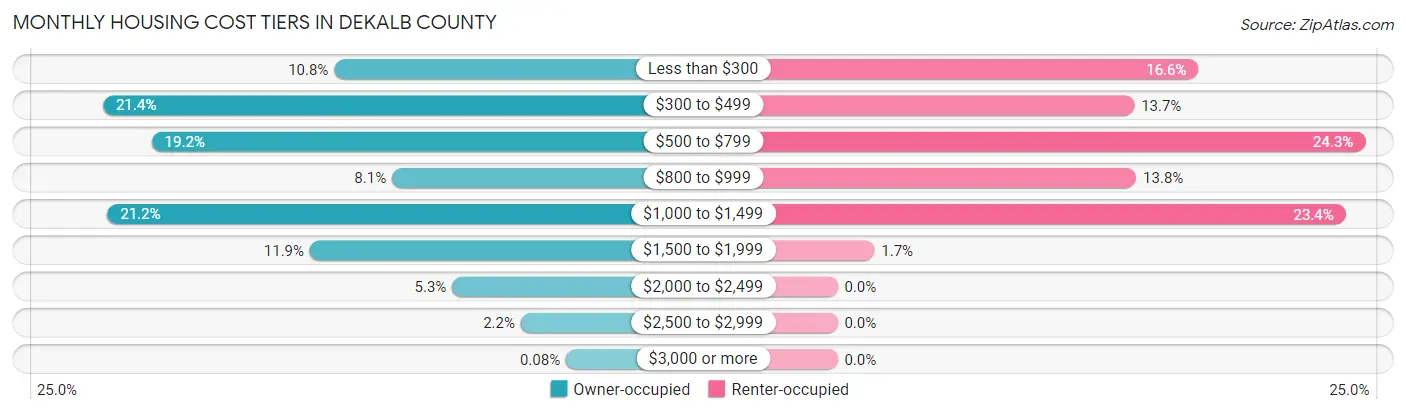
| Monthly Cost | Owner-occupied | Renter-occupied |
| Less than $300 | 279 (10.7%) | 186 (16.6%) |
| $300 to $499 | 555 (21.4%) | 153 (13.7%) |
| $500 to $799 | 497 (19.2%) | 272 (24.3%) |
| $800 to $999 | 210 (8.1%) | 154 (13.8%) |
| $1,000 to $1,499 | 550 (21.2%) | 262 (23.4%) |
| $1,500 to $1,999 | 308 (11.9%) | 19 (1.7%) |
| $2,000 to $2,499 | 138 (5.3%) | 0 (0.0%) |
| $2,500 to $2,999 | 56 (2.2%) | 0 (0.0%) |
| $3,000 or more | 2 (0.1%) | 0 (0.0%) |
| Total | 2,595 (100.0%) | 1,120 (100.0%) |
Physical Housing Characteristics in DeKalb County
Housing Structures in DeKalb County
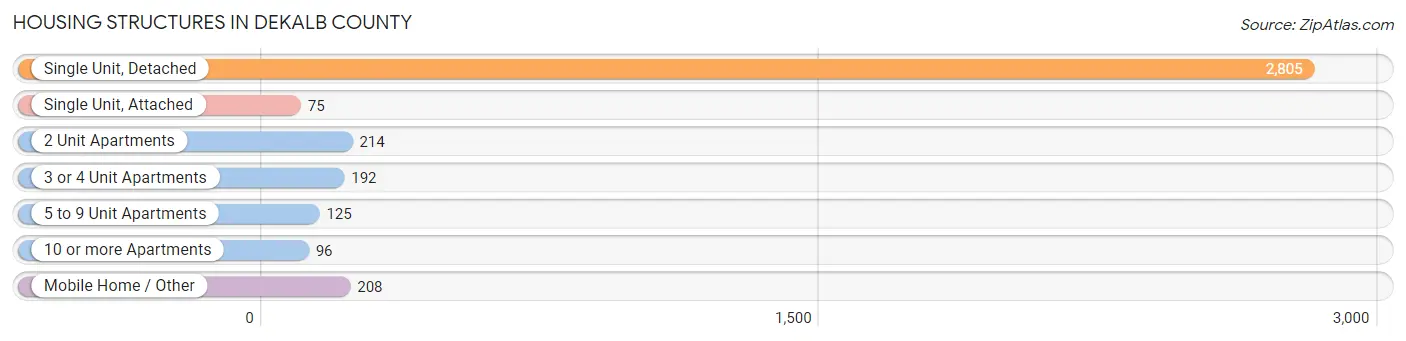
| Structure Type | # Housing Units | % Housing Units |
| Single Unit, Detached | 2,805 | 75.5% |
| Single Unit, Attached | 75 | 2.0% |
| 2 Unit Apartments | 214 | 5.8% |
| 3 or 4 Unit Apartments | 192 | 5.2% |
| 5 to 9 Unit Apartments | 125 | 3.4% |
| 10 or more Apartments | 96 | 2.6% |
| Mobile Home / Other | 208 | 5.6% |
| Total | 3,715 | 100.0% |
Housing Structures by Occupancy in DeKalb County
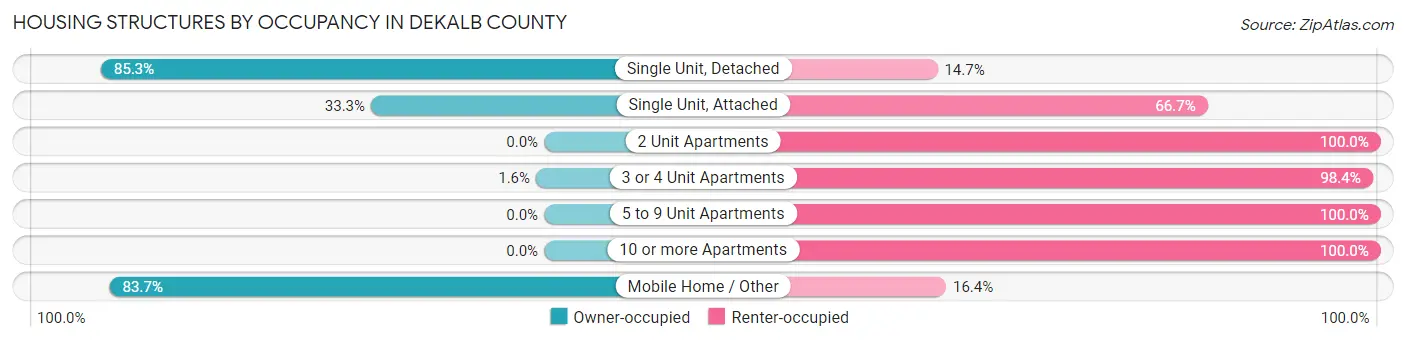
| Structure Type | Owner-occupied | Renter-occupied |
| Single Unit, Detached | 2,393 (85.3%) | 412 (14.7%) |
| Single Unit, Attached | 25 (33.3%) | 50 (66.7%) |
| 2 Unit Apartments | 0 (0.0%) | 214 (100.0%) |
| 3 or 4 Unit Apartments | 3 (1.6%) | 189 (98.4%) |
| 5 to 9 Unit Apartments | 0 (0.0%) | 125 (100.0%) |
| 10 or more Apartments | 0 (0.0%) | 96 (100.0%) |
| Mobile Home / Other | 174 (83.7%) | 34 (16.4%) |
| Total | 2,595 (69.9%) | 1,120 (30.1%) |
Housing Structures by Number of Rooms in DeKalb County
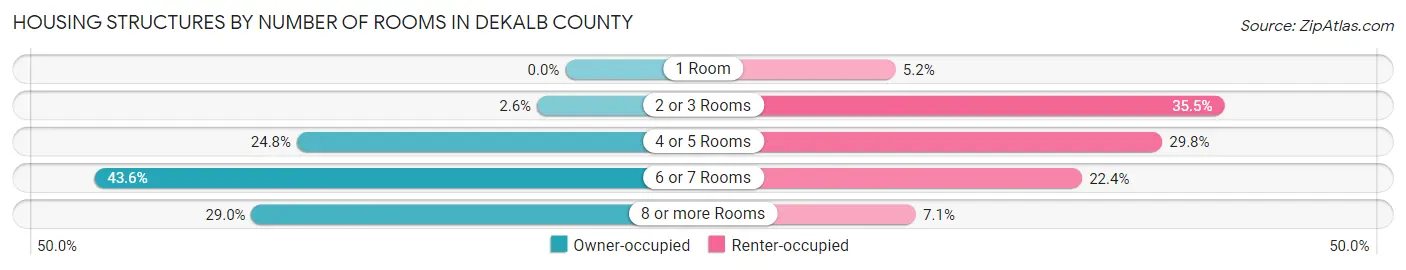
| Number of Rooms | Owner-occupied | Renter-occupied |
| 1 Room | 0 (0.0%) | 58 (5.2%) |
| 2 or 3 Rooms | 68 (2.6%) | 398 (35.5%) |
| 4 or 5 Rooms | 644 (24.8%) | 334 (29.8%) |
| 6 or 7 Rooms | 1,130 (43.5%) | 251 (22.4%) |
| 8 or more Rooms | 753 (29.0%) | 79 (7.0%) |
| Total | 2,595 (100.0%) | 1,120 (100.0%) |
Housing Structure by Heating Type in DeKalb County
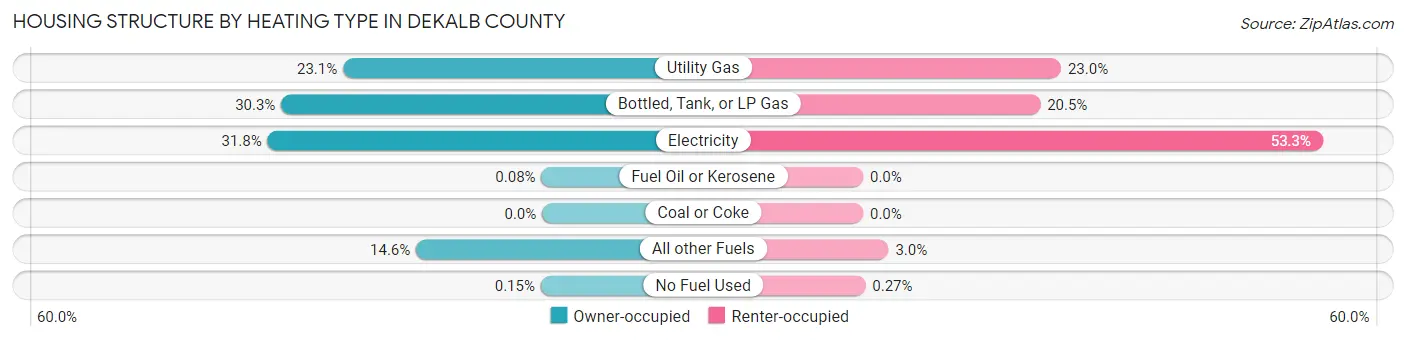
| Heating Type | Owner-occupied | Renter-occupied |
| Utility Gas | 599 (23.1%) | 257 (23.0%) |
| Bottled, Tank, or LP Gas | 785 (30.2%) | 230 (20.5%) |
| Electricity | 826 (31.8%) | 597 (53.3%) |
| Fuel Oil or Kerosene | 2 (0.1%) | 0 (0.0%) |
| Coal or Coke | 0 (0.0%) | 0 (0.0%) |
| All other Fuels | 379 (14.6%) | 33 (2.9%) |
| No Fuel Used | 4 (0.2%) | 3 (0.3%) |
| Total | 2,595 (100.0%) | 1,120 (100.0%) |
Household Vehicle Usage in DeKalb County
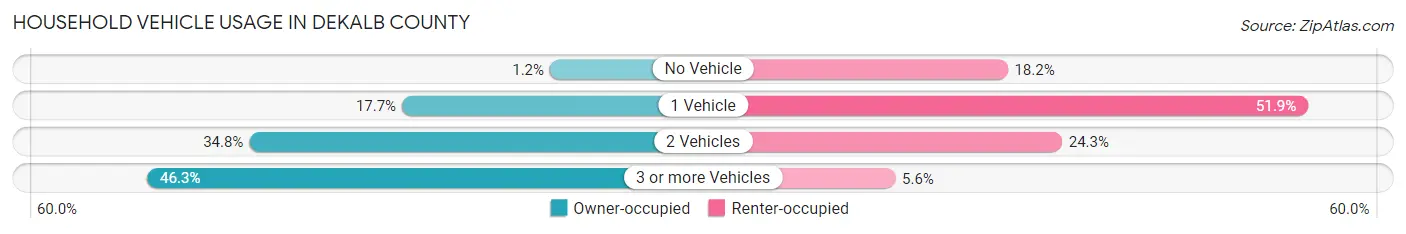
| Vehicles per Household | Owner-occupied | Renter-occupied |
| No Vehicle | 30 (1.2%) | 204 (18.2%) |
| 1 Vehicle | 460 (17.7%) | 581 (51.9%) |
| 2 Vehicles | 904 (34.8%) | 272 (24.3%) |
| 3 or more Vehicles | 1,201 (46.3%) | 63 (5.6%) |
| Total | 2,595 (100.0%) | 1,120 (100.0%) |
Real Estate & Mortgages in DeKalb County
Real Estate and Mortgage Overview in DeKalb County
| Characteristic | Without Mortgage | With Mortgage |
| Housing Units | 1,312 | 1,283 |
| Median Property Value | $136,400 | $186,600 |
| Median Household Income | $64,833 | $209 |
| Monthly Housing Costs | $458 | $2 |
| Real Estate Taxes | $1,210 | $55 |
Property Value by Mortgage Status in DeKalb County
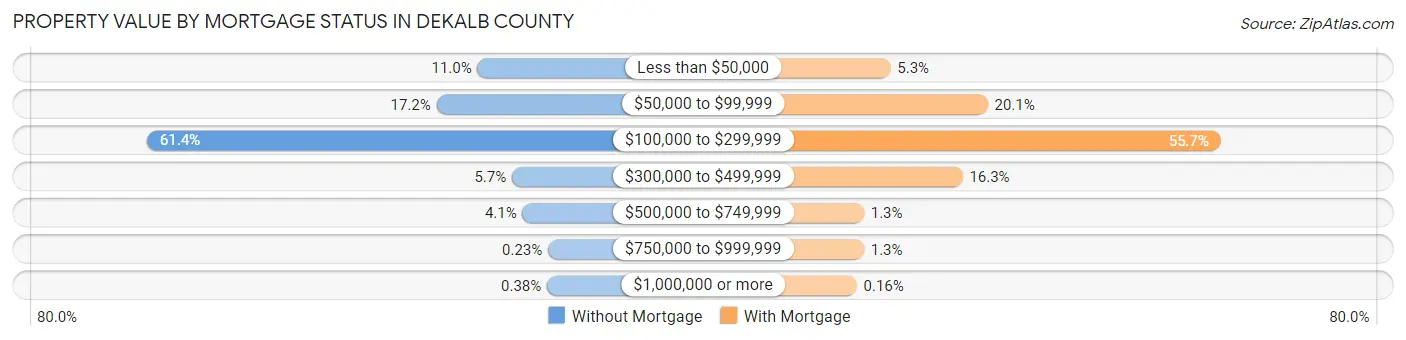
| Property Value | Without Mortgage | With Mortgage |
| Less than $50,000 | 144 (11.0%) | 68 (5.3%) |
| $50,000 to $99,999 | 226 (17.2%) | 258 (20.1%) |
| $100,000 to $299,999 | 805 (61.4%) | 714 (55.6%) |
| $300,000 to $499,999 | 75 (5.7%) | 209 (16.3%) |
| $500,000 to $749,999 | 54 (4.1%) | 16 (1.3%) |
| $750,000 to $999,999 | 3 (0.2%) | 16 (1.3%) |
| $1,000,000 or more | 5 (0.4%) | 2 (0.2%) |
| Total | 1,312 (100.0%) | 1,283 (100.0%) |
Household Income by Mortgage Status in DeKalb County
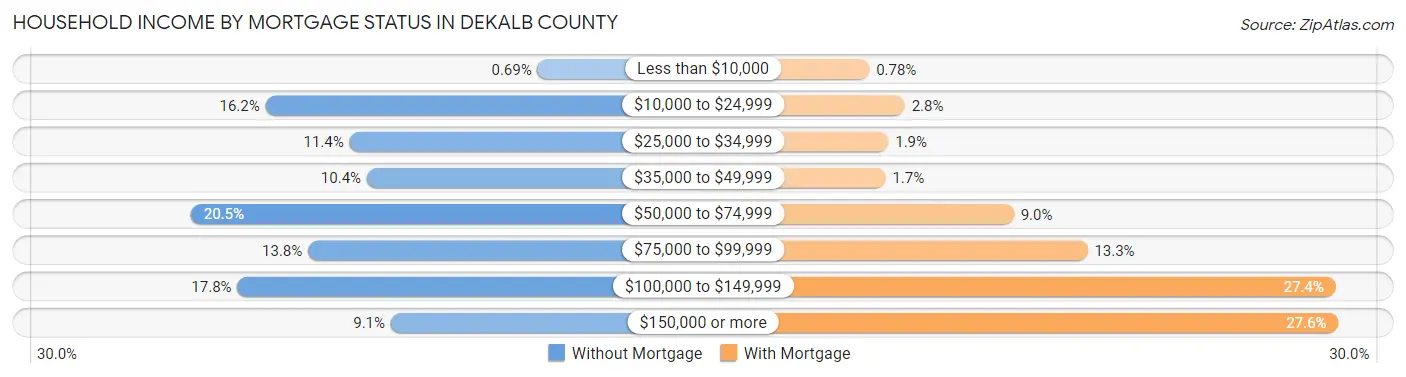
| Household Income | Without Mortgage | With Mortgage |
| Less than $10,000 | 9 (0.7%) | 10 (0.8%) |
| $10,000 to $24,999 | 213 (16.2%) | 36 (2.8%) |
| $25,000 to $34,999 | 150 (11.4%) | 24 (1.9%) |
| $35,000 to $49,999 | 137 (10.4%) | 22 (1.7%) |
| $50,000 to $74,999 | 269 (20.5%) | 116 (9.0%) |
| $75,000 to $99,999 | 181 (13.8%) | 170 (13.3%) |
| $100,000 to $149,999 | 234 (17.8%) | 352 (27.4%) |
| $150,000 or more | 119 (9.1%) | 354 (27.6%) |
| Total | 1,312 (100.0%) | 1,283 (100.0%) |
Property Value to Household Income Ratio in DeKalb County
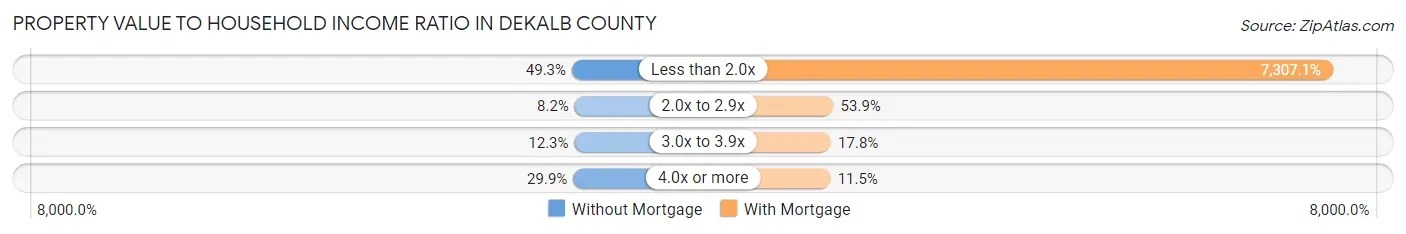
| Value-to-Income Ratio | Without Mortgage | With Mortgage |
| Less than 2.0x | 647 (49.3%) | 93,750 (7,307.1%) |
| 2.0x to 2.9x | 108 (8.2%) | 692 (53.9%) |
| 3.0x to 3.9x | 161 (12.3%) | 228 (17.8%) |
| 4.0x or more | 392 (29.9%) | 148 (11.5%) |
| Total | 1,312 (100.0%) | 1,283 (100.0%) |
Real Estate Taxes by Mortgage Status in DeKalb County
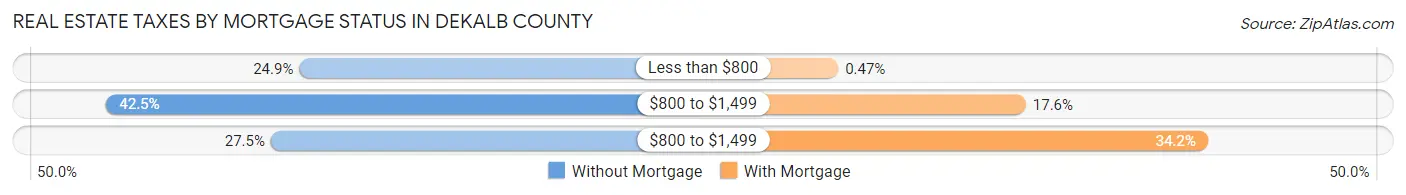
| Property Taxes | Without Mortgage | With Mortgage |
| Less than $800 | 327 (24.9%) | 6 (0.5%) |
| $800 to $1,499 | 558 (42.5%) | 226 (17.6%) |
| $800 to $1,499 | 361 (27.5%) | 439 (34.2%) |
| Total | 1,312 (100.0%) | 1,283 (100.0%) |
Health & Disability in DeKalb County
Health Insurance Coverage by Age in DeKalb County
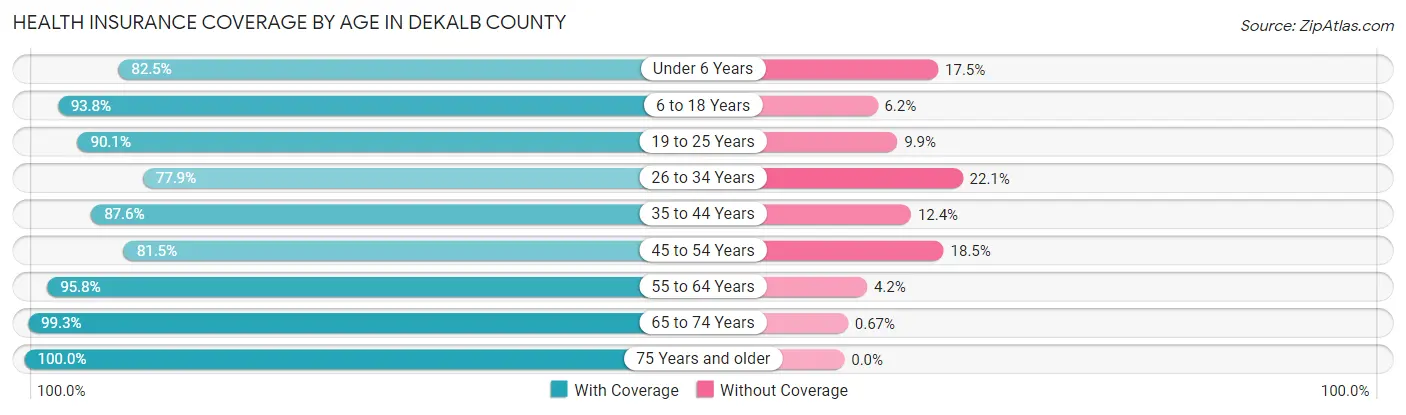
| Age Bracket | With Coverage | Without Coverage |
| Under 6 Years | 604 (82.5%) | 128 (17.5%) |
| 6 to 18 Years | 1,442 (93.8%) | 95 (6.2%) |
| 19 to 25 Years | 675 (90.1%) | 74 (9.9%) |
| 26 to 34 Years | 735 (77.9%) | 208 (22.1%) |
| 35 to 44 Years | 895 (87.6%) | 127 (12.4%) |
| 45 to 54 Years | 1,021 (81.5%) | 232 (18.5%) |
| 55 to 64 Years | 1,088 (95.8%) | 48 (4.2%) |
| 65 to 74 Years | 1,031 (99.3%) | 7 (0.7%) |
| 75 Years and older | 912 (100.0%) | 0 (0.0%) |
| Total | 8,403 (90.1%) | 919 (9.9%) |
Health Insurance Coverage by Citizenship Status in DeKalb County
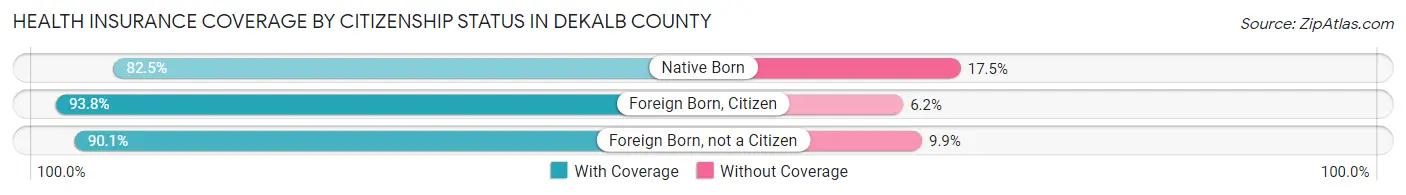
| Citizenship Status | With Coverage | Without Coverage |
| Native Born | 604 (82.5%) | 128 (17.5%) |
| Foreign Born, Citizen | 1,442 (93.8%) | 95 (6.2%) |
| Foreign Born, not a Citizen | 675 (90.1%) | 74 (9.9%) |
Health Insurance Coverage by Household Income in DeKalb County
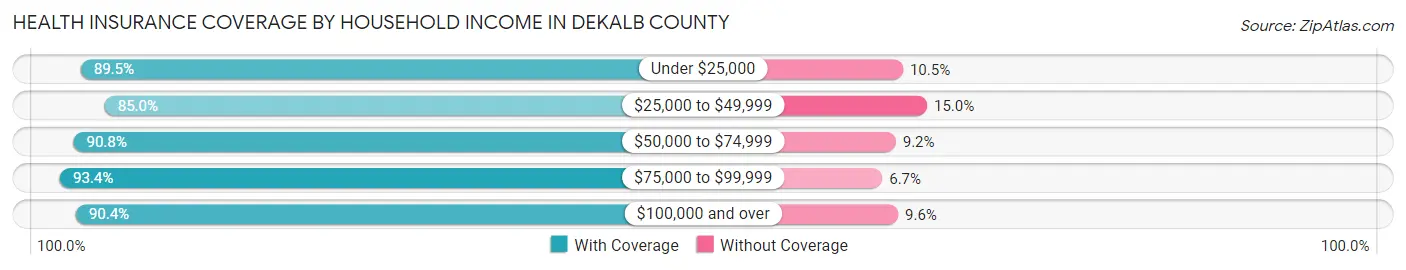
| Household Income | With Coverage | Without Coverage |
| Under $25,000 | 1,003 (89.5%) | 118 (10.5%) |
| $25,000 to $49,999 | 1,136 (85.0%) | 201 (15.0%) |
| $50,000 to $74,999 | 1,326 (90.8%) | 134 (9.2%) |
| $75,000 to $99,999 | 1,881 (93.3%) | 134 (6.7%) |
| $100,000 and over | 3,033 (90.4%) | 323 (9.6%) |
Public vs Private Health Insurance Coverage by Age in DeKalb County
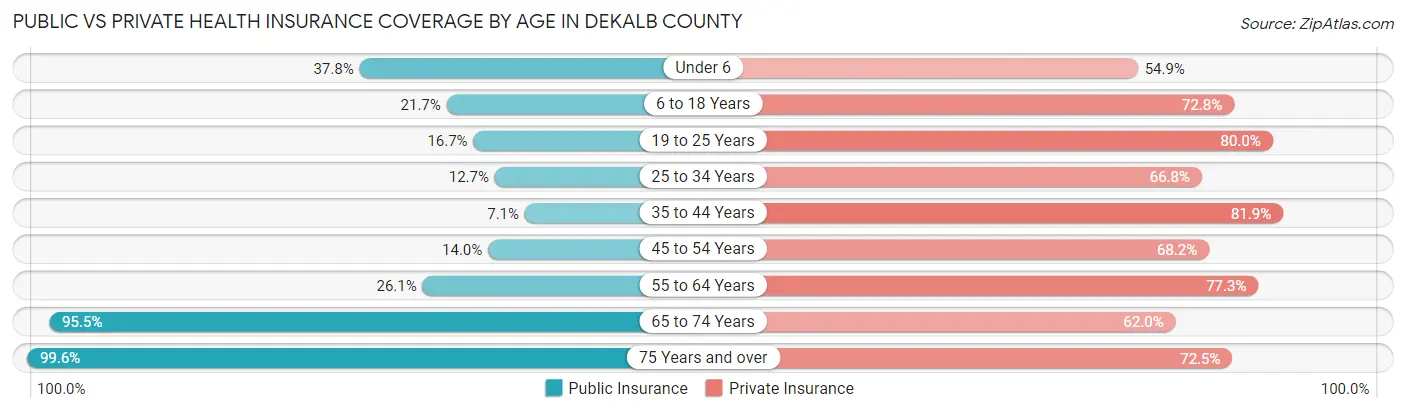
| Age Bracket | Public Insurance | Private Insurance |
| Under 6 | 277 (37.8%) | 402 (54.9%) |
| 6 to 18 Years | 333 (21.7%) | 1,119 (72.8%) |
| 19 to 25 Years | 125 (16.7%) | 599 (80.0%) |
| 25 to 34 Years | 120 (12.7%) | 630 (66.8%) |
| 35 to 44 Years | 73 (7.1%) | 837 (81.9%) |
| 45 to 54 Years | 175 (14.0%) | 854 (68.2%) |
| 55 to 64 Years | 297 (26.1%) | 878 (77.3%) |
| 65 to 74 Years | 991 (95.5%) | 643 (62.0%) |
| 75 Years and over | 908 (99.6%) | 661 (72.5%) |
| Total | 3,299 (35.4%) | 6,623 (71.1%) |
Disability Status by Sex by Age in DeKalb County
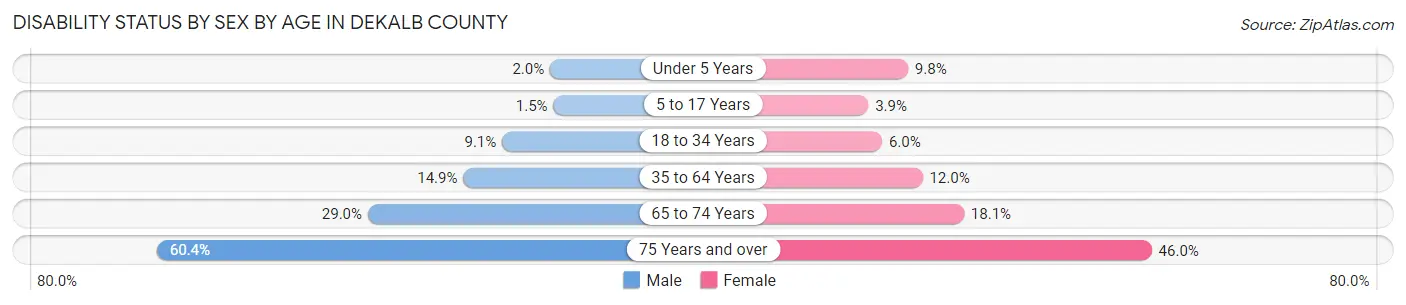
| Age Bracket | Male | Female |
| Under 5 Years | 6 (2.0%) | 28 (9.8%) |
| 5 to 17 Years | 12 (1.5%) | 29 (3.9%) |
| 18 to 34 Years | 92 (9.1%) | 48 (6.0%) |
| 35 to 64 Years | 255 (14.9%) | 203 (12.0%) |
| 65 to 74 Years | 146 (29.0%) | 97 (18.1%) |
| 75 Years and over | 233 (60.4%) | 242 (46.0%) |
Disability Class by Sex by Age in DeKalb County
Disability Class: Hearing Difficulty
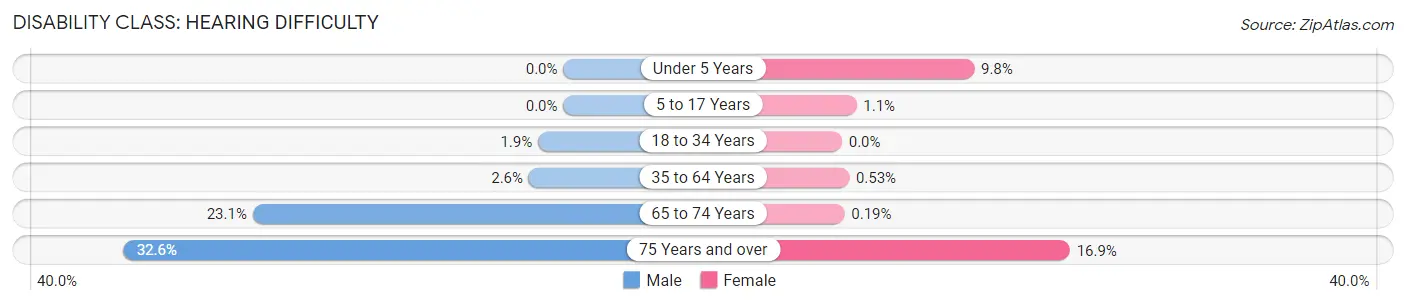
| Age Bracket | Male | Female |
| Under 5 Years | 0 (0.0%) | 28 (9.8%) |
| 5 to 17 Years | 0 (0.0%) | 8 (1.1%) |
| 18 to 34 Years | 19 (1.9%) | 0 (0.0%) |
| 35 to 64 Years | 44 (2.6%) | 9 (0.5%) |
| 65 to 74 Years | 116 (23.1%) | 1 (0.2%) |
| 75 Years and over | 126 (32.6%) | 89 (16.9%) |
Disability Class: Vision Difficulty
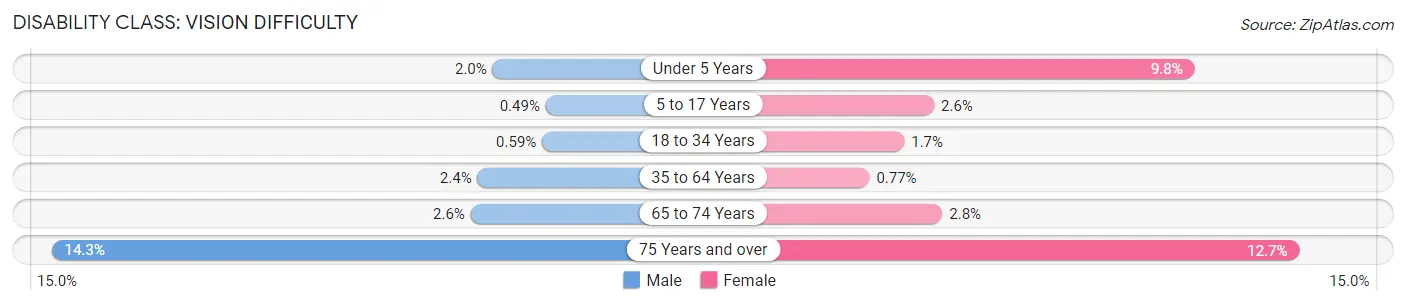
| Age Bracket | Male | Female |
| Under 5 Years | 6 (2.0%) | 28 (9.8%) |
| 5 to 17 Years | 4 (0.5%) | 19 (2.6%) |
| 18 to 34 Years | 6 (0.6%) | 14 (1.7%) |
| 35 to 64 Years | 41 (2.4%) | 13 (0.8%) |
| 65 to 74 Years | 13 (2.6%) | 15 (2.8%) |
| 75 Years and over | 55 (14.2%) | 67 (12.7%) |
Disability Class: Cognitive Difficulty
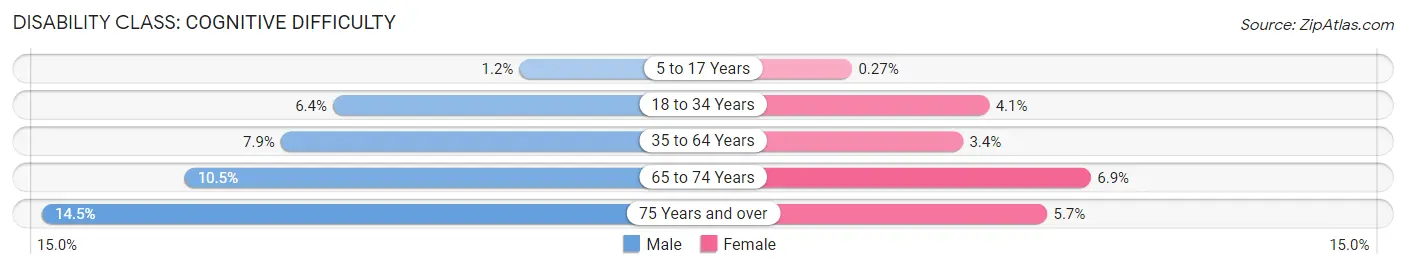
| Age Bracket | Male | Female |
| 5 to 17 Years | 10 (1.2%) | 2 (0.3%) |
| 18 to 34 Years | 65 (6.4%) | 33 (4.1%) |
| 35 to 64 Years | 135 (7.9%) | 57 (3.4%) |
| 65 to 74 Years | 53 (10.5%) | 37 (6.9%) |
| 75 Years and over | 56 (14.5%) | 30 (5.7%) |
Disability Class: Ambulatory Difficulty
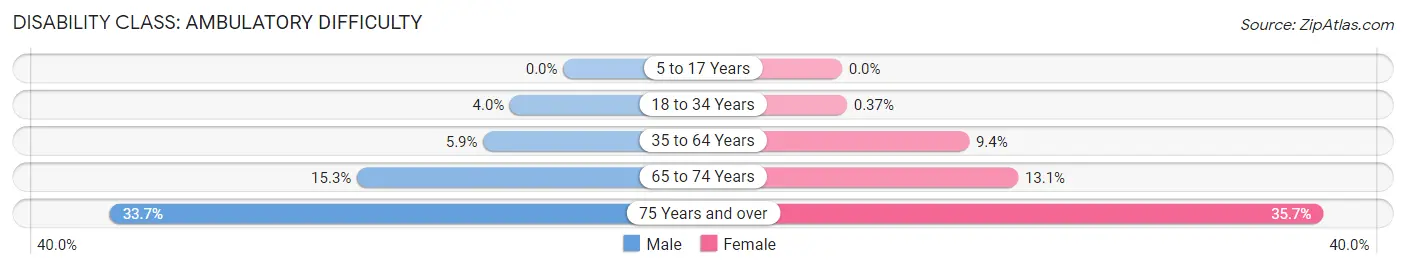
| Age Bracket | Male | Female |
| 5 to 17 Years | 0 (0.0%) | 0 (0.0%) |
| 18 to 34 Years | 40 (4.0%) | 3 (0.4%) |
| 35 to 64 Years | 102 (5.9%) | 160 (9.4%) |
| 65 to 74 Years | 77 (15.3%) | 70 (13.1%) |
| 75 Years and over | 130 (33.7%) | 188 (35.7%) |
Disability Class: Self-Care Difficulty
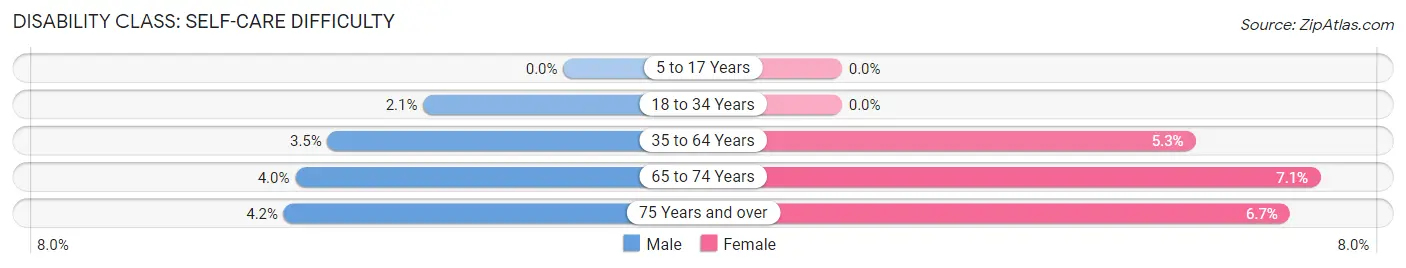
| Age Bracket | Male | Female |
| 5 to 17 Years | 0 (0.0%) | 0 (0.0%) |
| 18 to 34 Years | 21 (2.1%) | 0 (0.0%) |
| 35 to 64 Years | 60 (3.5%) | 89 (5.2%) |
| 65 to 74 Years | 20 (4.0%) | 38 (7.1%) |
| 75 Years and over | 16 (4.2%) | 35 (6.7%) |
Technology Access in DeKalb County
Computing Device Access in DeKalb County
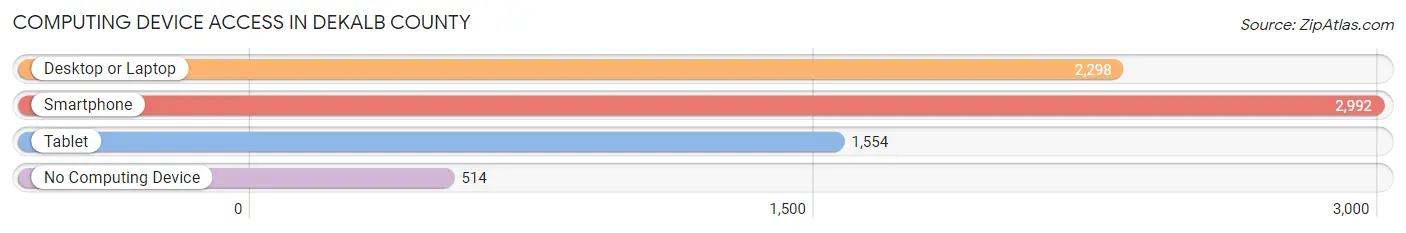
| Device Type | # Households | % Households |
| Desktop or Laptop | 2,298 | 61.9% |
| Smartphone | 2,992 | 80.5% |
| Tablet | 1,554 | 41.8% |
| No Computing Device | 514 | 13.8% |
| Total | 3,715 | 100.0% |
Internet Access in DeKalb County
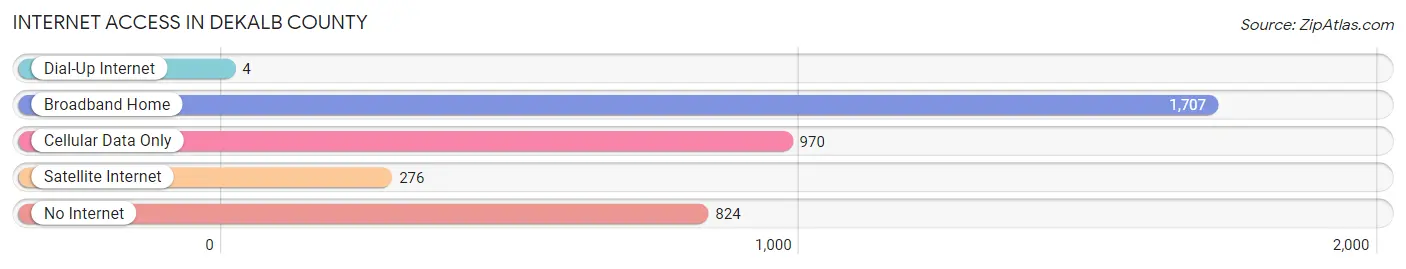
| Internet Type | # Households | % Households |
| Dial-Up Internet | 4 | 0.1% |
| Broadband Home | 1,707 | 46.0% |
| Cellular Data Only | 970 | 26.1% |
| Satellite Internet | 276 | 7.4% |
| No Internet | 824 | 22.2% |
| Total | 3,715 | 100.0% |
DeKalb County Summary
Dekalb County, Missouri is located in the northwest corner of the state and is part of the St. Joseph, MO-KS Metropolitan Statistical Area. The county was established in 1845 and named after Major General Johann de Kalb, a German-born officer who served in the Continental Army during the American Revolutionary War. As of the 2010 census, the population was 12,892, making it the second least populous county in Missouri.
Geography
Dekalb County is located in the northwest corner of Missouri and is bordered by Andrew County to the north, Buchanan County to the east, Clinton County to the south, and Doniphan County, Kansas to the west. The county has a total area of 517 square miles, of which 515 square miles is land and 2.2 square miles (0.4%) is water. The county is mostly rural and is home to several small towns, including Maysville, Union Star, and Stewartsville. The county is also home to several state parks, including Big Lake State Park, Wallace State Park, and Big Creek State Park.
Climate
Dekalb County has a humid continental climate, with hot, humid summers and cold, dry winters. The average annual temperature is 54°F, with an average high of 79°F in July and an average low of 28°F in January. The average annual precipitation is 37.5 inches, with the wettest month being May, when an average of 4.7 inches of rain falls.
Demographics
As of the 2010 census, there were 12,892 people, 4,945 households, and 3,521 families residing in the county. The population density was 25 people per square mile. The racial makeup of the county was 97.3% White, 0.4% African American, 0.3% Native American, 0.2% Asian, 0.1% Pacific Islander, 0.5% from other races, and 1.2% from two or more races. Hispanic or Latino of any race were 1.3% of the population.
The median income for a household in the county was $41,945, and the median income for a family was $50,945. The per capita income for the county was $20,845. About 11.2% of families and 14.2% of the population were below the poverty line, including 19.2% of those under age 18 and 8.2% of those age 65 or over.
Economy
Dekalb County is largely rural and agricultural, with the majority of the population employed in farming and related industries. The county is home to several large farms, including the Maysville Farms, which produces corn, soybeans, and wheat. Other major industries in the county include manufacturing, retail, and healthcare. The county is also home to several small businesses, including restaurants, gas stations, and convenience stores.
The county is served by two major highways, US Route 36 and Missouri Route 6. The county is also served by the Burlington Northern Santa Fe Railway, which runs through the county from east to west.
Conclusion
Dekalb County, Missouri is a rural county located in the northwest corner of the state. The county is home to several small towns and is largely agricultural, with the majority of the population employed in farming and related industries. The county is served by two major highways and the Burlington Northern Santa Fe Railway, and is home to several state parks. As of the 2010 census, the population was 12,892, with a median household income of $41,945.
Common Questions
What is Per Capita Income in DeKalb County?
Per Capita income in DeKalb County is $25,591.
What is the Median Family Income in DeKalb County?
Median Family Income in DeKalb County is $86,402.
What is the Median Household income in DeKalb County?
Median Household Income in DeKalb County is $67,910.
What is Income or Wage Gap in DeKalb County?
Income or Wage Gap in DeKalb County is 22.6%.
Women in DeKalb County earn 77.4 cents for every dollar earned by a man.
What is Family Income Deficit in DeKalb County?
Family Income Deficit in DeKalb County is $12,812.
Families that are below poverty line in DeKalb County earn $12,812 less on average than the poverty threshold level.
What is Inequality or Gini Index in DeKalb County?
Inequality or Gini Index in DeKalb County is 0.40.
What is the Total Population of DeKalb County?
Total Population of DeKalb County is 11,838.
What is the Total Male Population of DeKalb County?
Total Male Population of DeKalb County is 7,127.
What is the Total Female Population of DeKalb County?
Total Female Population of DeKalb County is 4,711.
What is the Ratio of Males per 100 Females in DeKalb County?
There are 151.28 Males per 100 Females in DeKalb County.
What is the Ratio of Females per 100 Males in DeKalb County?
There are 66.10 Females per 100 Males in DeKalb County.
What is the Median Population Age in DeKalb County?
Median Population Age in DeKalb County is 41.7 Years.
What is the Average Family Size in DeKalb County
Average Family Size in DeKalb County is 3.2 People.
What is the Average Household Size in DeKalb County
Average Household Size in DeKalb County is 2.5 People.
How Large is the Labor Force in DeKalb County?
There are 4,394 People in the Labor Forcein in DeKalb County.
What is the Percentage of People in the Labor Force in DeKalb County?
44.2% of People are in the Labor Force in DeKalb County.
What is the Unemployment Rate in DeKalb County?
Unemployment Rate in DeKalb County is 3.1%.