Dallas County, MO Map & Demographics
Dallas County Map
Dallas County Overview
$24,646
PER CAPITA INCOME
$61,361
AVG FAMILY INCOME
$46,547
AVG HOUSEHOLD INCOME
30.6%
WAGE / INCOME GAP [ % ]
69.4¢/ $1
WAGE / INCOME GAP [ $ ]
0.44
INEQUALITY / GINI INDEX
17,158
TOTAL POPULATION
8,402
MALE POPULATION
8,756
FEMALE POPULATION
95.96
MALES / 100 FEMALES
104.21
FEMALES / 100 MALES
41.7
MEDIAN AGE
3.1
AVG FAMILY SIZE
2.6
AVG HOUSEHOLD SIZE
6,821
LABOR FORCE [ PEOPLE ]
50.6%
PERCENT IN LABOR FORCE
4.9%
UNEMPLOYMENT RATE
Dallas County Area Codes
Income in Dallas County
Income Overview in Dallas County
Per Capita Income in Dallas County is $24,646, while median incomes of families and households are $61,361 and $46,547 respectively.
| Characteristic | Number | Measure |
| Per Capita Income | 17,158 | $24,646 |
| Median Family Income | 4,684 | $61,361 |
| Mean Family Income | 4,684 | $73,471 |
| Median Household Income | 6,604 | $46,547 |
| Mean Household Income | 6,604 | $62,187 |
| Income Deficit | 4,684 | $0 |
| Wage / Income Gap (%) | 17,158 | 30.61% |
| Wage / Income Gap ($) | 17,158 | 69.39¢ per $1 |
| Gini / Inequality Index | 17,158 | 0.44 |
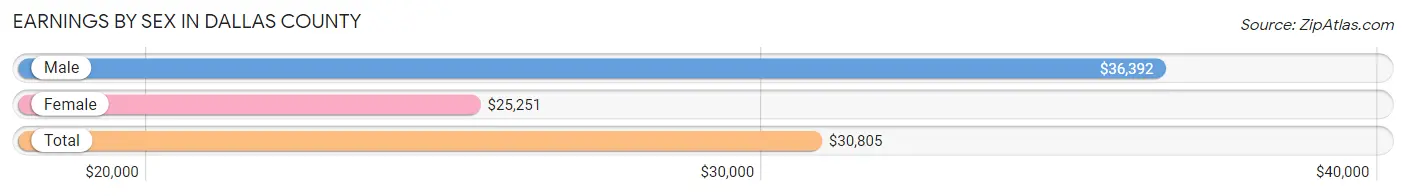
Earnings by Sex in Dallas County
Average Earnings in Dallas County are $30,805, $36,392 for men and $25,251 for women, a difference of 30.6%.
| Sex | Number | Average Earnings |
| Male | 3,869 (53.2%) | $36,392 |
| Female | 3,402 (46.8%) | $25,251 |
| Total | 7,271 (100.0%) | $30,805 |
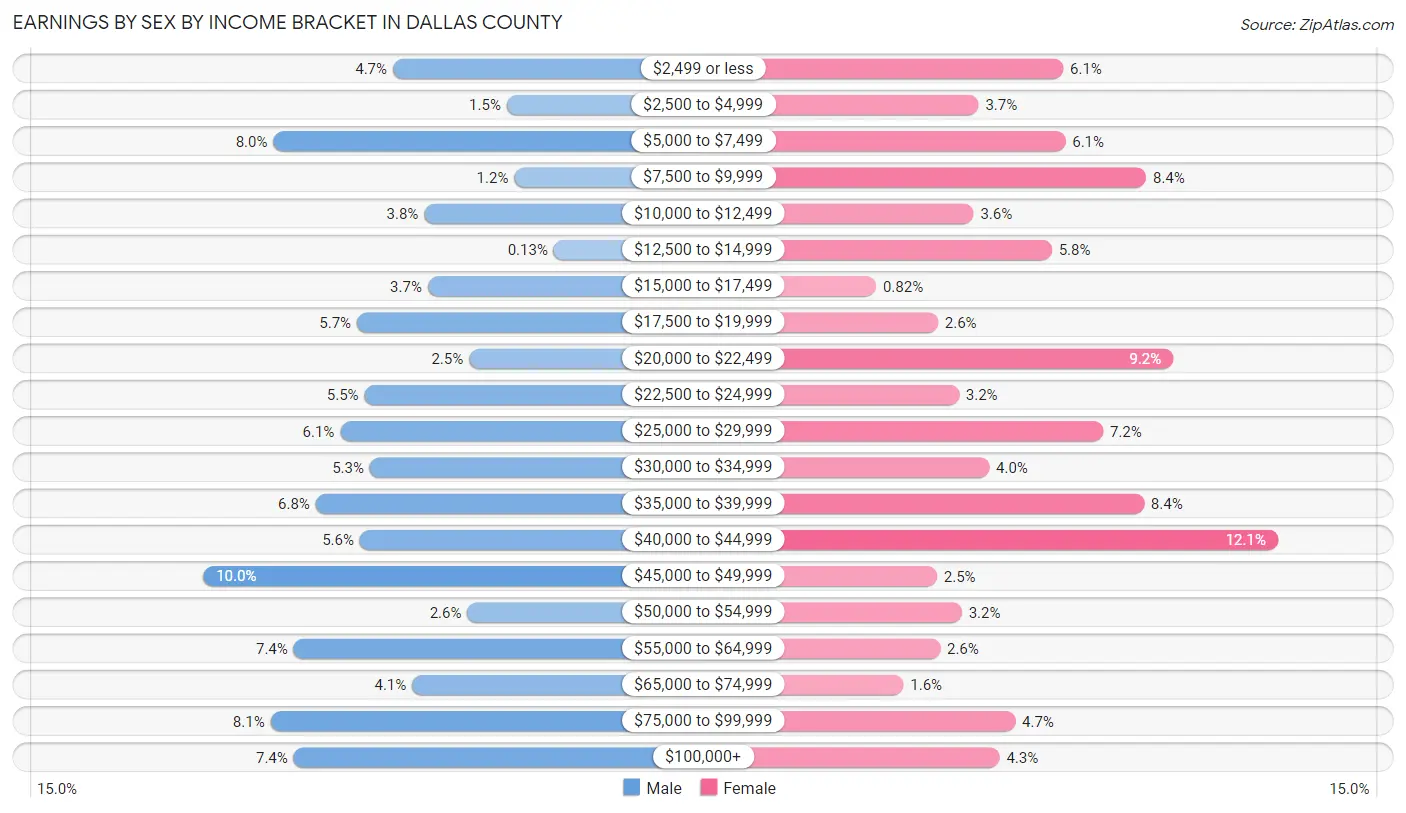
Earnings by Sex by Income Bracket in Dallas County
The most common earnings brackets in Dallas County are $45,000 to $49,999 for men (386 | 10.0%) and $40,000 to $44,999 for women (412 | 12.1%).
| Income | Male | Female |
| $2,499 or less | 180 (4.6%) | 207 (6.1%) |
| $2,500 to $4,999 | 56 (1.5%) | 126 (3.7%) |
| $5,000 to $7,499 | 310 (8.0%) | 209 (6.1%) |
| $7,500 to $9,999 | 48 (1.2%) | 286 (8.4%) |
| $10,000 to $12,499 | 146 (3.8%) | 121 (3.6%) |
| $12,500 to $14,999 | 5 (0.1%) | 196 (5.8%) |
| $15,000 to $17,499 | 142 (3.7%) | 28 (0.8%) |
| $17,500 to $19,999 | 219 (5.7%) | 87 (2.6%) |
| $20,000 to $22,499 | 97 (2.5%) | 312 (9.2%) |
| $22,500 to $24,999 | 211 (5.4%) | 107 (3.2%) |
| $25,000 to $29,999 | 237 (6.1%) | 245 (7.2%) |
| $30,000 to $34,999 | 205 (5.3%) | 136 (4.0%) |
| $35,000 to $39,999 | 264 (6.8%) | 284 (8.4%) |
| $40,000 to $44,999 | 216 (5.6%) | 412 (12.1%) |
| $45,000 to $49,999 | 386 (10.0%) | 86 (2.5%) |
| $50,000 to $54,999 | 99 (2.6%) | 110 (3.2%) |
| $55,000 to $64,999 | 288 (7.4%) | 89 (2.6%) |
| $65,000 to $74,999 | 159 (4.1%) | 54 (1.6%) |
| $75,000 to $99,999 | 313 (8.1%) | 161 (4.7%) |
| $100,000+ | 288 (7.4%) | 146 (4.3%) |
| Total | 3,869 (100.0%) | 3,402 (100.0%) |
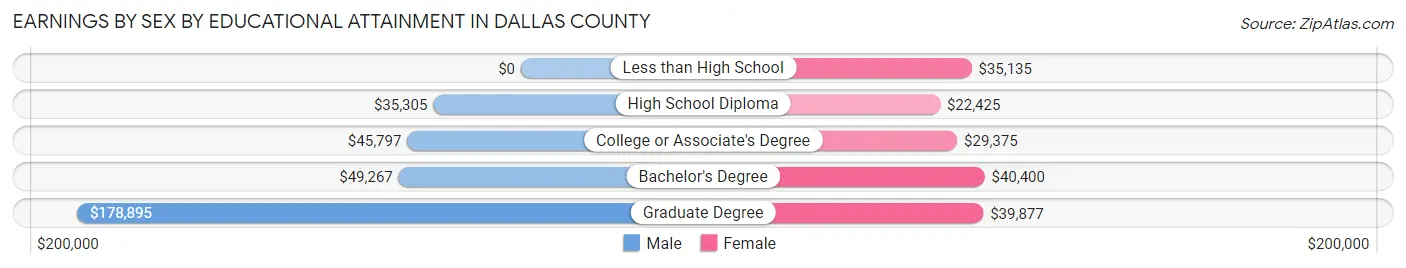
Earnings by Sex by Educational Attainment in Dallas County
Average earnings in Dallas County are $42,199 for men and $26,429 for women, a difference of 37.4%. Men with an educational attainment of graduate degree enjoy the highest average annual earnings of $178,895, while those with high school diploma education earn the least with $35,305. Women with an educational attainment of bachelor's degree earn the most with the average annual earnings of $40,400, while those with high school diploma education have the smallest earnings of $22,425.
| Educational Attainment | Male Income | Female Income |
| Less than High School | - | - |
| High School Diploma | $35,305 | $22,425 |
| College or Associate's Degree | $45,797 | $29,375 |
| Bachelor's Degree | $49,267 | $40,400 |
| Graduate Degree | $178,895 | $39,877 |
| Total | $42,199 | $26,429 |
Family Income in Dallas County
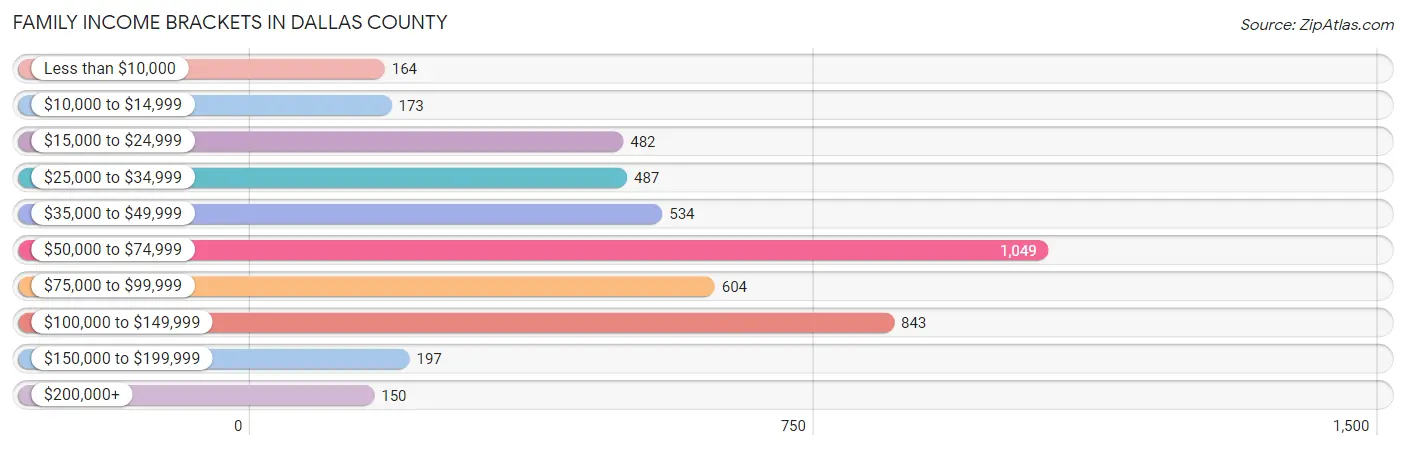
Family Income Brackets in Dallas County
According to the Dallas County family income data, there are 1,049 families falling into the $50,000 to $74,999 income range, which is the most common income bracket and makes up 22.4% of all families. Conversely, the $200,000+ income bracket is the least frequent group with only 150 families (3.2%) belonging to this category.
| Income Bracket | # Families | % Families |
| Less than $10,000 | 164 | 3.5% |
| $10,000 to $14,999 | 173 | 3.7% |
| $15,000 to $24,999 | 482 | 10.3% |
| $25,000 to $34,999 | 487 | 10.4% |
| $35,000 to $49,999 | 534 | 11.4% |
| $50,000 to $74,999 | 1,049 | 22.4% |
| $75,000 to $99,999 | 604 | 12.9% |
| $100,000 to $149,999 | 843 | 18.0% |
| $150,000 to $199,999 | 197 | 4.2% |
| $200,000+ | 150 | 3.2% |
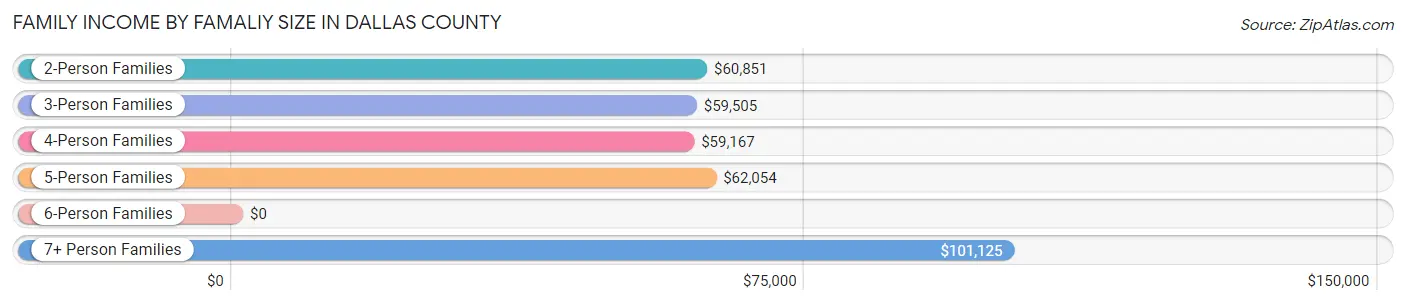
Family Income by Famaliy Size in Dallas County
7+ person families (159 | 3.4%) account for the highest median family income in Dallas County with $101,125 per family, while 2-person families (2,556 | 54.6%) have the highest median income of $30,426 per family member.
| Income Bracket | # Families | Median Income |
| 2-Person Families | 2,556 (54.6%) | $60,851 |
| 3-Person Families | 779 (16.6%) | $59,505 |
| 4-Person Families | 778 (16.6%) | $59,167 |
| 5-Person Families | 364 (7.8%) | $62,054 |
| 6-Person Families | 48 (1.0%) | $0 |
| 7+ Person Families | 159 (3.4%) | $101,125 |
| Total | 4,684 (100.0%) | $61,361 |
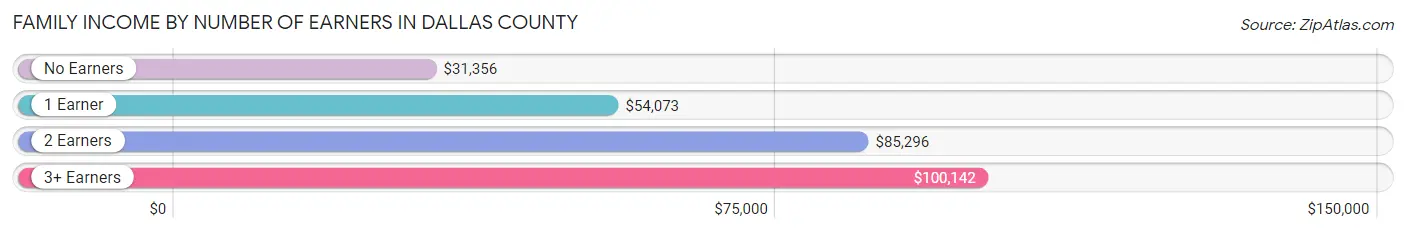
Family Income by Number of Earners in Dallas County
The median family income in Dallas County is $61,361, with families comprising 3+ earners (319) having the highest median family income of $100,142, while families with no earners (1,360) have the lowest median family income of $31,356, accounting for 6.8% and 29.0% of families, respectively.
| Number of Earners | # Families | Median Income |
| No Earners | 1,360 (29.0%) | $31,356 |
| 1 Earner | 1,145 (24.4%) | $54,073 |
| 2 Earners | 1,860 (39.7%) | $85,296 |
| 3+ Earners | 319 (6.8%) | $100,142 |
| Total | 4,684 (100.0%) | $61,361 |
Household Income in Dallas County
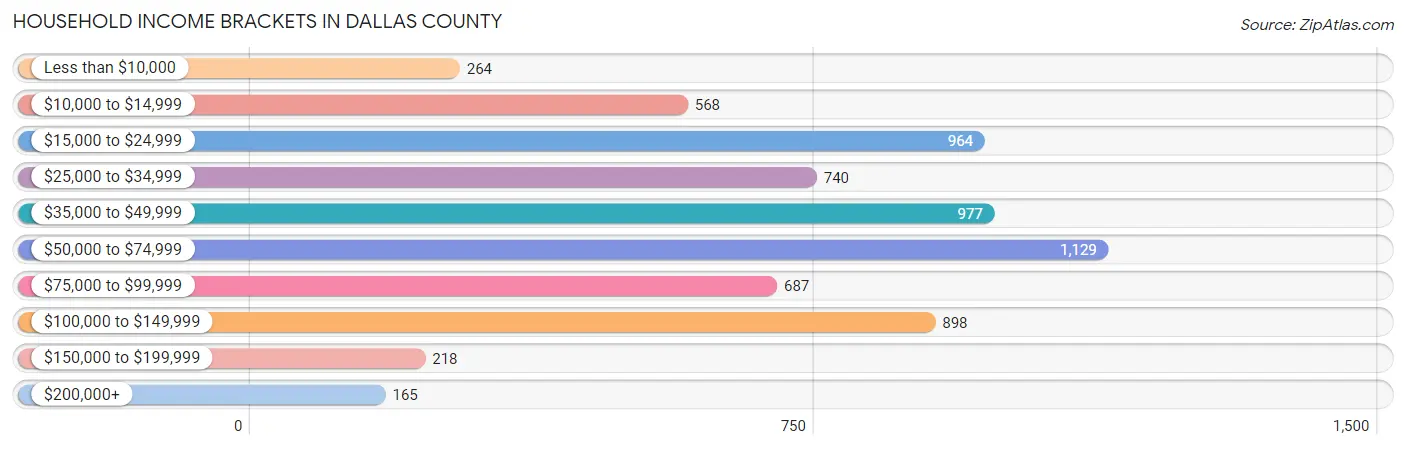
Household Income Brackets in Dallas County
With 1,129 households falling in the category, the $50,000 to $74,999 income range is the most frequent in Dallas County, accounting for 17.1% of all households. In contrast, only 165 households (2.5%) fall into the $200,000+ income bracket, making it the least populous group.
| Income Bracket | # Households | % Households |
| Less than $10,000 | 264 | 4.0% |
| $10,000 to $14,999 | 568 | 8.6% |
| $15,000 to $24,999 | 964 | 14.6% |
| $25,000 to $34,999 | 740 | 11.2% |
| $35,000 to $49,999 | 977 | 14.8% |
| $50,000 to $74,999 | 1,129 | 17.1% |
| $75,000 to $99,999 | 687 | 10.4% |
| $100,000 to $149,999 | 898 | 13.6% |
| $150,000 to $199,999 | 218 | 3.3% |
| $200,000+ | 165 | 2.5% |
Household Income by Householder Age in Dallas County
The median household income in Dallas County is $46,547, with the highest median household income of $61,736 found in the 45 to 64 years age bracket for the primary householder. A total of 2,549 households (38.6%) fall into this category. Meanwhile, the 15 to 24 years age bracket for the primary householder has the lowest median household income of $2,499, with 187 households (2.8%) in this group.
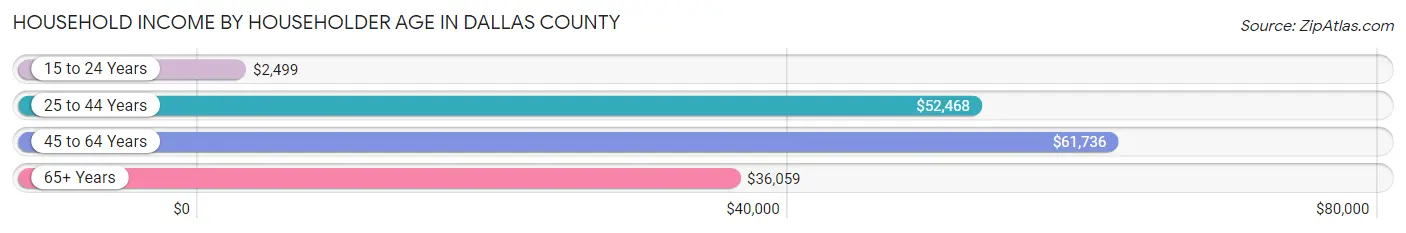
| Income Bracket | # Households | Median Income |
| 15 to 24 Years | 187 (2.8%) | $2,499 |
| 25 to 44 Years | 1,756 (26.6%) | $52,468 |
| 45 to 64 Years | 2,549 (38.6%) | $61,736 |
| 65+ Years | 2,112 (32.0%) | $36,059 |
| Total | 6,604 (100.0%) | $46,547 |
Poverty in Dallas County
Income Below Poverty by Sex and Age in Dallas County
With 17.3% poverty level for males and 23.8% for females among the residents of Dallas County, 6 to 11 year old males and 12 to 14 year old females are the most vulnerable to poverty, with 254 males (44.3%) and 137 females (50.2%) in their respective age groups living below the poverty level.
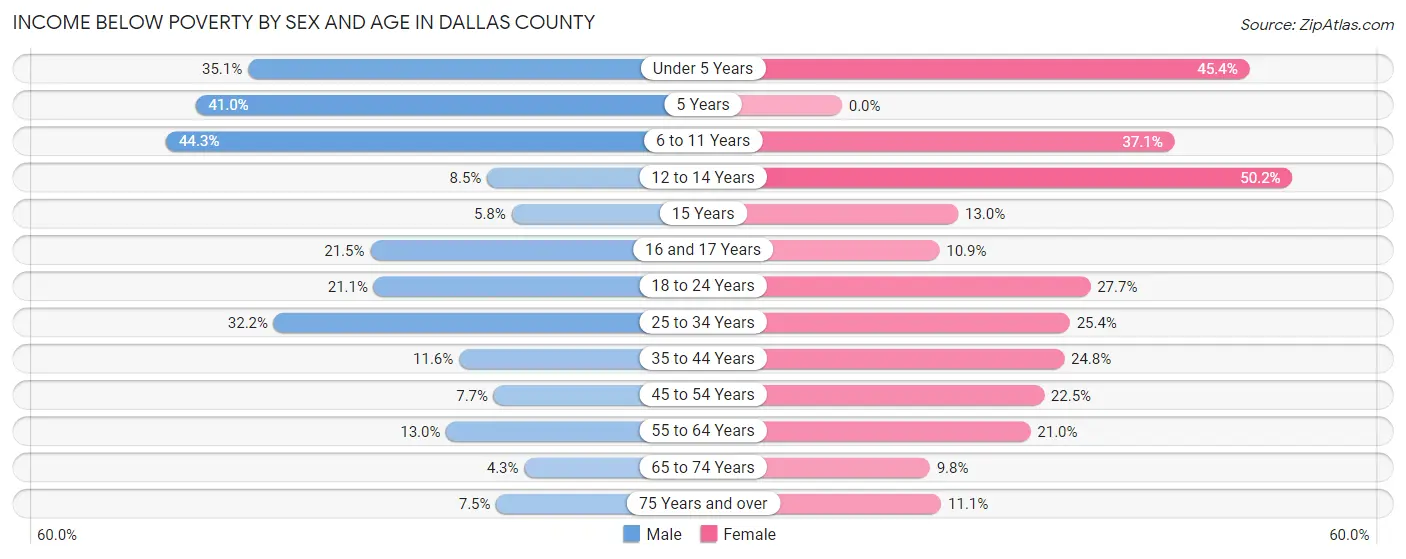
| Age Bracket | Male | Female |
| Under 5 Years | 190 (35.1%) | 257 (45.4%) |
| 5 Years | 59 (41.0%) | 0 (0.0%) |
| 6 to 11 Years | 254 (44.3%) | 295 (37.1%) |
| 12 to 14 Years | 34 (8.5%) | 137 (50.2%) |
| 15 Years | 8 (5.8%) | 18 (13.0%) |
| 16 and 17 Years | 43 (21.5%) | 24 (10.9%) |
| 18 to 24 Years | 126 (21.1%) | 145 (27.7%) |
| 25 to 34 Years | 276 (32.2%) | 285 (25.4%) |
| 35 to 44 Years | 118 (11.6%) | 223 (24.7%) |
| 45 to 54 Years | 74 (7.7%) | 226 (22.5%) |
| 55 to 64 Years | 163 (13.0%) | 257 (21.0%) |
| 65 to 74 Years | 44 (4.3%) | 106 (9.8%) |
| 75 Years and over | 45 (7.5%) | 77 (11.1%) |
| Total | 1,434 (17.3%) | 2,050 (23.8%) |
Income Above Poverty by Sex and Age in Dallas County
According to the poverty statistics in Dallas County, males aged 65 to 74 years and females aged 5 years are the age groups that are most secure financially, with 95.7% of males and 100.0% of females in these age groups living above the poverty line.
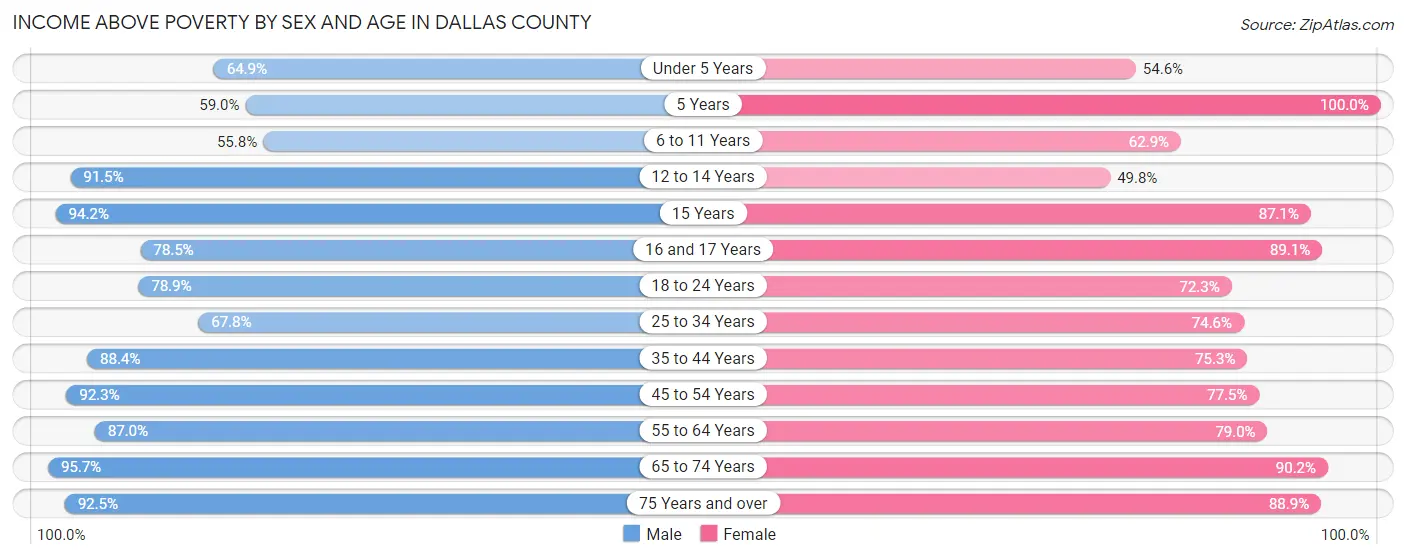
| Age Bracket | Male | Female |
| Under 5 Years | 351 (64.9%) | 309 (54.6%) |
| 5 Years | 85 (59.0%) | 70 (100.0%) |
| 6 to 11 Years | 320 (55.7%) | 501 (62.9%) |
| 12 to 14 Years | 367 (91.5%) | 136 (49.8%) |
| 15 Years | 131 (94.2%) | 121 (87.1%) |
| 16 and 17 Years | 157 (78.5%) | 197 (89.1%) |
| 18 to 24 Years | 471 (78.9%) | 379 (72.3%) |
| 25 to 34 Years | 580 (67.8%) | 838 (74.6%) |
| 35 to 44 Years | 898 (88.4%) | 678 (75.2%) |
| 45 to 54 Years | 882 (92.3%) | 778 (77.5%) |
| 55 to 64 Years | 1,087 (87.0%) | 967 (79.0%) |
| 65 to 74 Years | 970 (95.7%) | 977 (90.2%) |
| 75 Years and over | 558 (92.5%) | 619 (88.9%) |
| Total | 6,857 (82.7%) | 6,570 (76.2%) |
Income Below Poverty Among Married-Couple Families in Dallas County
The poverty statistics for married-couple families in Dallas County show that 6.2% or 235 of the total 3,777 families live below the poverty line. Families with 3 or 4 children have the highest poverty rate of 20.0%, comprising of 68 families. On the other hand, families with 5 or more children have the lowest poverty rate of 0.0%, which includes 0 families.
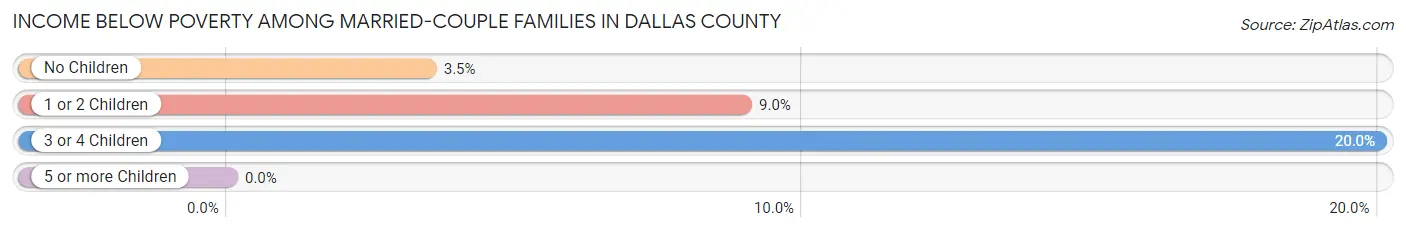
| Children | Above Poverty | Below Poverty |
| No Children | 2,347 (96.5%) | 84 (3.5%) |
| 1 or 2 Children | 844 (91.0%) | 83 (8.9%) |
| 3 or 4 Children | 272 (80.0%) | 68 (20.0%) |
| 5 or more Children | 79 (100.0%) | 0 (0.0%) |
| Total | 3,542 (93.8%) | 235 (6.2%) |
Income Below Poverty Among Single-Parent Households in Dallas County
According to the poverty data in Dallas County, 40.5% or 81 single-father households and 66.3% or 469 single-mother households are living below the poverty line. Among single-father households, those with 1 or 2 children have the highest poverty rate, with 81 households (52.9%) experiencing poverty. Likewise, among single-mother households, those with 3 or 4 children have the highest poverty rate, with 57 households (100.0%) falling below the poverty line.
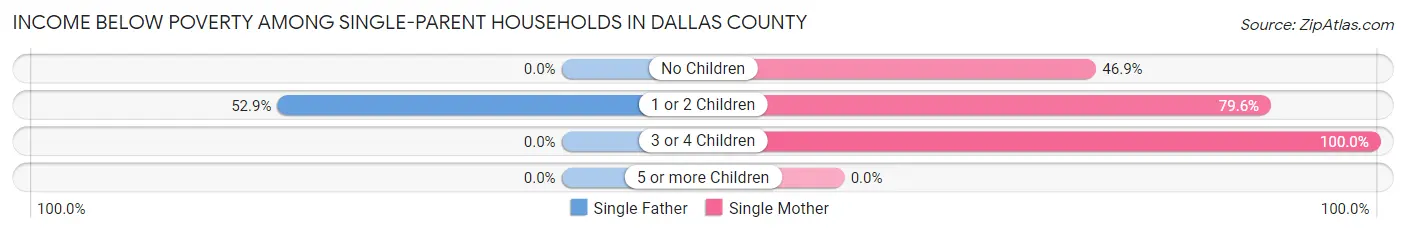
| Children | Single Father | Single Mother |
| No Children | 0 (0.0%) | 151 (46.9%) |
| 1 or 2 Children | 81 (52.9%) | 261 (79.6%) |
| 3 or 4 Children | 0 (0.0%) | 57 (100.0%) |
| 5 or more Children | 0 (0.0%) | 0 (0.0%) |
| Total | 81 (40.5%) | 469 (66.3%) |
Income Below Poverty Among Married-Couple vs Single-Parent Households in Dallas County
The poverty data for Dallas County shows that 235 of the married-couple family households (6.2%) and 550 of the single-parent households (60.6%) are living below the poverty level. Within the married-couple family households, those with 3 or 4 children have the highest poverty rate, with 68 households (20.0%) falling below the poverty line. Among the single-parent households, those with 3 or 4 children have the highest poverty rate, with 57 household (100.0%) living below poverty.
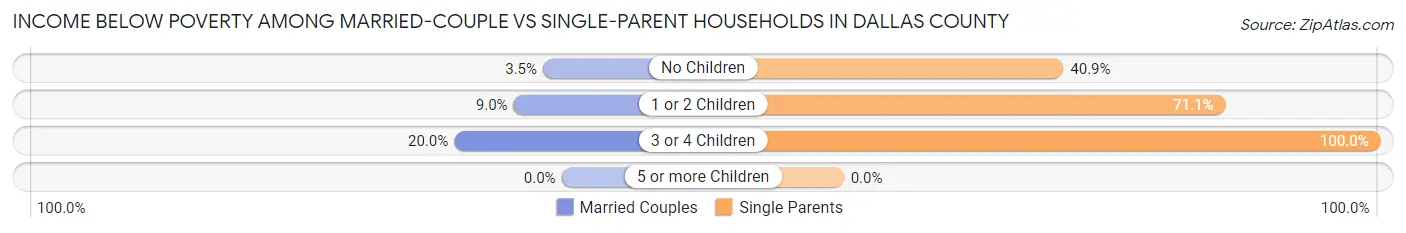
| Children | Married-Couple Families | Single-Parent Households |
| No Children | 84 (3.5%) | 151 (40.9%) |
| 1 or 2 Children | 83 (8.9%) | 342 (71.1%) |
| 3 or 4 Children | 68 (20.0%) | 57 (100.0%) |
| 5 or more Children | 0 (0.0%) | 0 (0.0%) |
| Total | 235 (6.2%) | 550 (60.6%) |
Race in Dallas County
The most populous races in Dallas County are White / Caucasian (16,392 | 95.5%), Two or more Races (674 | 3.9%), and Hispanic or Latino (417 | 2.4%).
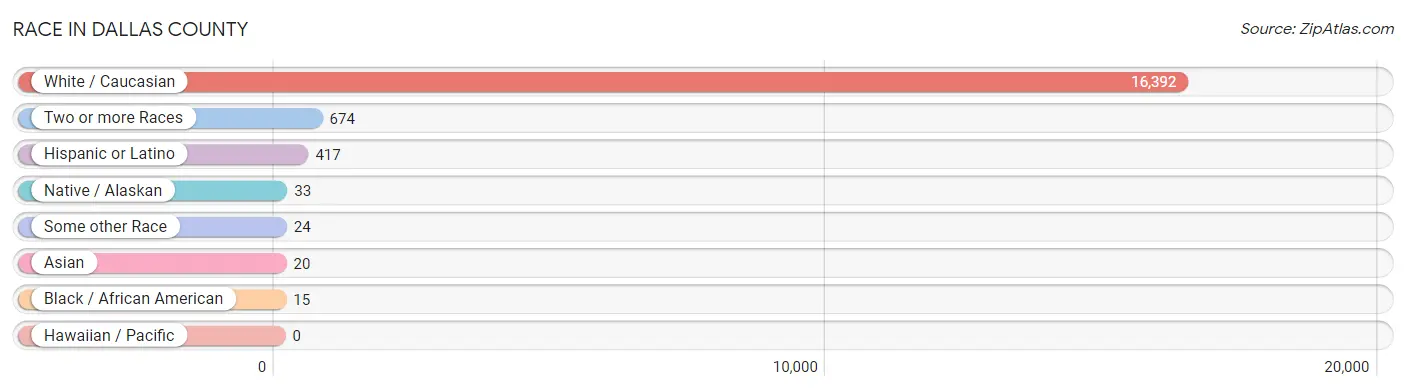
| Race | # Population | % Population |
| Asian | 20 | 0.1% |
| Black / African American | 15 | 0.1% |
| Hawaiian / Pacific | 0 | 0.0% |
| Hispanic or Latino | 417 | 2.4% |
| Native / Alaskan | 33 | 0.2% |
| White / Caucasian | 16,392 | 95.5% |
| Two or more Races | 674 | 3.9% |
| Some other Race | 24 | 0.1% |
| Total | 17,158 | 100.0% |
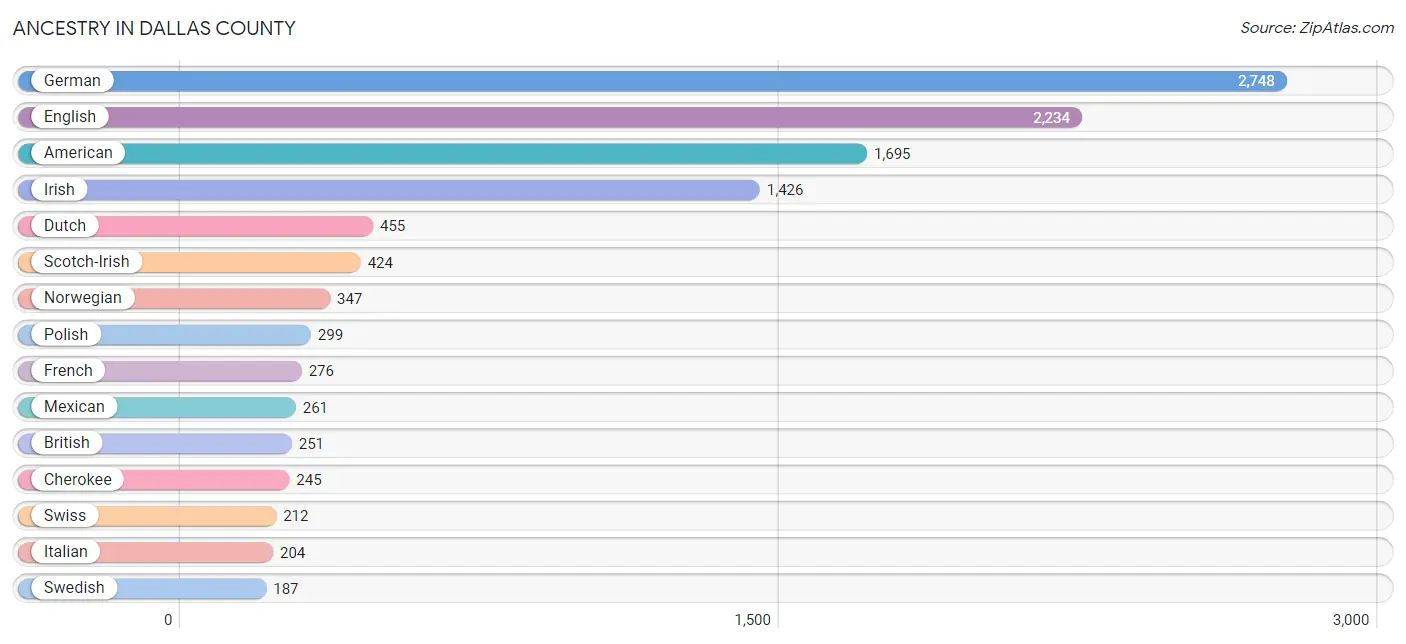
Ancestry in Dallas County
The most populous ancestries reported in Dallas County are German (2,748 | 16.0%), English (2,234 | 13.0%), American (1,695 | 9.9%), Irish (1,426 | 8.3%), and Dutch (455 | 2.6%), together accounting for 49.9% of all Dallas County residents.
| Ancestry | # Population | % Population |
| African | 19 | 0.1% |
| American | 1,695 | 9.9% |
| Arab | 42 | 0.2% |
| Blackfeet | 1 | 0.0% |
| British | 251 | 1.5% |
| Canadian | 3 | 0.0% |
| Celtic | 13 | 0.1% |
| Central American | 22 | 0.1% |
| Cherokee | 245 | 1.4% |
| Choctaw | 9 | 0.1% |
| Creek | 41 | 0.2% |
| Czech | 16 | 0.1% |
| Danish | 164 | 1.0% |
| Dutch | 455 | 2.6% |
| Eastern European | 35 | 0.2% |
| English | 2,234 | 13.0% |
| European | 133 | 0.8% |
| Finnish | 9 | 0.1% |
| French | 276 | 1.6% |
| French Canadian | 4 | 0.0% |
| German | 2,748 | 16.0% |
| Greek | 14 | 0.1% |
| Hungarian | 34 | 0.2% |
| Iranian | 70 | 0.4% |
| Irish | 1,426 | 8.3% |
| Italian | 204 | 1.2% |
| Lebanese | 5 | 0.0% |
| Mexican | 261 | 1.5% |
| Norwegian | 347 | 2.0% |
| Panamanian | 22 | 0.1% |
| Polish | 299 | 1.7% |
| Puerto Rican | 133 | 0.8% |
| Romanian | 35 | 0.2% |
| Russian | 66 | 0.4% |
| Scandinavian | 184 | 1.1% |
| Scotch-Irish | 424 | 2.5% |
| Scottish | 177 | 1.0% |
| Serbian | 10 | 0.1% |
| Sioux | 1 | 0.0% |
| Slovak | 50 | 0.3% |
| Sri Lankan | 20 | 0.1% |
| Subsaharan African | 19 | 0.1% |
| Swedish | 187 | 1.1% |
| Swiss | 212 | 1.2% |
| Ukrainian | 31 | 0.2% |
| Welsh | 106 | 0.6% | View All 46 Rows |
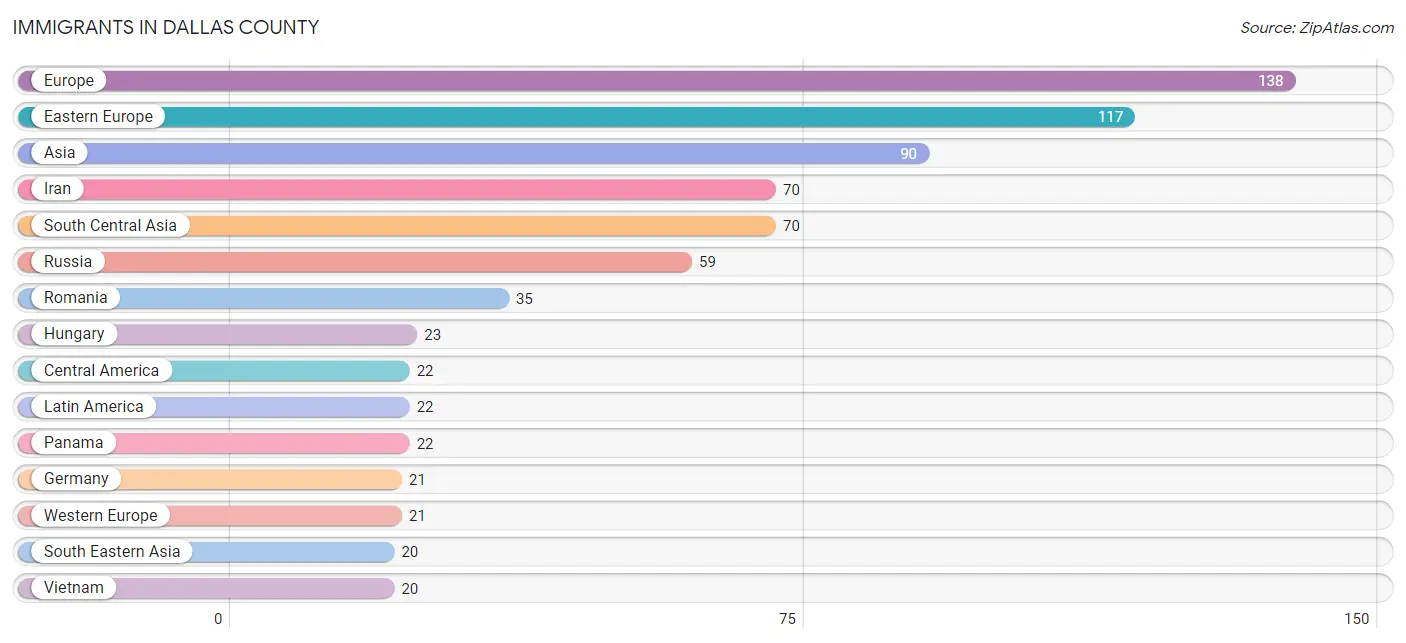
Immigrants in Dallas County
The most numerous immigrant groups reported in Dallas County came from Europe (138 | 0.8%), Eastern Europe (117 | 0.7%), Asia (90 | 0.5%), Iran (70 | 0.4%), and South Central Asia (70 | 0.4%), together accounting for 2.8% of all Dallas County residents.
| Immigration Origin | # Population | % Population |
| Asia | 90 | 0.5% |
| Central America | 22 | 0.1% |
| Eastern Europe | 117 | 0.7% |
| Europe | 138 | 0.8% |
| Germany | 21 | 0.1% |
| Hungary | 23 | 0.1% |
| Iran | 70 | 0.4% |
| Latin America | 22 | 0.1% |
| Panama | 22 | 0.1% |
| Romania | 35 | 0.2% |
| Russia | 59 | 0.3% |
| South Central Asia | 70 | 0.4% |
| South Eastern Asia | 20 | 0.1% |
| Vietnam | 20 | 0.1% |
| Western Europe | 21 | 0.1% | View All 15 Rows |
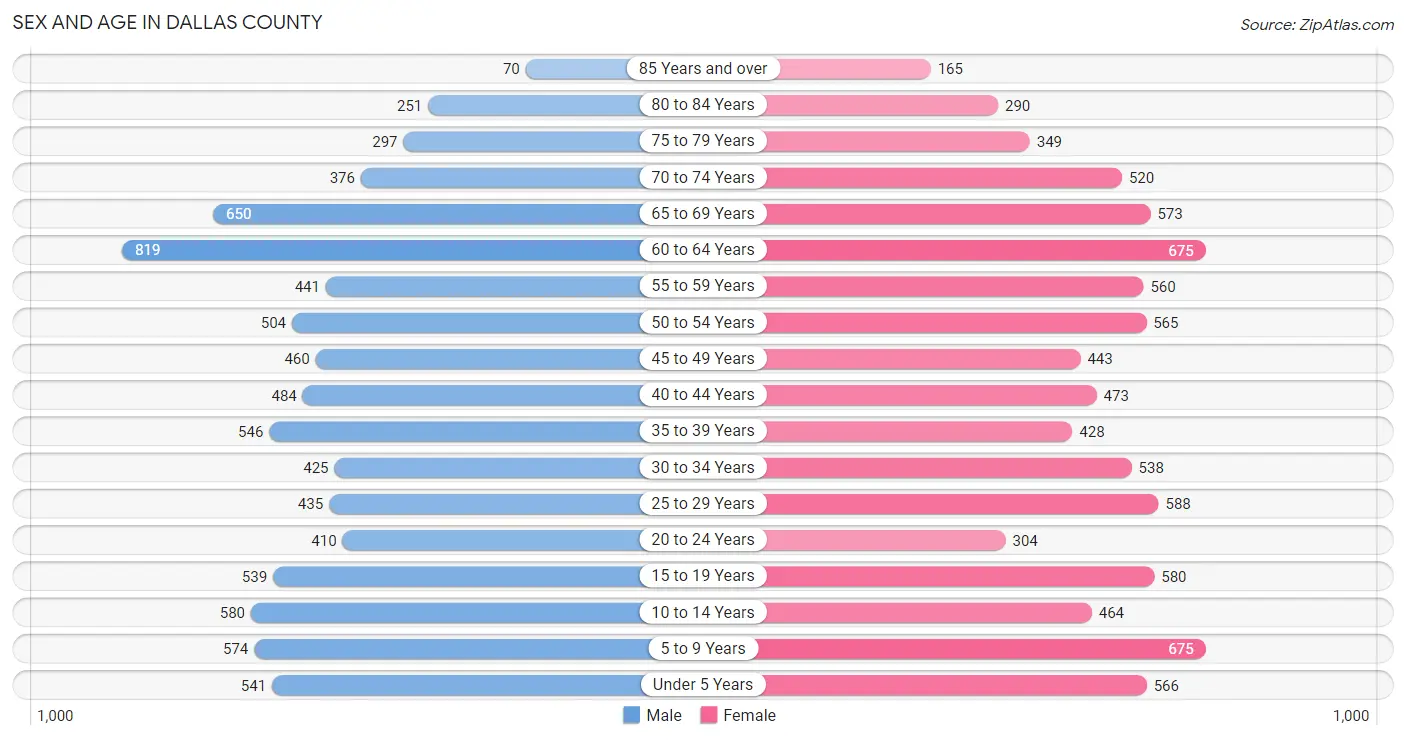
Sex and Age in Dallas County
Sex and Age in Dallas County
The most populous age groups in Dallas County are 60 to 64 Years (819 | 9.8%) for men and 5 to 9 Years (675 | 7.7%) for women.
| Age Bracket | Male | Female |
| Under 5 Years | 541 (6.4%) | 566 (6.5%) |
| 5 to 9 Years | 574 (6.8%) | 675 (7.7%) |
| 10 to 14 Years | 580 (6.9%) | 464 (5.3%) |
| 15 to 19 Years | 539 (6.4%) | 580 (6.6%) |
| 20 to 24 Years | 410 (4.9%) | 304 (3.5%) |
| 25 to 29 Years | 435 (5.2%) | 588 (6.7%) |
| 30 to 34 Years | 425 (5.1%) | 538 (6.1%) |
| 35 to 39 Years | 546 (6.5%) | 428 (4.9%) |
| 40 to 44 Years | 484 (5.8%) | 473 (5.4%) |
| 45 to 49 Years | 460 (5.5%) | 443 (5.1%) |
| 50 to 54 Years | 504 (6.0%) | 565 (6.5%) |
| 55 to 59 Years | 441 (5.2%) | 560 (6.4%) |
| 60 to 64 Years | 819 (9.8%) | 675 (7.7%) |
| 65 to 69 Years | 650 (7.7%) | 573 (6.5%) |
| 70 to 74 Years | 376 (4.5%) | 520 (5.9%) |
| 75 to 79 Years | 297 (3.5%) | 349 (4.0%) |
| 80 to 84 Years | 251 (3.0%) | 290 (3.3%) |
| 85 Years and over | 70 (0.8%) | 165 (1.9%) |
| Total | 8,402 (100.0%) | 8,756 (100.0%) |
Families and Households in Dallas County
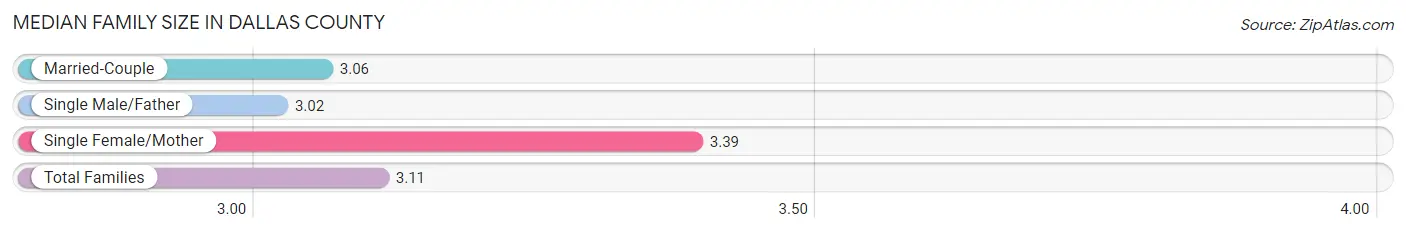
Median Family Size in Dallas County
The median family size in Dallas County is 3.11 persons per family, with single female/mother families (707 | 15.1%) accounting for the largest median family size of 3.39 persons per family. On the other hand, single male/father families (200 | 4.3%) represent the smallest median family size with 3.02 persons per family.
| Family Type | # Families | Family Size |
| Married-Couple | 3,777 (80.6%) | 3.06 |
| Single Male/Father | 200 (4.3%) | 3.02 |
| Single Female/Mother | 707 (15.1%) | 3.39 |
| Total Families | 4,684 (100.0%) | 3.11 |
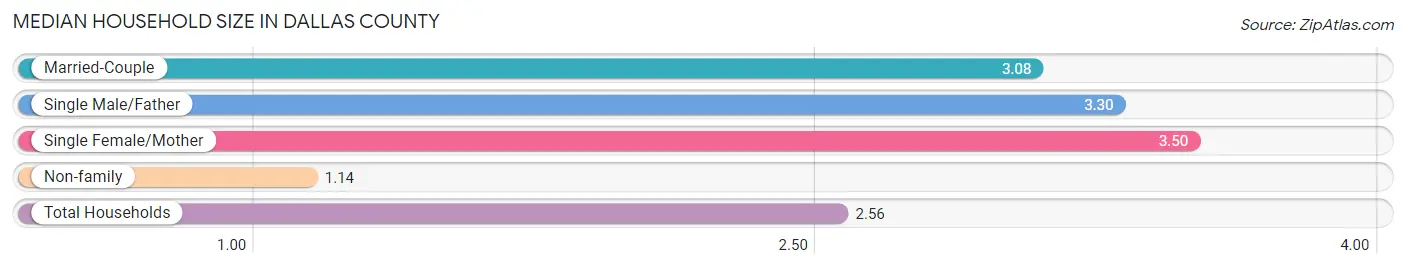
Median Household Size in Dallas County
The median household size in Dallas County is 2.56 persons per household, with single female/mother households (707 | 10.7%) accounting for the largest median household size of 3.5 persons per household. non-family households (1,920 | 29.1%) represent the smallest median household size with 1.14 persons per household.
| Household Type | # Households | Household Size |
| Married-Couple | 3,777 (57.2%) | 3.08 |
| Single Male/Father | 200 (3.0%) | 3.30 |
| Single Female/Mother | 707 (10.7%) | 3.50 |
| Non-family | 1,920 (29.1%) | 1.14 |
| Total Households | 6,604 (100.0%) | 2.56 |
Household Size by Marriage Status in Dallas County
Out of a total of 6,604 households in Dallas County, 4,684 (70.9%) are family households, while 1,920 (29.1%) are nonfamily households. The most numerous type of family households are 2-person households, comprising 2,523, and the most common type of nonfamily households are 1-person households, comprising 1,716.
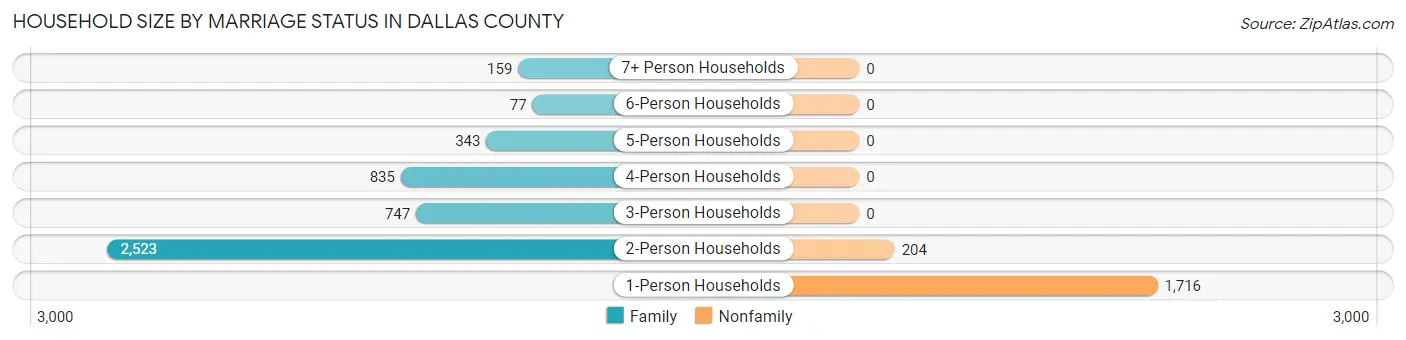
| Household Size | Family Households | Nonfamily Households |
| 1-Person Households | - | 1,716 (26.0%) |
| 2-Person Households | 2,523 (38.2%) | 204 (3.1%) |
| 3-Person Households | 747 (11.3%) | 0 (0.0%) |
| 4-Person Households | 835 (12.6%) | 0 (0.0%) |
| 5-Person Households | 343 (5.2%) | 0 (0.0%) |
| 6-Person Households | 77 (1.2%) | 0 (0.0%) |
| 7+ Person Households | 159 (2.4%) | 0 (0.0%) |
| Total | 4,684 (70.9%) | 1,920 (29.1%) |
Female Fertility in Dallas County
Fertility by Age in Dallas County
Average fertility rate in Dallas County is 110.0 births per 1,000 women. Women in the age bracket of 20 to 34 years have the highest fertility rate with 225.0 births per 1,000 women. Women in the age bracket of 20 to 34 years acount for 84.3% of all women with births.
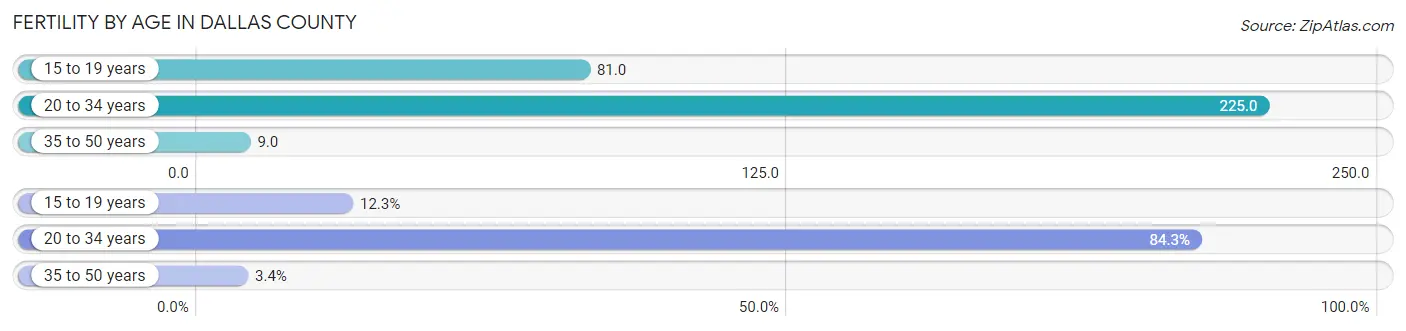
| Age Bracket | Women with Births | Births / 1,000 Women |
| 15 to 19 years | 47 (12.3%) | 81.0 |
| 20 to 34 years | 322 (84.3%) | 225.0 |
| 35 to 50 years | 13 (3.4%) | 9.0 |
| Total | 382 (100.0%) | 110.0 |
Fertility by Age by Marriage Status in Dallas County
62.3% of women with births (382) in Dallas County are married. The highest percentage of unmarried women with births falls into 15 to 19 years age bracket with 97.9% of them unmarried at the time of birth, while the lowest percentage of unmarried women with births belong to 35 to 50 years age bracket with 0.0% of them unmarried.
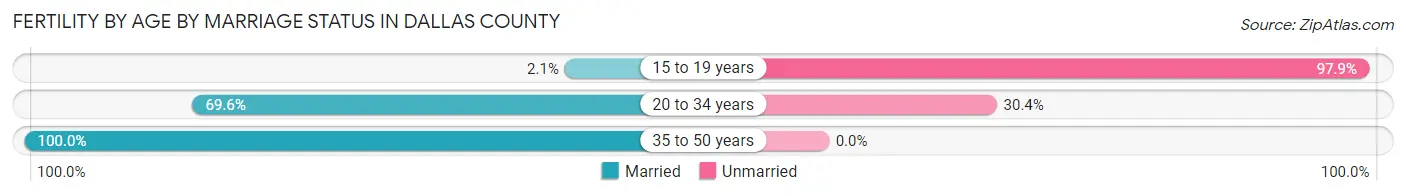
| Age Bracket | Married | Unmarried |
| 15 to 19 years | 1 (2.1%) | 46 (97.9%) |
| 20 to 34 years | 224 (69.6%) | 98 (30.4%) |
| 35 to 50 years | 13 (100.0%) | 0 (0.0%) |
| Total | 238 (62.3%) | 144 (37.7%) |
Fertility by Education in Dallas County
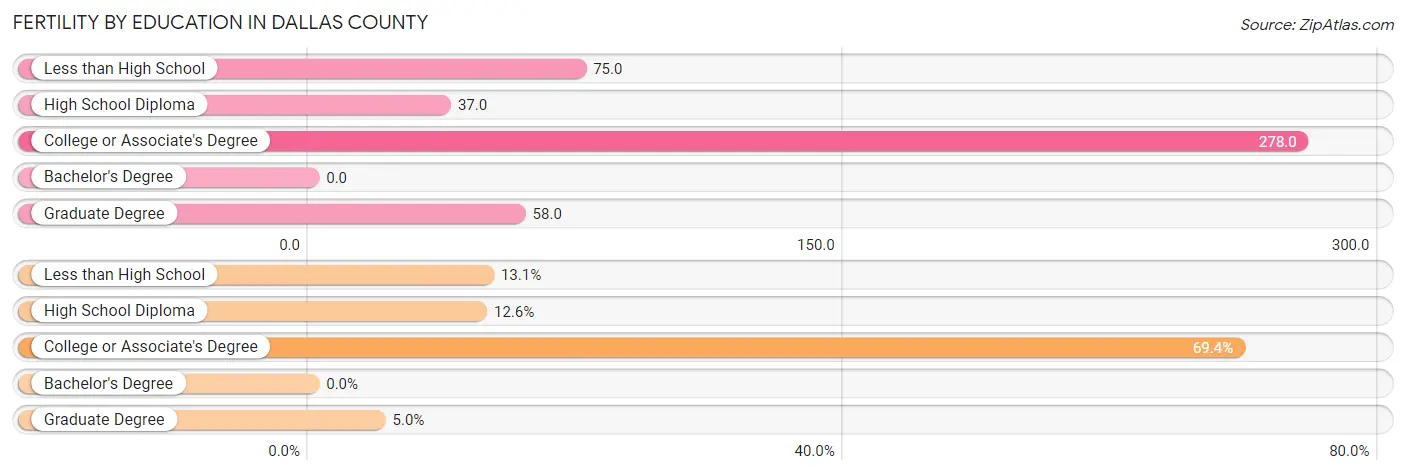
| Educational Attainment | Women with Births | Births / 1,000 Women |
| Less than High School | 50 (13.1%) | 75.0 |
| High School Diploma | 48 (12.6%) | 37.0 |
| College or Associate's Degree | 265 (69.4%) | 278.0 |
| Bachelor's Degree | 0 (0.0%) | 0.0 |
| Graduate Degree | 19 (5.0%) | 58.0 |
| Total | 382 (100.0%) | 110.0 |
Fertility by Education by Marriage Status in Dallas County
37.7% of women with births in Dallas County are unmarried. Women with the educational attainment of high school diploma are most likely to be married with 100.0% of them married at childbirth, while women with the educational attainment of less than high school are least likely to be married with 92.0% of them unmarried at childbirth.
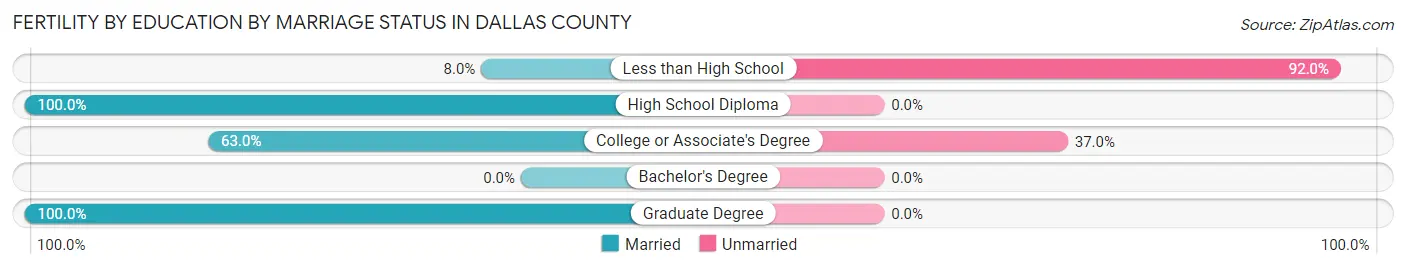
| Educational Attainment | Married | Unmarried |
| Less than High School | 4 (8.0%) | 46 (92.0%) |
| High School Diploma | 48 (100.0%) | 0 (0.0%) |
| College or Associate's Degree | 167 (63.0%) | 98 (37.0%) |
| Bachelor's Degree | 0 (0.0%) | 0 (0.0%) |
| Graduate Degree | 19 (100.0%) | 0 (0.0%) |
| Total | 238 (62.3%) | 144 (37.7%) |
Employment Characteristics in Dallas County
Employment by Class of Employer in Dallas County
Among the 6,291 employed individuals in Dallas County, private company employees (4,120 | 65.5%), not-for-profit organizations (687 | 10.9%), and self-employed (not incorporated) (622 | 9.9%) make up the most common classes of employment.
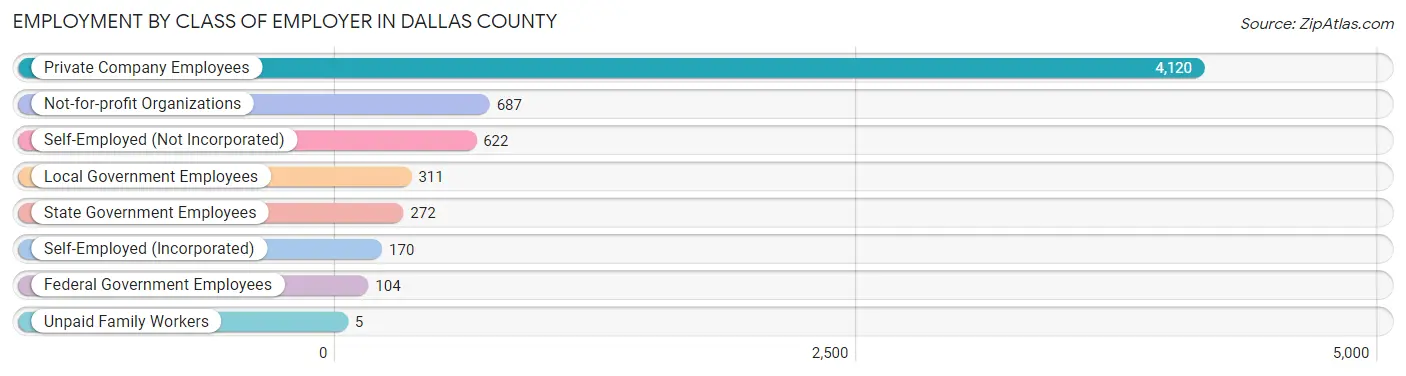
| Employer Class | # Employees | % Employees |
| Private Company Employees | 4,120 | 65.5% |
| Self-Employed (Incorporated) | 170 | 2.7% |
| Self-Employed (Not Incorporated) | 622 | 9.9% |
| Not-for-profit Organizations | 687 | 10.9% |
| Local Government Employees | 311 | 4.9% |
| State Government Employees | 272 | 4.3% |
| Federal Government Employees | 104 | 1.7% |
| Unpaid Family Workers | 5 | 0.1% |
| Total | 6,291 | 100.0% |
Employment Status by Age in Dallas County
According to the labor force statistics for Dallas County, out of the total population over 16 years of age (13,480), 50.6% or 6,821 individuals are in the labor force, with 4.9% or 334 of them unemployed. The age group with the highest labor force participation rate is 30 to 34 years, with 82.1% or 791 individuals in the labor force. Within the labor force, the 16 to 19 years age range has the highest percentage of unemployed individuals, with 31.6% or 114 of them being unemployed.
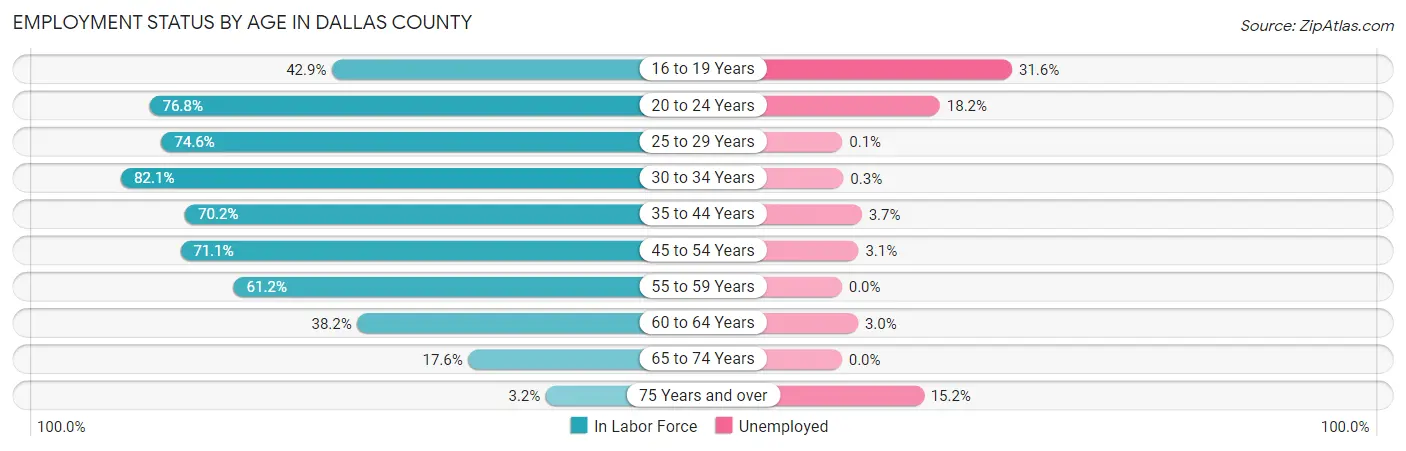
| Age Bracket | In Labor Force | Unemployed |
| 16 to 19 Years | 361 (42.9%) | 114 (31.6%) |
| 20 to 24 Years | 548 (76.8%) | 100 (18.2%) |
| 25 to 29 Years | 763 (74.6%) | 1 (0.1%) |
| 30 to 34 Years | 791 (82.1%) | 2 (0.3%) |
| 35 to 44 Years | 1,356 (70.2%) | 50 (3.7%) |
| 45 to 54 Years | 1,402 (71.1%) | 43 (3.1%) |
| 55 to 59 Years | 613 (61.2%) | 0 (0.0%) |
| 60 to 64 Years | 571 (38.2%) | 17 (3.0%) |
| 65 to 74 Years | 373 (17.6%) | 0 (0.0%) |
| 75 Years and over | 46 (3.2%) | 7 (15.2%) |
| Total | 6,821 (50.6%) | 334 (4.9%) |
Employment Status by Educational Attainment in Dallas County
According to labor force statistics for Dallas County, 65.5% of individuals (5,492) out of the total population between 25 and 64 years of age (8,384) are in the labor force, with 2.1% or 115 of them being unemployed. The group with the highest labor force participation rate are those with the educational attainment of bachelor's degree or higher, with 76.6% or 941 individuals in the labor force. Within the labor force, individuals with high school diploma education have the highest percentage of unemployment, with 2.6% or 66 of them being unemployed.
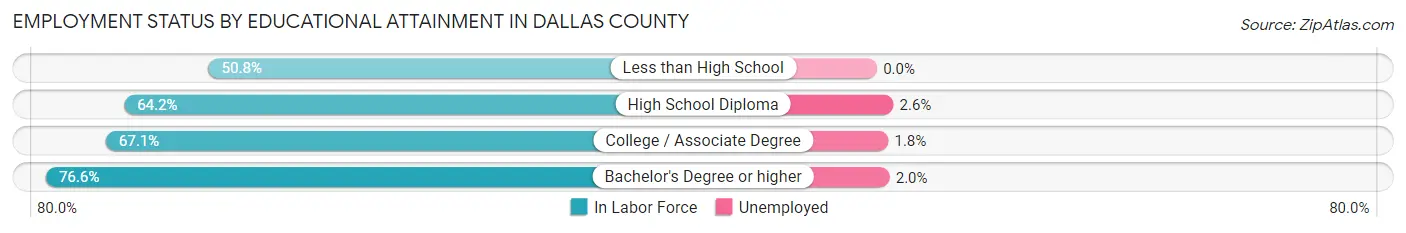
| Educational Attainment | In Labor Force | Unemployed |
| Less than High School | 421 (50.8%) | 0 (0.0%) |
| High School Diploma | 2,524 (64.2%) | 102 (2.6%) |
| College / Associate Degree | 1,606 (67.1%) | 43 (1.8%) |
| Bachelor's Degree or higher | 941 (76.6%) | 25 (2.0%) |
| Total | 5,492 (65.5%) | 176 (2.1%) |
Employment Occupations by Sex in Dallas County
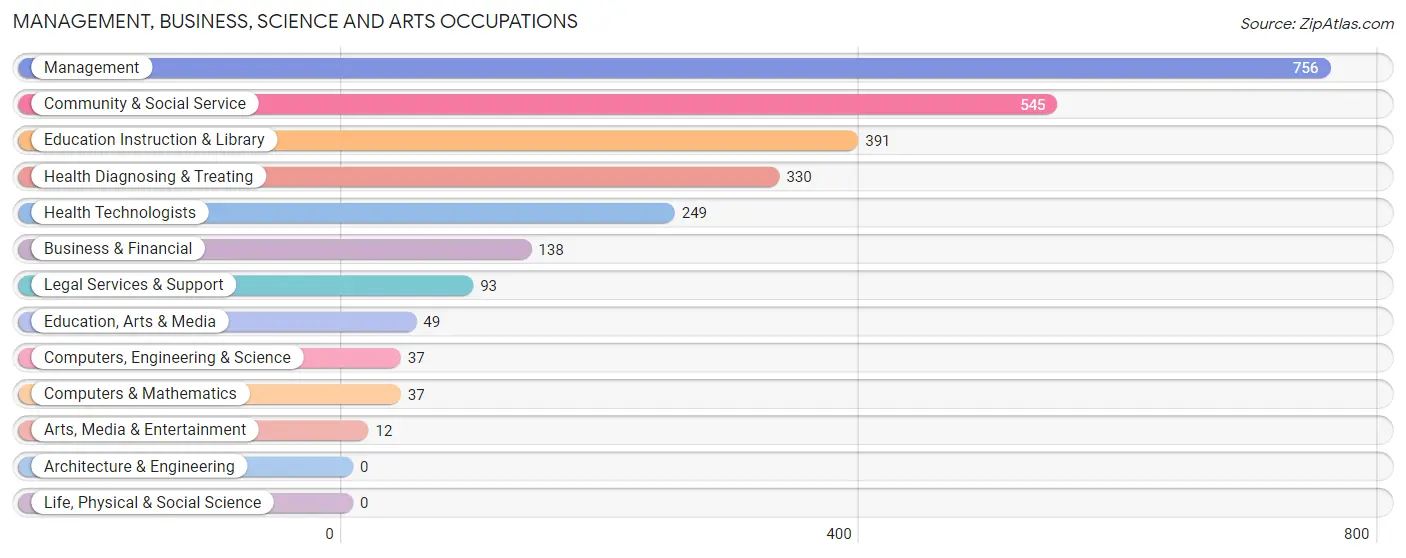
Management, Business, Science and Arts Occupations
The most common Management, Business, Science and Arts occupations in Dallas County are Management (756 | 11.7%), Community & Social Service (545 | 8.5%), Education Instruction & Library (391 | 6.1%), Health Diagnosing & Treating (330 | 5.1%), and Health Technologists (249 | 3.9%).
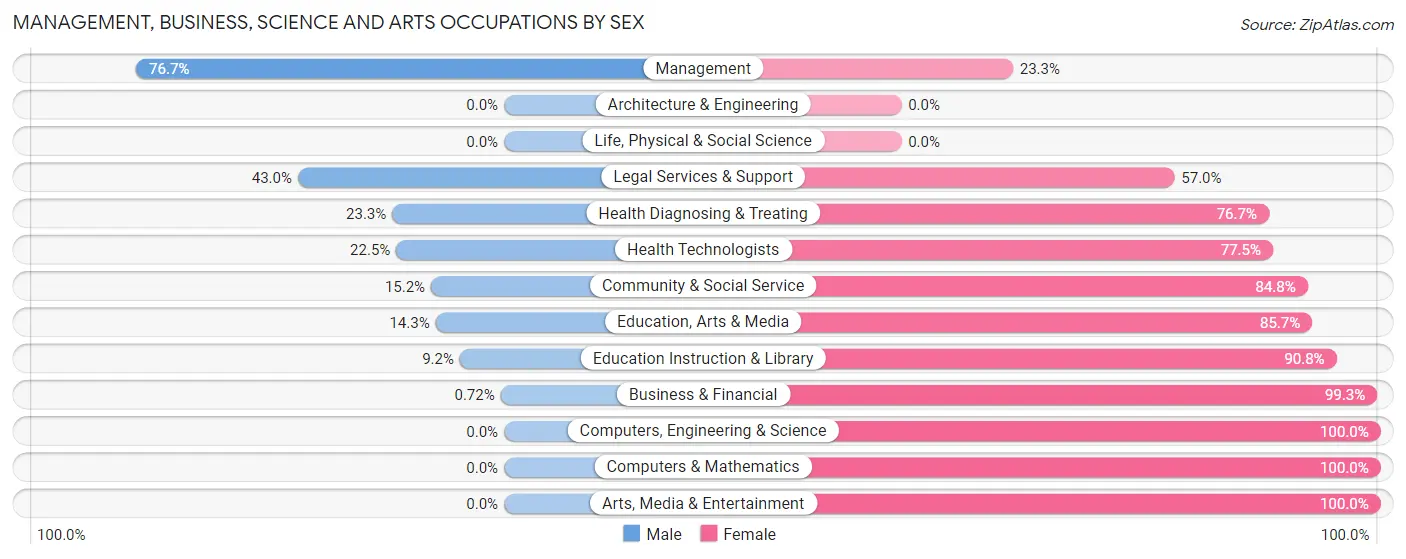
Management, Business, Science and Arts Occupations by Sex
Within the Management, Business, Science and Arts occupations in Dallas County, the most male-oriented occupations are Management (76.7%), Legal Services & Support (43.0%), and Health Diagnosing & Treating (23.3%), while the most female-oriented occupations are Computers, Engineering & Science (100.0%), Computers & Mathematics (100.0%), and Arts, Media & Entertainment (100.0%).
| Occupation | Male | Female |
| Management | 580 (76.7%) | 176 (23.3%) |
| Business & Financial | 1 (0.7%) | 137 (99.3%) |
| Computers, Engineering & Science | 0 (0.0%) | 37 (100.0%) |
| Computers & Mathematics | 0 (0.0%) | 37 (100.0%) |
| Architecture & Engineering | 0 (0.0%) | 0 (0.0%) |
| Life, Physical & Social Science | 0 (0.0%) | 0 (0.0%) |
| Community & Social Service | 83 (15.2%) | 462 (84.8%) |
| Education, Arts & Media | 7 (14.3%) | 42 (85.7%) |
| Legal Services & Support | 40 (43.0%) | 53 (57.0%) |
| Education Instruction & Library | 36 (9.2%) | 355 (90.8%) |
| Arts, Media & Entertainment | 0 (0.0%) | 12 (100.0%) |
| Health Diagnosing & Treating | 77 (23.3%) | 253 (76.7%) |
| Health Technologists | 56 (22.5%) | 193 (77.5%) |
| Total (Category) | 741 (41.0%) | 1,065 (59.0%) |
| Total (Overall) | 3,307 (51.2%) | 3,146 (48.7%) |
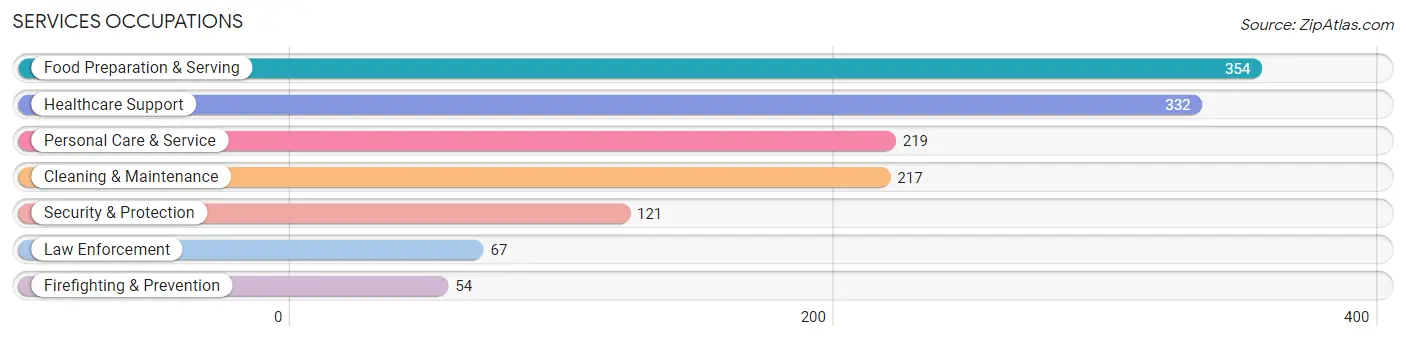
Services Occupations
The most common Services occupations in Dallas County are Food Preparation & Serving (354 | 5.5%), Healthcare Support (332 | 5.1%), Personal Care & Service (219 | 3.4%), Cleaning & Maintenance (217 | 3.4%), and Security & Protection (121 | 1.9%).
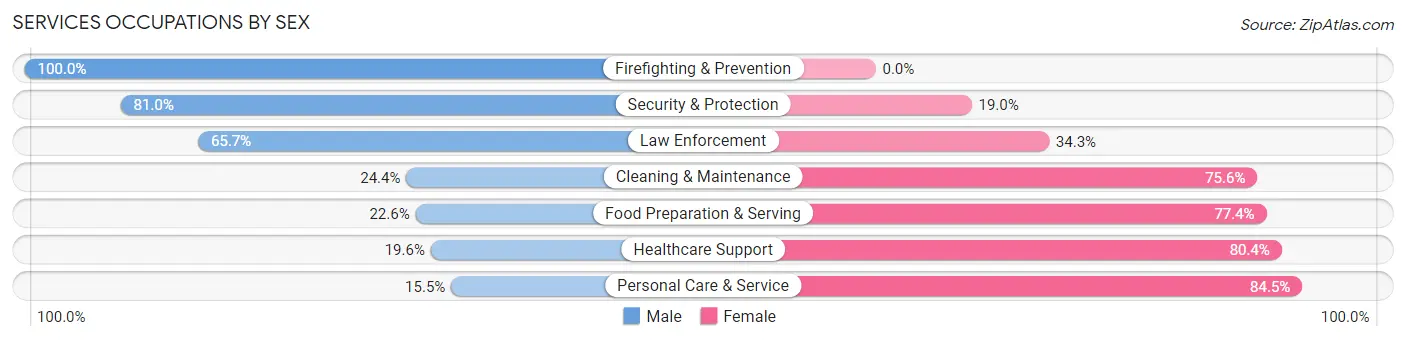
Services Occupations by Sex
Within the Services occupations in Dallas County, the most male-oriented occupations are Firefighting & Prevention (100.0%), Security & Protection (81.0%), and Law Enforcement (65.7%), while the most female-oriented occupations are Personal Care & Service (84.5%), Healthcare Support (80.4%), and Food Preparation & Serving (77.4%).
| Occupation | Male | Female |
| Healthcare Support | 65 (19.6%) | 267 (80.4%) |
| Security & Protection | 98 (81.0%) | 23 (19.0%) |
| Firefighting & Prevention | 54 (100.0%) | 0 (0.0%) |
| Law Enforcement | 44 (65.7%) | 23 (34.3%) |
| Food Preparation & Serving | 80 (22.6%) | 274 (77.4%) |
| Cleaning & Maintenance | 53 (24.4%) | 164 (75.6%) |
| Personal Care & Service | 34 (15.5%) | 185 (84.5%) |
| Total (Category) | 330 (26.6%) | 913 (73.5%) |
| Total (Overall) | 3,307 (51.2%) | 3,146 (48.7%) |
Sales and Office Occupations
The most common Sales and Office occupations in Dallas County are Sales & Related (585 | 9.1%), and Office & Administration (549 | 8.5%).

Sales and Office Occupations by Sex

| Occupation | Male | Female |
| Sales & Related | 183 (31.3%) | 402 (68.7%) |
| Office & Administration | 87 (15.9%) | 462 (84.2%) |
| Total (Category) | 270 (23.8%) | 864 (76.2%) |
| Total (Overall) | 3,307 (51.2%) | 3,146 (48.7%) |
Natural Resources, Construction and Maintenance Occupations
The most common Natural Resources, Construction and Maintenance occupations in Dallas County are Construction & Extraction (385 | 6.0%), Installation, Maintenance & Repair (297 | 4.6%), and Farming, Fishing & Forestry (100 | 1.5%).
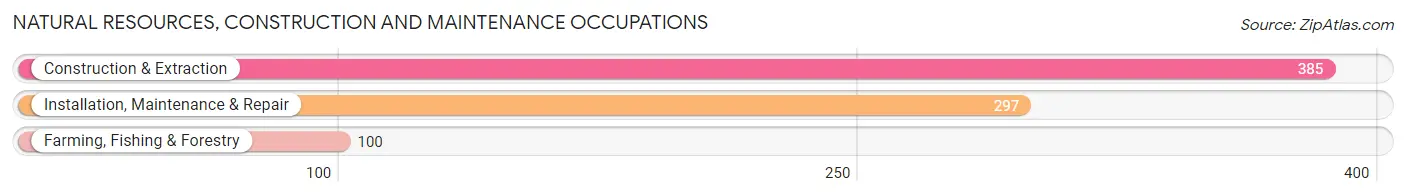
Natural Resources, Construction and Maintenance Occupations by Sex
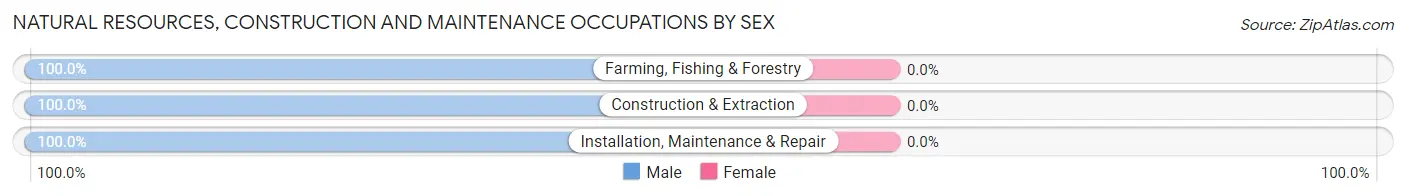
| Occupation | Male | Female |
| Farming, Fishing & Forestry | 100 (100.0%) | 0 (0.0%) |
| Construction & Extraction | 385 (100.0%) | 0 (0.0%) |
| Installation, Maintenance & Repair | 297 (100.0%) | 0 (0.0%) |
| Total (Category) | 782 (100.0%) | 0 (0.0%) |
| Total (Overall) | 3,307 (51.2%) | 3,146 (48.7%) |
Production, Transportation and Moving Occupations
The most common Production, Transportation and Moving occupations in Dallas County are Transportation (541 | 8.4%), Material Moving (488 | 7.6%), and Production (459 | 7.1%).
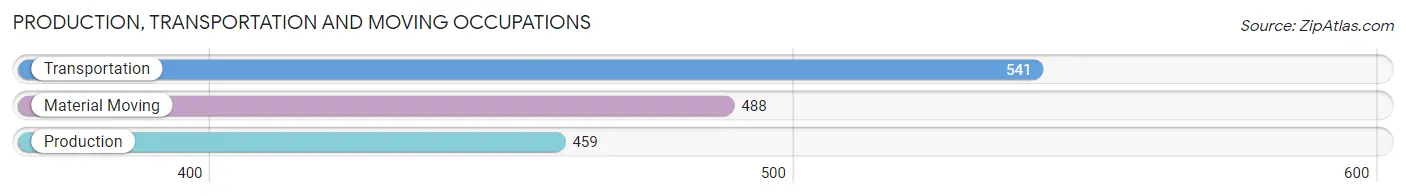
Production, Transportation and Moving Occupations by Sex
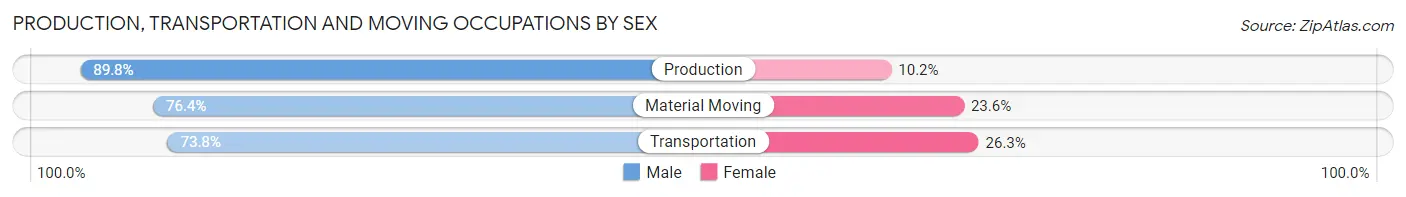
| Occupation | Male | Female |
| Production | 412 (89.8%) | 47 (10.2%) |
| Transportation | 399 (73.8%) | 142 (26.3%) |
| Material Moving | 373 (76.4%) | 115 (23.6%) |
| Total (Category) | 1,184 (79.6%) | 304 (20.4%) |
| Total (Overall) | 3,307 (51.2%) | 3,146 (48.7%) |
Employment Industries by Sex in Dallas County
Employment Industries in Dallas County
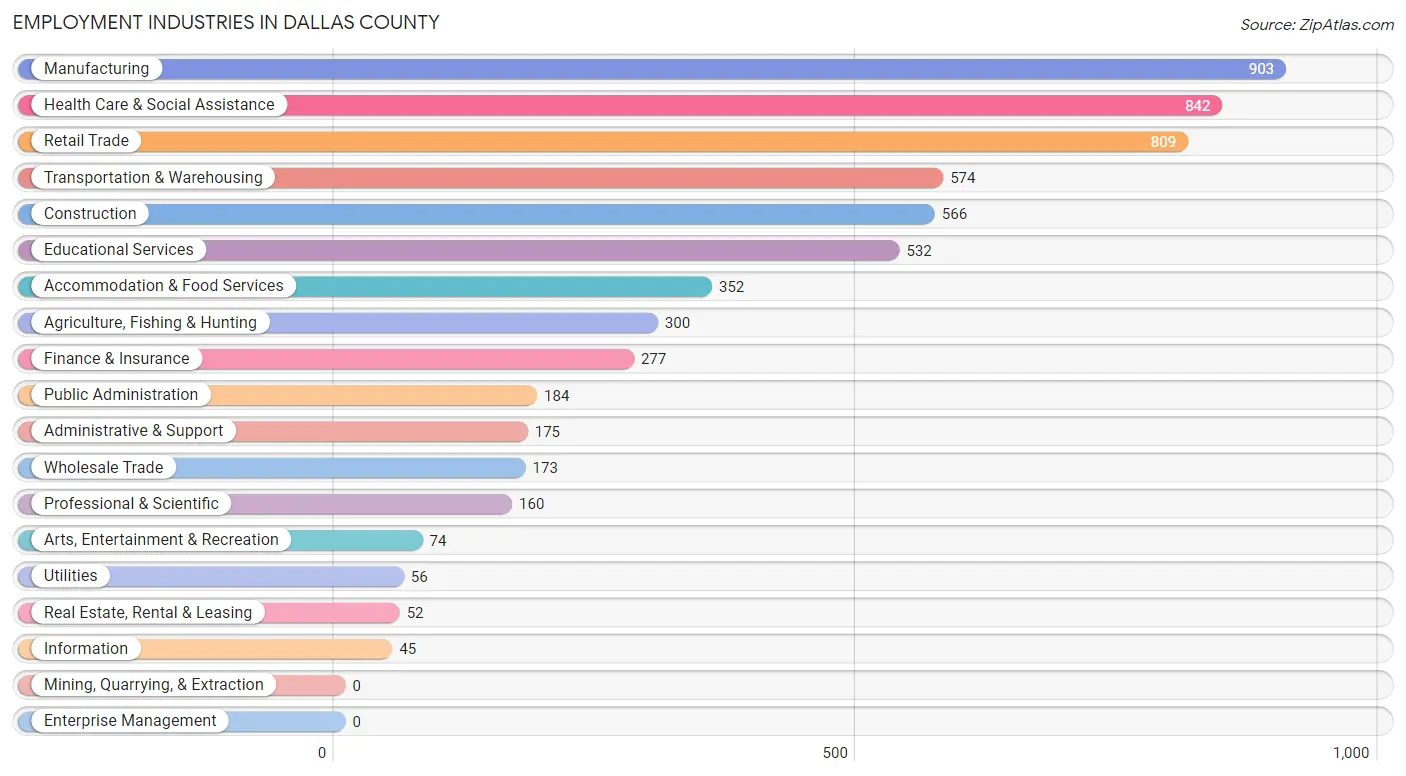
The major employment industries in Dallas County include Manufacturing (903 | 14.0%), Health Care & Social Assistance (842 | 13.1%), Retail Trade (809 | 12.5%), Transportation & Warehousing (574 | 8.9%), and Construction (566 | 8.8%).
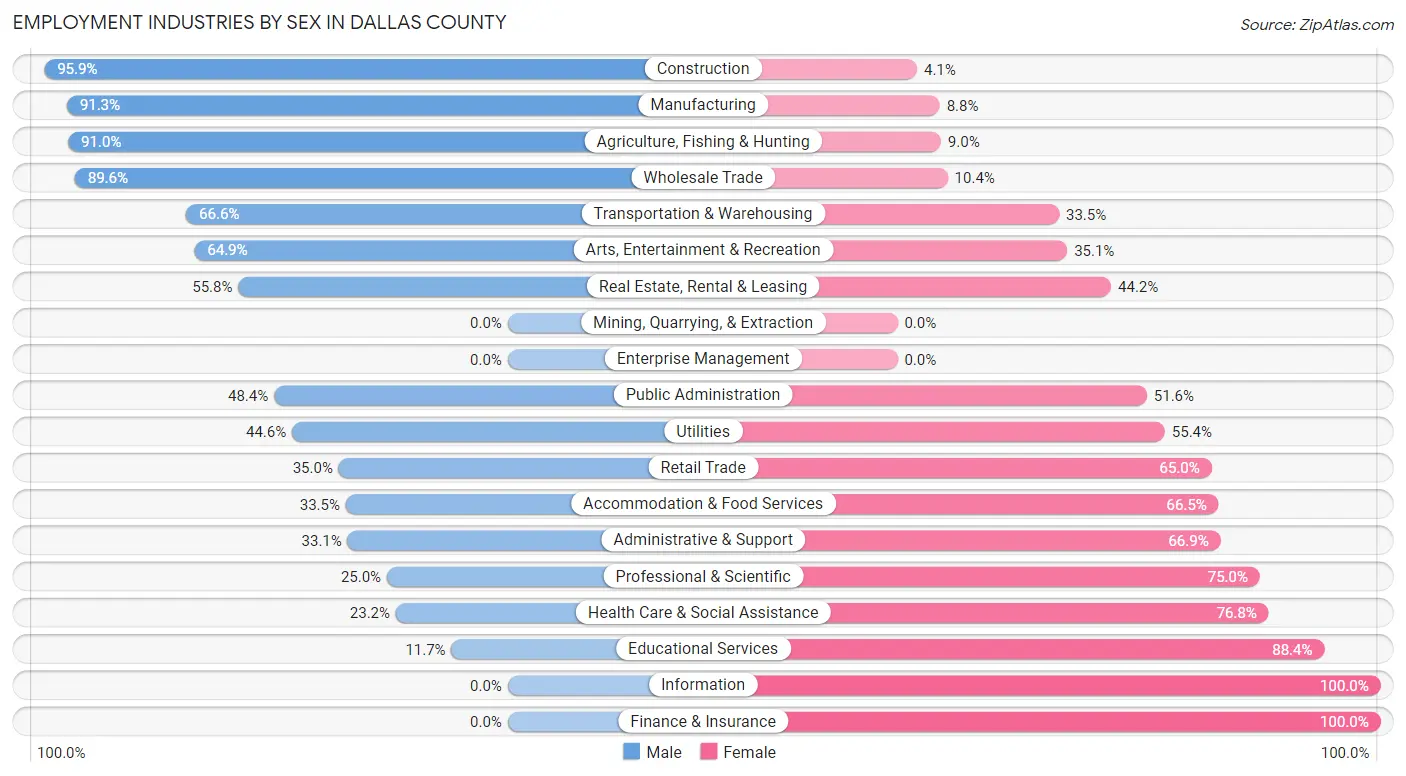
Employment Industries by Sex in Dallas County
The Dallas County industries that see more men than women are Construction (95.9%), Manufacturing (91.2%), and Agriculture, Fishing & Hunting (91.0%), whereas the industries that tend to have a higher number of women are Information (100.0%), Finance & Insurance (100.0%), and Educational Services (88.3%).
| Industry | Male | Female |
| Agriculture, Fishing & Hunting | 273 (91.0%) | 27 (9.0%) |
| Mining, Quarrying, & Extraction | 0 (0.0%) | 0 (0.0%) |
| Construction | 543 (95.9%) | 23 (4.1%) |
| Manufacturing | 824 (91.2%) | 79 (8.7%) |
| Wholesale Trade | 155 (89.6%) | 18 (10.4%) |
| Retail Trade | 283 (35.0%) | 526 (65.0%) |
| Transportation & Warehousing | 382 (66.5%) | 192 (33.5%) |
| Utilities | 25 (44.6%) | 31 (55.4%) |
| Information | 0 (0.0%) | 45 (100.0%) |
| Finance & Insurance | 0 (0.0%) | 277 (100.0%) |
| Real Estate, Rental & Leasing | 29 (55.8%) | 23 (44.2%) |
| Professional & Scientific | 40 (25.0%) | 120 (75.0%) |
| Enterprise Management | 0 (0.0%) | 0 (0.0%) |
| Administrative & Support | 58 (33.1%) | 117 (66.9%) |
| Educational Services | 62 (11.7%) | 470 (88.3%) |
| Health Care & Social Assistance | 195 (23.2%) | 647 (76.8%) |
| Arts, Entertainment & Recreation | 48 (64.9%) | 26 (35.1%) |
| Accommodation & Food Services | 118 (33.5%) | 234 (66.5%) |
| Public Administration | 89 (48.4%) | 95 (51.6%) |
| Total | 3,307 (51.2%) | 3,146 (48.7%) |
Education in Dallas County
School Enrollment in Dallas County
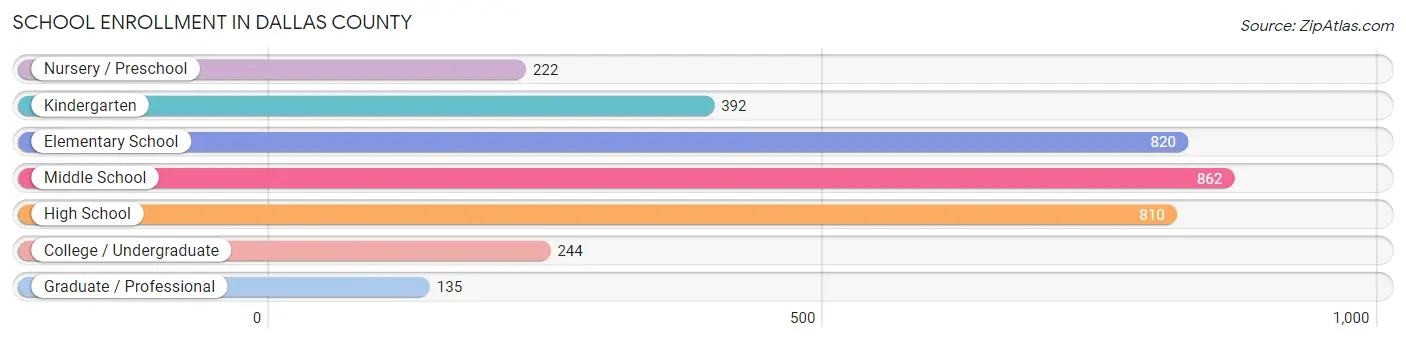
The most common levels of schooling among the 3,485 students in Dallas County are middle school (862 | 24.7%), elementary school (820 | 23.5%), and high school (810 | 23.2%).
| School Level | # Students | % Students |
| Nursery / Preschool | 222 | 6.4% |
| Kindergarten | 392 | 11.3% |
| Elementary School | 820 | 23.5% |
| Middle School | 862 | 24.7% |
| High School | 810 | 23.2% |
| College / Undergraduate | 244 | 7.0% |
| Graduate / Professional | 135 | 3.9% |
| Total | 3,485 | 100.0% |
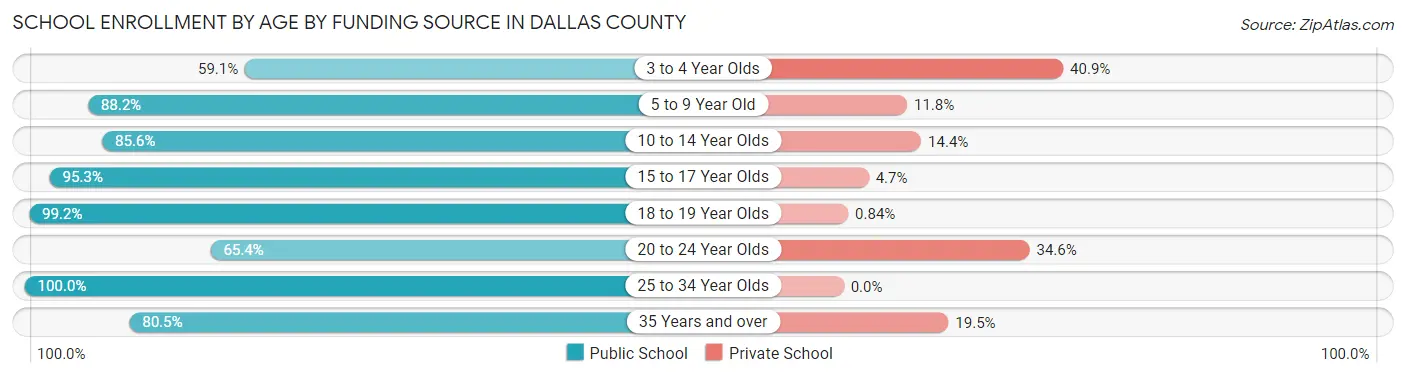
School Enrollment by Age by Funding Source in Dallas County
Out of a total of 3,485 students who are enrolled in schools in Dallas County, 443 (12.7%) attend a private institution, while the remaining 3,042 (87.3%) are enrolled in public schools. The age group of 3 to 4 year olds has the highest likelihood of being enrolled in private schools, with 56 (40.9% in the age bracket) enrolled. Conversely, the age group of 25 to 34 year olds has the lowest likelihood of being enrolled in a private school, with 132 (100.0% in the age bracket) attending a public institution.
| Age Bracket | Public School | Private School |
| 3 to 4 Year Olds | 81 (59.1%) | 56 (40.9%) |
| 5 to 9 Year Old | 1,061 (88.2%) | 142 (11.8%) |
| 10 to 14 Year Olds | 872 (85.6%) | 147 (14.4%) |
| 15 to 17 Year Olds | 593 (95.3%) | 29 (4.7%) |
| 18 to 19 Year Olds | 118 (99.2%) | 1 (0.8%) |
| 20 to 24 Year Olds | 85 (65.4%) | 45 (34.6%) |
| 25 to 34 Year Olds | 132 (100.0%) | 0 (0.0%) |
| 35 Years and over | 99 (80.5%) | 24 (19.5%) |
| Total | 3,042 (87.3%) | 443 (12.7%) |
Educational Attainment by Field of Study in Dallas County
Education (351 | 21.1%), business (282 | 17.0%), science & technology (234 | 14.1%), bio, nature & agricultural (147 | 8.8%), and arts & humanities (130 | 7.8%) are the most common fields of study among 1,663 individuals in Dallas County who have obtained a bachelor's degree or higher.
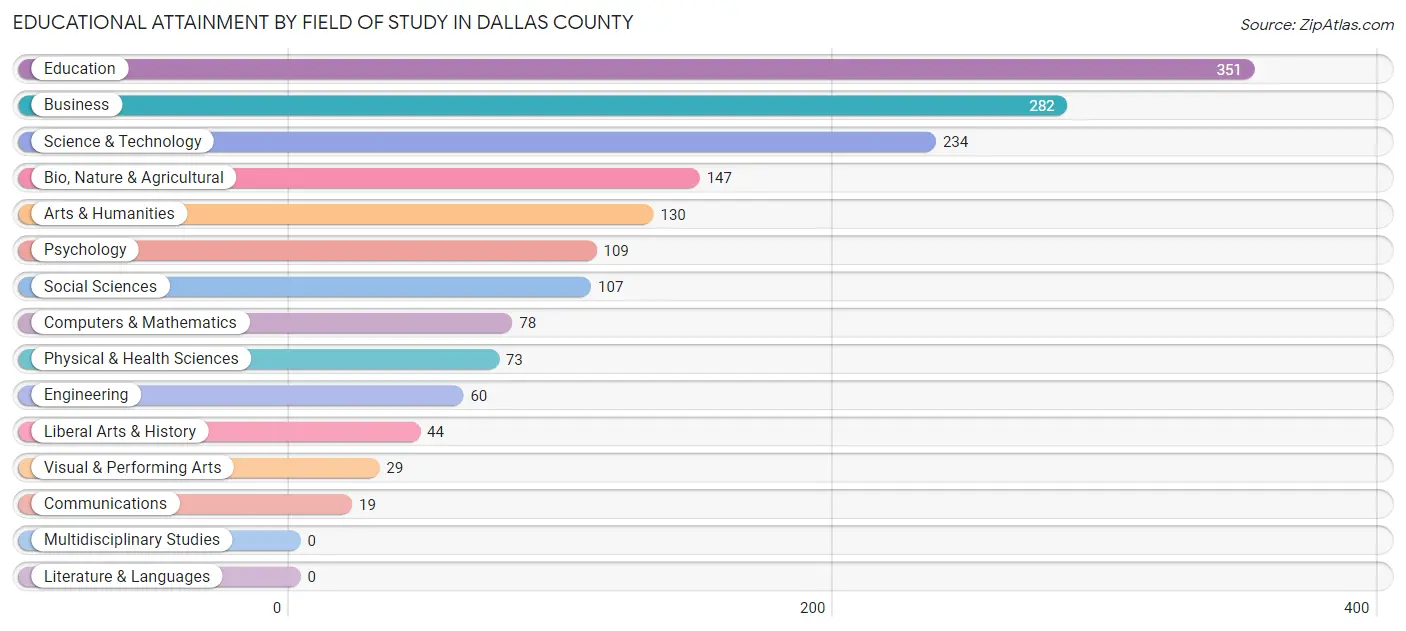
| Field of Study | # Graduates | % Graduates |
| Computers & Mathematics | 78 | 4.7% |
| Bio, Nature & Agricultural | 147 | 8.8% |
| Physical & Health Sciences | 73 | 4.4% |
| Psychology | 109 | 6.6% |
| Social Sciences | 107 | 6.4% |
| Engineering | 60 | 3.6% |
| Multidisciplinary Studies | 0 | 0.0% |
| Science & Technology | 234 | 14.1% |
| Business | 282 | 17.0% |
| Education | 351 | 21.1% |
| Literature & Languages | 0 | 0.0% |
| Liberal Arts & History | 44 | 2.6% |
| Visual & Performing Arts | 29 | 1.7% |
| Communications | 19 | 1.1% |
| Arts & Humanities | 130 | 7.8% |
| Total | 1,663 | 100.0% |
Transportation & Commute in Dallas County
Vehicle Availability by Sex in Dallas County
The most prevalent vehicle ownership categories in Dallas County are males with 2 vehicles (1,083, accounting for 33.0%) and females with 2 vehicles (963, making up 36.0%).
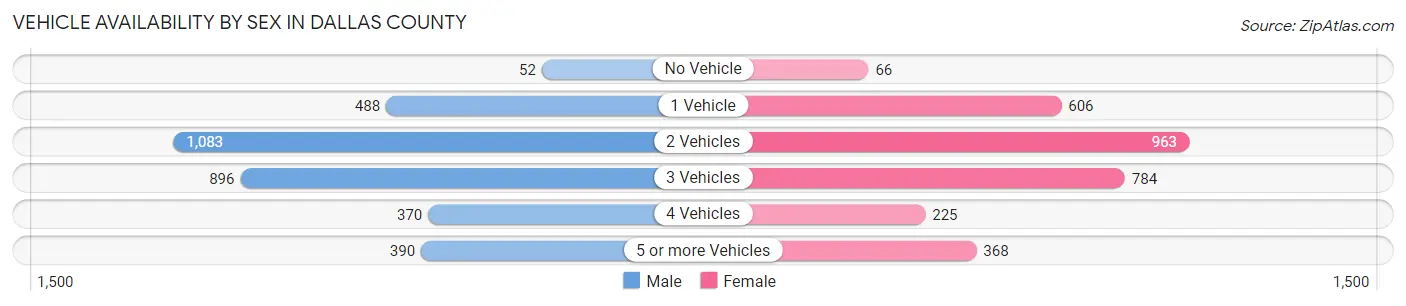
| Vehicles Available | Male | Female |
| No Vehicle | 52 (1.6%) | 66 (2.2%) |
| 1 Vehicle | 488 (14.9%) | 606 (20.1%) |
| 2 Vehicles | 1,083 (33.0%) | 963 (32.0%) |
| 3 Vehicles | 896 (27.3%) | 784 (26.0%) |
| 4 Vehicles | 370 (11.3%) | 225 (7.5%) |
| 5 or more Vehicles | 390 (11.9%) | 368 (12.2%) |
| Total | 3,279 (100.0%) | 3,012 (100.0%) |
Commute Time in Dallas County
The most frequently occuring commute durations in Dallas County are 30 to 34 minutes (863 commuters, 14.9%), 45 to 59 minutes (802 commuters, 13.8%), and 15 to 19 minutes (643 commuters, 11.1%).
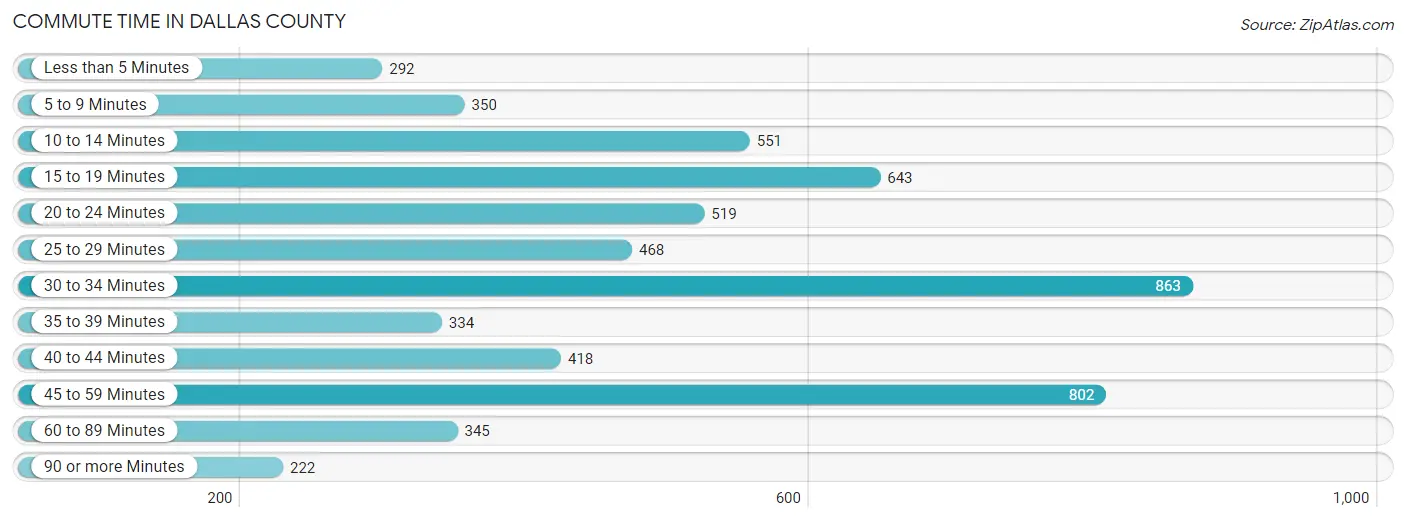
| Commute Time | # Commuters | % Commuters |
| Less than 5 Minutes | 292 | 5.0% |
| 5 to 9 Minutes | 350 | 6.0% |
| 10 to 14 Minutes | 551 | 9.5% |
| 15 to 19 Minutes | 643 | 11.1% |
| 20 to 24 Minutes | 519 | 8.9% |
| 25 to 29 Minutes | 468 | 8.1% |
| 30 to 34 Minutes | 863 | 14.9% |
| 35 to 39 Minutes | 334 | 5.8% |
| 40 to 44 Minutes | 418 | 7.2% |
| 45 to 59 Minutes | 802 | 13.8% |
| 60 to 89 Minutes | 345 | 5.9% |
| 90 or more Minutes | 222 | 3.8% |
Commute Time by Sex in Dallas County
The most common commute times in Dallas County are 30 to 34 minutes (616 commuters, 20.0%) for males and 20 to 24 minutes (392 commuters, 14.3%) for females.
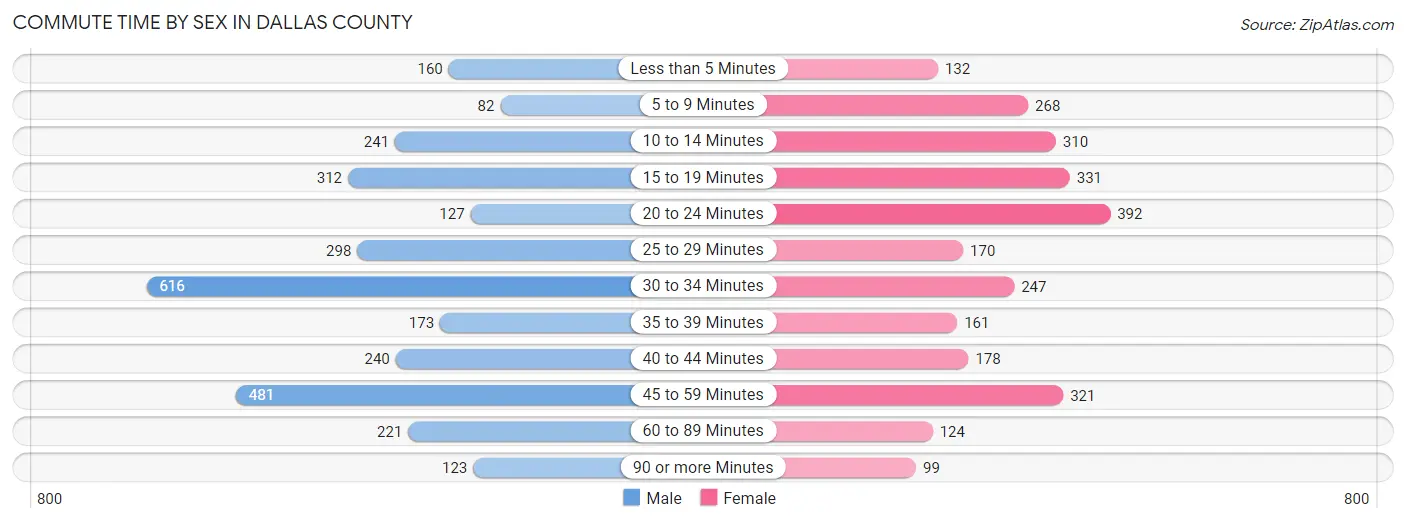
| Commute Time | Male | Female |
| Less than 5 Minutes | 160 (5.2%) | 132 (4.8%) |
| 5 to 9 Minutes | 82 (2.7%) | 268 (9.8%) |
| 10 to 14 Minutes | 241 (7.8%) | 310 (11.3%) |
| 15 to 19 Minutes | 312 (10.2%) | 331 (12.1%) |
| 20 to 24 Minutes | 127 (4.1%) | 392 (14.3%) |
| 25 to 29 Minutes | 298 (9.7%) | 170 (6.2%) |
| 30 to 34 Minutes | 616 (20.0%) | 247 (9.0%) |
| 35 to 39 Minutes | 173 (5.6%) | 161 (5.9%) |
| 40 to 44 Minutes | 240 (7.8%) | 178 (6.5%) |
| 45 to 59 Minutes | 481 (15.7%) | 321 (11.7%) |
| 60 to 89 Minutes | 221 (7.2%) | 124 (4.5%) |
| 90 or more Minutes | 123 (4.0%) | 99 (3.6%) |
Time of Departure to Work by Sex in Dallas County
The most frequent times of departure to work in Dallas County are 6:00 AM to 6:29 AM (711, 23.1%) for males and 7:30 AM to 7:59 AM (482, 17.6%) for females.
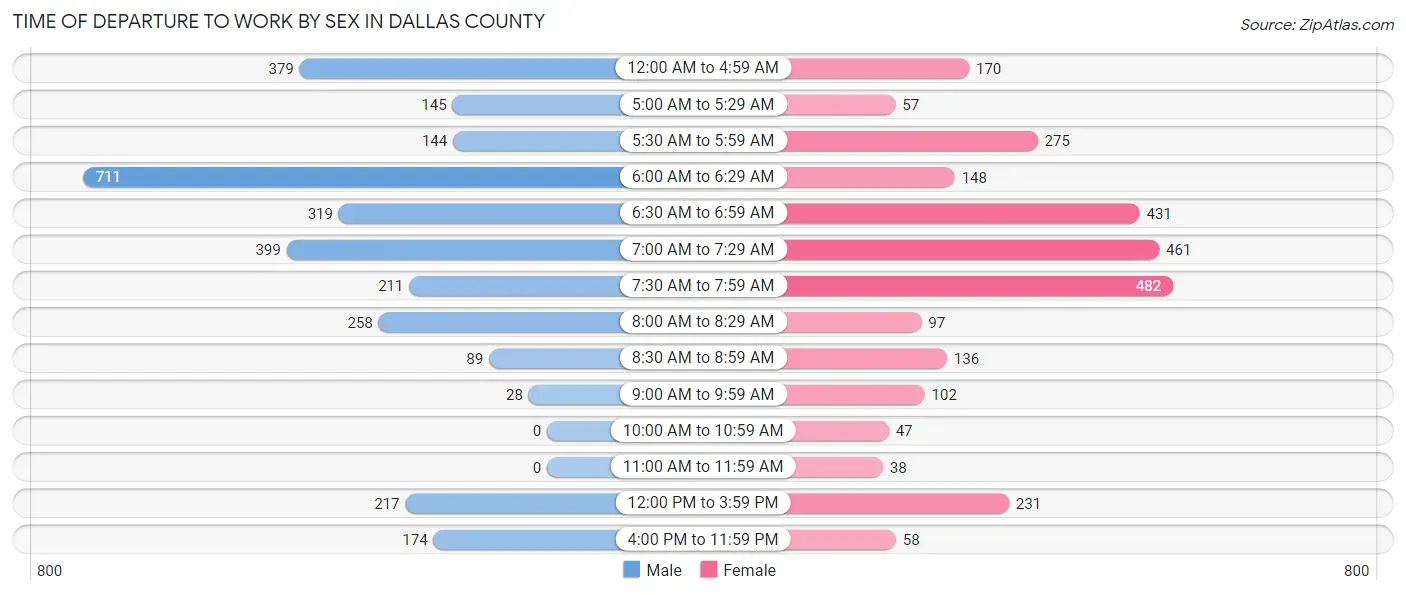
| Time of Departure | Male | Female |
| 12:00 AM to 4:59 AM | 379 (12.3%) | 170 (6.2%) |
| 5:00 AM to 5:29 AM | 145 (4.7%) | 57 (2.1%) |
| 5:30 AM to 5:59 AM | 144 (4.7%) | 275 (10.1%) |
| 6:00 AM to 6:29 AM | 711 (23.1%) | 148 (5.4%) |
| 6:30 AM to 6:59 AM | 319 (10.4%) | 431 (15.8%) |
| 7:00 AM to 7:29 AM | 399 (13.0%) | 461 (16.9%) |
| 7:30 AM to 7:59 AM | 211 (6.9%) | 482 (17.6%) |
| 8:00 AM to 8:29 AM | 258 (8.4%) | 97 (3.5%) |
| 8:30 AM to 8:59 AM | 89 (2.9%) | 136 (5.0%) |
| 9:00 AM to 9:59 AM | 28 (0.9%) | 102 (3.7%) |
| 10:00 AM to 10:59 AM | 0 (0.0%) | 47 (1.7%) |
| 11:00 AM to 11:59 AM | 0 (0.0%) | 38 (1.4%) |
| 12:00 PM to 3:59 PM | 217 (7.1%) | 231 (8.5%) |
| 4:00 PM to 11:59 PM | 174 (5.7%) | 58 (2.1%) |
| Total | 3,074 (100.0%) | 2,733 (100.0%) |
Housing Occupancy in Dallas County
Occupancy by Ownership in Dallas County
Of the total 6,604 dwellings in Dallas County, owner-occupied units account for 4,994 (75.6%), while renter-occupied units make up 1,610 (24.4%).
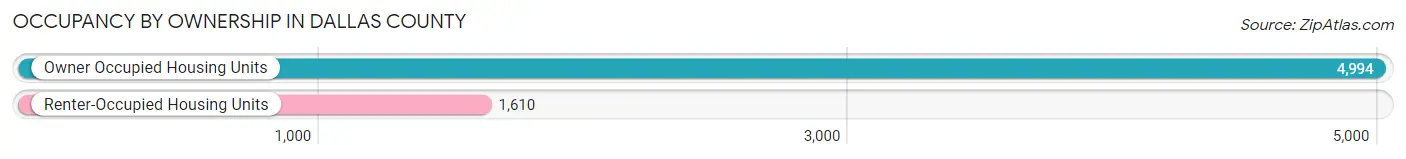
| Occupancy | # Housing Units | % Housing Units |
| Owner Occupied Housing Units | 4,994 | 75.6% |
| Renter-Occupied Housing Units | 1,610 | 24.4% |
| Total Occupied Housing Units | 6,604 | 100.0% |
Occupancy by Household Size in Dallas County
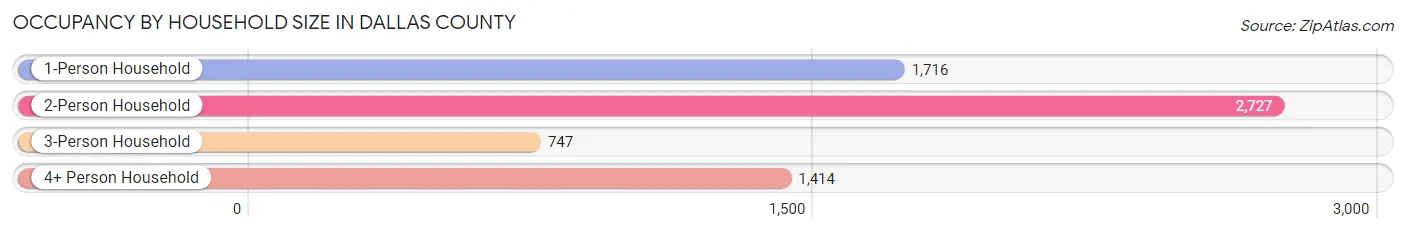
| Household Size | # Housing Units | % Housing Units |
| 1-Person Household | 1,716 | 26.0% |
| 2-Person Household | 2,727 | 41.3% |
| 3-Person Household | 747 | 11.3% |
| 4+ Person Household | 1,414 | 21.4% |
| Total Housing Units | 6,604 | 100.0% |
Occupancy by Ownership by Household Size in Dallas County
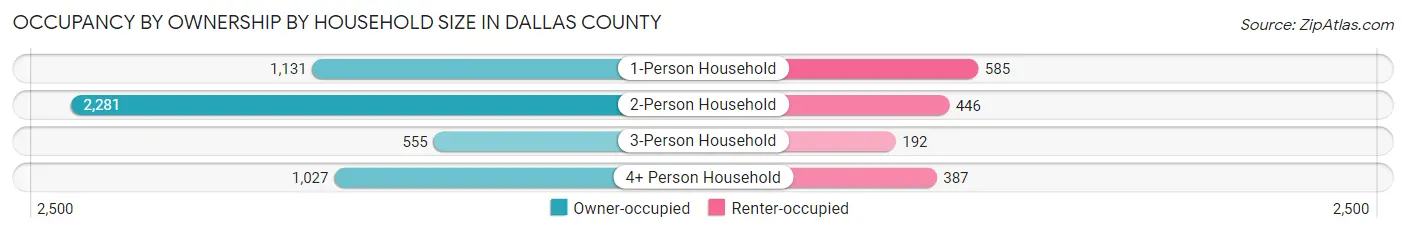
| Household Size | Owner-occupied | Renter-occupied |
| 1-Person Household | 1,131 (65.9%) | 585 (34.1%) |
| 2-Person Household | 2,281 (83.7%) | 446 (16.4%) |
| 3-Person Household | 555 (74.3%) | 192 (25.7%) |
| 4+ Person Household | 1,027 (72.6%) | 387 (27.4%) |
| Total Housing Units | 4,994 (75.6%) | 1,610 (24.4%) |
Occupancy by Educational Attainment in Dallas County
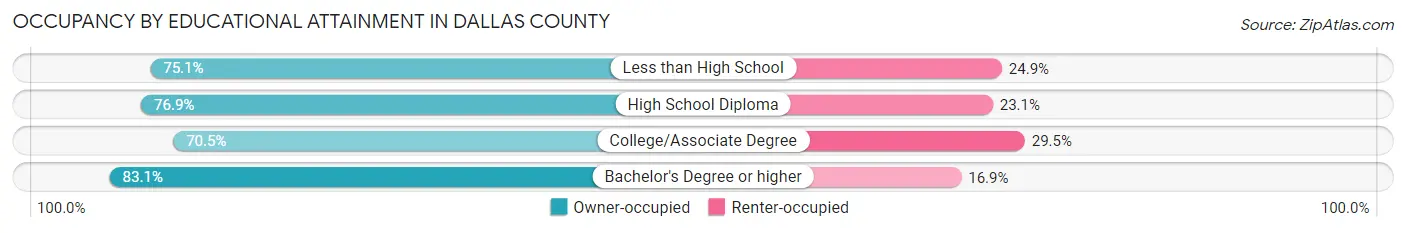
| Household Size | Owner-occupied | Renter-occupied |
| Less than High School | 509 (75.1%) | 169 (24.9%) |
| High School Diploma | 2,334 (76.9%) | 702 (23.1%) |
| College/Associate Degree | 1,407 (70.5%) | 588 (29.5%) |
| Bachelor's Degree or higher | 744 (83.1%) | 151 (16.9%) |
Occupancy by Age of Householder in Dallas County
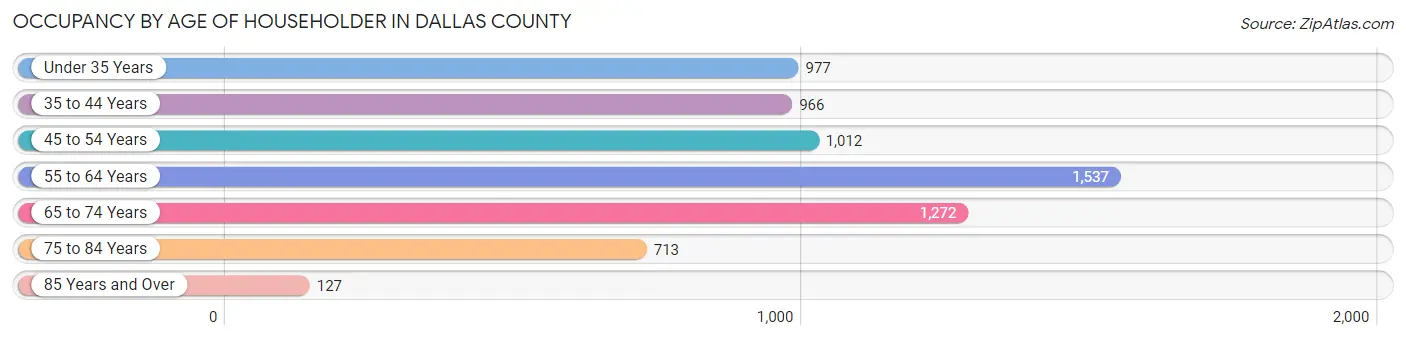
| Age Bracket | # Households | % Households |
| Under 35 Years | 977 | 14.8% |
| 35 to 44 Years | 966 | 14.6% |
| 45 to 54 Years | 1,012 | 15.3% |
| 55 to 64 Years | 1,537 | 23.3% |
| 65 to 74 Years | 1,272 | 19.3% |
| 75 to 84 Years | 713 | 10.8% |
| 85 Years and Over | 127 | 1.9% |
| Total | 6,604 | 100.0% |
Housing Finances in Dallas County
Median Income by Occupancy in Dallas County
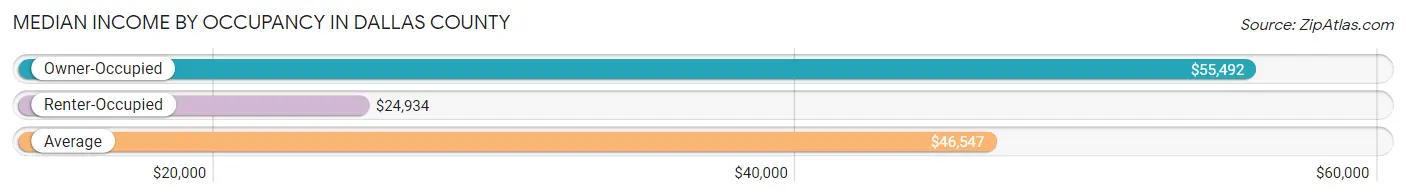
| Occupancy Type | # Households | Median Income |
| Owner-Occupied | 4,994 (75.6%) | $55,492 |
| Renter-Occupied | 1,610 (24.4%) | $24,934 |
| Average | 6,604 (100.0%) | $46,547 |
Occupancy by Householder Income Bracket in Dallas County
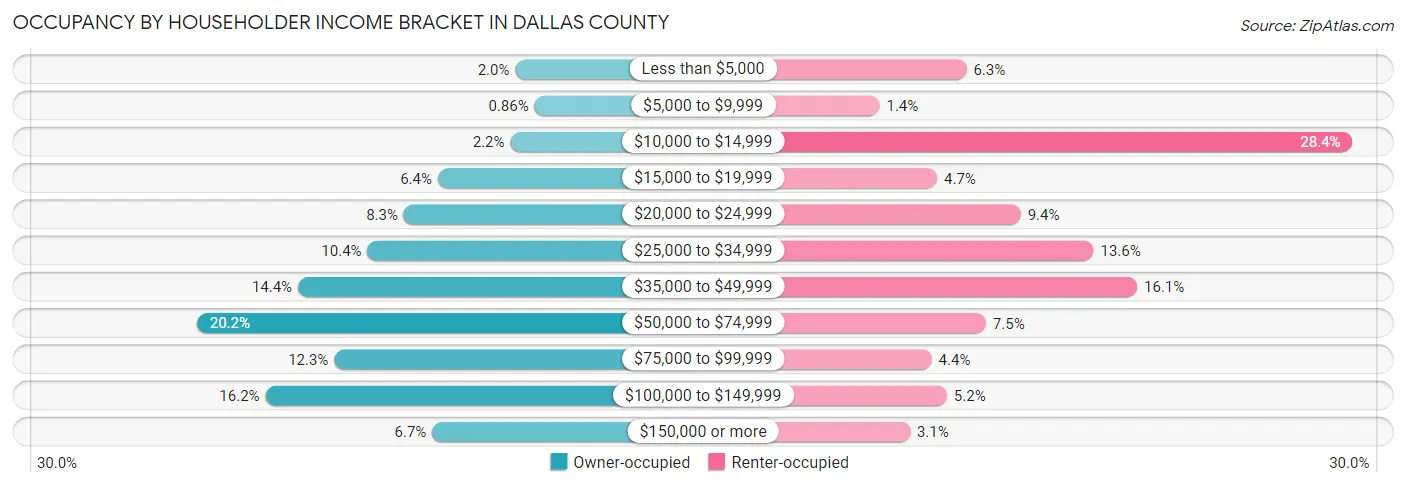
| Income Bracket | Owner-occupied | Renter-occupied |
| Less than $5,000 | 98 (2.0%) | 102 (6.3%) |
| $5,000 to $9,999 | 43 (0.9%) | 22 (1.4%) |
| $10,000 to $14,999 | 112 (2.2%) | 457 (28.4%) |
| $15,000 to $19,999 | 319 (6.4%) | 75 (4.7%) |
| $20,000 to $24,999 | 416 (8.3%) | 152 (9.4%) |
| $25,000 to $34,999 | 520 (10.4%) | 219 (13.6%) |
| $35,000 to $49,999 | 718 (14.4%) | 259 (16.1%) |
| $50,000 to $74,999 | 1,007 (20.2%) | 120 (7.4%) |
| $75,000 to $99,999 | 615 (12.3%) | 70 (4.3%) |
| $100,000 to $149,999 | 811 (16.2%) | 84 (5.2%) |
| $150,000 or more | 335 (6.7%) | 50 (3.1%) |
| Total | 4,994 (100.0%) | 1,610 (100.0%) |
Monthly Housing Cost Tiers in Dallas County
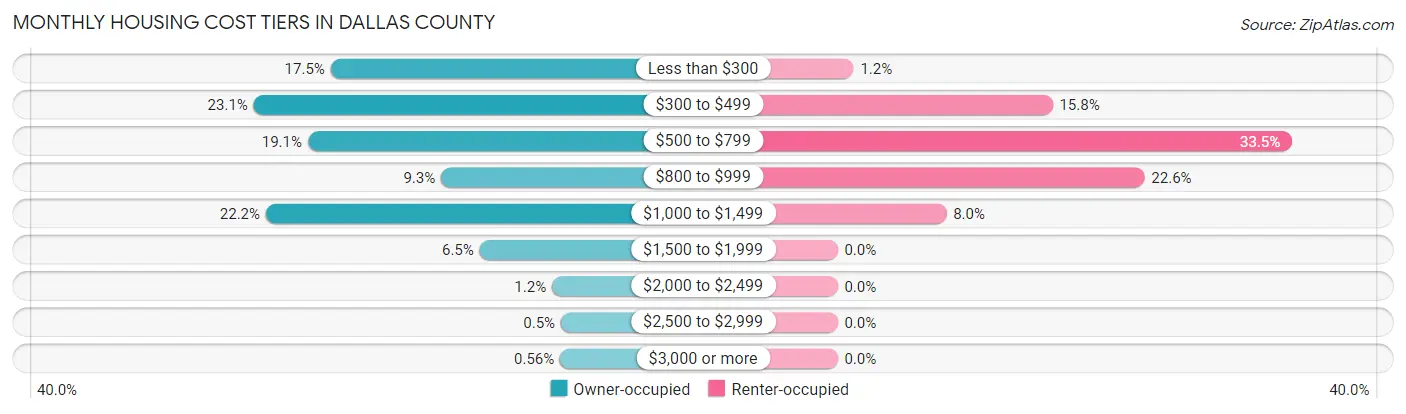
| Monthly Cost | Owner-occupied | Renter-occupied |
| Less than $300 | 872 (17.5%) | 19 (1.2%) |
| $300 to $499 | 1,155 (23.1%) | 255 (15.8%) |
| $500 to $799 | 956 (19.1%) | 539 (33.5%) |
| $800 to $999 | 466 (9.3%) | 364 (22.6%) |
| $1,000 to $1,499 | 1,110 (22.2%) | 129 (8.0%) |
| $1,500 to $1,999 | 324 (6.5%) | 0 (0.0%) |
| $2,000 to $2,499 | 58 (1.2%) | 0 (0.0%) |
| $2,500 to $2,999 | 25 (0.5%) | 0 (0.0%) |
| $3,000 or more | 28 (0.6%) | 0 (0.0%) |
| Total | 4,994 (100.0%) | 1,610 (100.0%) |
Physical Housing Characteristics in Dallas County
Housing Structures in Dallas County
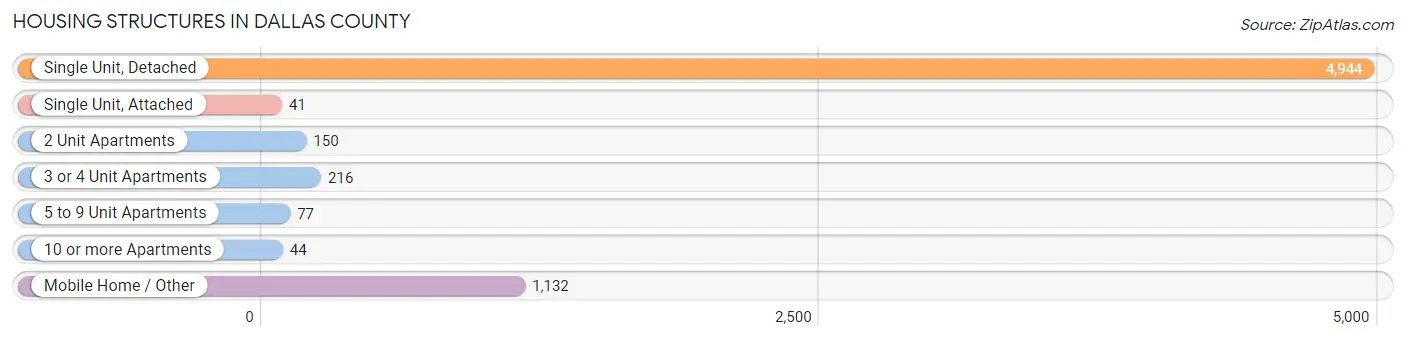
| Structure Type | # Housing Units | % Housing Units |
| Single Unit, Detached | 4,944 | 74.9% |
| Single Unit, Attached | 41 | 0.6% |
| 2 Unit Apartments | 150 | 2.3% |
| 3 or 4 Unit Apartments | 216 | 3.3% |
| 5 to 9 Unit Apartments | 77 | 1.2% |
| 10 or more Apartments | 44 | 0.7% |
| Mobile Home / Other | 1,132 | 17.1% |
| Total | 6,604 | 100.0% |
Housing Structures by Occupancy in Dallas County
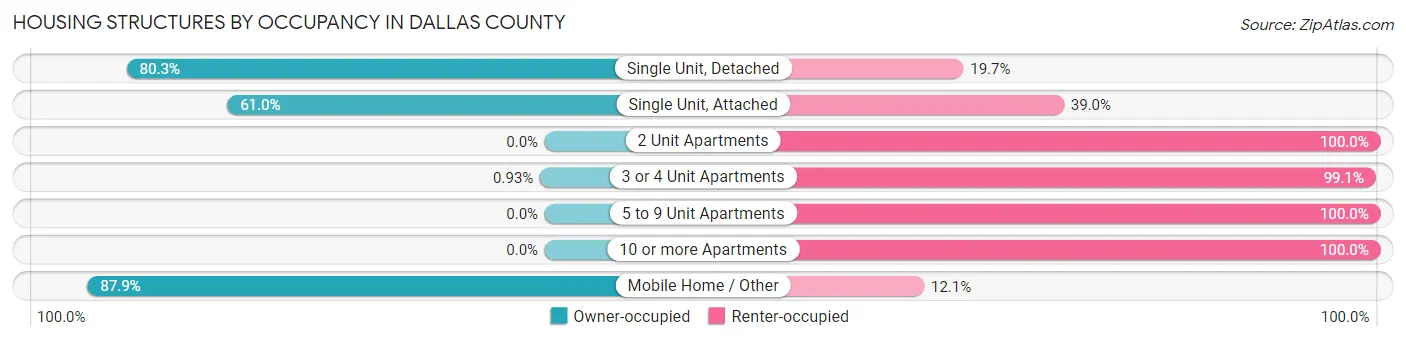
| Structure Type | Owner-occupied | Renter-occupied |
| Single Unit, Detached | 3,972 (80.3%) | 972 (19.7%) |
| Single Unit, Attached | 25 (61.0%) | 16 (39.0%) |
| 2 Unit Apartments | 0 (0.0%) | 150 (100.0%) |
| 3 or 4 Unit Apartments | 2 (0.9%) | 214 (99.1%) |
| 5 to 9 Unit Apartments | 0 (0.0%) | 77 (100.0%) |
| 10 or more Apartments | 0 (0.0%) | 44 (100.0%) |
| Mobile Home / Other | 995 (87.9%) | 137 (12.1%) |
| Total | 4,994 (75.6%) | 1,610 (24.4%) |
Housing Structures by Number of Rooms in Dallas County
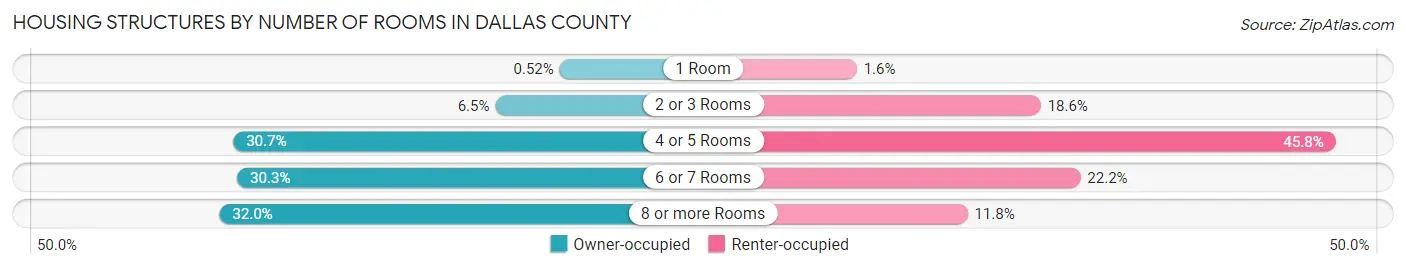
| Number of Rooms | Owner-occupied | Renter-occupied |
| 1 Room | 26 (0.5%) | 25 (1.5%) |
| 2 or 3 Rooms | 323 (6.5%) | 299 (18.6%) |
| 4 or 5 Rooms | 1,533 (30.7%) | 738 (45.8%) |
| 6 or 7 Rooms | 1,515 (30.3%) | 358 (22.2%) |
| 8 or more Rooms | 1,597 (32.0%) | 190 (11.8%) |
| Total | 4,994 (100.0%) | 1,610 (100.0%) |
Housing Structure by Heating Type in Dallas County
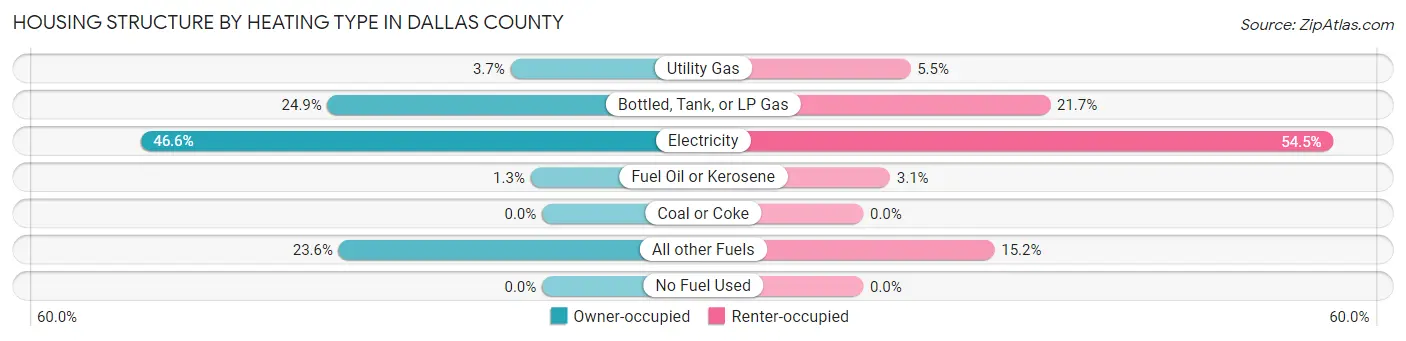
| Heating Type | Owner-occupied | Renter-occupied |
| Utility Gas | 183 (3.7%) | 88 (5.5%) |
| Bottled, Tank, or LP Gas | 1,242 (24.9%) | 349 (21.7%) |
| Electricity | 2,326 (46.6%) | 878 (54.5%) |
| Fuel Oil or Kerosene | 66 (1.3%) | 50 (3.1%) |
| Coal or Coke | 0 (0.0%) | 0 (0.0%) |
| All other Fuels | 1,177 (23.6%) | 245 (15.2%) |
| No Fuel Used | 0 (0.0%) | 0 (0.0%) |
| Total | 4,994 (100.0%) | 1,610 (100.0%) |
Household Vehicle Usage in Dallas County
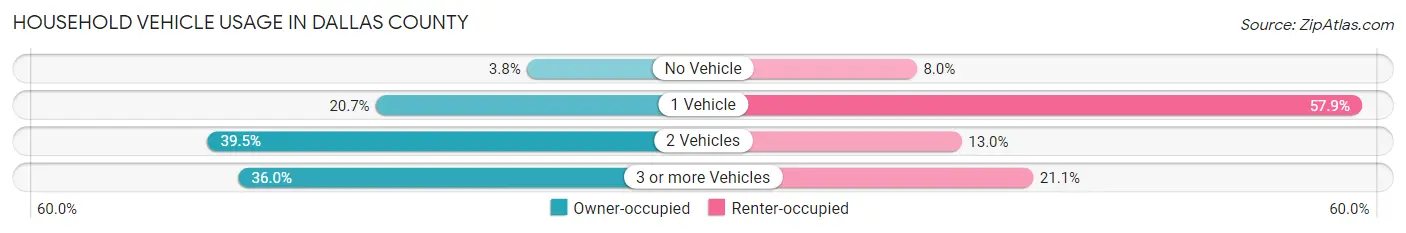
| Vehicles per Household | Owner-occupied | Renter-occupied |
| No Vehicle | 189 (3.8%) | 129 (8.0%) |
| 1 Vehicle | 1,034 (20.7%) | 932 (57.9%) |
| 2 Vehicles | 1,972 (39.5%) | 210 (13.0%) |
| 3 or more Vehicles | 1,799 (36.0%) | 339 (21.1%) |
| Total | 4,994 (100.0%) | 1,610 (100.0%) |
Real Estate & Mortgages in Dallas County
Real Estate and Mortgage Overview in Dallas County
| Characteristic | Without Mortgage | With Mortgage |
| Housing Units | 2,334 | 2,660 |
| Median Property Value | $109,100 | $155,300 |
| Median Household Income | $44,836 | $204 |
| Monthly Housing Costs | $343 | $28 |
| Real Estate Taxes | $759 | $34 |
Property Value by Mortgage Status in Dallas County
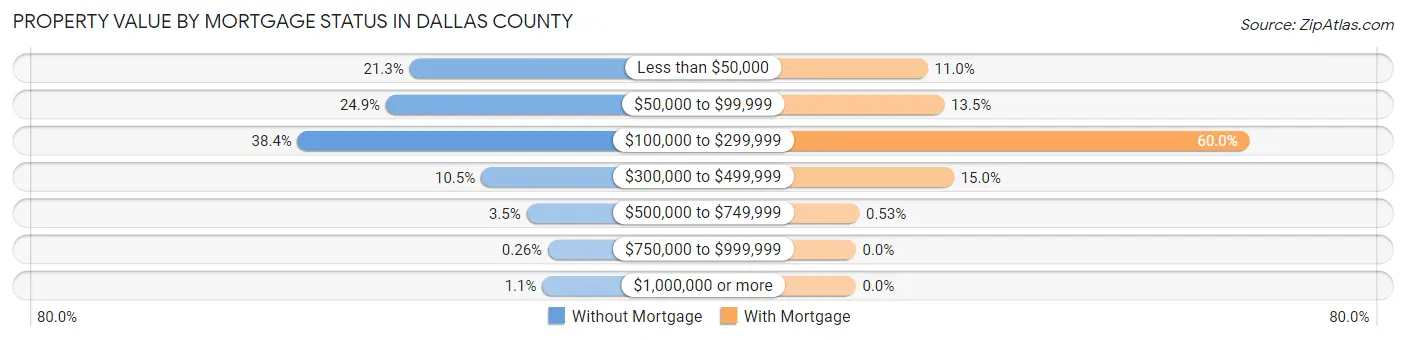
| Property Value | Without Mortgage | With Mortgage |
| Less than $50,000 | 498 (21.3%) | 292 (11.0%) |
| $50,000 to $99,999 | 582 (24.9%) | 359 (13.5%) |
| $100,000 to $299,999 | 896 (38.4%) | 1,597 (60.0%) |
| $300,000 to $499,999 | 244 (10.4%) | 398 (15.0%) |
| $500,000 to $749,999 | 82 (3.5%) | 14 (0.5%) |
| $750,000 to $999,999 | 6 (0.3%) | 0 (0.0%) |
| $1,000,000 or more | 26 (1.1%) | 0 (0.0%) |
| Total | 2,334 (100.0%) | 2,660 (100.0%) |
Household Income by Mortgage Status in Dallas County
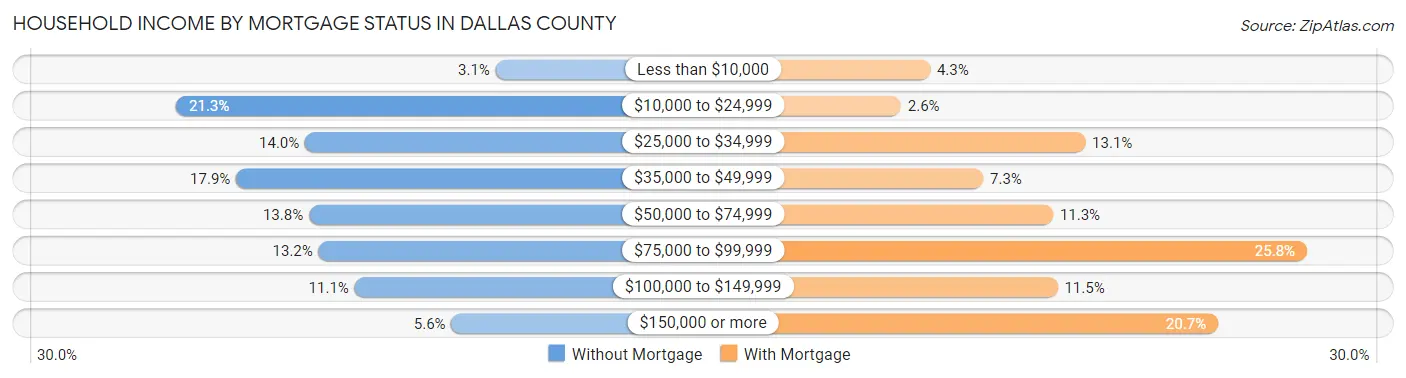
| Household Income | Without Mortgage | With Mortgage |
| Less than $10,000 | 72 (3.1%) | 113 (4.3%) |
| $10,000 to $24,999 | 498 (21.3%) | 69 (2.6%) |
| $25,000 to $34,999 | 326 (14.0%) | 349 (13.1%) |
| $35,000 to $49,999 | 418 (17.9%) | 194 (7.3%) |
| $50,000 to $74,999 | 321 (13.8%) | 300 (11.3%) |
| $75,000 to $99,999 | 308 (13.2%) | 686 (25.8%) |
| $100,000 to $149,999 | 260 (11.1%) | 307 (11.5%) |
| $150,000 or more | 131 (5.6%) | 551 (20.7%) |
| Total | 2,334 (100.0%) | 2,660 (100.0%) |
Property Value to Household Income Ratio in Dallas County
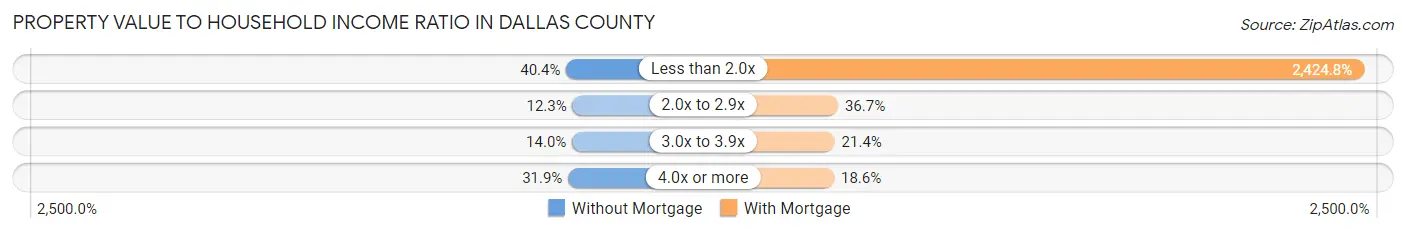
| Value-to-Income Ratio | Without Mortgage | With Mortgage |
| Less than 2.0x | 943 (40.4%) | 64,500 (2,424.8%) |
| 2.0x to 2.9x | 287 (12.3%) | 976 (36.7%) |
| 3.0x to 3.9x | 327 (14.0%) | 569 (21.4%) |
| 4.0x or more | 745 (31.9%) | 494 (18.6%) |
| Total | 2,334 (100.0%) | 2,660 (100.0%) |
Real Estate Taxes by Mortgage Status in Dallas County
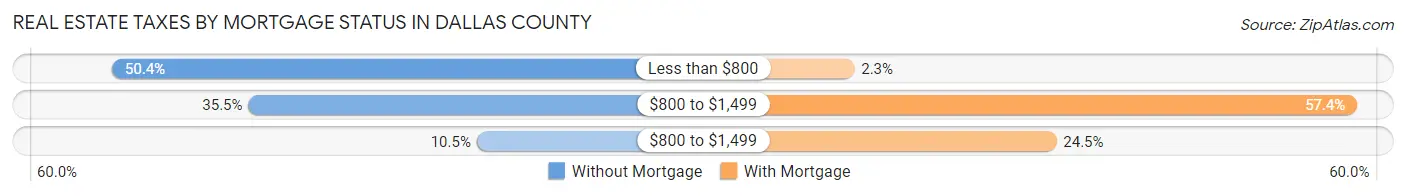
| Property Taxes | Without Mortgage | With Mortgage |
| Less than $800 | 1,177 (50.4%) | 62 (2.3%) |
| $800 to $1,499 | 828 (35.5%) | 1,528 (57.4%) |
| $800 to $1,499 | 244 (10.4%) | 651 (24.5%) |
| Total | 2,334 (100.0%) | 2,660 (100.0%) |
Health & Disability in Dallas County
Health Insurance Coverage by Age in Dallas County
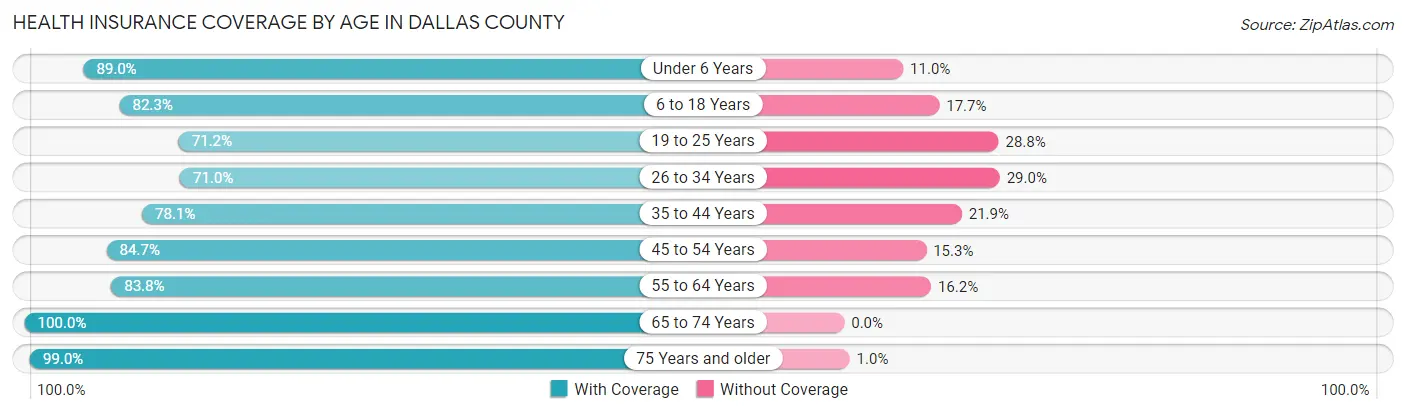
| Age Bracket | With Coverage | Without Coverage |
| Under 6 Years | 1,176 (89.0%) | 145 (11.0%) |
| 6 to 18 Years | 2,411 (82.3%) | 519 (17.7%) |
| 19 to 25 Years | 825 (71.2%) | 333 (28.8%) |
| 26 to 34 Years | 1,271 (71.0%) | 519 (29.0%) |
| 35 to 44 Years | 1,497 (78.1%) | 420 (21.9%) |
| 45 to 54 Years | 1,630 (84.7%) | 294 (15.3%) |
| 55 to 64 Years | 2,074 (83.8%) | 400 (16.2%) |
| 65 to 74 Years | 2,097 (100.0%) | 0 (0.0%) |
| 75 Years and older | 1,286 (99.0%) | 13 (1.0%) |
| Total | 14,267 (84.4%) | 2,643 (15.6%) |
Health Insurance Coverage by Citizenship Status in Dallas County
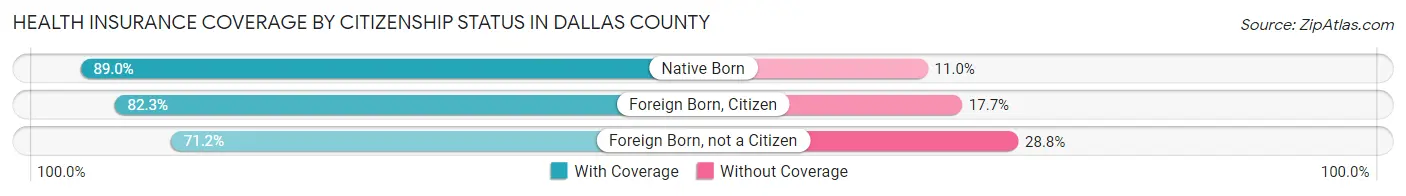
| Citizenship Status | With Coverage | Without Coverage |
| Native Born | 1,176 (89.0%) | 145 (11.0%) |
| Foreign Born, Citizen | 2,411 (82.3%) | 519 (17.7%) |
| Foreign Born, not a Citizen | 825 (71.2%) | 333 (28.8%) |
Health Insurance Coverage by Household Income in Dallas County
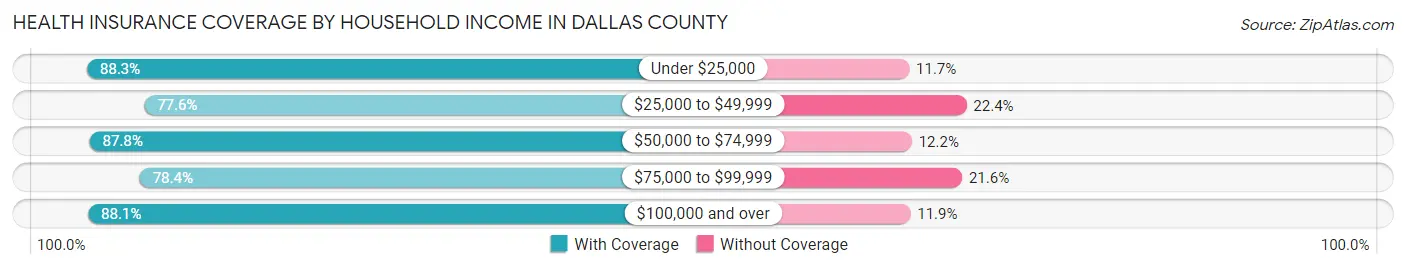
| Household Income | With Coverage | Without Coverage |
| Under $25,000 | 3,133 (88.3%) | 414 (11.7%) |
| $25,000 to $49,999 | 3,005 (77.6%) | 868 (22.4%) |
| $50,000 to $74,999 | 2,597 (87.8%) | 360 (12.2%) |
| $75,000 to $99,999 | 1,817 (78.4%) | 500 (21.6%) |
| $100,000 and over | 3,708 (88.1%) | 501 (11.9%) |
Public vs Private Health Insurance Coverage by Age in Dallas County
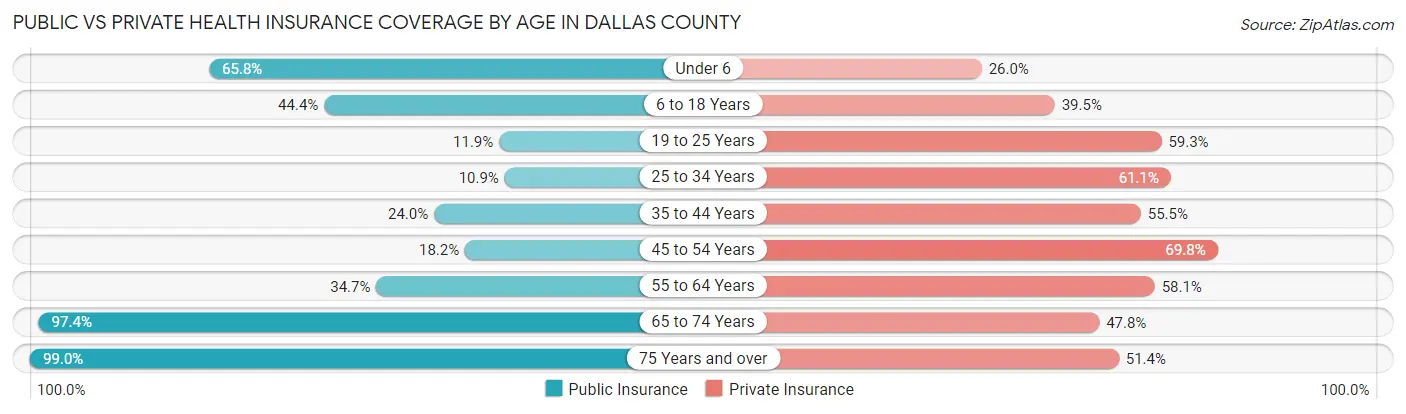
| Age Bracket | Public Insurance | Private Insurance |
| Under 6 | 869 (65.8%) | 343 (26.0%) |
| 6 to 18 Years | 1,301 (44.4%) | 1,158 (39.5%) |
| 19 to 25 Years | 138 (11.9%) | 687 (59.3%) |
| 25 to 34 Years | 195 (10.9%) | 1,093 (61.1%) |
| 35 to 44 Years | 460 (24.0%) | 1,064 (55.5%) |
| 45 to 54 Years | 351 (18.2%) | 1,342 (69.8%) |
| 55 to 64 Years | 859 (34.7%) | 1,437 (58.1%) |
| 65 to 74 Years | 2,042 (97.4%) | 1,002 (47.8%) |
| 75 Years and over | 1,286 (99.0%) | 668 (51.4%) |
| Total | 7,501 (44.4%) | 8,794 (52.0%) |
Disability Status by Sex by Age in Dallas County
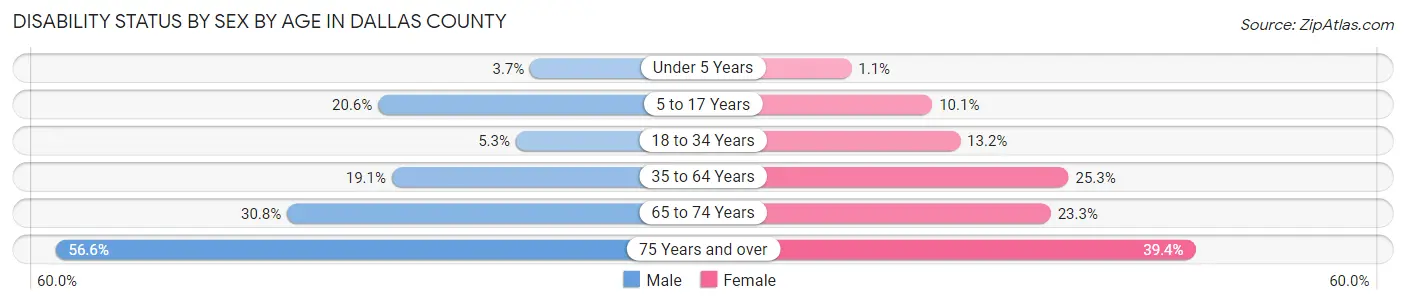
| Age Bracket | Male | Female |
| Under 5 Years | 20 (3.7%) | 6 (1.1%) |
| 5 to 17 Years | 308 (20.6%) | 151 (10.1%) |
| 18 to 34 Years | 77 (5.3%) | 217 (13.2%) |
| 35 to 64 Years | 609 (19.1%) | 790 (25.3%) |
| 65 to 74 Years | 312 (30.8%) | 252 (23.3%) |
| 75 Years and over | 341 (56.6%) | 274 (39.4%) |
Disability Class by Sex by Age in Dallas County
Disability Class: Hearing Difficulty
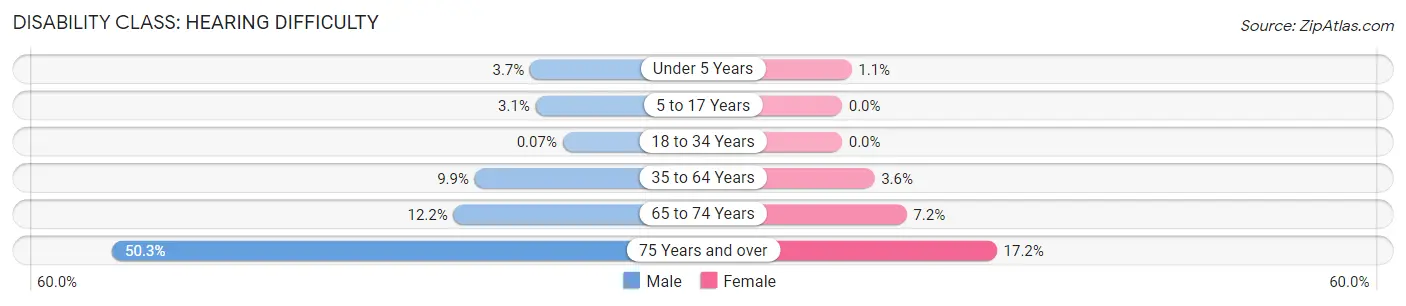
| Age Bracket | Male | Female |
| Under 5 Years | 20 (3.7%) | 6 (1.1%) |
| 5 to 17 Years | 46 (3.1%) | 0 (0.0%) |
| 18 to 34 Years | 1 (0.1%) | 0 (0.0%) |
| 35 to 64 Years | 314 (9.9%) | 113 (3.6%) |
| 65 to 74 Years | 124 (12.2%) | 78 (7.2%) |
| 75 Years and over | 303 (50.2%) | 120 (17.2%) |
Disability Class: Vision Difficulty
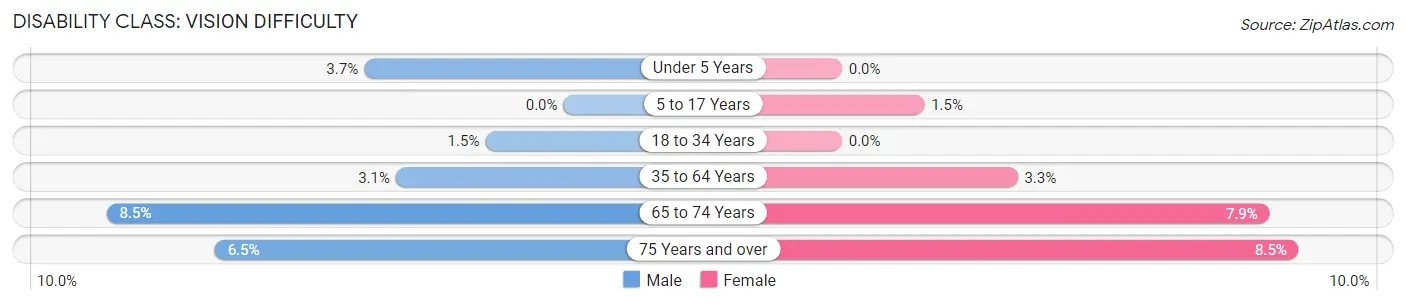
| Age Bracket | Male | Female |
| Under 5 Years | 20 (3.7%) | 0 (0.0%) |
| 5 to 17 Years | 0 (0.0%) | 23 (1.5%) |
| 18 to 34 Years | 21 (1.5%) | 0 (0.0%) |
| 35 to 64 Years | 99 (3.1%) | 102 (3.3%) |
| 65 to 74 Years | 86 (8.5%) | 86 (7.9%) |
| 75 Years and over | 39 (6.5%) | 59 (8.5%) |
Disability Class: Cognitive Difficulty
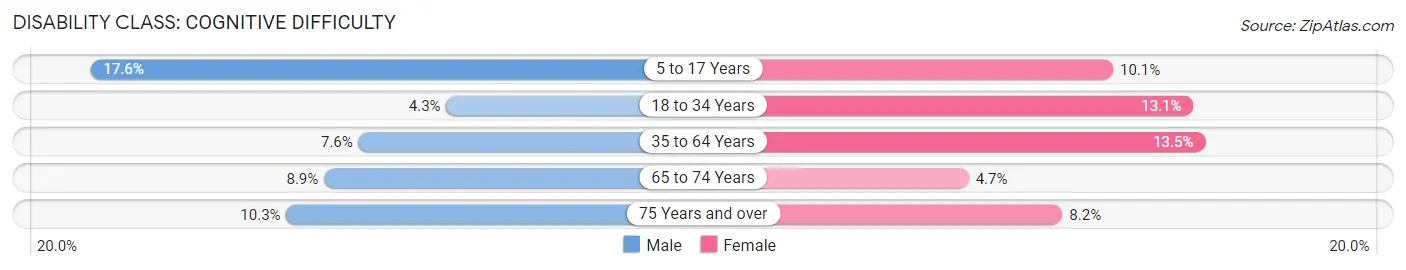
| Age Bracket | Male | Female |
| 5 to 17 Years | 262 (17.5%) | 151 (10.1%) |
| 18 to 34 Years | 63 (4.3%) | 215 (13.1%) |
| 35 to 64 Years | 242 (7.6%) | 422 (13.5%) |
| 65 to 74 Years | 90 (8.9%) | 51 (4.7%) |
| 75 Years and over | 62 (10.3%) | 57 (8.2%) |
Disability Class: Ambulatory Difficulty
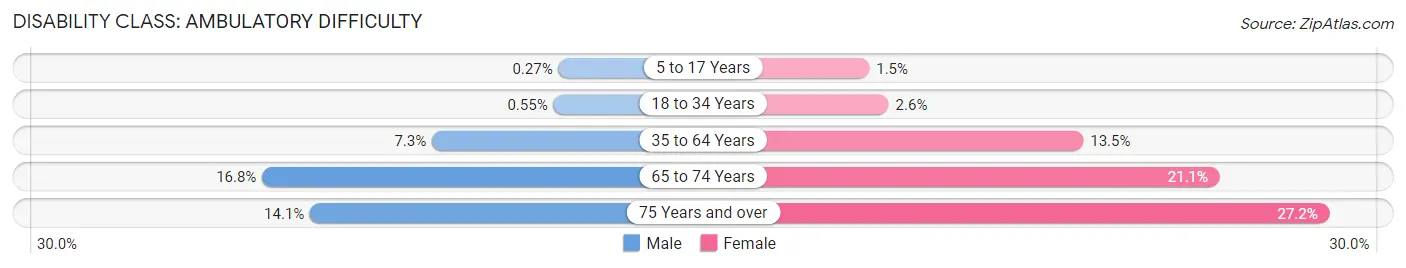
| Age Bracket | Male | Female |
| 5 to 17 Years | 4 (0.3%) | 23 (1.5%) |
| 18 to 34 Years | 8 (0.5%) | 43 (2.6%) |
| 35 to 64 Years | 233 (7.3%) | 421 (13.5%) |
| 65 to 74 Years | 170 (16.8%) | 228 (21.0%) |
| 75 Years and over | 85 (14.1%) | 189 (27.2%) |
Disability Class: Self-Care Difficulty
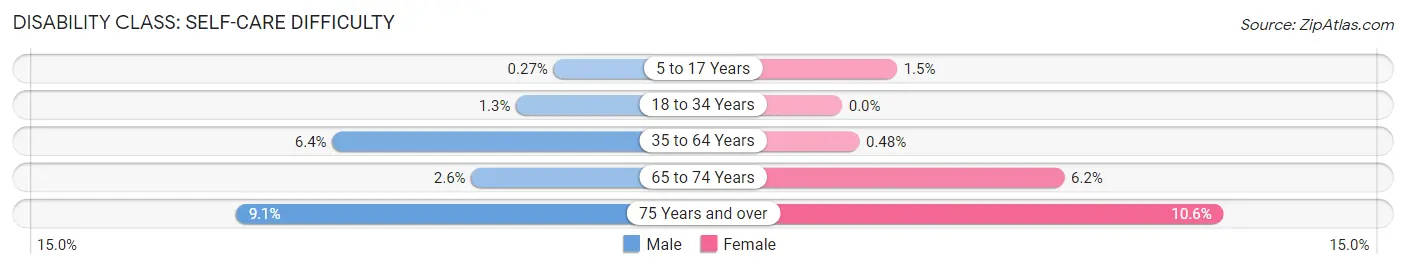
| Age Bracket | Male | Female |
| 5 to 17 Years | 4 (0.3%) | 23 (1.5%) |
| 18 to 34 Years | 19 (1.3%) | 0 (0.0%) |
| 35 to 64 Years | 205 (6.4%) | 15 (0.5%) |
| 65 to 74 Years | 26 (2.6%) | 67 (6.2%) |
| 75 Years and over | 55 (9.1%) | 74 (10.6%) |
Technology Access in Dallas County
Computing Device Access in Dallas County
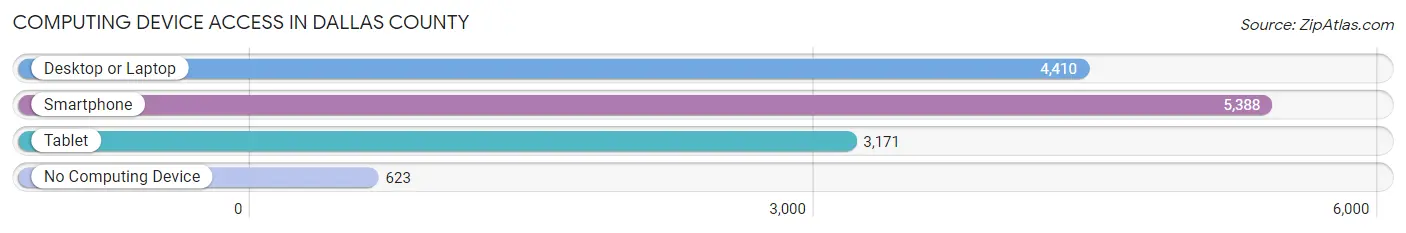
| Device Type | # Households | % Households |
| Desktop or Laptop | 4,410 | 66.8% |
| Smartphone | 5,388 | 81.6% |
| Tablet | 3,171 | 48.0% |
| No Computing Device | 623 | 9.4% |
| Total | 6,604 | 100.0% |
Internet Access in Dallas County
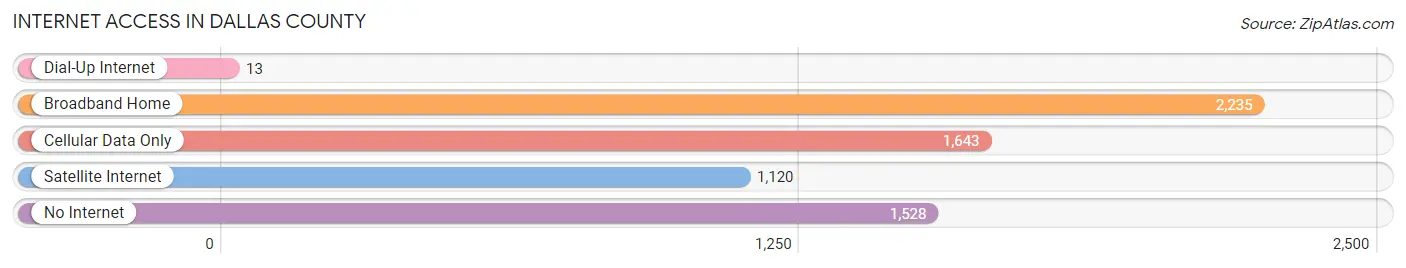
| Internet Type | # Households | % Households |
| Dial-Up Internet | 13 | 0.2% |
| Broadband Home | 2,235 | 33.8% |
| Cellular Data Only | 1,643 | 24.9% |
| Satellite Internet | 1,120 | 17.0% |
| No Internet | 1,528 | 23.1% |
| Total | 6,604 | 100.0% |
Dallas County Summary
Dallas County is located in the southwestern corner of Missouri, and is bordered by Polk County to the north, Webster County to the east, Wright County to the south, and Laclede County to the west. The county seat is Buffalo, and the largest city is Buffalo. The county was organized in 1845 and named after George M. Dallas, the 11th Vice President of the United States.
Geography
Dallas County is located in the Ozark Plateau region of Missouri. The county is mostly hilly and forested, with the highest point being the summit of Pilot Knob at 1,717 feet. The county is drained by the Sac River, which flows through the county from north to south. Other major streams in the county include the Niangua River, the Little Niangua River, and the Big Piney River.
The county has a total area of 576 square miles, of which 575 square miles is land and 1 square mile is water.
Demographics
As of the 2010 census, there were 16,777 people, 6,717 households, and 4,717 families residing in the county. The population density was 29.3 people per square mile. There were 7,717 housing units at an average density of 13.4 per square mile. The racial makeup of the county was 97.2% White, 0.3% Black or African American, 0.4% Native American, 0.2% Asian, 0.1% Pacific Islander, 0.5% from other races, and 1.3% from two or more races. 1.7% of the population were Hispanic or Latino of any race.
There were 6,717 households, out of which 30.2% had children under the age of 18 living with them, 56.2% were married couples living together, 9.2% had a female householder with no husband present, and 30.3% were non-families. 26.2% of all households were made up of individuals, and 13.2% had someone living alone who was 65 years of age or older. The average household size was 2.45 and the average family size was 2.94.
In the county, the population was spread out, with 24.2% under the age of 18, 7.7% from 18 to 24, 25.2% from 25 to 44, 25.2% from 45 to 64, and 17.7% who were 65 years of age or older. The median age was 40 years. For every 100 females there were 96.2 males. For every 100 females age 18 and over, there were 93.2 males.
The median income for a household in the county was $32,845, and the median income for a family was $39,845. Males had a median income of $27,917 versus $20,917 for females. The per capita income for the county was $16,845. About 11.2% of families and 14.2% of the population were below the poverty line, including 19.2% of those under age 18 and 11.2% of those age 65 or over.
Economy
The economy of Dallas County is largely based on agriculture. The county is home to a variety of crops, including corn, soybeans, wheat, hay, and oats. Livestock production is also important to the economy, with cattle, hogs, and poultry being the main animals raised.
The county also has a number of manufacturing and service industries. The largest employers in the county are the Buffalo School District, the Dallas County Hospital, and the Buffalo Post Office. Other major employers include the Buffalo-Dallas County Airport, the Buffalo-Dallas County Public Library, and the Buffalo-Dallas County Chamber of Commerce.
In addition, the county is home to a number of tourist attractions, including the Buffalo-Dallas County Museum, the Buffalo-Dallas County Historical Society, and the Buffalo-Dallas County Fairgrounds.
Conclusion
Dallas County is a rural county located in the southwestern corner of Missouri. The county is mostly hilly and forested, and is home to a variety of crops and livestock. The economy of the county is largely based on agriculture, but there are also a number of manufacturing and service industries, as well as a number of tourist attractions. The population of the county is largely white, with a small percentage of other races. The median income for a household in the county is slightly below the state average.
Common Questions
What is Per Capita Income in Dallas County?
Per Capita income in Dallas County is $24,646.
What is the Median Family Income in Dallas County?
Median Family Income in Dallas County is $61,361.
What is the Median Household income in Dallas County?
Median Household Income in Dallas County is $46,547.
What is Income or Wage Gap in Dallas County?
Income or Wage Gap in Dallas County is 30.6%.
Women in Dallas County earn 69.4 cents for every dollar earned by a man.
What is Inequality or Gini Index in Dallas County?
Inequality or Gini Index in Dallas County is 0.44.
What is the Total Population of Dallas County?
Total Population of Dallas County is 17,158.
What is the Total Male Population of Dallas County?
Total Male Population of Dallas County is 8,402.
What is the Total Female Population of Dallas County?
Total Female Population of Dallas County is 8,756.
What is the Ratio of Males per 100 Females in Dallas County?
There are 95.96 Males per 100 Females in Dallas County.
What is the Ratio of Females per 100 Males in Dallas County?
There are 104.21 Females per 100 Males in Dallas County.
What is the Median Population Age in Dallas County?
Median Population Age in Dallas County is 41.7 Years.
What is the Average Family Size in Dallas County
Average Family Size in Dallas County is 3.1 People.
What is the Average Household Size in Dallas County
Average Household Size in Dallas County is 2.6 People.
How Large is the Labor Force in Dallas County?
There are 6,821 People in the Labor Forcein in Dallas County.
What is the Percentage of People in the Labor Force in Dallas County?
50.6% of People are in the Labor Force in Dallas County.
What is the Unemployment Rate in Dallas County?
Unemployment Rate in Dallas County is 4.9%.