Cooper County, MO Map & Demographics
Cooper County Map
Cooper County Overview
$27,471
PER CAPITA INCOME
$76,317
AVG FAMILY INCOME
$62,239
AVG HOUSEHOLD INCOME
22.4%
WAGE / INCOME GAP [ % ]
77.6¢/ $1
WAGE / INCOME GAP [ $ ]
$10,791
FAMILY INCOME DEFICIT
0.41
INEQUALITY / GINI INDEX
16,893
TOTAL POPULATION
8,535
MALE POPULATION
8,358
FEMALE POPULATION
102.12
MALES / 100 FEMALES
97.93
FEMALES / 100 MALES
38.8
MEDIAN AGE
3.0
AVG FAMILY SIZE
2.5
AVG HOUSEHOLD SIZE
7,640
LABOR FORCE [ PEOPLE ]
56.1%
PERCENT IN LABOR FORCE
5.0%
UNEMPLOYMENT RATE
Cooper County Area Codes
Income in Cooper County
Income Overview in Cooper County
Per Capita Income in Cooper County is $27,471, while median incomes of families and households are $76,317 and $62,239 respectively.
| Characteristic | Number | Measure |
| Per Capita Income | 16,893 | $27,471 |
| Median Family Income | 4,269 | $76,317 |
| Mean Family Income | 4,269 | $85,752 |
| Median Household Income | 6,125 | $62,239 |
| Mean Household Income | 6,125 | $74,168 |
| Income Deficit | 4,269 | $10,791 |
| Wage / Income Gap (%) | 16,893 | 22.35% |
| Wage / Income Gap ($) | 16,893 | 77.65¢ per $1 |
| Gini / Inequality Index | 16,893 | 0.41 |
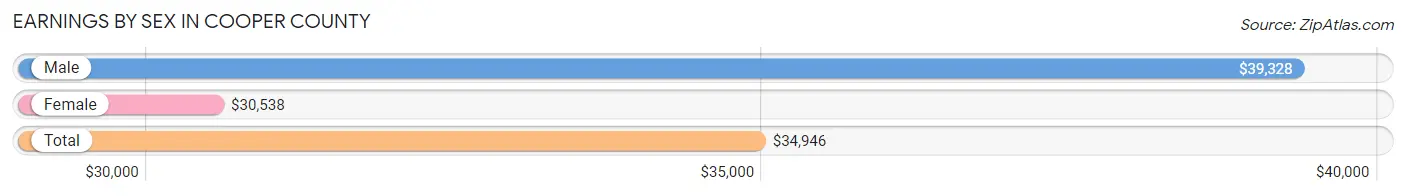
Earnings by Sex in Cooper County
Average Earnings in Cooper County are $34,946, $39,328 for men and $30,538 for women, a difference of 22.4%.
| Sex | Number | Average Earnings |
| Male | 3,954 (48.9%) | $39,328 |
| Female | 4,138 (51.1%) | $30,538 |
| Total | 8,092 (100.0%) | $34,946 |
Earnings by Sex by Income Bracket in Cooper County
The most common earnings brackets in Cooper County are $55,000 to $64,999 for men (476 | 12.0%) and $35,000 to $39,999 for women (436 | 10.5%).
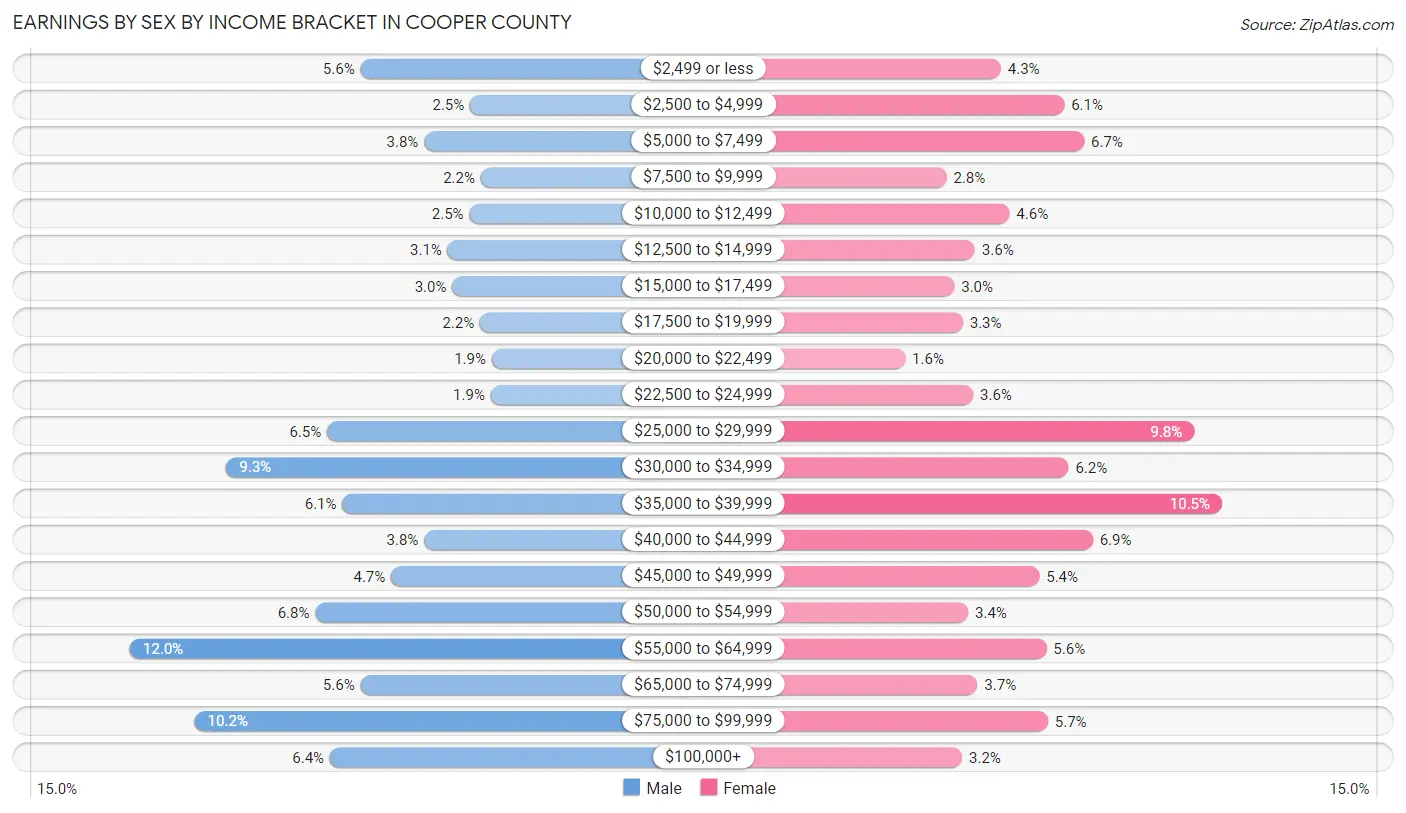
| Income | Male | Female |
| $2,499 or less | 220 (5.6%) | 179 (4.3%) |
| $2,500 to $4,999 | 98 (2.5%) | 253 (6.1%) |
| $5,000 to $7,499 | 149 (3.8%) | 276 (6.7%) |
| $7,500 to $9,999 | 86 (2.2%) | 116 (2.8%) |
| $10,000 to $12,499 | 99 (2.5%) | 189 (4.6%) |
| $12,500 to $14,999 | 123 (3.1%) | 149 (3.6%) |
| $15,000 to $17,499 | 118 (3.0%) | 125 (3.0%) |
| $17,500 to $19,999 | 87 (2.2%) | 135 (3.3%) |
| $20,000 to $22,499 | 74 (1.9%) | 68 (1.6%) |
| $22,500 to $24,999 | 75 (1.9%) | 147 (3.5%) |
| $25,000 to $29,999 | 257 (6.5%) | 404 (9.8%) |
| $30,000 to $34,999 | 369 (9.3%) | 258 (6.2%) |
| $35,000 to $39,999 | 240 (6.1%) | 436 (10.5%) |
| $40,000 to $44,999 | 149 (3.8%) | 286 (6.9%) |
| $45,000 to $49,999 | 186 (4.7%) | 224 (5.4%) |
| $50,000 to $54,999 | 270 (6.8%) | 141 (3.4%) |
| $55,000 to $64,999 | 476 (12.0%) | 232 (5.6%) |
| $65,000 to $74,999 | 220 (5.6%) | 152 (3.7%) |
| $75,000 to $99,999 | 404 (10.2%) | 234 (5.7%) |
| $100,000+ | 254 (6.4%) | 134 (3.2%) |
| Total | 3,954 (100.0%) | 4,138 (100.0%) |
Earnings by Sex by Educational Attainment in Cooper County
Average earnings in Cooper County are $48,844 for men and $35,928 for women, a difference of 26.4%. Men with an educational attainment of graduate degree enjoy the highest average annual earnings of $66,094, while those with less than high school education earn the least with $35,357. Women with an educational attainment of graduate degree earn the most with the average annual earnings of $58,333, while those with less than high school education have the smallest earnings of $19,375.
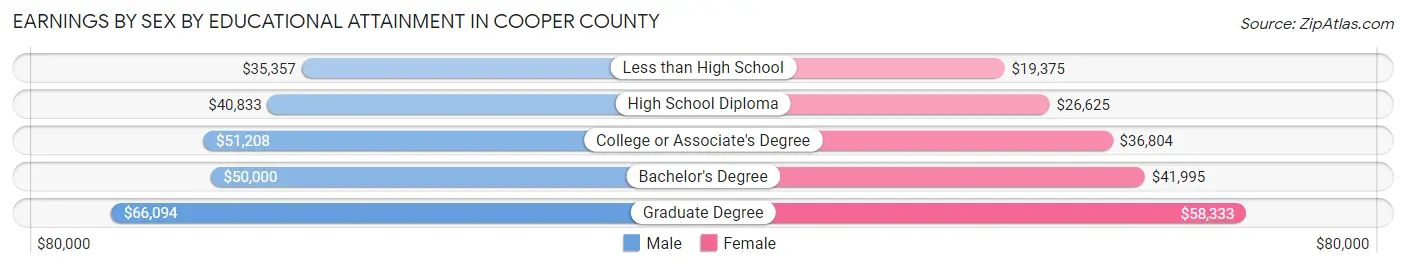
| Educational Attainment | Male Income | Female Income |
| Less than High School | $35,357 | $19,375 |
| High School Diploma | $40,833 | $26,625 |
| College or Associate's Degree | $51,208 | $36,804 |
| Bachelor's Degree | $50,000 | $41,995 |
| Graduate Degree | $66,094 | $58,333 |
| Total | $48,844 | $35,928 |
Family Income in Cooper County
Family Income Brackets in Cooper County
According to the Cooper County family income data, there are 939 families falling into the $100,000 to $149,999 income range, which is the most common income bracket and makes up 22.0% of all families. Conversely, the $10,000 to $14,999 income bracket is the least frequent group with only 77 families (1.8%) belonging to this category.
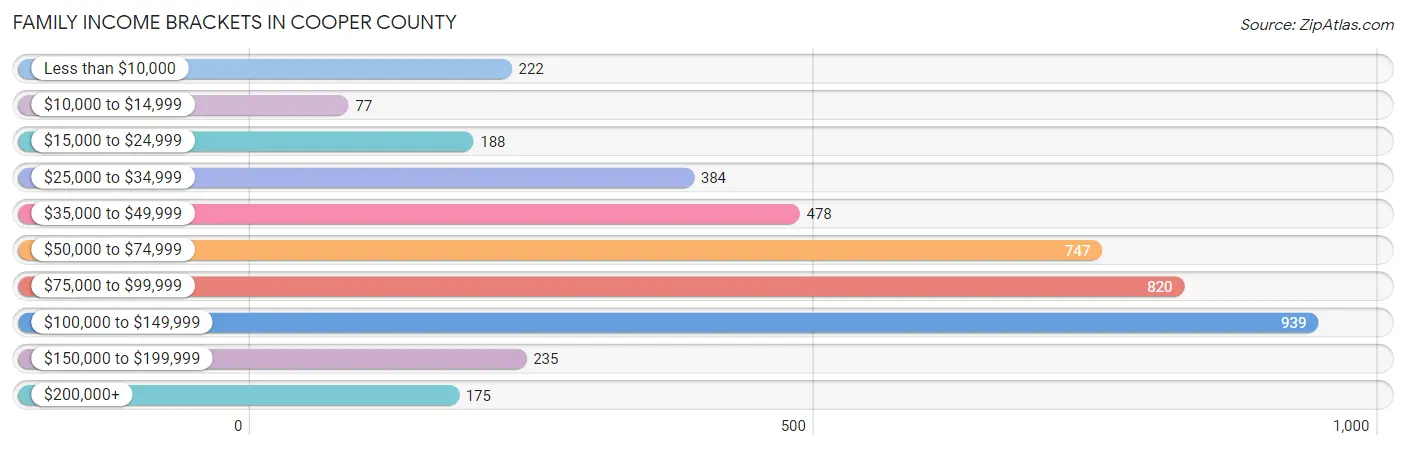
| Income Bracket | # Families | % Families |
| Less than $10,000 | 222 | 5.2% |
| $10,000 to $14,999 | 77 | 1.8% |
| $15,000 to $24,999 | 188 | 4.4% |
| $25,000 to $34,999 | 384 | 9.0% |
| $35,000 to $49,999 | 478 | 11.2% |
| $50,000 to $74,999 | 747 | 17.5% |
| $75,000 to $99,999 | 820 | 19.2% |
| $100,000 to $149,999 | 939 | 22.0% |
| $150,000 to $199,999 | 235 | 5.5% |
| $200,000+ | 175 | 4.1% |
Family Income by Famaliy Size in Cooper County
6-person families (54 | 1.3%) account for the highest median family income in Cooper County with $111,250 per family, while 2-person families (2,463 | 57.7%) have the highest median income of $32,148 per family member.
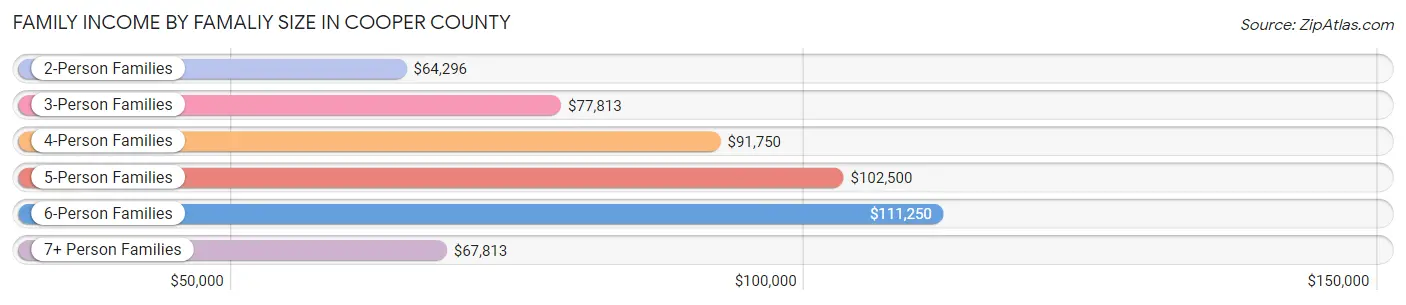
| Income Bracket | # Families | Median Income |
| 2-Person Families | 2,463 (57.7%) | $64,296 |
| 3-Person Families | 778 (18.2%) | $77,813 |
| 4-Person Families | 651 (15.2%) | $91,750 |
| 5-Person Families | 258 (6.0%) | $102,500 |
| 6-Person Families | 54 (1.3%) | $111,250 |
| 7+ Person Families | 65 (1.5%) | $67,813 |
| Total | 4,269 (100.0%) | $76,317 |
Family Income by Number of Earners in Cooper County
The median family income in Cooper County is $76,317, with families comprising 3+ earners (324) having the highest median family income of $135,449, while families with no earners (826) have the lowest median family income of $40,357, accounting for 7.6% and 19.4% of families, respectively.
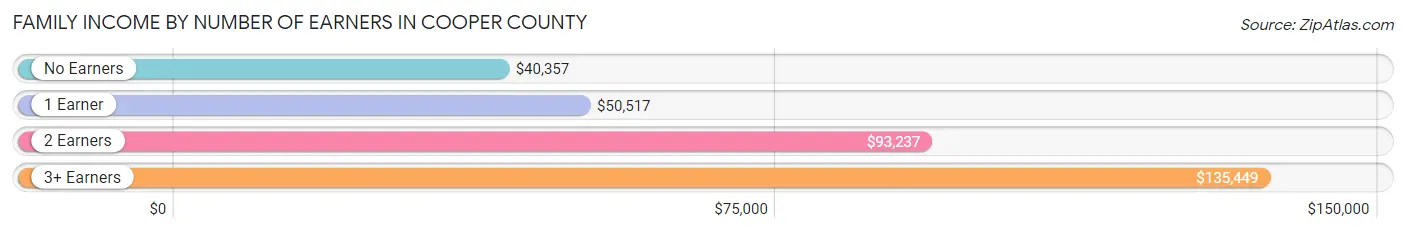
| Number of Earners | # Families | Median Income |
| No Earners | 826 (19.4%) | $40,357 |
| 1 Earner | 1,220 (28.6%) | $50,517 |
| 2 Earners | 1,899 (44.5%) | $93,237 |
| 3+ Earners | 324 (7.6%) | $135,449 |
| Total | 4,269 (100.0%) | $76,317 |
Household Income in Cooper County
Household Income Brackets in Cooper County
With 1,133 households falling in the category, the $100,000 to $149,999 income range is the most frequent in Cooper County, accounting for 18.5% of all households. In contrast, only 190 households (3.1%) fall into the $200,000+ income bracket, making it the least populous group.
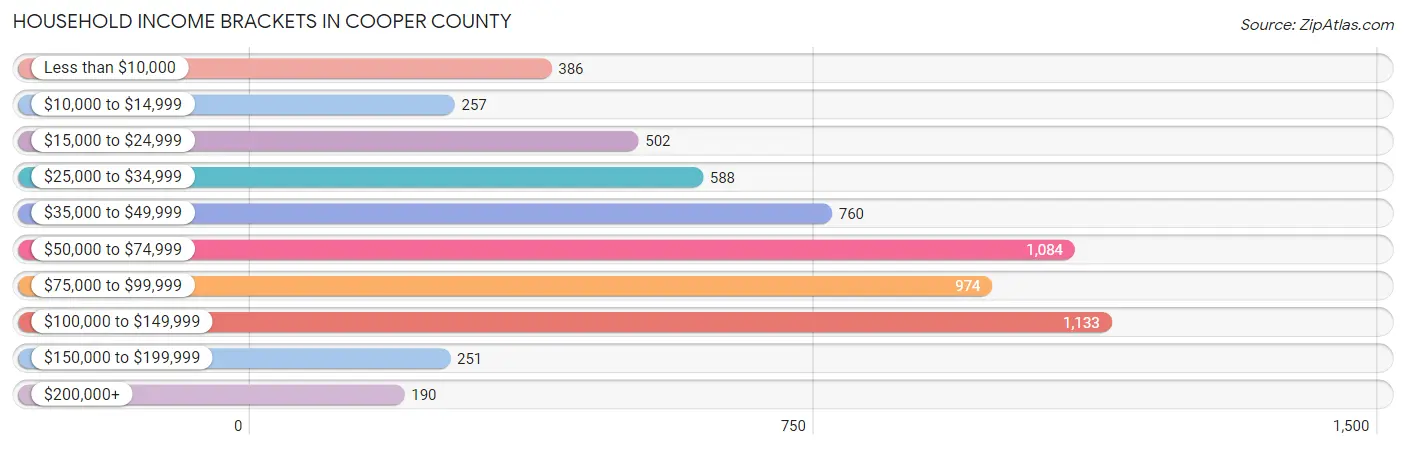
| Income Bracket | # Households | % Households |
| Less than $10,000 | 386 | 6.3% |
| $10,000 to $14,999 | 257 | 4.2% |
| $15,000 to $24,999 | 502 | 8.2% |
| $25,000 to $34,999 | 588 | 9.6% |
| $35,000 to $49,999 | 760 | 12.4% |
| $50,000 to $74,999 | 1,084 | 17.7% |
| $75,000 to $99,999 | 974 | 15.9% |
| $100,000 to $149,999 | 1,133 | 18.5% |
| $150,000 to $199,999 | 251 | 4.1% |
| $200,000+ | 190 | 3.1% |
Household Income by Householder Age in Cooper County
The median household income in Cooper County is $62,239, with the highest median household income of $76,875 found in the 25 to 44 years age bracket for the primary householder. A total of 1,603 households (26.2%) fall into this category. Meanwhile, the 65+ years age bracket for the primary householder has the lowest median household income of $38,992, with 1,944 households (31.7%) in this group.
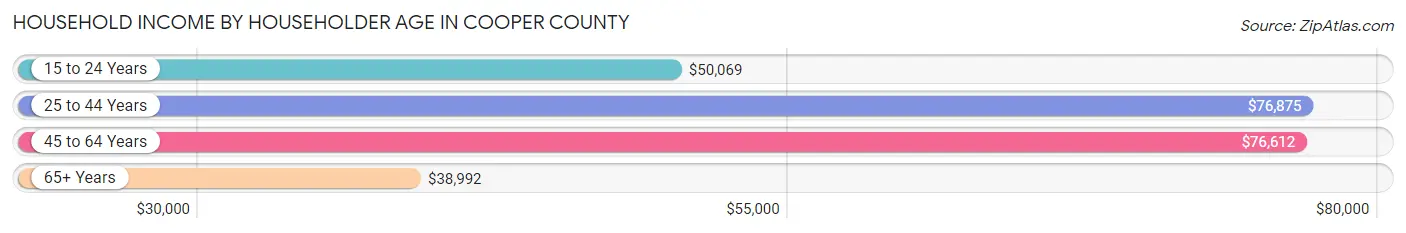
| Income Bracket | # Households | Median Income |
| 15 to 24 Years | 297 (4.9%) | $50,069 |
| 25 to 44 Years | 1,603 (26.2%) | $76,875 |
| 45 to 64 Years | 2,281 (37.2%) | $76,612 |
| 65+ Years | 1,944 (31.7%) | $38,992 |
| Total | 6,125 (100.0%) | $62,239 |
Poverty in Cooper County
Income Below Poverty by Sex and Age in Cooper County
With 11.8% poverty level for males and 14.1% for females among the residents of Cooper County, 5 year old males and 15 year old females are the most vulnerable to poverty, with 42 males (32.6%) and 19 females (28.4%) in their respective age groups living below the poverty level.
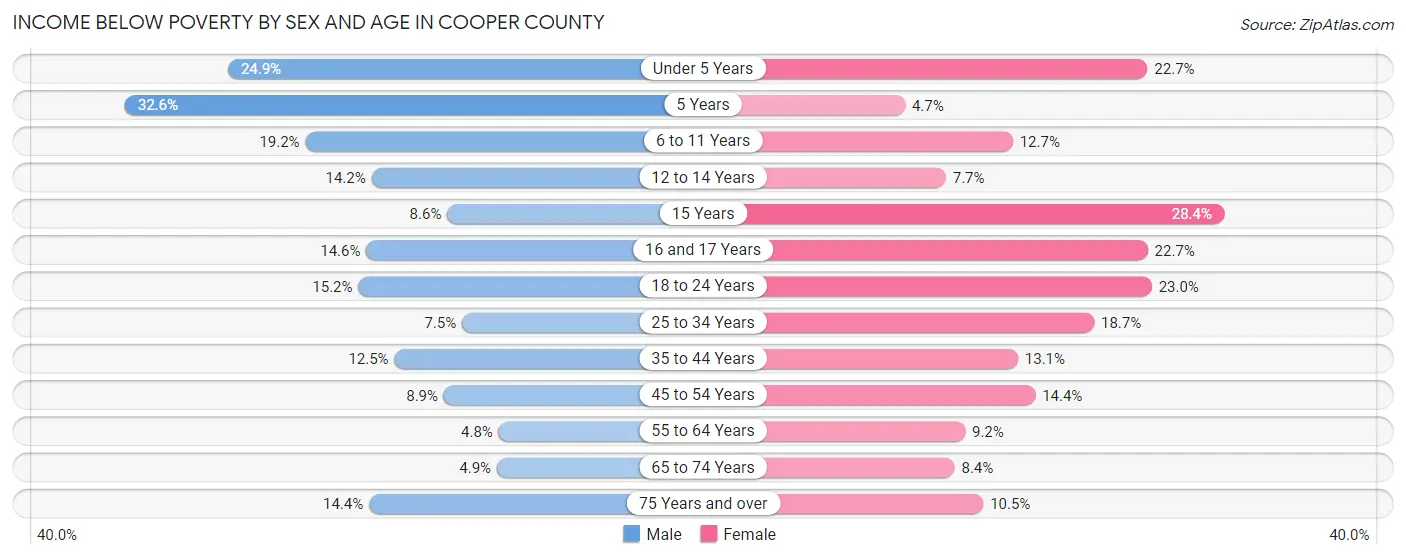
| Age Bracket | Male | Female |
| Under 5 Years | 126 (24.9%) | 108 (22.7%) |
| 5 Years | 42 (32.6%) | 6 (4.7%) |
| 6 to 11 Years | 104 (19.2%) | 67 (12.7%) |
| 12 to 14 Years | 48 (14.2%) | 26 (7.7%) |
| 15 Years | 10 (8.6%) | 19 (28.4%) |
| 16 and 17 Years | 30 (14.6%) | 62 (22.7%) |
| 18 to 24 Years | 121 (15.2%) | 168 (23.0%) |
| 25 to 34 Years | 61 (7.5%) | 180 (18.7%) |
| 35 to 44 Years | 75 (12.5%) | 124 (13.1%) |
| 45 to 54 Years | 75 (8.9%) | 133 (14.4%) |
| 55 to 64 Years | 48 (4.8%) | 107 (9.1%) |
| 65 to 74 Years | 40 (4.9%) | 75 (8.4%) |
| 75 Years and over | 74 (14.4%) | 75 (10.5%) |
| Total | 854 (11.8%) | 1,150 (14.1%) |
Income Above Poverty by Sex and Age in Cooper County
According to the poverty statistics in Cooper County, males aged 55 to 64 years and females aged 5 years are the age groups that are most secure financially, with 95.2% of males and 95.3% of females in these age groups living above the poverty line.
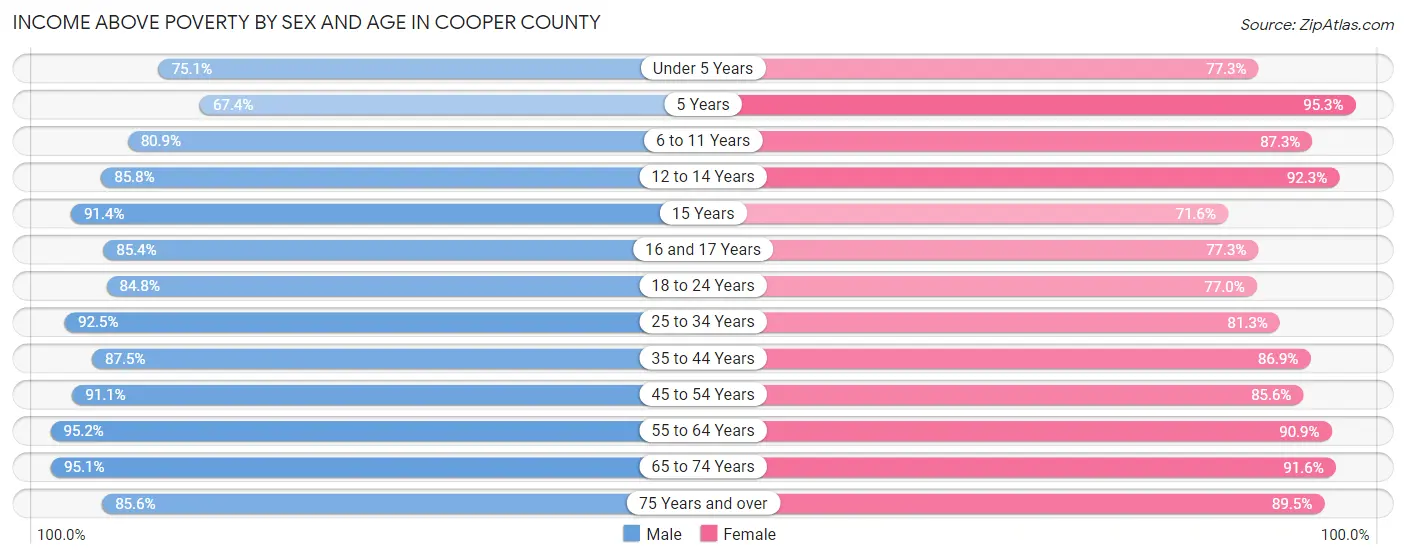
| Age Bracket | Male | Female |
| Under 5 Years | 380 (75.1%) | 368 (77.3%) |
| 5 Years | 87 (67.4%) | 122 (95.3%) |
| 6 to 11 Years | 439 (80.8%) | 461 (87.3%) |
| 12 to 14 Years | 289 (85.8%) | 311 (92.3%) |
| 15 Years | 106 (91.4%) | 48 (71.6%) |
| 16 and 17 Years | 175 (85.4%) | 211 (77.3%) |
| 18 to 24 Years | 674 (84.8%) | 562 (77.0%) |
| 25 to 34 Years | 750 (92.5%) | 781 (81.3%) |
| 35 to 44 Years | 523 (87.5%) | 825 (86.9%) |
| 45 to 54 Years | 771 (91.1%) | 793 (85.6%) |
| 55 to 64 Years | 952 (95.2%) | 1,062 (90.8%) |
| 65 to 74 Years | 771 (95.1%) | 821 (91.6%) |
| 75 Years and over | 439 (85.6%) | 639 (89.5%) |
| Total | 6,356 (88.2%) | 7,004 (85.9%) |
Income Below Poverty Among Married-Couple Families in Cooper County
The poverty statistics for married-couple families in Cooper County show that 4.1% or 131 of the total 3,170 families live below the poverty line. Families with 5 or more children have the highest poverty rate of 41.9%, comprising of 18 families. On the other hand, families with no children have the lowest poverty rate of 2.8%, which includes 56 families.
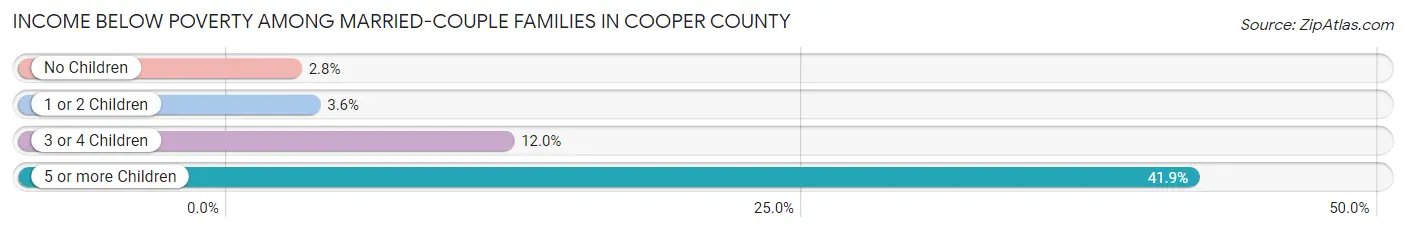
| Children | Above Poverty | Below Poverty |
| No Children | 1,969 (97.2%) | 56 (2.8%) |
| 1 or 2 Children | 862 (96.4%) | 32 (3.6%) |
| 3 or 4 Children | 183 (88.0%) | 25 (12.0%) |
| 5 or more Children | 25 (58.1%) | 18 (41.9%) |
| Total | 3,039 (95.9%) | 131 (4.1%) |
Income Below Poverty Among Single-Parent Households in Cooper County
According to the poverty data in Cooper County, 15.1% or 46 single-father households and 31.8% or 253 single-mother households are living below the poverty line. Among single-father households, those with 1 or 2 children have the highest poverty rate, with 33 households (18.0%) experiencing poverty. Likewise, among single-mother households, those with 1 or 2 children have the highest poverty rate, with 151 households (38.0%) falling below the poverty line.
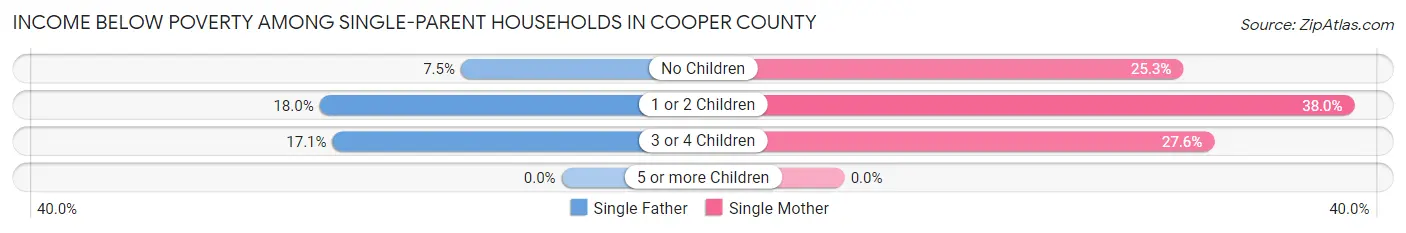
| Children | Single Father | Single Mother |
| No Children | 6 (7.5%) | 86 (25.3%) |
| 1 or 2 Children | 33 (18.0%) | 151 (38.0%) |
| 3 or 4 Children | 7 (17.1%) | 16 (27.6%) |
| 5 or more Children | 0 (0.0%) | 0 (0.0%) |
| Total | 46 (15.1%) | 253 (31.8%) |
Income Below Poverty Among Married-Couple vs Single-Parent Households in Cooper County
The poverty data for Cooper County shows that 131 of the married-couple family households (4.1%) and 299 of the single-parent households (27.2%) are living below the poverty level. Within the married-couple family households, those with 5 or more children have the highest poverty rate, with 18 households (41.9%) falling below the poverty line. Among the single-parent households, those with 1 or 2 children have the highest poverty rate, with 184 household (31.7%) living below poverty.
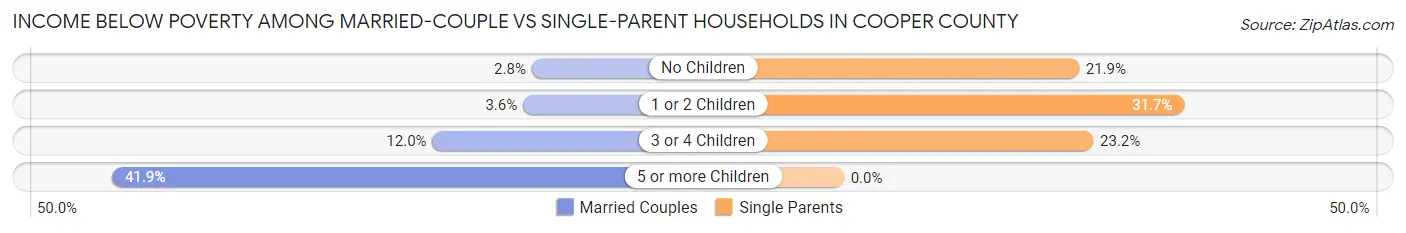
| Children | Married-Couple Families | Single-Parent Households |
| No Children | 56 (2.8%) | 92 (21.9%) |
| 1 or 2 Children | 32 (3.6%) | 184 (31.7%) |
| 3 or 4 Children | 25 (12.0%) | 23 (23.2%) |
| 5 or more Children | 18 (41.9%) | 0 (0.0%) |
| Total | 131 (4.1%) | 299 (27.2%) |
Race in Cooper County
The most populous races in Cooper County are White / Caucasian (14,956 | 88.5%), Black / African American (938 | 5.6%), and Two or more Races (813 | 4.8%).
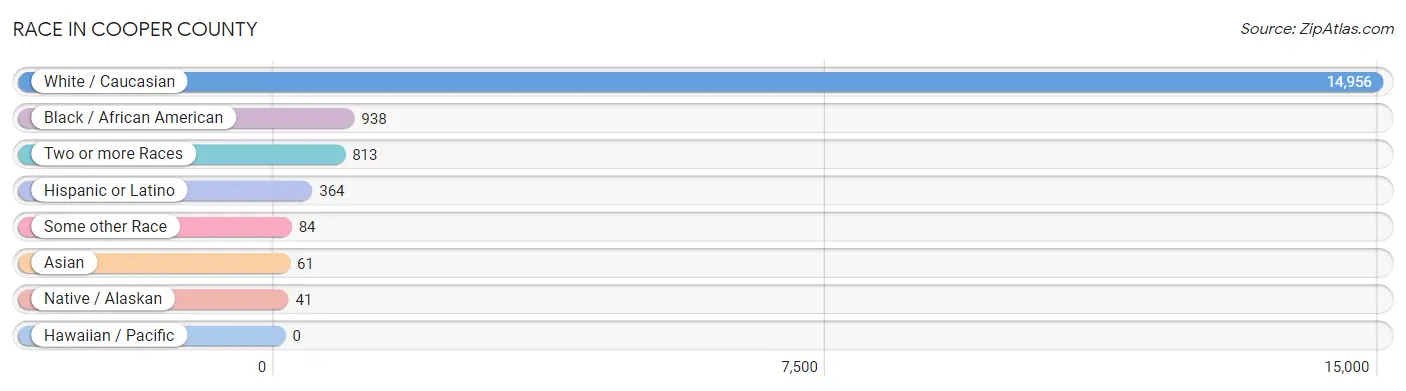
| Race | # Population | % Population |
| Asian | 61 | 0.4% |
| Black / African American | 938 | 5.6% |
| Hawaiian / Pacific | 0 | 0.0% |
| Hispanic or Latino | 364 | 2.1% |
| Native / Alaskan | 41 | 0.2% |
| White / Caucasian | 14,956 | 88.5% |
| Two or more Races | 813 | 4.8% |
| Some other Race | 84 | 0.5% |
| Total | 16,893 | 100.0% |
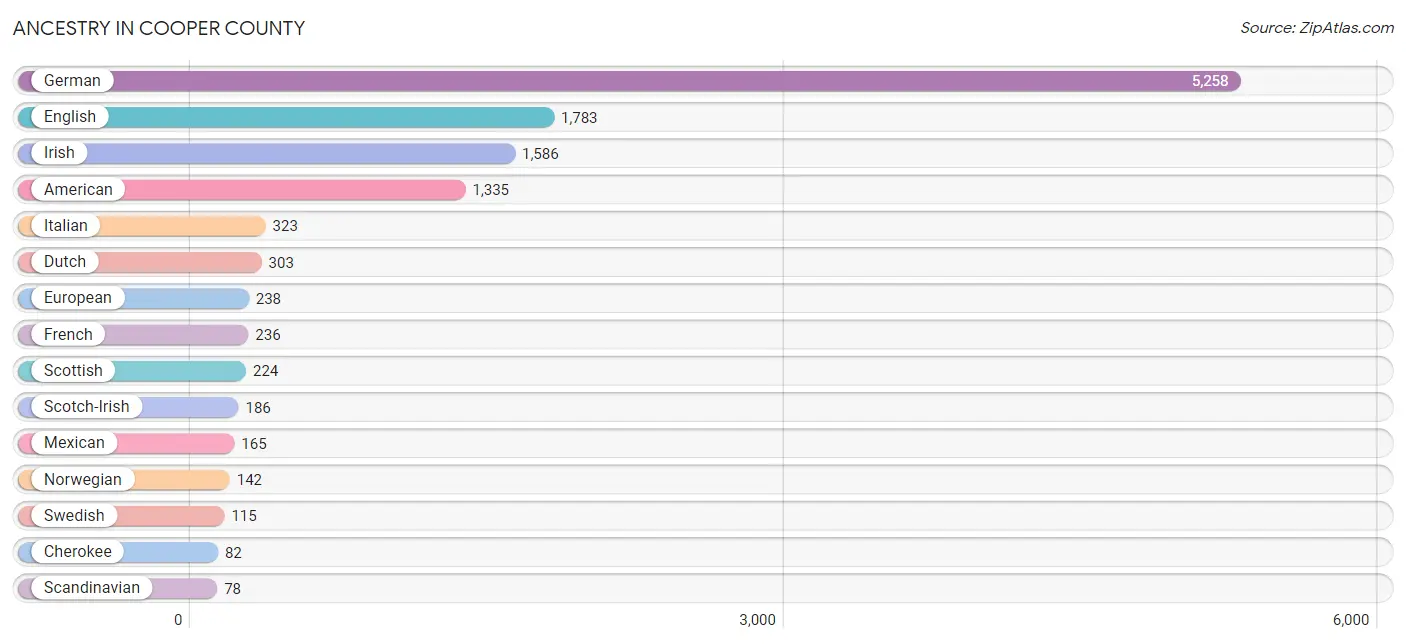
Ancestry in Cooper County
The most populous ancestries reported in Cooper County are German (5,258 | 31.1%), English (1,783 | 10.5%), Irish (1,586 | 9.4%), American (1,335 | 7.9%), and Italian (323 | 1.9%), together accounting for 60.9% of all Cooper County residents.
| Ancestry | # Population | % Population |
| African | 35 | 0.2% |
| Alsatian | 3 | 0.0% |
| American | 1,335 | 7.9% |
| Apache | 19 | 0.1% |
| Arab | 16 | 0.1% |
| Austrian | 25 | 0.2% |
| Bhutanese | 28 | 0.2% |
| Blackfeet | 13 | 0.1% |
| British | 27 | 0.2% |
| Bulgarian | 1 | 0.0% |
| Burmese | 7 | 0.0% |
| Central American | 15 | 0.1% |
| Cherokee | 82 | 0.5% |
| Choctaw | 33 | 0.2% |
| Comanche | 19 | 0.1% |
| Czech | 25 | 0.2% |
| Danish | 16 | 0.1% |
| Dutch | 303 | 1.8% |
| Egyptian | 2 | 0.0% |
| English | 1,783 | 10.5% |
| European | 238 | 1.4% |
| Finnish | 4 | 0.0% |
| French | 236 | 1.4% |
| German | 5,258 | 31.1% |
| Greek | 1 | 0.0% |
| Guatemalan | 15 | 0.1% |
| Haitian | 11 | 0.1% |
| Hungarian | 14 | 0.1% |
| Indian (Asian) | 35 | 0.2% |
| Inupiat | 1 | 0.0% |
| Irish | 1,586 | 9.4% |
| Iroquois | 6 | 0.0% |
| Italian | 323 | 1.9% |
| Korean | 74 | 0.4% |
| Lebanese | 5 | 0.0% |
| Liberian | 8 | 0.1% |
| Lithuanian | 2 | 0.0% |
| Mexican | 165 | 1.0% |
| Moroccan | 9 | 0.1% |
| Navajo | 3 | 0.0% |
| Nigerian | 18 | 0.1% |
| Northern European | 14 | 0.1% |
| Norwegian | 142 | 0.8% |
| Pennsylvania German | 8 | 0.1% |
| Peruvian | 44 | 0.3% |
| Polish | 68 | 0.4% |
| Portuguese | 5 | 0.0% |
| Puerto Rican | 46 | 0.3% |
| Romanian | 2 | 0.0% |
| Russian | 38 | 0.2% |
| Scandinavian | 78 | 0.5% |
| Scotch-Irish | 186 | 1.1% |
| Scottish | 224 | 1.3% |
| Serbian | 6 | 0.0% |
| Slavic | 6 | 0.0% |
| South American | 46 | 0.3% |
| Spanish | 75 | 0.4% |
| Sri Lankan | 5 | 0.0% |
| Subsaharan African | 63 | 0.4% |
| Sudanese | 2 | 0.0% |
| Swedish | 115 | 0.7% |
| Swiss | 72 | 0.4% |
| Ukrainian | 3 | 0.0% |
| Venezuelan | 2 | 0.0% |
| Welsh | 70 | 0.4% |
| Yaqui | 9 | 0.1% | View All 66 Rows |
Immigrants in Cooper County
The most numerous immigrant groups reported in Cooper County came from Africa (62 | 0.4%), Asia (47 | 0.3%), Western Africa (45 | 0.3%), Nigeria (37 | 0.2%), and Philippines (30 | 0.2%), together accounting for 1.3% of all Cooper County residents.
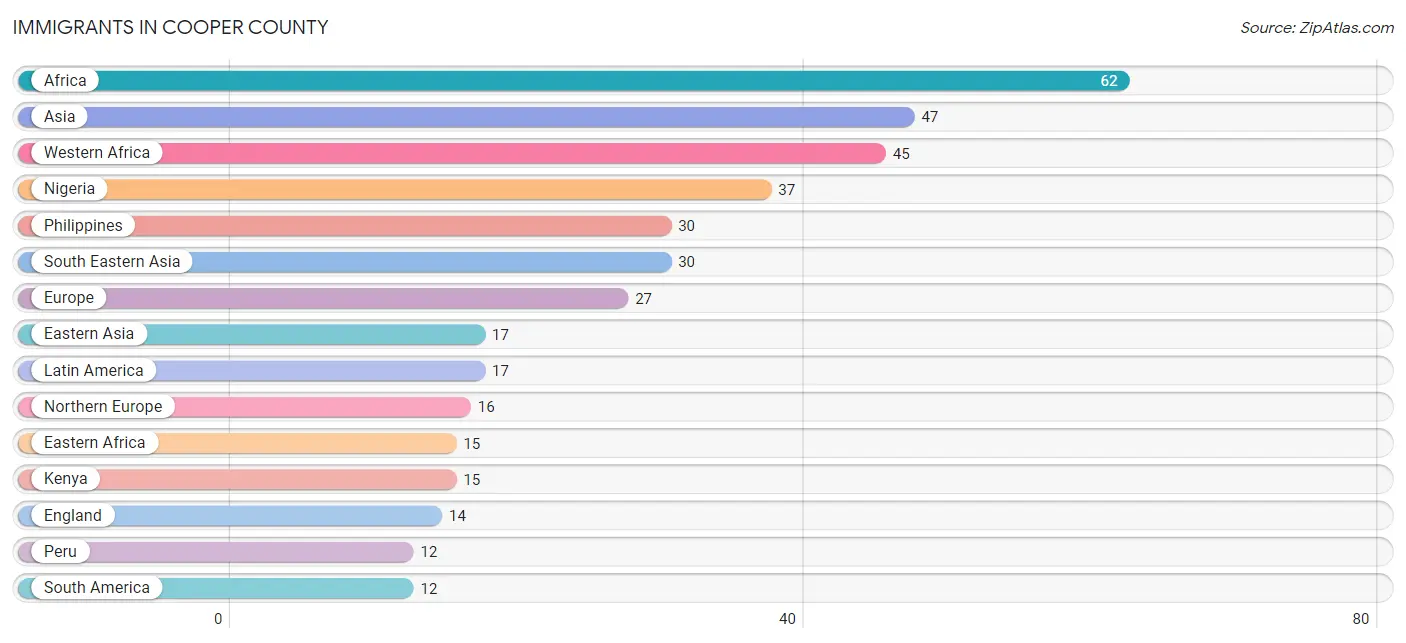
| Immigration Origin | # Population | % Population |
| Africa | 62 | 0.4% |
| Asia | 47 | 0.3% |
| Central America | 5 | 0.0% |
| China | 7 | 0.0% |
| Eastern Africa | 15 | 0.1% |
| Eastern Asia | 17 | 0.1% |
| Eastern Europe | 4 | 0.0% |
| Egypt | 2 | 0.0% |
| England | 14 | 0.1% |
| Europe | 27 | 0.2% |
| Germany | 7 | 0.0% |
| Japan | 10 | 0.1% |
| Kenya | 15 | 0.1% |
| Latin America | 17 | 0.1% |
| Liberia | 8 | 0.1% |
| Mexico | 5 | 0.0% |
| Nigeria | 37 | 0.2% |
| Northern Africa | 2 | 0.0% |
| Northern Europe | 16 | 0.1% |
| Peru | 12 | 0.1% |
| Philippines | 30 | 0.2% |
| South America | 12 | 0.1% |
| South Eastern Asia | 30 | 0.2% |
| Taiwan | 7 | 0.0% |
| Western Africa | 45 | 0.3% |
| Western Europe | 7 | 0.0% | View All 26 Rows |
Sex and Age in Cooper County
Sex and Age in Cooper County
The most populous age groups in Cooper County are 25 to 29 Years (656 | 7.7%) for men and 60 to 64 Years (593 | 7.1%) for women.
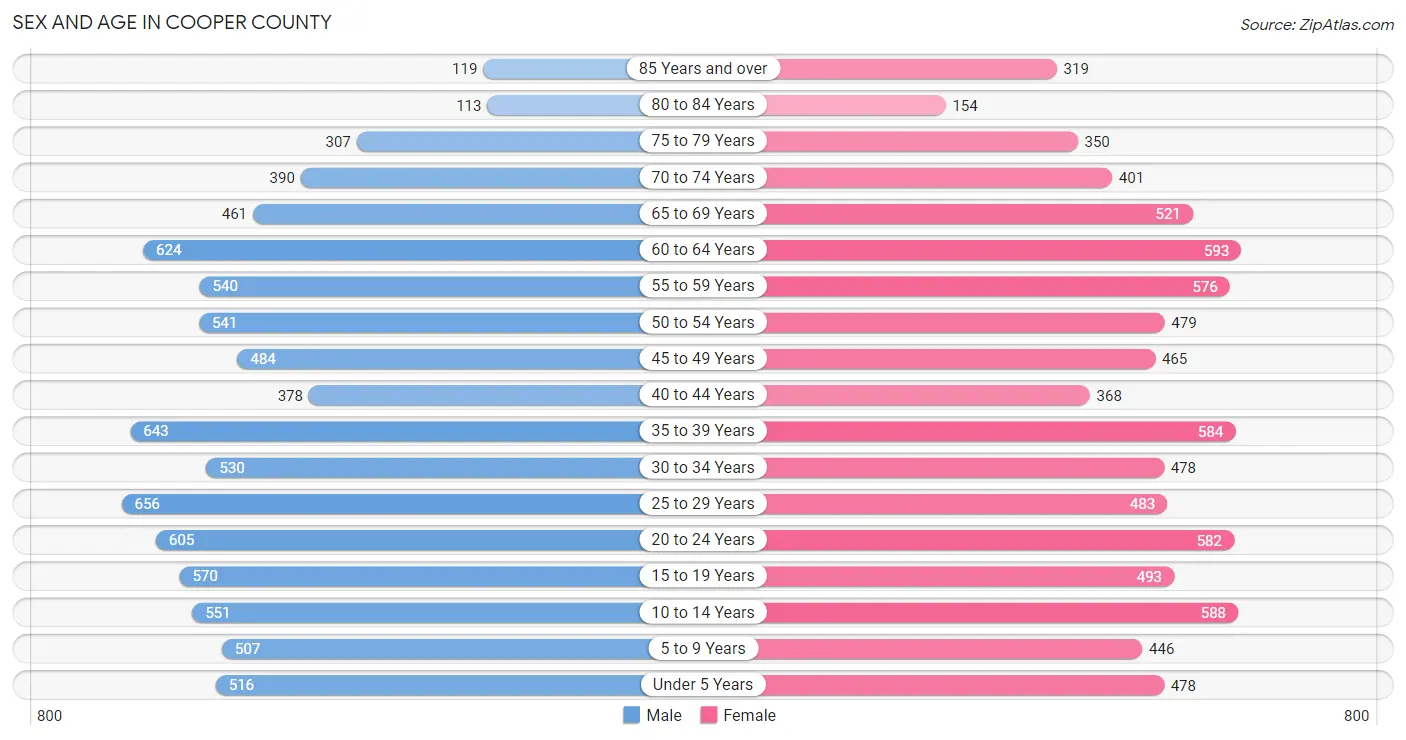
| Age Bracket | Male | Female |
| Under 5 Years | 516 (6.0%) | 478 (5.7%) |
| 5 to 9 Years | 507 (5.9%) | 446 (5.3%) |
| 10 to 14 Years | 551 (6.5%) | 588 (7.0%) |
| 15 to 19 Years | 570 (6.7%) | 493 (5.9%) |
| 20 to 24 Years | 605 (7.1%) | 582 (7.0%) |
| 25 to 29 Years | 656 (7.7%) | 483 (5.8%) |
| 30 to 34 Years | 530 (6.2%) | 478 (5.7%) |
| 35 to 39 Years | 643 (7.5%) | 584 (7.0%) |
| 40 to 44 Years | 378 (4.4%) | 368 (4.4%) |
| 45 to 49 Years | 484 (5.7%) | 465 (5.6%) |
| 50 to 54 Years | 541 (6.3%) | 479 (5.7%) |
| 55 to 59 Years | 540 (6.3%) | 576 (6.9%) |
| 60 to 64 Years | 624 (7.3%) | 593 (7.1%) |
| 65 to 69 Years | 461 (5.4%) | 521 (6.2%) |
| 70 to 74 Years | 390 (4.6%) | 401 (4.8%) |
| 75 to 79 Years | 307 (3.6%) | 350 (4.2%) |
| 80 to 84 Years | 113 (1.3%) | 154 (1.8%) |
| 85 Years and over | 119 (1.4%) | 319 (3.8%) |
| Total | 8,535 (100.0%) | 8,358 (100.0%) |
Families and Households in Cooper County
Median Family Size in Cooper County
The median family size in Cooper County is 3.01 persons per family, with married-couple families (3,170 | 74.3%) accounting for the largest median family size of 3.05 persons per family. On the other hand, single female/mother families (795 | 18.6%) represent the smallest median family size with 2.85 persons per family.
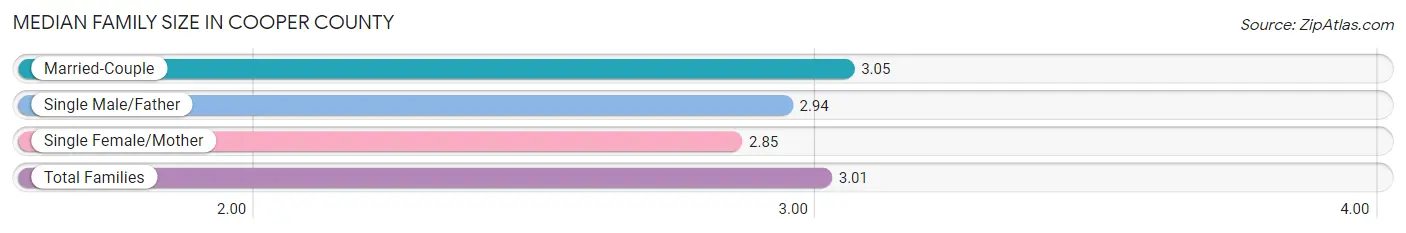
| Family Type | # Families | Family Size |
| Married-Couple | 3,170 (74.3%) | 3.05 |
| Single Male/Father | 304 (7.1%) | 2.94 |
| Single Female/Mother | 795 (18.6%) | 2.85 |
| Total Families | 4,269 (100.0%) | 3.01 |
Median Household Size in Cooper County
The median household size in Cooper County is 2.52 persons per household, with single male/father households (304 | 5.0%) accounting for the largest median household size of 3.6 persons per household. non-family households (1,856 | 30.3%) represent the smallest median household size with 1.15 persons per household.
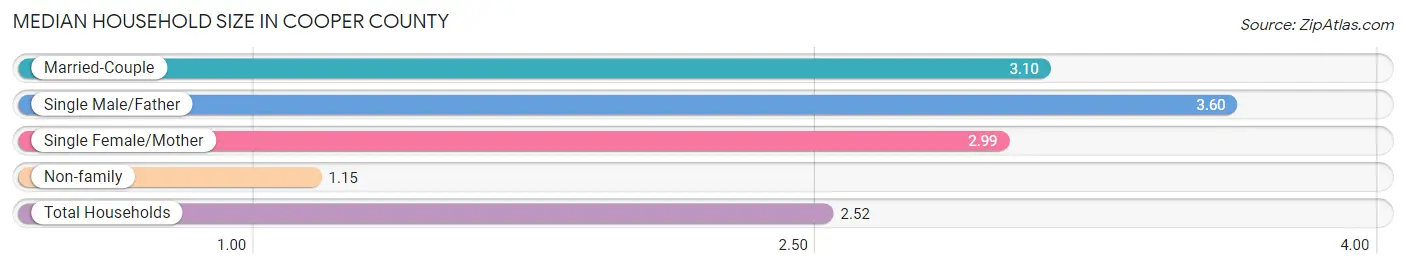
| Household Type | # Households | Household Size |
| Married-Couple | 3,170 (51.8%) | 3.10 |
| Single Male/Father | 304 (5.0%) | 3.60 |
| Single Female/Mother | 795 (13.0%) | 2.99 |
| Non-family | 1,856 (30.3%) | 1.15 |
| Total Households | 6,125 (100.0%) | 2.52 |
Household Size by Marriage Status in Cooper County
Out of a total of 6,125 households in Cooper County, 4,269 (69.7%) are family households, while 1,856 (30.3%) are nonfamily households. The most numerous type of family households are 2-person households, comprising 2,241, and the most common type of nonfamily households are 1-person households, comprising 1,620.
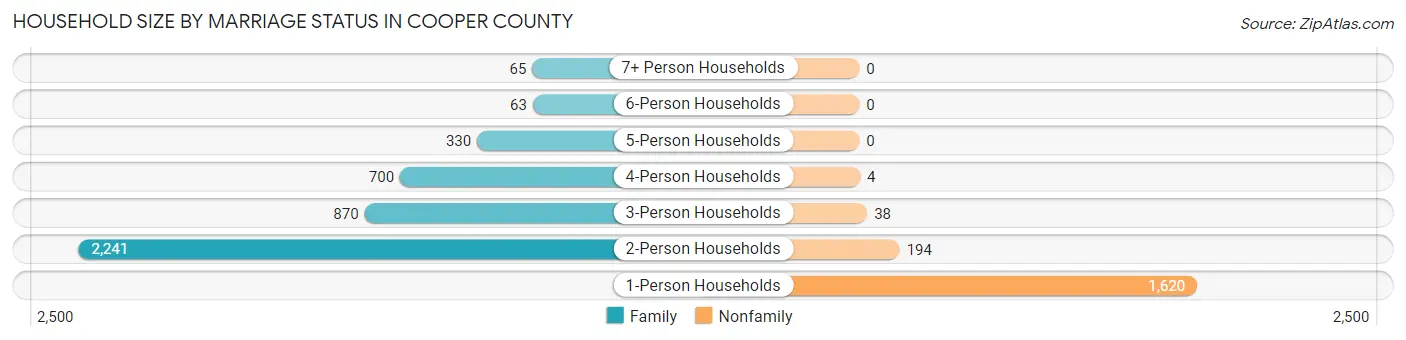
| Household Size | Family Households | Nonfamily Households |
| 1-Person Households | - | 1,620 (26.5%) |
| 2-Person Households | 2,241 (36.6%) | 194 (3.2%) |
| 3-Person Households | 870 (14.2%) | 38 (0.6%) |
| 4-Person Households | 700 (11.4%) | 4 (0.1%) |
| 5-Person Households | 330 (5.4%) | 0 (0.0%) |
| 6-Person Households | 63 (1.0%) | 0 (0.0%) |
| 7+ Person Households | 65 (1.1%) | 0 (0.0%) |
| Total | 4,269 (69.7%) | 1,856 (30.3%) |
Female Fertility in Cooper County
Fertility by Age in Cooper County
Average fertility rate in Cooper County is 63.0 births per 1,000 women. Women in the age bracket of 20 to 34 years have the highest fertility rate with 108.0 births per 1,000 women. Women in the age bracket of 20 to 34 years acount for 75.9% of all women with births.
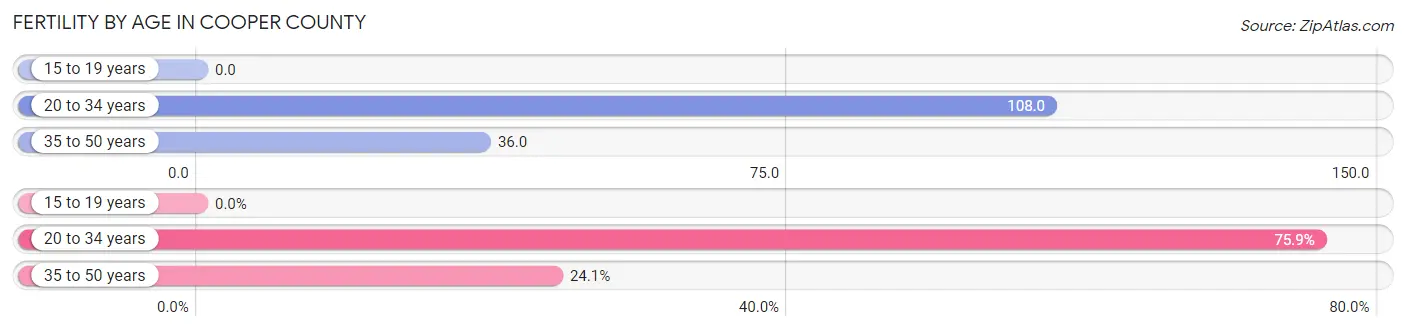
| Age Bracket | Women with Births | Births / 1,000 Women |
| 15 to 19 years | 0 (0.0%) | 0.0 |
| 20 to 34 years | 167 (75.9%) | 108.0 |
| 35 to 50 years | 53 (24.1%) | 36.0 |
| Total | 220 (100.0%) | 63.0 |
Fertility by Age by Marriage Status in Cooper County
83.6% of women with births (220) in Cooper County are married. The highest percentage of unmarried women with births falls into 35 to 50 years age bracket with 26.4% of them unmarried at the time of birth, while the lowest percentage of unmarried women with births belong to 20 to 34 years age bracket with 13.2% of them unmarried.
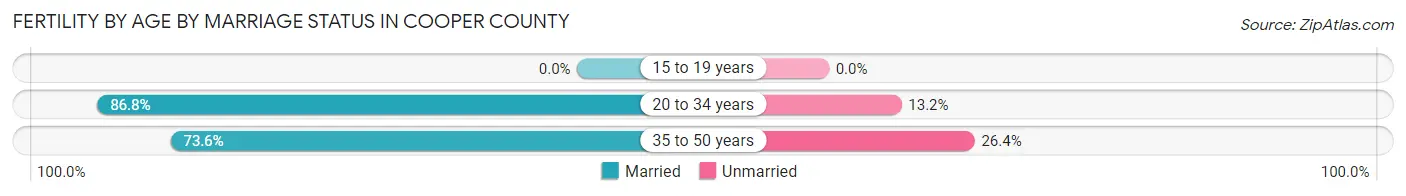
| Age Bracket | Married | Unmarried |
| 15 to 19 years | 0 (0.0%) | 0 (0.0%) |
| 20 to 34 years | 145 (86.8%) | 22 (13.2%) |
| 35 to 50 years | 39 (73.6%) | 14 (26.4%) |
| Total | 184 (83.6%) | 36 (16.4%) |
Fertility by Education in Cooper County
Average fertility rate in Cooper County is 63.0 births per 1,000 women. Women with the education attainment of bachelor's degree have the highest fertility rate of 113.0 births per 1,000 women, while women with the education attainment of high school diploma have the lowest fertility at 29.0 births per 1,000 women. Women with the education attainment of bachelor's degree represent 36.4% of all women with births.
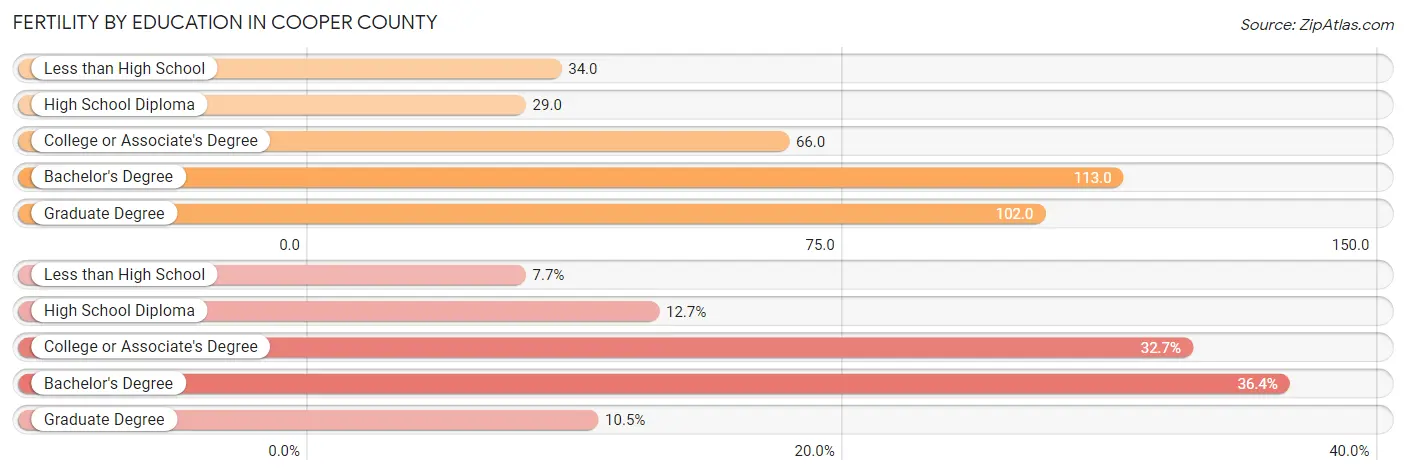
| Educational Attainment | Women with Births | Births / 1,000 Women |
| Less than High School | 17 (7.7%) | 34.0 |
| High School Diploma | 28 (12.7%) | 29.0 |
| College or Associate's Degree | 72 (32.7%) | 66.0 |
| Bachelor's Degree | 80 (36.4%) | 113.0 |
| Graduate Degree | 23 (10.4%) | 102.0 |
| Total | 220 (100.0%) | 63.0 |
Fertility by Education by Marriage Status in Cooper County
16.4% of women with births in Cooper County are unmarried. Women with the educational attainment of graduate degree are most likely to be married with 100.0% of them married at childbirth, while women with the educational attainment of bachelor's degree are least likely to be married with 22.5% of them unmarried at childbirth.
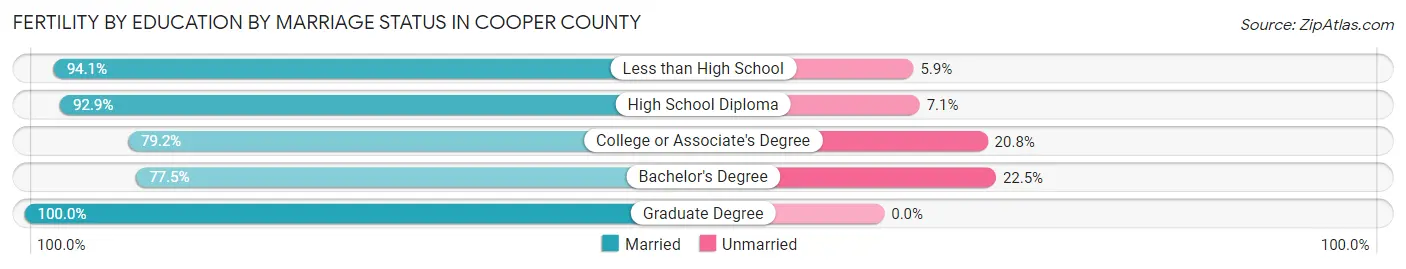
| Educational Attainment | Married | Unmarried |
| Less than High School | 16 (94.1%) | 1 (5.9%) |
| High School Diploma | 26 (92.9%) | 2 (7.1%) |
| College or Associate's Degree | 57 (79.2%) | 15 (20.8%) |
| Bachelor's Degree | 62 (77.5%) | 18 (22.5%) |
| Graduate Degree | 23 (100.0%) | 0 (0.0%) |
| Total | 184 (83.6%) | 36 (16.4%) |
Employment Characteristics in Cooper County
Employment by Class of Employer in Cooper County
Among the 7,186 employed individuals in Cooper County, private company employees (4,526 | 63.0%), local government employees (649 | 9.0%), and not-for-profit organizations (561 | 7.8%) make up the most common classes of employment.
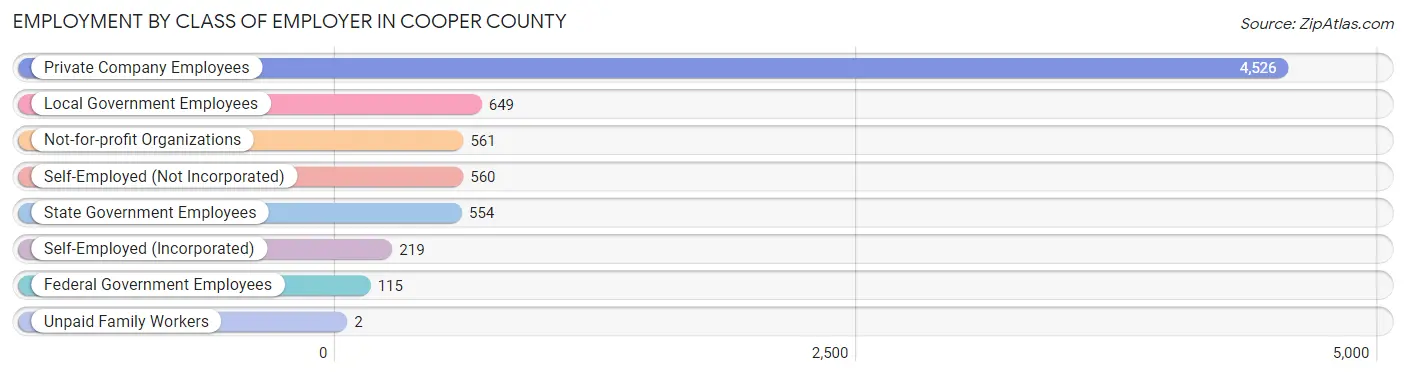
| Employer Class | # Employees | % Employees |
| Private Company Employees | 4,526 | 63.0% |
| Self-Employed (Incorporated) | 219 | 3.0% |
| Self-Employed (Not Incorporated) | 560 | 7.8% |
| Not-for-profit Organizations | 561 | 7.8% |
| Local Government Employees | 649 | 9.0% |
| State Government Employees | 554 | 7.7% |
| Federal Government Employees | 115 | 1.6% |
| Unpaid Family Workers | 2 | 0.0% |
| Total | 7,186 | 100.0% |
Employment Status by Age in Cooper County
According to the labor force statistics for Cooper County, out of the total population over 16 years of age (13,619), 56.1% or 7,640 individuals are in the labor force, with 5.0% or 382 of them unemployed. The age group with the highest labor force participation rate is 20 to 24 years, with 82.1% or 975 individuals in the labor force. Within the labor force, the 16 to 19 years age range has the highest percentage of unemployed individuals, with 25.1% or 104 of them being unemployed.
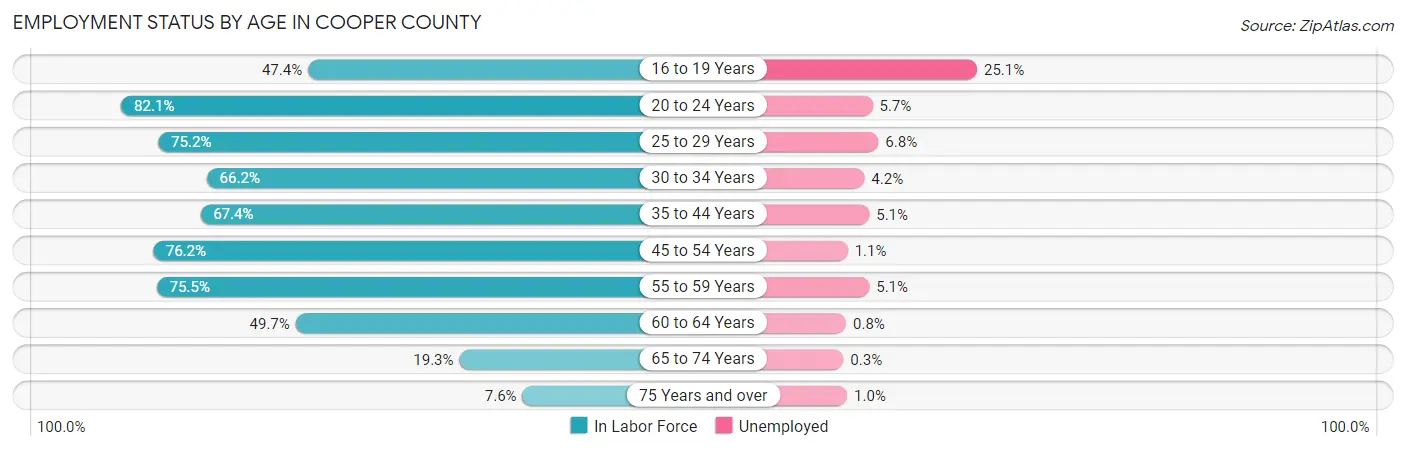
| Age Bracket | In Labor Force | Unemployed |
| 16 to 19 Years | 415 (47.4%) | 104 (25.1%) |
| 20 to 24 Years | 975 (82.1%) | 56 (5.7%) |
| 25 to 29 Years | 857 (75.2%) | 58 (6.8%) |
| 30 to 34 Years | 667 (66.2%) | 28 (4.2%) |
| 35 to 44 Years | 1,330 (67.4%) | 68 (5.1%) |
| 45 to 54 Years | 1,500 (76.2%) | 17 (1.1%) |
| 55 to 59 Years | 843 (75.5%) | 43 (5.1%) |
| 60 to 64 Years | 605 (49.7%) | 5 (0.8%) |
| 65 to 74 Years | 342 (19.3%) | 1 (0.3%) |
| 75 Years and over | 104 (7.6%) | 1 (1.0%) |
| Total | 7,640 (56.1%) | 382 (5.0%) |
Employment Status by Educational Attainment in Cooper County
According to labor force statistics for Cooper County, 68.9% of individuals (5,803) out of the total population between 25 and 64 years of age (8,422) are in the labor force, with 3.8% or 221 of them being unemployed. The group with the highest labor force participation rate are those with the educational attainment of bachelor's degree or higher, with 82.3% or 1,625 individuals in the labor force. Within the labor force, individuals with less than high school education have the highest percentage of unemployment, with 12.7% or 35 of them being unemployed.
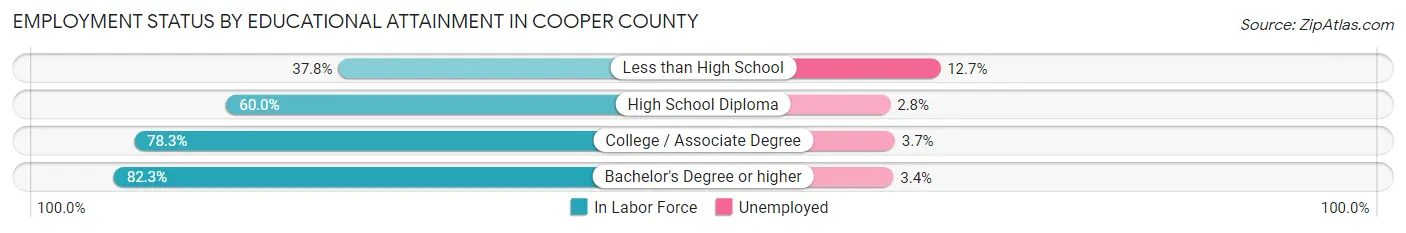
| Educational Attainment | In Labor Force | Unemployed |
| Less than High School | 275 (37.8%) | 92 (12.7%) |
| High School Diploma | 1,884 (60.0%) | 88 (2.8%) |
| College / Associate Degree | 2,020 (78.3%) | 95 (3.7%) |
| Bachelor's Degree or higher | 1,625 (82.3%) | 67 (3.4%) |
| Total | 5,803 (68.9%) | 320 (3.8%) |
Employment Occupations by Sex in Cooper County
Management, Business, Science and Arts Occupations
The most common Management, Business, Science and Arts occupations in Cooper County are Management (870 | 12.0%), Community & Social Service (646 | 8.9%), Health Diagnosing & Treating (548 | 7.5%), Education Instruction & Library (434 | 6.0%), and Business & Financial (359 | 5.0%).
Management, Business, Science and Arts Occupations by Sex
Within the Management, Business, Science and Arts occupations in Cooper County, the most male-oriented occupations are Life, Physical & Social Science (100.0%), Architecture & Engineering (76.9%), and Computers, Engineering & Science (71.8%), while the most female-oriented occupations are Health Diagnosing & Treating (92.5%), Legal Services & Support (92.1%), and Health Technologists (89.4%).
| Occupation | Male | Female |
| Management | 526 (60.5%) | 344 (39.5%) |
| Business & Financial | 107 (29.8%) | 252 (70.2%) |
| Computers, Engineering & Science | 79 (71.8%) | 31 (28.2%) |
| Computers & Mathematics | 50 (66.7%) | 25 (33.3%) |
| Architecture & Engineering | 20 (76.9%) | 6 (23.1%) |
| Life, Physical & Social Science | 9 (100.0%) | 0 (0.0%) |
| Community & Social Service | 143 (22.1%) | 503 (77.9%) |
| Education, Arts & Media | 20 (16.7%) | 100 (83.3%) |
| Legal Services & Support | 3 (7.9%) | 35 (92.1%) |
| Education Instruction & Library | 86 (19.8%) | 348 (80.2%) |
| Arts, Media & Entertainment | 34 (63.0%) | 20 (37.0%) |
| Health Diagnosing & Treating | 41 (7.5%) | 507 (92.5%) |
| Health Technologists | 37 (10.6%) | 311 (89.4%) |
| Total (Category) | 896 (35.4%) | 1,637 (64.6%) |
| Total (Overall) | 3,528 (48.6%) | 3,730 (51.4%) |
Services Occupations
The most common Services occupations in Cooper County are Food Preparation & Serving (433 | 6.0%), Cleaning & Maintenance (355 | 4.9%), Personal Care & Service (271 | 3.7%), Security & Protection (188 | 2.6%), and Healthcare Support (184 | 2.5%).
Services Occupations by Sex
Within the Services occupations in Cooper County, the most male-oriented occupations are Law Enforcement (87.3%), Cleaning & Maintenance (62.0%), and Security & Protection (60.1%), while the most female-oriented occupations are Healthcare Support (90.8%), Personal Care & Service (87.8%), and Food Preparation & Serving (66.3%).
| Occupation | Male | Female |
| Healthcare Support | 17 (9.2%) | 167 (90.8%) |
| Security & Protection | 113 (60.1%) | 75 (39.9%) |
| Firefighting & Prevention | 51 (43.6%) | 66 (56.4%) |
| Law Enforcement | 62 (87.3%) | 9 (12.7%) |
| Food Preparation & Serving | 146 (33.7%) | 287 (66.3%) |
| Cleaning & Maintenance | 220 (62.0%) | 135 (38.0%) |
| Personal Care & Service | 33 (12.2%) | 238 (87.8%) |
| Total (Category) | 529 (37.0%) | 902 (63.0%) |
| Total (Overall) | 3,528 (48.6%) | 3,730 (51.4%) |
Sales and Office Occupations
The most common Sales and Office occupations in Cooper County are Office & Administration (821 | 11.3%), and Sales & Related (539 | 7.4%).

Sales and Office Occupations by Sex
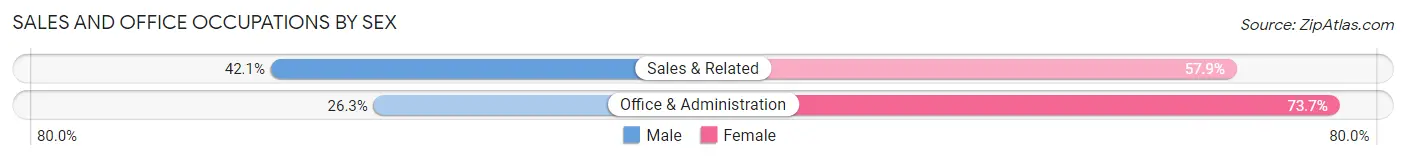
| Occupation | Male | Female |
| Sales & Related | 227 (42.1%) | 312 (57.9%) |
| Office & Administration | 216 (26.3%) | 605 (73.7%) |
| Total (Category) | 443 (32.6%) | 917 (67.4%) |
| Total (Overall) | 3,528 (48.6%) | 3,730 (51.4%) |
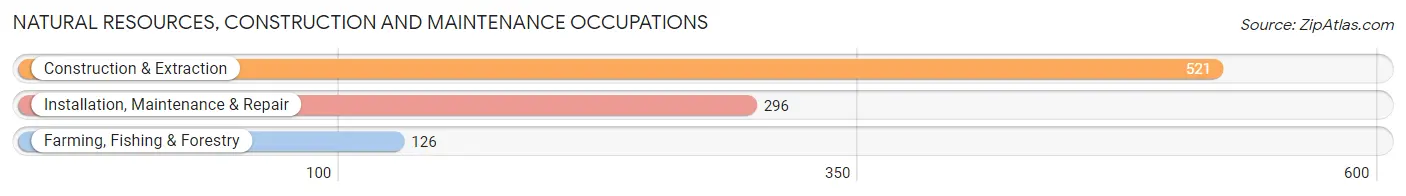
Natural Resources, Construction and Maintenance Occupations
The most common Natural Resources, Construction and Maintenance occupations in Cooper County are Construction & Extraction (521 | 7.2%), Installation, Maintenance & Repair (296 | 4.1%), and Farming, Fishing & Forestry (126 | 1.7%).
Natural Resources, Construction and Maintenance Occupations by Sex
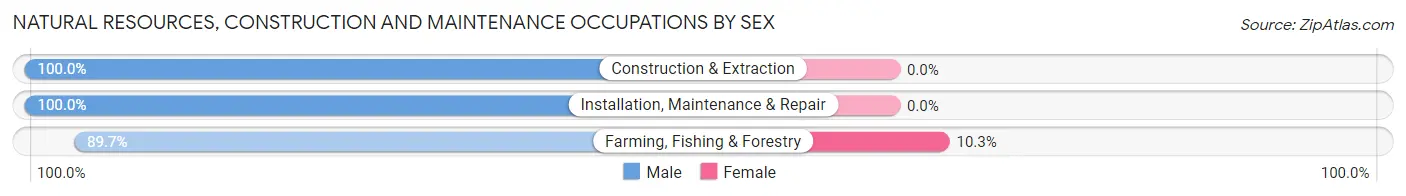
| Occupation | Male | Female |
| Farming, Fishing & Forestry | 113 (89.7%) | 13 (10.3%) |
| Construction & Extraction | 521 (100.0%) | 0 (0.0%) |
| Installation, Maintenance & Repair | 296 (100.0%) | 0 (0.0%) |
| Total (Category) | 930 (98.6%) | 13 (1.4%) |
| Total (Overall) | 3,528 (48.6%) | 3,730 (51.4%) |
Production, Transportation and Moving Occupations
The most common Production, Transportation and Moving occupations in Cooper County are Production (546 | 7.5%), Transportation (240 | 3.3%), and Material Moving (205 | 2.8%).
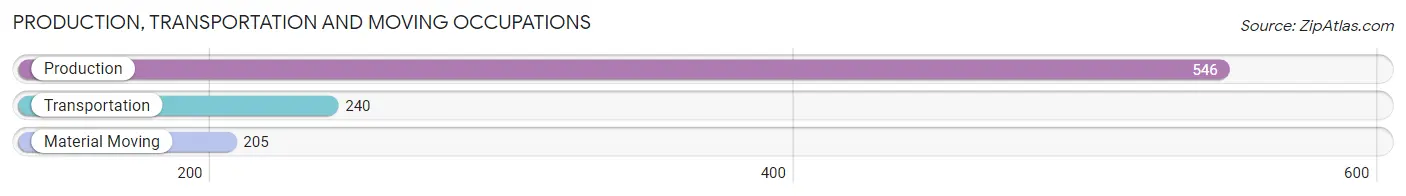
Production, Transportation and Moving Occupations by Sex
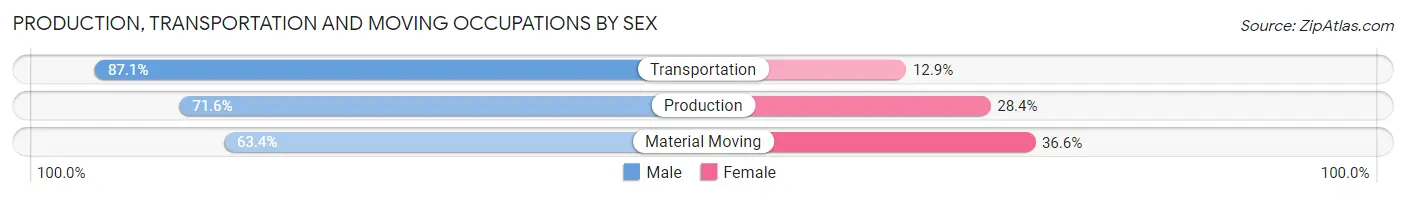
| Occupation | Male | Female |
| Production | 391 (71.6%) | 155 (28.4%) |
| Transportation | 209 (87.1%) | 31 (12.9%) |
| Material Moving | 130 (63.4%) | 75 (36.6%) |
| Total (Category) | 730 (73.7%) | 261 (26.3%) |
| Total (Overall) | 3,528 (48.6%) | 3,730 (51.4%) |
Employment Industries by Sex in Cooper County
Employment Industries in Cooper County
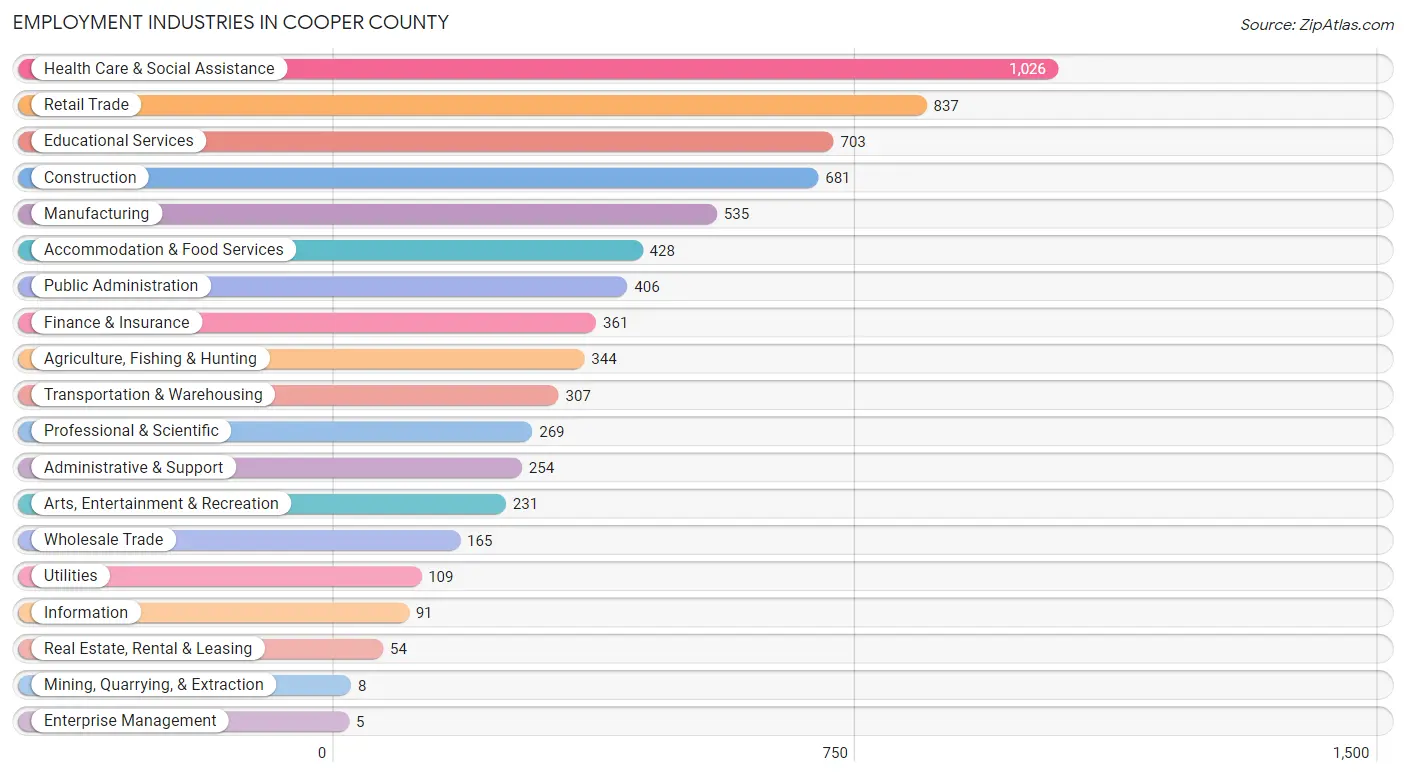
The major employment industries in Cooper County include Health Care & Social Assistance (1,026 | 14.1%), Retail Trade (837 | 11.5%), Educational Services (703 | 9.7%), Construction (681 | 9.4%), and Manufacturing (535 | 7.4%).
Employment Industries by Sex in Cooper County
The Cooper County industries that see more men than women are Mining, Quarrying, & Extraction (100.0%), Construction (97.1%), and Agriculture, Fishing & Hunting (89.5%), whereas the industries that tend to have a higher number of women are Health Care & Social Assistance (88.7%), Real Estate, Rental & Leasing (85.2%), and Finance & Insurance (82.3%).
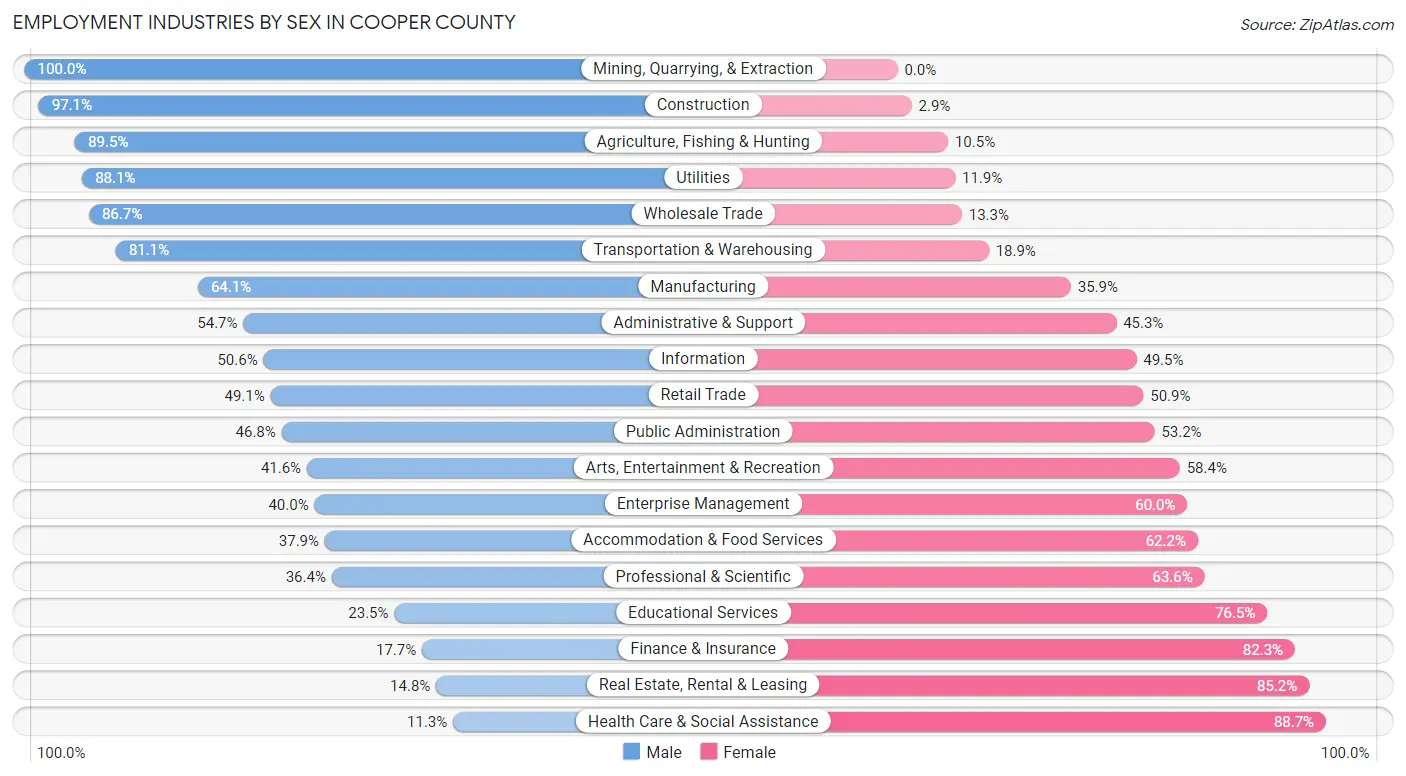
| Industry | Male | Female |
| Agriculture, Fishing & Hunting | 308 (89.5%) | 36 (10.5%) |
| Mining, Quarrying, & Extraction | 8 (100.0%) | 0 (0.0%) |
| Construction | 661 (97.1%) | 20 (2.9%) |
| Manufacturing | 343 (64.1%) | 192 (35.9%) |
| Wholesale Trade | 143 (86.7%) | 22 (13.3%) |
| Retail Trade | 411 (49.1%) | 426 (50.9%) |
| Transportation & Warehousing | 249 (81.1%) | 58 (18.9%) |
| Utilities | 96 (88.1%) | 13 (11.9%) |
| Information | 46 (50.5%) | 45 (49.4%) |
| Finance & Insurance | 64 (17.7%) | 297 (82.3%) |
| Real Estate, Rental & Leasing | 8 (14.8%) | 46 (85.2%) |
| Professional & Scientific | 98 (36.4%) | 171 (63.6%) |
| Enterprise Management | 2 (40.0%) | 3 (60.0%) |
| Administrative & Support | 139 (54.7%) | 115 (45.3%) |
| Educational Services | 165 (23.5%) | 538 (76.5%) |
| Health Care & Social Assistance | 116 (11.3%) | 910 (88.7%) |
| Arts, Entertainment & Recreation | 96 (41.6%) | 135 (58.4%) |
| Accommodation & Food Services | 162 (37.9%) | 266 (62.2%) |
| Public Administration | 190 (46.8%) | 216 (53.2%) |
| Total | 3,528 (48.6%) | 3,730 (51.4%) |
Education in Cooper County
School Enrollment in Cooper County
The most common levels of schooling among the 3,421 students in Cooper County are middle school (871 | 25.5%), high school (861 | 25.2%), and elementary school (751 | 22.0%).
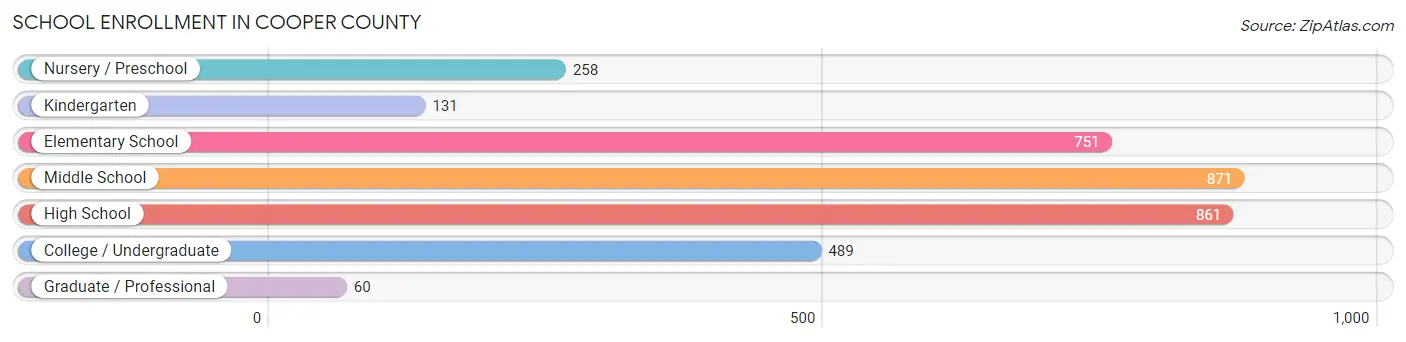
| School Level | # Students | % Students |
| Nursery / Preschool | 258 | 7.5% |
| Kindergarten | 131 | 3.8% |
| Elementary School | 751 | 22.0% |
| Middle School | 871 | 25.5% |
| High School | 861 | 25.2% |
| College / Undergraduate | 489 | 14.3% |
| Graduate / Professional | 60 | 1.8% |
| Total | 3,421 | 100.0% |
School Enrollment by Age by Funding Source in Cooper County
Out of a total of 3,421 students who are enrolled in schools in Cooper County, 770 (22.5%) attend a private institution, while the remaining 2,651 (77.5%) are enrolled in public schools. The age group of 35 years and over has the highest likelihood of being enrolled in private schools, with 42 (48.3% in the age bracket) enrolled. Conversely, the age group of 15 to 17 year olds has the lowest likelihood of being enrolled in a private school, with 550 (89.7% in the age bracket) attending a public institution.
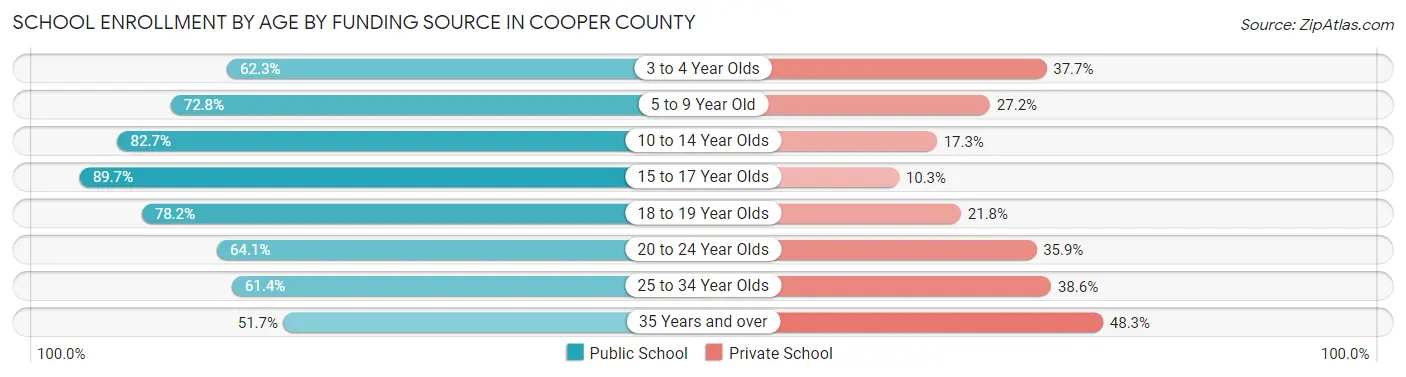
| Age Bracket | Public School | Private School |
| 3 to 4 Year Olds | 66 (62.3%) | 40 (37.7%) |
| 5 to 9 Year Old | 625 (72.8%) | 234 (27.2%) |
| 10 to 14 Year Olds | 935 (82.7%) | 196 (17.3%) |
| 15 to 17 Year Olds | 550 (89.7%) | 63 (10.3%) |
| 18 to 19 Year Olds | 179 (78.2%) | 50 (21.8%) |
| 20 to 24 Year Olds | 161 (64.1%) | 90 (35.9%) |
| 25 to 34 Year Olds | 89 (61.4%) | 56 (38.6%) |
| 35 Years and over | 45 (51.7%) | 42 (48.3%) |
| Total | 2,651 (77.5%) | 770 (22.5%) |
Educational Attainment by Field of Study in Cooper County
Education (695 | 24.2%), business (508 | 17.7%), bio, nature & agricultural (318 | 11.1%), arts & humanities (218 | 7.6%), and science & technology (216 | 7.5%) are the most common fields of study among 2,873 individuals in Cooper County who have obtained a bachelor's degree or higher.
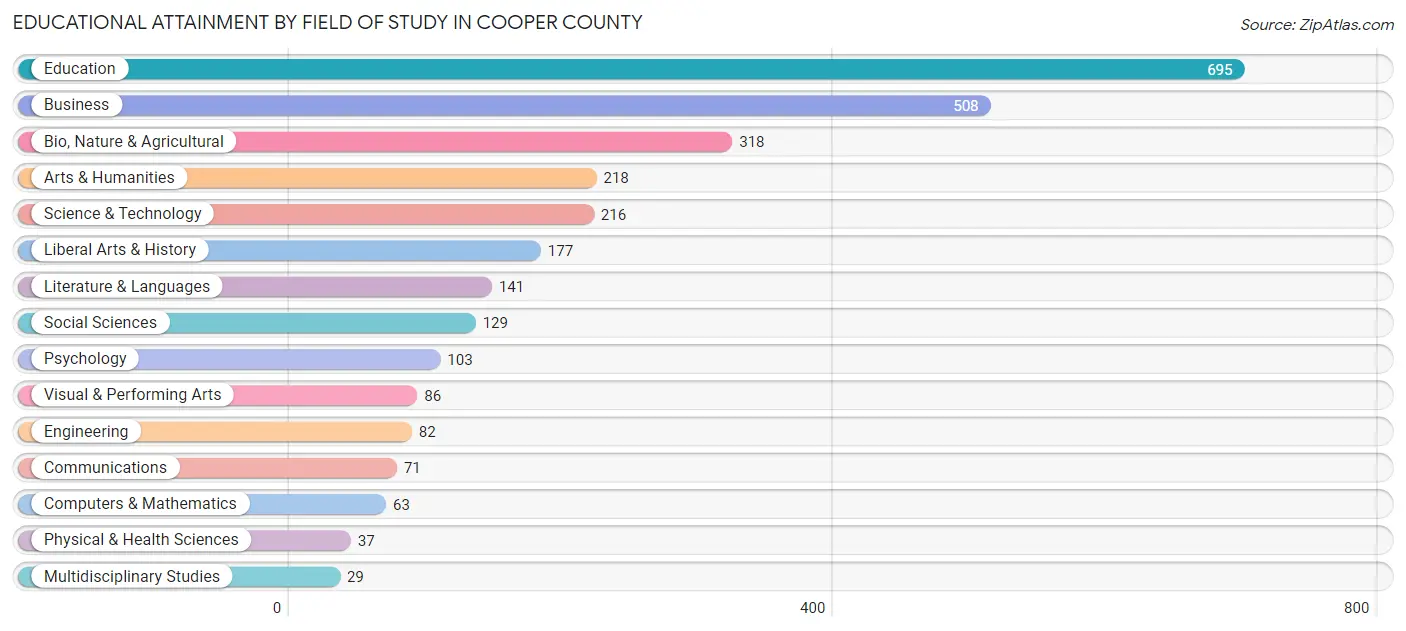
| Field of Study | # Graduates | % Graduates |
| Computers & Mathematics | 63 | 2.2% |
| Bio, Nature & Agricultural | 318 | 11.1% |
| Physical & Health Sciences | 37 | 1.3% |
| Psychology | 103 | 3.6% |
| Social Sciences | 129 | 4.5% |
| Engineering | 82 | 2.9% |
| Multidisciplinary Studies | 29 | 1.0% |
| Science & Technology | 216 | 7.5% |
| Business | 508 | 17.7% |
| Education | 695 | 24.2% |
| Literature & Languages | 141 | 4.9% |
| Liberal Arts & History | 177 | 6.2% |
| Visual & Performing Arts | 86 | 3.0% |
| Communications | 71 | 2.5% |
| Arts & Humanities | 218 | 7.6% |
| Total | 2,873 | 100.0% |
Transportation & Commute in Cooper County
Vehicle Availability by Sex in Cooper County
The most prevalent vehicle ownership categories in Cooper County are males with 2 vehicles (1,292, accounting for 37.0%) and females with 2 vehicles (1,381, making up 35.0%).
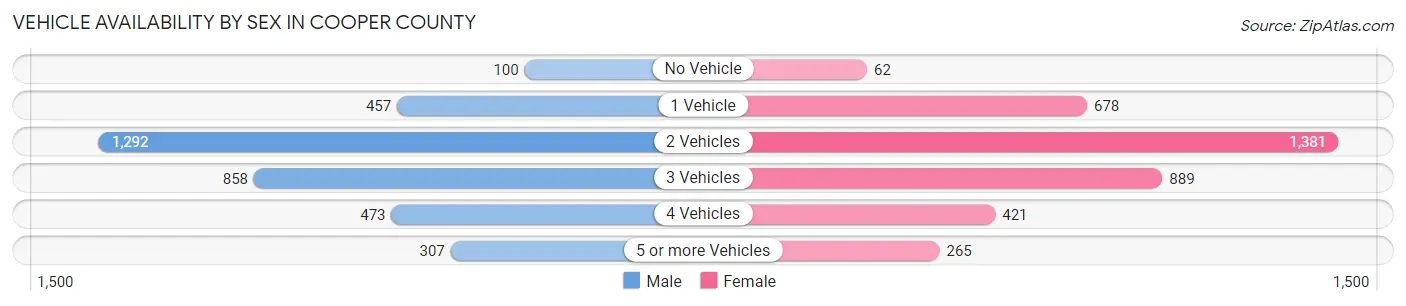
| Vehicles Available | Male | Female |
| No Vehicle | 100 (2.9%) | 62 (1.7%) |
| 1 Vehicle | 457 (13.1%) | 678 (18.3%) |
| 2 Vehicles | 1,292 (37.0%) | 1,381 (37.4%) |
| 3 Vehicles | 858 (24.6%) | 889 (24.0%) |
| 4 Vehicles | 473 (13.6%) | 421 (11.4%) |
| 5 or more Vehicles | 307 (8.8%) | 265 (7.2%) |
| Total | 3,487 (100.0%) | 3,696 (100.0%) |
Commute Time in Cooper County
The most frequently occuring commute durations in Cooper County are 30 to 34 minutes (1,179 commuters, 17.3%), 5 to 9 minutes (1,000 commuters, 14.7%), and 10 to 14 minutes (815 commuters, 12.0%).
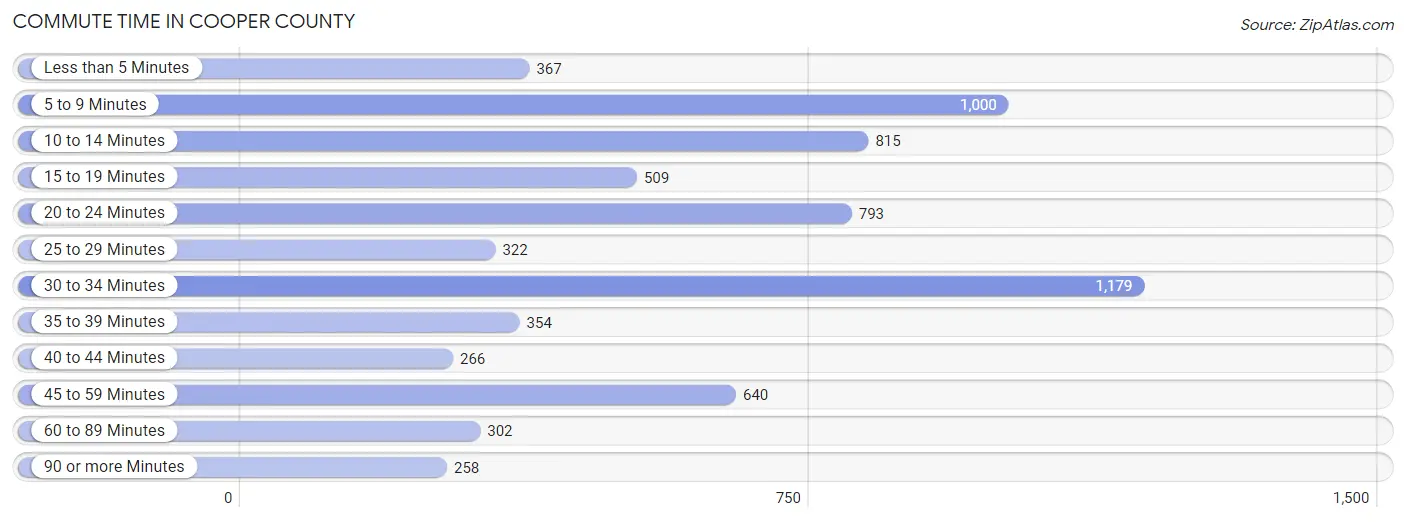
| Commute Time | # Commuters | % Commuters |
| Less than 5 Minutes | 367 | 5.4% |
| 5 to 9 Minutes | 1,000 | 14.7% |
| 10 to 14 Minutes | 815 | 12.0% |
| 15 to 19 Minutes | 509 | 7.5% |
| 20 to 24 Minutes | 793 | 11.7% |
| 25 to 29 Minutes | 322 | 4.7% |
| 30 to 34 Minutes | 1,179 | 17.3% |
| 35 to 39 Minutes | 354 | 5.2% |
| 40 to 44 Minutes | 266 | 3.9% |
| 45 to 59 Minutes | 640 | 9.4% |
| 60 to 89 Minutes | 302 | 4.4% |
| 90 or more Minutes | 258 | 3.8% |
Commute Time by Sex in Cooper County
The most common commute times in Cooper County are 5 to 9 minutes (490 commuters, 14.8%) for males and 30 to 34 minutes (691 commuters, 19.8%) for females.
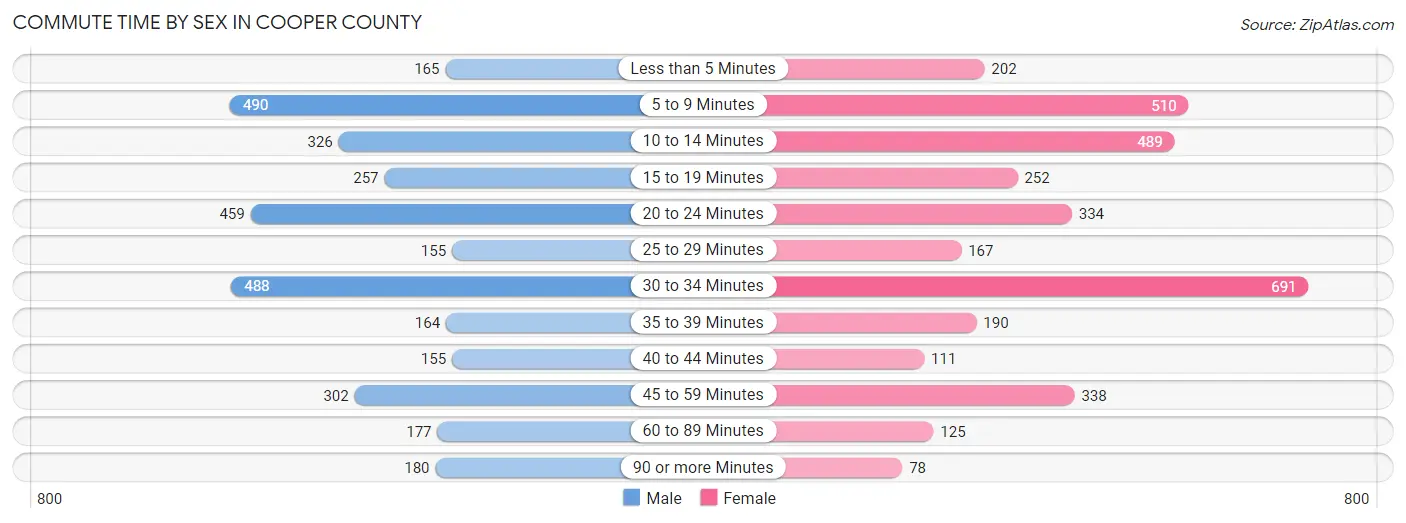
| Commute Time | Male | Female |
| Less than 5 Minutes | 165 (5.0%) | 202 (5.8%) |
| 5 to 9 Minutes | 490 (14.8%) | 510 (14.6%) |
| 10 to 14 Minutes | 326 (9.8%) | 489 (14.0%) |
| 15 to 19 Minutes | 257 (7.7%) | 252 (7.2%) |
| 20 to 24 Minutes | 459 (13.8%) | 334 (9.6%) |
| 25 to 29 Minutes | 155 (4.7%) | 167 (4.8%) |
| 30 to 34 Minutes | 488 (14.7%) | 691 (19.8%) |
| 35 to 39 Minutes | 164 (4.9%) | 190 (5.4%) |
| 40 to 44 Minutes | 155 (4.7%) | 111 (3.2%) |
| 45 to 59 Minutes | 302 (9.1%) | 338 (9.7%) |
| 60 to 89 Minutes | 177 (5.3%) | 125 (3.6%) |
| 90 or more Minutes | 180 (5.4%) | 78 (2.2%) |
Time of Departure to Work by Sex in Cooper County
The most frequent times of departure to work in Cooper County are 7:00 AM to 7:29 AM (673, 20.3%) for males and 7:00 AM to 7:29 AM (643, 18.4%) for females.
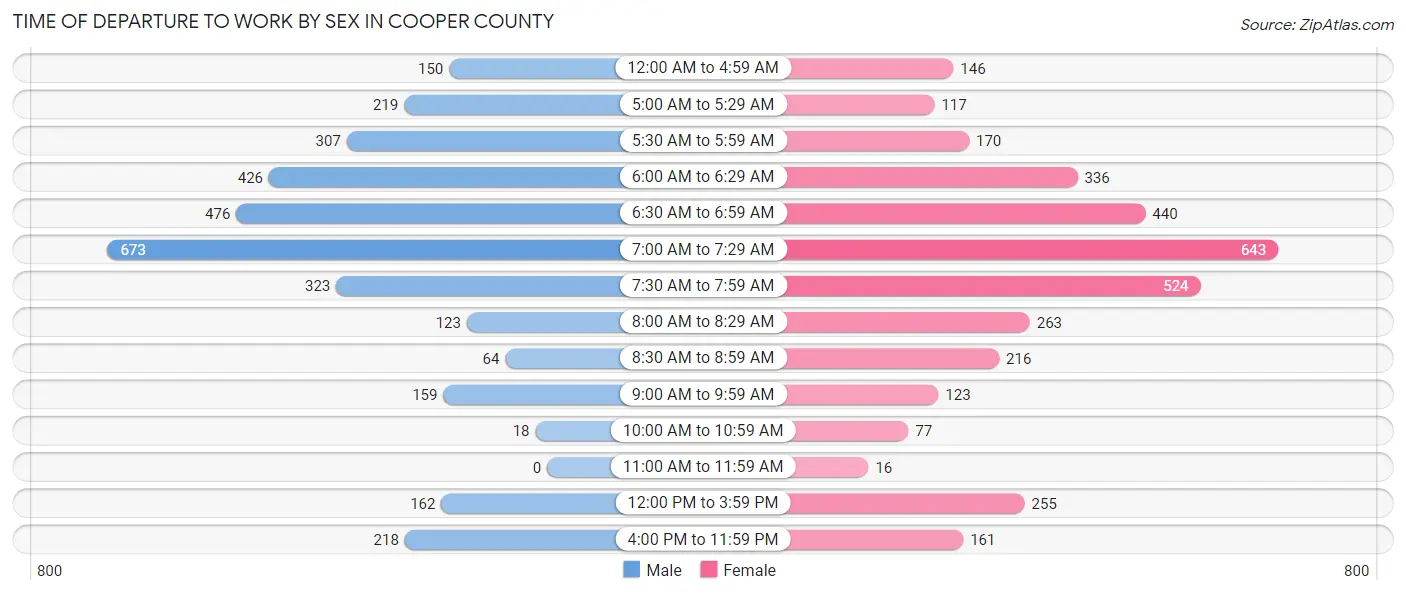
| Time of Departure | Male | Female |
| 12:00 AM to 4:59 AM | 150 (4.5%) | 146 (4.2%) |
| 5:00 AM to 5:29 AM | 219 (6.6%) | 117 (3.4%) |
| 5:30 AM to 5:59 AM | 307 (9.2%) | 170 (4.9%) |
| 6:00 AM to 6:29 AM | 426 (12.8%) | 336 (9.6%) |
| 6:30 AM to 6:59 AM | 476 (14.3%) | 440 (12.6%) |
| 7:00 AM to 7:29 AM | 673 (20.3%) | 643 (18.4%) |
| 7:30 AM to 7:59 AM | 323 (9.7%) | 524 (15.0%) |
| 8:00 AM to 8:29 AM | 123 (3.7%) | 263 (7.5%) |
| 8:30 AM to 8:59 AM | 64 (1.9%) | 216 (6.2%) |
| 9:00 AM to 9:59 AM | 159 (4.8%) | 123 (3.5%) |
| 10:00 AM to 10:59 AM | 18 (0.5%) | 77 (2.2%) |
| 11:00 AM to 11:59 AM | 0 (0.0%) | 16 (0.5%) |
| 12:00 PM to 3:59 PM | 162 (4.9%) | 255 (7.3%) |
| 4:00 PM to 11:59 PM | 218 (6.6%) | 161 (4.6%) |
| Total | 3,318 (100.0%) | 3,487 (100.0%) |
Housing Occupancy in Cooper County
Occupancy by Ownership in Cooper County
Of the total 6,125 dwellings in Cooper County, owner-occupied units account for 4,708 (76.9%), while renter-occupied units make up 1,417 (23.1%).
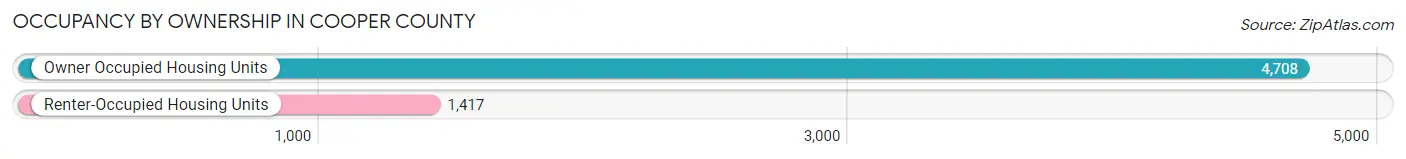
| Occupancy | # Housing Units | % Housing Units |
| Owner Occupied Housing Units | 4,708 | 76.9% |
| Renter-Occupied Housing Units | 1,417 | 23.1% |
| Total Occupied Housing Units | 6,125 | 100.0% |
Occupancy by Household Size in Cooper County
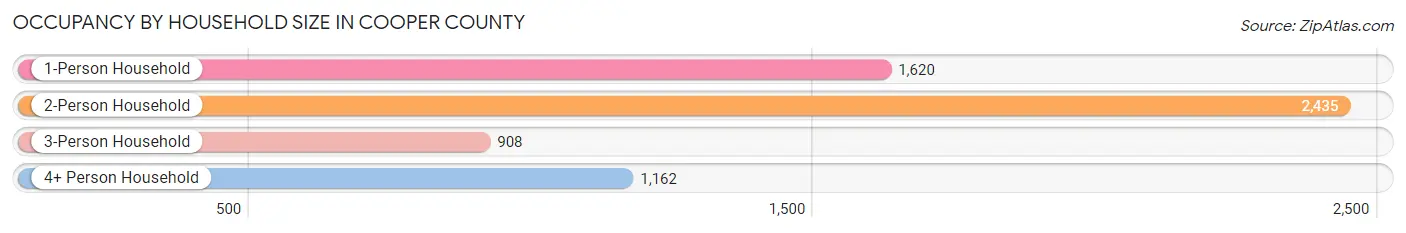
| Household Size | # Housing Units | % Housing Units |
| 1-Person Household | 1,620 | 26.5% |
| 2-Person Household | 2,435 | 39.8% |
| 3-Person Household | 908 | 14.8% |
| 4+ Person Household | 1,162 | 19.0% |
| Total Housing Units | 6,125 | 100.0% |
Occupancy by Ownership by Household Size in Cooper County
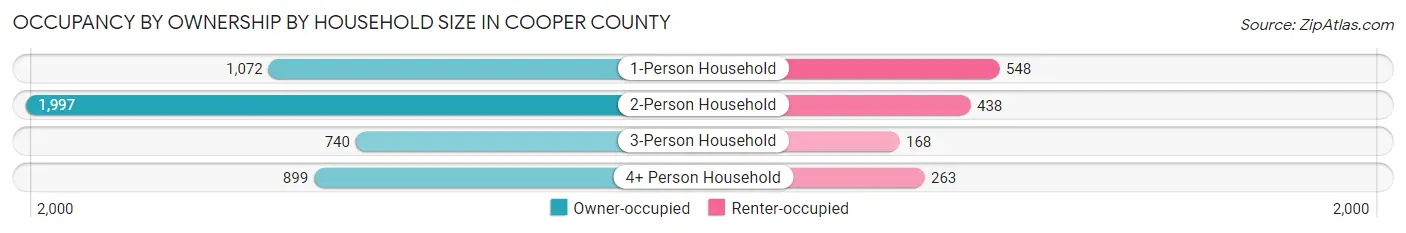
| Household Size | Owner-occupied | Renter-occupied |
| 1-Person Household | 1,072 (66.2%) | 548 (33.8%) |
| 2-Person Household | 1,997 (82.0%) | 438 (18.0%) |
| 3-Person Household | 740 (81.5%) | 168 (18.5%) |
| 4+ Person Household | 899 (77.4%) | 263 (22.6%) |
| Total Housing Units | 4,708 (76.9%) | 1,417 (23.1%) |
Occupancy by Educational Attainment in Cooper County
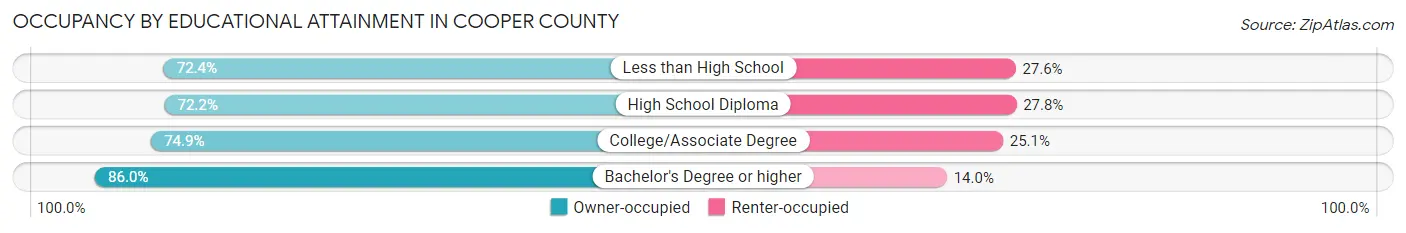
| Household Size | Owner-occupied | Renter-occupied |
| Less than High School | 333 (72.4%) | 127 (27.6%) |
| High School Diploma | 1,416 (72.2%) | 544 (27.8%) |
| College/Associate Degree | 1,533 (74.9%) | 514 (25.1%) |
| Bachelor's Degree or higher | 1,426 (86.0%) | 232 (14.0%) |
Occupancy by Age of Householder in Cooper County
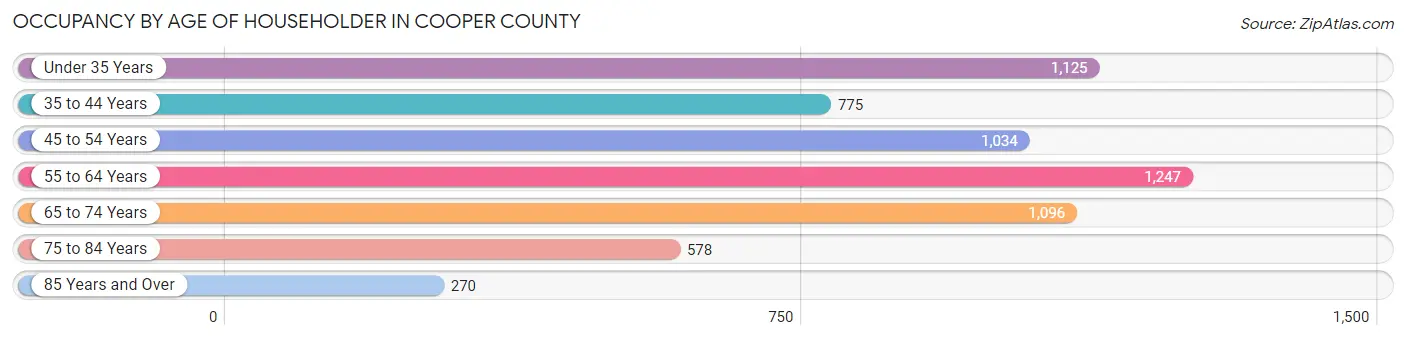
| Age Bracket | # Households | % Households |
| Under 35 Years | 1,125 | 18.4% |
| 35 to 44 Years | 775 | 12.7% |
| 45 to 54 Years | 1,034 | 16.9% |
| 55 to 64 Years | 1,247 | 20.4% |
| 65 to 74 Years | 1,096 | 17.9% |
| 75 to 84 Years | 578 | 9.4% |
| 85 Years and Over | 270 | 4.4% |
| Total | 6,125 | 100.0% |
Housing Finances in Cooper County
Median Income by Occupancy in Cooper County
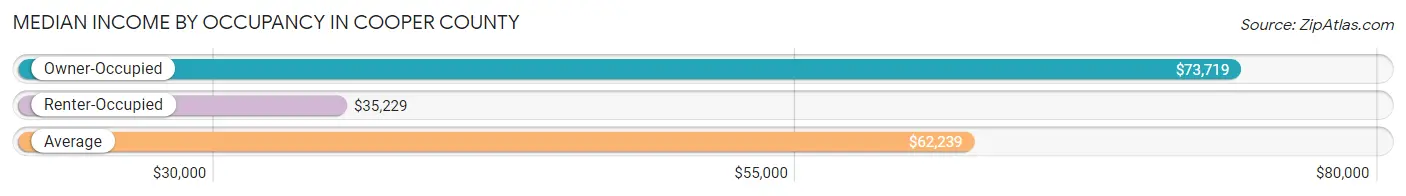
| Occupancy Type | # Households | Median Income |
| Owner-Occupied | 4,708 (76.9%) | $73,719 |
| Renter-Occupied | 1,417 (23.1%) | $35,229 |
| Average | 6,125 (100.0%) | $62,239 |
Occupancy by Householder Income Bracket in Cooper County
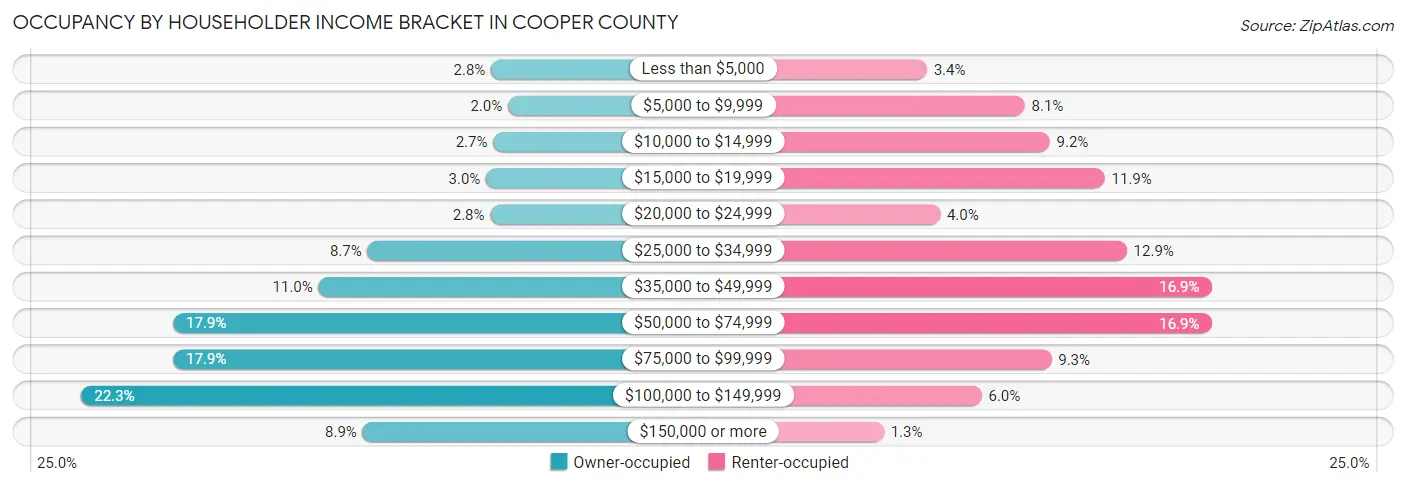
| Income Bracket | Owner-occupied | Renter-occupied |
| Less than $5,000 | 131 (2.8%) | 48 (3.4%) |
| $5,000 to $9,999 | 93 (2.0%) | 114 (8.1%) |
| $10,000 to $14,999 | 126 (2.7%) | 131 (9.2%) |
| $15,000 to $19,999 | 142 (3.0%) | 168 (11.9%) |
| $20,000 to $24,999 | 133 (2.8%) | 57 (4.0%) |
| $25,000 to $34,999 | 408 (8.7%) | 183 (12.9%) |
| $35,000 to $49,999 | 518 (11.0%) | 240 (16.9%) |
| $50,000 to $74,999 | 844 (17.9%) | 240 (16.9%) |
| $75,000 to $99,999 | 844 (17.9%) | 132 (9.3%) |
| $100,000 to $149,999 | 1,050 (22.3%) | 85 (6.0%) |
| $150,000 or more | 419 (8.9%) | 19 (1.3%) |
| Total | 4,708 (100.0%) | 1,417 (100.0%) |
Monthly Housing Cost Tiers in Cooper County
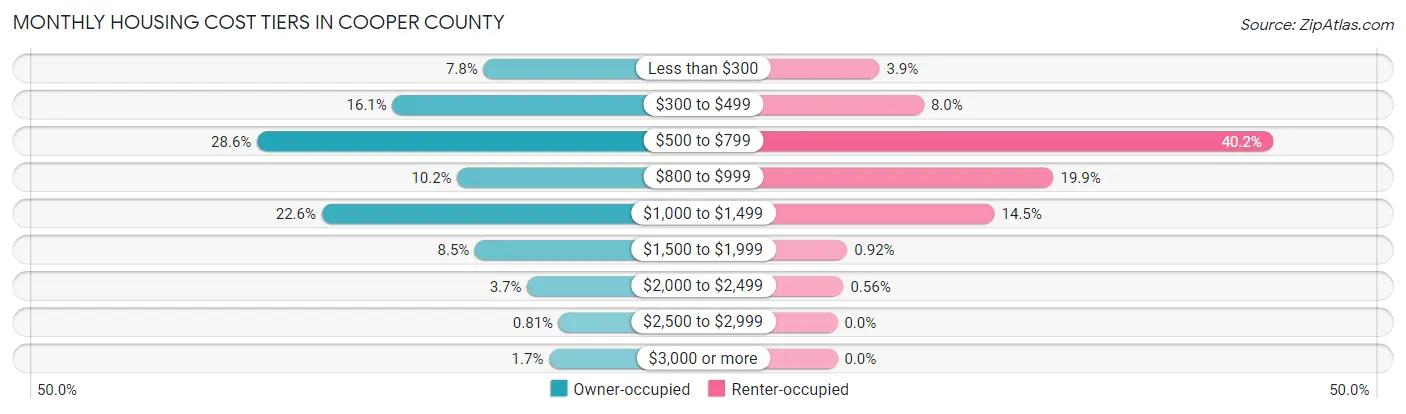
| Monthly Cost | Owner-occupied | Renter-occupied |
| Less than $300 | 365 (7.7%) | 55 (3.9%) |
| $300 to $499 | 759 (16.1%) | 113 (8.0%) |
| $500 to $799 | 1,346 (28.6%) | 569 (40.2%) |
| $800 to $999 | 478 (10.2%) | 282 (19.9%) |
| $1,000 to $1,499 | 1,066 (22.6%) | 205 (14.5%) |
| $1,500 to $1,999 | 401 (8.5%) | 13 (0.9%) |
| $2,000 to $2,499 | 175 (3.7%) | 8 (0.6%) |
| $2,500 to $2,999 | 38 (0.8%) | 0 (0.0%) |
| $3,000 or more | 80 (1.7%) | 0 (0.0%) |
| Total | 4,708 (100.0%) | 1,417 (100.0%) |
Physical Housing Characteristics in Cooper County
Housing Structures in Cooper County
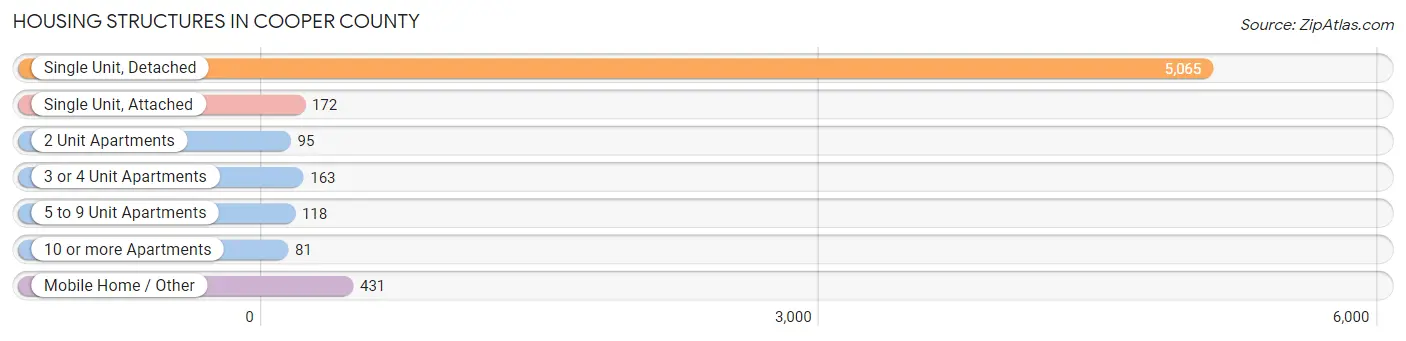
| Structure Type | # Housing Units | % Housing Units |
| Single Unit, Detached | 5,065 | 82.7% |
| Single Unit, Attached | 172 | 2.8% |
| 2 Unit Apartments | 95 | 1.5% |
| 3 or 4 Unit Apartments | 163 | 2.7% |
| 5 to 9 Unit Apartments | 118 | 1.9% |
| 10 or more Apartments | 81 | 1.3% |
| Mobile Home / Other | 431 | 7.0% |
| Total | 6,125 | 100.0% |
Housing Structures by Occupancy in Cooper County
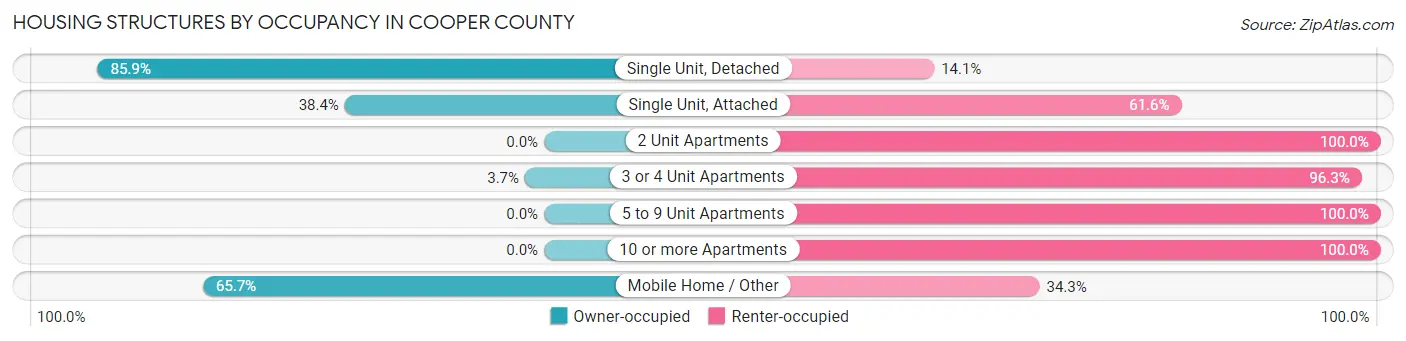
| Structure Type | Owner-occupied | Renter-occupied |
| Single Unit, Detached | 4,353 (85.9%) | 712 (14.1%) |
| Single Unit, Attached | 66 (38.4%) | 106 (61.6%) |
| 2 Unit Apartments | 0 (0.0%) | 95 (100.0%) |
| 3 or 4 Unit Apartments | 6 (3.7%) | 157 (96.3%) |
| 5 to 9 Unit Apartments | 0 (0.0%) | 118 (100.0%) |
| 10 or more Apartments | 0 (0.0%) | 81 (100.0%) |
| Mobile Home / Other | 283 (65.7%) | 148 (34.3%) |
| Total | 4,708 (76.9%) | 1,417 (23.1%) |
Housing Structures by Number of Rooms in Cooper County
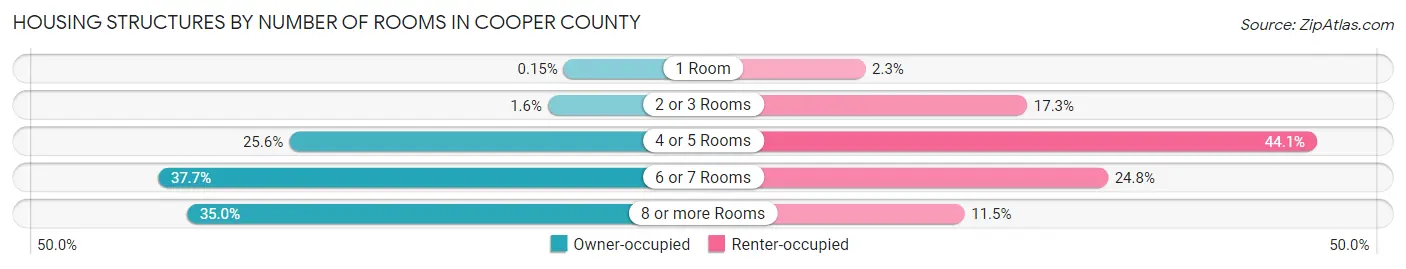
| Number of Rooms | Owner-occupied | Renter-occupied |
| 1 Room | 7 (0.2%) | 33 (2.3%) |
| 2 or 3 Rooms | 76 (1.6%) | 245 (17.3%) |
| 4 or 5 Rooms | 1,203 (25.6%) | 625 (44.1%) |
| 6 or 7 Rooms | 1,774 (37.7%) | 351 (24.8%) |
| 8 or more Rooms | 1,648 (35.0%) | 163 (11.5%) |
| Total | 4,708 (100.0%) | 1,417 (100.0%) |
Housing Structure by Heating Type in Cooper County
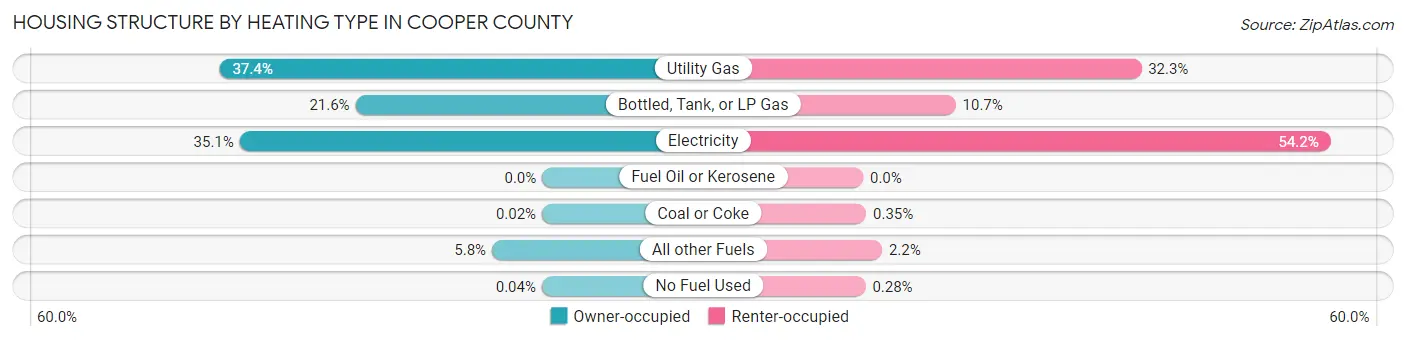
| Heating Type | Owner-occupied | Renter-occupied |
| Utility Gas | 1,761 (37.4%) | 457 (32.3%) |
| Bottled, Tank, or LP Gas | 1,019 (21.6%) | 152 (10.7%) |
| Electricity | 1,651 (35.1%) | 768 (54.2%) |
| Fuel Oil or Kerosene | 0 (0.0%) | 0 (0.0%) |
| Coal or Coke | 1 (0.0%) | 5 (0.4%) |
| All other Fuels | 274 (5.8%) | 31 (2.2%) |
| No Fuel Used | 2 (0.0%) | 4 (0.3%) |
| Total | 4,708 (100.0%) | 1,417 (100.0%) |
Household Vehicle Usage in Cooper County
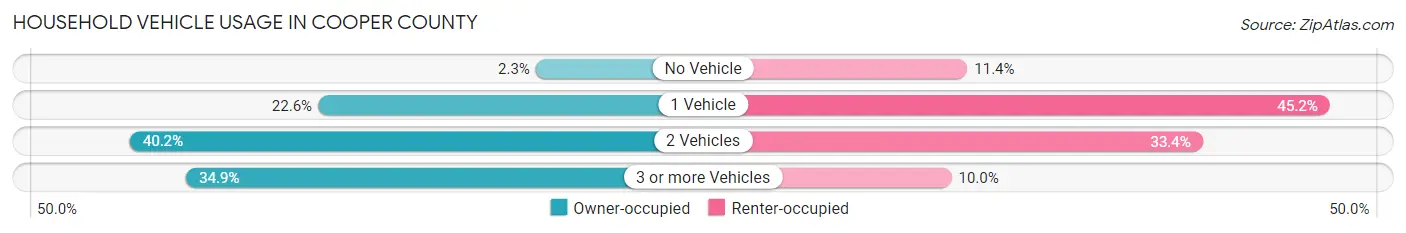
| Vehicles per Household | Owner-occupied | Renter-occupied |
| No Vehicle | 108 (2.3%) | 162 (11.4%) |
| 1 Vehicle | 1,065 (22.6%) | 641 (45.2%) |
| 2 Vehicles | 1,891 (40.2%) | 473 (33.4%) |
| 3 or more Vehicles | 1,644 (34.9%) | 141 (10.0%) |
| Total | 4,708 (100.0%) | 1,417 (100.0%) |
Real Estate & Mortgages in Cooper County
Real Estate and Mortgage Overview in Cooper County
| Characteristic | Without Mortgage | With Mortgage |
| Housing Units | 2,045 | 2,663 |
| Median Property Value | $151,700 | $178,800 |
| Median Household Income | $56,681 | $293 |
| Monthly Housing Costs | $479 | $80 |
| Real Estate Taxes | $1,206 | $93 |
Property Value by Mortgage Status in Cooper County
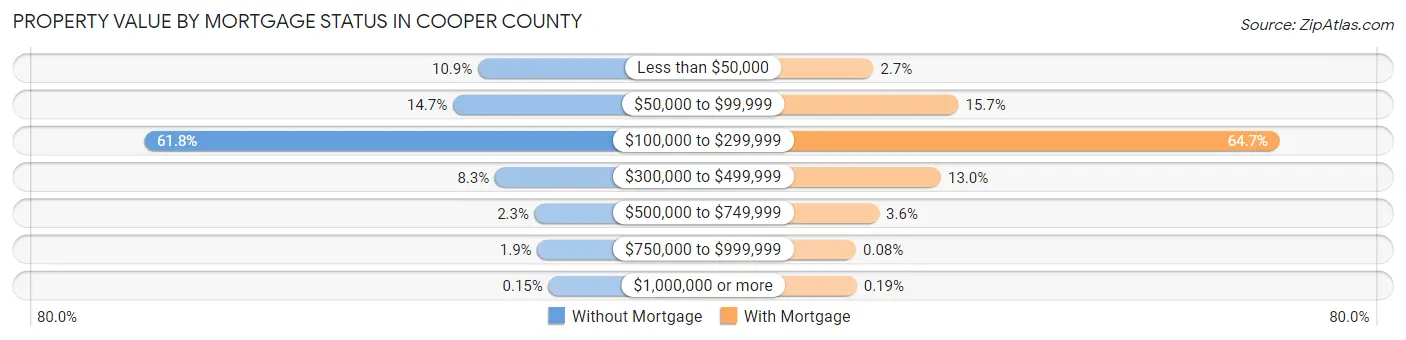
| Property Value | Without Mortgage | With Mortgage |
| Less than $50,000 | 223 (10.9%) | 73 (2.7%) |
| $50,000 to $99,999 | 301 (14.7%) | 418 (15.7%) |
| $100,000 to $299,999 | 1,264 (61.8%) | 1,722 (64.7%) |
| $300,000 to $499,999 | 170 (8.3%) | 347 (13.0%) |
| $500,000 to $749,999 | 46 (2.2%) | 96 (3.6%) |
| $750,000 to $999,999 | 38 (1.9%) | 2 (0.1%) |
| $1,000,000 or more | 3 (0.2%) | 5 (0.2%) |
| Total | 2,045 (100.0%) | 2,663 (100.0%) |
Household Income by Mortgage Status in Cooper County
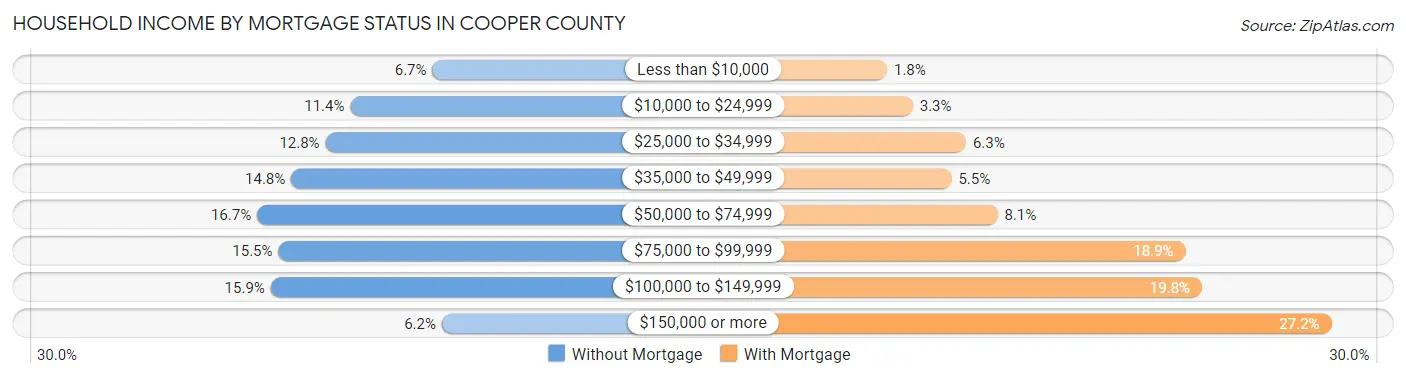
| Household Income | Without Mortgage | With Mortgage |
| Less than $10,000 | 137 (6.7%) | 48 (1.8%) |
| $10,000 to $24,999 | 233 (11.4%) | 87 (3.3%) |
| $25,000 to $34,999 | 262 (12.8%) | 168 (6.3%) |
| $35,000 to $49,999 | 302 (14.8%) | 146 (5.5%) |
| $50,000 to $74,999 | 342 (16.7%) | 216 (8.1%) |
| $75,000 to $99,999 | 317 (15.5%) | 502 (18.9%) |
| $100,000 to $149,999 | 326 (15.9%) | 527 (19.8%) |
| $150,000 or more | 126 (6.2%) | 724 (27.2%) |
| Total | 2,045 (100.0%) | 2,663 (100.0%) |
Property Value to Household Income Ratio in Cooper County
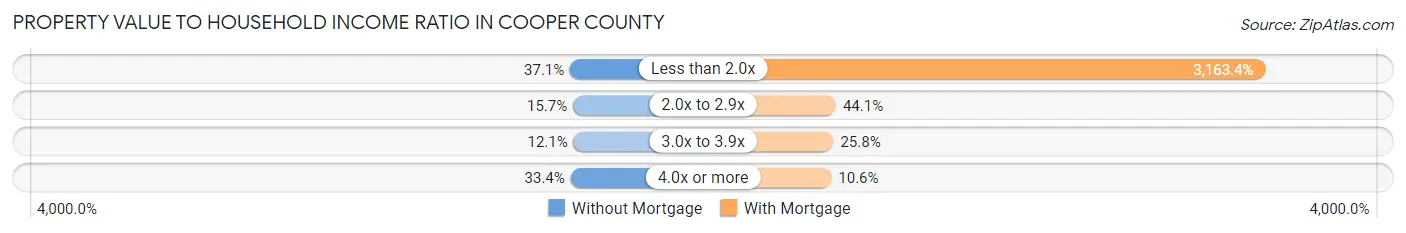
| Value-to-Income Ratio | Without Mortgage | With Mortgage |
| Less than 2.0x | 758 (37.1%) | 84,241 (3,163.4%) |
| 2.0x to 2.9x | 320 (15.7%) | 1,173 (44.1%) |
| 3.0x to 3.9x | 247 (12.1%) | 686 (25.8%) |
| 4.0x or more | 682 (33.4%) | 281 (10.5%) |
| Total | 2,045 (100.0%) | 2,663 (100.0%) |
Real Estate Taxes by Mortgage Status in Cooper County
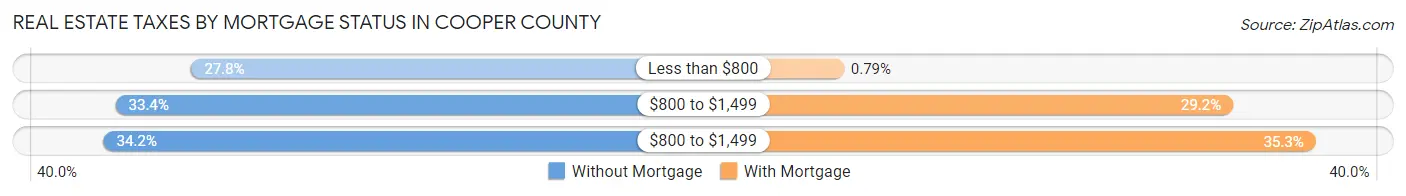
| Property Taxes | Without Mortgage | With Mortgage |
| Less than $800 | 569 (27.8%) | 21 (0.8%) |
| $800 to $1,499 | 682 (33.4%) | 778 (29.2%) |
| $800 to $1,499 | 700 (34.2%) | 939 (35.3%) |
| Total | 2,045 (100.0%) | 2,663 (100.0%) |
Health & Disability in Cooper County
Health Insurance Coverage by Age in Cooper County
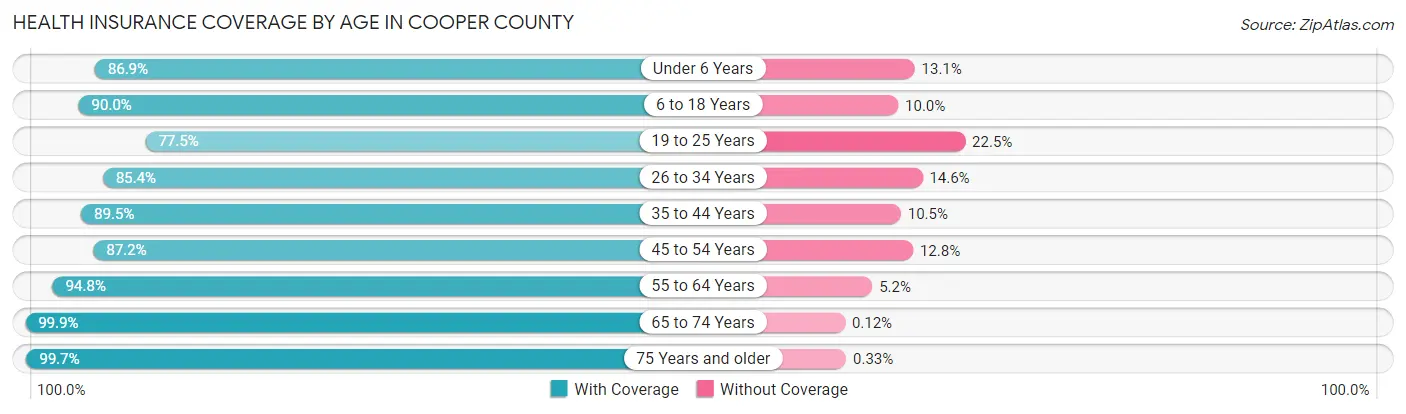
| Age Bracket | With Coverage | Without Coverage |
| Under 6 Years | 1,087 (86.9%) | 164 (13.1%) |
| 6 to 18 Years | 2,400 (90.0%) | 268 (10.0%) |
| 19 to 25 Years | 1,172 (77.5%) | 341 (22.5%) |
| 26 to 34 Years | 1,372 (85.4%) | 234 (14.6%) |
| 35 to 44 Years | 1,384 (89.5%) | 163 (10.5%) |
| 45 to 54 Years | 1,545 (87.2%) | 227 (12.8%) |
| 55 to 64 Years | 2,056 (94.8%) | 113 (5.2%) |
| 65 to 74 Years | 1,705 (99.9%) | 2 (0.1%) |
| 75 Years and older | 1,223 (99.7%) | 4 (0.3%) |
| Total | 13,944 (90.2%) | 1,516 (9.8%) |
Health Insurance Coverage by Citizenship Status in Cooper County
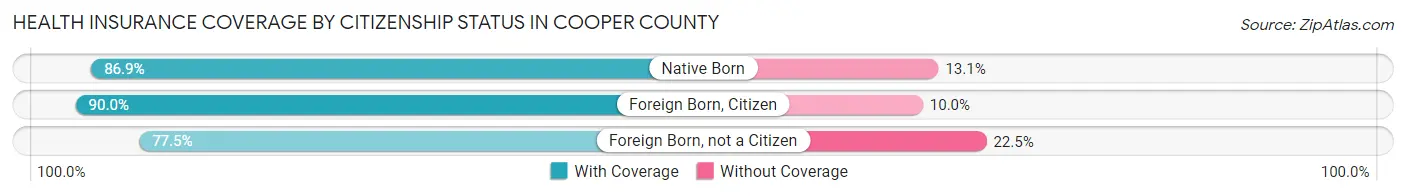
| Citizenship Status | With Coverage | Without Coverage |
| Native Born | 1,087 (86.9%) | 164 (13.1%) |
| Foreign Born, Citizen | 2,400 (90.0%) | 268 (10.0%) |
| Foreign Born, not a Citizen | 1,172 (77.5%) | 341 (22.5%) |
Health Insurance Coverage by Household Income in Cooper County
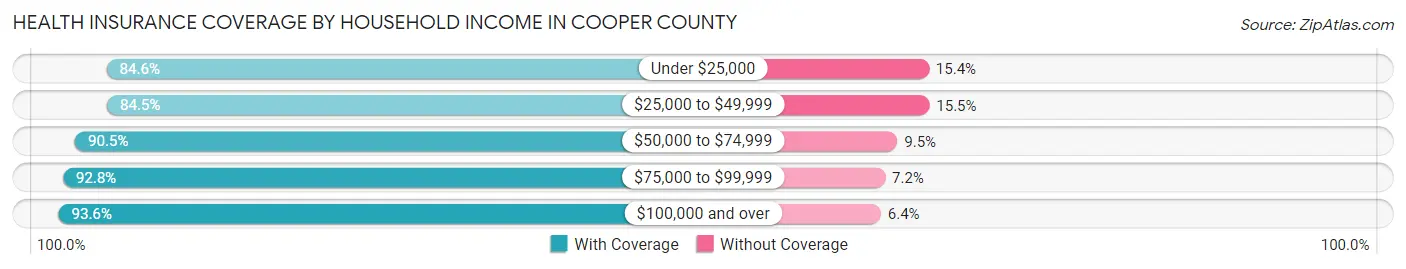
| Household Income | With Coverage | Without Coverage |
| Under $25,000 | 1,606 (84.6%) | 292 (15.4%) |
| $25,000 to $49,999 | 2,339 (84.5%) | 428 (15.5%) |
| $50,000 to $74,999 | 2,514 (90.5%) | 263 (9.5%) |
| $75,000 to $99,999 | 2,623 (92.8%) | 203 (7.2%) |
| $100,000 and over | 4,830 (93.6%) | 329 (6.4%) |
Public vs Private Health Insurance Coverage by Age in Cooper County
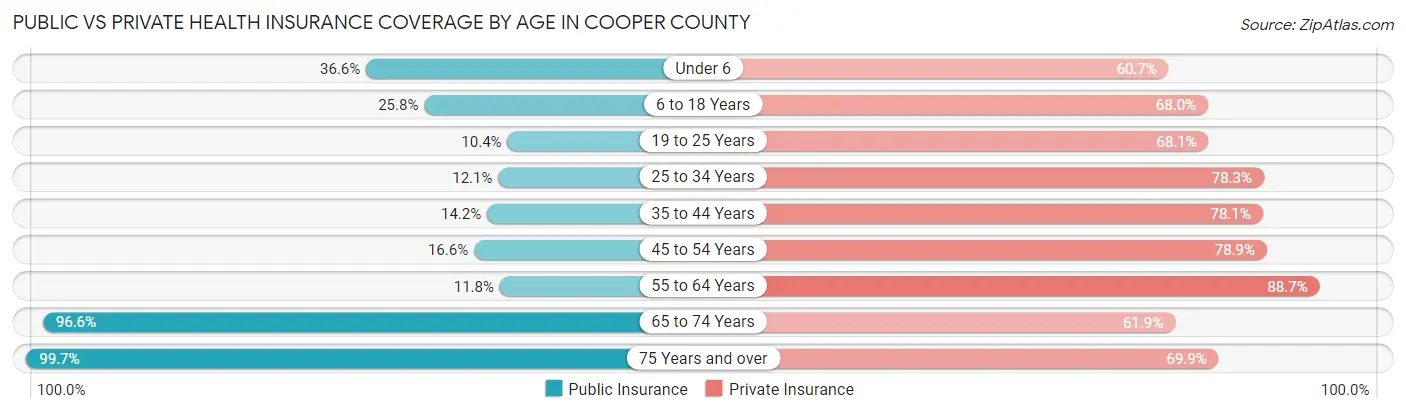
| Age Bracket | Public Insurance | Private Insurance |
| Under 6 | 458 (36.6%) | 759 (60.7%) |
| 6 to 18 Years | 689 (25.8%) | 1,813 (67.9%) |
| 19 to 25 Years | 157 (10.4%) | 1,030 (68.1%) |
| 25 to 34 Years | 194 (12.1%) | 1,258 (78.3%) |
| 35 to 44 Years | 219 (14.2%) | 1,208 (78.1%) |
| 45 to 54 Years | 294 (16.6%) | 1,398 (78.9%) |
| 55 to 64 Years | 256 (11.8%) | 1,923 (88.7%) |
| 65 to 74 Years | 1,649 (96.6%) | 1,056 (61.9%) |
| 75 Years and over | 1,223 (99.7%) | 858 (69.9%) |
| Total | 5,139 (33.2%) | 11,303 (73.1%) |
Disability Status by Sex by Age in Cooper County
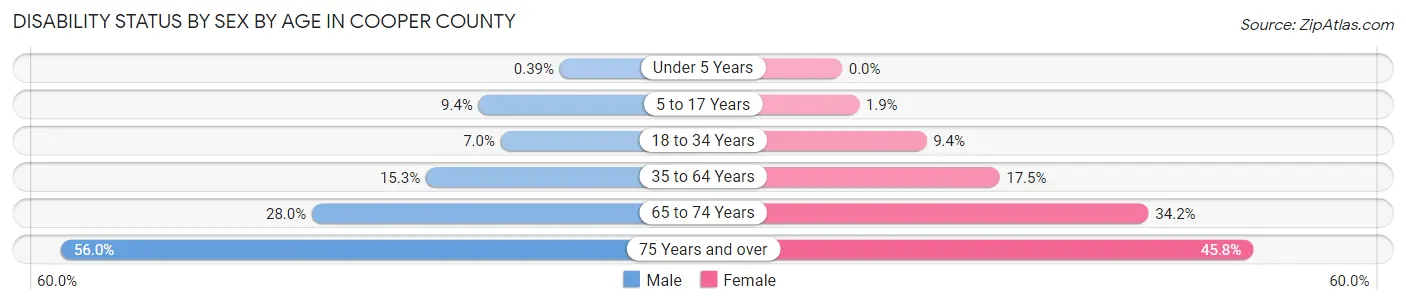
| Age Bracket | Male | Female |
| Under 5 Years | 2 (0.4%) | 0 (0.0%) |
| 5 to 17 Years | 130 (9.4%) | 26 (1.9%) |
| 18 to 34 Years | 112 (7.0%) | 159 (9.4%) |
| 35 to 64 Years | 374 (15.3%) | 534 (17.5%) |
| 65 to 74 Years | 227 (28.0%) | 306 (34.2%) |
| 75 Years and over | 287 (55.9%) | 327 (45.8%) |
Disability Class by Sex by Age in Cooper County
Disability Class: Hearing Difficulty
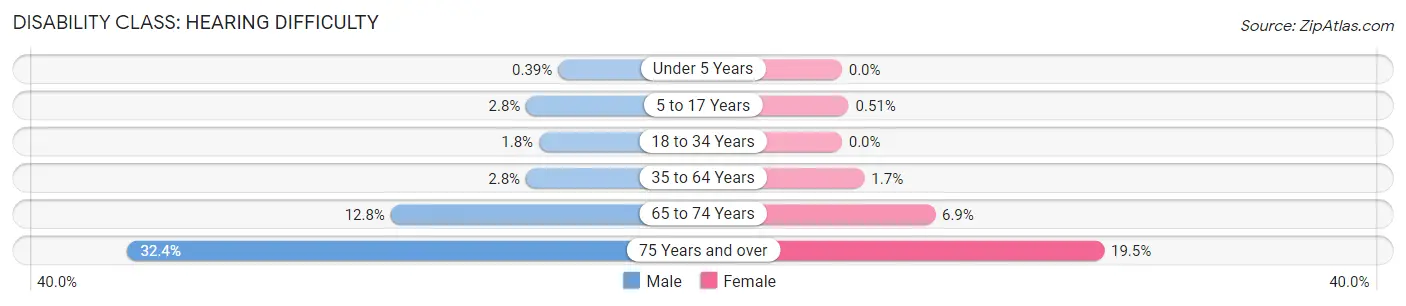
| Age Bracket | Male | Female |
| Under 5 Years | 2 (0.4%) | 0 (0.0%) |
| 5 to 17 Years | 38 (2.8%) | 7 (0.5%) |
| 18 to 34 Years | 29 (1.8%) | 0 (0.0%) |
| 35 to 64 Years | 68 (2.8%) | 51 (1.7%) |
| 65 to 74 Years | 104 (12.8%) | 62 (6.9%) |
| 75 Years and over | 166 (32.4%) | 139 (19.5%) |
Disability Class: Vision Difficulty
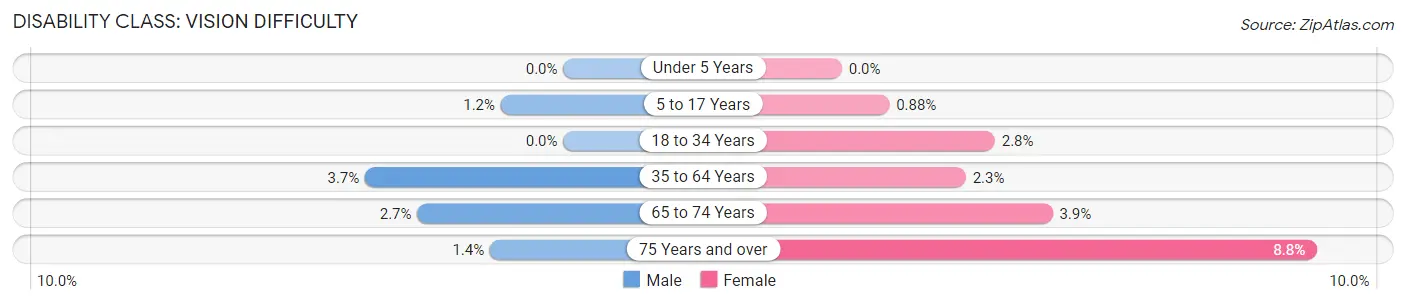
| Age Bracket | Male | Female |
| Under 5 Years | 0 (0.0%) | 0 (0.0%) |
| 5 to 17 Years | 16 (1.2%) | 12 (0.9%) |
| 18 to 34 Years | 0 (0.0%) | 48 (2.8%) |
| 35 to 64 Years | 90 (3.7%) | 70 (2.3%) |
| 65 to 74 Years | 22 (2.7%) | 35 (3.9%) |
| 75 Years and over | 7 (1.4%) | 63 (8.8%) |
Disability Class: Cognitive Difficulty
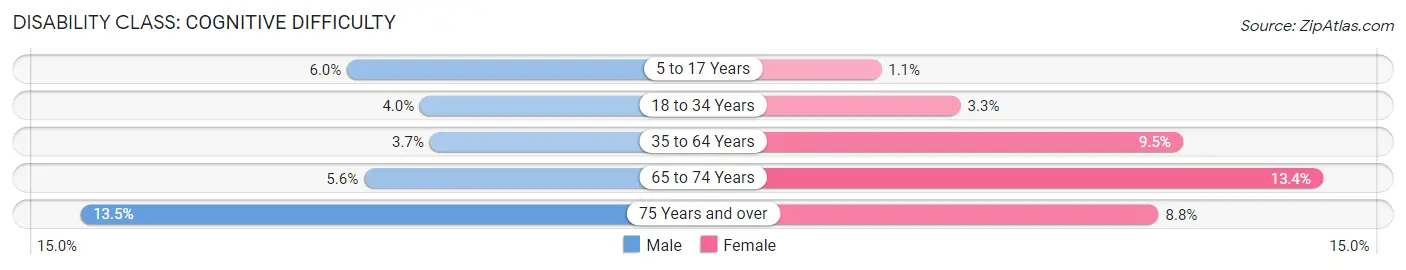
| Age Bracket | Male | Female |
| 5 to 17 Years | 83 (6.0%) | 15 (1.1%) |
| 18 to 34 Years | 64 (4.0%) | 56 (3.3%) |
| 35 to 64 Years | 91 (3.7%) | 289 (9.5%) |
| 65 to 74 Years | 45 (5.6%) | 120 (13.4%) |
| 75 Years and over | 69 (13.5%) | 63 (8.8%) |
Disability Class: Ambulatory Difficulty
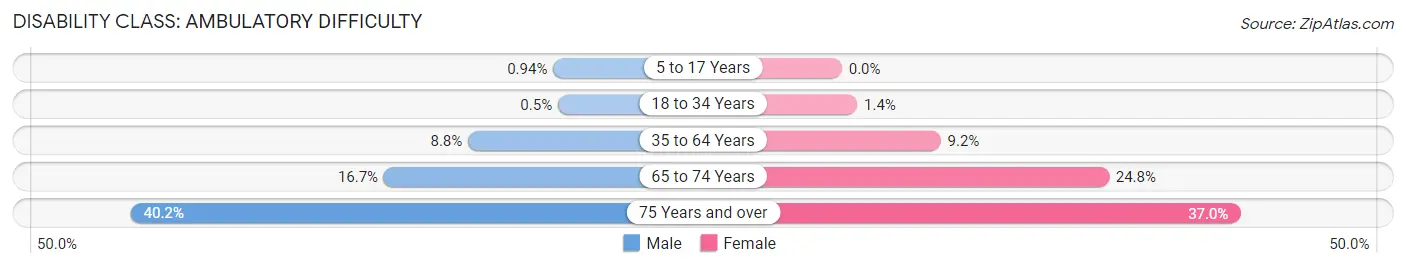
| Age Bracket | Male | Female |
| 5 to 17 Years | 13 (0.9%) | 0 (0.0%) |
| 18 to 34 Years | 8 (0.5%) | 24 (1.4%) |
| 35 to 64 Years | 216 (8.8%) | 279 (9.2%) |
| 65 to 74 Years | 135 (16.7%) | 222 (24.8%) |
| 75 Years and over | 206 (40.2%) | 264 (37.0%) |
Disability Class: Self-Care Difficulty
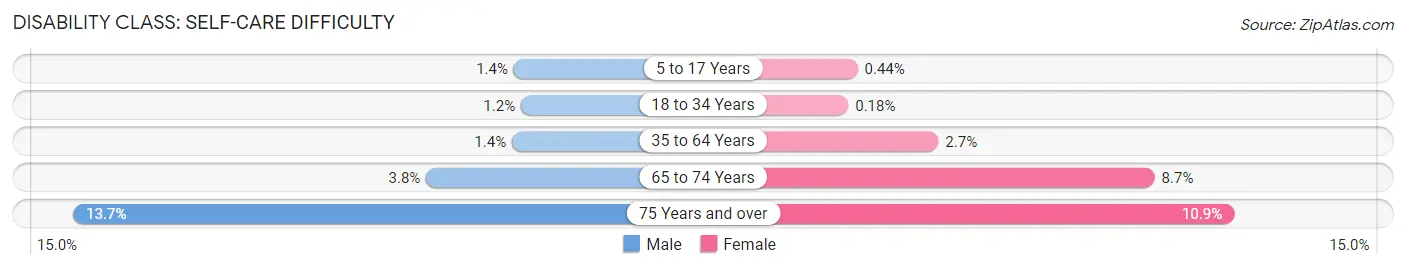
| Age Bracket | Male | Female |
| 5 to 17 Years | 19 (1.4%) | 6 (0.4%) |
| 18 to 34 Years | 19 (1.2%) | 3 (0.2%) |
| 35 to 64 Years | 35 (1.4%) | 82 (2.7%) |
| 65 to 74 Years | 31 (3.8%) | 78 (8.7%) |
| 75 Years and over | 70 (13.7%) | 78 (10.9%) |
Technology Access in Cooper County
Computing Device Access in Cooper County
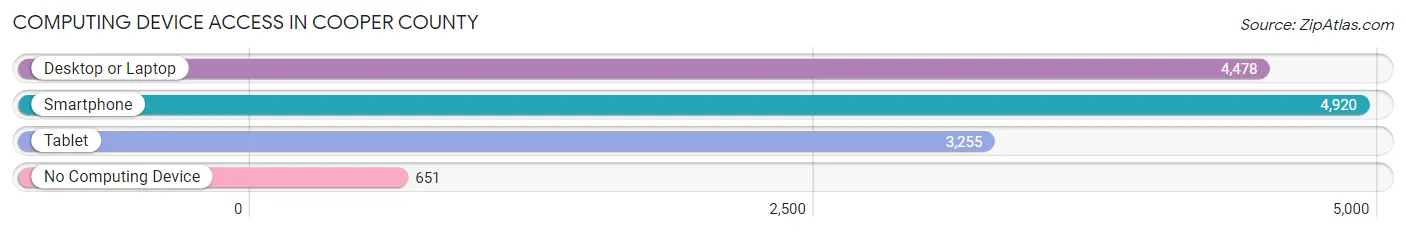
| Device Type | # Households | % Households |
| Desktop or Laptop | 4,478 | 73.1% |
| Smartphone | 4,920 | 80.3% |
| Tablet | 3,255 | 53.1% |
| No Computing Device | 651 | 10.6% |
| Total | 6,125 | 100.0% |
Internet Access in Cooper County
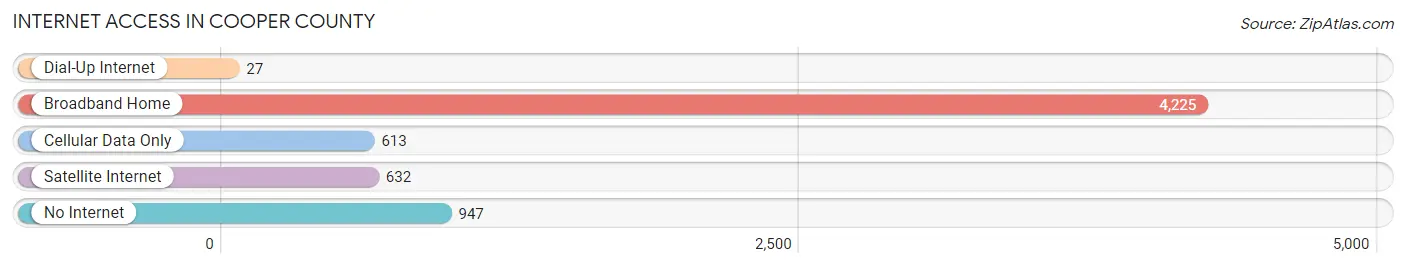
| Internet Type | # Households | % Households |
| Dial-Up Internet | 27 | 0.4% |
| Broadband Home | 4,225 | 69.0% |
| Cellular Data Only | 613 | 10.0% |
| Satellite Internet | 632 | 10.3% |
| No Internet | 947 | 15.5% |
| Total | 6,125 | 100.0% |
Cooper County Summary
Cooper County is located in the central part of the state of Missouri, and is part of the Columbia, Missouri Metropolitan Statistical Area. The county was established in 1818 and named after Sarshell Cooper, a pioneer settler. As of the 2010 census, the population was 17,601.
Geography
Cooper County is located in the central part of Missouri, and is bordered by Moniteau County to the north, Boone County to the east, Howard County to the south, and Pettis County to the west. The county has a total area of 545 square miles, of which 544 square miles is land and 1.2 square miles is water. The county is located in the Missouri River Valley, and is drained by the Missouri River and its tributaries. The highest point in the county is located in the northwest corner, at an elevation of 1,068 feet.
The county is home to several state parks and wildlife areas, including the Katy Trail State Park, which is a 225-mile long rail-trail that runs through the county. Other parks in the county include the Blackwater Conservation Area, the Big Muddy National Fish and Wildlife Refuge, and the Swan Lake National Wildlife Refuge.
Demographics
As of the 2010 census, there were 17,601 people, 6,845 households, and 4,817 families residing in the county. The population density was 32.3 people per square mile. The racial makeup of the county was 95.2% White, 1.3% African American, 0.3% Native American, 0.3% Asian, 0.1% Pacific Islander, 1.2% from other races, and 1.6% from two or more races. Hispanic or Latino of any race were 2.7% of the population.
The median income for a household in the county was $41,945, and the median income for a family was $50,945. The per capita income for the county was $20,945. About 11.2% of families and 14.2% of the population were below the poverty line, including 19.2% of those under age 18 and 8.7% of those age 65 or over.
Economy
The economy of Cooper County is largely based on agriculture, with corn, soybeans, and wheat being the main crops. Livestock production is also important, with cattle, hogs, and poultry being the main animals raised. Manufacturing is also an important part of the economy, with companies such as Cooper Industries, Inc., and Cooper Tire & Rubber Company having major operations in the county.
The county is also home to several colleges and universities, including the University of Missouri, Columbia College, and Stephens College. Tourism is also an important part of the economy, with the Katy Trail State Park and other attractions drawing visitors to the area.
Cooper County is also home to several historic sites, including the Governor's Mansion State Historic Site, the Boone's Lick State Historic Site, and the Arrow Rock State Historic Site. These sites are popular with tourists and provide an important source of revenue for the county.
Conclusion
Cooper County is a rural county located in the central part of Missouri. The county is home to several state parks and wildlife areas, and is an important agricultural center. Manufacturing and tourism are also important parts of the economy, and the county is home to several historic sites. The population of the county is 17,601, and the median income for a household is $41,945.
Common Questions
What is Per Capita Income in Cooper County?
Per Capita income in Cooper County is $27,471.
What is the Median Family Income in Cooper County?
Median Family Income in Cooper County is $76,317.
What is the Median Household income in Cooper County?
Median Household Income in Cooper County is $62,239.
What is Income or Wage Gap in Cooper County?
Income or Wage Gap in Cooper County is 22.4%.
Women in Cooper County earn 77.6 cents for every dollar earned by a man.
What is Family Income Deficit in Cooper County?
Family Income Deficit in Cooper County is $10,791.
Families that are below poverty line in Cooper County earn $10,791 less on average than the poverty threshold level.
What is Inequality or Gini Index in Cooper County?
Inequality or Gini Index in Cooper County is 0.41.
What is the Total Population of Cooper County?
Total Population of Cooper County is 16,893.
What is the Total Male Population of Cooper County?
Total Male Population of Cooper County is 8,535.
What is the Total Female Population of Cooper County?
Total Female Population of Cooper County is 8,358.
What is the Ratio of Males per 100 Females in Cooper County?
There are 102.12 Males per 100 Females in Cooper County.
What is the Ratio of Females per 100 Males in Cooper County?
There are 97.93 Females per 100 Males in Cooper County.
What is the Median Population Age in Cooper County?
Median Population Age in Cooper County is 38.8 Years.
What is the Average Family Size in Cooper County
Average Family Size in Cooper County is 3.0 People.
What is the Average Household Size in Cooper County
Average Household Size in Cooper County is 2.5 People.
How Large is the Labor Force in Cooper County?
There are 7,640 People in the Labor Forcein in Cooper County.
What is the Percentage of People in the Labor Force in Cooper County?
56.1% of People are in the Labor Force in Cooper County.
What is the Unemployment Rate in Cooper County?
Unemployment Rate in Cooper County is 5.0%.