Clinton County, MO Map & Demographics
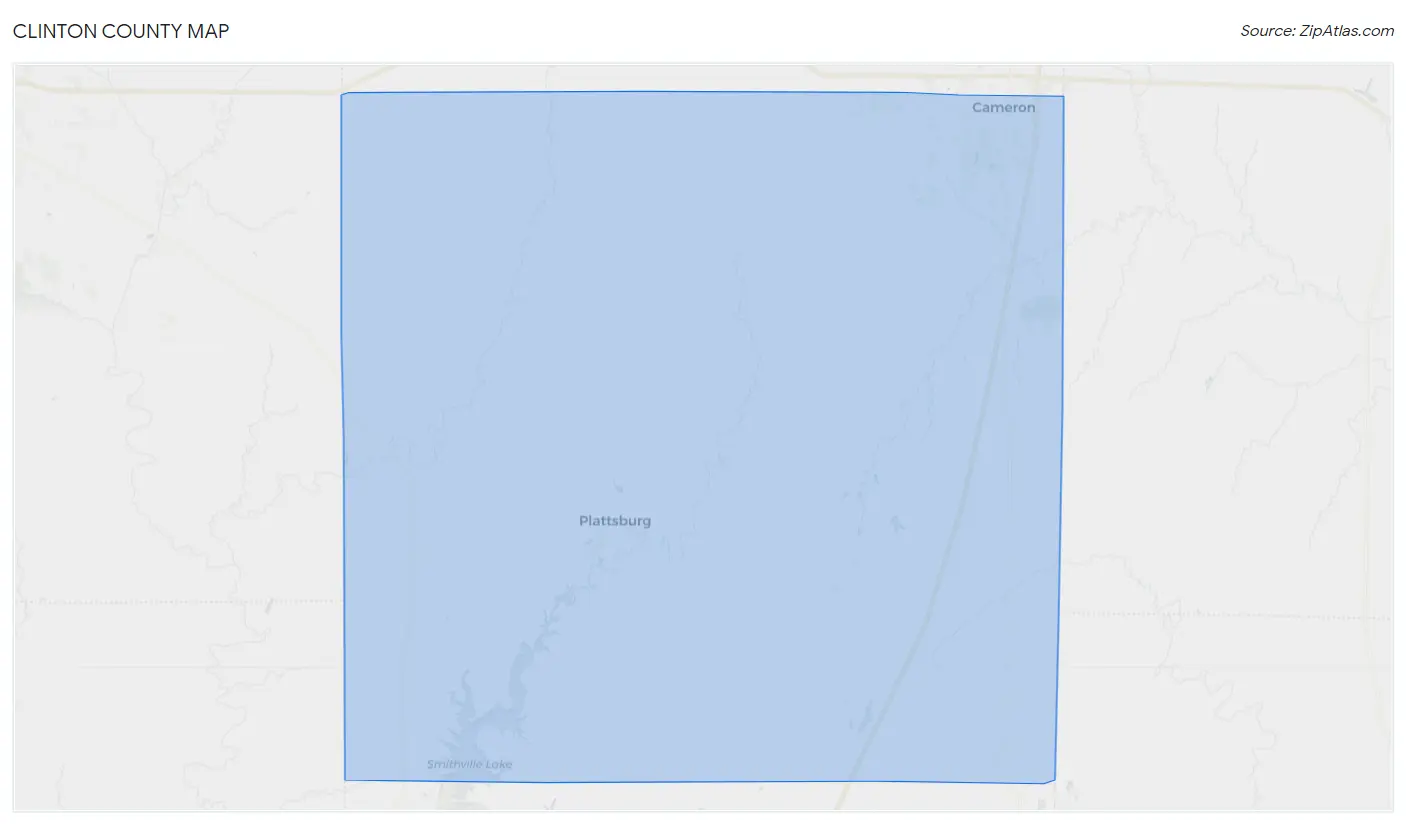
Clinton County Map
Clinton County Overview
$31,924
PER CAPITA INCOME
$87,733
AVG FAMILY INCOME
$66,494
AVG HOUSEHOLD INCOME
35.3%
WAGE / INCOME GAP [ % ]
64.7¢/ $1
WAGE / INCOME GAP [ $ ]
$10,021
FAMILY INCOME DEFICIT
0.41
INEQUALITY / GINI INDEX
21,155
TOTAL POPULATION
10,619
MALE POPULATION
10,536
FEMALE POPULATION
100.79
MALES / 100 FEMALES
99.22
FEMALES / 100 MALES
40.9
MEDIAN AGE
3.2
AVG FAMILY SIZE
2.6
AVG HOUSEHOLD SIZE
10,177
LABOR FORCE [ PEOPLE ]
60.0%
PERCENT IN LABOR FORCE
6.1%
UNEMPLOYMENT RATE
Clinton County Area Codes
Income in Clinton County
Income Overview in Clinton County
Per Capita Income in Clinton County is $31,924, while median incomes of families and households are $87,733 and $66,494 respectively.
| Characteristic | Number | Measure |
| Per Capita Income | 21,155 | $31,924 |
| Median Family Income | 5,129 | $87,733 |
| Mean Family Income | 5,129 | $98,563 |
| Median Household Income | 8,047 | $66,494 |
| Mean Household Income | 8,047 | $80,042 |
| Income Deficit | 5,129 | $10,021 |
| Wage / Income Gap (%) | 21,155 | 35.27% |
| Wage / Income Gap ($) | 21,155 | 64.73¢ per $1 |
| Gini / Inequality Index | 21,155 | 0.41 |
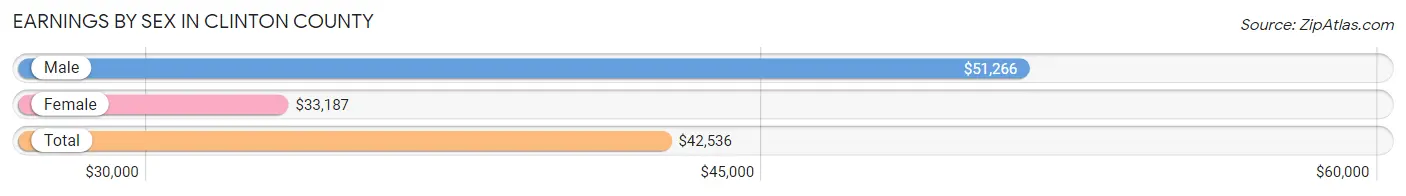
Earnings by Sex in Clinton County
Average Earnings in Clinton County are $42,536, $51,266 for men and $33,187 for women, a difference of 35.3%.
| Sex | Number | Average Earnings |
| Male | 5,790 (54.9%) | $51,266 |
| Female | 4,757 (45.1%) | $33,187 |
| Total | 10,547 (100.0%) | $42,536 |
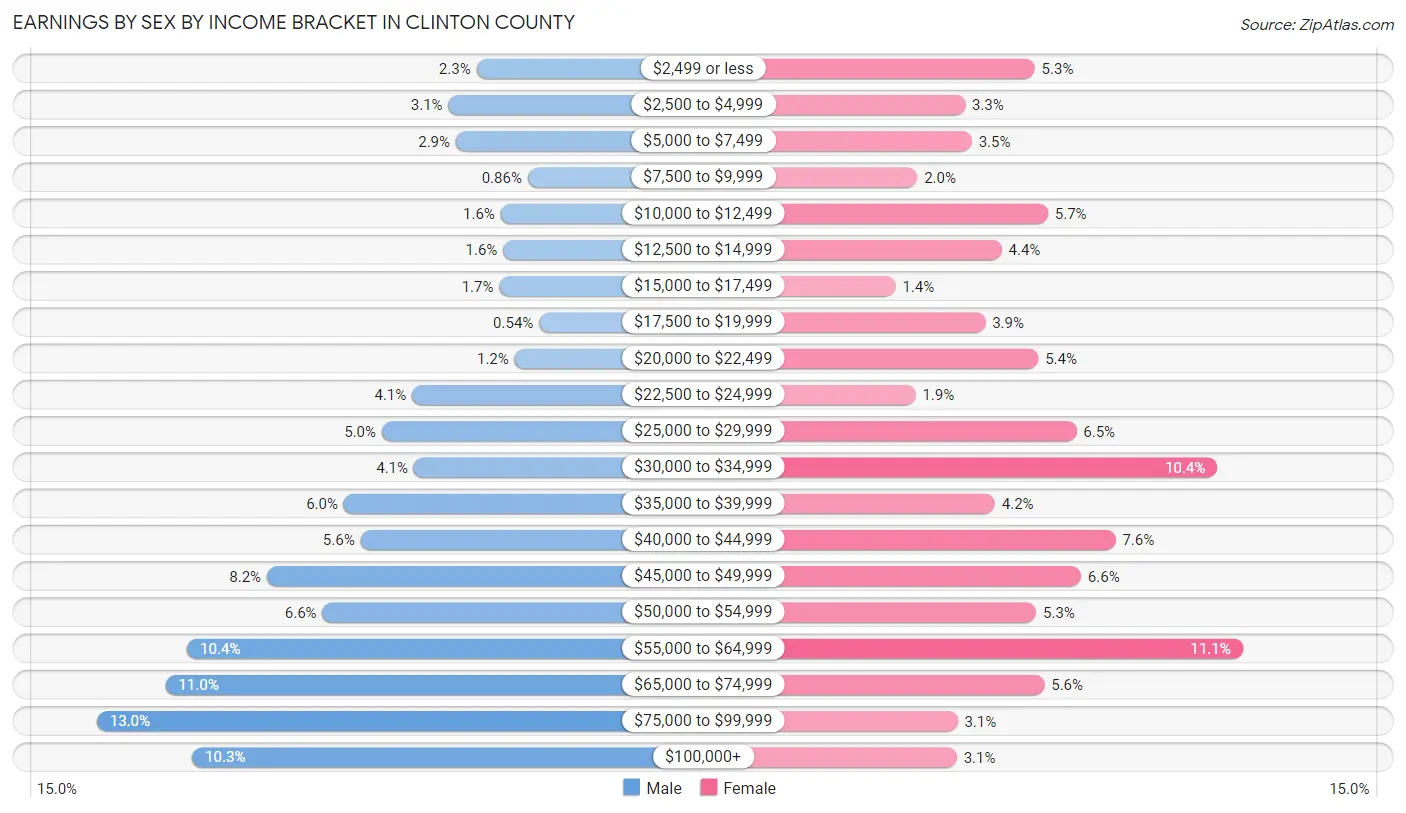
Earnings by Sex by Income Bracket in Clinton County
The most common earnings brackets in Clinton County are $75,000 to $99,999 for men (751 | 13.0%) and $55,000 to $64,999 for women (529 | 11.1%).
| Income | Male | Female |
| $2,499 or less | 133 (2.3%) | 251 (5.3%) |
| $2,500 to $4,999 | 179 (3.1%) | 158 (3.3%) |
| $5,000 to $7,499 | 167 (2.9%) | 167 (3.5%) |
| $7,500 to $9,999 | 50 (0.9%) | 94 (2.0%) |
| $10,000 to $12,499 | 94 (1.6%) | 269 (5.7%) |
| $12,500 to $14,999 | 90 (1.5%) | 207 (4.3%) |
| $15,000 to $17,499 | 96 (1.7%) | 65 (1.4%) |
| $17,500 to $19,999 | 31 (0.5%) | 185 (3.9%) |
| $20,000 to $22,499 | 71 (1.2%) | 256 (5.4%) |
| $22,500 to $24,999 | 238 (4.1%) | 92 (1.9%) |
| $25,000 to $29,999 | 287 (5.0%) | 307 (6.5%) |
| $30,000 to $34,999 | 235 (4.1%) | 495 (10.4%) |
| $35,000 to $39,999 | 349 (6.0%) | 198 (4.2%) |
| $40,000 to $44,999 | 322 (5.6%) | 359 (7.5%) |
| $45,000 to $49,999 | 474 (8.2%) | 313 (6.6%) |
| $50,000 to $54,999 | 384 (6.6%) | 253 (5.3%) |
| $55,000 to $64,999 | 604 (10.4%) | 529 (11.1%) |
| $65,000 to $74,999 | 639 (11.0%) | 264 (5.6%) |
| $75,000 to $99,999 | 751 (13.0%) | 148 (3.1%) |
| $100,000+ | 596 (10.3%) | 147 (3.1%) |
| Total | 5,790 (100.0%) | 4,757 (100.0%) |
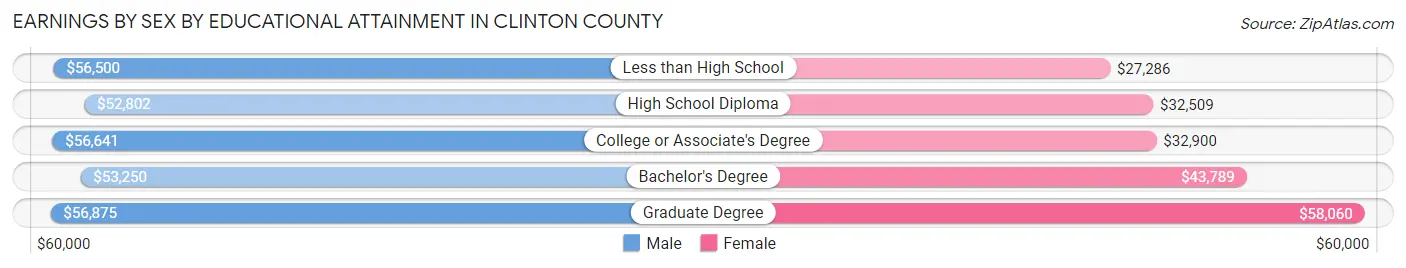
Earnings by Sex by Educational Attainment in Clinton County
Average earnings in Clinton County are $54,058 for men and $38,410 for women, a difference of 28.9%. Men with an educational attainment of graduate degree enjoy the highest average annual earnings of $56,875, while those with high school diploma education earn the least with $52,802. Women with an educational attainment of graduate degree earn the most with the average annual earnings of $58,060, while those with less than high school education have the smallest earnings of $27,286.
| Educational Attainment | Male Income | Female Income |
| Less than High School | $56,500 | $27,286 |
| High School Diploma | $52,802 | $32,509 |
| College or Associate's Degree | $56,641 | $32,900 |
| Bachelor's Degree | $53,250 | $43,789 |
| Graduate Degree | $56,875 | $58,060 |
| Total | $54,058 | $38,410 |
Family Income in Clinton County
Family Income Brackets in Clinton County
According to the Clinton County family income data, there are 1,159 families falling into the $100,000 to $149,999 income range, which is the most common income bracket and makes up 22.6% of all families. Conversely, the $10,000 to $14,999 income bracket is the least frequent group with only 15 families (0.3%) belonging to this category.
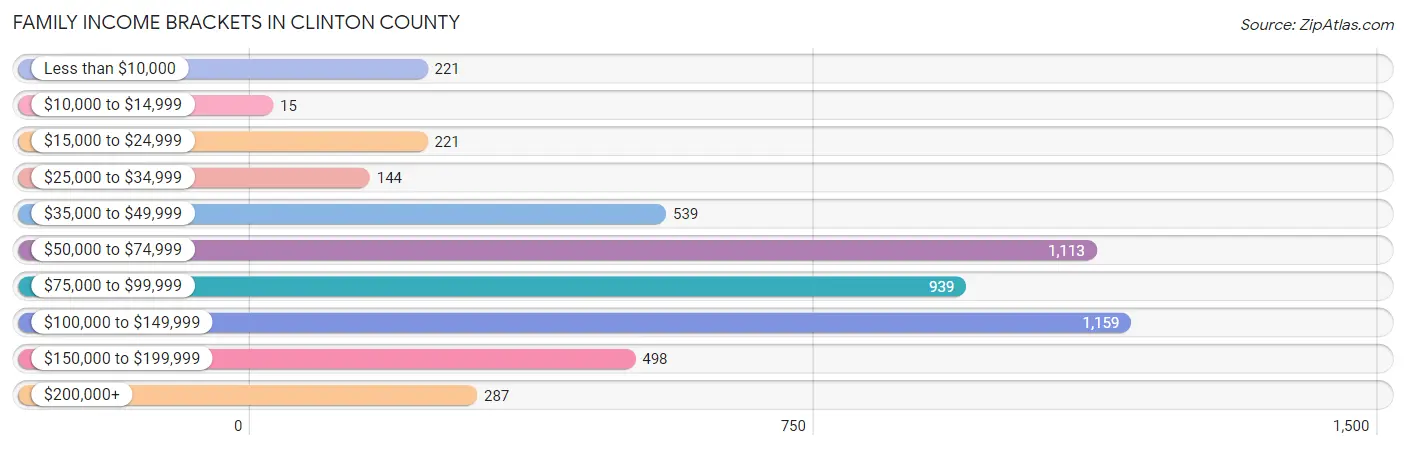
| Income Bracket | # Families | % Families |
| Less than $10,000 | 221 | 4.3% |
| $10,000 to $14,999 | 15 | 0.3% |
| $15,000 to $24,999 | 221 | 4.3% |
| $25,000 to $34,999 | 144 | 2.8% |
| $35,000 to $49,999 | 539 | 10.5% |
| $50,000 to $74,999 | 1,113 | 21.7% |
| $75,000 to $99,999 | 939 | 18.3% |
| $100,000 to $149,999 | 1,159 | 22.6% |
| $150,000 to $199,999 | 498 | 9.7% |
| $200,000+ | 287 | 5.6% |
Family Income by Famaliy Size in Clinton County
7+ person families (148 | 2.9%) account for the highest median family income in Clinton County with $163,333 per family, while 2-person families (2,541 | 49.5%) have the highest median income of $36,890 per family member.
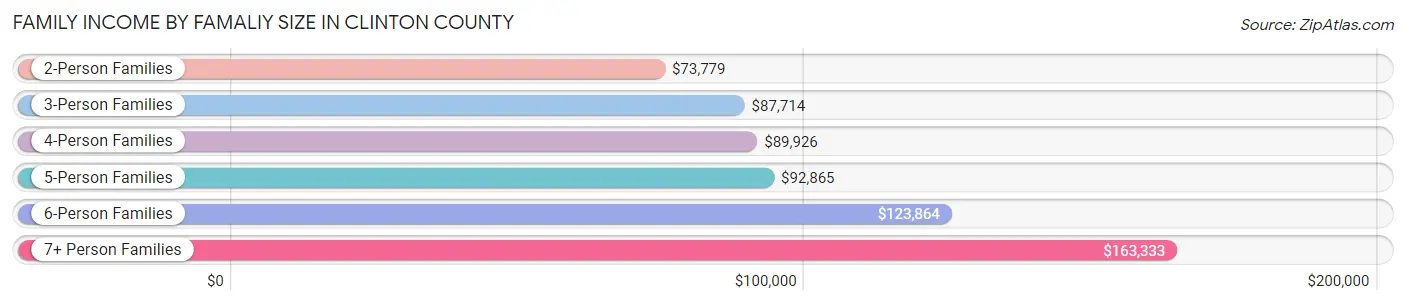
| Income Bracket | # Families | Median Income |
| 2-Person Families | 2,541 (49.5%) | $73,779 |
| 3-Person Families | 904 (17.6%) | $87,714 |
| 4-Person Families | 1,001 (19.5%) | $89,926 |
| 5-Person Families | 333 (6.5%) | $92,865 |
| 6-Person Families | 202 (3.9%) | $123,864 |
| 7+ Person Families | 148 (2.9%) | $163,333 |
| Total | 5,129 (100.0%) | $87,733 |
Family Income by Number of Earners in Clinton County
The median family income in Clinton County is $87,733, with families comprising 3+ earners (612) having the highest median family income of $138,750, while families with no earners (776) have the lowest median family income of $44,375, accounting for 11.9% and 15.1% of families, respectively.
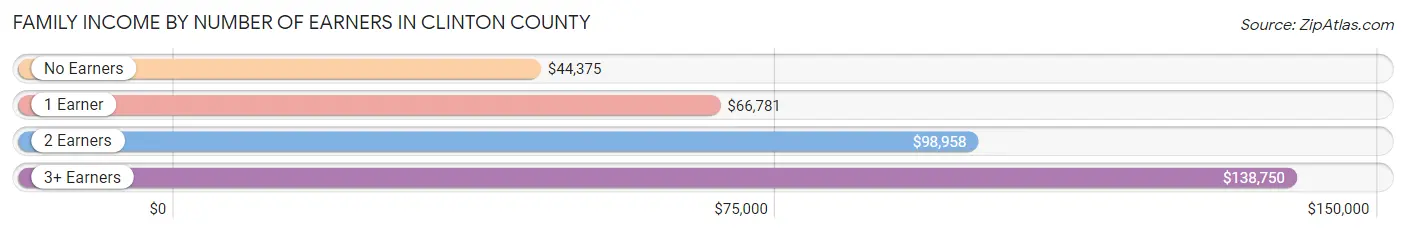
| Number of Earners | # Families | Median Income |
| No Earners | 776 (15.1%) | $44,375 |
| 1 Earner | 1,505 (29.3%) | $66,781 |
| 2 Earners | 2,236 (43.6%) | $98,958 |
| 3+ Earners | 612 (11.9%) | $138,750 |
| Total | 5,129 (100.0%) | $87,733 |
Household Income in Clinton County
Household Income Brackets in Clinton County
With 1,786 households falling in the category, the $50,000 to $74,999 income range is the most frequent in Clinton County, accounting for 22.2% of all households. In contrast, only 201 households (2.5%) fall into the $10,000 to $14,999 income bracket, making it the least populous group.
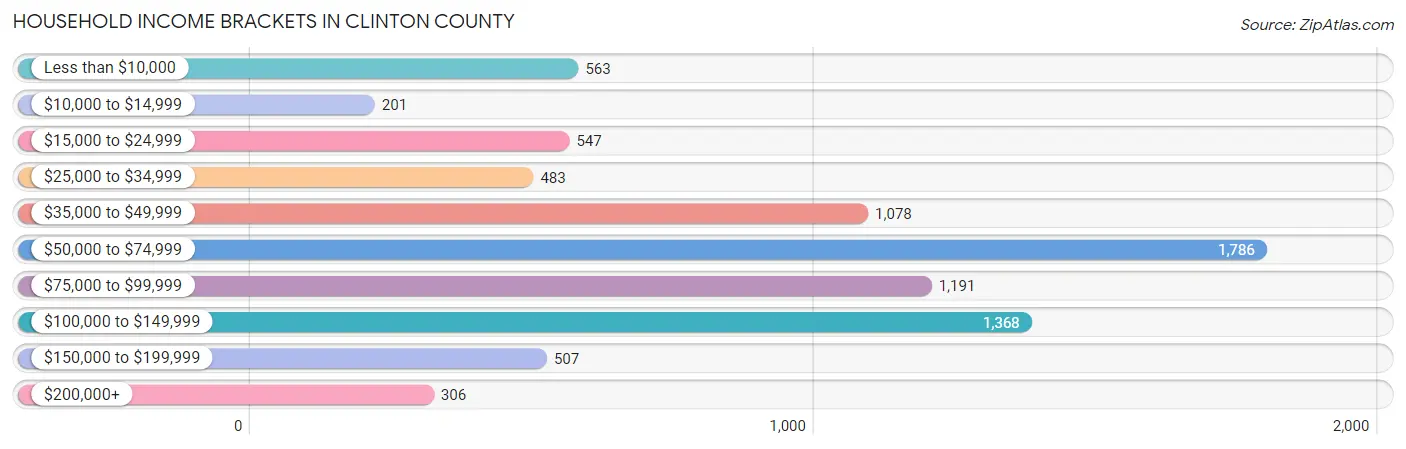
| Income Bracket | # Households | % Households |
| Less than $10,000 | 563 | 7.0% |
| $10,000 to $14,999 | 201 | 2.5% |
| $15,000 to $24,999 | 547 | 6.8% |
| $25,000 to $34,999 | 483 | 6.0% |
| $35,000 to $49,999 | 1,078 | 13.4% |
| $50,000 to $74,999 | 1,786 | 22.2% |
| $75,000 to $99,999 | 1,191 | 14.8% |
| $100,000 to $149,999 | 1,368 | 17.0% |
| $150,000 to $199,999 | 507 | 6.3% |
| $200,000+ | 306 | 3.8% |
Household Income by Householder Age in Clinton County
The median household income in Clinton County is $66,494, with the highest median household income of $74,023 found in the 45 to 64 years age bracket for the primary householder. A total of 3,426 households (42.6%) fall into this category. Meanwhile, the 65+ years age bracket for the primary householder has the lowest median household income of $50,425, with 2,230 households (27.7%) in this group.
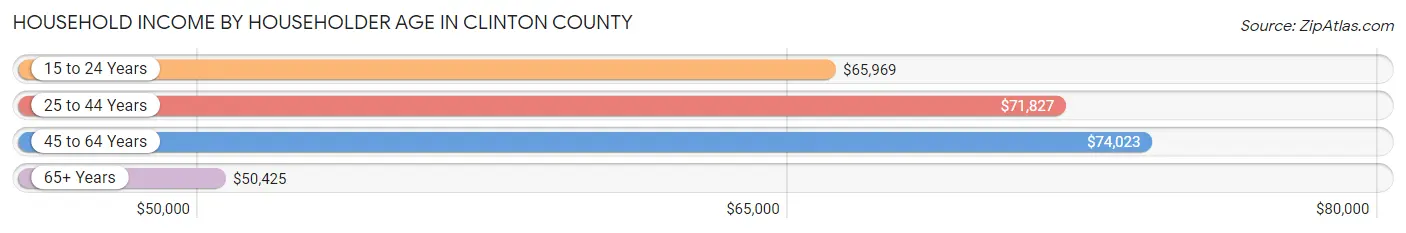
| Income Bracket | # Households | Median Income |
| 15 to 24 Years | 125 (1.5%) | $65,969 |
| 25 to 44 Years | 2,266 (28.2%) | $71,827 |
| 45 to 64 Years | 3,426 (42.6%) | $74,023 |
| 65+ Years | 2,230 (27.7%) | $50,425 |
| Total | 8,047 (100.0%) | $66,494 |
Poverty in Clinton County
Income Below Poverty by Sex and Age in Clinton County
With 10.7% poverty level for males and 11.9% for females among the residents of Clinton County, 16 and 17 year old males and 25 to 34 year old females are the most vulnerable to poverty, with 108 males (29.6%) and 262 females (21.9%) in their respective age groups living below the poverty level.
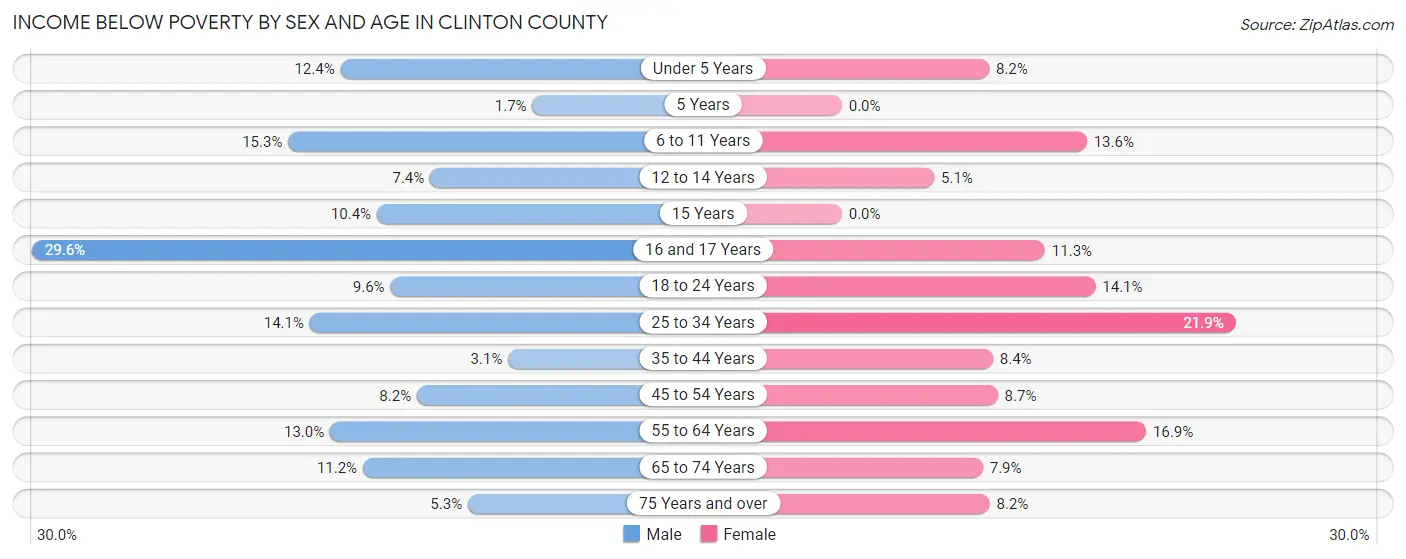
| Age Bracket | Male | Female |
| Under 5 Years | 66 (12.4%) | 46 (8.2%) |
| 5 Years | 3 (1.7%) | 0 (0.0%) |
| 6 to 11 Years | 135 (15.3%) | 123 (13.6%) |
| 12 to 14 Years | 31 (7.4%) | 15 (5.1%) |
| 15 Years | 11 (10.4%) | 0 (0.0%) |
| 16 and 17 Years | 108 (29.6%) | 45 (11.3%) |
| 18 to 24 Years | 75 (9.6%) | 109 (14.1%) |
| 25 to 34 Years | 169 (14.1%) | 262 (21.9%) |
| 35 to 44 Years | 39 (3.1%) | 105 (8.4%) |
| 45 to 54 Years | 112 (8.2%) | 118 (8.7%) |
| 55 to 64 Years | 204 (13.0%) | 265 (16.9%) |
| 65 to 74 Years | 107 (11.2%) | 82 (7.9%) |
| 75 Years and over | 30 (5.3%) | 73 (8.2%) |
| Total | 1,090 (10.7%) | 1,243 (11.9%) |
Income Above Poverty by Sex and Age in Clinton County
According to the poverty statistics in Clinton County, males aged 5 years and females aged 5 years are the age groups that are most secure financially, with 98.3% of males and 100.0% of females in these age groups living above the poverty line.
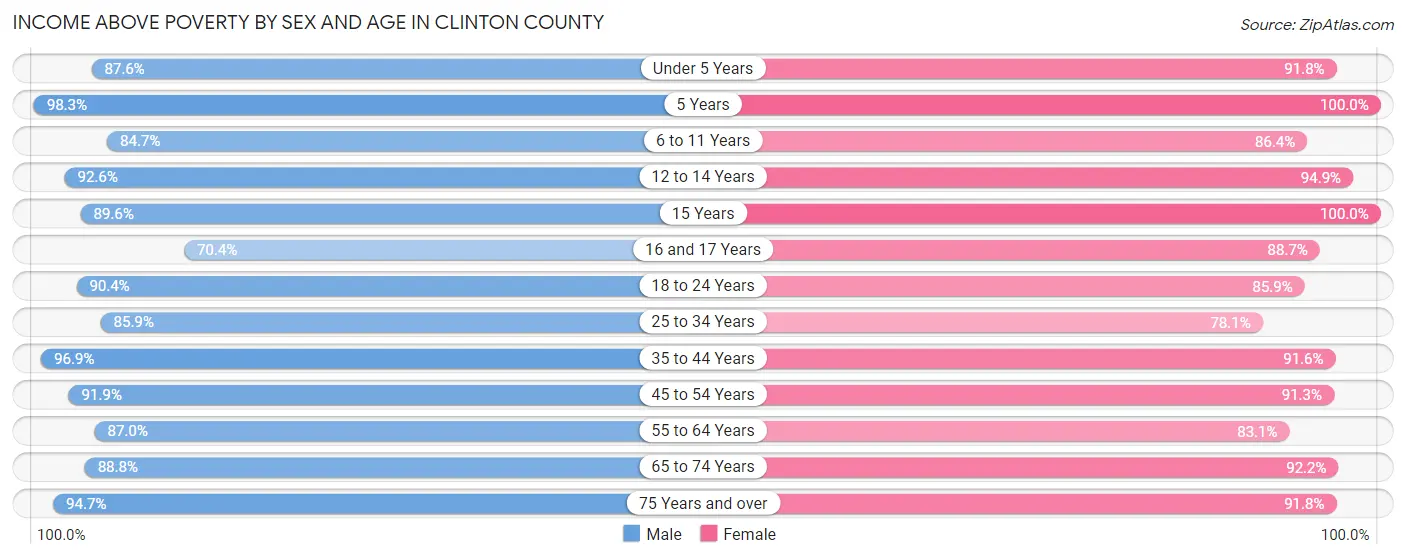
| Age Bracket | Male | Female |
| Under 5 Years | 466 (87.6%) | 515 (91.8%) |
| 5 Years | 171 (98.3%) | 67 (100.0%) |
| 6 to 11 Years | 746 (84.7%) | 779 (86.4%) |
| 12 to 14 Years | 387 (92.6%) | 277 (94.9%) |
| 15 Years | 95 (89.6%) | 158 (100.0%) |
| 16 and 17 Years | 257 (70.4%) | 353 (88.7%) |
| 18 to 24 Years | 704 (90.4%) | 663 (85.9%) |
| 25 to 34 Years | 1,028 (85.9%) | 933 (78.1%) |
| 35 to 44 Years | 1,231 (96.9%) | 1,144 (91.6%) |
| 45 to 54 Years | 1,262 (91.8%) | 1,241 (91.3%) |
| 55 to 64 Years | 1,366 (87.0%) | 1,299 (83.1%) |
| 65 to 74 Years | 852 (88.8%) | 962 (92.1%) |
| 75 Years and over | 535 (94.7%) | 814 (91.8%) |
| Total | 9,100 (89.3%) | 9,205 (88.1%) |
Income Below Poverty Among Married-Couple Families in Clinton County
The poverty statistics for married-couple families in Clinton County show that 3.1% or 128 of the total 4,112 families live below the poverty line. Families with no children have the highest poverty rate of 4.3%, comprising of 102 families. On the other hand, families with 5 or more children have the lowest poverty rate of 0.0%, which includes 0 families.
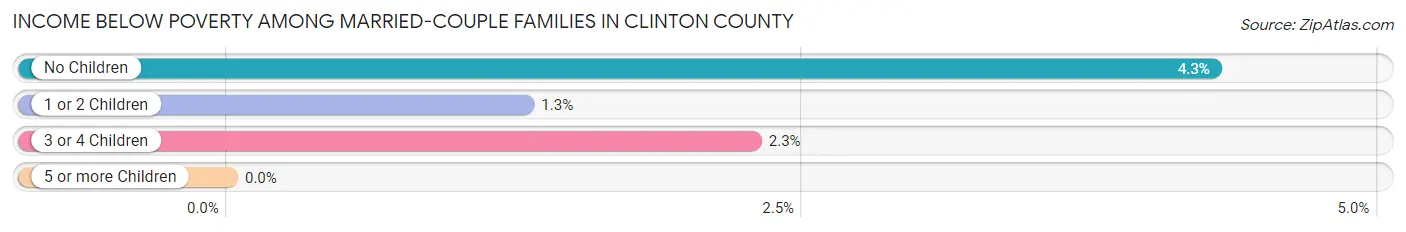
| Children | Above Poverty | Below Poverty |
| No Children | 2,281 (95.7%) | 102 (4.3%) |
| 1 or 2 Children | 1,296 (98.7%) | 17 (1.3%) |
| 3 or 4 Children | 385 (97.7%) | 9 (2.3%) |
| 5 or more Children | 22 (100.0%) | 0 (0.0%) |
| Total | 3,984 (96.9%) | 128 (3.1%) |
Income Below Poverty Among Single-Parent Households in Clinton County
According to the poverty data in Clinton County, 27.4% or 77 single-father households and 31.0% or 228 single-mother households are living below the poverty line. Among single-father households, those with 1 or 2 children have the highest poverty rate, with 67 households (32.8%) experiencing poverty. Likewise, among single-mother households, those with 5 or more children have the highest poverty rate, with 5 households (100.0%) falling below the poverty line.
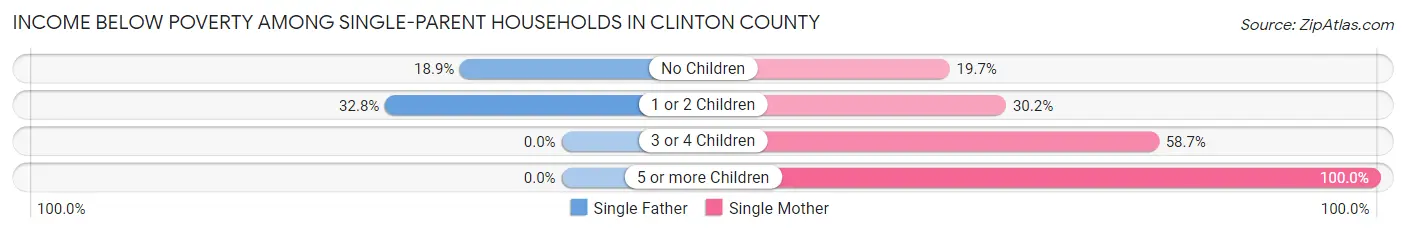
| Children | Single Father | Single Mother |
| No Children | 10 (18.9%) | 61 (19.7%) |
| 1 or 2 Children | 67 (32.8%) | 91 (30.2%) |
| 3 or 4 Children | 0 (0.0%) | 71 (58.7%) |
| 5 or more Children | 0 (0.0%) | 5 (100.0%) |
| Total | 77 (27.4%) | 228 (31.0%) |
Income Below Poverty Among Married-Couple vs Single-Parent Households in Clinton County
The poverty data for Clinton County shows that 128 of the married-couple family households (3.1%) and 305 of the single-parent households (30.0%) are living below the poverty level. Within the married-couple family households, those with no children have the highest poverty rate, with 102 households (4.3%) falling below the poverty line. Among the single-parent households, those with 5 or more children have the highest poverty rate, with 5 household (100.0%) living below poverty.
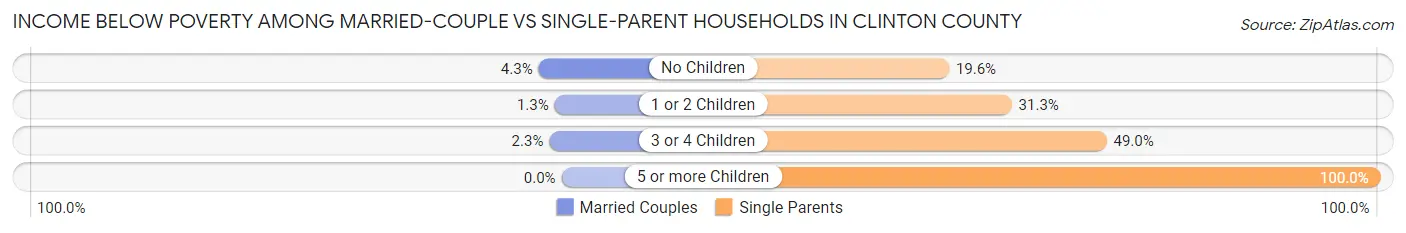
| Children | Married-Couple Families | Single-Parent Households |
| No Children | 102 (4.3%) | 71 (19.6%) |
| 1 or 2 Children | 17 (1.3%) | 158 (31.3%) |
| 3 or 4 Children | 9 (2.3%) | 71 (49.0%) |
| 5 or more Children | 0 (0.0%) | 5 (100.0%) |
| Total | 128 (3.1%) | 305 (30.0%) |
Race in Clinton County
The most populous races in Clinton County are White / Caucasian (19,960 | 94.4%), Two or more Races (716 | 3.4%), and Hispanic or Latino (521 | 2.5%).
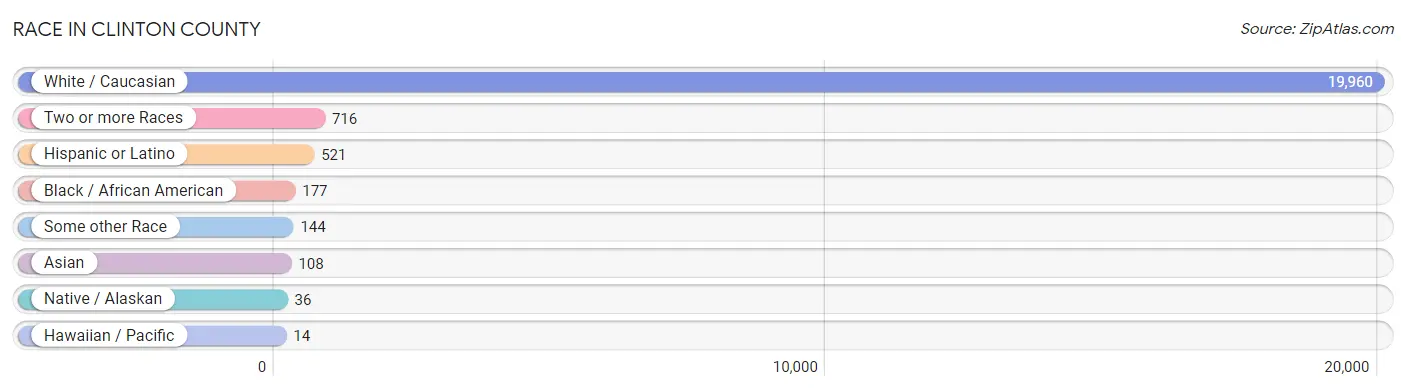
| Race | # Population | % Population |
| Asian | 108 | 0.5% |
| Black / African American | 177 | 0.8% |
| Hawaiian / Pacific | 14 | 0.1% |
| Hispanic or Latino | 521 | 2.5% |
| Native / Alaskan | 36 | 0.2% |
| White / Caucasian | 19,960 | 94.4% |
| Two or more Races | 716 | 3.4% |
| Some other Race | 144 | 0.7% |
| Total | 21,155 | 100.0% |
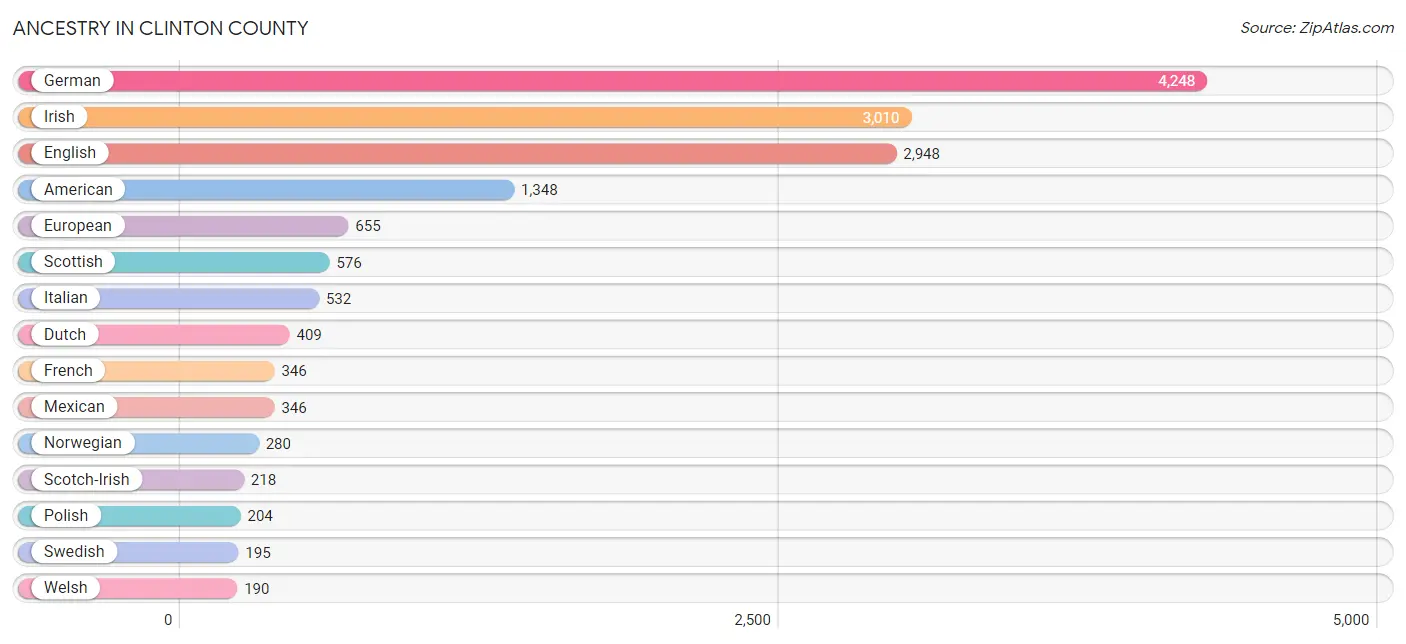
Ancestry in Clinton County
The most populous ancestries reported in Clinton County are German (4,248 | 20.1%), Irish (3,010 | 14.2%), English (2,948 | 13.9%), American (1,348 | 6.4%), and European (655 | 3.1%), together accounting for 57.7% of all Clinton County residents.
| Ancestry | # Population | % Population |
| American | 1,348 | 6.4% |
| Armenian | 12 | 0.1% |
| Austrian | 8 | 0.0% |
| Bhutanese | 19 | 0.1% |
| Blackfeet | 26 | 0.1% |
| British | 84 | 0.4% |
| Burmese | 7 | 0.0% |
| Canadian | 8 | 0.0% |
| Central American | 134 | 0.6% |
| Cherokee | 178 | 0.8% |
| Cheyenne | 2 | 0.0% |
| Chickasaw | 3 | 0.0% |
| Chippewa | 27 | 0.1% |
| Choctaw | 6 | 0.0% |
| Creek | 22 | 0.1% |
| Croatian | 31 | 0.2% |
| Crow | 3 | 0.0% |
| Cuban | 12 | 0.1% |
| Czech | 69 | 0.3% |
| Czechoslovakian | 35 | 0.2% |
| Danish | 52 | 0.3% |
| Dominican | 1 | 0.0% |
| Dutch | 409 | 1.9% |
| Dutch West Indian | 2 | 0.0% |
| Eastern European | 62 | 0.3% |
| English | 2,948 | 13.9% |
| European | 655 | 3.1% |
| Finnish | 2 | 0.0% |
| French | 346 | 1.6% |
| French Canadian | 84 | 0.4% |
| German | 4,248 | 20.1% |
| Greek | 88 | 0.4% |
| Guatemalan | 59 | 0.3% |
| Honduran | 68 | 0.3% |
| Indian (Asian) | 19 | 0.1% |
| Irish | 3,010 | 14.2% |
| Italian | 532 | 2.5% |
| Korean | 26 | 0.1% |
| Lithuanian | 11 | 0.1% |
| Maltese | 23 | 0.1% |
| Mexican | 346 | 1.6% |
| Northern European | 36 | 0.2% |
| Norwegian | 280 | 1.3% |
| Osage | 3 | 0.0% |
| Panamanian | 7 | 0.0% |
| Pennsylvania German | 4 | 0.0% |
| Polish | 204 | 1.0% |
| Portuguese | 126 | 0.6% |
| Romanian | 17 | 0.1% |
| Russian | 58 | 0.3% |
| Scandinavian | 26 | 0.1% |
| Scotch-Irish | 218 | 1.0% |
| Scottish | 576 | 2.7% |
| Sioux | 13 | 0.1% |
| Slovene | 9 | 0.0% |
| Sri Lankan | 35 | 0.2% |
| Swedish | 195 | 0.9% |
| Swiss | 62 | 0.3% |
| Thai | 45 | 0.2% |
| Ukrainian | 23 | 0.1% |
| Welsh | 190 | 0.9% | View All 61 Rows |
Immigrants in Clinton County
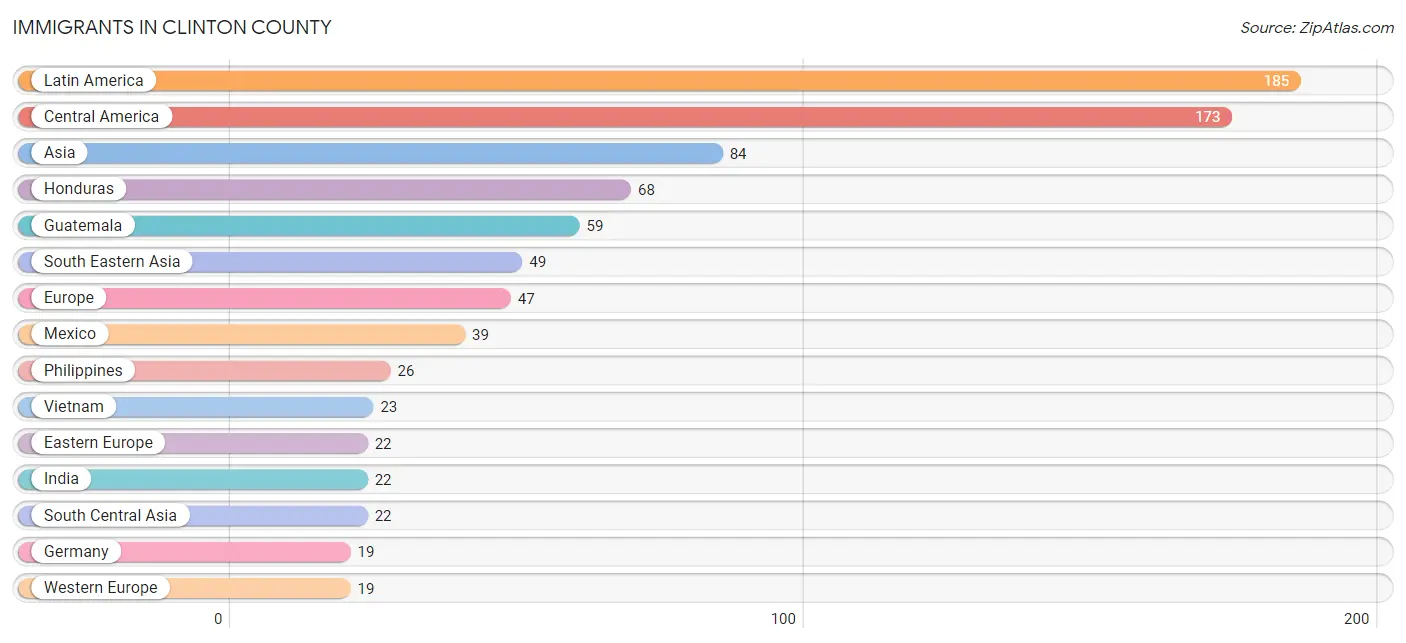
The most numerous immigrant groups reported in Clinton County came from Latin America (185 | 0.9%), Central America (173 | 0.8%), Asia (84 | 0.4%), Honduras (68 | 0.3%), and Guatemala (59 | 0.3%), together accounting for 2.7% of all Clinton County residents.
| Immigration Origin | # Population | % Population |
| Asia | 84 | 0.4% |
| Canada | 8 | 0.0% |
| Caribbean | 12 | 0.1% |
| Central America | 173 | 0.8% |
| China | 2 | 0.0% |
| Cuba | 12 | 0.1% |
| Czechoslovakia | 8 | 0.0% |
| Eastern Asia | 2 | 0.0% |
| Eastern Europe | 22 | 0.1% |
| Europe | 47 | 0.2% |
| Germany | 19 | 0.1% |
| Guatemala | 59 | 0.3% |
| Honduras | 68 | 0.3% |
| India | 22 | 0.1% |
| Italy | 6 | 0.0% |
| Latin America | 185 | 0.9% |
| Latvia | 5 | 0.0% |
| Lebanon | 5 | 0.0% |
| Mexico | 39 | 0.2% |
| Panama | 7 | 0.0% |
| Philippines | 26 | 0.1% |
| Russia | 9 | 0.0% |
| South Central Asia | 22 | 0.1% |
| South Eastern Asia | 49 | 0.2% |
| Southern Europe | 6 | 0.0% |
| Syria | 6 | 0.0% |
| Vietnam | 23 | 0.1% |
| Western Asia | 11 | 0.1% |
| Western Europe | 19 | 0.1% | View All 29 Rows |
Sex and Age in Clinton County
Sex and Age in Clinton County
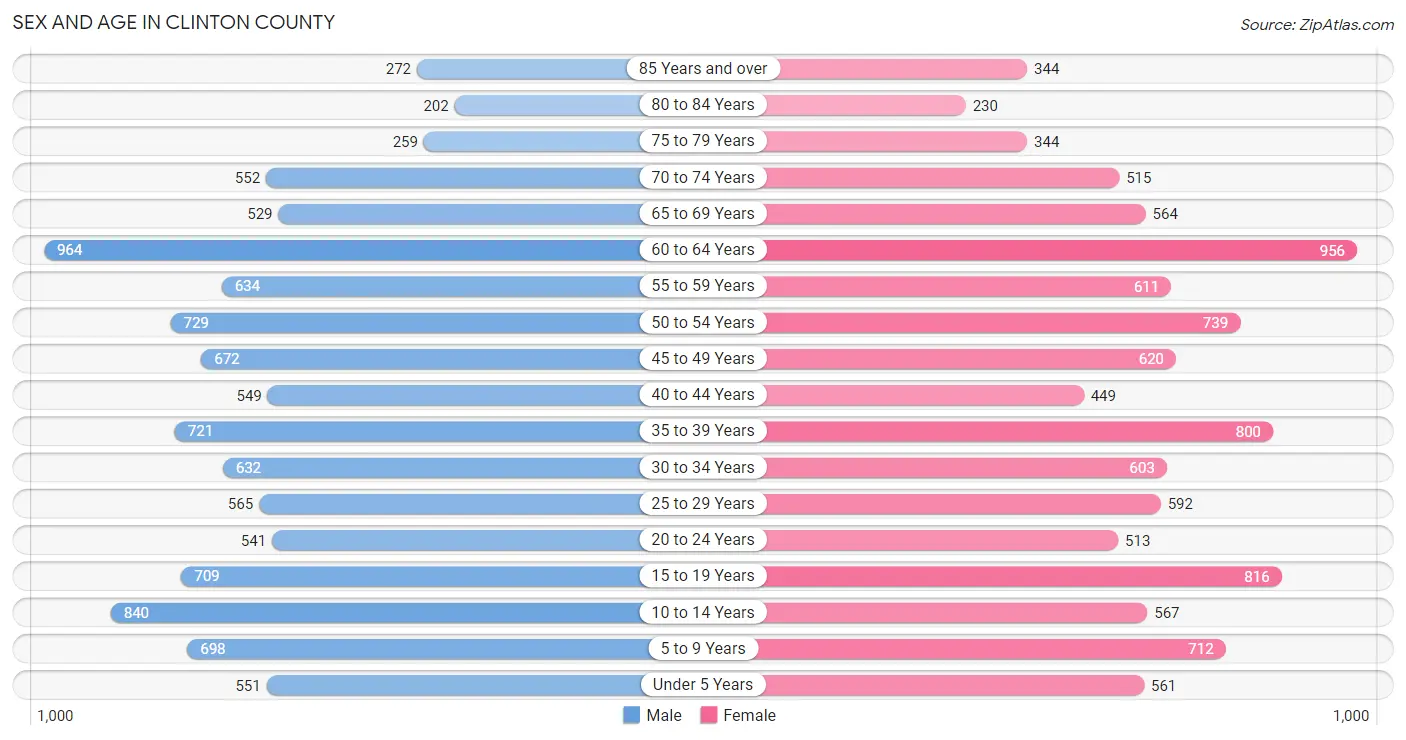
The most populous age groups in Clinton County are 60 to 64 Years (964 | 9.1%) for men and 60 to 64 Years (956 | 9.1%) for women.
| Age Bracket | Male | Female |
| Under 5 Years | 551 (5.2%) | 561 (5.3%) |
| 5 to 9 Years | 698 (6.6%) | 712 (6.8%) |
| 10 to 14 Years | 840 (7.9%) | 567 (5.4%) |
| 15 to 19 Years | 709 (6.7%) | 816 (7.7%) |
| 20 to 24 Years | 541 (5.1%) | 513 (4.9%) |
| 25 to 29 Years | 565 (5.3%) | 592 (5.6%) |
| 30 to 34 Years | 632 (5.9%) | 603 (5.7%) |
| 35 to 39 Years | 721 (6.8%) | 800 (7.6%) |
| 40 to 44 Years | 549 (5.2%) | 449 (4.3%) |
| 45 to 49 Years | 672 (6.3%) | 620 (5.9%) |
| 50 to 54 Years | 729 (6.9%) | 739 (7.0%) |
| 55 to 59 Years | 634 (6.0%) | 611 (5.8%) |
| 60 to 64 Years | 964 (9.1%) | 956 (9.1%) |
| 65 to 69 Years | 529 (5.0%) | 564 (5.3%) |
| 70 to 74 Years | 552 (5.2%) | 515 (4.9%) |
| 75 to 79 Years | 259 (2.4%) | 344 (3.3%) |
| 80 to 84 Years | 202 (1.9%) | 230 (2.2%) |
| 85 Years and over | 272 (2.6%) | 344 (3.3%) |
| Total | 10,619 (100.0%) | 10,536 (100.0%) |
Families and Households in Clinton County
Median Family Size in Clinton County
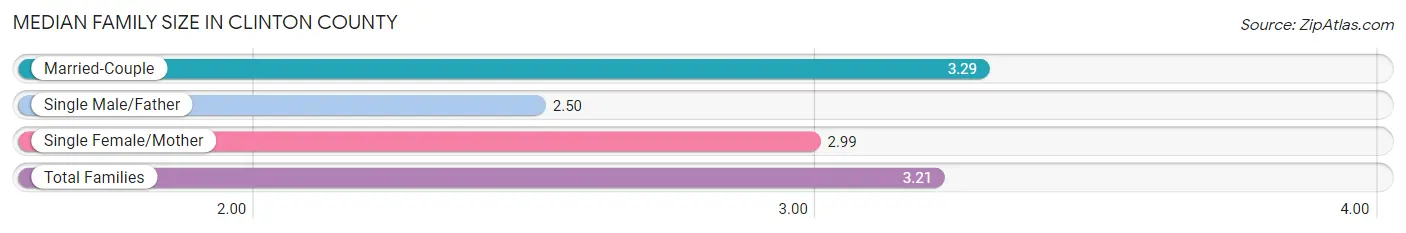
The median family size in Clinton County is 3.21 persons per family, with married-couple families (4,112 | 80.2%) accounting for the largest median family size of 3.29 persons per family. On the other hand, single male/father families (281 | 5.5%) represent the smallest median family size with 2.50 persons per family.
| Family Type | # Families | Family Size |
| Married-Couple | 4,112 (80.2%) | 3.29 |
| Single Male/Father | 281 (5.5%) | 2.50 |
| Single Female/Mother | 736 (14.3%) | 2.99 |
| Total Families | 5,129 (100.0%) | 3.21 |
Median Household Size in Clinton County
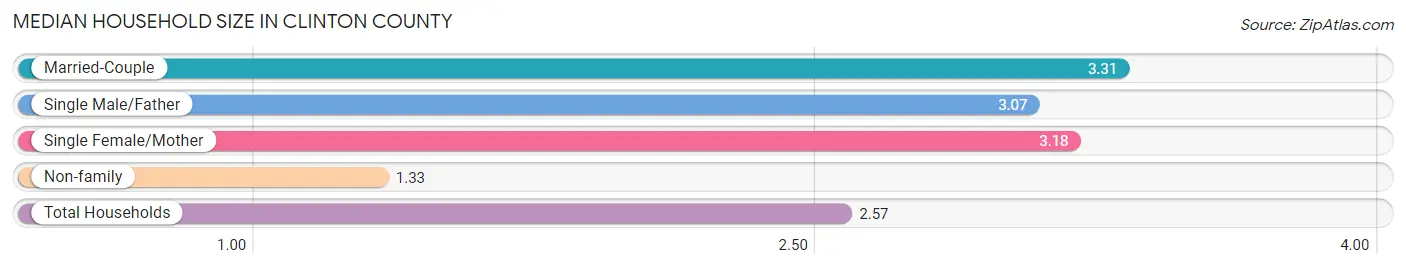
The median household size in Clinton County is 2.57 persons per household, with married-couple households (4,112 | 51.1%) accounting for the largest median household size of 3.31 persons per household. non-family households (2,918 | 36.3%) represent the smallest median household size with 1.33 persons per household.
| Household Type | # Households | Household Size |
| Married-Couple | 4,112 (51.1%) | 3.31 |
| Single Male/Father | 281 (3.5%) | 3.07 |
| Single Female/Mother | 736 (9.1%) | 3.18 |
| Non-family | 2,918 (36.3%) | 1.33 |
| Total Households | 8,047 (100.0%) | 2.57 |
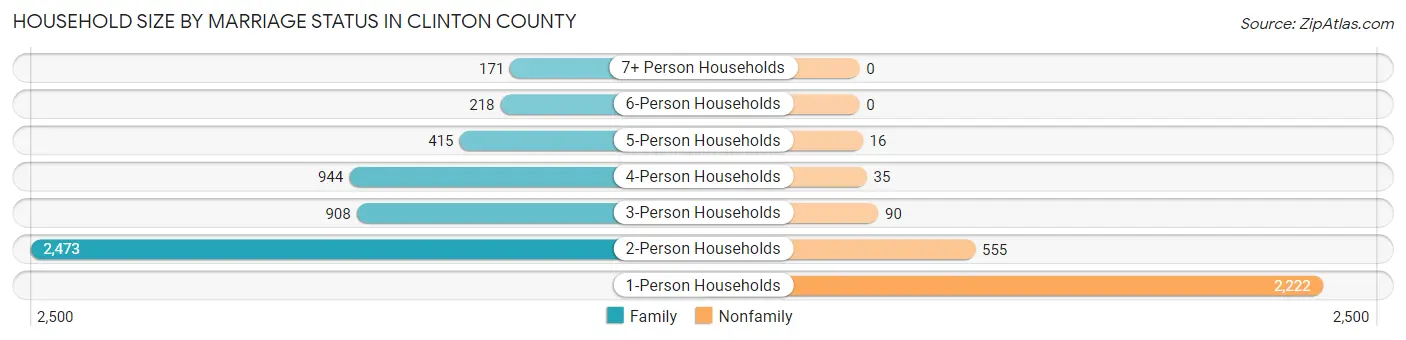
Household Size by Marriage Status in Clinton County
Out of a total of 8,047 households in Clinton County, 5,129 (63.7%) are family households, while 2,918 (36.3%) are nonfamily households. The most numerous type of family households are 2-person households, comprising 2,473, and the most common type of nonfamily households are 1-person households, comprising 2,222.
| Household Size | Family Households | Nonfamily Households |
| 1-Person Households | - | 2,222 (27.6%) |
| 2-Person Households | 2,473 (30.7%) | 555 (6.9%) |
| 3-Person Households | 908 (11.3%) | 90 (1.1%) |
| 4-Person Households | 944 (11.7%) | 35 (0.4%) |
| 5-Person Households | 415 (5.2%) | 16 (0.2%) |
| 6-Person Households | 218 (2.7%) | 0 (0.0%) |
| 7+ Person Households | 171 (2.1%) | 0 (0.0%) |
| Total | 5,129 (63.7%) | 2,918 (36.3%) |
Female Fertility in Clinton County
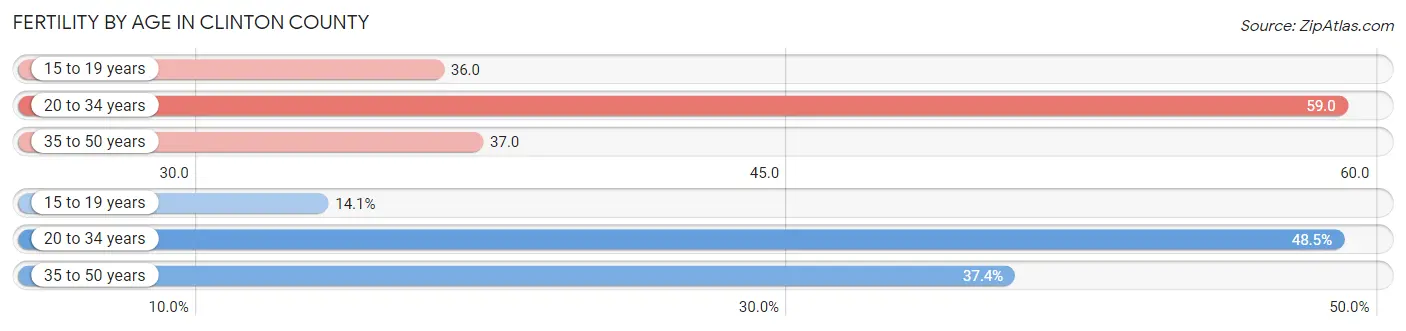
Fertility by Age in Clinton County
Average fertility rate in Clinton County is 45.0 births per 1,000 women. Women in the age bracket of 20 to 34 years have the highest fertility rate with 59.0 births per 1,000 women. Women in the age bracket of 20 to 34 years acount for 48.5% of all women with births.
| Age Bracket | Women with Births | Births / 1,000 Women |
| 15 to 19 years | 29 (14.1%) | 36.0 |
| 20 to 34 years | 100 (48.5%) | 59.0 |
| 35 to 50 years | 77 (37.4%) | 37.0 |
| Total | 206 (100.0%) | 45.0 |
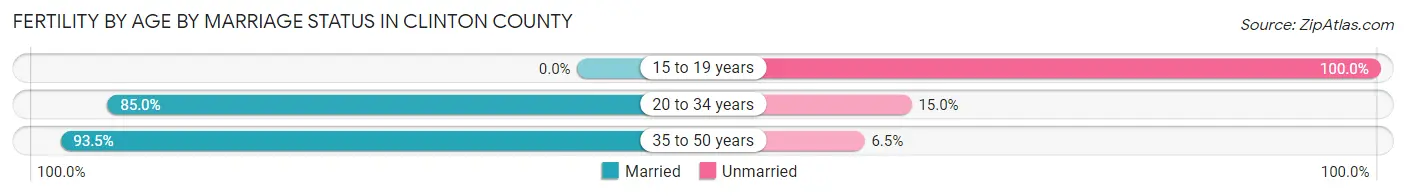
Fertility by Age by Marriage Status in Clinton County
76.2% of women with births (206) in Clinton County are married. The highest percentage of unmarried women with births falls into 15 to 19 years age bracket with 100.0% of them unmarried at the time of birth, while the lowest percentage of unmarried women with births belong to 35 to 50 years age bracket with 6.5% of them unmarried.
| Age Bracket | Married | Unmarried |
| 15 to 19 years | 0 (0.0%) | 29 (100.0%) |
| 20 to 34 years | 85 (85.0%) | 15 (15.0%) |
| 35 to 50 years | 72 (93.5%) | 5 (6.5%) |
| Total | 157 (76.2%) | 49 (23.8%) |
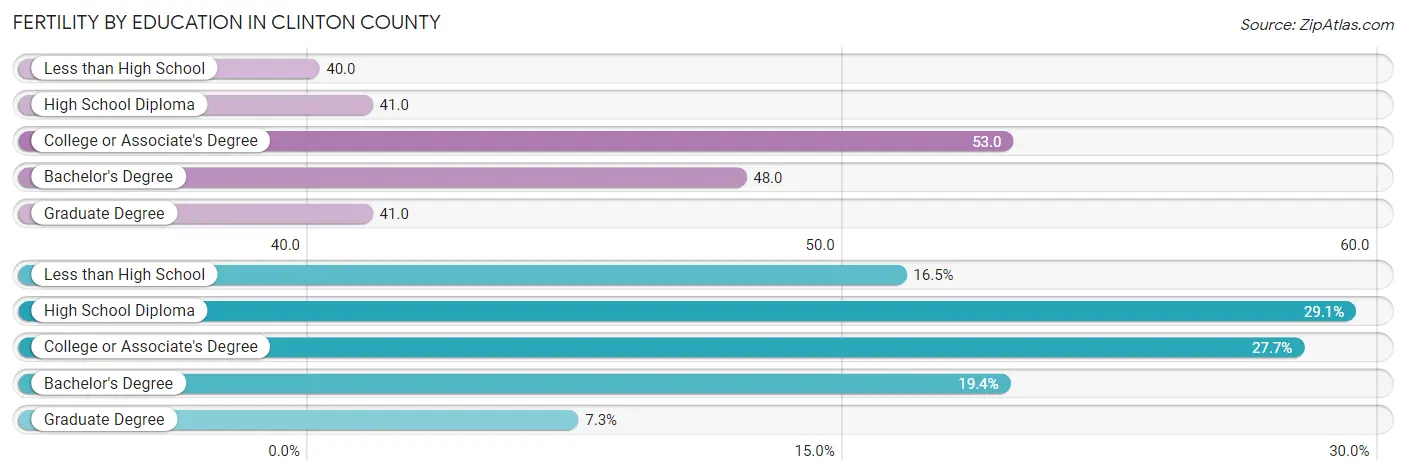
Fertility by Education in Clinton County
Average fertility rate in Clinton County is 45.0 births per 1,000 women. Women with the education attainment of college or associate's degree have the highest fertility rate of 53.0 births per 1,000 women, while women with the education attainment of less than high school have the lowest fertility at 40.0 births per 1,000 women. Women with the education attainment of high school diploma represent 29.1% of all women with births.
| Educational Attainment | Women with Births | Births / 1,000 Women |
| Less than High School | 34 (16.5%) | 40.0 |
| High School Diploma | 60 (29.1%) | 41.0 |
| College or Associate's Degree | 57 (27.7%) | 53.0 |
| Bachelor's Degree | 40 (19.4%) | 48.0 |
| Graduate Degree | 15 (7.3%) | 41.0 |
| Total | 206 (100.0%) | 45.0 |
Fertility by Education by Marriage Status in Clinton County
23.8% of women with births in Clinton County are unmarried. Women with the educational attainment of college or associate's degree are most likely to be married with 100.0% of them married at childbirth, while women with the educational attainment of less than high school are least likely to be married with 85.3% of them unmarried at childbirth.
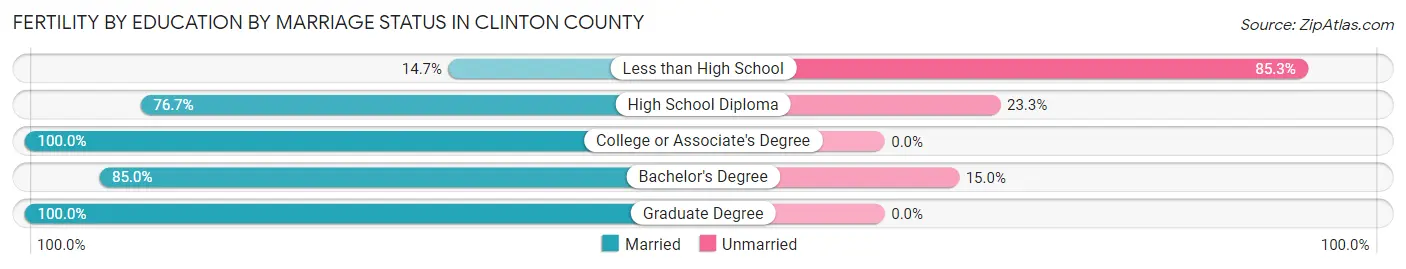
| Educational Attainment | Married | Unmarried |
| Less than High School | 5 (14.7%) | 29 (85.3%) |
| High School Diploma | 46 (76.7%) | 14 (23.3%) |
| College or Associate's Degree | 57 (100.0%) | 0 (0.0%) |
| Bachelor's Degree | 34 (85.0%) | 6 (15.0%) |
| Graduate Degree | 15 (100.0%) | 0 (0.0%) |
| Total | 157 (76.2%) | 49 (23.8%) |
Employment Characteristics in Clinton County
Employment by Class of Employer in Clinton County
Among the 9,070 employed individuals in Clinton County, private company employees (5,899 | 65.0%), not-for-profit organizations (947 | 10.4%), and self-employed (not incorporated) (611 | 6.7%) make up the most common classes of employment.
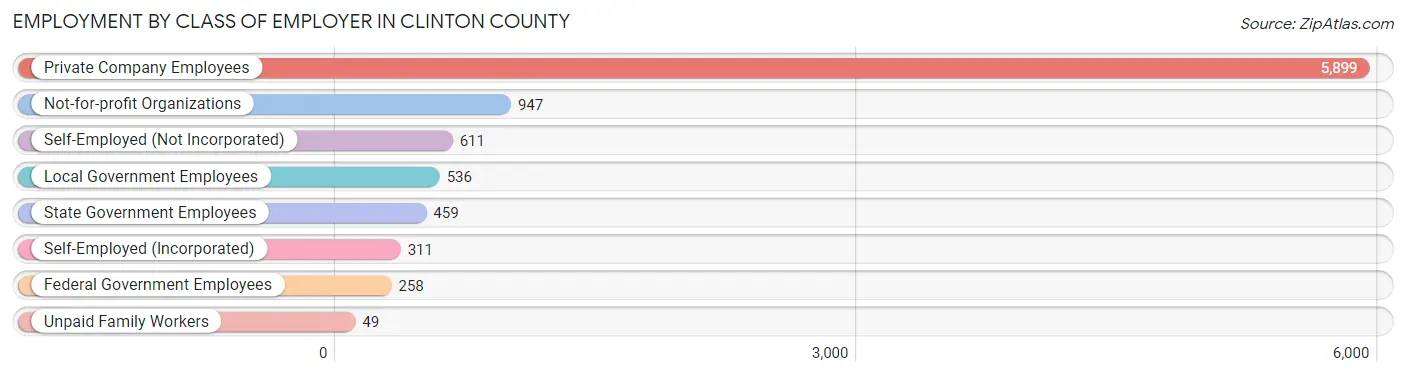
| Employer Class | # Employees | % Employees |
| Private Company Employees | 5,899 | 65.0% |
| Self-Employed (Incorporated) | 311 | 3.4% |
| Self-Employed (Not Incorporated) | 611 | 6.7% |
| Not-for-profit Organizations | 947 | 10.4% |
| Local Government Employees | 536 | 5.9% |
| State Government Employees | 459 | 5.1% |
| Federal Government Employees | 258 | 2.8% |
| Unpaid Family Workers | 49 | 0.5% |
| Total | 9,070 | 100.0% |
Employment Status by Age in Clinton County
According to the labor force statistics for Clinton County, out of the total population over 16 years of age (16,962), 60.0% or 10,177 individuals are in the labor force, with 6.1% or 621 of them unemployed. The age group with the highest labor force participation rate is 35 to 44 years, with 90.4% or 2,277 individuals in the labor force. Within the labor force, the 16 to 19 years age range has the highest percentage of unemployed individuals, with 41.6% or 195 of them being unemployed.
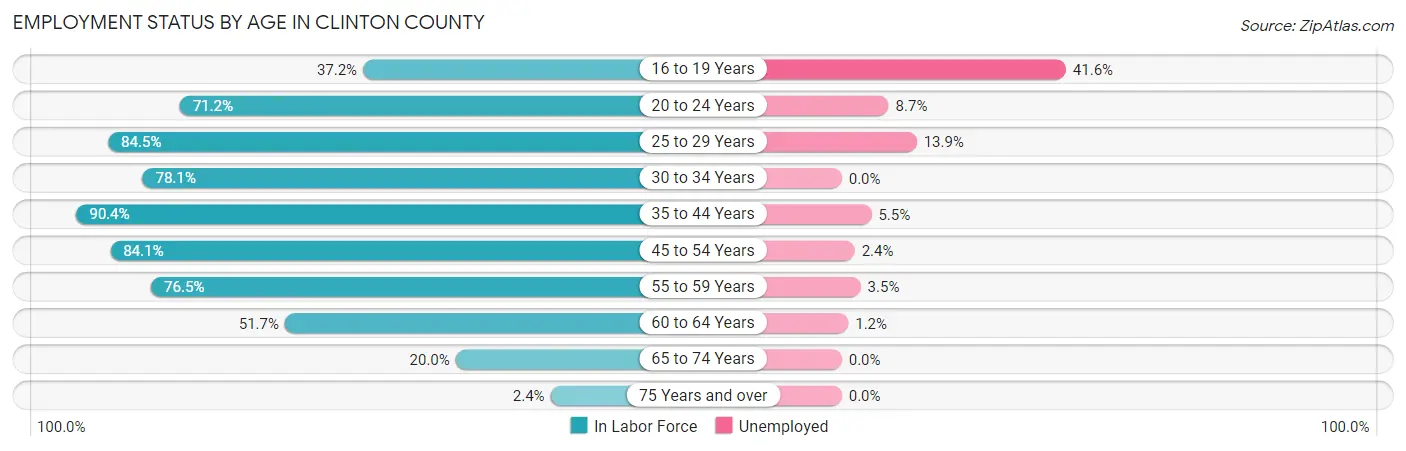
| Age Bracket | In Labor Force | Unemployed |
| 16 to 19 Years | 469 (37.2%) | 195 (41.6%) |
| 20 to 24 Years | 750 (71.2%) | 65 (8.7%) |
| 25 to 29 Years | 978 (84.5%) | 136 (13.9%) |
| 30 to 34 Years | 965 (78.1%) | 0 (0.0%) |
| 35 to 44 Years | 2,277 (90.4%) | 125 (5.5%) |
| 45 to 54 Years | 2,321 (84.1%) | 56 (2.4%) |
| 55 to 59 Years | 952 (76.5%) | 33 (3.5%) |
| 60 to 64 Years | 993 (51.7%) | 12 (1.2%) |
| 65 to 74 Years | 432 (20.0%) | 0 (0.0%) |
| 75 Years and over | 40 (2.4%) | 0 (0.0%) |
| Total | 10,177 (60.0%) | 621 (6.1%) |
Employment Status by Educational Attainment in Clinton County
According to labor force statistics for Clinton County, 78.3% of individuals (8,485) out of the total population between 25 and 64 years of age (10,836) are in the labor force, with 4.3% or 365 of them being unemployed. The group with the highest labor force participation rate are those with the educational attainment of bachelor's degree or higher, with 86.3% or 2,255 individuals in the labor force. Within the labor force, individuals with less than high school education have the highest percentage of unemployment, with 21.7% or 68 of them being unemployed.
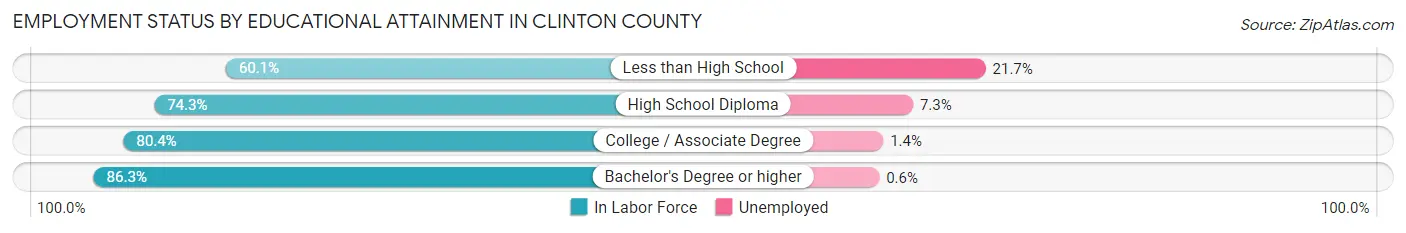
| Educational Attainment | In Labor Force | Unemployed |
| Less than High School | 313 (60.1%) | 113 (21.7%) |
| High School Diploma | 3,362 (74.3%) | 330 (7.3%) |
| College / Associate Degree | 2,554 (80.4%) | 44 (1.4%) |
| Bachelor's Degree or higher | 2,255 (86.3%) | 16 (0.6%) |
| Total | 8,485 (78.3%) | 466 (4.3%) |
Employment Occupations by Sex in Clinton County
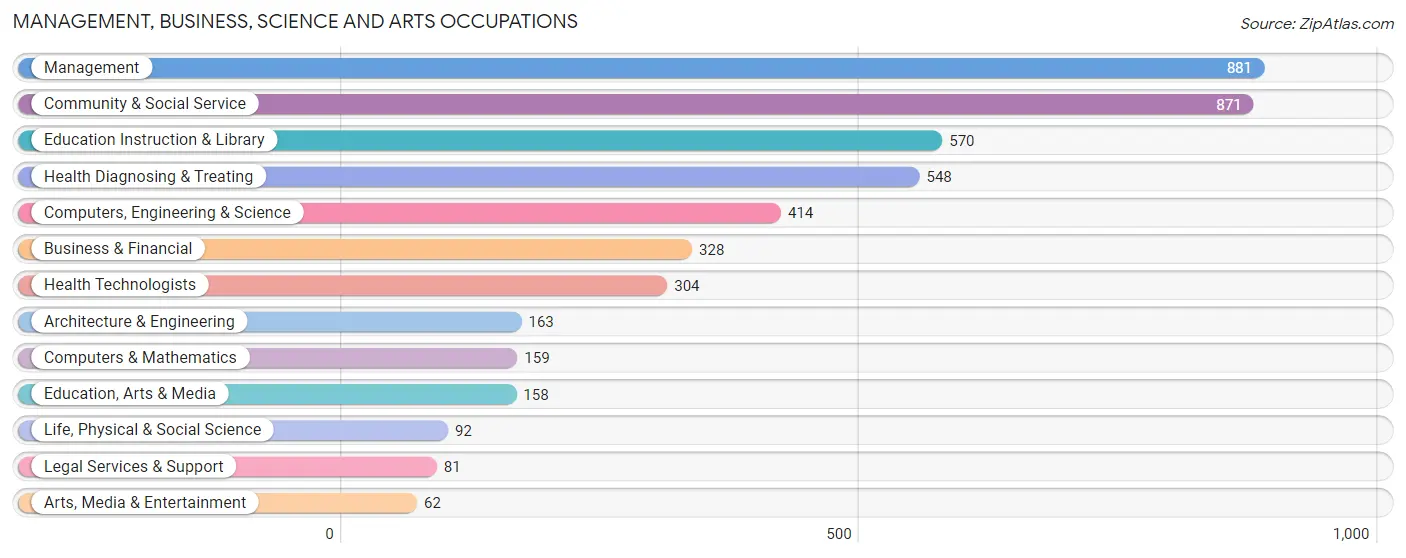
Management, Business, Science and Arts Occupations
The most common Management, Business, Science and Arts occupations in Clinton County are Management (881 | 9.2%), Community & Social Service (871 | 9.1%), Education Instruction & Library (570 | 6.0%), Health Diagnosing & Treating (548 | 5.7%), and Computers, Engineering & Science (414 | 4.3%).
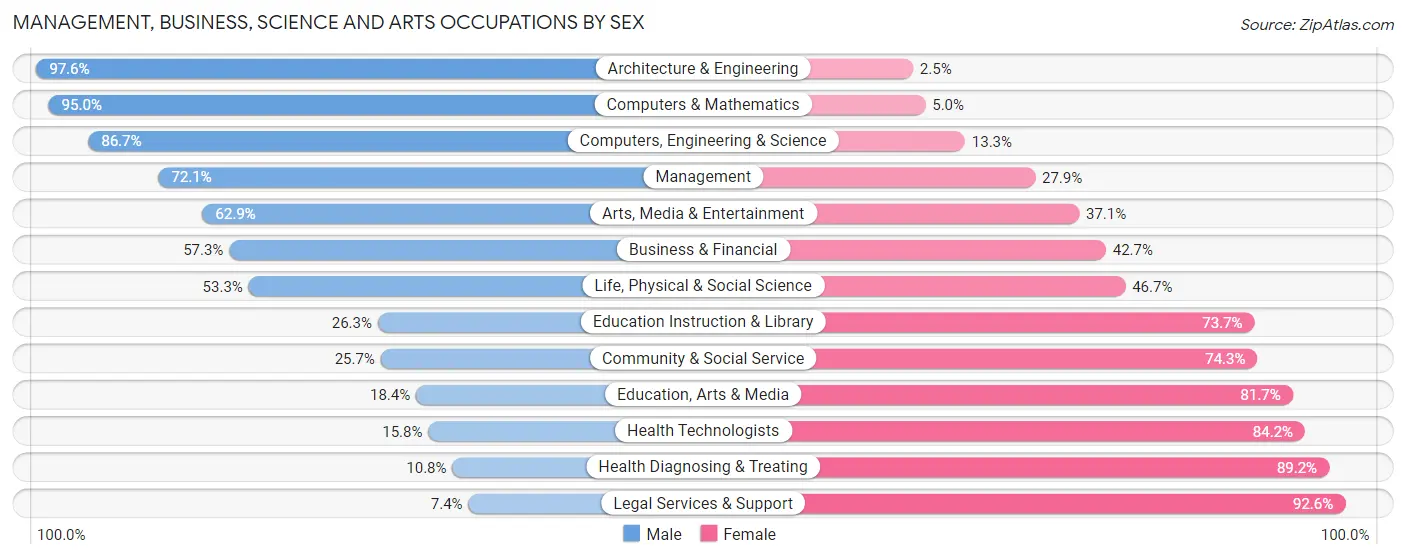
Management, Business, Science and Arts Occupations by Sex
Within the Management, Business, Science and Arts occupations in Clinton County, the most male-oriented occupations are Architecture & Engineering (97.6%), Computers & Mathematics (95.0%), and Computers, Engineering & Science (86.7%), while the most female-oriented occupations are Legal Services & Support (92.6%), Health Diagnosing & Treating (89.2%), and Health Technologists (84.2%).
| Occupation | Male | Female |
| Management | 635 (72.1%) | 246 (27.9%) |
| Business & Financial | 188 (57.3%) | 140 (42.7%) |
| Computers, Engineering & Science | 359 (86.7%) | 55 (13.3%) |
| Computers & Mathematics | 151 (95.0%) | 8 (5.0%) |
| Architecture & Engineering | 159 (97.6%) | 4 (2.5%) |
| Life, Physical & Social Science | 49 (53.3%) | 43 (46.7%) |
| Community & Social Service | 224 (25.7%) | 647 (74.3%) |
| Education, Arts & Media | 29 (18.3%) | 129 (81.7%) |
| Legal Services & Support | 6 (7.4%) | 75 (92.6%) |
| Education Instruction & Library | 150 (26.3%) | 420 (73.7%) |
| Arts, Media & Entertainment | 39 (62.9%) | 23 (37.1%) |
| Health Diagnosing & Treating | 59 (10.8%) | 489 (89.2%) |
| Health Technologists | 48 (15.8%) | 256 (84.2%) |
| Total (Category) | 1,465 (48.2%) | 1,577 (51.8%) |
| Total (Overall) | 5,187 (54.4%) | 4,352 (45.6%) |
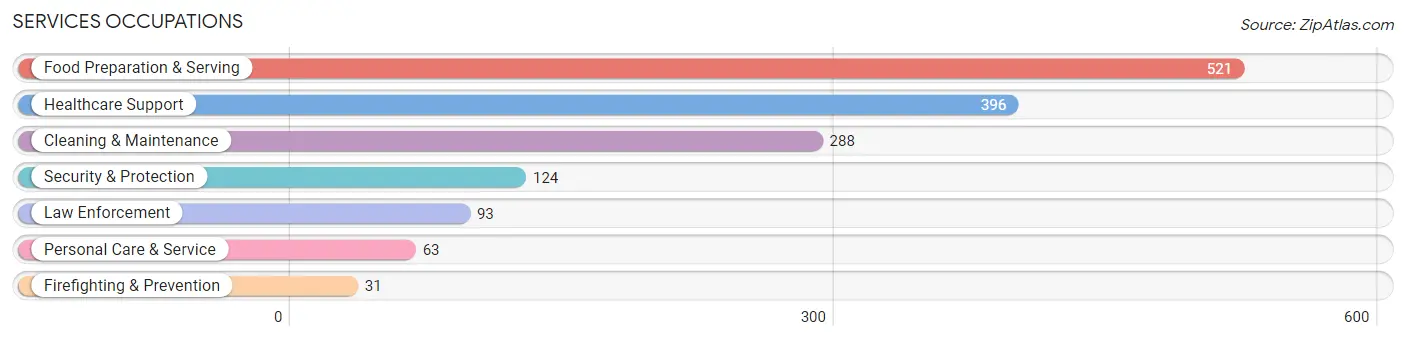
Services Occupations
The most common Services occupations in Clinton County are Food Preparation & Serving (521 | 5.5%), Healthcare Support (396 | 4.2%), Cleaning & Maintenance (288 | 3.0%), Security & Protection (124 | 1.3%), and Law Enforcement (93 | 1.0%).
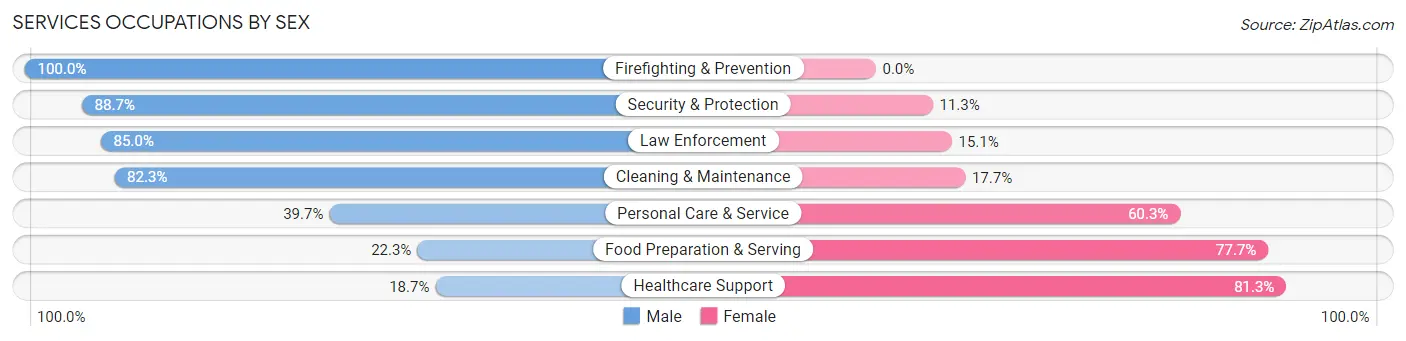
Services Occupations by Sex
Within the Services occupations in Clinton County, the most male-oriented occupations are Firefighting & Prevention (100.0%), Security & Protection (88.7%), and Law Enforcement (85.0%), while the most female-oriented occupations are Healthcare Support (81.3%), Food Preparation & Serving (77.7%), and Personal Care & Service (60.3%).
| Occupation | Male | Female |
| Healthcare Support | 74 (18.7%) | 322 (81.3%) |
| Security & Protection | 110 (88.7%) | 14 (11.3%) |
| Firefighting & Prevention | 31 (100.0%) | 0 (0.0%) |
| Law Enforcement | 79 (85.0%) | 14 (15.0%) |
| Food Preparation & Serving | 116 (22.3%) | 405 (77.7%) |
| Cleaning & Maintenance | 237 (82.3%) | 51 (17.7%) |
| Personal Care & Service | 25 (39.7%) | 38 (60.3%) |
| Total (Category) | 562 (40.4%) | 830 (59.6%) |
| Total (Overall) | 5,187 (54.4%) | 4,352 (45.6%) |
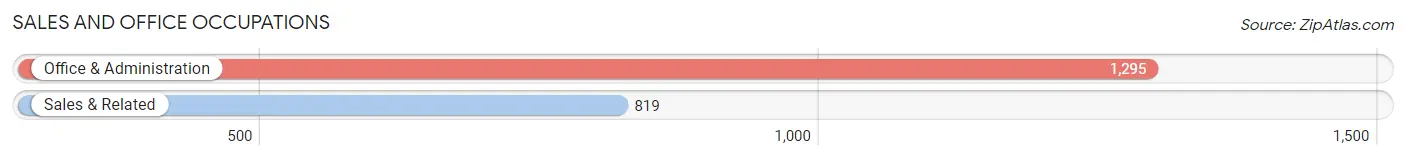
Sales and Office Occupations
The most common Sales and Office occupations in Clinton County are Office & Administration (1,295 | 13.6%), and Sales & Related (819 | 8.6%).
Sales and Office Occupations by Sex
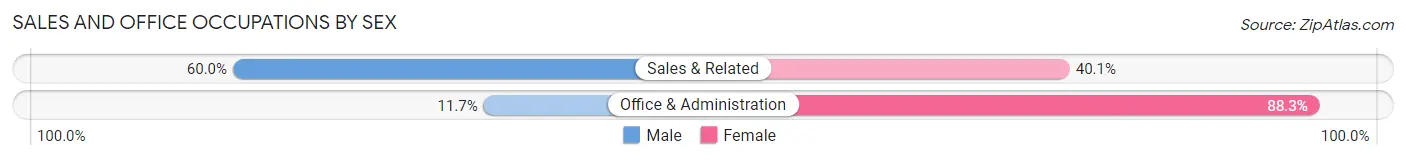
| Occupation | Male | Female |
| Sales & Related | 491 (60.0%) | 328 (40.1%) |
| Office & Administration | 152 (11.7%) | 1,143 (88.3%) |
| Total (Category) | 643 (30.4%) | 1,471 (69.6%) |
| Total (Overall) | 5,187 (54.4%) | 4,352 (45.6%) |
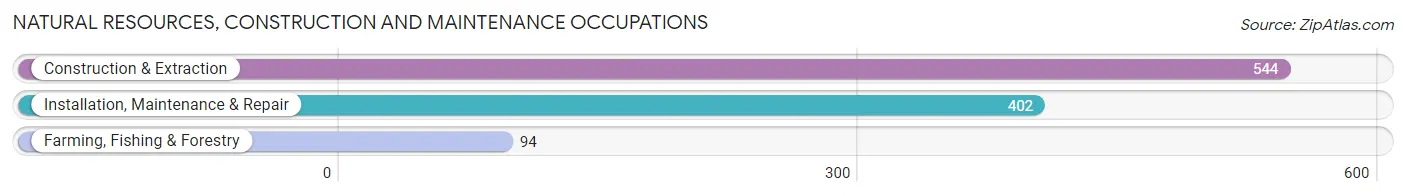
Natural Resources, Construction and Maintenance Occupations
The most common Natural Resources, Construction and Maintenance occupations in Clinton County are Construction & Extraction (544 | 5.7%), Installation, Maintenance & Repair (402 | 4.2%), and Farming, Fishing & Forestry (94 | 1.0%).
Natural Resources, Construction and Maintenance Occupations by Sex
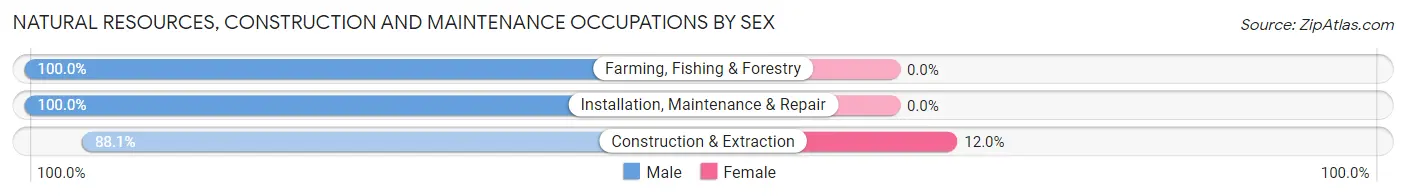
| Occupation | Male | Female |
| Farming, Fishing & Forestry | 94 (100.0%) | 0 (0.0%) |
| Construction & Extraction | 479 (88.0%) | 65 (11.9%) |
| Installation, Maintenance & Repair | 402 (100.0%) | 0 (0.0%) |
| Total (Category) | 975 (93.8%) | 65 (6.2%) |
| Total (Overall) | 5,187 (54.4%) | 4,352 (45.6%) |
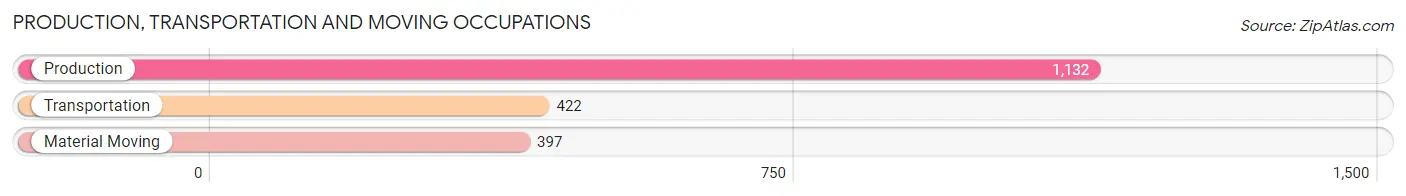
Production, Transportation and Moving Occupations
The most common Production, Transportation and Moving occupations in Clinton County are Production (1,132 | 11.9%), Transportation (422 | 4.4%), and Material Moving (397 | 4.2%).
Production, Transportation and Moving Occupations by Sex
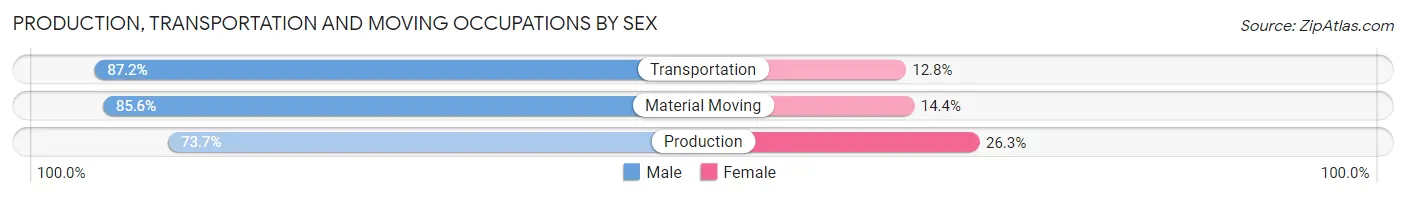
| Occupation | Male | Female |
| Production | 834 (73.7%) | 298 (26.3%) |
| Transportation | 368 (87.2%) | 54 (12.8%) |
| Material Moving | 340 (85.6%) | 57 (14.4%) |
| Total (Category) | 1,542 (79.0%) | 409 (21.0%) |
| Total (Overall) | 5,187 (54.4%) | 4,352 (45.6%) |
Employment Industries by Sex in Clinton County
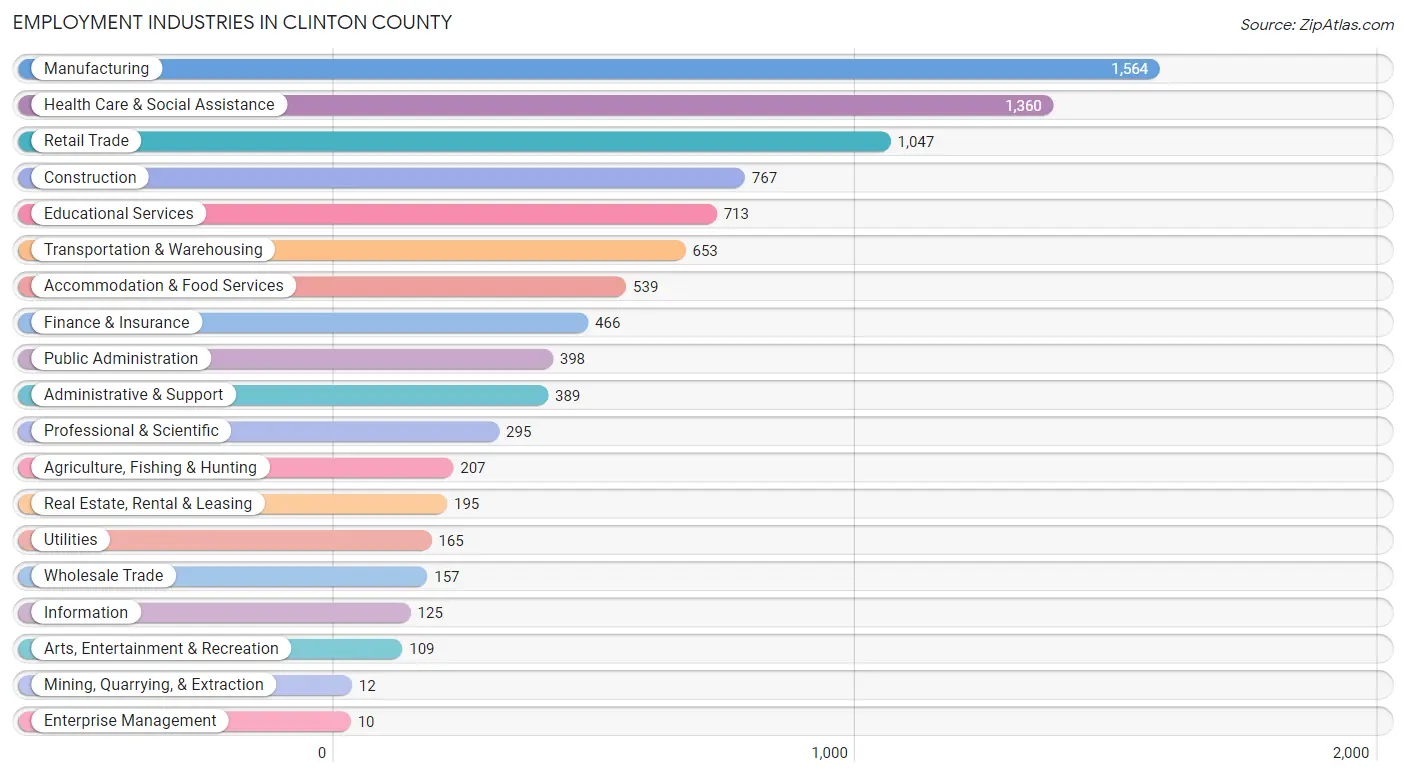
Employment Industries in Clinton County
The major employment industries in Clinton County include Manufacturing (1,564 | 16.4%), Health Care & Social Assistance (1,360 | 14.3%), Retail Trade (1,047 | 11.0%), Construction (767 | 8.0%), and Educational Services (713 | 7.5%).
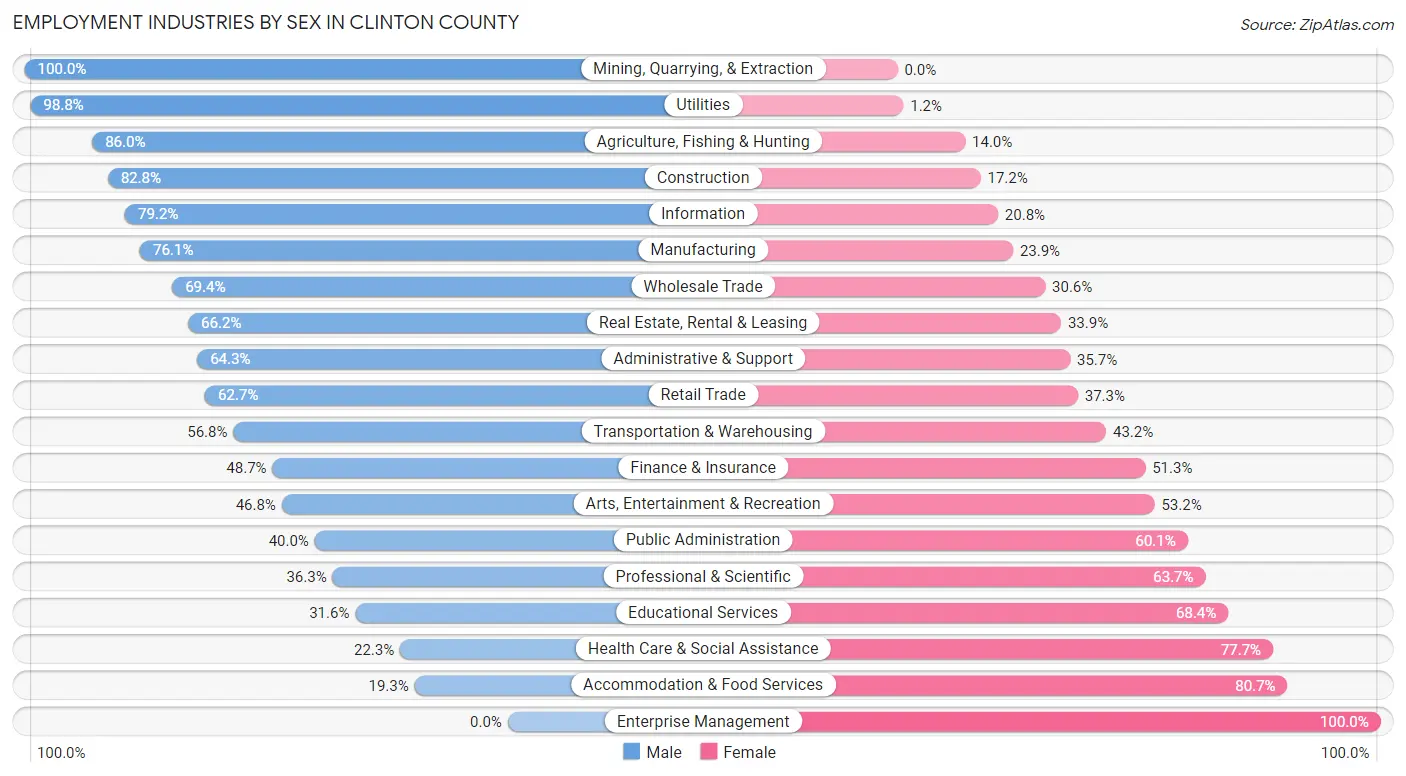
Employment Industries by Sex in Clinton County
The Clinton County industries that see more men than women are Mining, Quarrying, & Extraction (100.0%), Utilities (98.8%), and Agriculture, Fishing & Hunting (86.0%), whereas the industries that tend to have a higher number of women are Enterprise Management (100.0%), Accommodation & Food Services (80.7%), and Health Care & Social Assistance (77.7%).
| Industry | Male | Female |
| Agriculture, Fishing & Hunting | 178 (86.0%) | 29 (14.0%) |
| Mining, Quarrying, & Extraction | 12 (100.0%) | 0 (0.0%) |
| Construction | 635 (82.8%) | 132 (17.2%) |
| Manufacturing | 1,190 (76.1%) | 374 (23.9%) |
| Wholesale Trade | 109 (69.4%) | 48 (30.6%) |
| Retail Trade | 656 (62.7%) | 391 (37.3%) |
| Transportation & Warehousing | 371 (56.8%) | 282 (43.2%) |
| Utilities | 163 (98.8%) | 2 (1.2%) |
| Information | 99 (79.2%) | 26 (20.8%) |
| Finance & Insurance | 227 (48.7%) | 239 (51.3%) |
| Real Estate, Rental & Leasing | 129 (66.1%) | 66 (33.9%) |
| Professional & Scientific | 107 (36.3%) | 188 (63.7%) |
| Enterprise Management | 0 (0.0%) | 10 (100.0%) |
| Administrative & Support | 250 (64.3%) | 139 (35.7%) |
| Educational Services | 225 (31.6%) | 488 (68.4%) |
| Health Care & Social Assistance | 303 (22.3%) | 1,057 (77.7%) |
| Arts, Entertainment & Recreation | 51 (46.8%) | 58 (53.2%) |
| Accommodation & Food Services | 104 (19.3%) | 435 (80.7%) |
| Public Administration | 159 (40.0%) | 239 (60.1%) |
| Total | 5,187 (54.4%) | 4,352 (45.6%) |
Education in Clinton County
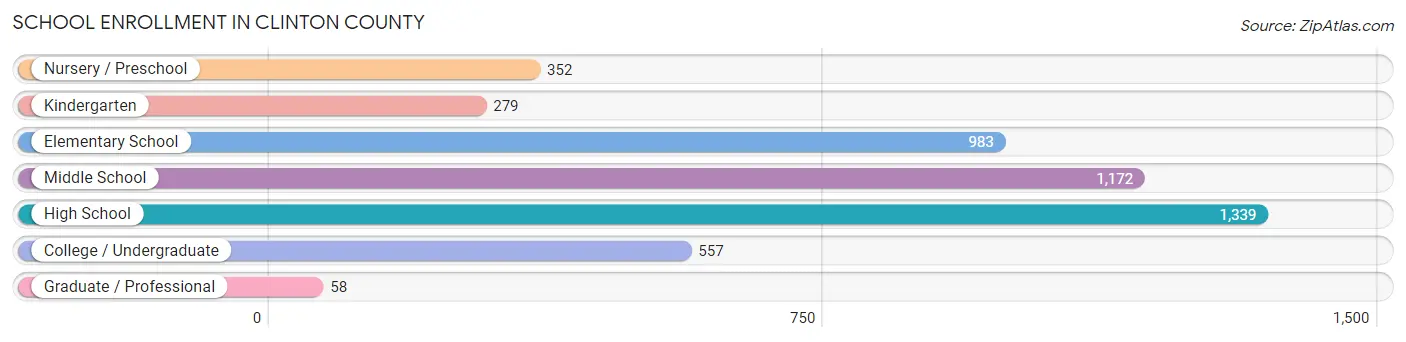
School Enrollment in Clinton County
The most common levels of schooling among the 4,740 students in Clinton County are high school (1,339 | 28.2%), middle school (1,172 | 24.7%), and elementary school (983 | 20.7%).
| School Level | # Students | % Students |
| Nursery / Preschool | 352 | 7.4% |
| Kindergarten | 279 | 5.9% |
| Elementary School | 983 | 20.7% |
| Middle School | 1,172 | 24.7% |
| High School | 1,339 | 28.2% |
| College / Undergraduate | 557 | 11.7% |
| Graduate / Professional | 58 | 1.2% |
| Total | 4,740 | 100.0% |
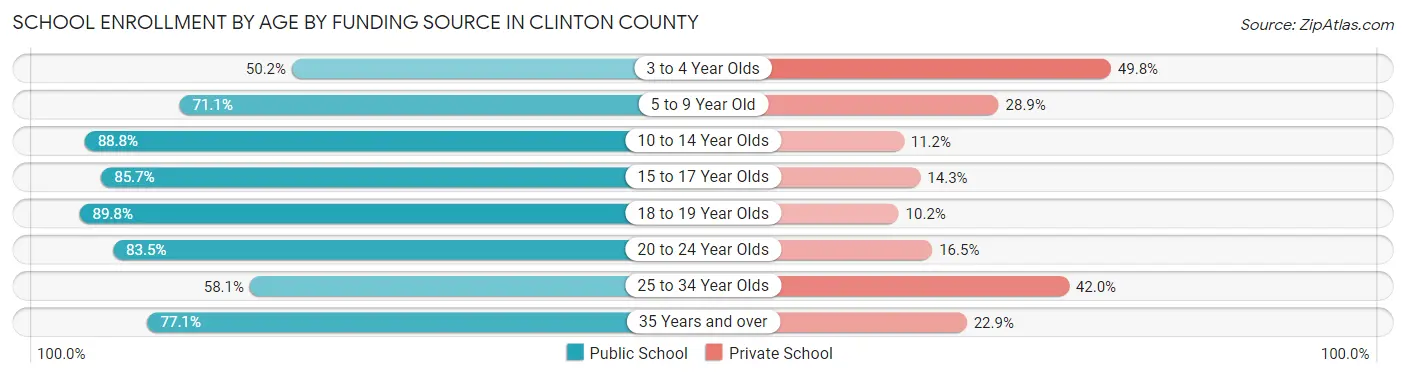
School Enrollment by Age by Funding Source in Clinton County
Out of a total of 4,740 students who are enrolled in schools in Clinton County, 962 (20.3%) attend a private institution, while the remaining 3,778 (79.7%) are enrolled in public schools. The age group of 3 to 4 year olds has the highest likelihood of being enrolled in private schools, with 113 (49.8% in the age bracket) enrolled. Conversely, the age group of 18 to 19 year olds has the lowest likelihood of being enrolled in a private school, with 228 (89.8% in the age bracket) attending a public institution.
| Age Bracket | Public School | Private School |
| 3 to 4 Year Olds | 114 (50.2%) | 113 (49.8%) |
| 5 to 9 Year Old | 902 (71.1%) | 366 (28.9%) |
| 10 to 14 Year Olds | 1,237 (88.8%) | 156 (11.2%) |
| 15 to 17 Year Olds | 852 (85.7%) | 142 (14.3%) |
| 18 to 19 Year Olds | 228 (89.8%) | 26 (10.2%) |
| 20 to 24 Year Olds | 253 (83.5%) | 50 (16.5%) |
| 25 to 34 Year Olds | 119 (58.1%) | 86 (41.9%) |
| 35 Years and over | 74 (77.1%) | 22 (22.9%) |
| Total | 3,778 (79.7%) | 962 (20.3%) |
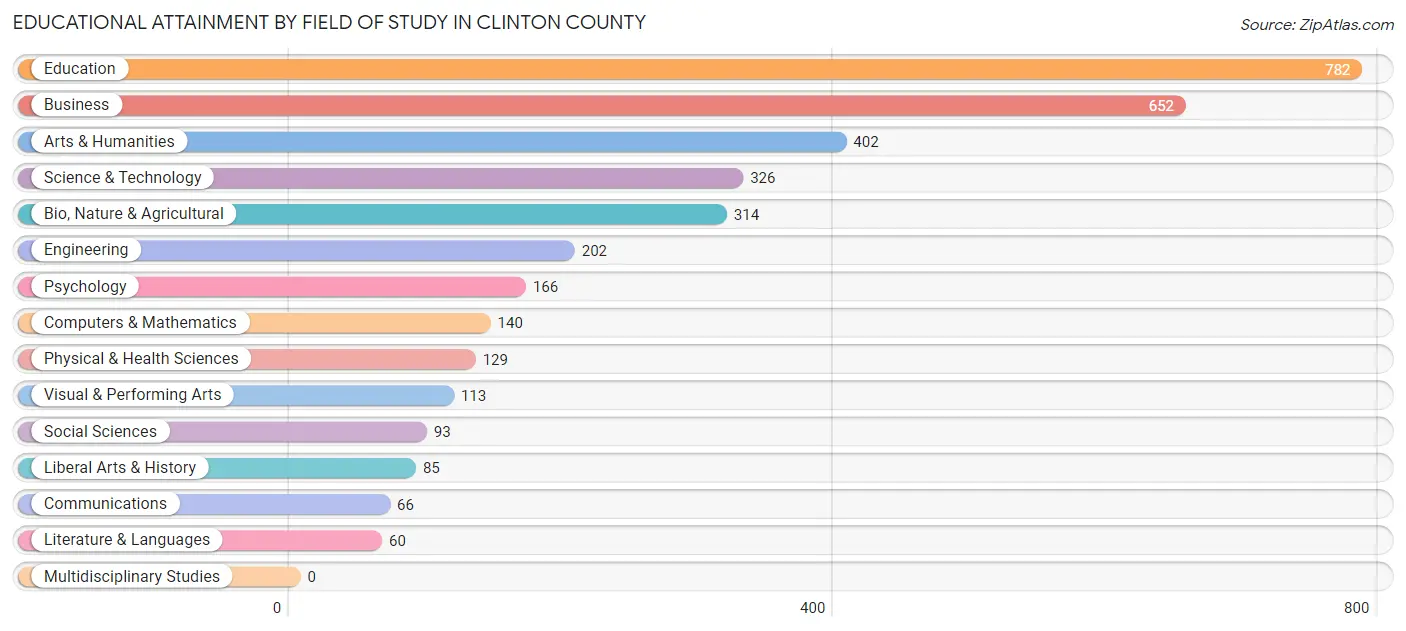
Educational Attainment by Field of Study in Clinton County
Education (782 | 22.2%), business (652 | 18.5%), arts & humanities (402 | 11.4%), science & technology (326 | 9.2%), and bio, nature & agricultural (314 | 8.9%) are the most common fields of study among 3,530 individuals in Clinton County who have obtained a bachelor's degree or higher.
| Field of Study | # Graduates | % Graduates |
| Computers & Mathematics | 140 | 4.0% |
| Bio, Nature & Agricultural | 314 | 8.9% |
| Physical & Health Sciences | 129 | 3.6% |
| Psychology | 166 | 4.7% |
| Social Sciences | 93 | 2.6% |
| Engineering | 202 | 5.7% |
| Multidisciplinary Studies | 0 | 0.0% |
| Science & Technology | 326 | 9.2% |
| Business | 652 | 18.5% |
| Education | 782 | 22.2% |
| Literature & Languages | 60 | 1.7% |
| Liberal Arts & History | 85 | 2.4% |
| Visual & Performing Arts | 113 | 3.2% |
| Communications | 66 | 1.9% |
| Arts & Humanities | 402 | 11.4% |
| Total | 3,530 | 100.0% |
Transportation & Commute in Clinton County
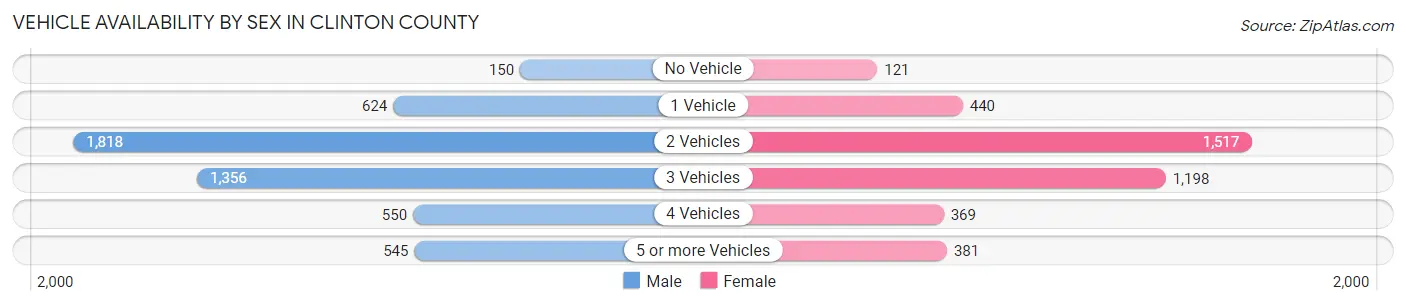
Vehicle Availability by Sex in Clinton County
The most prevalent vehicle ownership categories in Clinton County are males with 2 vehicles (1,818, accounting for 36.0%) and females with 2 vehicles (1,517, making up 45.2%).
| Vehicles Available | Male | Female |
| No Vehicle | 150 (3.0%) | 121 (3.0%) |
| 1 Vehicle | 624 (12.4%) | 440 (10.9%) |
| 2 Vehicles | 1,818 (36.0%) | 1,517 (37.7%) |
| 3 Vehicles | 1,356 (26.9%) | 1,198 (29.8%) |
| 4 Vehicles | 550 (10.9%) | 369 (9.2%) |
| 5 or more Vehicles | 545 (10.8%) | 381 (9.5%) |
| Total | 5,043 (100.0%) | 4,026 (100.0%) |
Commute Time in Clinton County
The most frequently occuring commute durations in Clinton County are 45 to 59 minutes (1,314 commuters, 15.7%), 30 to 34 minutes (1,268 commuters, 15.2%), and 5 to 9 minutes (1,065 commuters, 12.8%).
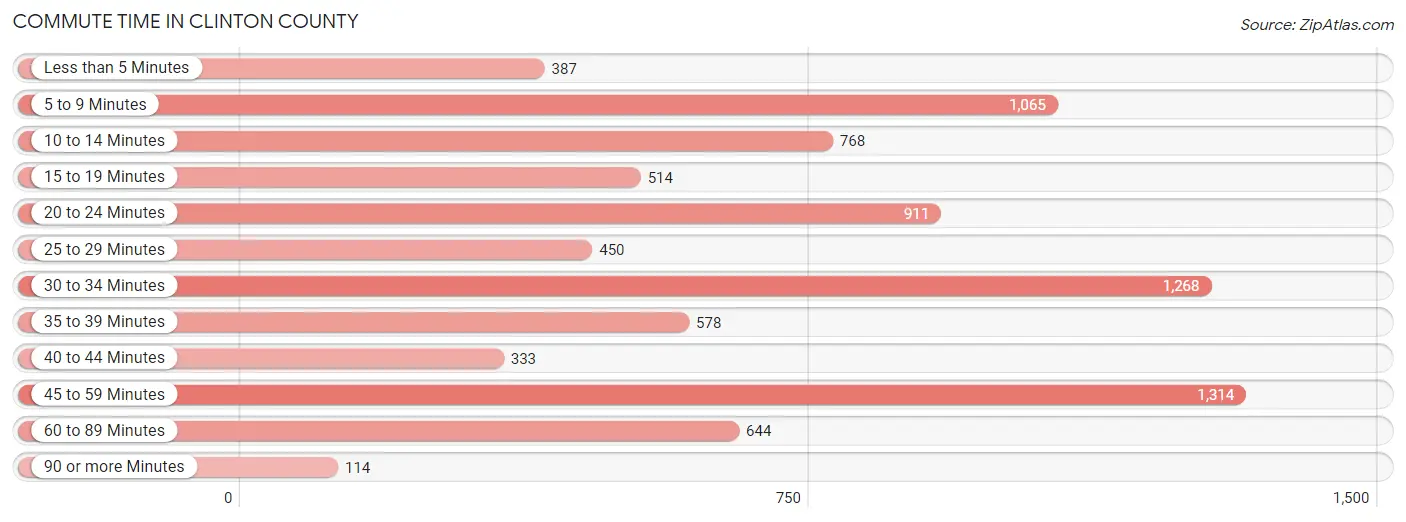
| Commute Time | # Commuters | % Commuters |
| Less than 5 Minutes | 387 | 4.6% |
| 5 to 9 Minutes | 1,065 | 12.8% |
| 10 to 14 Minutes | 768 | 9.2% |
| 15 to 19 Minutes | 514 | 6.2% |
| 20 to 24 Minutes | 911 | 10.9% |
| 25 to 29 Minutes | 450 | 5.4% |
| 30 to 34 Minutes | 1,268 | 15.2% |
| 35 to 39 Minutes | 578 | 6.9% |
| 40 to 44 Minutes | 333 | 4.0% |
| 45 to 59 Minutes | 1,314 | 15.7% |
| 60 to 89 Minutes | 644 | 7.7% |
| 90 or more Minutes | 114 | 1.4% |
Commute Time by Sex in Clinton County
The most common commute times in Clinton County are 45 to 59 minutes (874 commuters, 18.7%) for males and 20 to 24 minutes (598 commuters, 16.3%) for females.
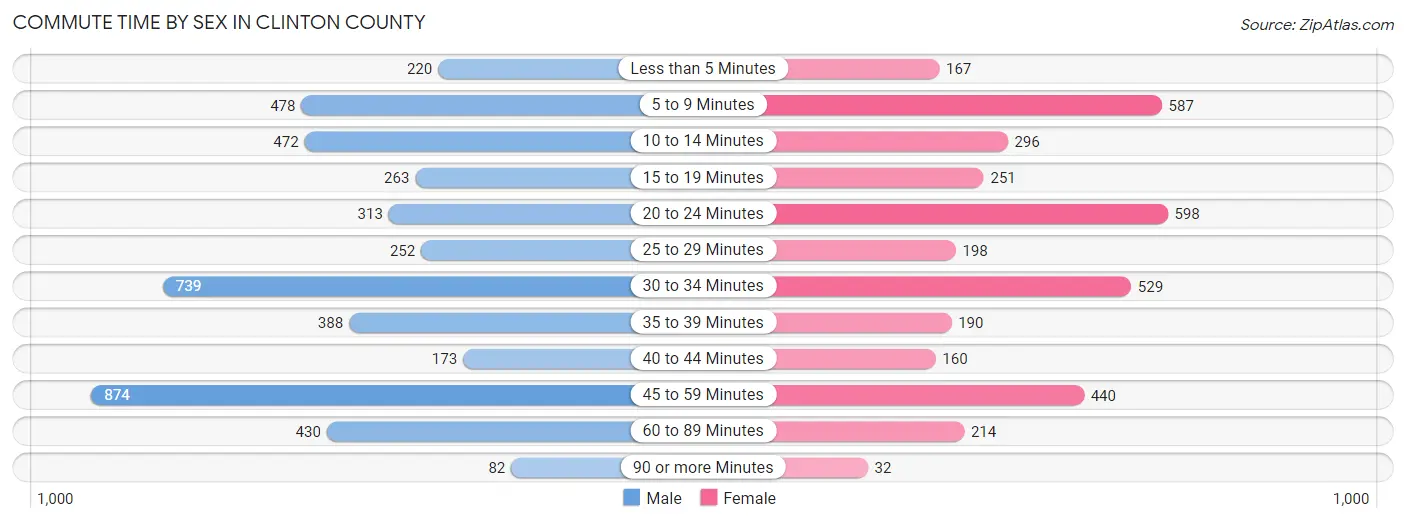
| Commute Time | Male | Female |
| Less than 5 Minutes | 220 (4.7%) | 167 (4.6%) |
| 5 to 9 Minutes | 478 (10.2%) | 587 (16.0%) |
| 10 to 14 Minutes | 472 (10.1%) | 296 (8.1%) |
| 15 to 19 Minutes | 263 (5.6%) | 251 (6.9%) |
| 20 to 24 Minutes | 313 (6.7%) | 598 (16.3%) |
| 25 to 29 Minutes | 252 (5.4%) | 198 (5.4%) |
| 30 to 34 Minutes | 739 (15.8%) | 529 (14.4%) |
| 35 to 39 Minutes | 388 (8.3%) | 190 (5.2%) |
| 40 to 44 Minutes | 173 (3.7%) | 160 (4.4%) |
| 45 to 59 Minutes | 874 (18.7%) | 440 (12.0%) |
| 60 to 89 Minutes | 430 (9.2%) | 214 (5.8%) |
| 90 or more Minutes | 82 (1.8%) | 32 (0.9%) |
Time of Departure to Work by Sex in Clinton County
The most frequent times of departure to work in Clinton County are 7:00 AM to 7:29 AM (685, 14.6%) for males and 7:00 AM to 7:29 AM (708, 19.3%) for females.
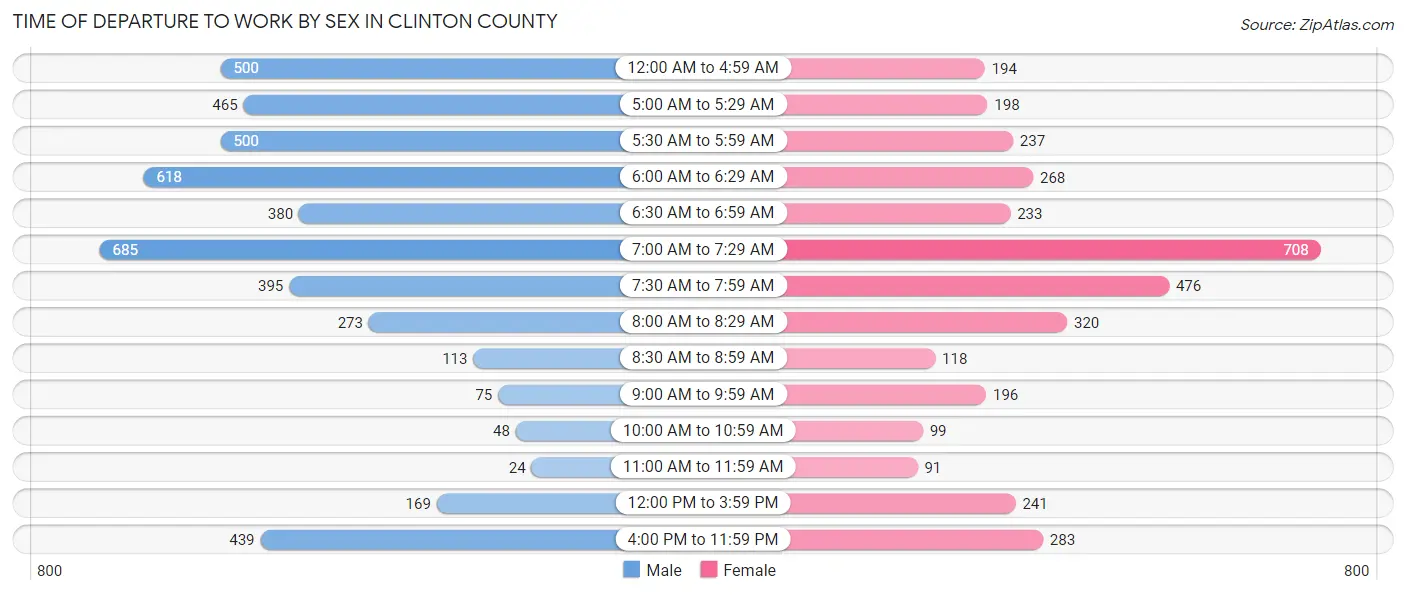
| Time of Departure | Male | Female |
| 12:00 AM to 4:59 AM | 500 (10.7%) | 194 (5.3%) |
| 5:00 AM to 5:29 AM | 465 (9.9%) | 198 (5.4%) |
| 5:30 AM to 5:59 AM | 500 (10.7%) | 237 (6.5%) |
| 6:00 AM to 6:29 AM | 618 (13.2%) | 268 (7.3%) |
| 6:30 AM to 6:59 AM | 380 (8.1%) | 233 (6.4%) |
| 7:00 AM to 7:29 AM | 685 (14.6%) | 708 (19.3%) |
| 7:30 AM to 7:59 AM | 395 (8.4%) | 476 (13.0%) |
| 8:00 AM to 8:29 AM | 273 (5.8%) | 320 (8.7%) |
| 8:30 AM to 8:59 AM | 113 (2.4%) | 118 (3.2%) |
| 9:00 AM to 9:59 AM | 75 (1.6%) | 196 (5.3%) |
| 10:00 AM to 10:59 AM | 48 (1.0%) | 99 (2.7%) |
| 11:00 AM to 11:59 AM | 24 (0.5%) | 91 (2.5%) |
| 12:00 PM to 3:59 PM | 169 (3.6%) | 241 (6.6%) |
| 4:00 PM to 11:59 PM | 439 (9.4%) | 283 (7.7%) |
| Total | 4,684 (100.0%) | 3,662 (100.0%) |
Housing Occupancy in Clinton County
Occupancy by Ownership in Clinton County
Of the total 8,047 dwellings in Clinton County, owner-occupied units account for 6,111 (75.9%), while renter-occupied units make up 1,936 (24.1%).
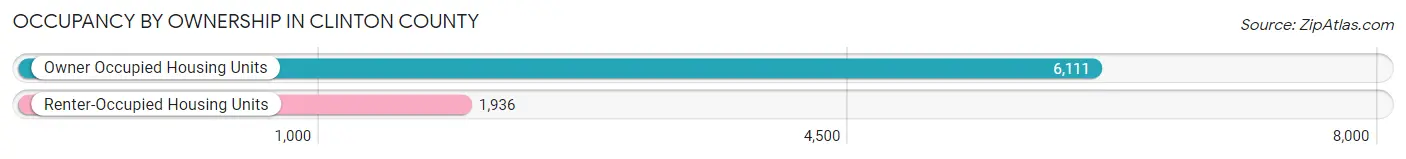
| Occupancy | # Housing Units | % Housing Units |
| Owner Occupied Housing Units | 6,111 | 75.9% |
| Renter-Occupied Housing Units | 1,936 | 24.1% |
| Total Occupied Housing Units | 8,047 | 100.0% |
Occupancy by Household Size in Clinton County
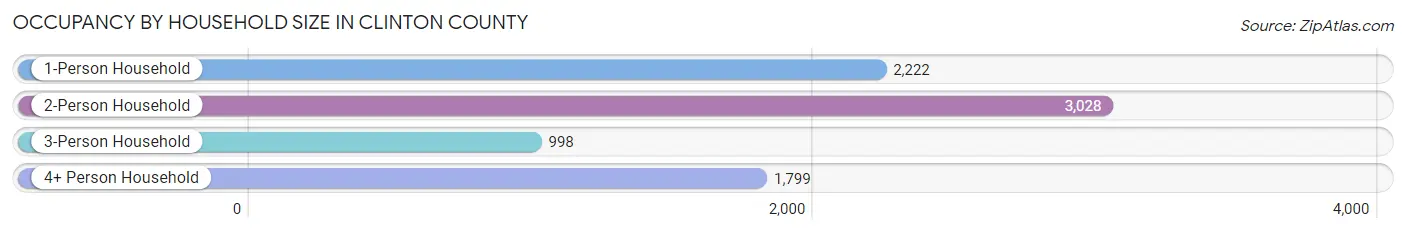
| Household Size | # Housing Units | % Housing Units |
| 1-Person Household | 2,222 | 27.6% |
| 2-Person Household | 3,028 | 37.6% |
| 3-Person Household | 998 | 12.4% |
| 4+ Person Household | 1,799 | 22.4% |
| Total Housing Units | 8,047 | 100.0% |
Occupancy by Ownership by Household Size in Clinton County
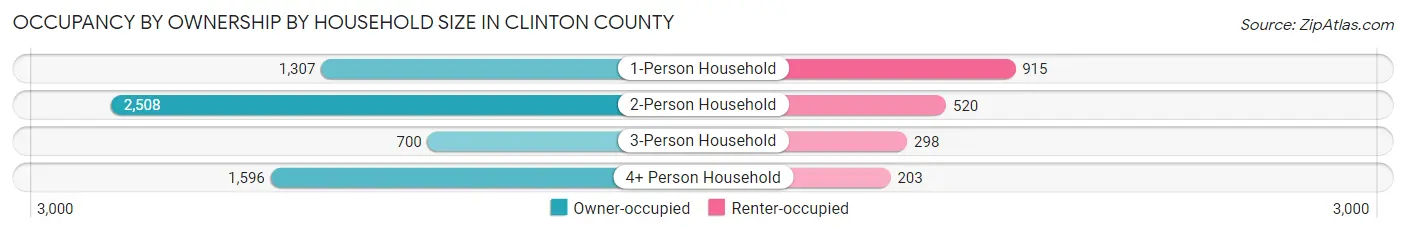
| Household Size | Owner-occupied | Renter-occupied |
| 1-Person Household | 1,307 (58.8%) | 915 (41.2%) |
| 2-Person Household | 2,508 (82.8%) | 520 (17.2%) |
| 3-Person Household | 700 (70.1%) | 298 (29.9%) |
| 4+ Person Household | 1,596 (88.7%) | 203 (11.3%) |
| Total Housing Units | 6,111 (75.9%) | 1,936 (24.1%) |
Occupancy by Educational Attainment in Clinton County
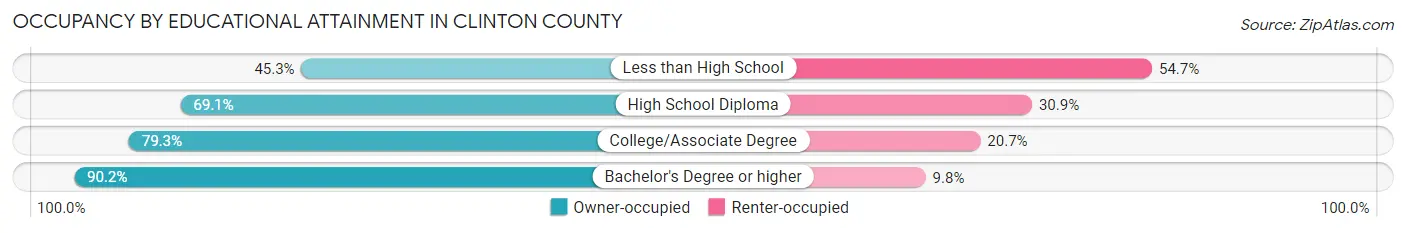
| Household Size | Owner-occupied | Renter-occupied |
| Less than High School | 198 (45.3%) | 239 (54.7%) |
| High School Diploma | 2,336 (69.1%) | 1,044 (30.9%) |
| College/Associate Degree | 1,739 (79.3%) | 453 (20.7%) |
| Bachelor's Degree or higher | 1,838 (90.2%) | 200 (9.8%) |
Occupancy by Age of Householder in Clinton County
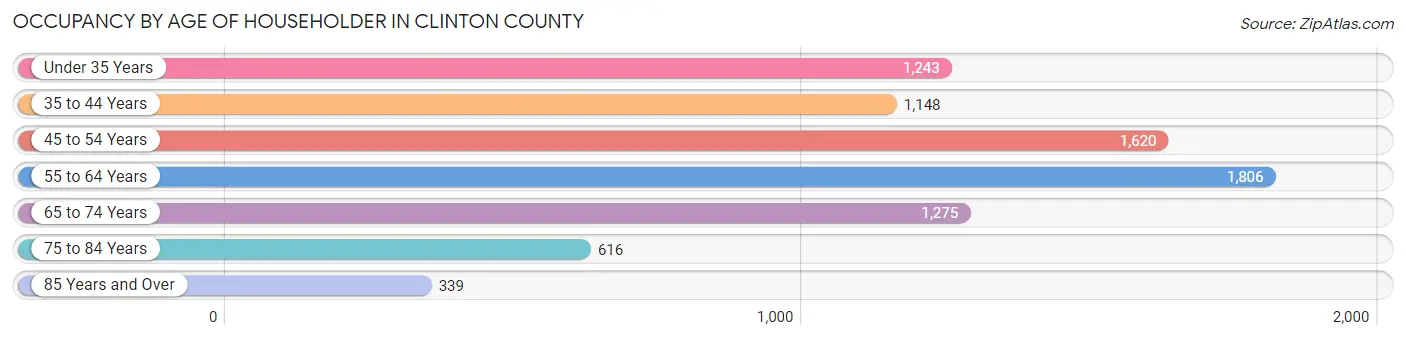
| Age Bracket | # Households | % Households |
| Under 35 Years | 1,243 | 15.4% |
| 35 to 44 Years | 1,148 | 14.3% |
| 45 to 54 Years | 1,620 | 20.1% |
| 55 to 64 Years | 1,806 | 22.4% |
| 65 to 74 Years | 1,275 | 15.8% |
| 75 to 84 Years | 616 | 7.7% |
| 85 Years and Over | 339 | 4.2% |
| Total | 8,047 | 100.0% |
Housing Finances in Clinton County
Median Income by Occupancy in Clinton County
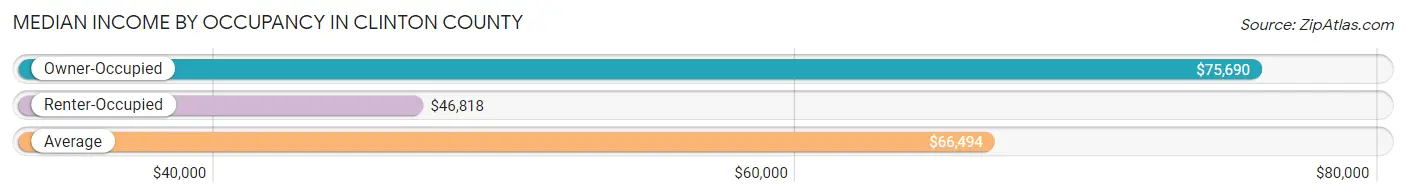
| Occupancy Type | # Households | Median Income |
| Owner-Occupied | 6,111 (75.9%) | $75,690 |
| Renter-Occupied | 1,936 (24.1%) | $46,818 |
| Average | 8,047 (100.0%) | $66,494 |
Occupancy by Householder Income Bracket in Clinton County
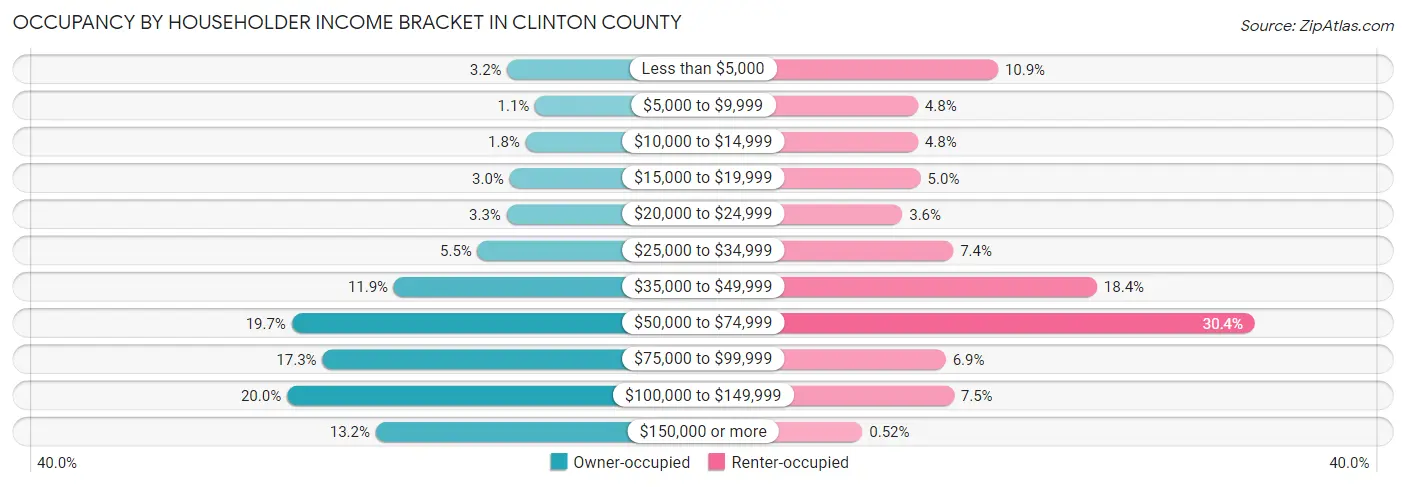
| Income Bracket | Owner-occupied | Renter-occupied |
| Less than $5,000 | 196 (3.2%) | 210 (10.8%) |
| $5,000 to $9,999 | 67 (1.1%) | 92 (4.8%) |
| $10,000 to $14,999 | 111 (1.8%) | 92 (4.8%) |
| $15,000 to $19,999 | 186 (3.0%) | 96 (5.0%) |
| $20,000 to $24,999 | 200 (3.3%) | 69 (3.6%) |
| $25,000 to $34,999 | 335 (5.5%) | 144 (7.4%) |
| $35,000 to $49,999 | 725 (11.9%) | 356 (18.4%) |
| $50,000 to $74,999 | 1,201 (19.7%) | 589 (30.4%) |
| $75,000 to $99,999 | 1,058 (17.3%) | 133 (6.9%) |
| $100,000 to $149,999 | 1,223 (20.0%) | 145 (7.5%) |
| $150,000 or more | 809 (13.2%) | 10 (0.5%) |
| Total | 6,111 (100.0%) | 1,936 (100.0%) |
Monthly Housing Cost Tiers in Clinton County
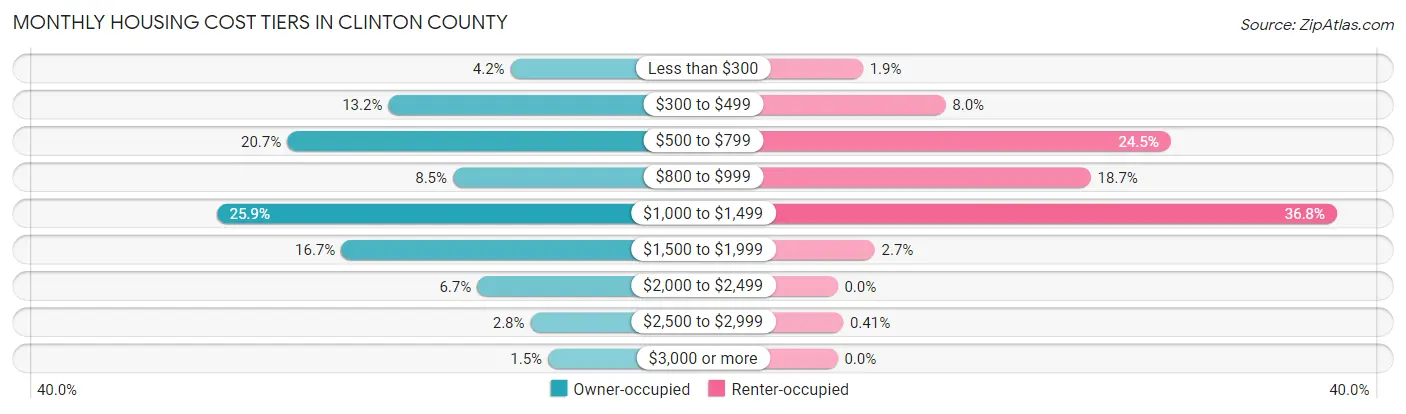
| Monthly Cost | Owner-occupied | Renter-occupied |
| Less than $300 | 258 (4.2%) | 36 (1.9%) |
| $300 to $499 | 808 (13.2%) | 154 (8.0%) |
| $500 to $799 | 1,263 (20.7%) | 475 (24.5%) |
| $800 to $999 | 517 (8.5%) | 361 (18.6%) |
| $1,000 to $1,499 | 1,580 (25.9%) | 712 (36.8%) |
| $1,500 to $1,999 | 1,020 (16.7%) | 53 (2.7%) |
| $2,000 to $2,499 | 408 (6.7%) | 0 (0.0%) |
| $2,500 to $2,999 | 168 (2.8%) | 8 (0.4%) |
| $3,000 or more | 89 (1.5%) | 0 (0.0%) |
| Total | 6,111 (100.0%) | 1,936 (100.0%) |
Physical Housing Characteristics in Clinton County
Housing Structures in Clinton County
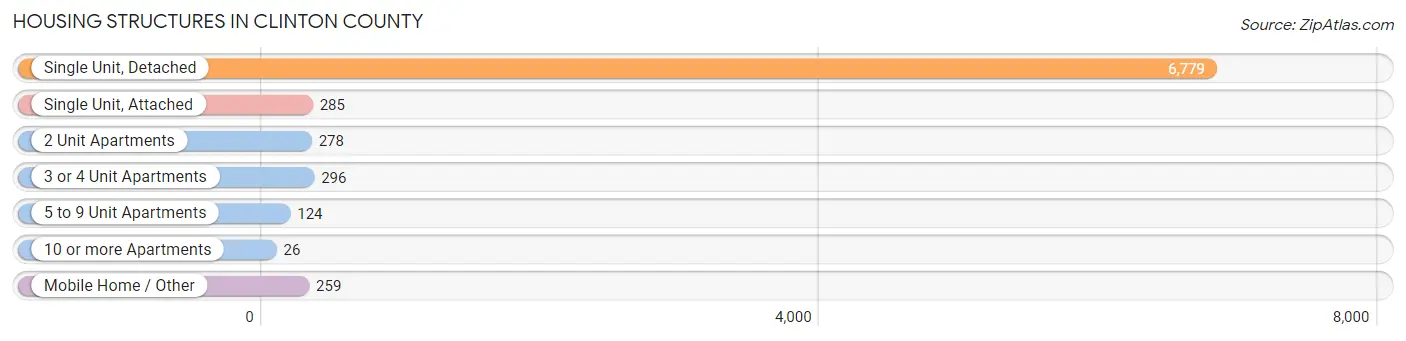
| Structure Type | # Housing Units | % Housing Units |
| Single Unit, Detached | 6,779 | 84.2% |
| Single Unit, Attached | 285 | 3.5% |
| 2 Unit Apartments | 278 | 3.5% |
| 3 or 4 Unit Apartments | 296 | 3.7% |
| 5 to 9 Unit Apartments | 124 | 1.5% |
| 10 or more Apartments | 26 | 0.3% |
| Mobile Home / Other | 259 | 3.2% |
| Total | 8,047 | 100.0% |
Housing Structures by Occupancy in Clinton County
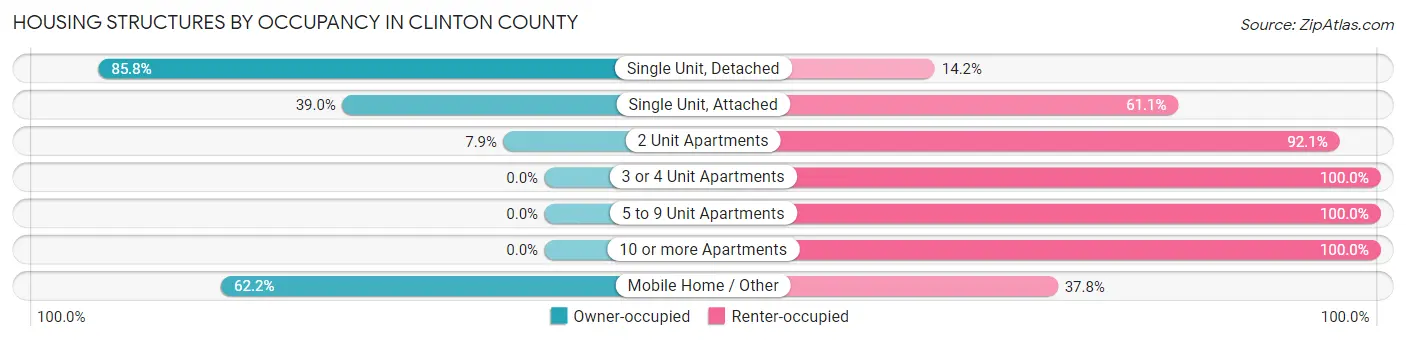
| Structure Type | Owner-occupied | Renter-occupied |
| Single Unit, Detached | 5,817 (85.8%) | 962 (14.2%) |
| Single Unit, Attached | 111 (39.0%) | 174 (61.1%) |
| 2 Unit Apartments | 22 (7.9%) | 256 (92.1%) |
| 3 or 4 Unit Apartments | 0 (0.0%) | 296 (100.0%) |
| 5 to 9 Unit Apartments | 0 (0.0%) | 124 (100.0%) |
| 10 or more Apartments | 0 (0.0%) | 26 (100.0%) |
| Mobile Home / Other | 161 (62.2%) | 98 (37.8%) |
| Total | 6,111 (75.9%) | 1,936 (24.1%) |
Housing Structures by Number of Rooms in Clinton County
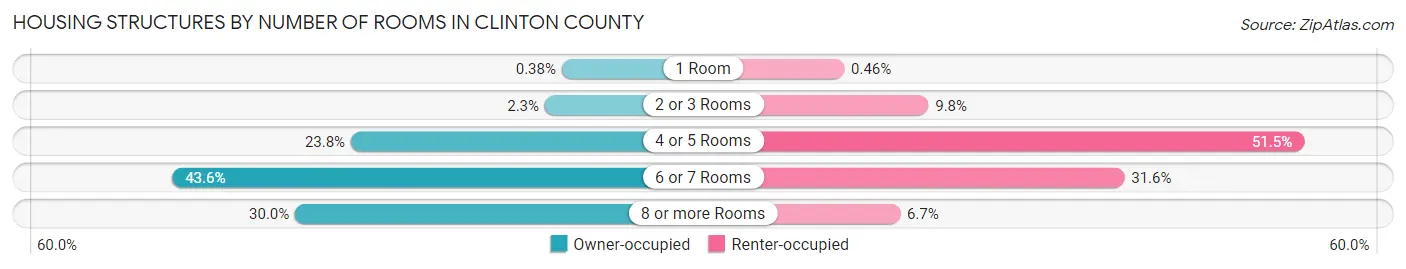
| Number of Rooms | Owner-occupied | Renter-occupied |
| 1 Room | 23 (0.4%) | 9 (0.5%) |
| 2 or 3 Rooms | 138 (2.3%) | 190 (9.8%) |
| 4 or 5 Rooms | 1,453 (23.8%) | 997 (51.5%) |
| 6 or 7 Rooms | 2,665 (43.6%) | 611 (31.6%) |
| 8 or more Rooms | 1,832 (30.0%) | 129 (6.7%) |
| Total | 6,111 (100.0%) | 1,936 (100.0%) |
Housing Structure by Heating Type in Clinton County
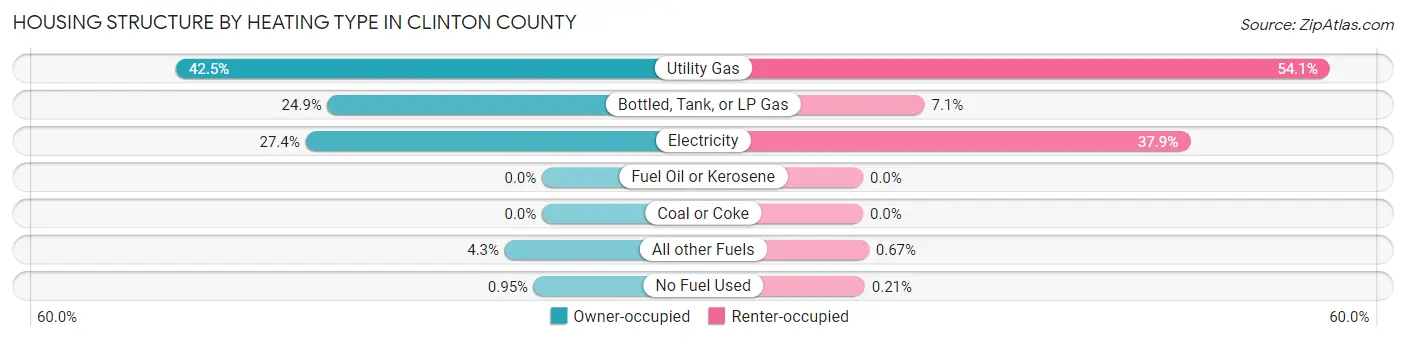
| Heating Type | Owner-occupied | Renter-occupied |
| Utility Gas | 2,594 (42.4%) | 1,047 (54.1%) |
| Bottled, Tank, or LP Gas | 1,519 (24.9%) | 138 (7.1%) |
| Electricity | 1,676 (27.4%) | 734 (37.9%) |
| Fuel Oil or Kerosene | 0 (0.0%) | 0 (0.0%) |
| Coal or Coke | 0 (0.0%) | 0 (0.0%) |
| All other Fuels | 264 (4.3%) | 13 (0.7%) |
| No Fuel Used | 58 (0.9%) | 4 (0.2%) |
| Total | 6,111 (100.0%) | 1,936 (100.0%) |
Household Vehicle Usage in Clinton County
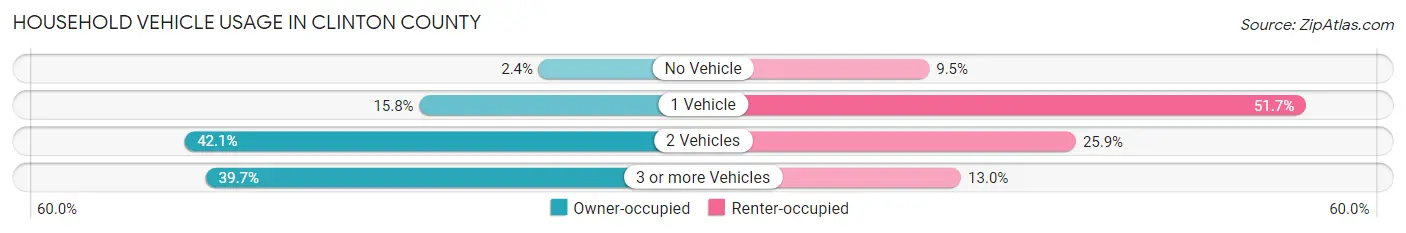
| Vehicles per Household | Owner-occupied | Renter-occupied |
| No Vehicle | 146 (2.4%) | 183 (9.5%) |
| 1 Vehicle | 964 (15.8%) | 1,000 (51.6%) |
| 2 Vehicles | 2,574 (42.1%) | 501 (25.9%) |
| 3 or more Vehicles | 2,427 (39.7%) | 252 (13.0%) |
| Total | 6,111 (100.0%) | 1,936 (100.0%) |
Real Estate & Mortgages in Clinton County
Real Estate and Mortgage Overview in Clinton County
| Characteristic | Without Mortgage | With Mortgage |
| Housing Units | 2,504 | 3,607 |
| Median Property Value | $184,500 | $188,900 |
| Median Household Income | $59,663 | $566 |
| Monthly Housing Costs | $547 | $89 |
| Real Estate Taxes | $1,790 | $79 |
Property Value by Mortgage Status in Clinton County
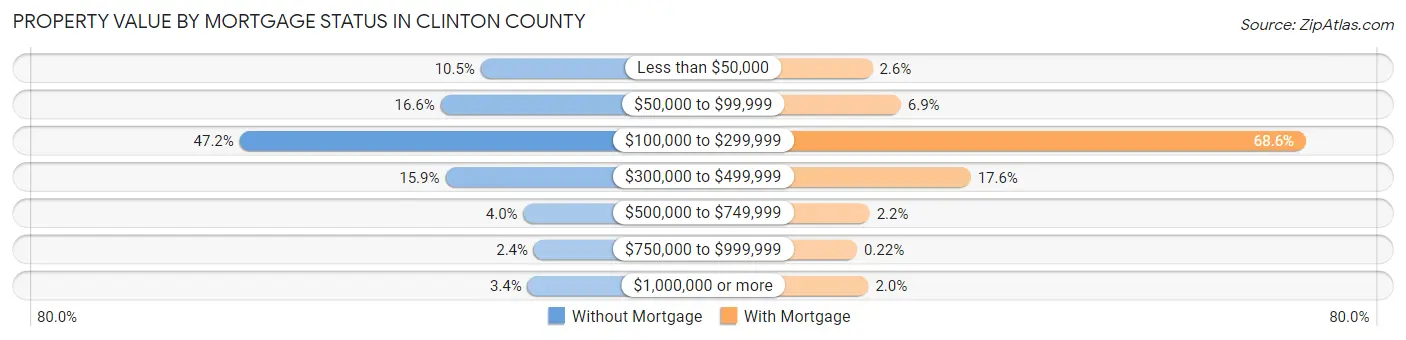
| Property Value | Without Mortgage | With Mortgage |
| Less than $50,000 | 263 (10.5%) | 93 (2.6%) |
| $50,000 to $99,999 | 416 (16.6%) | 249 (6.9%) |
| $100,000 to $299,999 | 1,183 (47.2%) | 2,475 (68.6%) |
| $300,000 to $499,999 | 398 (15.9%) | 633 (17.5%) |
| $500,000 to $749,999 | 100 (4.0%) | 78 (2.2%) |
| $750,000 to $999,999 | 60 (2.4%) | 8 (0.2%) |
| $1,000,000 or more | 84 (3.4%) | 71 (2.0%) |
| Total | 2,504 (100.0%) | 3,607 (100.0%) |
Household Income by Mortgage Status in Clinton County
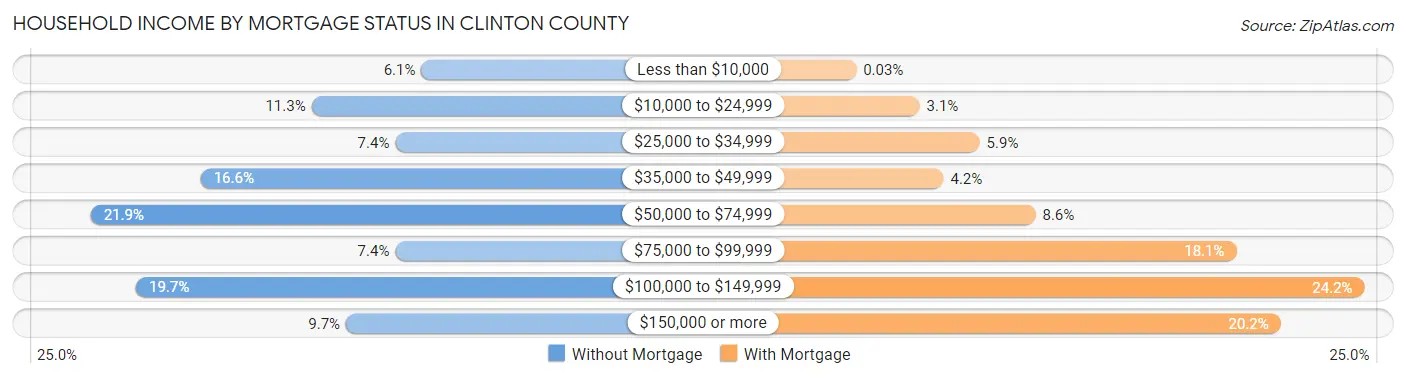
| Household Income | Without Mortgage | With Mortgage |
| Less than $10,000 | 153 (6.1%) | 1 (0.0%) |
| $10,000 to $24,999 | 284 (11.3%) | 110 (3.0%) |
| $25,000 to $34,999 | 184 (7.3%) | 213 (5.9%) |
| $35,000 to $49,999 | 416 (16.6%) | 151 (4.2%) |
| $50,000 to $74,999 | 547 (21.8%) | 309 (8.6%) |
| $75,000 to $99,999 | 184 (7.3%) | 654 (18.1%) |
| $100,000 to $149,999 | 493 (19.7%) | 874 (24.2%) |
| $150,000 or more | 243 (9.7%) | 730 (20.2%) |
| Total | 2,504 (100.0%) | 3,607 (100.0%) |
Property Value to Household Income Ratio in Clinton County
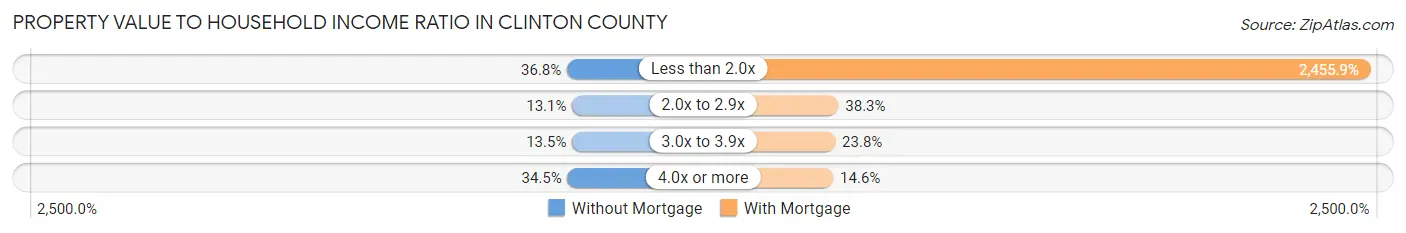
| Value-to-Income Ratio | Without Mortgage | With Mortgage |
| Less than 2.0x | 921 (36.8%) | 88,585 (2,455.9%) |
| 2.0x to 2.9x | 329 (13.1%) | 1,382 (38.3%) |
| 3.0x to 3.9x | 339 (13.5%) | 858 (23.8%) |
| 4.0x or more | 865 (34.5%) | 528 (14.6%) |
| Total | 2,504 (100.0%) | 3,607 (100.0%) |
Real Estate Taxes by Mortgage Status in Clinton County
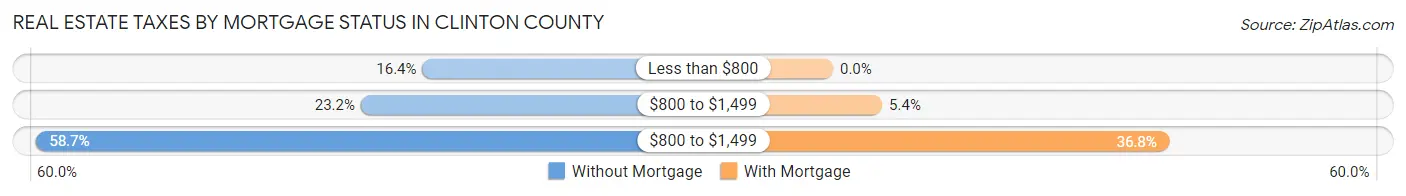
| Property Taxes | Without Mortgage | With Mortgage |
| Less than $800 | 411 (16.4%) | 0 (0.0%) |
| $800 to $1,499 | 580 (23.2%) | 194 (5.4%) |
| $800 to $1,499 | 1,470 (58.7%) | 1,327 (36.8%) |
| Total | 2,504 (100.0%) | 3,607 (100.0%) |
Health & Disability in Clinton County
Health Insurance Coverage by Age in Clinton County
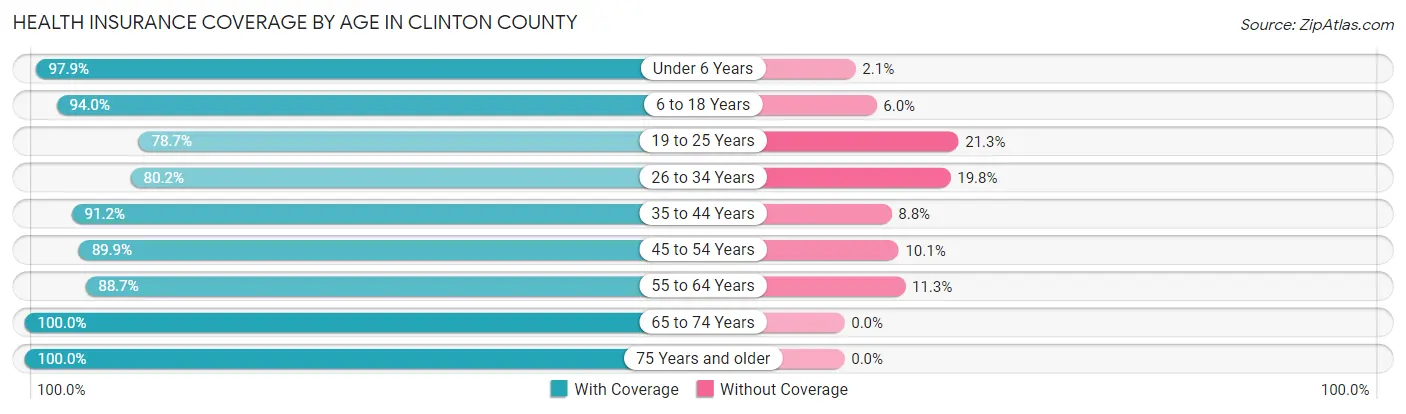
| Age Bracket | With Coverage | Without Coverage |
| Under 6 Years | 1,325 (97.9%) | 28 (2.1%) |
| 6 to 18 Years | 3,571 (94.0%) | 227 (6.0%) |
| 19 to 25 Years | 1,167 (78.7%) | 315 (21.3%) |
| 26 to 34 Years | 1,806 (80.2%) | 445 (19.8%) |
| 35 to 44 Years | 2,295 (91.2%) | 221 (8.8%) |
| 45 to 54 Years | 2,457 (89.9%) | 276 (10.1%) |
| 55 to 64 Years | 2,779 (88.7%) | 355 (11.3%) |
| 65 to 74 Years | 2,003 (100.0%) | 0 (0.0%) |
| 75 Years and older | 1,452 (100.0%) | 0 (0.0%) |
| Total | 18,855 (91.0%) | 1,867 (9.0%) |
Health Insurance Coverage by Citizenship Status in Clinton County
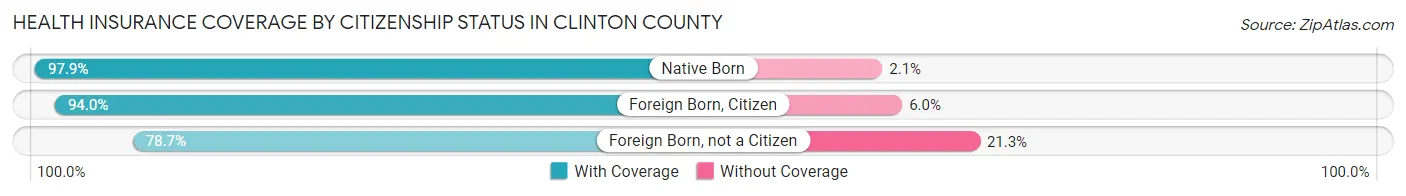
| Citizenship Status | With Coverage | Without Coverage |
| Native Born | 1,325 (97.9%) | 28 (2.1%) |
| Foreign Born, Citizen | 3,571 (94.0%) | 227 (6.0%) |
| Foreign Born, not a Citizen | 1,167 (78.7%) | 315 (21.3%) |
Health Insurance Coverage by Household Income in Clinton County
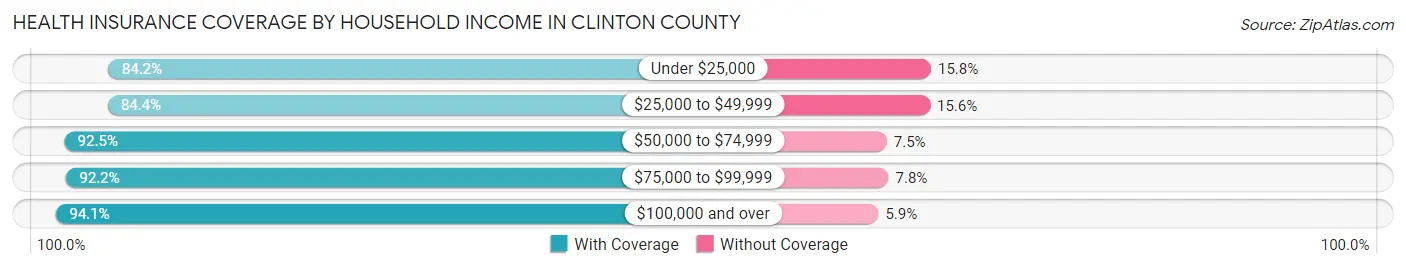
| Household Income | With Coverage | Without Coverage |
| Under $25,000 | 1,611 (84.2%) | 302 (15.8%) |
| $25,000 to $49,999 | 2,729 (84.4%) | 504 (15.6%) |
| $50,000 to $74,999 | 3,985 (92.5%) | 323 (7.5%) |
| $75,000 to $99,999 | 3,329 (92.2%) | 283 (7.8%) |
| $100,000 and over | 7,177 (94.1%) | 453 (5.9%) |
Public vs Private Health Insurance Coverage by Age in Clinton County
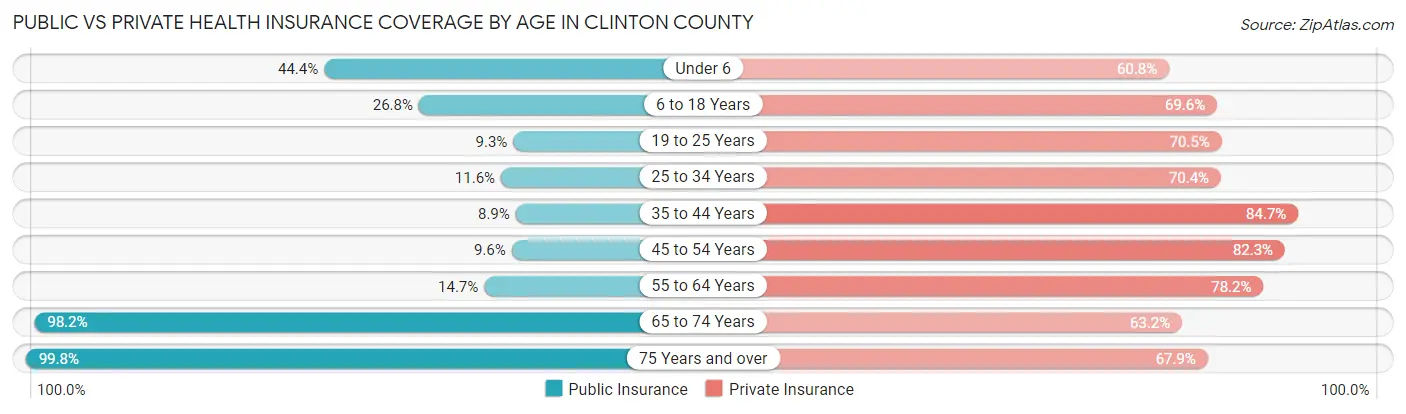
| Age Bracket | Public Insurance | Private Insurance |
| Under 6 | 601 (44.4%) | 822 (60.8%) |
| 6 to 18 Years | 1,019 (26.8%) | 2,645 (69.6%) |
| 19 to 25 Years | 138 (9.3%) | 1,045 (70.5%) |
| 25 to 34 Years | 261 (11.6%) | 1,584 (70.4%) |
| 35 to 44 Years | 223 (8.9%) | 2,131 (84.7%) |
| 45 to 54 Years | 263 (9.6%) | 2,248 (82.3%) |
| 55 to 64 Years | 461 (14.7%) | 2,452 (78.2%) |
| 65 to 74 Years | 1,967 (98.2%) | 1,265 (63.2%) |
| 75 Years and over | 1,449 (99.8%) | 986 (67.9%) |
| Total | 6,382 (30.8%) | 15,178 (73.3%) |
Disability Status by Sex by Age in Clinton County
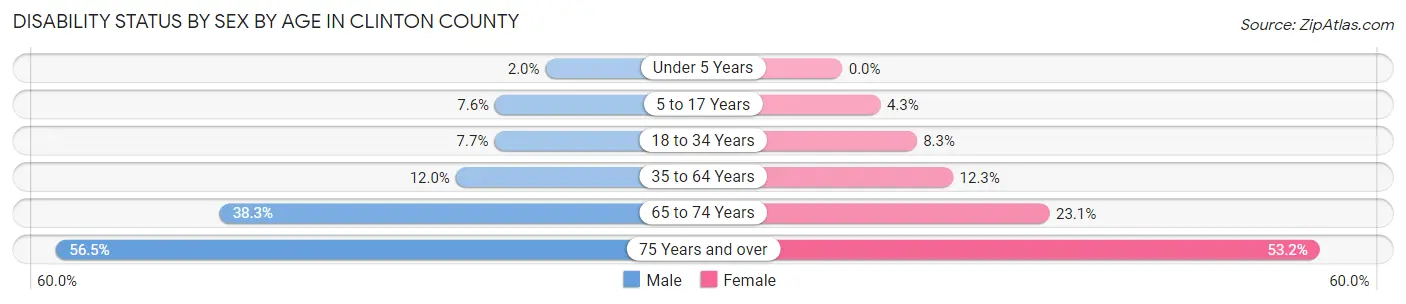
| Age Bracket | Male | Female |
| Under 5 Years | 11 (2.0%) | 0 (0.0%) |
| 5 to 17 Years | 153 (7.6%) | 78 (4.3%) |
| 18 to 34 Years | 151 (7.7%) | 163 (8.3%) |
| 35 to 64 Years | 505 (12.0%) | 515 (12.3%) |
| 65 to 74 Years | 367 (38.3%) | 241 (23.1%) |
| 75 Years and over | 319 (56.5%) | 472 (53.2%) |
Disability Class by Sex by Age in Clinton County
Disability Class: Hearing Difficulty
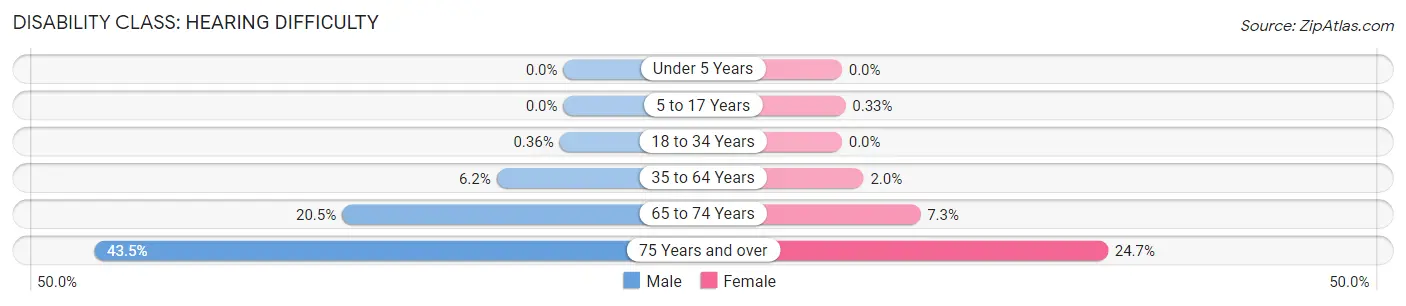
| Age Bracket | Male | Female |
| Under 5 Years | 0 (0.0%) | 0 (0.0%) |
| 5 to 17 Years | 0 (0.0%) | 6 (0.3%) |
| 18 to 34 Years | 7 (0.4%) | 0 (0.0%) |
| 35 to 64 Years | 261 (6.2%) | 84 (2.0%) |
| 65 to 74 Years | 197 (20.5%) | 76 (7.3%) |
| 75 Years and over | 246 (43.5%) | 219 (24.7%) |
Disability Class: Vision Difficulty
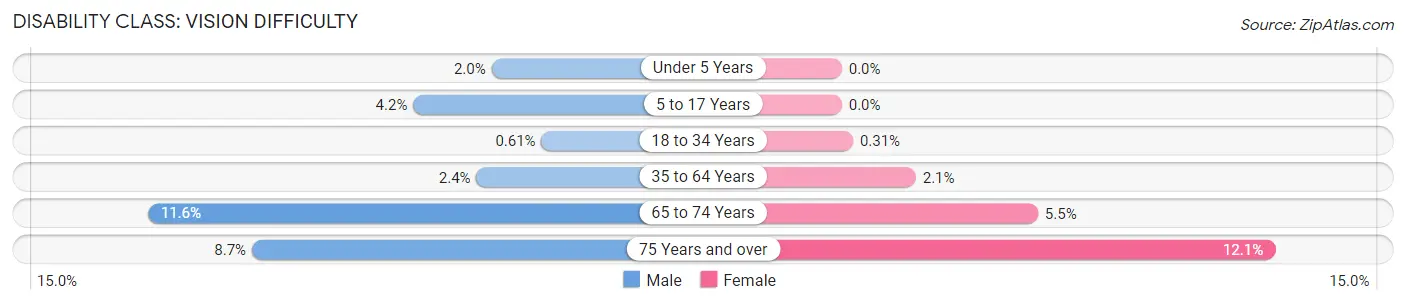
| Age Bracket | Male | Female |
| Under 5 Years | 11 (2.0%) | 0 (0.0%) |
| 5 to 17 Years | 84 (4.2%) | 0 (0.0%) |
| 18 to 34 Years | 12 (0.6%) | 6 (0.3%) |
| 35 to 64 Years | 102 (2.4%) | 86 (2.1%) |
| 65 to 74 Years | 111 (11.6%) | 57 (5.5%) |
| 75 Years and over | 49 (8.7%) | 107 (12.1%) |
Disability Class: Cognitive Difficulty
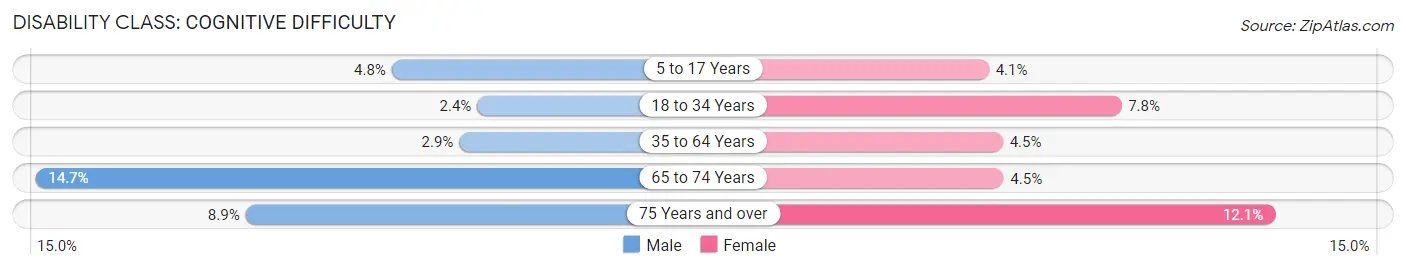
| Age Bracket | Male | Female |
| 5 to 17 Years | 96 (4.8%) | 75 (4.1%) |
| 18 to 34 Years | 47 (2.4%) | 153 (7.8%) |
| 35 to 64 Years | 122 (2.9%) | 187 (4.5%) |
| 65 to 74 Years | 141 (14.7%) | 47 (4.5%) |
| 75 Years and over | 50 (8.8%) | 107 (12.1%) |
Disability Class: Ambulatory Difficulty
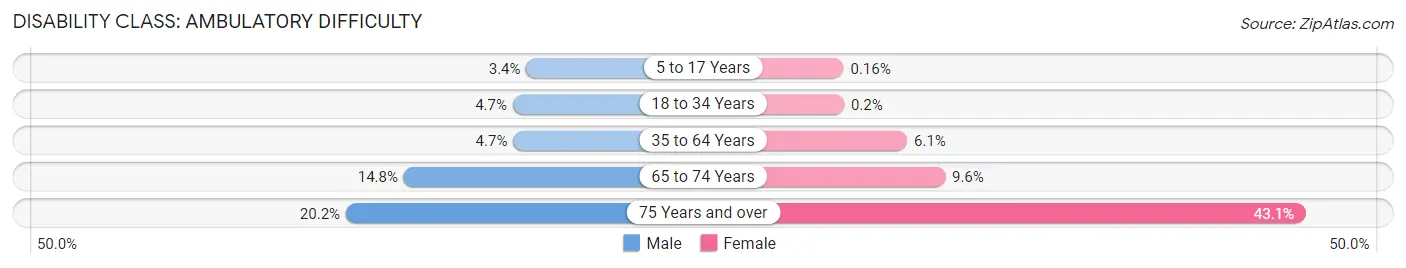
| Age Bracket | Male | Female |
| 5 to 17 Years | 69 (3.4%) | 3 (0.2%) |
| 18 to 34 Years | 92 (4.7%) | 4 (0.2%) |
| 35 to 64 Years | 196 (4.6%) | 253 (6.1%) |
| 65 to 74 Years | 142 (14.8%) | 100 (9.6%) |
| 75 Years and over | 114 (20.2%) | 382 (43.1%) |
Disability Class: Self-Care Difficulty
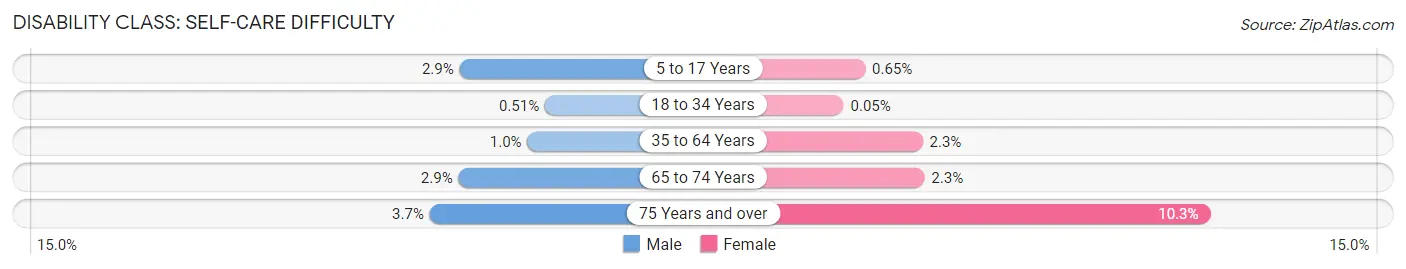
| Age Bracket | Male | Female |
| 5 to 17 Years | 58 (2.9%) | 12 (0.6%) |
| 18 to 34 Years | 10 (0.5%) | 1 (0.1%) |
| 35 to 64 Years | 42 (1.0%) | 94 (2.2%) |
| 65 to 74 Years | 28 (2.9%) | 24 (2.3%) |
| 75 Years and over | 21 (3.7%) | 91 (10.3%) |
Technology Access in Clinton County
Computing Device Access in Clinton County
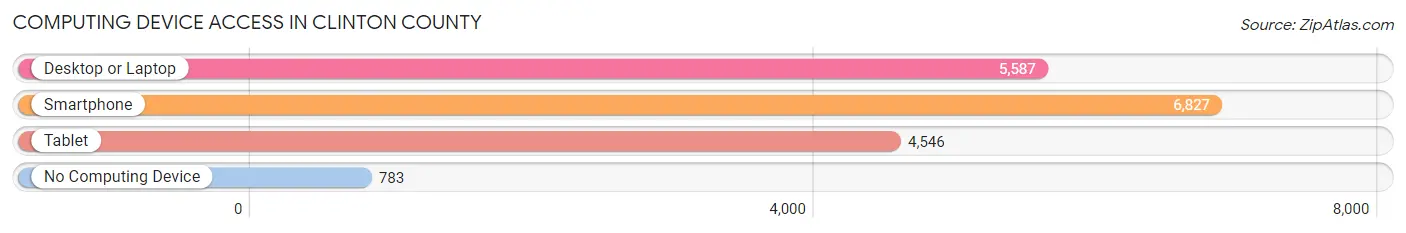
| Device Type | # Households | % Households |
| Desktop or Laptop | 5,587 | 69.4% |
| Smartphone | 6,827 | 84.8% |
| Tablet | 4,546 | 56.5% |
| No Computing Device | 783 | 9.7% |
| Total | 8,047 | 100.0% |
Internet Access in Clinton County
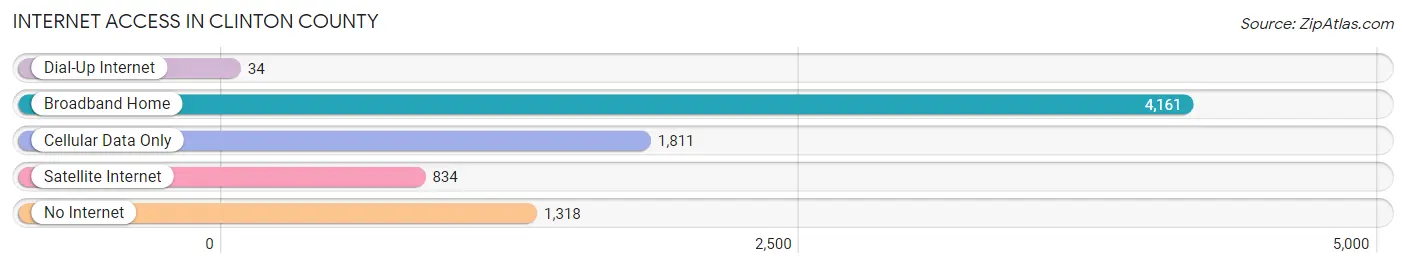
| Internet Type | # Households | % Households |
| Dial-Up Internet | 34 | 0.4% |
| Broadband Home | 4,161 | 51.7% |
| Cellular Data Only | 1,811 | 22.5% |
| Satellite Internet | 834 | 10.4% |
| No Internet | 1,318 | 16.4% |
| Total | 8,047 | 100.0% |
Clinton County Summary
County History
Clinton County, Missouri is located in the northwestern part of the state and is bordered by Caldwell, DeKalb, and Daviess counties to the north, Caldwell and Ray counties to the east, Lafayette and Jackson counties to the south, and Bates and Henry counties to the west. The county was established in 1833 and named after DeWitt Clinton, the seventh governor of New York.
The first settlers in the area were French trappers and traders who arrived in the late 1700s. The first permanent settlers were mostly of English and German descent, and they began arriving in the early 1800s. The county was officially organized in 1833, and the first county seat was located in the town of Plattsburg.
The county experienced rapid growth in the mid-1800s, with the population increasing from 1,000 in 1840 to over 10,000 by 1860. This growth was largely due to the influx of German immigrants, who were attracted to the area by the fertile soil and abundant natural resources.
The county was also home to several Civil War battles, including the Battle of Lexington in 1861 and the Battle of Lone Jack in 1862. The county was also the site of the infamous Sacking of Plattsburg in 1863, when Confederate forces burned the town to the ground.
The county continued to grow after the Civil War, and by the turn of the century, the population had reached nearly 20,000. The county experienced a period of economic prosperity in the early 1900s, with the establishment of several factories and businesses.
The county also experienced a period of population growth in the mid-1900s, with the population reaching over 30,000 by 1970. The county has experienced a slight decline in population since then, but it remains a vibrant and diverse community.
Geography
Clinton County is located in the northwestern part of Missouri and covers an area of 576 square miles. The county is mostly flat, with some rolling hills in the northern and western parts of the county. The county is drained by the Grand River, which flows through the center of the county.
The county is home to several state parks and wildlife areas, including the Clinton State Park, the Smithville Lake State Park, and the Truman Lake Wildlife Area. The county also contains several small towns and villages, including Plattsburg, Lathrop, and Trimble.
Economy
Clinton County has a diverse economy, with a mix of agriculture, manufacturing, and services. The county is home to several large employers, including the Clinton County Regional Medical Center, the Clinton County Courthouse, and the Clinton County Sheriff’s Office.
Agriculture is a major part of the county’s economy, with the county’s farms producing corn, soybeans, wheat, hay, and other crops. The county is also home to several large livestock operations, including cattle, hogs, and poultry.
Manufacturing is also an important part of the county’s economy, with several factories producing a variety of products, including furniture, clothing, and automotive parts. The county is also home to several service-based businesses, including restaurants, hotels, and retail stores.
Demographics
As of the 2010 census, the population of Clinton County was 33,224, with a population density of 57.7 people per square mile. The median household income was $45,845, and the median family income was $54,845.
The population of Clinton County is mostly white (94.2%), with small percentages of African Americans (2.3%), Hispanics (1.7%), and Asians (0.7%). The largest age group is 45-64 (27.2%), followed by 25-44 (25.2%), 65+ (17.2%), and 18-24 (14.2%).
The county is home to several colleges and universities, including the University of Central Missouri, Missouri Western State University, and William Jewell College. The county is also home to several museums, including the Clinton County Historical Museum and the Clinton County Arts Council.
Conclusion
Clinton County, Missouri is a vibrant and diverse community located in the northwestern part of the state. The county has a long and rich history, and it is home to several large employers, including the Clinton County Regional Medical Center and the Clinton County Courthouse. The county is also home to several state parks and wildlife areas, and it has a diverse economy, with a mix of agriculture, manufacturing, and services. The population of the county is mostly white, with small percentages of African Americans, Hispanics, and Asians. The county is also home to several colleges and universities, as well as several museums.
Common Questions
What is Per Capita Income in Clinton County?
Per Capita income in Clinton County is $31,924.
What is the Median Family Income in Clinton County?
Median Family Income in Clinton County is $87,733.
What is the Median Household income in Clinton County?
Median Household Income in Clinton County is $66,494.
What is Income or Wage Gap in Clinton County?
Income or Wage Gap in Clinton County is 35.3%.
Women in Clinton County earn 64.7 cents for every dollar earned by a man.
What is Family Income Deficit in Clinton County?
Family Income Deficit in Clinton County is $10,021.
Families that are below poverty line in Clinton County earn $10,021 less on average than the poverty threshold level.
What is Inequality or Gini Index in Clinton County?
Inequality or Gini Index in Clinton County is 0.41.
What is the Total Population of Clinton County?
Total Population of Clinton County is 21,155.
What is the Total Male Population of Clinton County?
Total Male Population of Clinton County is 10,619.
What is the Total Female Population of Clinton County?
Total Female Population of Clinton County is 10,536.
What is the Ratio of Males per 100 Females in Clinton County?
There are 100.79 Males per 100 Females in Clinton County.
What is the Ratio of Females per 100 Males in Clinton County?
There are 99.22 Females per 100 Males in Clinton County.
What is the Median Population Age in Clinton County?
Median Population Age in Clinton County is 40.9 Years.
What is the Average Family Size in Clinton County
Average Family Size in Clinton County is 3.2 People.
What is the Average Household Size in Clinton County
Average Household Size in Clinton County is 2.6 People.
How Large is the Labor Force in Clinton County?
There are 10,177 People in the Labor Forcein in Clinton County.
What is the Percentage of People in the Labor Force in Clinton County?
60.0% of People are in the Labor Force in Clinton County.
What is the Unemployment Rate in Clinton County?
Unemployment Rate in Clinton County is 6.1%.