Clay County, MO Map & Demographics
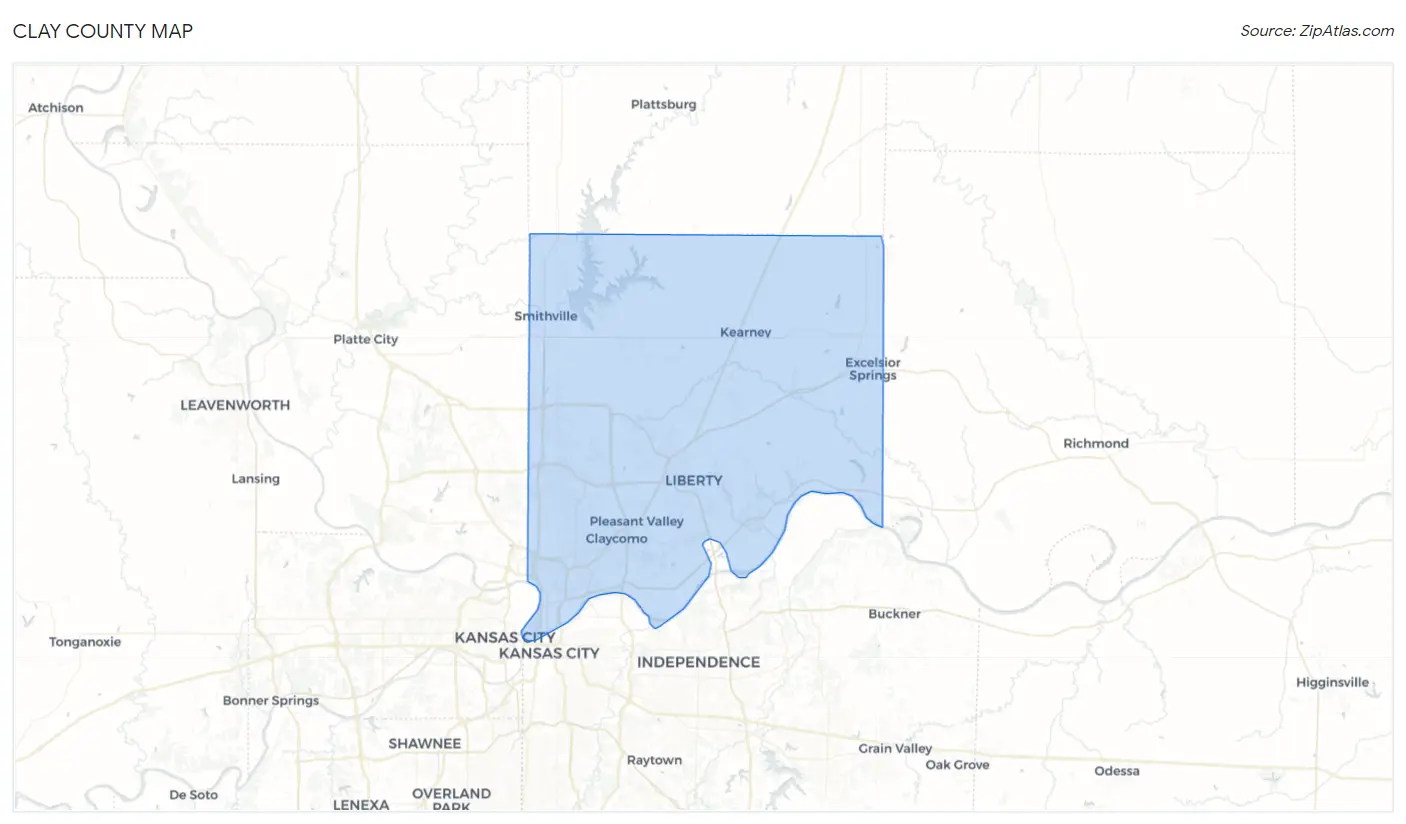
Clay County Map
Clay County Overview
$40,278
PER CAPITA INCOME
$98,881
AVG FAMILY INCOME
$82,264
AVG HOUSEHOLD INCOME
26.8%
WAGE / INCOME GAP [ % ]
73.2¢/ $1
WAGE / INCOME GAP [ $ ]
$11,025
FAMILY INCOME DEFICIT
0.41
INEQUALITY / GINI INDEX
253,085
TOTAL POPULATION
125,225
MALE POPULATION
127,860
FEMALE POPULATION
97.94
MALES / 100 FEMALES
102.10
FEMALES / 100 MALES
37.5
MEDIAN AGE
3.1
AVG FAMILY SIZE
2.5
AVG HOUSEHOLD SIZE
139,692
LABOR FORCE [ PEOPLE ]
69.8%
PERCENT IN LABOR FORCE
4.0%
UNEMPLOYMENT RATE
Clay County Area Codes
Income in Clay County
Income Overview in Clay County
Per Capita Income in Clay County is $40,278, while median incomes of families and households are $98,881 and $82,264 respectively.
| Characteristic | Number | Measure |
| Per Capita Income | 253,085 | $40,278 |
| Median Family Income | 66,168 | $98,881 |
| Mean Family Income | 66,168 | $117,635 |
| Median Household Income | 99,501 | $82,264 |
| Mean Household Income | 99,501 | $100,619 |
| Income Deficit | 66,168 | $11,025 |
| Wage / Income Gap (%) | 253,085 | 26.79% |
| Wage / Income Gap ($) | 253,085 | 73.21¢ per $1 |
| Gini / Inequality Index | 253,085 | 0.41 |
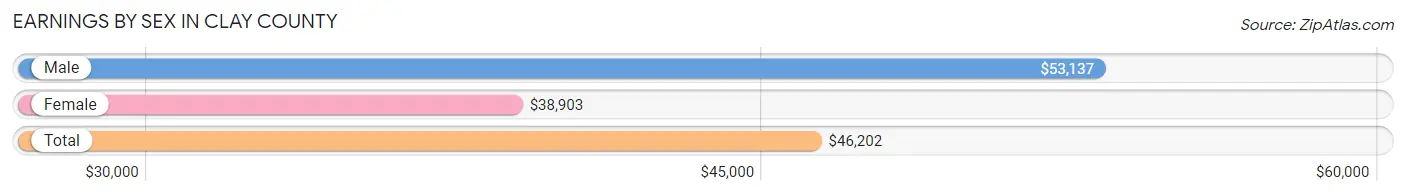
Earnings by Sex in Clay County
Average Earnings in Clay County are $46,202, $53,137 for men and $38,903 for women, a difference of 26.8%.
| Sex | Number | Average Earnings |
| Male | 76,422 (52.7%) | $53,137 |
| Female | 68,705 (47.3%) | $38,903 |
| Total | 145,127 (100.0%) | $46,202 |
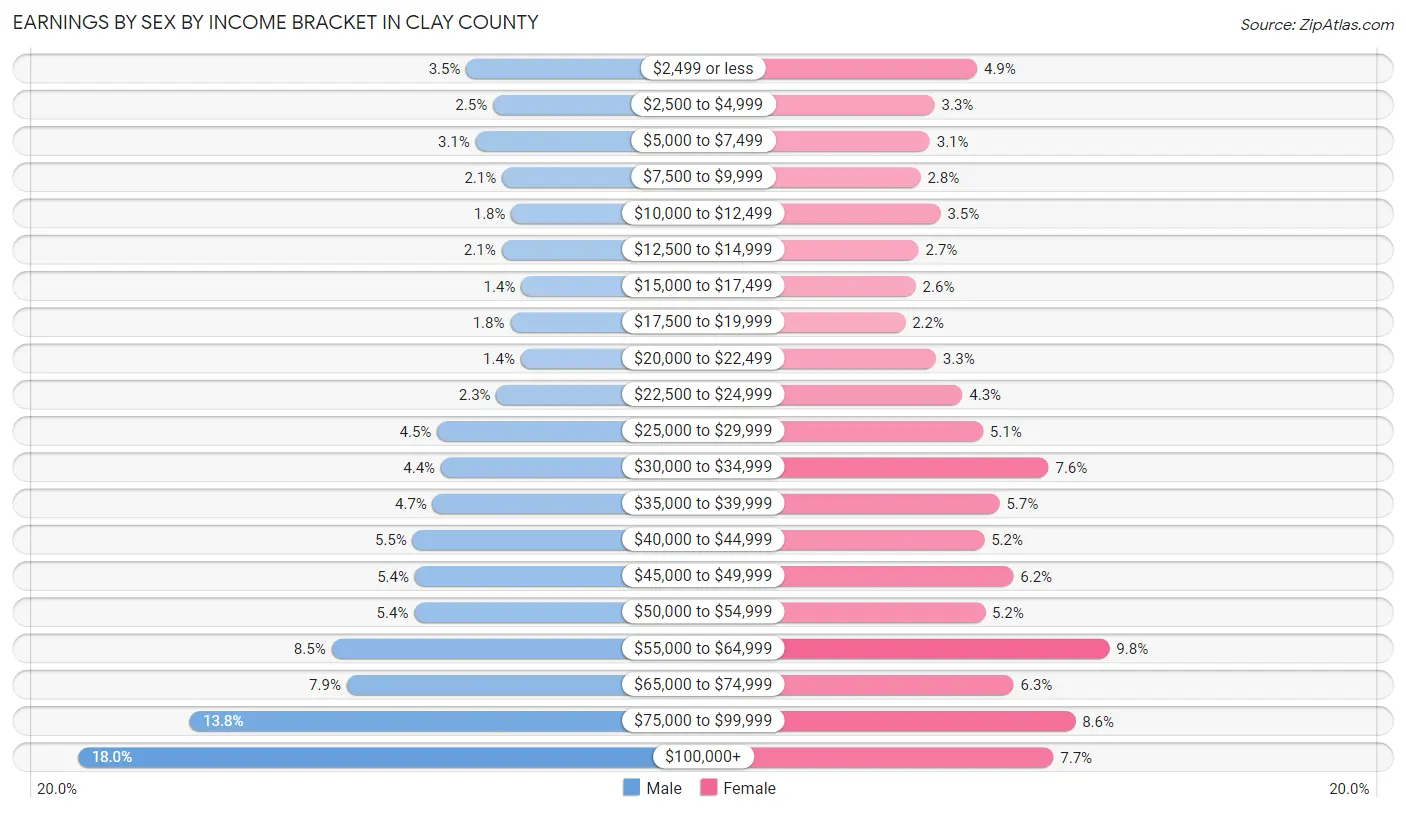
Earnings by Sex by Income Bracket in Clay County
The most common earnings brackets in Clay County are $100,000+ for men (13,730 | 18.0%) and $55,000 to $64,999 for women (6,760 | 9.8%).
| Income | Male | Female |
| $2,499 or less | 2,640 (3.5%) | 3,350 (4.9%) |
| $2,500 to $4,999 | 1,872 (2.5%) | 2,257 (3.3%) |
| $5,000 to $7,499 | 2,369 (3.1%) | 2,135 (3.1%) |
| $7,500 to $9,999 | 1,610 (2.1%) | 1,896 (2.8%) |
| $10,000 to $12,499 | 1,344 (1.8%) | 2,413 (3.5%) |
| $12,500 to $14,999 | 1,631 (2.1%) | 1,845 (2.7%) |
| $15,000 to $17,499 | 1,064 (1.4%) | 1,770 (2.6%) |
| $17,500 to $19,999 | 1,372 (1.8%) | 1,506 (2.2%) |
| $20,000 to $22,499 | 1,075 (1.4%) | 2,297 (3.3%) |
| $22,500 to $24,999 | 1,773 (2.3%) | 2,973 (4.3%) |
| $25,000 to $29,999 | 3,469 (4.5%) | 3,502 (5.1%) |
| $30,000 to $34,999 | 3,364 (4.4%) | 5,197 (7.6%) |
| $35,000 to $39,999 | 3,597 (4.7%) | 3,931 (5.7%) |
| $40,000 to $44,999 | 4,173 (5.5%) | 3,535 (5.1%) |
| $45,000 to $49,999 | 4,112 (5.4%) | 4,289 (6.2%) |
| $50,000 to $54,999 | 4,126 (5.4%) | 3,561 (5.2%) |
| $55,000 to $64,999 | 6,493 (8.5%) | 6,760 (9.8%) |
| $65,000 to $74,999 | 6,059 (7.9%) | 4,291 (6.2%) |
| $75,000 to $99,999 | 10,549 (13.8%) | 5,882 (8.6%) |
| $100,000+ | 13,730 (18.0%) | 5,315 (7.7%) |
| Total | 76,422 (100.0%) | 68,705 (100.0%) |
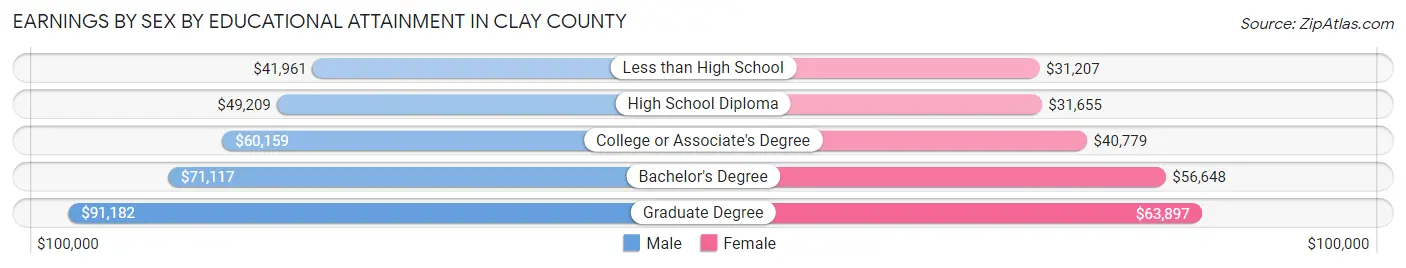
Earnings by Sex by Educational Attainment in Clay County
Average earnings in Clay County are $59,864 for men and $45,337 for women, a difference of 24.3%. Men with an educational attainment of graduate degree enjoy the highest average annual earnings of $91,182, while those with less than high school education earn the least with $41,961. Women with an educational attainment of graduate degree earn the most with the average annual earnings of $63,897, while those with less than high school education have the smallest earnings of $31,207.
| Educational Attainment | Male Income | Female Income |
| Less than High School | $41,961 | $31,207 |
| High School Diploma | $49,209 | $31,655 |
| College or Associate's Degree | $60,159 | $40,779 |
| Bachelor's Degree | $71,117 | $56,648 |
| Graduate Degree | $91,182 | $63,897 |
| Total | $59,864 | $45,337 |
Family Income in Clay County
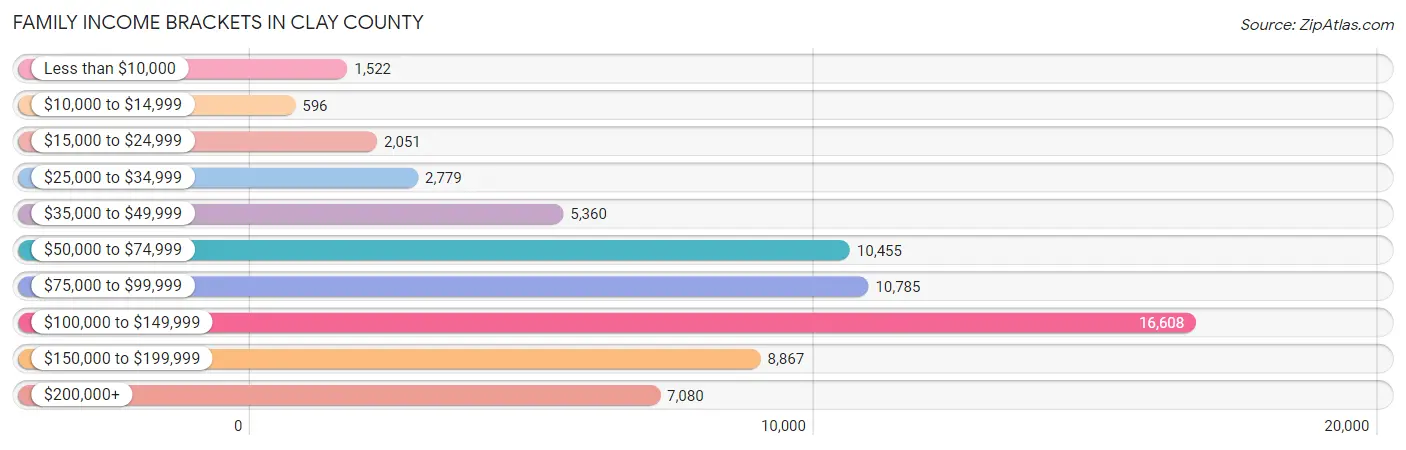
Family Income Brackets in Clay County
According to the Clay County family income data, there are 16,608 families falling into the $100,000 to $149,999 income range, which is the most common income bracket and makes up 25.1% of all families. Conversely, the $10,000 to $14,999 income bracket is the least frequent group with only 596 families (0.9%) belonging to this category.
| Income Bracket | # Families | % Families |
| Less than $10,000 | 1,522 | 2.3% |
| $10,000 to $14,999 | 596 | 0.9% |
| $15,000 to $24,999 | 2,051 | 3.1% |
| $25,000 to $34,999 | 2,779 | 4.2% |
| $35,000 to $49,999 | 5,360 | 8.1% |
| $50,000 to $74,999 | 10,455 | 15.8% |
| $75,000 to $99,999 | 10,785 | 16.3% |
| $100,000 to $149,999 | 16,608 | 25.1% |
| $150,000 to $199,999 | 8,867 | 13.4% |
| $200,000+ | 7,080 | 10.7% |
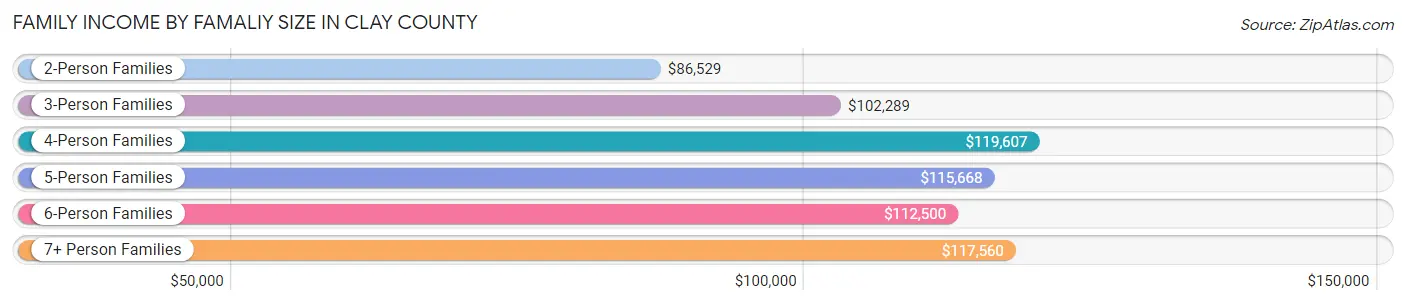
Family Income by Famaliy Size in Clay County
4-person families (12,518 | 18.9%) account for the highest median family income in Clay County with $119,607 per family, while 2-person families (30,575 | 46.2%) have the highest median income of $43,264 per family member.
| Income Bracket | # Families | Median Income |
| 2-Person Families | 30,575 (46.2%) | $86,529 |
| 3-Person Families | 14,140 (21.4%) | $102,289 |
| 4-Person Families | 12,518 (18.9%) | $119,607 |
| 5-Person Families | 5,657 (8.6%) | $115,668 |
| 6-Person Families | 2,198 (3.3%) | $112,500 |
| 7+ Person Families | 1,080 (1.6%) | $117,560 |
| Total | 66,168 (100.0%) | $98,881 |
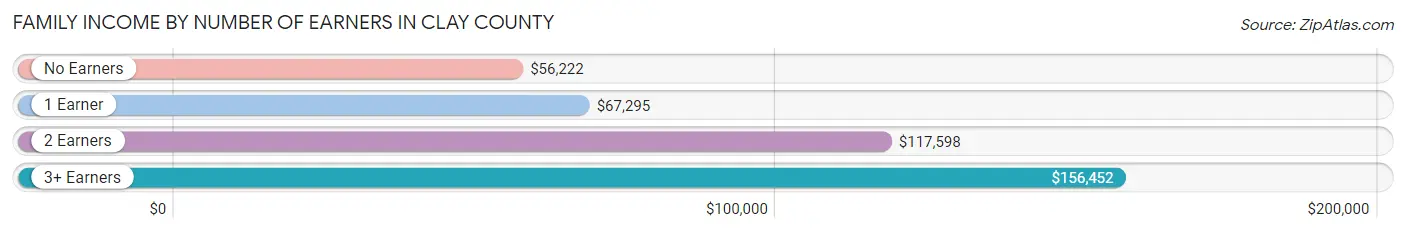
Family Income by Number of Earners in Clay County
The median family income in Clay County is $98,881, with families comprising 3+ earners (8,256) having the highest median family income of $156,452, while families with no earners (7,534) have the lowest median family income of $56,222, accounting for 12.5% and 11.4% of families, respectively.
| Number of Earners | # Families | Median Income |
| No Earners | 7,534 (11.4%) | $56,222 |
| 1 Earner | 20,594 (31.1%) | $67,295 |
| 2 Earners | 29,784 (45.0%) | $117,598 |
| 3+ Earners | 8,256 (12.5%) | $156,452 |
| Total | 66,168 (100.0%) | $98,881 |
Household Income in Clay County
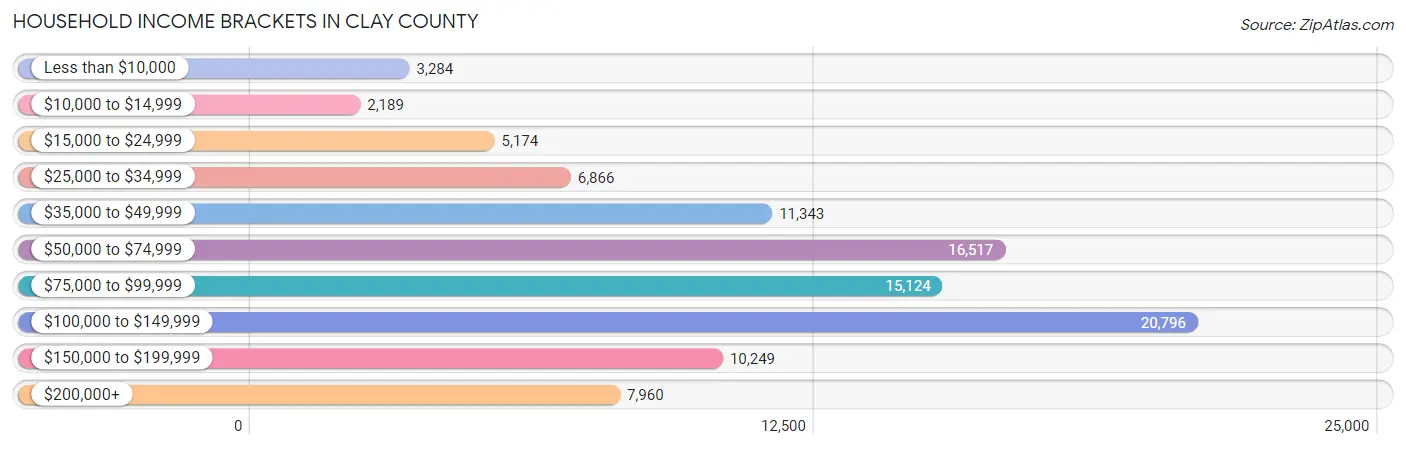
Household Income Brackets in Clay County
With 20,796 households falling in the category, the $100,000 to $149,999 income range is the most frequent in Clay County, accounting for 20.9% of all households. In contrast, only 2,189 households (2.2%) fall into the $10,000 to $14,999 income bracket, making it the least populous group.
| Income Bracket | # Households | % Households |
| Less than $10,000 | 3,284 | 3.3% |
| $10,000 to $14,999 | 2,189 | 2.2% |
| $15,000 to $24,999 | 5,174 | 5.2% |
| $25,000 to $34,999 | 6,866 | 6.9% |
| $35,000 to $49,999 | 11,343 | 11.4% |
| $50,000 to $74,999 | 16,517 | 16.6% |
| $75,000 to $99,999 | 15,124 | 15.2% |
| $100,000 to $149,999 | 20,796 | 20.9% |
| $150,000 to $199,999 | 10,249 | 10.3% |
| $200,000+ | 7,960 | 8.0% |
Household Income by Householder Age in Clay County
The median household income in Clay County is $82,264, with the highest median household income of $97,213 found in the 45 to 64 years age bracket for the primary householder. A total of 36,633 households (36.8%) fall into this category. Meanwhile, the 15 to 24 years age bracket for the primary householder has the lowest median household income of $42,633, with 3,785 households (3.8%) in this group.
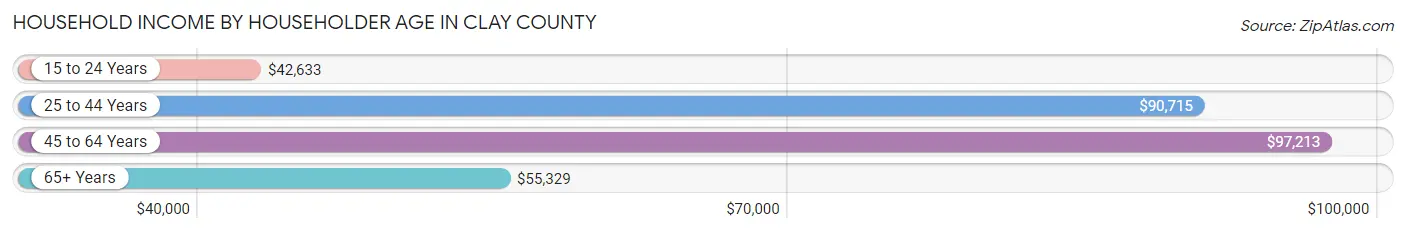
| Income Bracket | # Households | Median Income |
| 15 to 24 Years | 3,785 (3.8%) | $42,633 |
| 25 to 44 Years | 35,993 (36.2%) | $90,715 |
| 45 to 64 Years | 36,633 (36.8%) | $97,213 |
| 65+ Years | 23,090 (23.2%) | $55,329 |
| Total | 99,501 (100.0%) | $82,264 |
Poverty in Clay County
Income Below Poverty by Sex and Age in Clay County
With 7.7% poverty level for males and 8.8% for females among the residents of Clay County, 5 year old males and 18 to 24 year old females are the most vulnerable to poverty, with 435 males (23.2%) and 1,469 females (15.2%) in their respective age groups living below the poverty level.
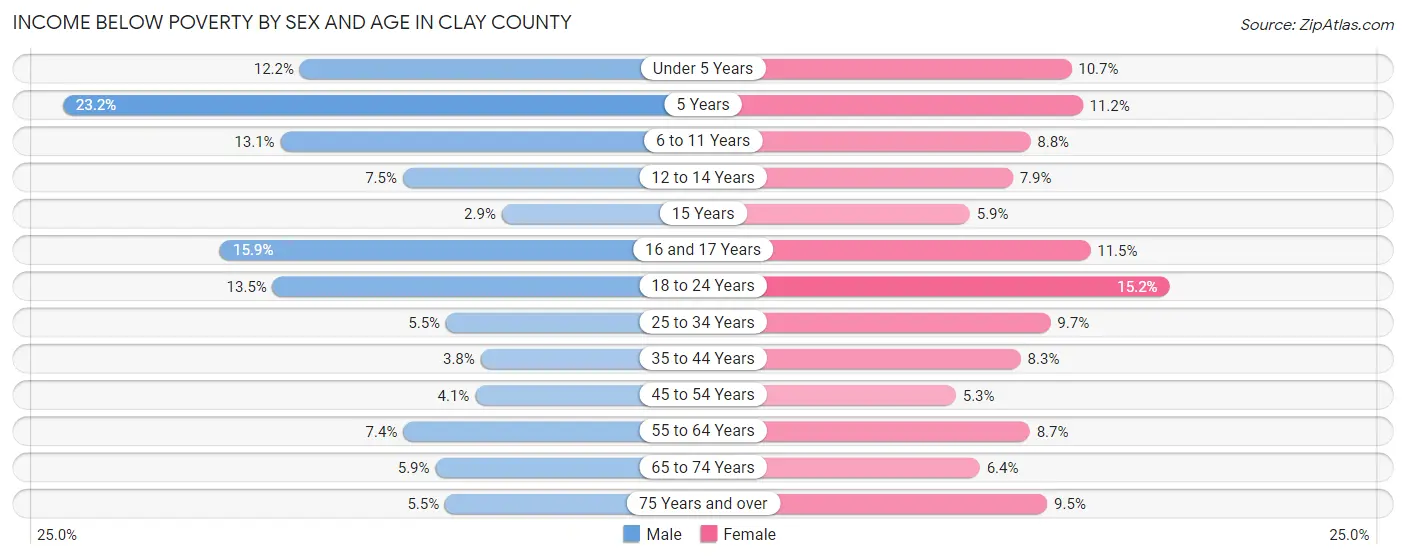
| Age Bracket | Male | Female |
| Under 5 Years | 961 (12.2%) | 791 (10.6%) |
| 5 Years | 435 (23.2%) | 113 (11.2%) |
| 6 to 11 Years | 1,300 (13.1%) | 878 (8.7%) |
| 12 to 14 Years | 406 (7.4%) | 432 (7.9%) |
| 15 Years | 44 (2.9%) | 105 (5.9%) |
| 16 and 17 Years | 612 (15.9%) | 385 (11.5%) |
| 18 to 24 Years | 1,364 (13.5%) | 1,469 (15.2%) |
| 25 to 34 Years | 984 (5.4%) | 1,757 (9.7%) |
| 35 to 44 Years | 688 (3.8%) | 1,469 (8.3%) |
| 45 to 54 Years | 664 (4.1%) | 849 (5.3%) |
| 55 to 64 Years | 1,120 (7.4%) | 1,371 (8.7%) |
| 65 to 74 Years | 610 (5.9%) | 757 (6.4%) |
| 75 Years and over | 325 (5.5%) | 792 (9.5%) |
| Total | 9,513 (7.7%) | 11,168 (8.8%) |
Income Above Poverty by Sex and Age in Clay County
According to the poverty statistics in Clay County, males aged 15 years and females aged 45 to 54 years are the age groups that are most secure financially, with 97.1% of males and 94.7% of females in these age groups living above the poverty line.
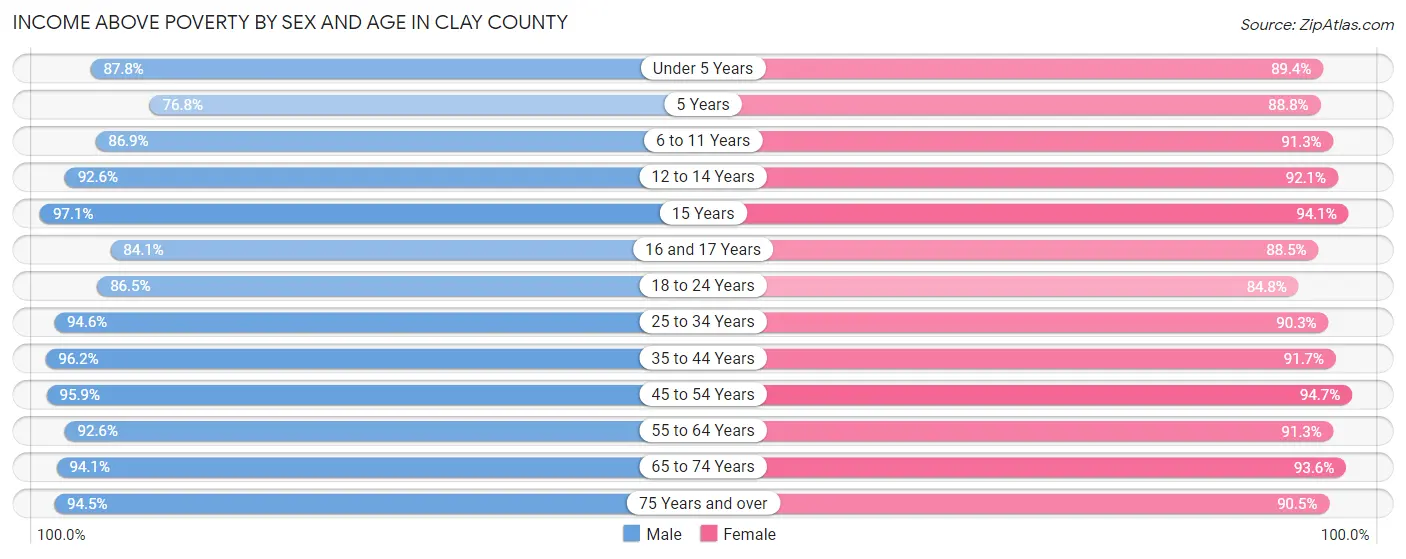
| Age Bracket | Male | Female |
| Under 5 Years | 6,895 (87.8%) | 6,635 (89.3%) |
| 5 Years | 1,438 (76.8%) | 899 (88.8%) |
| 6 to 11 Years | 8,601 (86.9%) | 9,151 (91.2%) |
| 12 to 14 Years | 5,047 (92.5%) | 5,016 (92.1%) |
| 15 Years | 1,493 (97.1%) | 1,664 (94.1%) |
| 16 and 17 Years | 3,231 (84.1%) | 2,954 (88.5%) |
| 18 to 24 Years | 8,744 (86.5%) | 8,197 (84.8%) |
| 25 to 34 Years | 17,056 (94.6%) | 16,390 (90.3%) |
| 35 to 44 Years | 17,226 (96.2%) | 16,237 (91.7%) |
| 45 to 54 Years | 15,576 (95.9%) | 15,208 (94.7%) |
| 55 to 64 Years | 13,964 (92.6%) | 14,348 (91.3%) |
| 65 to 74 Years | 9,663 (94.1%) | 11,068 (93.6%) |
| 75 Years and over | 5,595 (94.5%) | 7,515 (90.5%) |
| Total | 114,529 (92.3%) | 115,282 (91.2%) |
Income Below Poverty Among Married-Couple Families in Clay County
The poverty statistics for married-couple families in Clay County show that 2.9% or 1,459 of the total 49,607 families live below the poverty line. Families with 5 or more children have the highest poverty rate of 17.8%, comprising of 133 families. On the other hand, families with no children have the lowest poverty rate of 2.3%, which includes 612 families.
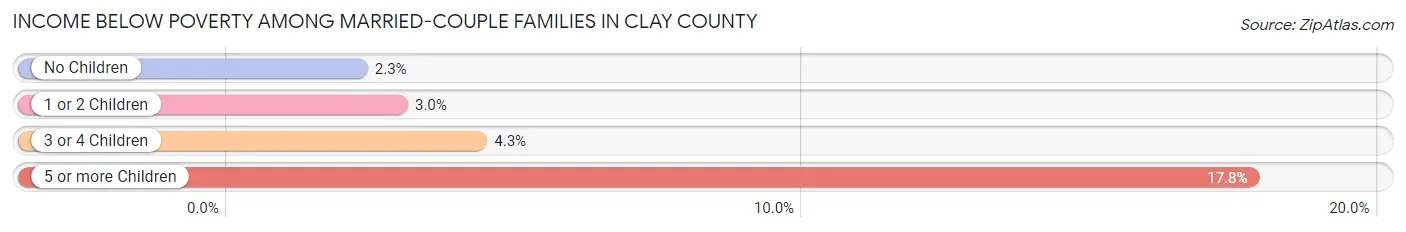
| Children | Above Poverty | Below Poverty |
| No Children | 26,446 (97.7%) | 612 (2.3%) |
| 1 or 2 Children | 16,299 (97.0%) | 497 (3.0%) |
| 3 or 4 Children | 4,788 (95.7%) | 217 (4.3%) |
| 5 or more Children | 615 (82.2%) | 133 (17.8%) |
| Total | 48,148 (97.1%) | 1,459 (2.9%) |
Income Below Poverty Among Single-Parent Households in Clay County
According to the poverty data in Clay County, 4.6% or 237 single-father households and 17.2% or 1,966 single-mother households are living below the poverty line. Among single-father households, those with 5 or more children have the highest poverty rate, with 3 households (100.0%) experiencing poverty. Likewise, among single-mother households, those with 5 or more children have the highest poverty rate, with 130 households (94.2%) falling below the poverty line.
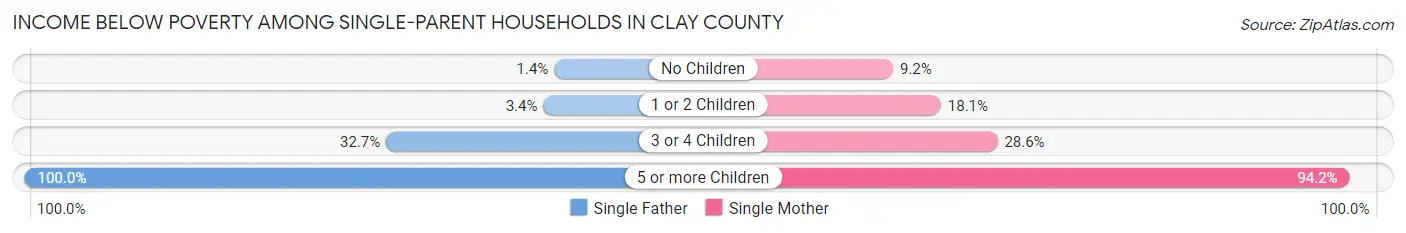
| Children | Single Father | Single Mother |
| No Children | 29 (1.4%) | 353 (9.2%) |
| 1 or 2 Children | 90 (3.4%) | 1,109 (18.1%) |
| 3 or 4 Children | 115 (32.7%) | 374 (28.6%) |
| 5 or more Children | 3 (100.0%) | 130 (94.2%) |
| Total | 237 (4.6%) | 1,966 (17.2%) |
Income Below Poverty Among Married-Couple vs Single-Parent Households in Clay County
The poverty data for Clay County shows that 1,459 of the married-couple family households (2.9%) and 2,203 of the single-parent households (13.3%) are living below the poverty level. Within the married-couple family households, those with 5 or more children have the highest poverty rate, with 133 households (17.8%) falling below the poverty line. Among the single-parent households, those with 5 or more children have the highest poverty rate, with 133 household (94.3%) living below poverty.
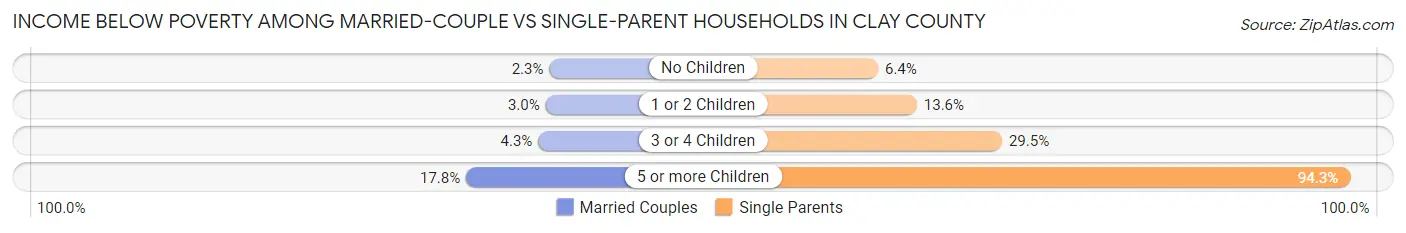
| Children | Married-Couple Families | Single-Parent Households |
| No Children | 612 (2.3%) | 382 (6.4%) |
| 1 or 2 Children | 497 (3.0%) | 1,199 (13.6%) |
| 3 or 4 Children | 217 (4.3%) | 489 (29.5%) |
| 5 or more Children | 133 (17.8%) | 133 (94.3%) |
| Total | 1,459 (2.9%) | 2,203 (13.3%) |
Race in Clay County
The most populous races in Clay County are White / Caucasian (206,069 | 81.4%), Hispanic or Latino (18,613 | 7.3%), and Two or more Races (16,960 | 6.7%).
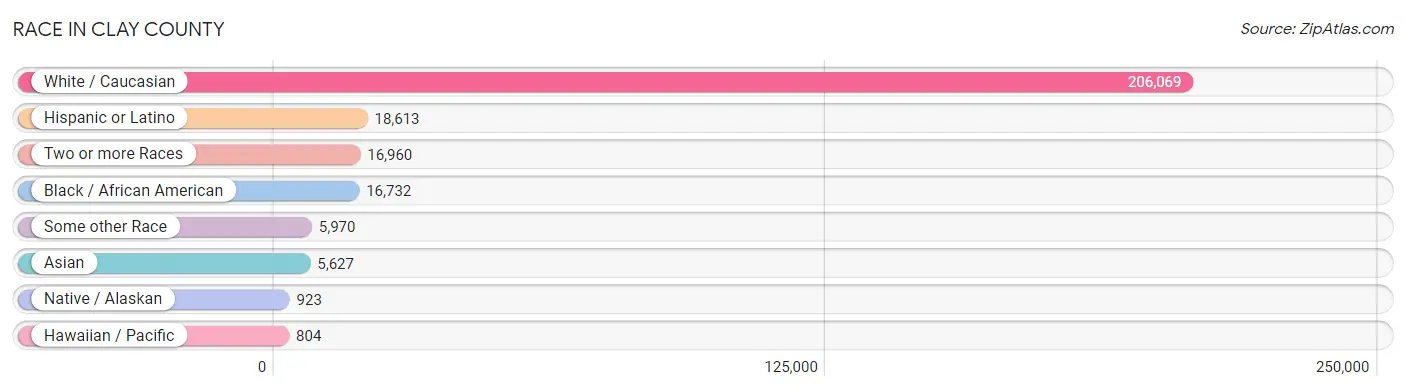
| Race | # Population | % Population |
| Asian | 5,627 | 2.2% |
| Black / African American | 16,732 | 6.6% |
| Hawaiian / Pacific | 804 | 0.3% |
| Hispanic or Latino | 18,613 | 7.3% |
| Native / Alaskan | 923 | 0.4% |
| White / Caucasian | 206,069 | 81.4% |
| Two or more Races | 16,960 | 6.7% |
| Some other Race | 5,970 | 2.4% |
| Total | 253,085 | 100.0% |
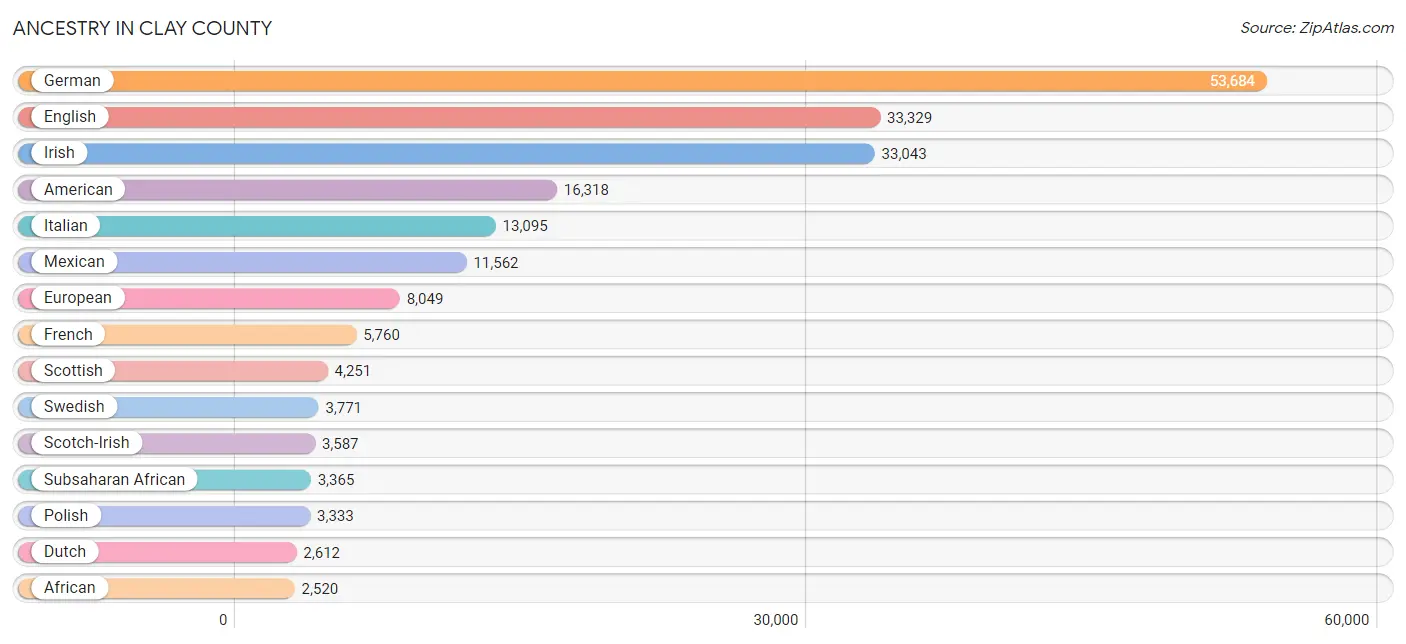
Ancestry in Clay County
The most populous ancestries reported in Clay County are German (53,684 | 21.2%), English (33,329 | 13.2%), Irish (33,043 | 13.1%), American (16,318 | 6.5%), and Italian (13,095 | 5.2%), together accounting for 59.1% of all Clay County residents.
| Ancestry | # Population | % Population |
| Afghan | 194 | 0.1% |
| African | 2,520 | 1.0% |
| Albanian | 9 | 0.0% |
| Alsatian | 12 | 0.0% |
| American | 16,318 | 6.5% |
| Apache | 52 | 0.0% |
| Arab | 2,427 | 1.0% |
| Argentinean | 67 | 0.0% |
| Armenian | 23 | 0.0% |
| Assyrian / Chaldean / Syriac | 3 | 0.0% |
| Australian | 10 | 0.0% |
| Austrian | 214 | 0.1% |
| Bahamian | 12 | 0.0% |
| Belgian | 587 | 0.2% |
| Belizean | 14 | 0.0% |
| Bhutanese | 760 | 0.3% |
| Blackfeet | 179 | 0.1% |
| Bolivian | 34 | 0.0% |
| Brazilian | 41 | 0.0% |
| British | 1,398 | 0.5% |
| Bulgarian | 65 | 0.0% |
| Burmese | 371 | 0.2% |
| Cajun | 33 | 0.0% |
| Cambodian | 30 | 0.0% |
| Canadian | 368 | 0.2% |
| Celtic | 24 | 0.0% |
| Central American | 1,104 | 0.4% |
| Central American Indian | 16 | 0.0% |
| Cherokee | 1,433 | 0.6% |
| Chickasaw | 82 | 0.0% |
| Chilean | 85 | 0.0% |
| Chippewa | 87 | 0.0% |
| Choctaw | 582 | 0.2% |
| Colombian | 764 | 0.3% |
| Comanche | 1 | 0.0% |
| Costa Rican | 29 | 0.0% |
| Cree | 10 | 0.0% |
| Creek | 194 | 0.1% |
| Croatian | 602 | 0.2% |
| Crow | 4 | 0.0% |
| Cuban | 874 | 0.4% |
| Czech | 1,067 | 0.4% |
| Czechoslovakian | 198 | 0.1% |
| Danish | 956 | 0.4% |
| Delaware | 4 | 0.0% |
| Dominican | 211 | 0.1% |
| Dutch | 2,612 | 1.0% |
| Dutch West Indian | 225 | 0.1% |
| Eastern European | 437 | 0.2% |
| Ecuadorian | 29 | 0.0% |
| Egyptian | 147 | 0.1% |
| English | 33,329 | 13.2% |
| Ethiopian | 203 | 0.1% |
| European | 8,049 | 3.2% |
| Fijian | 1 | 0.0% |
| Filipino | 36 | 0.0% |
| Finnish | 381 | 0.2% |
| French | 5,760 | 2.3% |
| French American Indian | 16 | 0.0% |
| French Canadian | 711 | 0.3% |
| German | 53,684 | 21.2% |
| German Russian | 46 | 0.0% |
| Ghanaian | 132 | 0.1% |
| Greek | 455 | 0.2% |
| Guamanian / Chamorro | 208 | 0.1% |
| Guatemalan | 361 | 0.1% |
| Guyanese | 12 | 0.0% |
| Haitian | 461 | 0.2% |
| Honduran | 333 | 0.1% |
| Hopi | 7 | 0.0% |
| Hungarian | 265 | 0.1% |
| Icelander | 37 | 0.0% |
| Indian (Asian) | 1,122 | 0.4% |
| Indonesian | 80 | 0.0% |
| Iranian | 66 | 0.0% |
| Iraqi | 704 | 0.3% |
| Irish | 33,043 | 13.1% |
| Iroquois | 39 | 0.0% |
| Israeli | 21 | 0.0% |
| Italian | 13,095 | 5.2% |
| Jamaican | 24 | 0.0% |
| Japanese | 357 | 0.1% |
| Jordanian | 39 | 0.0% |
| Kenyan | 22 | 0.0% |
| Korean | 963 | 0.4% |
| Laotian | 22 | 0.0% |
| Latvian | 29 | 0.0% |
| Lebanese | 75 | 0.0% |
| Liberian | 43 | 0.0% |
| Lithuanian | 164 | 0.1% |
| Luxembourger | 128 | 0.1% |
| Malaysian | 32 | 0.0% |
| Mexican | 11,562 | 4.6% |
| Mexican American Indian | 165 | 0.1% |
| Mongolian | 81 | 0.0% |
| Native Hawaiian | 226 | 0.1% |
| Navajo | 60 | 0.0% |
| New Zealander | 13 | 0.0% |
| Nicaraguan | 63 | 0.0% |
| Nigerian | 257 | 0.1% |
| Northern European | 428 | 0.2% |
| Norwegian | 2,239 | 0.9% |
| Osage | 53 | 0.0% |
| Ottawa | 63 | 0.0% |
| Pakistani | 123 | 0.1% |
| Palestinian | 16 | 0.0% |
| Panamanian | 154 | 0.1% |
| Pennsylvania German | 80 | 0.0% |
| Peruvian | 161 | 0.1% |
| Pima | 6 | 0.0% |
| Polish | 3,333 | 1.3% |
| Portuguese | 395 | 0.2% |
| Potawatomi | 85 | 0.0% |
| Pueblo | 16 | 0.0% |
| Puerto Rican | 1,779 | 0.7% |
| Puget Sound Salish | 23 | 0.0% |
| Romanian | 60 | 0.0% |
| Russian | 939 | 0.4% |
| Salvadoran | 114 | 0.1% |
| Samoan | 251 | 0.1% |
| Scandinavian | 996 | 0.4% |
| Scotch-Irish | 3,587 | 1.4% |
| Scottish | 4,251 | 1.7% |
| Seminole | 84 | 0.0% |
| Serbian | 87 | 0.0% |
| Shoshone | 50 | 0.0% |
| Sioux | 65 | 0.0% |
| Slavic | 92 | 0.0% |
| Slovak | 241 | 0.1% |
| Somali | 23 | 0.0% |
| South American | 1,186 | 0.5% |
| South American Indian | 10 | 0.0% |
| Spaniard | 665 | 0.3% |
| Spanish | 944 | 0.4% |
| Sri Lankan | 2,226 | 0.9% |
| Subsaharan African | 3,365 | 1.3% |
| Sudanese | 36 | 0.0% |
| Swedish | 3,771 | 1.5% |
| Swiss | 593 | 0.2% |
| Syrian | 38 | 0.0% |
| Thai | 1,470 | 0.6% |
| Turkish | 307 | 0.1% |
| Ugandan | 27 | 0.0% |
| Ukrainian | 209 | 0.1% |
| Venezuelan | 42 | 0.0% |
| Vietnamese | 36 | 0.0% |
| Welsh | 2,054 | 0.8% |
| West Indian | 116 | 0.1% |
| Yaqui | 1 | 0.0% |
| Yugoslavian | 206 | 0.1% | View All 150 Rows |
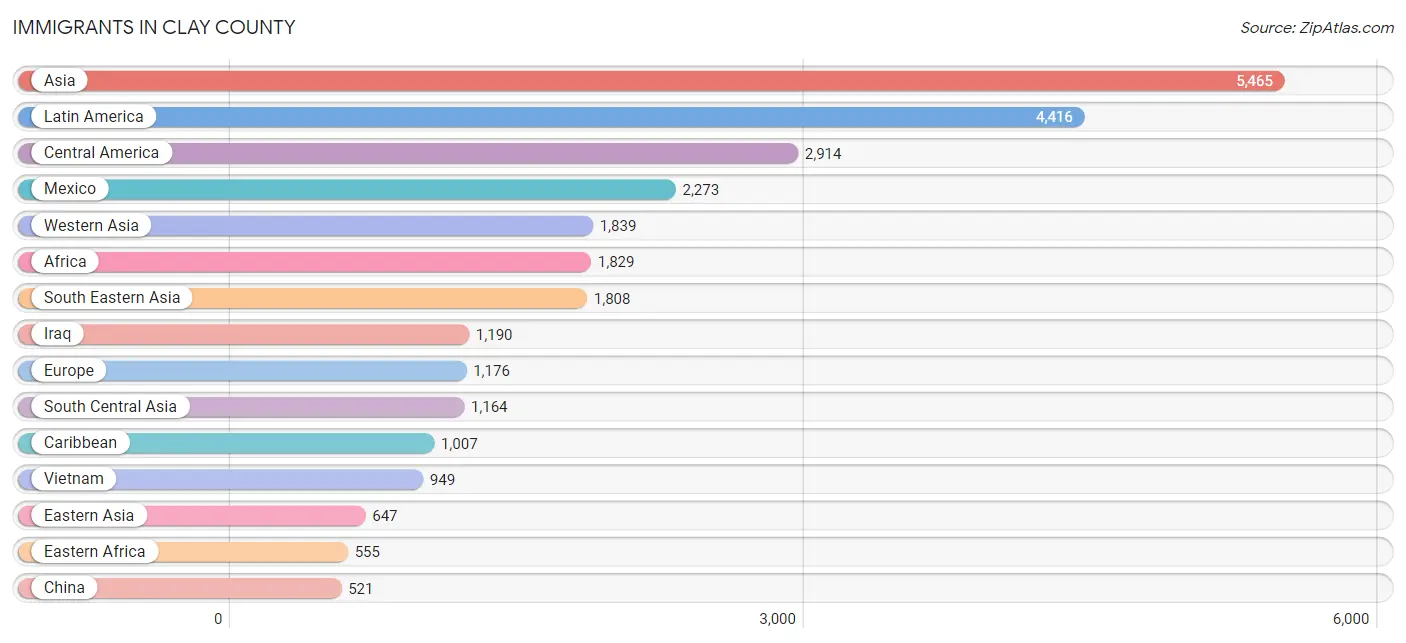
Immigrants in Clay County
The most numerous immigrant groups reported in Clay County came from Asia (5,465 | 2.2%), Latin America (4,416 | 1.7%), Central America (2,914 | 1.1%), Mexico (2,273 | 0.9%), and Western Asia (1,839 | 0.7%), together accounting for 6.7% of all Clay County residents.
| Immigration Origin | # Population | % Population |
| Afghanistan | 153 | 0.1% |
| Africa | 1,829 | 0.7% |
| Albania | 9 | 0.0% |
| Argentina | 57 | 0.0% |
| Asia | 5,465 | 2.2% |
| Australia | 10 | 0.0% |
| Bahamas | 12 | 0.0% |
| Bangladesh | 67 | 0.0% |
| Belize | 14 | 0.0% |
| Bosnia and Herzegovina | 123 | 0.1% |
| Brazil | 32 | 0.0% |
| Bulgaria | 82 | 0.0% |
| Cambodia | 169 | 0.1% |
| Cameroon | 50 | 0.0% |
| Canada | 185 | 0.1% |
| Caribbean | 1,007 | 0.4% |
| Central America | 2,914 | 1.1% |
| Chile | 27 | 0.0% |
| China | 521 | 0.2% |
| Colombia | 225 | 0.1% |
| Costa Rica | 29 | 0.0% |
| Croatia | 23 | 0.0% |
| Cuba | 501 | 0.2% |
| Czechoslovakia | 18 | 0.0% |
| Denmark | 8 | 0.0% |
| Dominican Republic | 138 | 0.1% |
| Eastern Africa | 555 | 0.2% |
| Eastern Asia | 647 | 0.3% |
| Eastern Europe | 440 | 0.2% |
| Ecuador | 10 | 0.0% |
| Egypt | 127 | 0.1% |
| El Salvador | 60 | 0.0% |
| England | 148 | 0.1% |
| Eritrea | 29 | 0.0% |
| Ethiopia | 167 | 0.1% |
| Europe | 1,176 | 0.5% |
| France | 15 | 0.0% |
| Germany | 155 | 0.1% |
| Ghana | 75 | 0.0% |
| Greece | 84 | 0.0% |
| Guatemala | 232 | 0.1% |
| Haiti | 154 | 0.1% |
| Honduras | 253 | 0.1% |
| Hong Kong | 5 | 0.0% |
| India | 453 | 0.2% |
| Indonesia | 11 | 0.0% |
| Iran | 21 | 0.0% |
| Iraq | 1,190 | 0.5% |
| Ireland | 18 | 0.0% |
| Israel | 68 | 0.0% |
| Italy | 197 | 0.1% |
| Jamaica | 22 | 0.0% |
| Japan | 41 | 0.0% |
| Jordan | 354 | 0.1% |
| Kazakhstan | 18 | 0.0% |
| Kenya | 22 | 0.0% |
| Korea | 55 | 0.0% |
| Kuwait | 8 | 0.0% |
| Laos | 75 | 0.0% |
| Latin America | 4,416 | 1.7% |
| Liberia | 158 | 0.1% |
| Malaysia | 22 | 0.0% |
| Mexico | 2,273 | 0.9% |
| Micronesia | 312 | 0.1% |
| Middle Africa | 50 | 0.0% |
| Nicaragua | 48 | 0.0% |
| Nigeria | 164 | 0.1% |
| Northern Africa | 470 | 0.2% |
| Northern Europe | 247 | 0.1% |
| Oceania | 372 | 0.2% |
| Pakistan | 362 | 0.1% |
| Panama | 5 | 0.0% |
| Peru | 101 | 0.0% |
| Philippines | 381 | 0.2% |
| Romania | 15 | 0.0% |
| Russia | 125 | 0.1% |
| Scotland | 21 | 0.0% |
| Sierra Leone | 17 | 0.0% |
| Somalia | 79 | 0.0% |
| South Africa | 90 | 0.0% |
| South America | 495 | 0.2% |
| South Central Asia | 1,164 | 0.5% |
| South Eastern Asia | 1,808 | 0.7% |
| Southern Europe | 319 | 0.1% |
| Spain | 38 | 0.0% |
| Sri Lanka | 52 | 0.0% |
| Sudan | 303 | 0.1% |
| Sweden | 8 | 0.0% |
| Syria | 21 | 0.0% |
| Taiwan | 31 | 0.0% |
| Thailand | 172 | 0.1% |
| Trinidad and Tobago | 180 | 0.1% |
| Turkey | 162 | 0.1% |
| Uganda | 8 | 0.0% |
| Ukraine | 18 | 0.0% |
| Uzbekistan | 20 | 0.0% |
| Venezuela | 39 | 0.0% |
| Vietnam | 949 | 0.4% |
| Western Africa | 414 | 0.2% |
| Western Asia | 1,839 | 0.7% |
| Western Europe | 170 | 0.1% | View All 101 Rows |
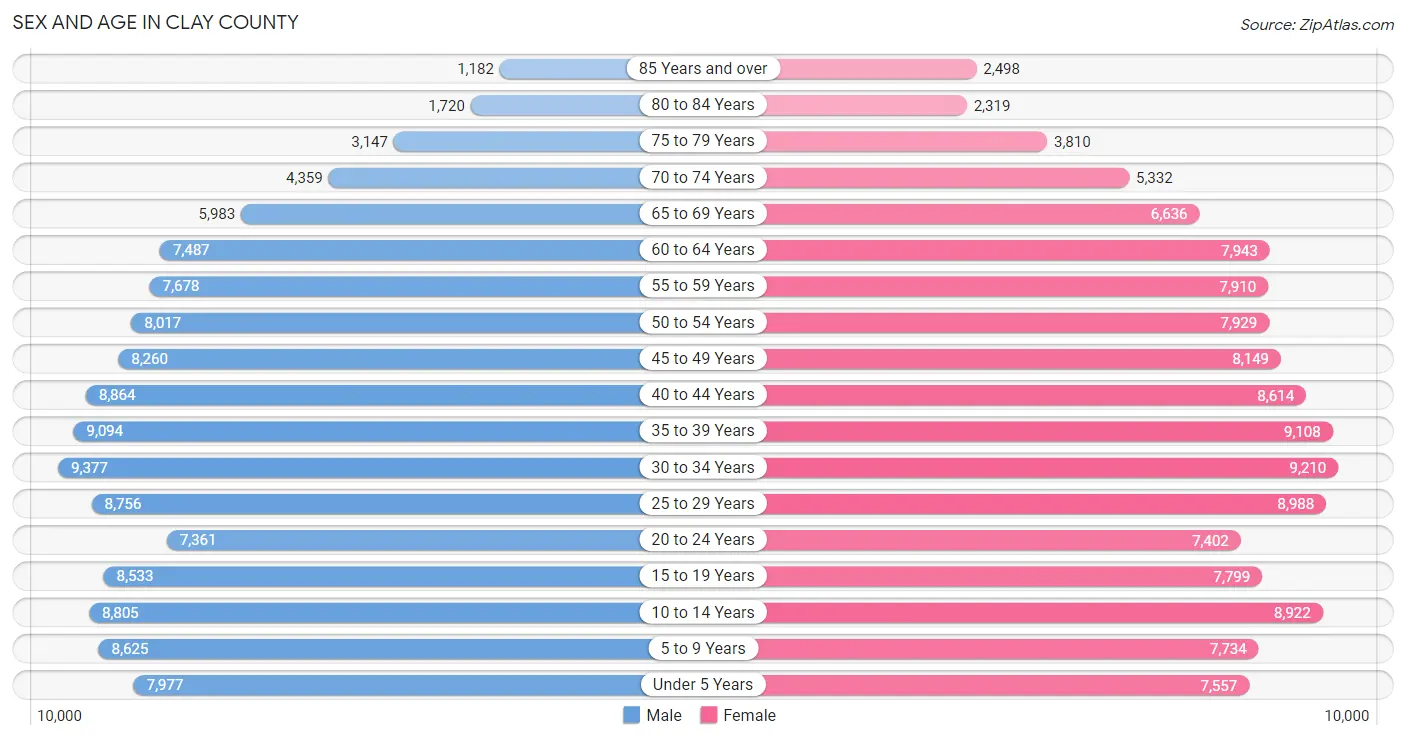
Sex and Age in Clay County
Sex and Age in Clay County
The most populous age groups in Clay County are 30 to 34 Years (9,377 | 7.5%) for men and 30 to 34 Years (9,210 | 7.2%) for women.
| Age Bracket | Male | Female |
| Under 5 Years | 7,977 (6.4%) | 7,557 (5.9%) |
| 5 to 9 Years | 8,625 (6.9%) | 7,734 (6.0%) |
| 10 to 14 Years | 8,805 (7.0%) | 8,922 (7.0%) |
| 15 to 19 Years | 8,533 (6.8%) | 7,799 (6.1%) |
| 20 to 24 Years | 7,361 (5.9%) | 7,402 (5.8%) |
| 25 to 29 Years | 8,756 (7.0%) | 8,988 (7.0%) |
| 30 to 34 Years | 9,377 (7.5%) | 9,210 (7.2%) |
| 35 to 39 Years | 9,094 (7.3%) | 9,108 (7.1%) |
| 40 to 44 Years | 8,864 (7.1%) | 8,614 (6.7%) |
| 45 to 49 Years | 8,260 (6.6%) | 8,149 (6.4%) |
| 50 to 54 Years | 8,017 (6.4%) | 7,929 (6.2%) |
| 55 to 59 Years | 7,678 (6.1%) | 7,910 (6.2%) |
| 60 to 64 Years | 7,487 (6.0%) | 7,943 (6.2%) |
| 65 to 69 Years | 5,983 (4.8%) | 6,636 (5.2%) |
| 70 to 74 Years | 4,359 (3.5%) | 5,332 (4.2%) |
| 75 to 79 Years | 3,147 (2.5%) | 3,810 (3.0%) |
| 80 to 84 Years | 1,720 (1.4%) | 2,319 (1.8%) |
| 85 Years and over | 1,182 (0.9%) | 2,498 (1.9%) |
| Total | 125,225 (100.0%) | 127,860 (100.0%) |
Families and Households in Clay County
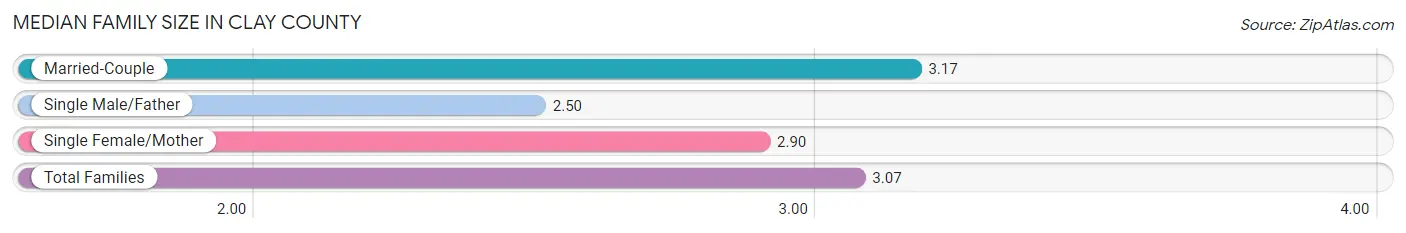
Median Family Size in Clay County
The median family size in Clay County is 3.07 persons per family, with married-couple families (49,607 | 75.0%) accounting for the largest median family size of 3.17 persons per family. On the other hand, single male/father families (5,149 | 7.8%) represent the smallest median family size with 2.50 persons per family.
| Family Type | # Families | Family Size |
| Married-Couple | 49,607 (75.0%) | 3.17 |
| Single Male/Father | 5,149 (7.8%) | 2.50 |
| Single Female/Mother | 11,412 (17.2%) | 2.90 |
| Total Families | 66,168 (100.0%) | 3.07 |
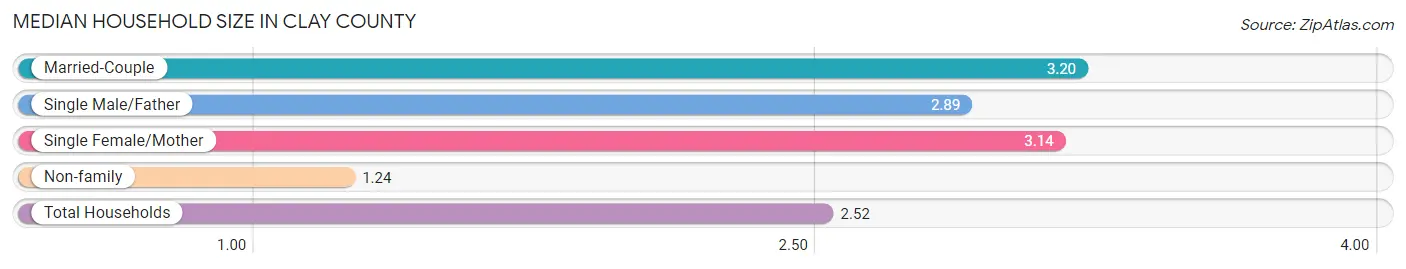
Median Household Size in Clay County
The median household size in Clay County is 2.52 persons per household, with married-couple households (49,607 | 49.9%) accounting for the largest median household size of 3.2 persons per household. non-family households (33,333 | 33.5%) represent the smallest median household size with 1.24 persons per household.
| Household Type | # Households | Household Size |
| Married-Couple | 49,607 (49.9%) | 3.20 |
| Single Male/Father | 5,149 (5.2%) | 2.89 |
| Single Female/Mother | 11,412 (11.5%) | 3.14 |
| Non-family | 33,333 (33.5%) | 1.24 |
| Total Households | 99,501 (100.0%) | 2.52 |
Household Size by Marriage Status in Clay County
Out of a total of 99,501 households in Clay County, 66,168 (66.5%) are family households, while 33,333 (33.5%) are nonfamily households. The most numerous type of family households are 2-person households, comprising 28,585, and the most common type of nonfamily households are 1-person households, comprising 27,039.
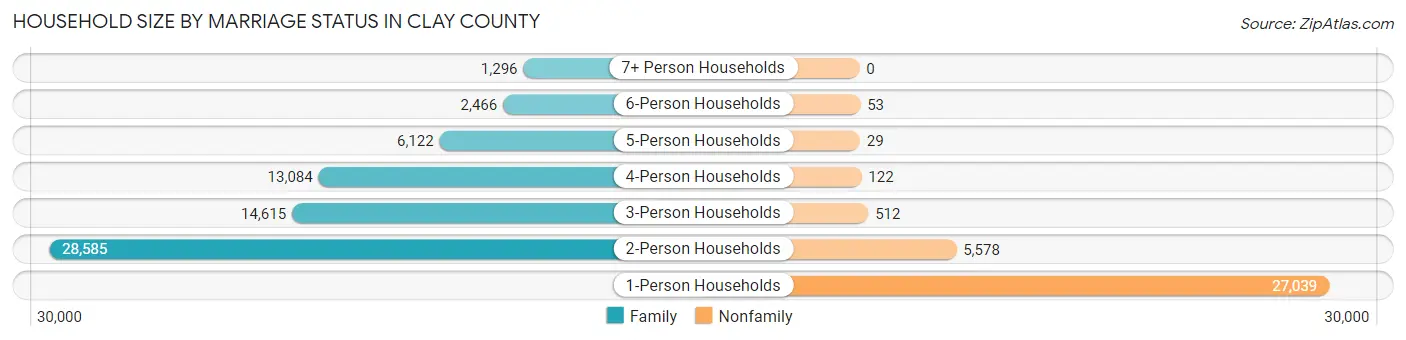
| Household Size | Family Households | Nonfamily Households |
| 1-Person Households | - | 27,039 (27.2%) |
| 2-Person Households | 28,585 (28.7%) | 5,578 (5.6%) |
| 3-Person Households | 14,615 (14.7%) | 512 (0.5%) |
| 4-Person Households | 13,084 (13.2%) | 122 (0.1%) |
| 5-Person Households | 6,122 (6.1%) | 29 (0.0%) |
| 6-Person Households | 2,466 (2.5%) | 53 (0.1%) |
| 7+ Person Households | 1,296 (1.3%) | 0 (0.0%) |
| Total | 66,168 (66.5%) | 33,333 (33.5%) |
Female Fertility in Clay County
Fertility by Age in Clay County
Average fertility rate in Clay County is 54.0 births per 1,000 women. Women in the age bracket of 20 to 34 years have the highest fertility rate with 95.0 births per 1,000 women. Women in the age bracket of 20 to 34 years acount for 73.0% of all women with births.
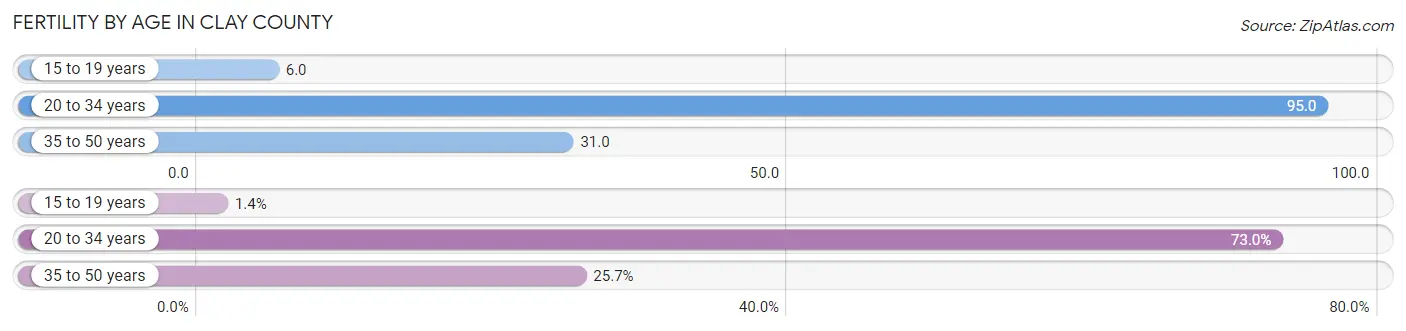
| Age Bracket | Women with Births | Births / 1,000 Women |
| 15 to 19 years | 45 (1.3%) | 6.0 |
| 20 to 34 years | 2,429 (73.0%) | 95.0 |
| 35 to 50 years | 855 (25.7%) | 31.0 |
| Total | 3,329 (100.0%) | 54.0 |
Fertility by Age by Marriage Status in Clay County
79.6% of women with births (3,329) in Clay County are married. The highest percentage of unmarried women with births falls into 15 to 19 years age bracket with 100.0% of them unmarried at the time of birth, while the lowest percentage of unmarried women with births belong to 20 to 34 years age bracket with 18.8% of them unmarried.
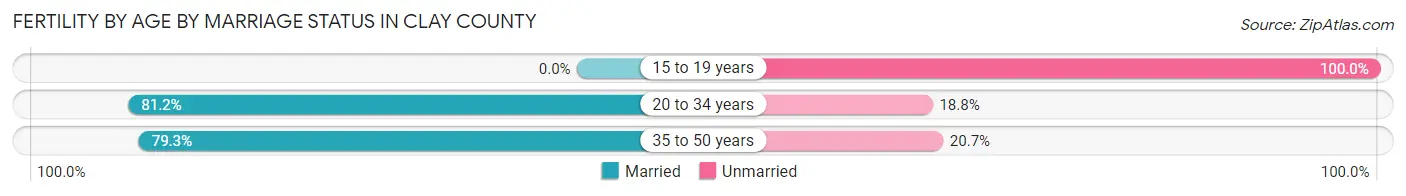
| Age Bracket | Married | Unmarried |
| 15 to 19 years | 0 (0.0%) | 45 (100.0%) |
| 20 to 34 years | 1,972 (81.2%) | 457 (18.8%) |
| 35 to 50 years | 678 (79.3%) | 177 (20.7%) |
| Total | 2,650 (79.6%) | 679 (20.4%) |
Fertility by Education in Clay County
Average fertility rate in Clay County is 54.0 births per 1,000 women. Women with the education attainment of college or associate's degree have the highest fertility rate of 63.0 births per 1,000 women, while women with the education attainment of less than high school have the lowest fertility at 19.0 births per 1,000 women. Women with the education attainment of college or associate's degree represent 37.2% of all women with births.
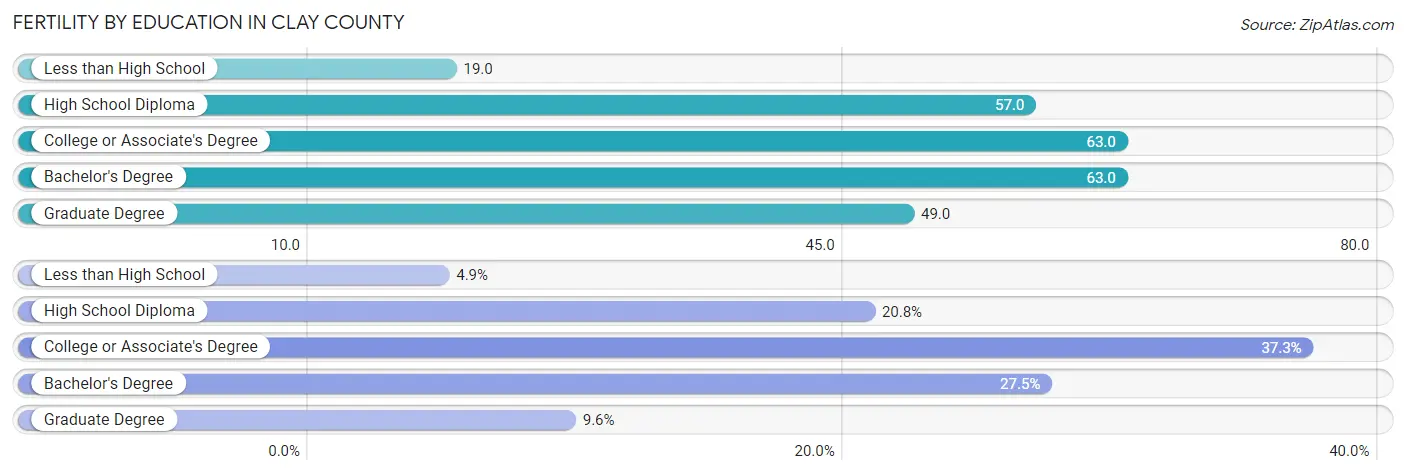
| Educational Attainment | Women with Births | Births / 1,000 Women |
| Less than High School | 162 (4.9%) | 19.0 |
| High School Diploma | 693 (20.8%) | 57.0 |
| College or Associate's Degree | 1,240 (37.2%) | 63.0 |
| Bachelor's Degree | 914 (27.5%) | 63.0 |
| Graduate Degree | 320 (9.6%) | 49.0 |
| Total | 3,329 (100.0%) | 54.0 |
Fertility by Education by Marriage Status in Clay County
20.4% of women with births in Clay County are unmarried. Women with the educational attainment of high school diploma are most likely to be married with 88.2% of them married at childbirth, while women with the educational attainment of less than high school are least likely to be married with 32.7% of them unmarried at childbirth.
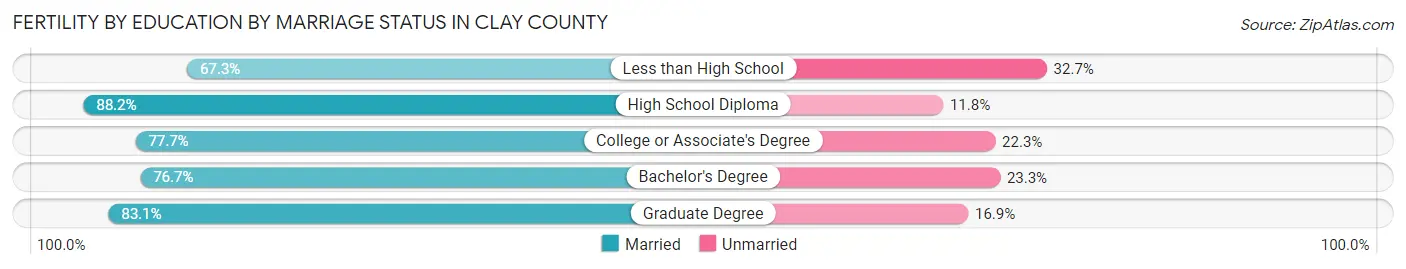
| Educational Attainment | Married | Unmarried |
| Less than High School | 109 (67.3%) | 53 (32.7%) |
| High School Diploma | 611 (88.2%) | 82 (11.8%) |
| College or Associate's Degree | 963 (77.7%) | 277 (22.3%) |
| Bachelor's Degree | 701 (76.7%) | 213 (23.3%) |
| Graduate Degree | 266 (83.1%) | 54 (16.9%) |
| Total | 2,650 (79.6%) | 679 (20.4%) |
Employment Characteristics in Clay County
Employment by Class of Employer in Clay County
Among the 131,772 employed individuals in Clay County, private company employees (92,664 | 70.3%), not-for-profit organizations (12,652 | 9.6%), and local government employees (9,236 | 7.0%) make up the most common classes of employment.
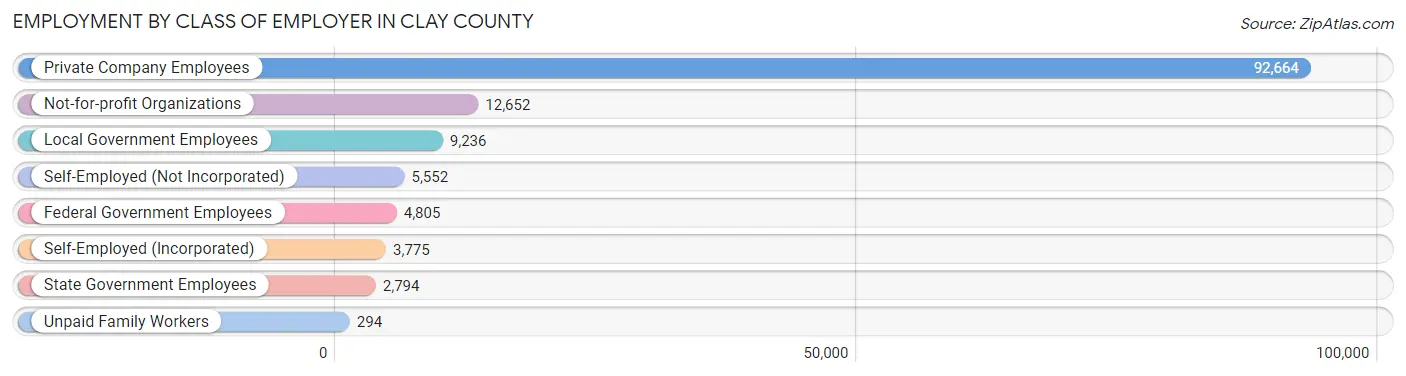
| Employer Class | # Employees | % Employees |
| Private Company Employees | 92,664 | 70.3% |
| Self-Employed (Incorporated) | 3,775 | 2.9% |
| Self-Employed (Not Incorporated) | 5,552 | 4.2% |
| Not-for-profit Organizations | 12,652 | 9.6% |
| Local Government Employees | 9,236 | 7.0% |
| State Government Employees | 2,794 | 2.1% |
| Federal Government Employees | 4,805 | 3.6% |
| Unpaid Family Workers | 294 | 0.2% |
| Total | 131,772 | 100.0% |
Employment Status by Age in Clay County
According to the labor force statistics for Clay County, out of the total population over 16 years of age (200,132), 69.8% or 139,692 individuals are in the labor force, with 4.0% or 5,588 of them unemployed. The age group with the highest labor force participation rate is 30 to 34 years, with 88.0% or 16,357 individuals in the labor force. Within the labor force, the 16 to 19 years age range has the highest percentage of unemployed individuals, with 9.6% or 643 of them being unemployed.
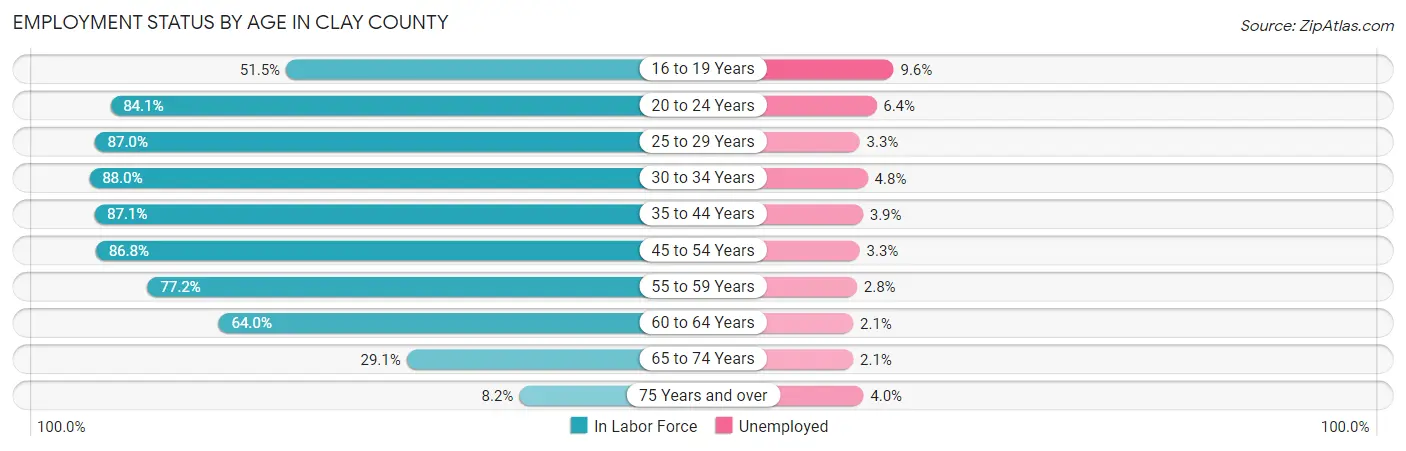
| Age Bracket | In Labor Force | Unemployed |
| 16 to 19 Years | 6,694 (51.5%) | 643 (9.6%) |
| 20 to 24 Years | 12,416 (84.1%) | 795 (6.4%) |
| 25 to 29 Years | 15,437 (87.0%) | 509 (3.3%) |
| 30 to 34 Years | 16,357 (88.0%) | 785 (4.8%) |
| 35 to 44 Years | 31,077 (87.1%) | 1,212 (3.9%) |
| 45 to 54 Years | 28,084 (86.8%) | 927 (3.3%) |
| 55 to 59 Years | 12,034 (77.2%) | 337 (2.8%) |
| 60 to 64 Years | 9,875 (64.0%) | 207 (2.1%) |
| 65 to 74 Years | 6,492 (29.1%) | 136 (2.1%) |
| 75 Years and over | 1,203 (8.2%) | 48 (4.0%) |
| Total | 139,692 (69.8%) | 5,588 (4.0%) |
Employment Status by Educational Attainment in Clay County
According to labor force statistics for Clay County, 83.4% of individuals (112,910) out of the total population between 25 and 64 years of age (135,384) are in the labor force, with 3.5% or 3,952 of them being unemployed. The group with the highest labor force participation rate are those with the educational attainment of bachelor's degree or higher, with 89.8% or 44,935 individuals in the labor force. Within the labor force, individuals with less than high school education have the highest percentage of unemployment, with 9.3% or 467 of them being unemployed.
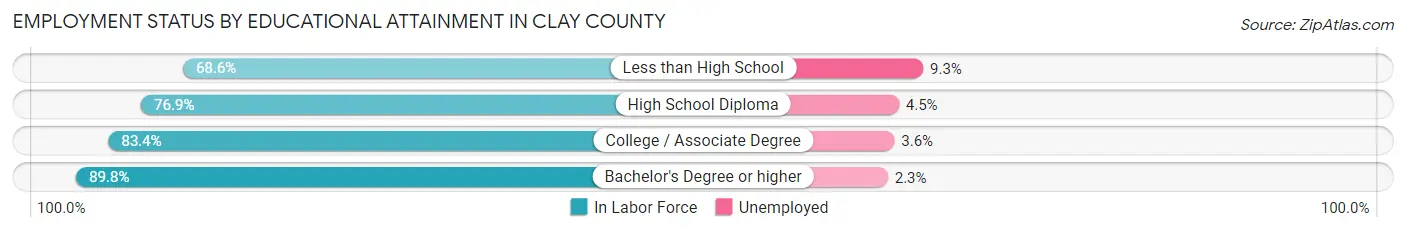
| Educational Attainment | In Labor Force | Unemployed |
| Less than High School | 5,022 (68.6%) | 681 (9.3%) |
| High School Diploma | 26,131 (76.9%) | 1,529 (4.5%) |
| College / Associate Degree | 36,733 (83.4%) | 1,586 (3.6%) |
| Bachelor's Degree or higher | 44,935 (89.8%) | 1,151 (2.3%) |
| Total | 112,910 (83.4%) | 4,738 (3.5%) |
Employment Occupations by Sex in Clay County
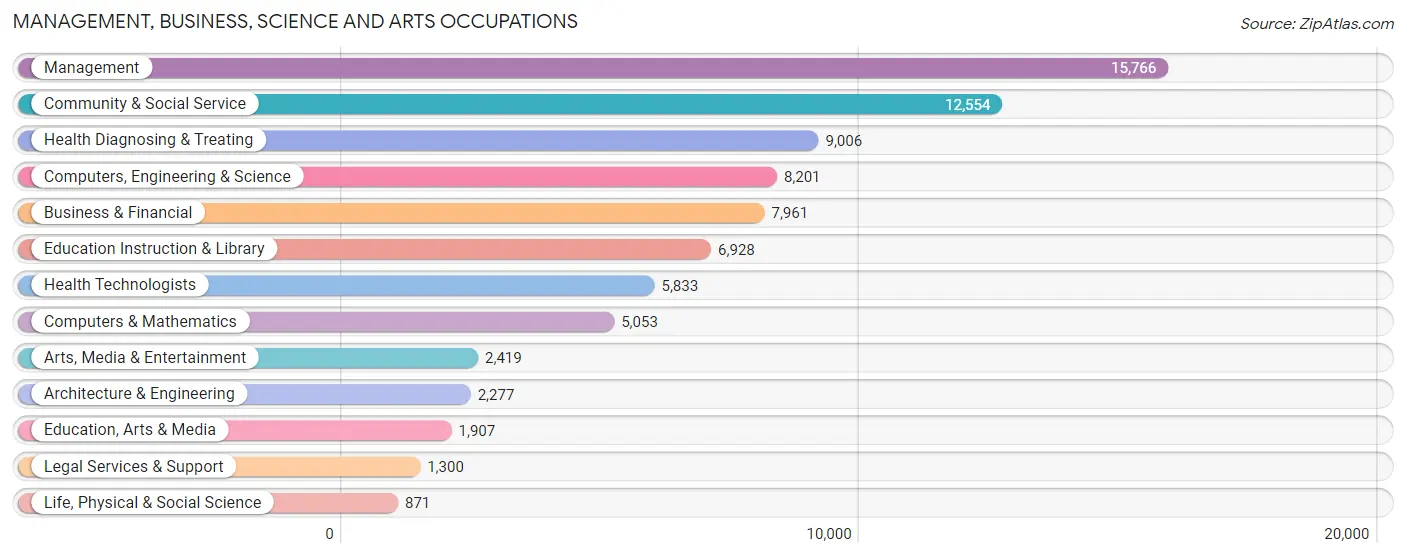
Management, Business, Science and Arts Occupations
The most common Management, Business, Science and Arts occupations in Clay County are Management (15,766 | 11.8%), Community & Social Service (12,554 | 9.4%), Health Diagnosing & Treating (9,006 | 6.7%), Computers, Engineering & Science (8,201 | 6.1%), and Business & Financial (7,961 | 6.0%).
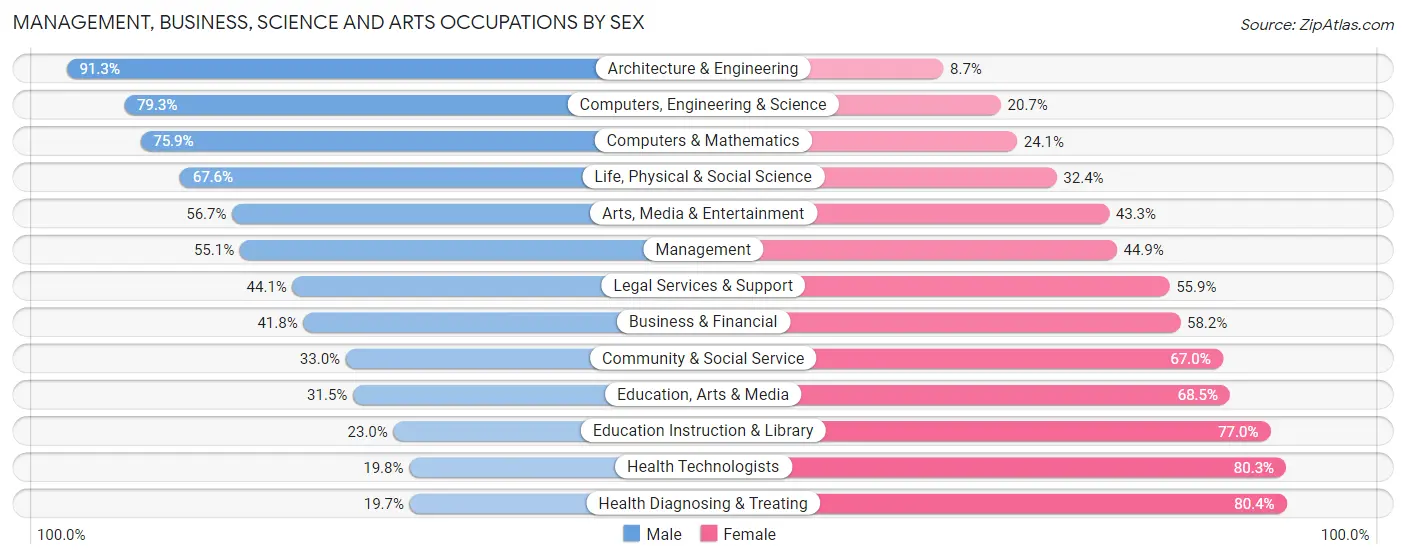
Management, Business, Science and Arts Occupations by Sex
Within the Management, Business, Science and Arts occupations in Clay County, the most male-oriented occupations are Architecture & Engineering (91.3%), Computers, Engineering & Science (79.3%), and Computers & Mathematics (75.9%), while the most female-oriented occupations are Health Diagnosing & Treating (80.3%), Health Technologists (80.2%), and Education Instruction & Library (77.0%).
| Occupation | Male | Female |
| Management | 8,682 (55.1%) | 7,084 (44.9%) |
| Business & Financial | 3,329 (41.8%) | 4,632 (58.2%) |
| Computers, Engineering & Science | 6,500 (79.3%) | 1,701 (20.7%) |
| Computers & Mathematics | 3,833 (75.9%) | 1,220 (24.1%) |
| Architecture & Engineering | 2,078 (91.3%) | 199 (8.7%) |
| Life, Physical & Social Science | 589 (67.6%) | 282 (32.4%) |
| Community & Social Service | 4,139 (33.0%) | 8,415 (67.0%) |
| Education, Arts & Media | 600 (31.5%) | 1,307 (68.5%) |
| Legal Services & Support | 573 (44.1%) | 727 (55.9%) |
| Education Instruction & Library | 1,595 (23.0%) | 5,333 (77.0%) |
| Arts, Media & Entertainment | 1,371 (56.7%) | 1,048 (43.3%) |
| Health Diagnosing & Treating | 1,770 (19.7%) | 7,236 (80.3%) |
| Health Technologists | 1,152 (19.8%) | 4,681 (80.2%) |
| Total (Category) | 24,420 (45.7%) | 29,068 (54.3%) |
| Total (Overall) | 70,470 (52.7%) | 63,192 (47.3%) |
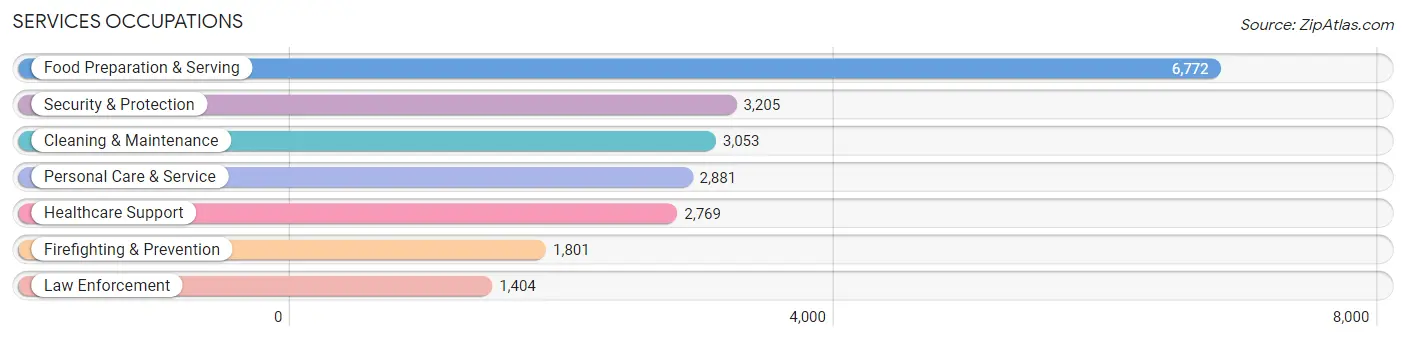
Services Occupations
The most common Services occupations in Clay County are Food Preparation & Serving (6,772 | 5.1%), Security & Protection (3,205 | 2.4%), Cleaning & Maintenance (3,053 | 2.3%), Personal Care & Service (2,881 | 2.2%), and Healthcare Support (2,769 | 2.1%).
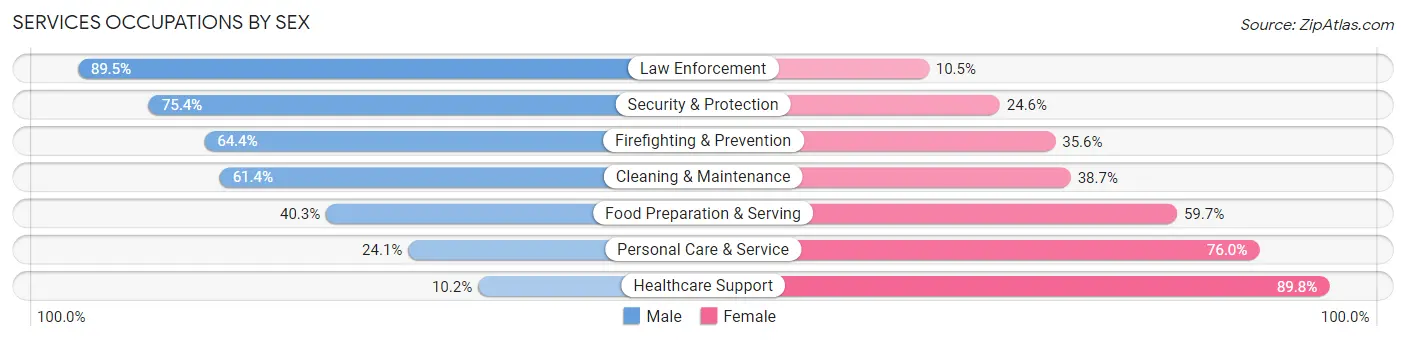
Services Occupations by Sex
Within the Services occupations in Clay County, the most male-oriented occupations are Law Enforcement (89.5%), Security & Protection (75.4%), and Firefighting & Prevention (64.4%), while the most female-oriented occupations are Healthcare Support (89.8%), Personal Care & Service (75.9%), and Food Preparation & Serving (59.7%).
| Occupation | Male | Female |
| Healthcare Support | 283 (10.2%) | 2,486 (89.8%) |
| Security & Protection | 2,416 (75.4%) | 789 (24.6%) |
| Firefighting & Prevention | 1,160 (64.4%) | 641 (35.6%) |
| Law Enforcement | 1,256 (89.5%) | 148 (10.5%) |
| Food Preparation & Serving | 2,730 (40.3%) | 4,042 (59.7%) |
| Cleaning & Maintenance | 1,873 (61.4%) | 1,180 (38.7%) |
| Personal Care & Service | 693 (24.0%) | 2,188 (75.9%) |
| Total (Category) | 7,995 (42.8%) | 10,685 (57.2%) |
| Total (Overall) | 70,470 (52.7%) | 63,192 (47.3%) |
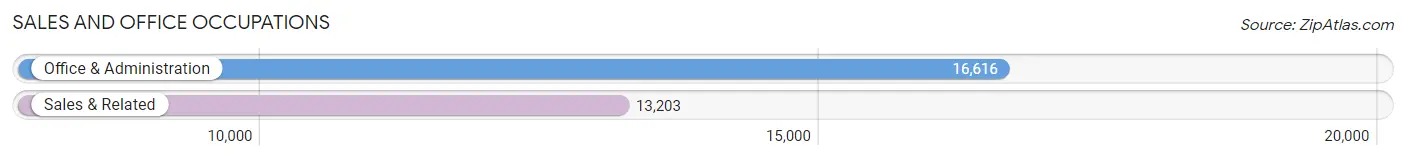
Sales and Office Occupations
The most common Sales and Office occupations in Clay County are Office & Administration (16,616 | 12.4%), and Sales & Related (13,203 | 9.9%).
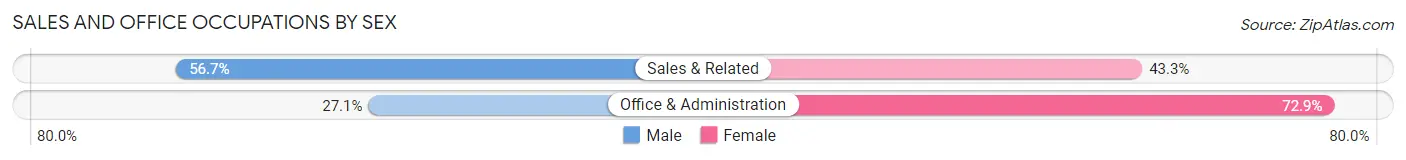
Sales and Office Occupations by Sex
| Occupation | Male | Female |
| Sales & Related | 7,482 (56.7%) | 5,721 (43.3%) |
| Office & Administration | 4,507 (27.1%) | 12,109 (72.9%) |
| Total (Category) | 11,989 (40.2%) | 17,830 (59.8%) |
| Total (Overall) | 70,470 (52.7%) | 63,192 (47.3%) |
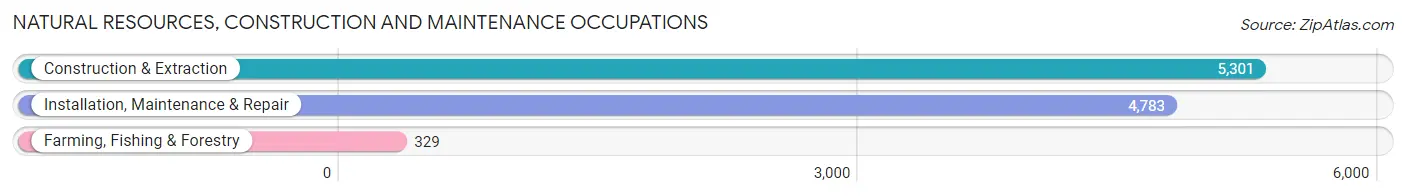
Natural Resources, Construction and Maintenance Occupations
The most common Natural Resources, Construction and Maintenance occupations in Clay County are Construction & Extraction (5,301 | 4.0%), Installation, Maintenance & Repair (4,783 | 3.6%), and Farming, Fishing & Forestry (329 | 0.3%).
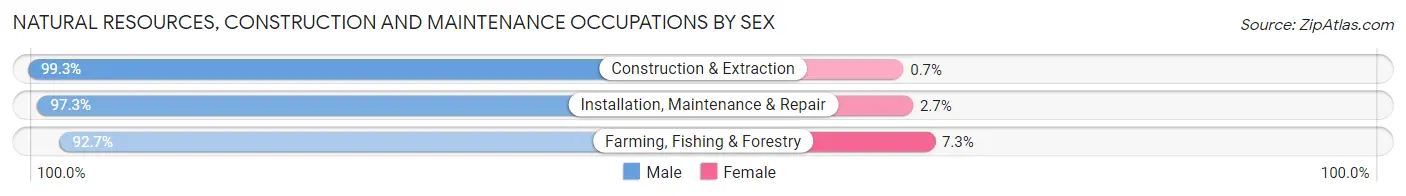
Natural Resources, Construction and Maintenance Occupations by Sex
| Occupation | Male | Female |
| Farming, Fishing & Forestry | 305 (92.7%) | 24 (7.3%) |
| Construction & Extraction | 5,264 (99.3%) | 37 (0.7%) |
| Installation, Maintenance & Repair | 4,653 (97.3%) | 130 (2.7%) |
| Total (Category) | 10,222 (98.2%) | 191 (1.8%) |
| Total (Overall) | 70,470 (52.7%) | 63,192 (47.3%) |
Production, Transportation and Moving Occupations
The most common Production, Transportation and Moving occupations in Clay County are Production (9,483 | 7.1%), Material Moving (5,951 | 4.4%), and Transportation (5,828 | 4.4%).
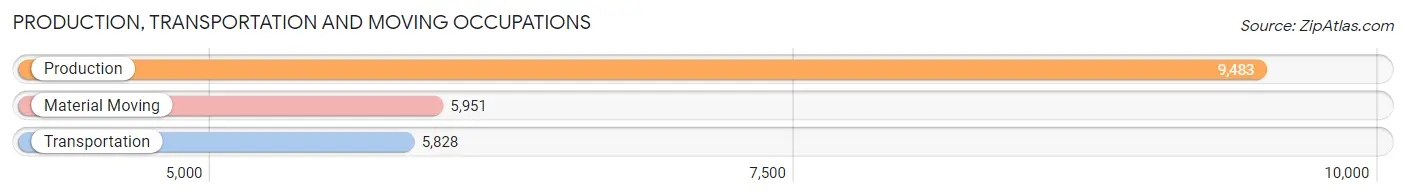
Production, Transportation and Moving Occupations by Sex
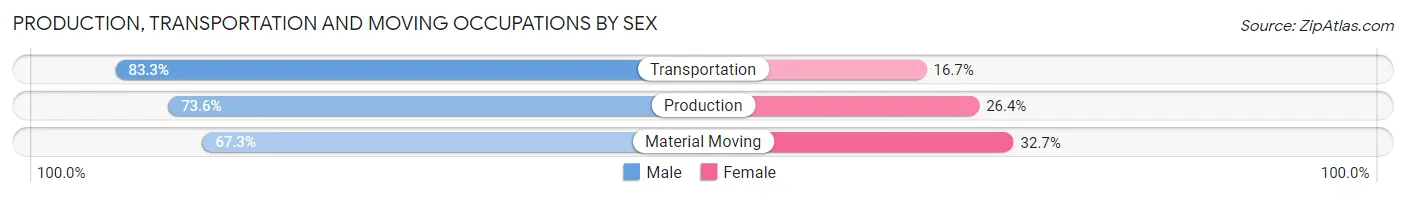
| Occupation | Male | Female |
| Production | 6,983 (73.6%) | 2,500 (26.4%) |
| Transportation | 4,854 (83.3%) | 974 (16.7%) |
| Material Moving | 4,007 (67.3%) | 1,944 (32.7%) |
| Total (Category) | 15,844 (74.5%) | 5,418 (25.5%) |
| Total (Overall) | 70,470 (52.7%) | 63,192 (47.3%) |
Employment Industries by Sex in Clay County
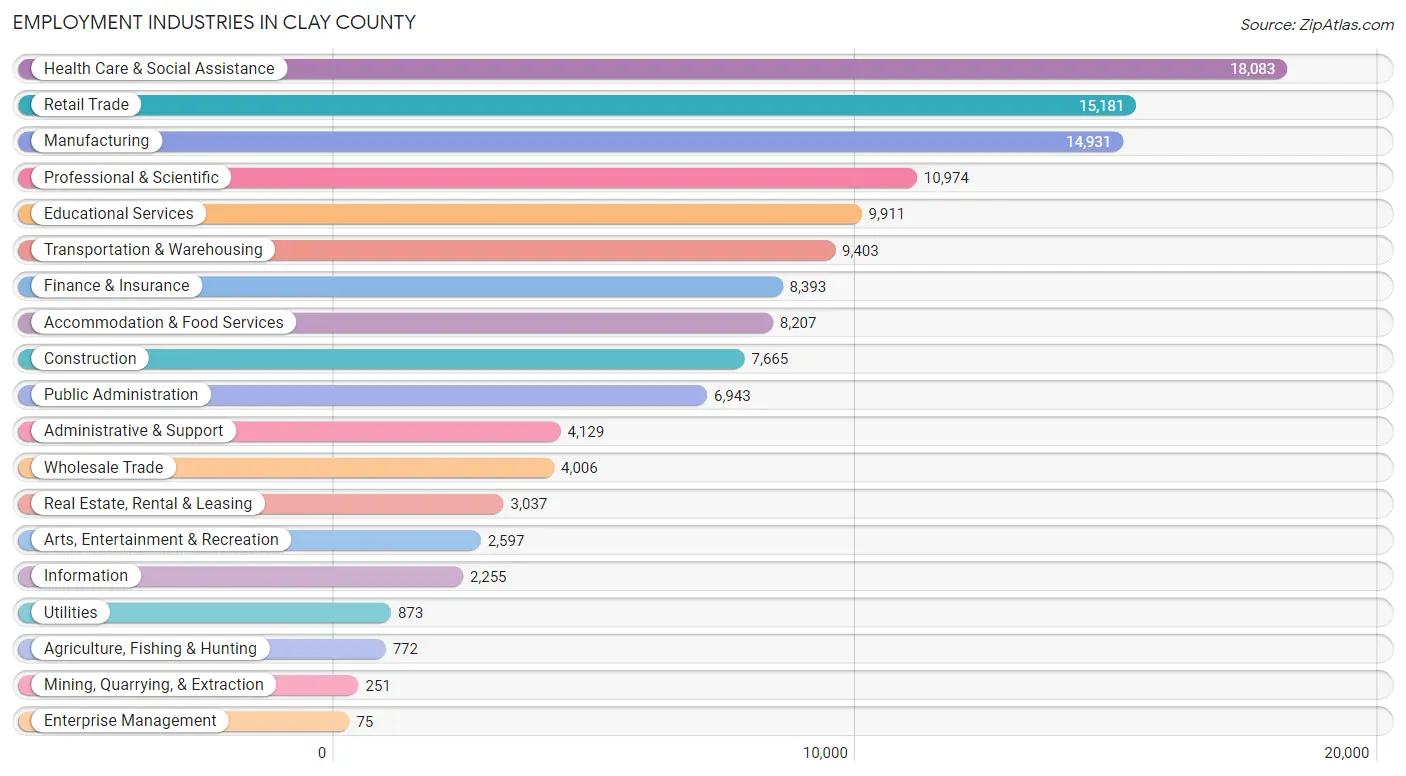
Employment Industries in Clay County
The major employment industries in Clay County include Health Care & Social Assistance (18,083 | 13.5%), Retail Trade (15,181 | 11.4%), Manufacturing (14,931 | 11.2%), Professional & Scientific (10,974 | 8.2%), and Educational Services (9,911 | 7.4%).
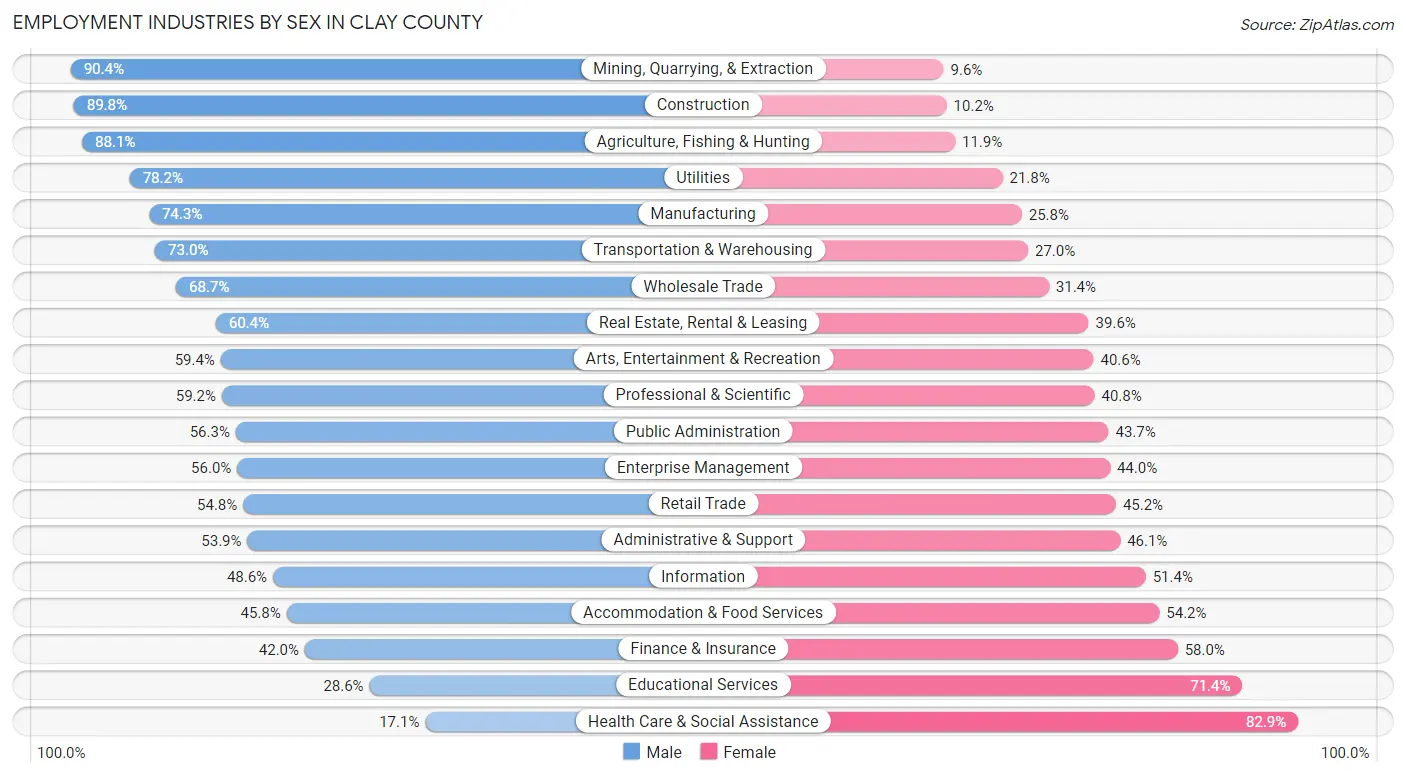
Employment Industries by Sex in Clay County
The Clay County industries that see more men than women are Mining, Quarrying, & Extraction (90.4%), Construction (89.8%), and Agriculture, Fishing & Hunting (88.1%), whereas the industries that tend to have a higher number of women are Health Care & Social Assistance (82.9%), Educational Services (71.4%), and Finance & Insurance (58.0%).
| Industry | Male | Female |
| Agriculture, Fishing & Hunting | 680 (88.1%) | 92 (11.9%) |
| Mining, Quarrying, & Extraction | 227 (90.4%) | 24 (9.6%) |
| Construction | 6,884 (89.8%) | 781 (10.2%) |
| Manufacturing | 11,086 (74.3%) | 3,845 (25.8%) |
| Wholesale Trade | 2,750 (68.6%) | 1,256 (31.4%) |
| Retail Trade | 8,314 (54.8%) | 6,867 (45.2%) |
| Transportation & Warehousing | 6,861 (73.0%) | 2,542 (27.0%) |
| Utilities | 683 (78.2%) | 190 (21.8%) |
| Information | 1,096 (48.6%) | 1,159 (51.4%) |
| Finance & Insurance | 3,524 (42.0%) | 4,869 (58.0%) |
| Real Estate, Rental & Leasing | 1,835 (60.4%) | 1,202 (39.6%) |
| Professional & Scientific | 6,496 (59.2%) | 4,478 (40.8%) |
| Enterprise Management | 42 (56.0%) | 33 (44.0%) |
| Administrative & Support | 2,225 (53.9%) | 1,904 (46.1%) |
| Educational Services | 2,837 (28.6%) | 7,074 (71.4%) |
| Health Care & Social Assistance | 3,086 (17.1%) | 14,997 (82.9%) |
| Arts, Entertainment & Recreation | 1,543 (59.4%) | 1,054 (40.6%) |
| Accommodation & Food Services | 3,757 (45.8%) | 4,450 (54.2%) |
| Public Administration | 3,909 (56.3%) | 3,034 (43.7%) |
| Total | 70,470 (52.7%) | 63,192 (47.3%) |
Education in Clay County
School Enrollment in Clay County
The most common levels of schooling among the 60,533 students in Clay County are middle school (14,278 | 23.6%), high school (13,615 | 22.5%), and elementary school (13,255 | 21.9%).
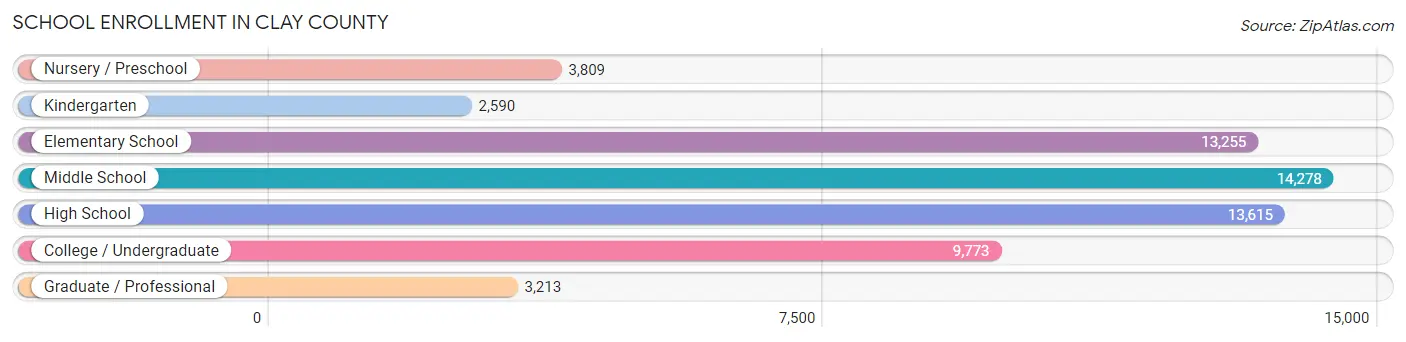
| School Level | # Students | % Students |
| Nursery / Preschool | 3,809 | 6.3% |
| Kindergarten | 2,590 | 4.3% |
| Elementary School | 13,255 | 21.9% |
| Middle School | 14,278 | 23.6% |
| High School | 13,615 | 22.5% |
| College / Undergraduate | 9,773 | 16.1% |
| Graduate / Professional | 3,213 | 5.3% |
| Total | 60,533 | 100.0% |
School Enrollment by Age by Funding Source in Clay County
Out of a total of 60,533 students who are enrolled in schools in Clay County, 9,383 (15.5%) attend a private institution, while the remaining 51,150 (84.5%) are enrolled in public schools. The age group of 3 to 4 year olds has the highest likelihood of being enrolled in private schools, with 1,037 (42.1% in the age bracket) enrolled. Conversely, the age group of 15 to 17 year olds has the lowest likelihood of being enrolled in a private school, with 9,614 (94.3% in the age bracket) attending a public institution.
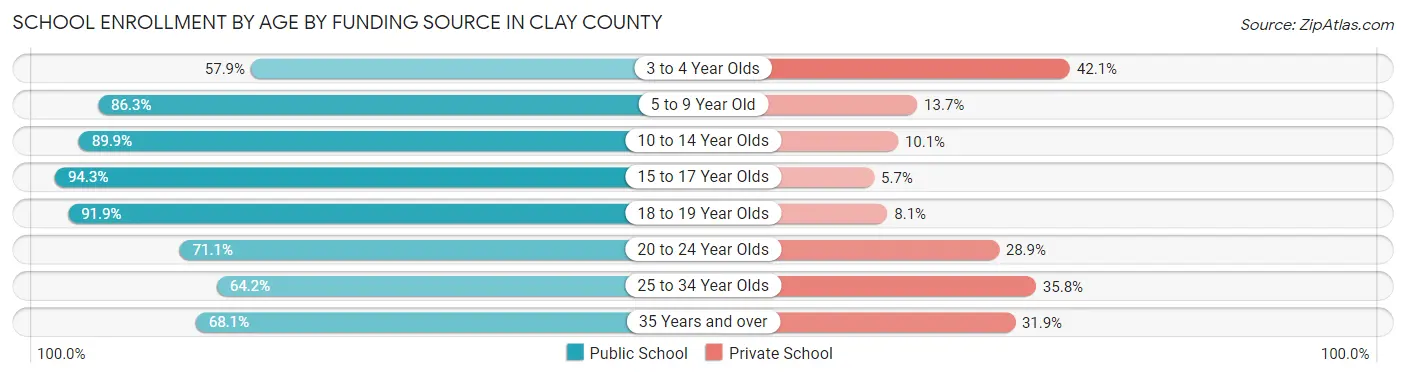
| Age Bracket | Public School | Private School |
| 3 to 4 Year Olds | 1,424 (57.9%) | 1,037 (42.1%) |
| 5 to 9 Year Old | 13,230 (86.3%) | 2,099 (13.7%) |
| 10 to 14 Year Olds | 15,639 (89.9%) | 1,758 (10.1%) |
| 15 to 17 Year Olds | 9,614 (94.3%) | 578 (5.7%) |
| 18 to 19 Year Olds | 3,492 (91.9%) | 309 (8.1%) |
| 20 to 24 Year Olds | 3,338 (71.1%) | 1,356 (28.9%) |
| 25 to 34 Year Olds | 2,427 (64.2%) | 1,354 (35.8%) |
| 35 Years and over | 1,960 (68.1%) | 918 (31.9%) |
| Total | 51,150 (84.5%) | 9,383 (15.5%) |
Educational Attainment by Field of Study in Clay County
Business (14,976 | 22.8%), education (8,841 | 13.4%), science & technology (8,160 | 12.4%), arts & humanities (4,916 | 7.5%), and psychology (3,545 | 5.4%) are the most common fields of study among 65,822 individuals in Clay County who have obtained a bachelor's degree or higher.
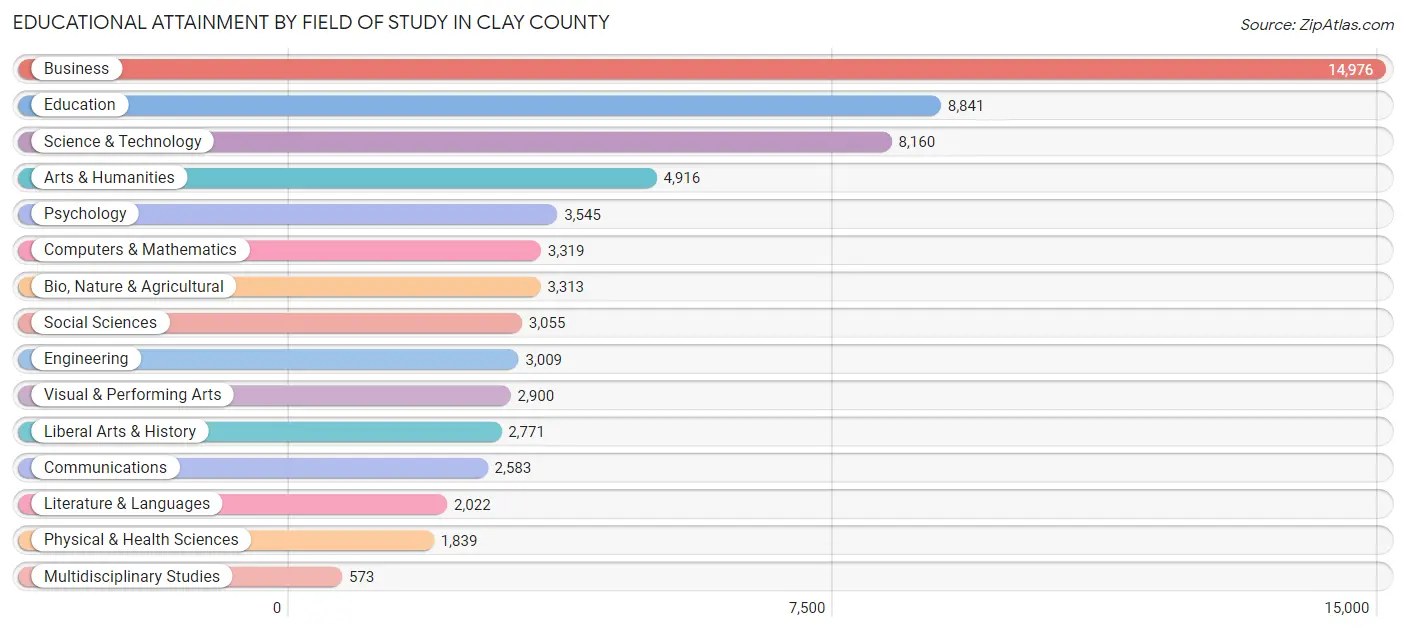
| Field of Study | # Graduates | % Graduates |
| Computers & Mathematics | 3,319 | 5.0% |
| Bio, Nature & Agricultural | 3,313 | 5.0% |
| Physical & Health Sciences | 1,839 | 2.8% |
| Psychology | 3,545 | 5.4% |
| Social Sciences | 3,055 | 4.6% |
| Engineering | 3,009 | 4.6% |
| Multidisciplinary Studies | 573 | 0.9% |
| Science & Technology | 8,160 | 12.4% |
| Business | 14,976 | 22.8% |
| Education | 8,841 | 13.4% |
| Literature & Languages | 2,022 | 3.1% |
| Liberal Arts & History | 2,771 | 4.2% |
| Visual & Performing Arts | 2,900 | 4.4% |
| Communications | 2,583 | 3.9% |
| Arts & Humanities | 4,916 | 7.5% |
| Total | 65,822 | 100.0% |
Transportation & Commute in Clay County
Vehicle Availability by Sex in Clay County
The most prevalent vehicle ownership categories in Clay County are males with 2 vehicles (30,528, accounting for 44.0%) and females with 2 vehicles (26,265, making up 49.1%).
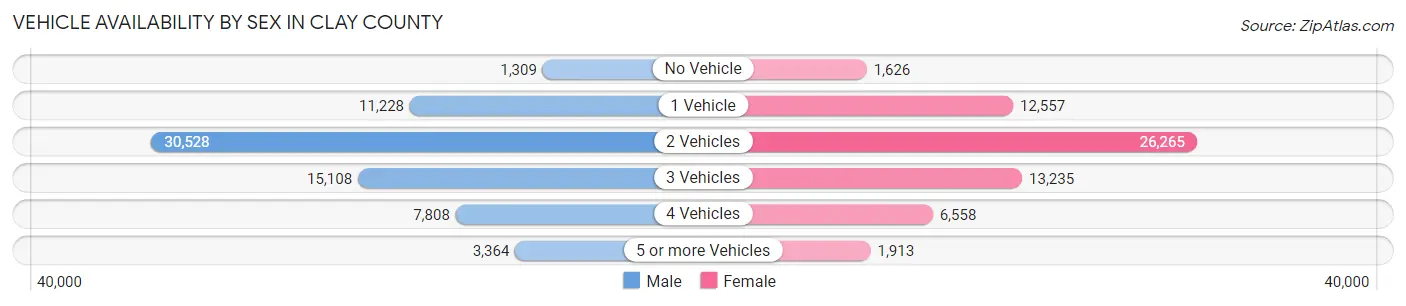
| Vehicles Available | Male | Female |
| No Vehicle | 1,309 (1.9%) | 1,626 (2.6%) |
| 1 Vehicle | 11,228 (16.2%) | 12,557 (20.2%) |
| 2 Vehicles | 30,528 (44.0%) | 26,265 (42.3%) |
| 3 Vehicles | 15,108 (21.8%) | 13,235 (21.3%) |
| 4 Vehicles | 7,808 (11.3%) | 6,558 (10.5%) |
| 5 or more Vehicles | 3,364 (4.9%) | 1,913 (3.1%) |
| Total | 69,345 (100.0%) | 62,154 (100.0%) |
Commute Time in Clay County
The most frequently occuring commute durations in Clay County are 15 to 19 minutes (23,188 commuters, 19.9%), 20 to 24 minutes (19,387 commuters, 16.6%), and 10 to 14 minutes (14,390 commuters, 12.3%).
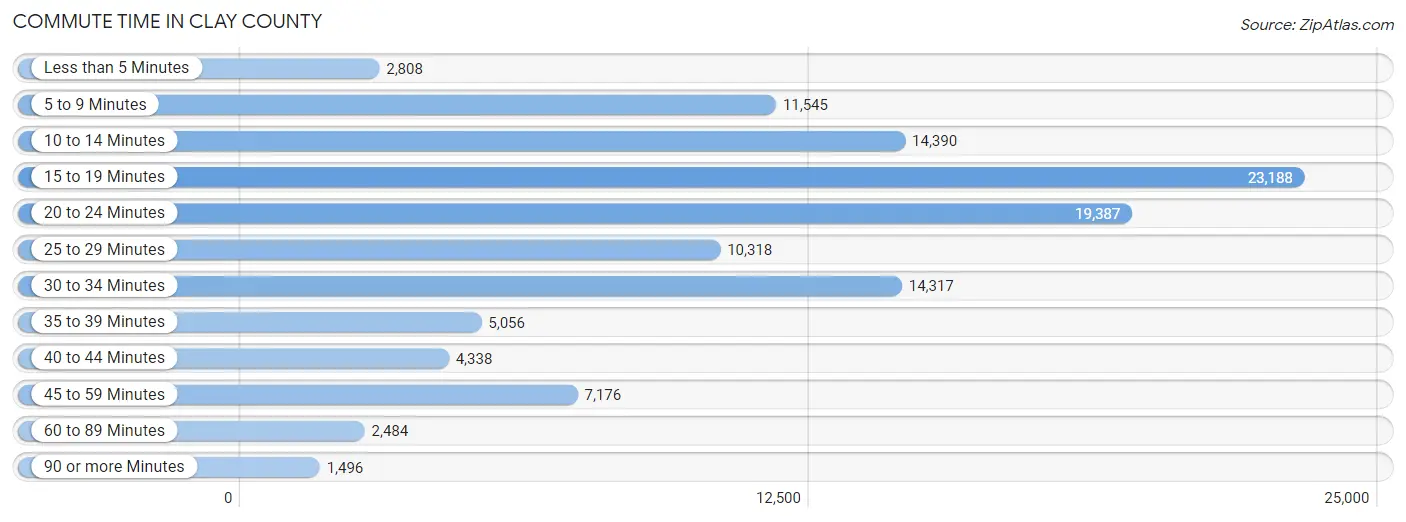
| Commute Time | # Commuters | % Commuters |
| Less than 5 Minutes | 2,808 | 2.4% |
| 5 to 9 Minutes | 11,545 | 9.9% |
| 10 to 14 Minutes | 14,390 | 12.3% |
| 15 to 19 Minutes | 23,188 | 19.9% |
| 20 to 24 Minutes | 19,387 | 16.6% |
| 25 to 29 Minutes | 10,318 | 8.9% |
| 30 to 34 Minutes | 14,317 | 12.3% |
| 35 to 39 Minutes | 5,056 | 4.3% |
| 40 to 44 Minutes | 4,338 | 3.7% |
| 45 to 59 Minutes | 7,176 | 6.2% |
| 60 to 89 Minutes | 2,484 | 2.1% |
| 90 or more Minutes | 1,496 | 1.3% |
Commute Time by Sex in Clay County
The most common commute times in Clay County are 15 to 19 minutes (11,838 commuters, 19.1%) for males and 15 to 19 minutes (11,350 commuters, 20.8%) for females.
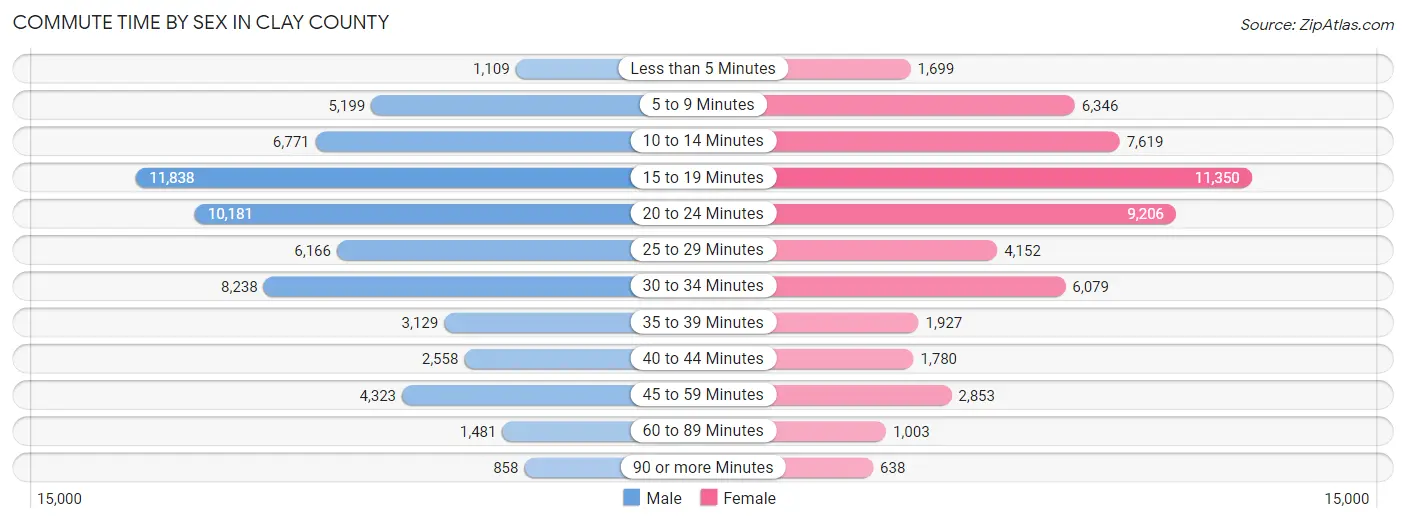
| Commute Time | Male | Female |
| Less than 5 Minutes | 1,109 (1.8%) | 1,699 (3.1%) |
| 5 to 9 Minutes | 5,199 (8.4%) | 6,346 (11.6%) |
| 10 to 14 Minutes | 6,771 (11.0%) | 7,619 (13.9%) |
| 15 to 19 Minutes | 11,838 (19.1%) | 11,350 (20.8%) |
| 20 to 24 Minutes | 10,181 (16.5%) | 9,206 (16.8%) |
| 25 to 29 Minutes | 6,166 (10.0%) | 4,152 (7.6%) |
| 30 to 34 Minutes | 8,238 (13.3%) | 6,079 (11.1%) |
| 35 to 39 Minutes | 3,129 (5.1%) | 1,927 (3.5%) |
| 40 to 44 Minutes | 2,558 (4.1%) | 1,780 (3.3%) |
| 45 to 59 Minutes | 4,323 (7.0%) | 2,853 (5.2%) |
| 60 to 89 Minutes | 1,481 (2.4%) | 1,003 (1.8%) |
| 90 or more Minutes | 858 (1.4%) | 638 (1.2%) |
Time of Departure to Work by Sex in Clay County
The most frequent times of departure to work in Clay County are 7:00 AM to 7:29 AM (9,135, 14.8%) for males and 7:30 AM to 7:59 AM (8,587, 15.7%) for females.
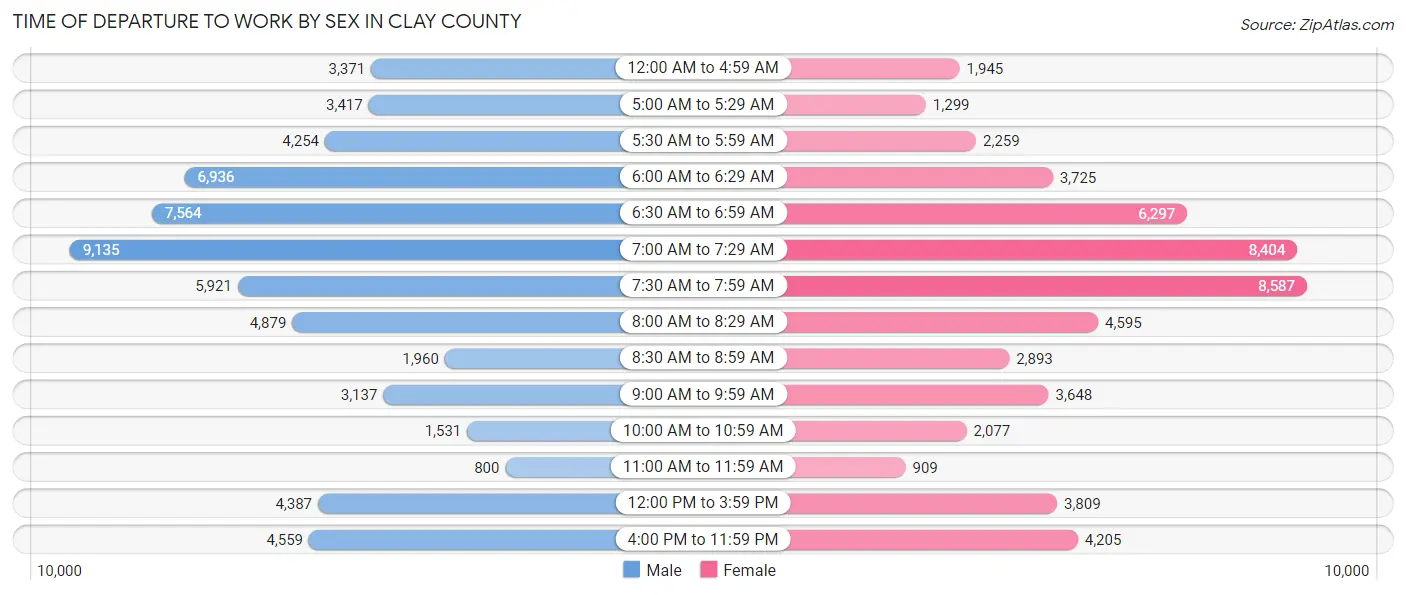
| Time of Departure | Male | Female |
| 12:00 AM to 4:59 AM | 3,371 (5.4%) | 1,945 (3.6%) |
| 5:00 AM to 5:29 AM | 3,417 (5.5%) | 1,299 (2.4%) |
| 5:30 AM to 5:59 AM | 4,254 (6.9%) | 2,259 (4.1%) |
| 6:00 AM to 6:29 AM | 6,936 (11.2%) | 3,725 (6.8%) |
| 6:30 AM to 6:59 AM | 7,564 (12.2%) | 6,297 (11.5%) |
| 7:00 AM to 7:29 AM | 9,135 (14.8%) | 8,404 (15.4%) |
| 7:30 AM to 7:59 AM | 5,921 (9.6%) | 8,587 (15.7%) |
| 8:00 AM to 8:29 AM | 4,879 (7.9%) | 4,595 (8.4%) |
| 8:30 AM to 8:59 AM | 1,960 (3.2%) | 2,893 (5.3%) |
| 9:00 AM to 9:59 AM | 3,137 (5.1%) | 3,648 (6.7%) |
| 10:00 AM to 10:59 AM | 1,531 (2.5%) | 2,077 (3.8%) |
| 11:00 AM to 11:59 AM | 800 (1.3%) | 909 (1.7%) |
| 12:00 PM to 3:59 PM | 4,387 (7.1%) | 3,809 (7.0%) |
| 4:00 PM to 11:59 PM | 4,559 (7.4%) | 4,205 (7.7%) |
| Total | 61,851 (100.0%) | 54,652 (100.0%) |
Housing Occupancy in Clay County
Occupancy by Ownership in Clay County
Of the total 99,501 dwellings in Clay County, owner-occupied units account for 67,850 (68.2%), while renter-occupied units make up 31,651 (31.8%).
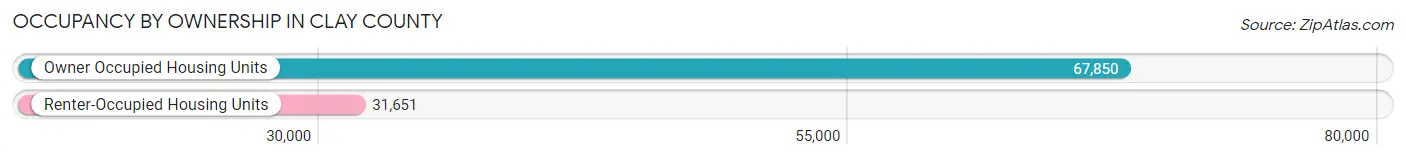
| Occupancy | # Housing Units | % Housing Units |
| Owner Occupied Housing Units | 67,850 | 68.2% |
| Renter-Occupied Housing Units | 31,651 | 31.8% |
| Total Occupied Housing Units | 99,501 | 100.0% |
Occupancy by Household Size in Clay County
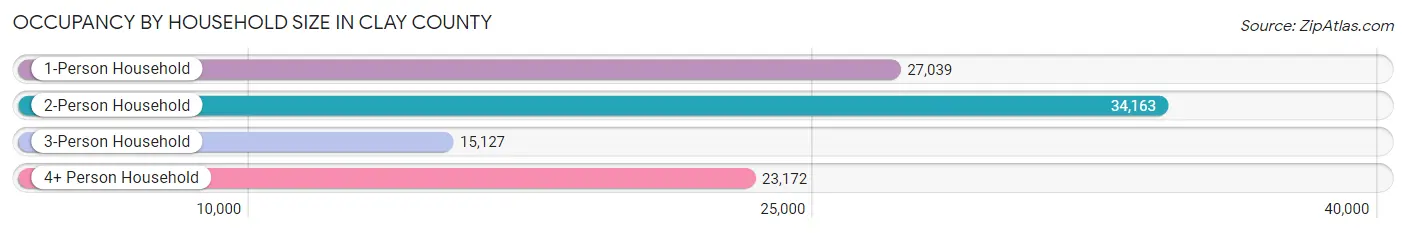
| Household Size | # Housing Units | % Housing Units |
| 1-Person Household | 27,039 | 27.2% |
| 2-Person Household | 34,163 | 34.3% |
| 3-Person Household | 15,127 | 15.2% |
| 4+ Person Household | 23,172 | 23.3% |
| Total Housing Units | 99,501 | 100.0% |
Occupancy by Ownership by Household Size in Clay County
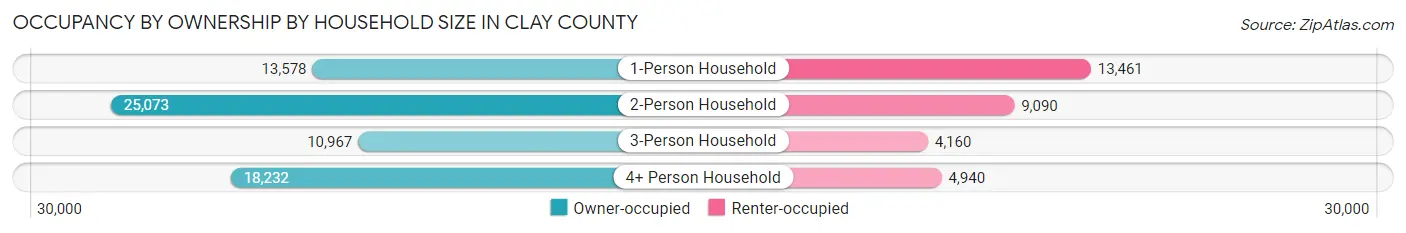
| Household Size | Owner-occupied | Renter-occupied |
| 1-Person Household | 13,578 (50.2%) | 13,461 (49.8%) |
| 2-Person Household | 25,073 (73.4%) | 9,090 (26.6%) |
| 3-Person Household | 10,967 (72.5%) | 4,160 (27.5%) |
| 4+ Person Household | 18,232 (78.7%) | 4,940 (21.3%) |
| Total Housing Units | 67,850 (68.2%) | 31,651 (31.8%) |
Occupancy by Educational Attainment in Clay County
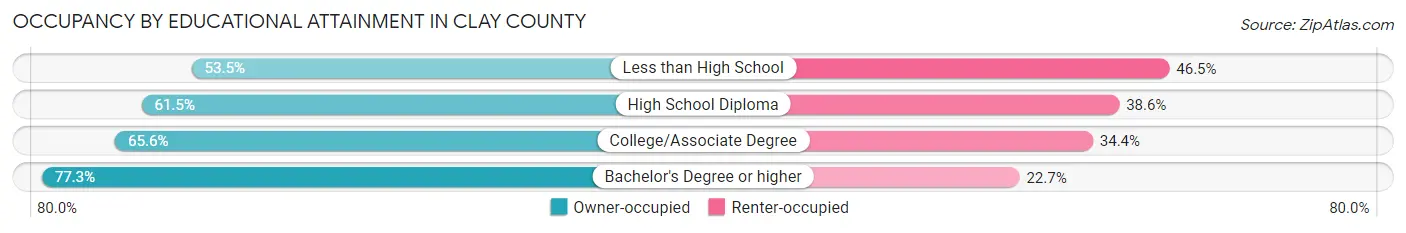
| Household Size | Owner-occupied | Renter-occupied |
| Less than High School | 2,846 (53.5%) | 2,474 (46.5%) |
| High School Diploma | 15,002 (61.5%) | 9,412 (38.6%) |
| College/Associate Degree | 22,020 (65.6%) | 11,534 (34.4%) |
| Bachelor's Degree or higher | 27,982 (77.3%) | 8,231 (22.7%) |
Occupancy by Age of Householder in Clay County
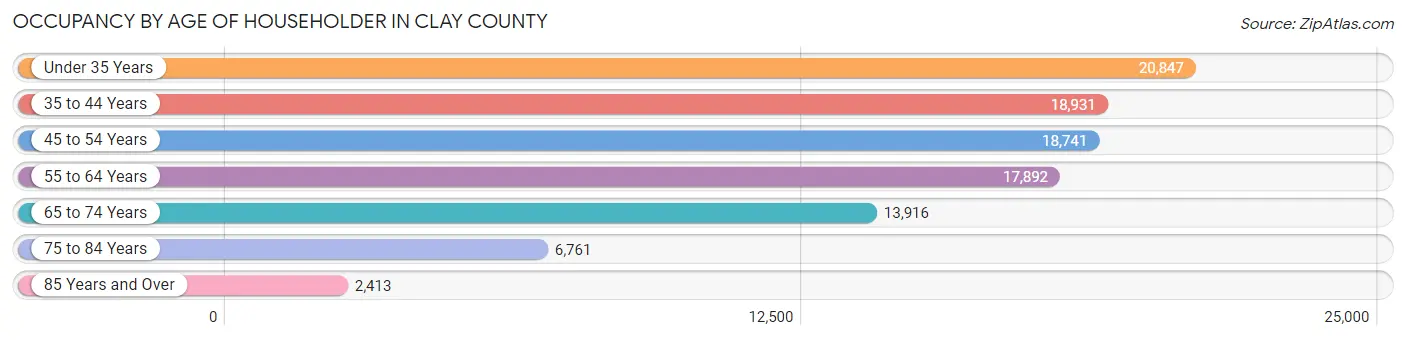
| Age Bracket | # Households | % Households |
| Under 35 Years | 20,847 | 20.9% |
| 35 to 44 Years | 18,931 | 19.0% |
| 45 to 54 Years | 18,741 | 18.8% |
| 55 to 64 Years | 17,892 | 18.0% |
| 65 to 74 Years | 13,916 | 14.0% |
| 75 to 84 Years | 6,761 | 6.8% |
| 85 Years and Over | 2,413 | 2.4% |
| Total | 99,501 | 100.0% |
Housing Finances in Clay County
Median Income by Occupancy in Clay County
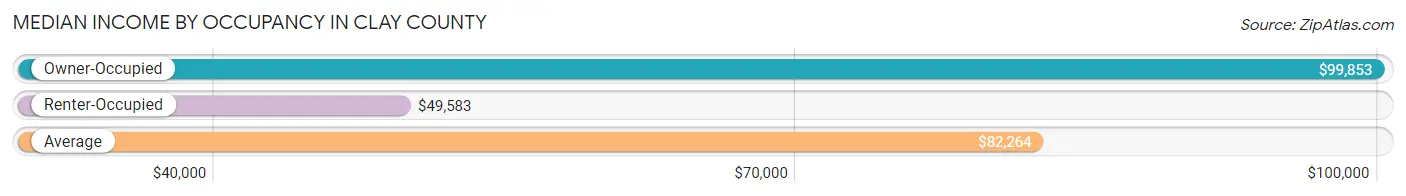
| Occupancy Type | # Households | Median Income |
| Owner-Occupied | 67,850 (68.2%) | $99,853 |
| Renter-Occupied | 31,651 (31.8%) | $49,583 |
| Average | 99,501 (100.0%) | $82,264 |
Occupancy by Householder Income Bracket in Clay County
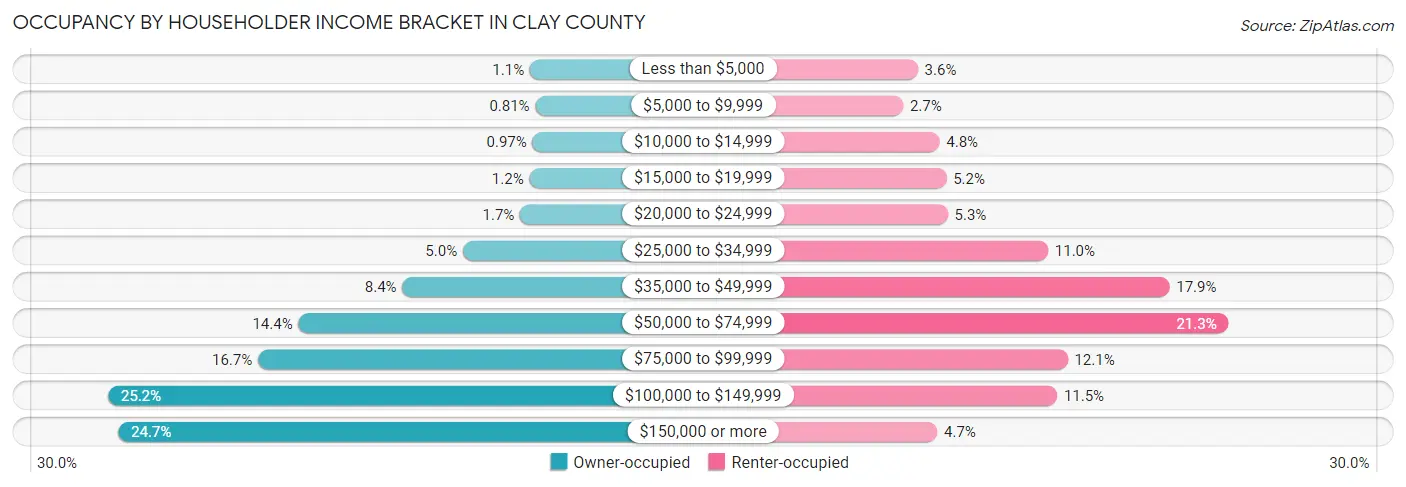
| Income Bracket | Owner-occupied | Renter-occupied |
| Less than $5,000 | 757 (1.1%) | 1,125 (3.5%) |
| $5,000 to $9,999 | 547 (0.8%) | 859 (2.7%) |
| $10,000 to $14,999 | 658 (1.0%) | 1,515 (4.8%) |
| $15,000 to $19,999 | 778 (1.1%) | 1,639 (5.2%) |
| $20,000 to $24,999 | 1,138 (1.7%) | 1,664 (5.3%) |
| $25,000 to $34,999 | 3,361 (5.0%) | 3,478 (11.0%) |
| $35,000 to $49,999 | 5,706 (8.4%) | 5,676 (17.9%) |
| $50,000 to $74,999 | 9,738 (14.3%) | 6,744 (21.3%) |
| $75,000 to $99,999 | 11,307 (16.7%) | 3,833 (12.1%) |
| $100,000 to $149,999 | 17,125 (25.2%) | 3,642 (11.5%) |
| $150,000 or more | 16,735 (24.7%) | 1,476 (4.7%) |
| Total | 67,850 (100.0%) | 31,651 (100.0%) |
Monthly Housing Cost Tiers in Clay County
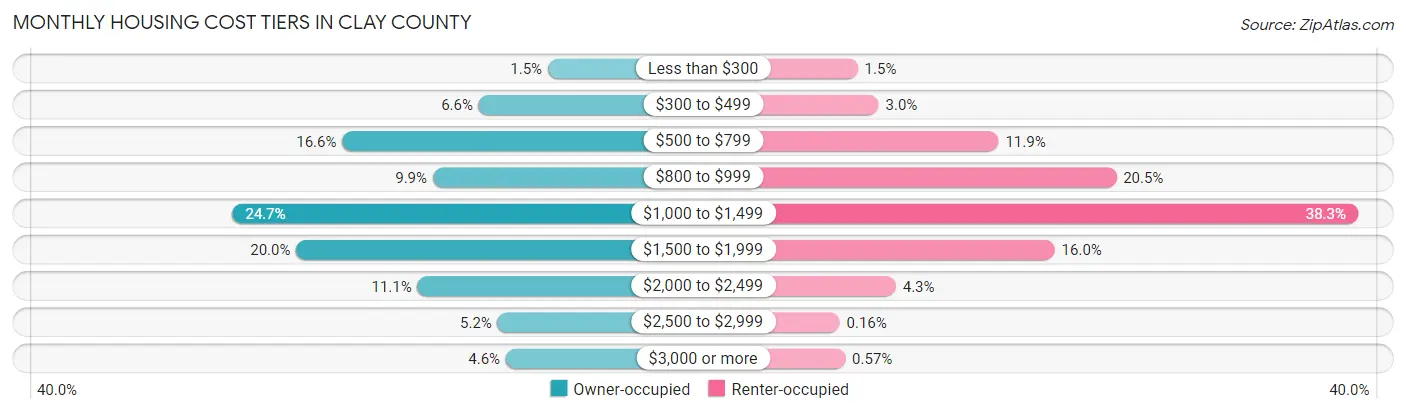
| Monthly Cost | Owner-occupied | Renter-occupied |
| Less than $300 | 990 (1.5%) | 472 (1.5%) |
| $300 to $499 | 4,447 (6.6%) | 960 (3.0%) |
| $500 to $799 | 11,260 (16.6%) | 3,753 (11.9%) |
| $800 to $999 | 6,737 (9.9%) | 6,499 (20.5%) |
| $1,000 to $1,499 | 16,762 (24.7%) | 12,129 (38.3%) |
| $1,500 to $1,999 | 13,560 (20.0%) | 5,065 (16.0%) |
| $2,000 to $2,499 | 7,505 (11.1%) | 1,362 (4.3%) |
| $2,500 to $2,999 | 3,501 (5.2%) | 52 (0.2%) |
| $3,000 or more | 3,088 (4.5%) | 180 (0.6%) |
| Total | 67,850 (100.0%) | 31,651 (100.0%) |
Physical Housing Characteristics in Clay County
Housing Structures in Clay County
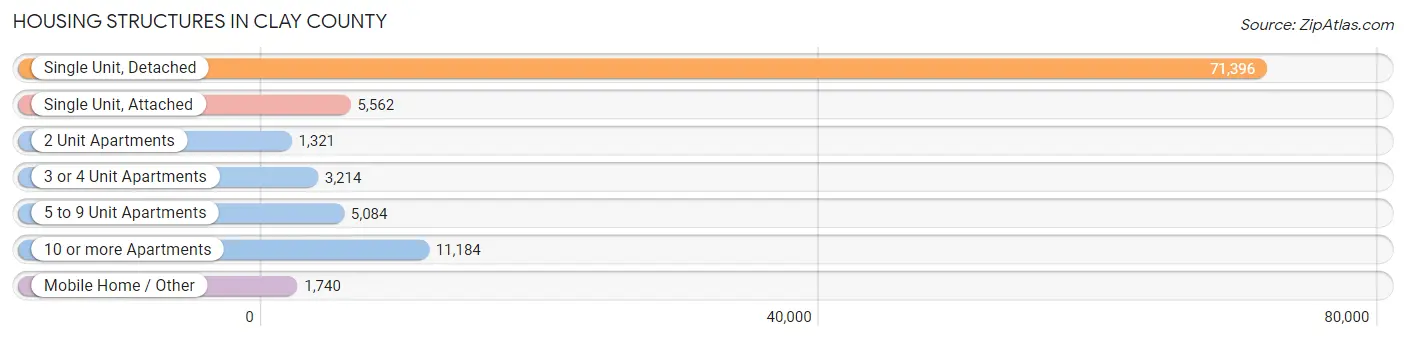
| Structure Type | # Housing Units | % Housing Units |
| Single Unit, Detached | 71,396 | 71.8% |
| Single Unit, Attached | 5,562 | 5.6% |
| 2 Unit Apartments | 1,321 | 1.3% |
| 3 or 4 Unit Apartments | 3,214 | 3.2% |
| 5 to 9 Unit Apartments | 5,084 | 5.1% |
| 10 or more Apartments | 11,184 | 11.2% |
| Mobile Home / Other | 1,740 | 1.8% |
| Total | 99,501 | 100.0% |
Housing Structures by Occupancy in Clay County
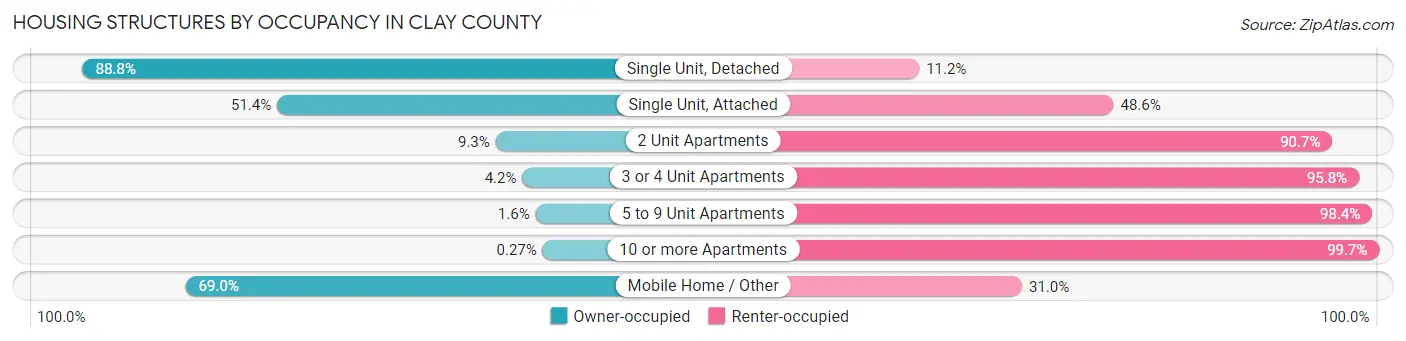
| Structure Type | Owner-occupied | Renter-occupied |
| Single Unit, Detached | 63,420 (88.8%) | 7,976 (11.2%) |
| Single Unit, Attached | 2,859 (51.4%) | 2,703 (48.6%) |
| 2 Unit Apartments | 123 (9.3%) | 1,198 (90.7%) |
| 3 or 4 Unit Apartments | 134 (4.2%) | 3,080 (95.8%) |
| 5 to 9 Unit Apartments | 83 (1.6%) | 5,001 (98.4%) |
| 10 or more Apartments | 30 (0.3%) | 11,154 (99.7%) |
| Mobile Home / Other | 1,201 (69.0%) | 539 (31.0%) |
| Total | 67,850 (68.2%) | 31,651 (31.8%) |
Housing Structures by Number of Rooms in Clay County
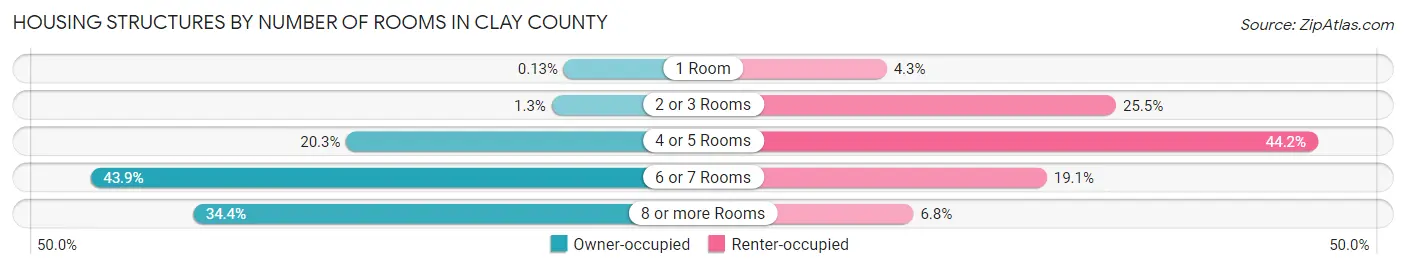
| Number of Rooms | Owner-occupied | Renter-occupied |
| 1 Room | 91 (0.1%) | 1,370 (4.3%) |
| 2 or 3 Rooms | 848 (1.3%) | 8,084 (25.5%) |
| 4 or 5 Rooms | 13,743 (20.3%) | 13,991 (44.2%) |
| 6 or 7 Rooms | 29,801 (43.9%) | 6,054 (19.1%) |
| 8 or more Rooms | 23,367 (34.4%) | 2,152 (6.8%) |
| Total | 67,850 (100.0%) | 31,651 (100.0%) |
Housing Structure by Heating Type in Clay County
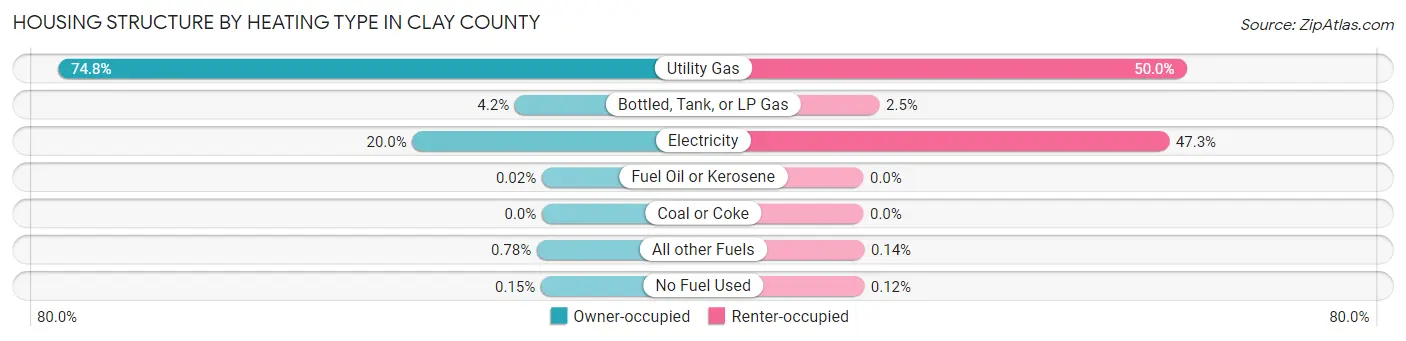
| Heating Type | Owner-occupied | Renter-occupied |
| Utility Gas | 50,774 (74.8%) | 15,817 (50.0%) |
| Bottled, Tank, or LP Gas | 2,846 (4.2%) | 786 (2.5%) |
| Electricity | 13,589 (20.0%) | 14,966 (47.3%) |
| Fuel Oil or Kerosene | 13 (0.0%) | 0 (0.0%) |
| Coal or Coke | 0 (0.0%) | 0 (0.0%) |
| All other Fuels | 526 (0.8%) | 45 (0.1%) |
| No Fuel Used | 102 (0.2%) | 37 (0.1%) |
| Total | 67,850 (100.0%) | 31,651 (100.0%) |
Household Vehicle Usage in Clay County
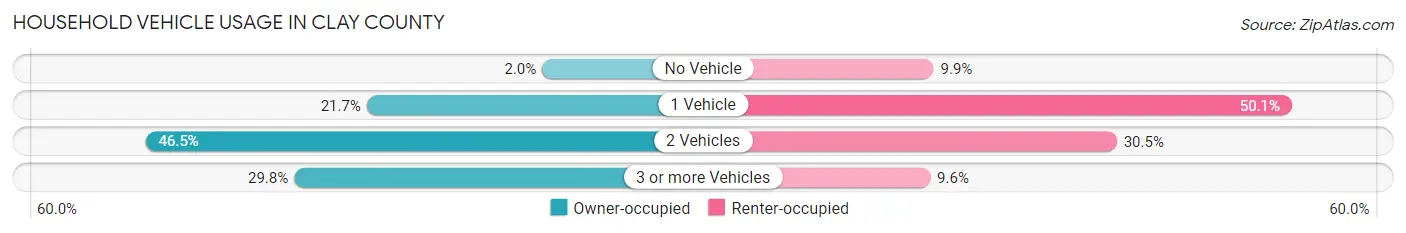
| Vehicles per Household | Owner-occupied | Renter-occupied |
| No Vehicle | 1,378 (2.0%) | 3,144 (9.9%) |
| 1 Vehicle | 14,712 (21.7%) | 15,846 (50.1%) |
| 2 Vehicles | 31,525 (46.5%) | 9,638 (30.4%) |
| 3 or more Vehicles | 20,235 (29.8%) | 3,023 (9.6%) |
| Total | 67,850 (100.0%) | 31,651 (100.0%) |
Real Estate & Mortgages in Clay County
Real Estate and Mortgage Overview in Clay County
| Characteristic | Without Mortgage | With Mortgage |
| Housing Units | 20,356 | 47,494 |
| Median Property Value | $216,800 | $245,500 |
| Median Household Income | $73,948 | $13,964 |
| Monthly Housing Costs | $628 | $3,062 |
| Real Estate Taxes | $2,566 | $944 |
Property Value by Mortgage Status in Clay County
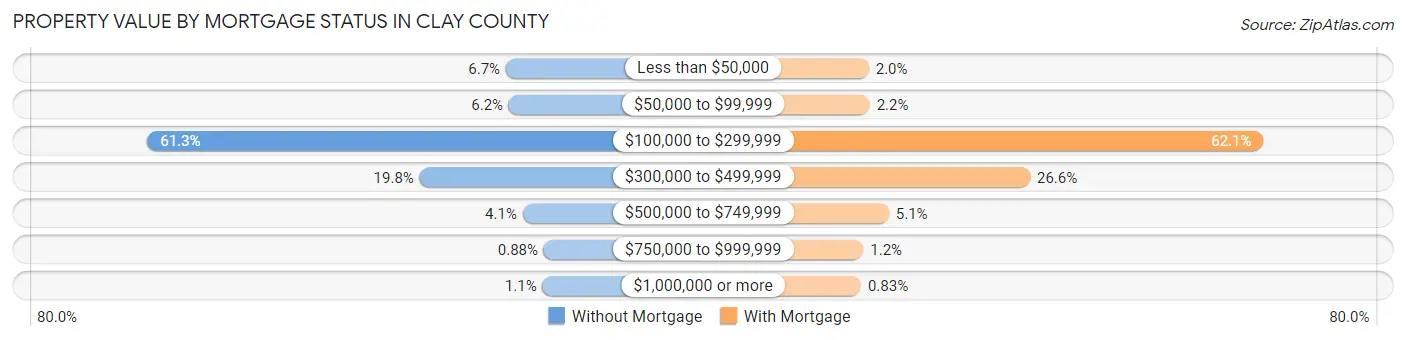
| Property Value | Without Mortgage | With Mortgage |
| Less than $50,000 | 1,355 (6.7%) | 959 (2.0%) |
| $50,000 to $99,999 | 1,263 (6.2%) | 1,027 (2.2%) |
| $100,000 to $299,999 | 12,478 (61.3%) | 29,508 (62.1%) |
| $300,000 to $499,999 | 4,030 (19.8%) | 12,628 (26.6%) |
| $500,000 to $749,999 | 833 (4.1%) | 2,414 (5.1%) |
| $750,000 to $999,999 | 180 (0.9%) | 564 (1.2%) |
| $1,000,000 or more | 217 (1.1%) | 394 (0.8%) |
| Total | 20,356 (100.0%) | 47,494 (100.0%) |
Household Income by Mortgage Status in Clay County
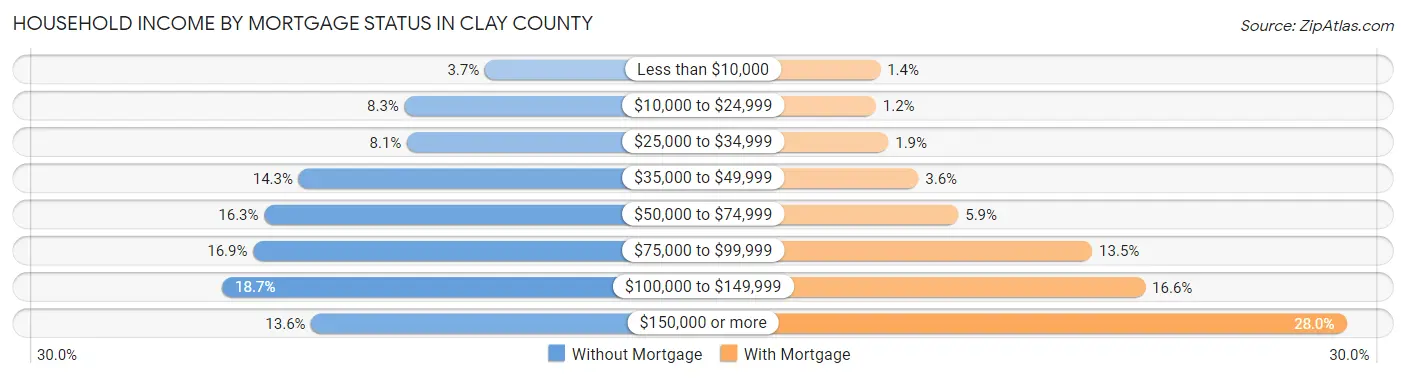
| Household Income | Without Mortgage | With Mortgage |
| Less than $10,000 | 752 (3.7%) | 672 (1.4%) |
| $10,000 to $24,999 | 1,685 (8.3%) | 552 (1.2%) |
| $25,000 to $34,999 | 1,657 (8.1%) | 889 (1.9%) |
| $35,000 to $49,999 | 2,917 (14.3%) | 1,704 (3.6%) |
| $50,000 to $74,999 | 3,318 (16.3%) | 2,789 (5.9%) |
| $75,000 to $99,999 | 3,447 (16.9%) | 6,420 (13.5%) |
| $100,000 to $149,999 | 3,809 (18.7%) | 7,860 (16.6%) |
| $150,000 or more | 2,771 (13.6%) | 13,316 (28.0%) |
| Total | 20,356 (100.0%) | 47,494 (100.0%) |
Property Value to Household Income Ratio in Clay County
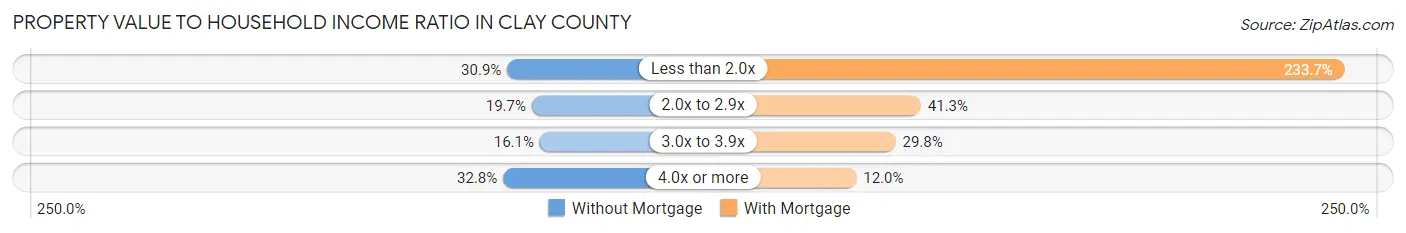
| Value-to-Income Ratio | Without Mortgage | With Mortgage |
| Less than 2.0x | 6,290 (30.9%) | 110,984 (233.7%) |
| 2.0x to 2.9x | 4,015 (19.7%) | 19,605 (41.3%) |
| 3.0x to 3.9x | 3,271 (16.1%) | 14,160 (29.8%) |
| 4.0x or more | 6,669 (32.8%) | 5,678 (12.0%) |
| Total | 20,356 (100.0%) | 47,494 (100.0%) |
Real Estate Taxes by Mortgage Status in Clay County
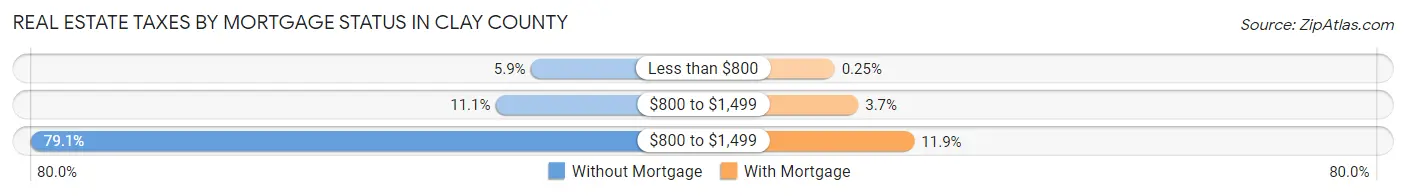
| Property Taxes | Without Mortgage | With Mortgage |
| Less than $800 | 1,210 (5.9%) | 121 (0.3%) |
| $800 to $1,499 | 2,256 (11.1%) | 1,754 (3.7%) |
| $800 to $1,499 | 16,096 (79.1%) | 5,647 (11.9%) |
| Total | 20,356 (100.0%) | 47,494 (100.0%) |
Health & Disability in Clay County
Health Insurance Coverage by Age in Clay County
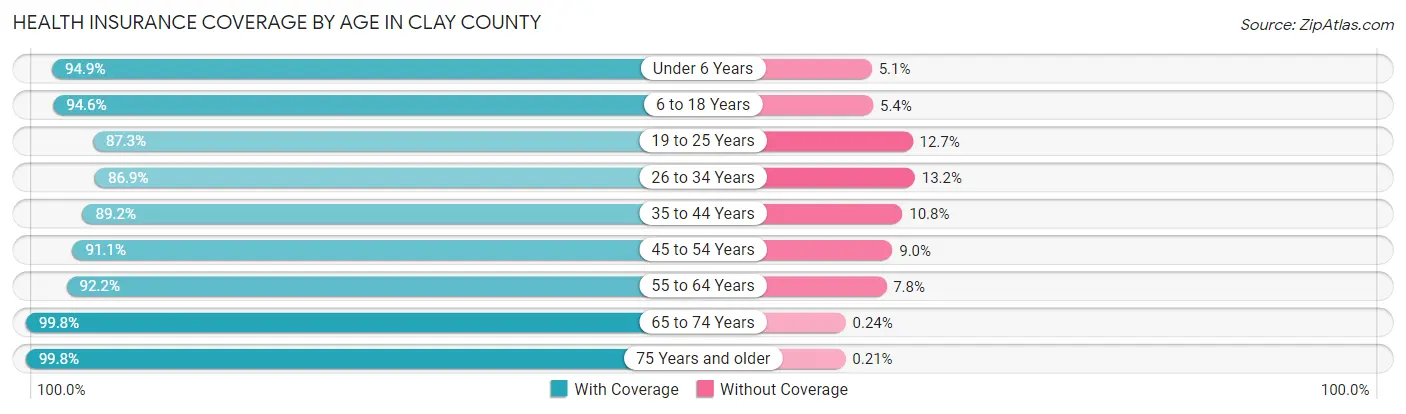
| Age Bracket | With Coverage | Without Coverage |
| Under 6 Years | 17,535 (94.9%) | 947 (5.1%) |
| 6 to 18 Years | 42,438 (94.6%) | 2,403 (5.4%) |
| 19 to 25 Years | 17,704 (87.3%) | 2,581 (12.7%) |
| 26 to 34 Years | 28,701 (86.9%) | 4,347 (13.2%) |
| 35 to 44 Years | 31,670 (89.2%) | 3,841 (10.8%) |
| 45 to 54 Years | 29,304 (91.0%) | 2,879 (8.9%) |
| 55 to 64 Years | 28,381 (92.2%) | 2,409 (7.8%) |
| 65 to 74 Years | 22,044 (99.8%) | 54 (0.2%) |
| 75 Years and older | 14,197 (99.8%) | 30 (0.2%) |
| Total | 231,974 (92.2%) | 19,491 (7.7%) |
Health Insurance Coverage by Citizenship Status in Clay County
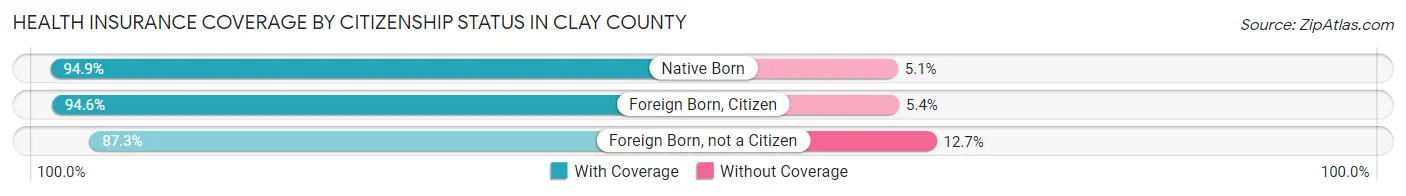
| Citizenship Status | With Coverage | Without Coverage |
| Native Born | 17,535 (94.9%) | 947 (5.1%) |
| Foreign Born, Citizen | 42,438 (94.6%) | 2,403 (5.4%) |
| Foreign Born, not a Citizen | 17,704 (87.3%) | 2,581 (12.7%) |
Health Insurance Coverage by Household Income in Clay County
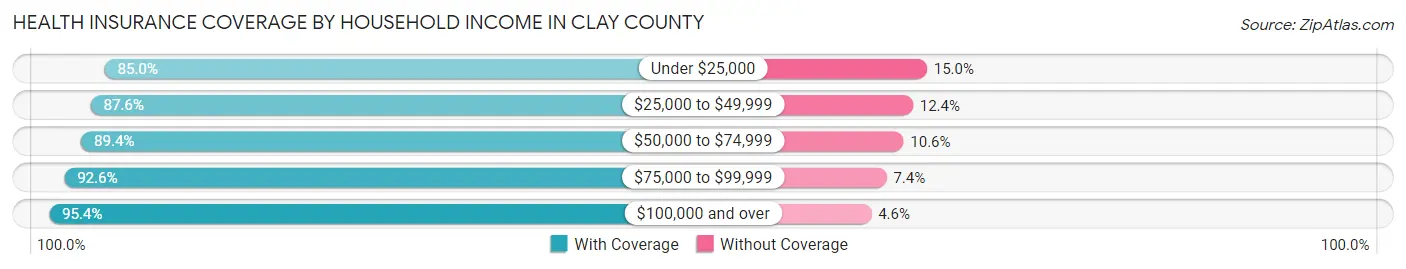
| Household Income | With Coverage | Without Coverage |
| Under $25,000 | 14,955 (85.0%) | 2,638 (15.0%) |
| $25,000 to $49,999 | 29,578 (87.6%) | 4,173 (12.4%) |
| $50,000 to $74,999 | 33,671 (89.4%) | 3,994 (10.6%) |
| $75,000 to $99,999 | 36,311 (92.6%) | 2,915 (7.4%) |
| $100,000 and over | 116,269 (95.4%) | 5,585 (4.6%) |
Public vs Private Health Insurance Coverage by Age in Clay County
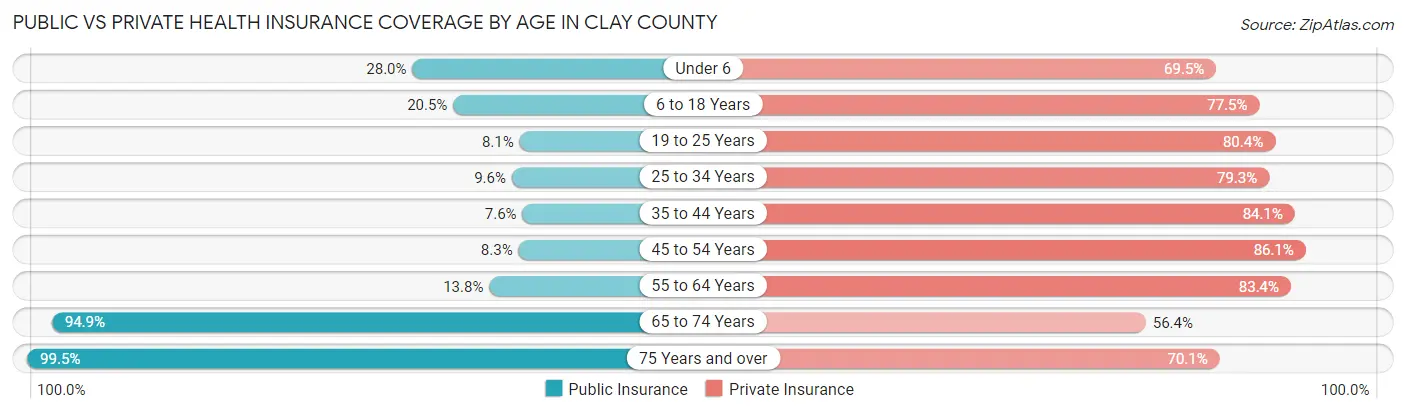
| Age Bracket | Public Insurance | Private Insurance |
| Under 6 | 5,178 (28.0%) | 12,841 (69.5%) |
| 6 to 18 Years | 9,172 (20.4%) | 34,741 (77.5%) |
| 19 to 25 Years | 1,649 (8.1%) | 16,310 (80.4%) |
| 25 to 34 Years | 3,163 (9.6%) | 26,205 (79.3%) |
| 35 to 44 Years | 2,698 (7.6%) | 29,854 (84.1%) |
| 45 to 54 Years | 2,682 (8.3%) | 27,709 (86.1%) |
| 55 to 64 Years | 4,237 (13.8%) | 25,662 (83.4%) |
| 65 to 74 Years | 20,980 (94.9%) | 12,469 (56.4%) |
| 75 Years and over | 14,159 (99.5%) | 9,974 (70.1%) |
| Total | 63,918 (25.4%) | 195,765 (77.8%) |
Disability Status by Sex by Age in Clay County
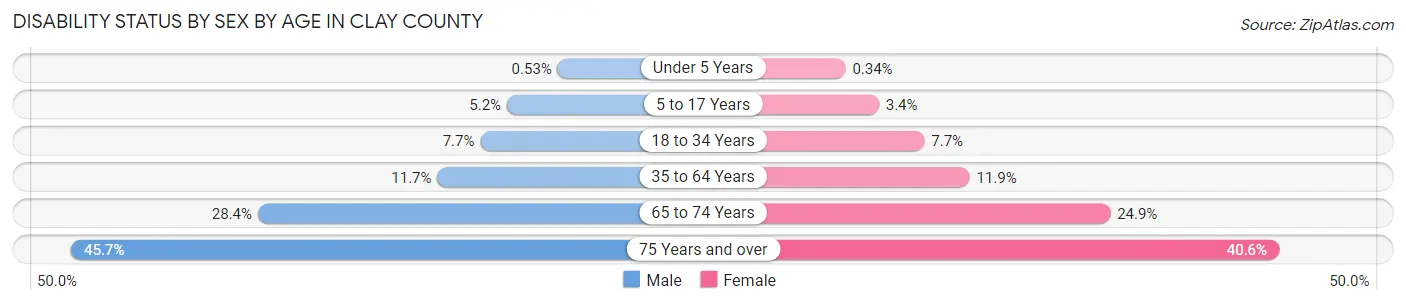
| Age Bracket | Male | Female |
| Under 5 Years | 42 (0.5%) | 26 (0.3%) |
| 5 to 17 Years | 1,195 (5.2%) | 746 (3.4%) |
| 18 to 34 Years | 2,186 (7.7%) | 2,162 (7.7%) |
| 35 to 64 Years | 5,732 (11.7%) | 5,869 (11.9%) |
| 65 to 74 Years | 2,913 (28.4%) | 2,946 (24.9%) |
| 75 Years and over | 2,704 (45.7%) | 3,369 (40.6%) |
Disability Class by Sex by Age in Clay County
Disability Class: Hearing Difficulty
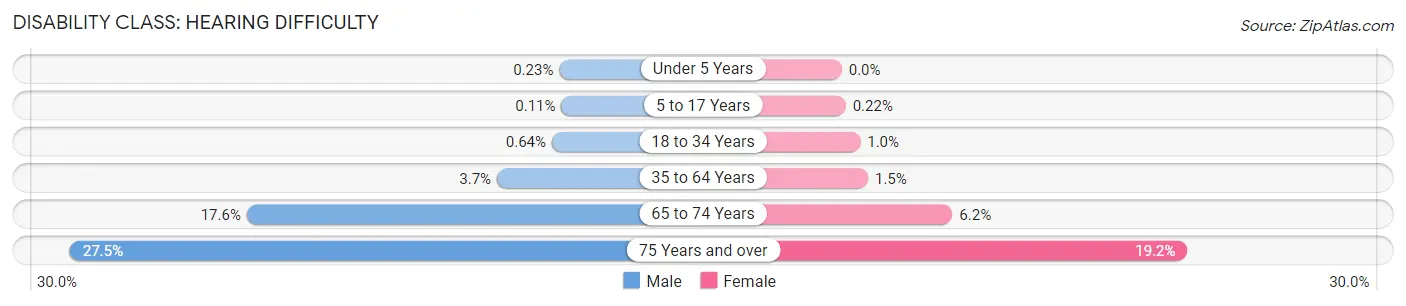
| Age Bracket | Male | Female |
| Under 5 Years | 18 (0.2%) | 0 (0.0%) |
| 5 to 17 Years | 26 (0.1%) | 47 (0.2%) |
| 18 to 34 Years | 182 (0.6%) | 291 (1.0%) |
| 35 to 64 Years | 1,814 (3.7%) | 720 (1.5%) |
| 65 to 74 Years | 1,811 (17.6%) | 729 (6.2%) |
| 75 Years and over | 1,627 (27.5%) | 1,598 (19.2%) |
Disability Class: Vision Difficulty
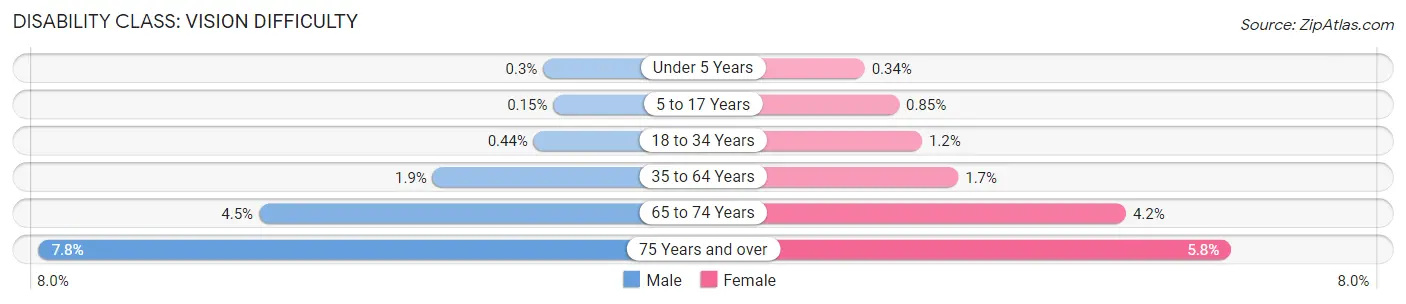
| Age Bracket | Male | Female |
| Under 5 Years | 24 (0.3%) | 26 (0.3%) |
| 5 to 17 Years | 34 (0.2%) | 184 (0.9%) |
| 18 to 34 Years | 126 (0.4%) | 336 (1.2%) |
| 35 to 64 Years | 949 (1.9%) | 856 (1.7%) |
| 65 to 74 Years | 464 (4.5%) | 499 (4.2%) |
| 75 Years and over | 461 (7.8%) | 480 (5.8%) |
Disability Class: Cognitive Difficulty
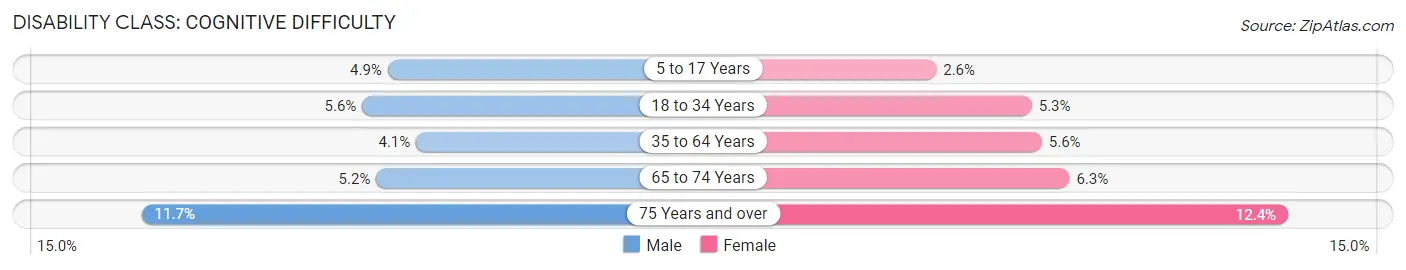
| Age Bracket | Male | Female |
| 5 to 17 Years | 1,116 (4.9%) | 573 (2.6%) |
| 18 to 34 Years | 1,587 (5.6%) | 1,491 (5.3%) |
| 35 to 64 Years | 2,008 (4.1%) | 2,755 (5.6%) |
| 65 to 74 Years | 535 (5.2%) | 750 (6.3%) |
| 75 Years and over | 695 (11.7%) | 1,032 (12.4%) |
Disability Class: Ambulatory Difficulty
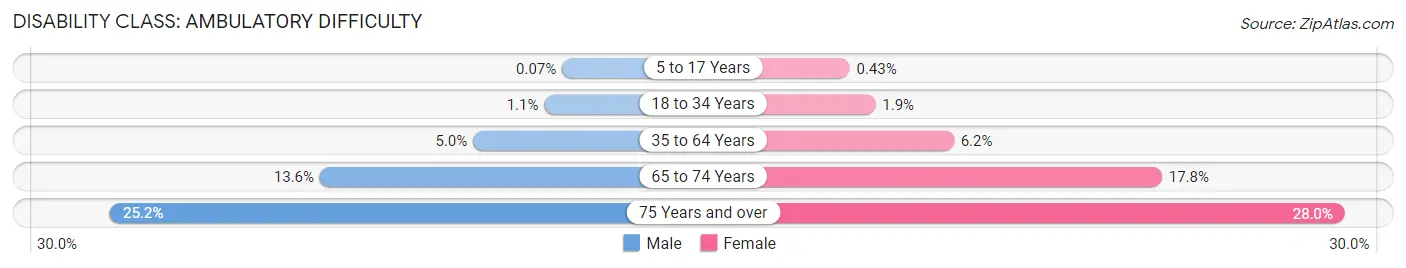
| Age Bracket | Male | Female |
| 5 to 17 Years | 16 (0.1%) | 93 (0.4%) |
| 18 to 34 Years | 300 (1.1%) | 527 (1.9%) |
| 35 to 64 Years | 2,466 (5.0%) | 3,083 (6.2%) |
| 65 to 74 Years | 1,393 (13.6%) | 2,107 (17.8%) |
| 75 Years and over | 1,494 (25.2%) | 2,327 (28.0%) |
Disability Class: Self-Care Difficulty
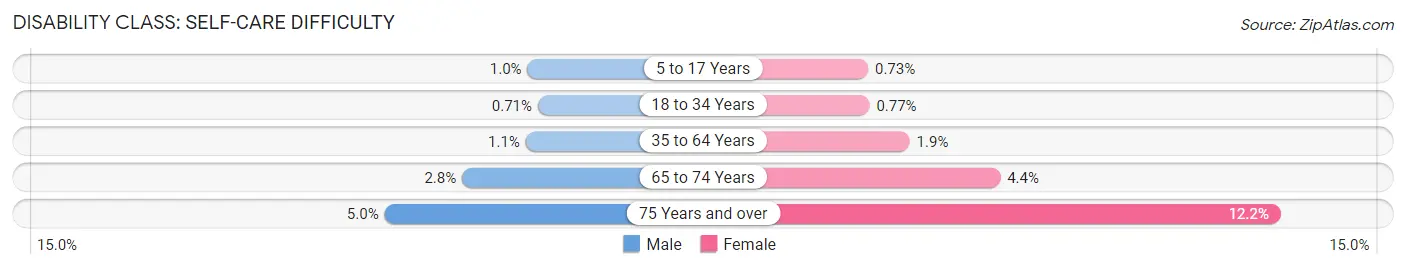
| Age Bracket | Male | Female |
| 5 to 17 Years | 227 (1.0%) | 159 (0.7%) |
| 18 to 34 Years | 202 (0.7%) | 216 (0.8%) |
| 35 to 64 Years | 515 (1.1%) | 935 (1.9%) |
| 65 to 74 Years | 290 (2.8%) | 522 (4.4%) |
| 75 Years and over | 295 (5.0%) | 1,015 (12.2%) |
Technology Access in Clay County
Computing Device Access in Clay County
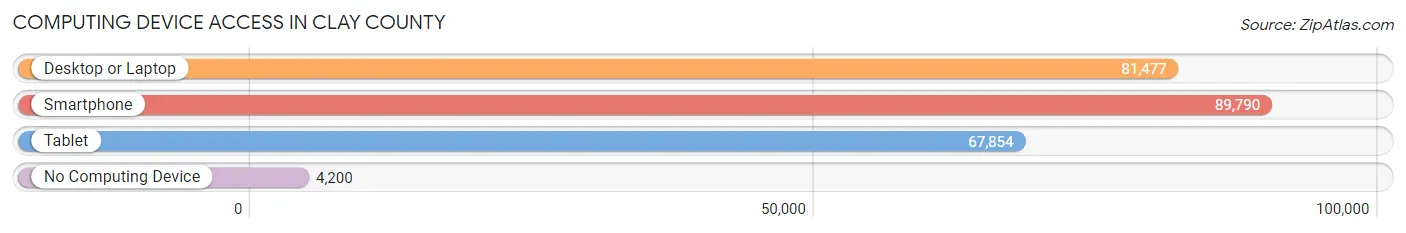
| Device Type | # Households | % Households |
| Desktop or Laptop | 81,477 | 81.9% |
| Smartphone | 89,790 | 90.2% |
| Tablet | 67,854 | 68.2% |
| No Computing Device | 4,200 | 4.2% |
| Total | 99,501 | 100.0% |
Internet Access in Clay County
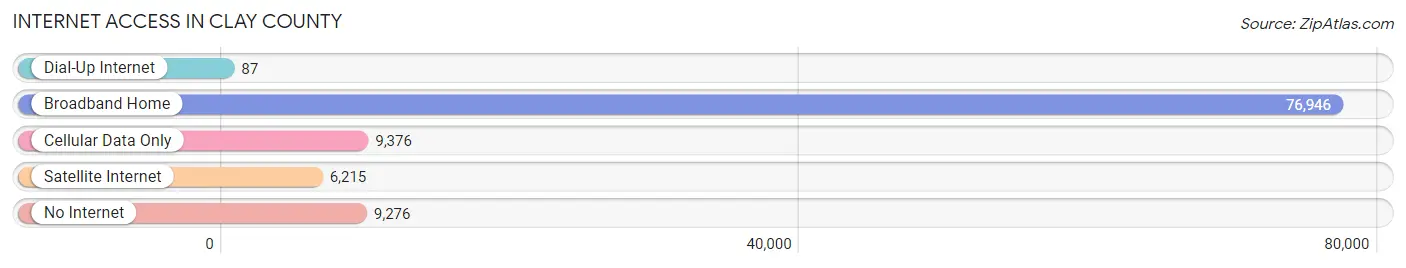
| Internet Type | # Households | % Households |
| Dial-Up Internet | 87 | 0.1% |
| Broadband Home | 76,946 | 77.3% |
| Cellular Data Only | 9,376 | 9.4% |
| Satellite Internet | 6,215 | 6.2% |
| No Internet | 9,276 | 9.3% |
| Total | 99,501 | 100.0% |
Clay County Summary
Clay County, Missouri is located in the northwest corner of the state and is part of the Kansas City metropolitan area. The county was established in 1822 and named after Henry Clay, a prominent statesman from Kentucky. Clay County is home to over 220,000 people and covers an area of 463 square miles.
Geography
Clay County is located in the northwest corner of Missouri and is bordered by Jackson County to the east, Platte County to the north, Ray County to the west, and Cass County to the south. The county is part of the Kansas City metropolitan area and is located in the Missouri River Valley. The county is mostly flat with rolling hills in the northern and western parts. The highest point in the county is located in the northwest corner at an elevation of 1,068 feet. The county is drained by the Missouri River and its tributaries, including the Little Platte, Big Platte, and Grand Rivers.
Economy
Clay County has a diverse economy that is largely driven by the Kansas City metropolitan area. The county is home to several large employers, including Cerner Corporation, Hallmark Cards, and H&R Block. The county is also home to several smaller businesses, including manufacturing, retail, and service industries. The county is also home to several educational institutions, including the University of Missouri-Kansas City, Park University, and Metropolitan Community College.
Demographics
As of the 2010 census, Clay County had a population of 221,939. The population was spread out with a median age of 36.7 years. The racial makeup of the county was 79.2% White, 13.3% African American, 0.7% Native American, 2.2% Asian, 0.1% Pacific Islander, 1.7% from other races, and 2.8% from two or more races. Hispanic or Latino of any race were 4.3% of the population.
The median household income in Clay County was $60,945 and the median family income was $71,945. The per capita income was $29,945. About 8.2% of families and 11.2% of the population were below the poverty line, including 15.2% of those under age 18 and 6.2% of those age 65 or over.
Conclusion
Clay County, Missouri is a diverse and vibrant county located in the northwest corner of the state. The county is part of the Kansas City metropolitan area and is home to over 220,000 people. The county has a diverse economy that is largely driven by the Kansas City metropolitan area and is home to several large employers. The population of the county is diverse, with a median age of 36.7 years and a median household income of $60,945. Clay County is a great place to live, work, and play.
Common Questions
What is Per Capita Income in Clay County?
Per Capita income in Clay County is $40,278.
What is the Median Family Income in Clay County?
Median Family Income in Clay County is $98,881.
What is the Median Household income in Clay County?
Median Household Income in Clay County is $82,264.
What is Income or Wage Gap in Clay County?
Income or Wage Gap in Clay County is 26.8%.
Women in Clay County earn 73.2 cents for every dollar earned by a man.
What is Family Income Deficit in Clay County?
Family Income Deficit in Clay County is $11,025.
Families that are below poverty line in Clay County earn $11,025 less on average than the poverty threshold level.
What is Inequality or Gini Index in Clay County?
Inequality or Gini Index in Clay County is 0.41.
What is the Total Population of Clay County?
Total Population of Clay County is 253,085.
What is the Total Male Population of Clay County?
Total Male Population of Clay County is 125,225.
What is the Total Female Population of Clay County?
Total Female Population of Clay County is 127,860.
What is the Ratio of Males per 100 Females in Clay County?
There are 97.94 Males per 100 Females in Clay County.
What is the Ratio of Females per 100 Males in Clay County?
There are 102.10 Females per 100 Males in Clay County.
What is the Median Population Age in Clay County?
Median Population Age in Clay County is 37.5 Years.
What is the Average Family Size in Clay County
Average Family Size in Clay County is 3.1 People.
What is the Average Household Size in Clay County
Average Household Size in Clay County is 2.5 People.
How Large is the Labor Force in Clay County?
There are 139,692 People in the Labor Forcein in Clay County.
What is the Percentage of People in the Labor Force in Clay County?
69.8% of People are in the Labor Force in Clay County.
What is the Unemployment Rate in Clay County?
Unemployment Rate in Clay County is 4.0%.