Clark County, MO Map & Demographics
Clark County Map
Clark County Overview
$26,417
PER CAPITA INCOME
$69,212
AVG FAMILY INCOME
$53,362
AVG HOUSEHOLD INCOME
21.4%
WAGE / INCOME GAP [ % ]
78.6¢/ $1
WAGE / INCOME GAP [ $ ]
0.43
INEQUALITY / GINI INDEX
6,693
TOTAL POPULATION
3,459
MALE POPULATION
3,234
FEMALE POPULATION
106.96
MALES / 100 FEMALES
93.50
FEMALES / 100 MALES
42.8
MEDIAN AGE
3.8
AVG FAMILY SIZE
2.9
AVG HOUSEHOLD SIZE
2,993
LABOR FORCE [ PEOPLE ]
57.5%
PERCENT IN LABOR FORCE
3.9%
UNEMPLOYMENT RATE
Clark County Area Codes
Income in Clark County
Income Overview in Clark County
Per Capita Income in Clark County is $26,417, while median incomes of families and households are $69,212 and $53,362 respectively.
| Characteristic | Number | Measure |
| Per Capita Income | 6,693 | $26,417 |
| Median Family Income | 1,460 | $69,212 |
| Mean Family Income | 1,460 | $85,086 |
| Median Household Income | 2,300 | $53,362 |
| Mean Household Income | 2,300 | $69,018 |
| Income Deficit | 1,460 | $0 |
| Wage / Income Gap (%) | 6,693 | 21.38% |
| Wage / Income Gap ($) | 6,693 | 78.62¢ per $1 |
| Gini / Inequality Index | 6,693 | 0.43 |
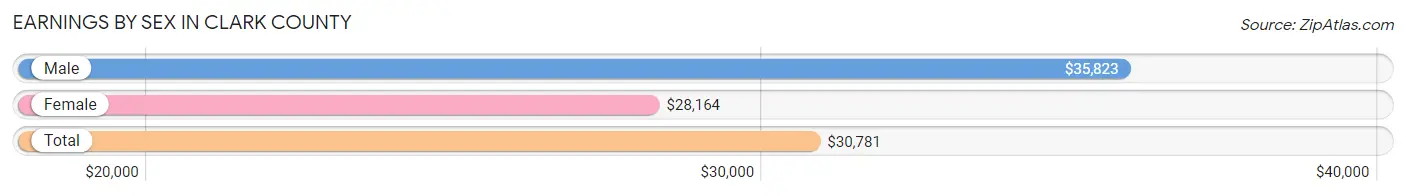
Earnings by Sex in Clark County
Average Earnings in Clark County are $30,781, $35,823 for men and $28,164 for women, a difference of 21.4%.
| Sex | Number | Average Earnings |
| Male | 1,699 (55.1%) | $35,823 |
| Female | 1,383 (44.9%) | $28,164 |
| Total | 3,082 (100.0%) | $30,781 |
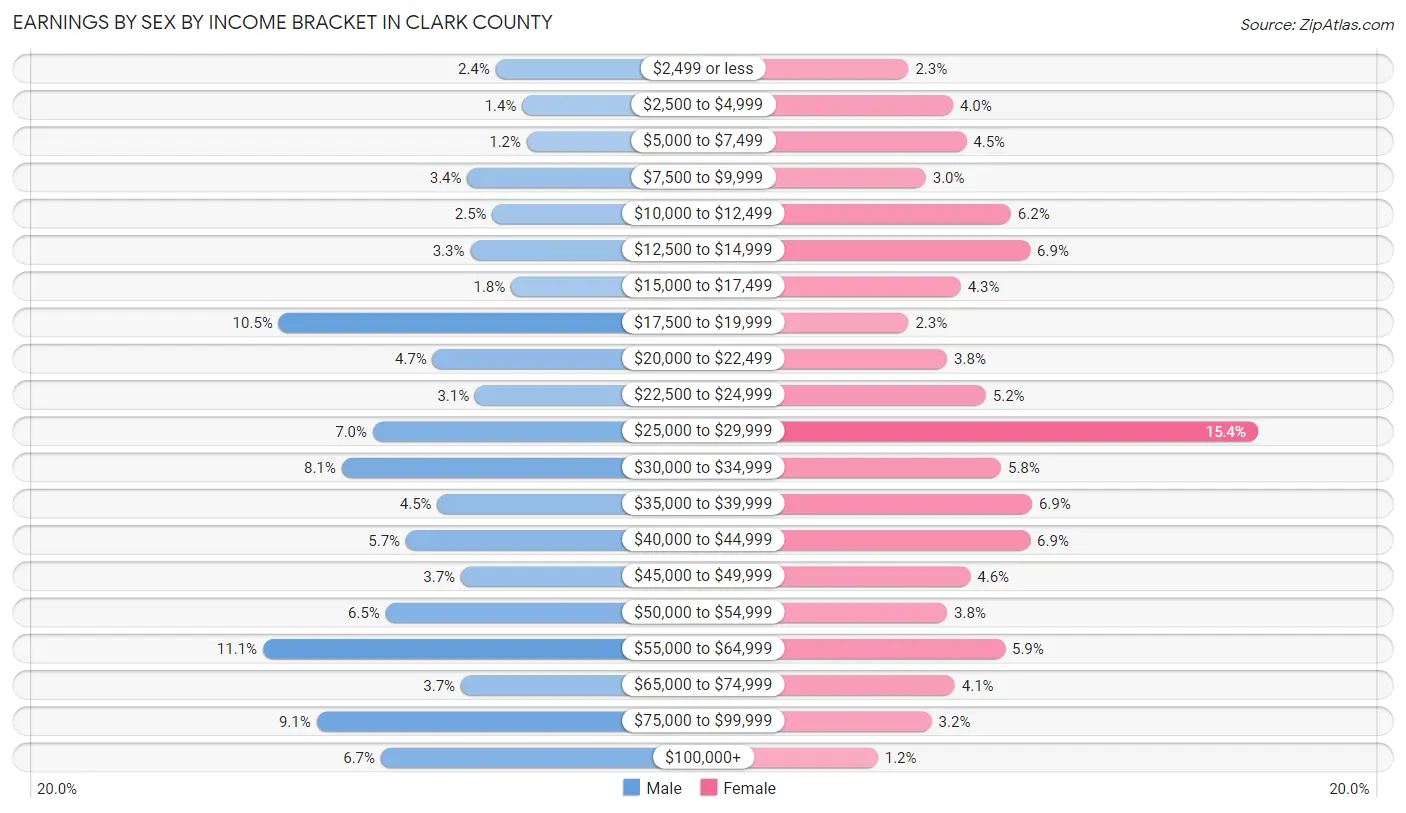
Earnings by Sex by Income Bracket in Clark County
The most common earnings brackets in Clark County are $55,000 to $64,999 for men (188 | 11.1%) and $25,000 to $29,999 for women (213 | 15.4%).
| Income | Male | Female |
| $2,499 or less | 40 (2.4%) | 32 (2.3%) |
| $2,500 to $4,999 | 23 (1.3%) | 55 (4.0%) |
| $5,000 to $7,499 | 20 (1.2%) | 62 (4.5%) |
| $7,500 to $9,999 | 58 (3.4%) | 41 (3.0%) |
| $10,000 to $12,499 | 42 (2.5%) | 85 (6.1%) |
| $12,500 to $14,999 | 56 (3.3%) | 95 (6.9%) |
| $15,000 to $17,499 | 30 (1.8%) | 59 (4.3%) |
| $17,500 to $19,999 | 178 (10.5%) | 32 (2.3%) |
| $20,000 to $22,499 | 80 (4.7%) | 52 (3.8%) |
| $22,500 to $24,999 | 53 (3.1%) | 72 (5.2%) |
| $25,000 to $29,999 | 118 (7.0%) | 213 (15.4%) |
| $30,000 to $34,999 | 138 (8.1%) | 80 (5.8%) |
| $35,000 to $39,999 | 77 (4.5%) | 96 (6.9%) |
| $40,000 to $44,999 | 97 (5.7%) | 95 (6.9%) |
| $45,000 to $49,999 | 62 (3.6%) | 64 (4.6%) |
| $50,000 to $54,999 | 110 (6.5%) | 52 (3.8%) |
| $55,000 to $64,999 | 188 (11.1%) | 82 (5.9%) |
| $65,000 to $74,999 | 62 (3.6%) | 56 (4.1%) |
| $75,000 to $99,999 | 154 (9.1%) | 44 (3.2%) |
| $100,000+ | 113 (6.7%) | 16 (1.2%) |
| Total | 1,699 (100.0%) | 1,383 (100.0%) |
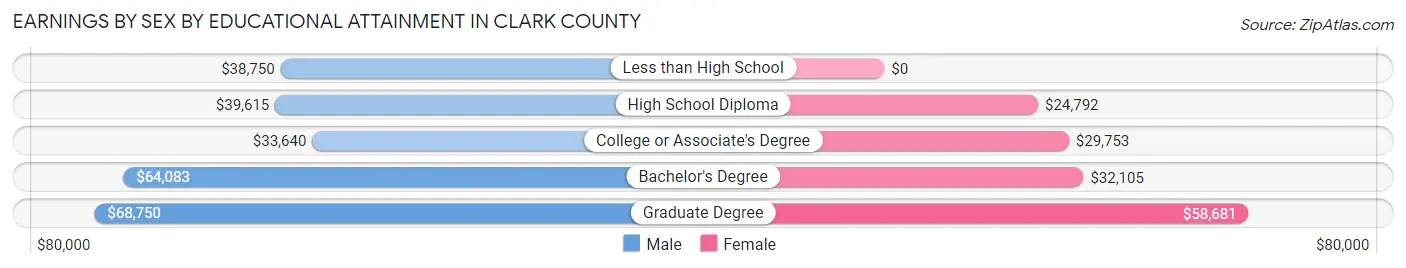
Earnings by Sex by Educational Attainment in Clark County
Average earnings in Clark County are $39,236 for men and $29,328 for women, a difference of 25.3%. Men with an educational attainment of graduate degree enjoy the highest average annual earnings of $68,750, while those with college or associate's degree education earn the least with $33,640. Women with an educational attainment of graduate degree earn the most with the average annual earnings of $58,681, while those with high school diploma education have the smallest earnings of $24,792.
| Educational Attainment | Male Income | Female Income |
| Less than High School | $38,750 | $0 |
| High School Diploma | $39,615 | $24,792 |
| College or Associate's Degree | $33,640 | $29,753 |
| Bachelor's Degree | $64,083 | $32,105 |
| Graduate Degree | $68,750 | $58,681 |
| Total | $39,236 | $29,328 |
Family Income in Clark County
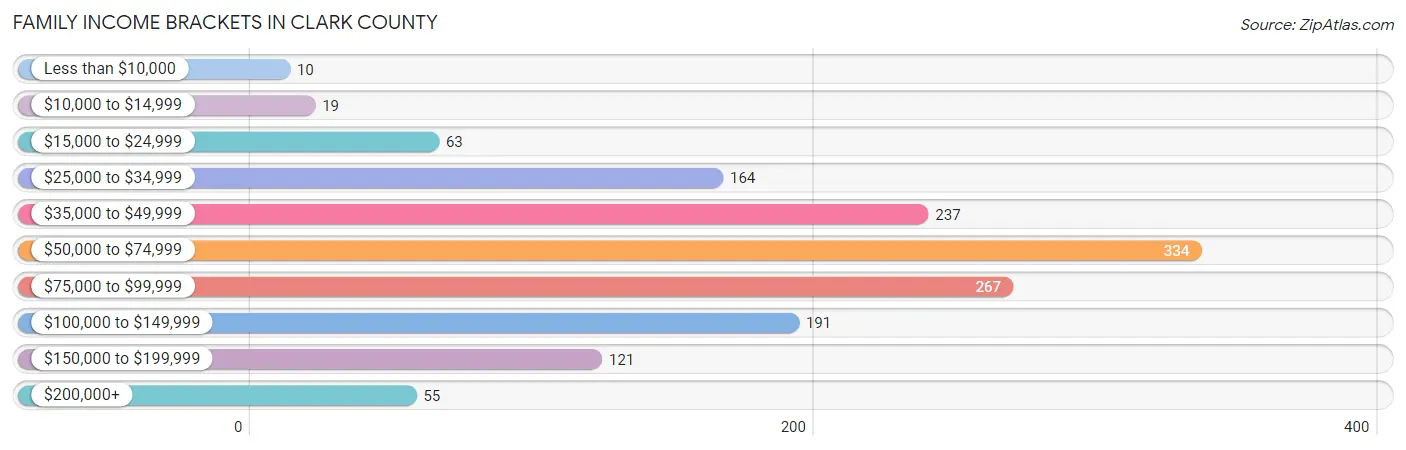
Family Income Brackets in Clark County
According to the Clark County family income data, there are 334 families falling into the $50,000 to $74,999 income range, which is the most common income bracket and makes up 22.9% of all families. Conversely, the less than $10,000 income bracket is the least frequent group with only 10 families (0.7%) belonging to this category.
| Income Bracket | # Families | % Families |
| Less than $10,000 | 10 | 0.7% |
| $10,000 to $14,999 | 19 | 1.3% |
| $15,000 to $24,999 | 63 | 4.3% |
| $25,000 to $34,999 | 164 | 11.2% |
| $35,000 to $49,999 | 237 | 16.2% |
| $50,000 to $74,999 | 334 | 22.9% |
| $75,000 to $99,999 | 267 | 18.3% |
| $100,000 to $149,999 | 191 | 13.1% |
| $150,000 to $199,999 | 121 | 8.3% |
| $200,000+ | 55 | 3.8% |
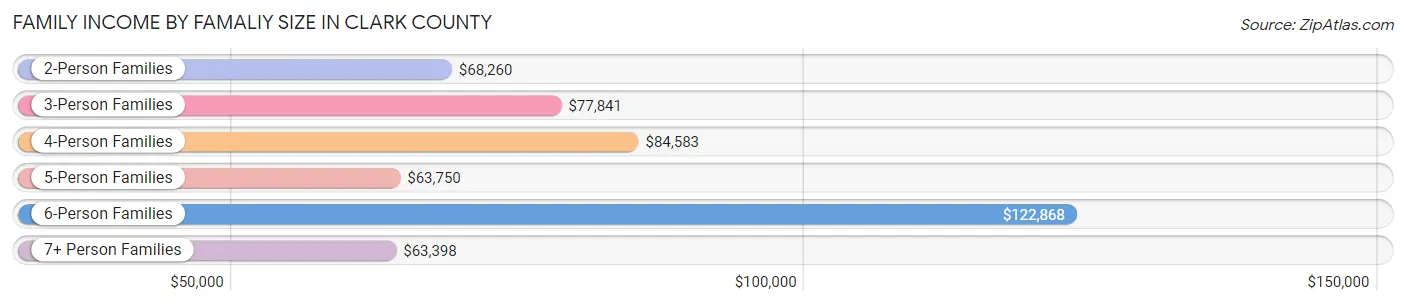
Family Income by Famaliy Size in Clark County
6-person families (29 | 2.0%) account for the highest median family income in Clark County with $122,868 per family, while 2-person families (821 | 56.2%) have the highest median income of $34,130 per family member.
| Income Bracket | # Families | Median Income |
| 2-Person Families | 821 (56.2%) | $68,260 |
| 3-Person Families | 232 (15.9%) | $77,841 |
| 4-Person Families | 243 (16.6%) | $84,583 |
| 5-Person Families | 64 (4.4%) | $63,750 |
| 6-Person Families | 29 (2.0%) | $122,868 |
| 7+ Person Families | 71 (4.9%) | $63,398 |
| Total | 1,460 (100.0%) | $69,212 |
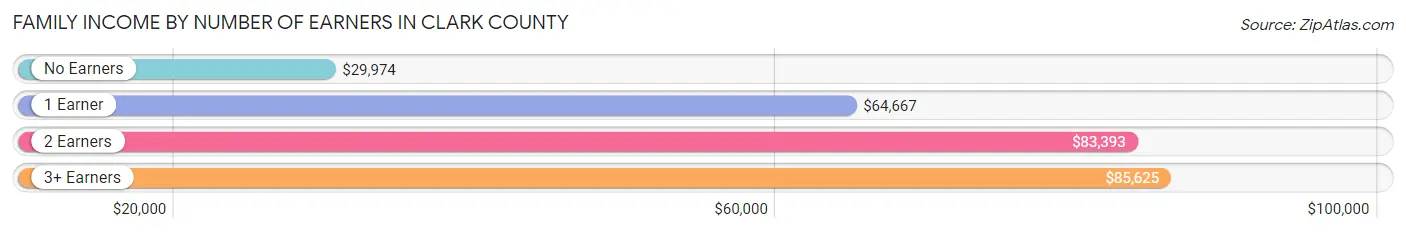
Family Income by Number of Earners in Clark County
The median family income in Clark County is $69,212, with families comprising 3+ earners (62) having the highest median family income of $85,625, while families with no earners (282) have the lowest median family income of $29,974, accounting for 4.3% and 19.3% of families, respectively.
| Number of Earners | # Families | Median Income |
| No Earners | 282 (19.3%) | $29,974 |
| 1 Earner | 444 (30.4%) | $64,667 |
| 2 Earners | 672 (46.0%) | $83,393 |
| 3+ Earners | 62 (4.3%) | $85,625 |
| Total | 1,460 (100.0%) | $69,212 |
Household Income in Clark County
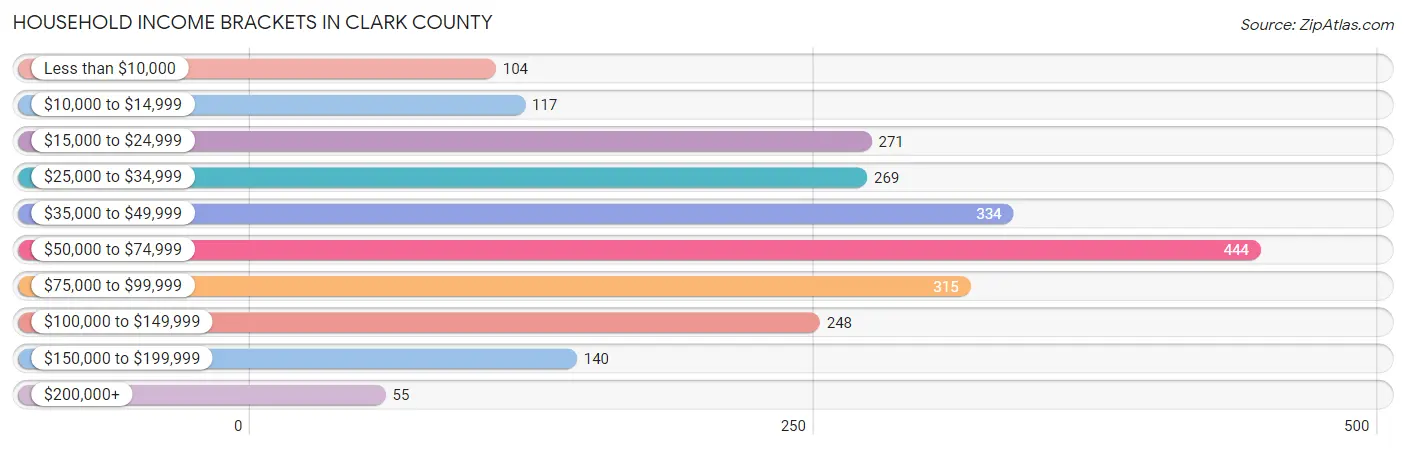
Household Income Brackets in Clark County
With 444 households falling in the category, the $50,000 to $74,999 income range is the most frequent in Clark County, accounting for 19.3% of all households. In contrast, only 55 households (2.4%) fall into the $200,000+ income bracket, making it the least populous group.
| Income Bracket | # Households | % Households |
| Less than $10,000 | 104 | 4.5% |
| $10,000 to $14,999 | 117 | 5.1% |
| $15,000 to $24,999 | 271 | 11.8% |
| $25,000 to $34,999 | 269 | 11.7% |
| $35,000 to $49,999 | 334 | 14.5% |
| $50,000 to $74,999 | 444 | 19.3% |
| $75,000 to $99,999 | 315 | 13.7% |
| $100,000 to $149,999 | 248 | 10.8% |
| $150,000 to $199,999 | 140 | 6.1% |
| $200,000+ | 55 | 2.4% |
Household Income by Householder Age in Clark County
The median household income in Clark County is $53,362, with the highest median household income of $71,907 found in the 45 to 64 years age bracket for the primary householder. A total of 896 households (39.0%) fall into this category. Meanwhile, the 15 to 24 years age bracket for the primary householder has the lowest median household income of $0, with 30 households (1.3%) in this group.
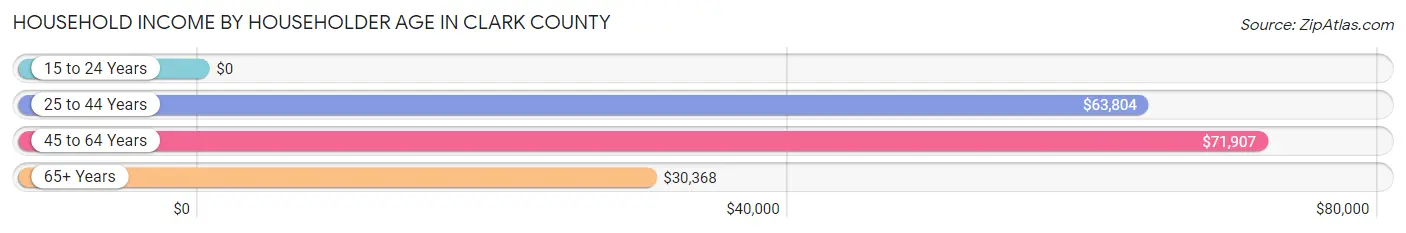
| Income Bracket | # Households | Median Income |
| 15 to 24 Years | 30 (1.3%) | $0 |
| 25 to 44 Years | 530 (23.0%) | $63,804 |
| 45 to 64 Years | 896 (39.0%) | $71,907 |
| 65+ Years | 844 (36.7%) | $30,368 |
| Total | 2,300 (100.0%) | $53,362 |
Poverty in Clark County
Income Below Poverty by Sex and Age in Clark County
With 9.9% poverty level for males and 11.9% for females among the residents of Clark County, 5 year old males and 16 and 17 year old females are the most vulnerable to poverty, with 37 males (48.0%) and 28 females (28.0%) in their respective age groups living below the poverty level.
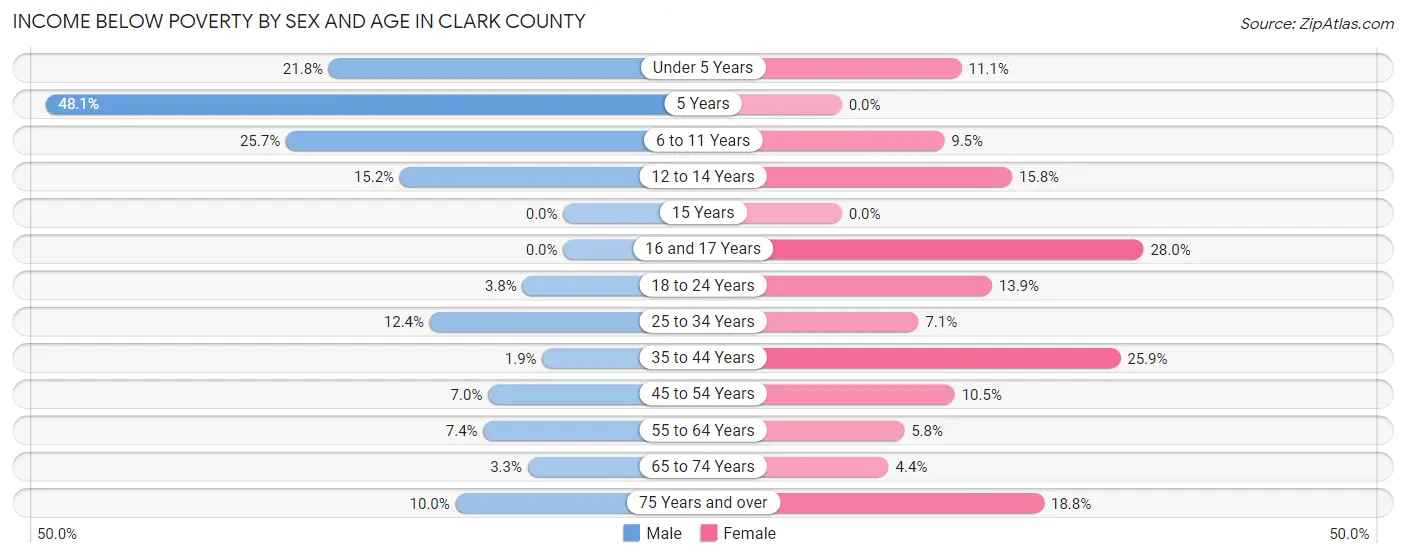
| Age Bracket | Male | Female |
| Under 5 Years | 47 (21.8%) | 22 (11.1%) |
| 5 Years | 37 (48.0%) | 0 (0.0%) |
| 6 to 11 Years | 61 (25.7%) | 27 (9.5%) |
| 12 to 14 Years | 27 (15.2%) | 21 (15.8%) |
| 15 Years | 0 (0.0%) | 0 (0.0%) |
| 16 and 17 Years | 0 (0.0%) | 28 (28.0%) |
| 18 to 24 Years | 9 (3.8%) | 28 (13.9%) |
| 25 to 34 Years | 43 (12.4%) | 23 (7.1%) |
| 35 to 44 Years | 7 (1.9%) | 91 (25.9%) |
| 45 to 54 Years | 29 (7.0%) | 39 (10.5%) |
| 55 to 64 Years | 40 (7.4%) | 27 (5.8%) |
| 65 to 74 Years | 13 (3.3%) | 17 (4.3%) |
| 75 Years and over | 26 (10.0%) | 58 (18.8%) |
| Total | 339 (9.9%) | 381 (11.9%) |
Income Above Poverty by Sex and Age in Clark County
According to the poverty statistics in Clark County, males aged 15 years and females aged 5 years are the age groups that are most secure financially, with 100.0% of males and 100.0% of females in these age groups living above the poverty line.
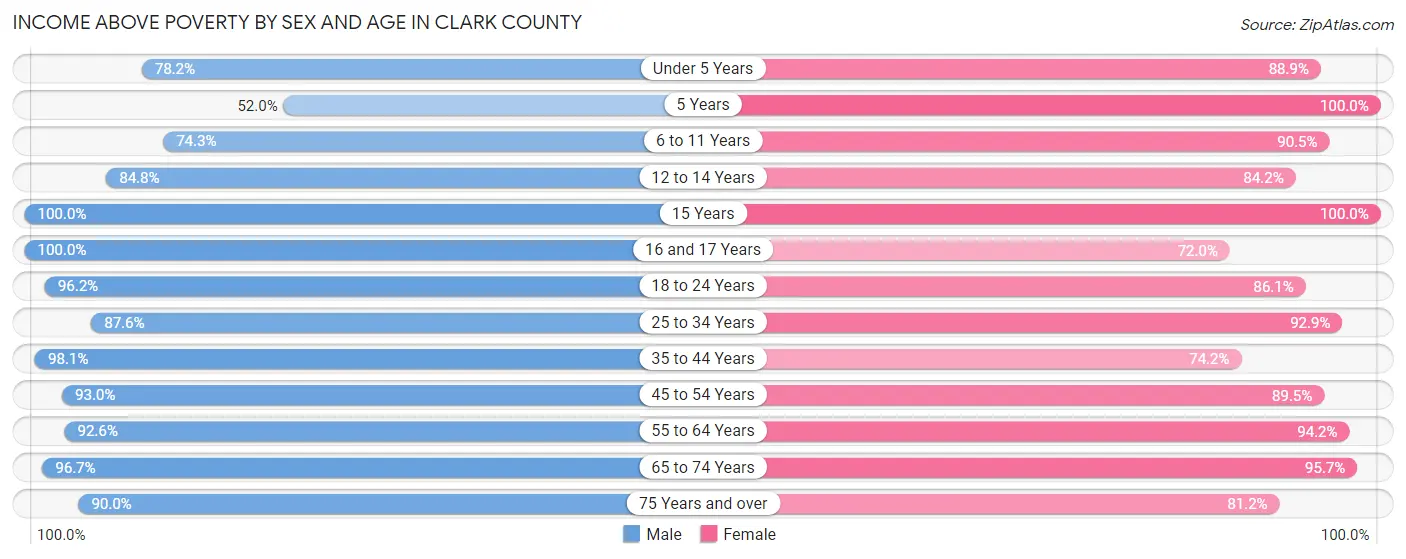
| Age Bracket | Male | Female |
| Under 5 Years | 169 (78.2%) | 176 (88.9%) |
| 5 Years | 40 (51.9%) | 20 (100.0%) |
| 6 to 11 Years | 176 (74.3%) | 257 (90.5%) |
| 12 to 14 Years | 151 (84.8%) | 112 (84.2%) |
| 15 Years | 94 (100.0%) | 39 (100.0%) |
| 16 and 17 Years | 58 (100.0%) | 72 (72.0%) |
| 18 to 24 Years | 229 (96.2%) | 173 (86.1%) |
| 25 to 34 Years | 304 (87.6%) | 300 (92.9%) |
| 35 to 44 Years | 353 (98.1%) | 261 (74.2%) |
| 45 to 54 Years | 387 (93.0%) | 333 (89.5%) |
| 55 to 64 Years | 499 (92.6%) | 439 (94.2%) |
| 65 to 74 Years | 381 (96.7%) | 374 (95.7%) |
| 75 Years and over | 234 (90.0%) | 251 (81.2%) |
| Total | 3,075 (90.1%) | 2,807 (88.0%) |
Income Below Poverty Among Married-Couple Families in Clark County
The poverty statistics for married-couple families in Clark County show that 3.9% or 50 of the total 1,277 families live below the poverty line. Families with 5 or more children have the highest poverty rate of 33.9%, comprising of 19 families. On the other hand, families with no children have the lowest poverty rate of 1.5%, which includes 12 families.
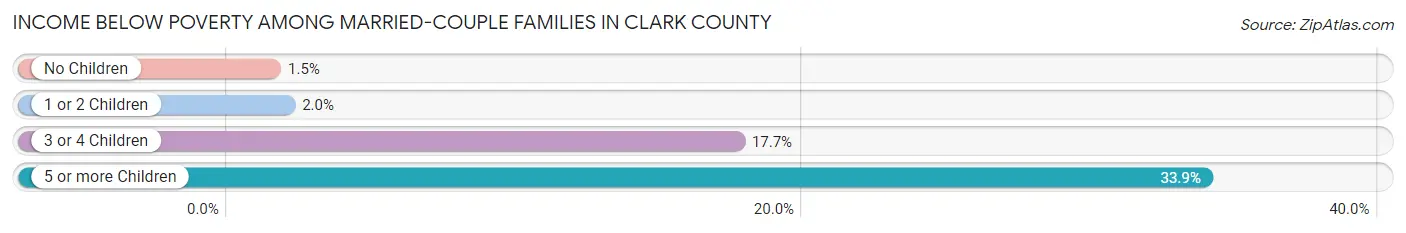
| Children | Above Poverty | Below Poverty |
| No Children | 790 (98.5%) | 12 (1.5%) |
| 1 or 2 Children | 344 (98.0%) | 7 (2.0%) |
| 3 or 4 Children | 56 (82.4%) | 12 (17.6%) |
| 5 or more Children | 37 (66.1%) | 19 (33.9%) |
| Total | 1,227 (96.1%) | 50 (3.9%) |
Income Below Poverty Among Single-Parent Households in Clark County
According to the poverty data in Clark County, 2.1% or 2 single-father households and 16.9% or 15 single-mother households are living below the poverty line. Among single-father households, those with no children have the highest poverty rate, with 2 households (3.3%) experiencing poverty. Likewise, among single-mother households, those with 3 or 4 children have the highest poverty rate, with 9 households (64.3%) falling below the poverty line.

| Children | Single Father | Single Mother |
| No Children | 2 (3.3%) | 3 (7.1%) |
| 1 or 2 Children | 0 (0.0%) | 3 (16.7%) |
| 3 or 4 Children | 0 (0.0%) | 9 (64.3%) |
| 5 or more Children | 0 (0.0%) | 0 (0.0%) |
| Total | 2 (2.1%) | 15 (16.9%) |
Income Below Poverty Among Married-Couple vs Single-Parent Households in Clark County
The poverty data for Clark County shows that 50 of the married-couple family households (3.9%) and 17 of the single-parent households (9.3%) are living below the poverty level. Within the married-couple family households, those with 5 or more children have the highest poverty rate, with 19 households (33.9%) falling below the poverty line. Among the single-parent households, those with 3 or 4 children have the highest poverty rate, with 9 household (64.3%) living below poverty.
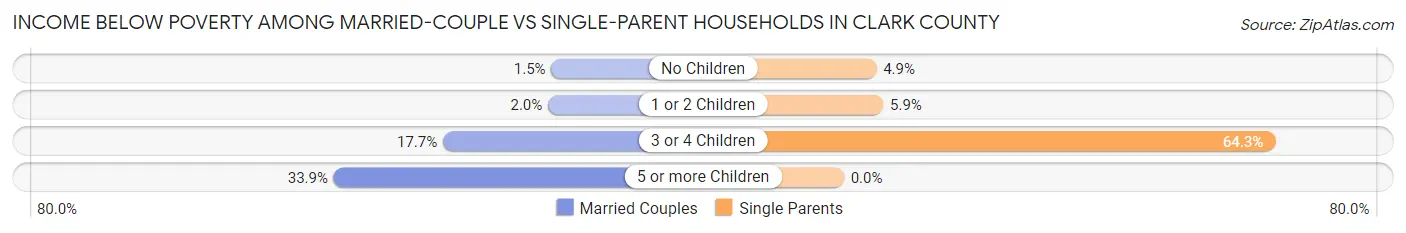
| Children | Married-Couple Families | Single-Parent Households |
| No Children | 12 (1.5%) | 5 (4.9%) |
| 1 or 2 Children | 7 (2.0%) | 3 (5.9%) |
| 3 or 4 Children | 12 (17.6%) | 9 (64.3%) |
| 5 or more Children | 19 (33.9%) | 0 (0.0%) |
| Total | 50 (3.9%) | 17 (9.3%) |
Race in Clark County
The most populous races in Clark County are White / Caucasian (6,414 | 95.8%), Two or more Races (143 | 2.1%), and Hispanic or Latino (64 | 1.0%).
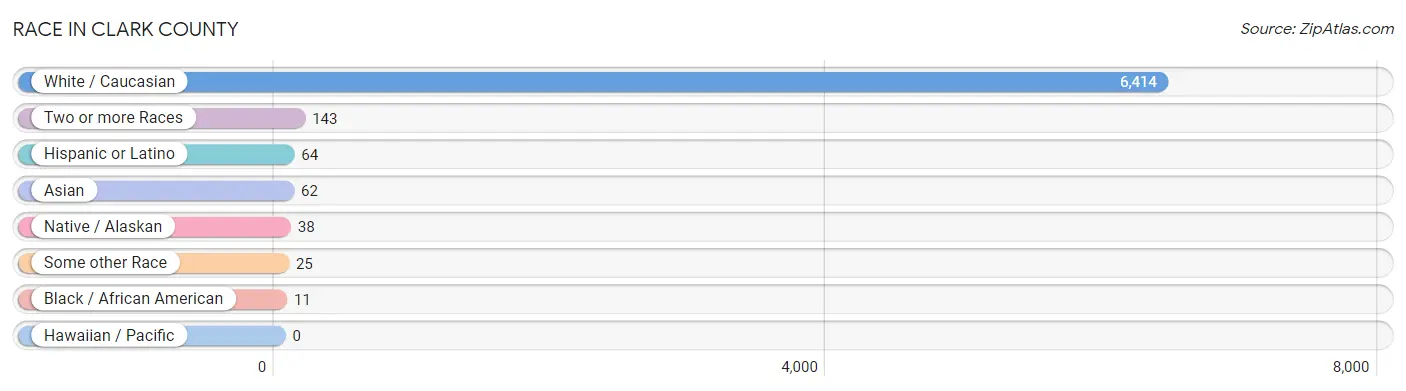
| Race | # Population | % Population |
| Asian | 62 | 0.9% |
| Black / African American | 11 | 0.2% |
| Hawaiian / Pacific | 0 | 0.0% |
| Hispanic or Latino | 64 | 1.0% |
| Native / Alaskan | 38 | 0.6% |
| White / Caucasian | 6,414 | 95.8% |
| Two or more Races | 143 | 2.1% |
| Some other Race | 25 | 0.4% |
| Total | 6,693 | 100.0% |
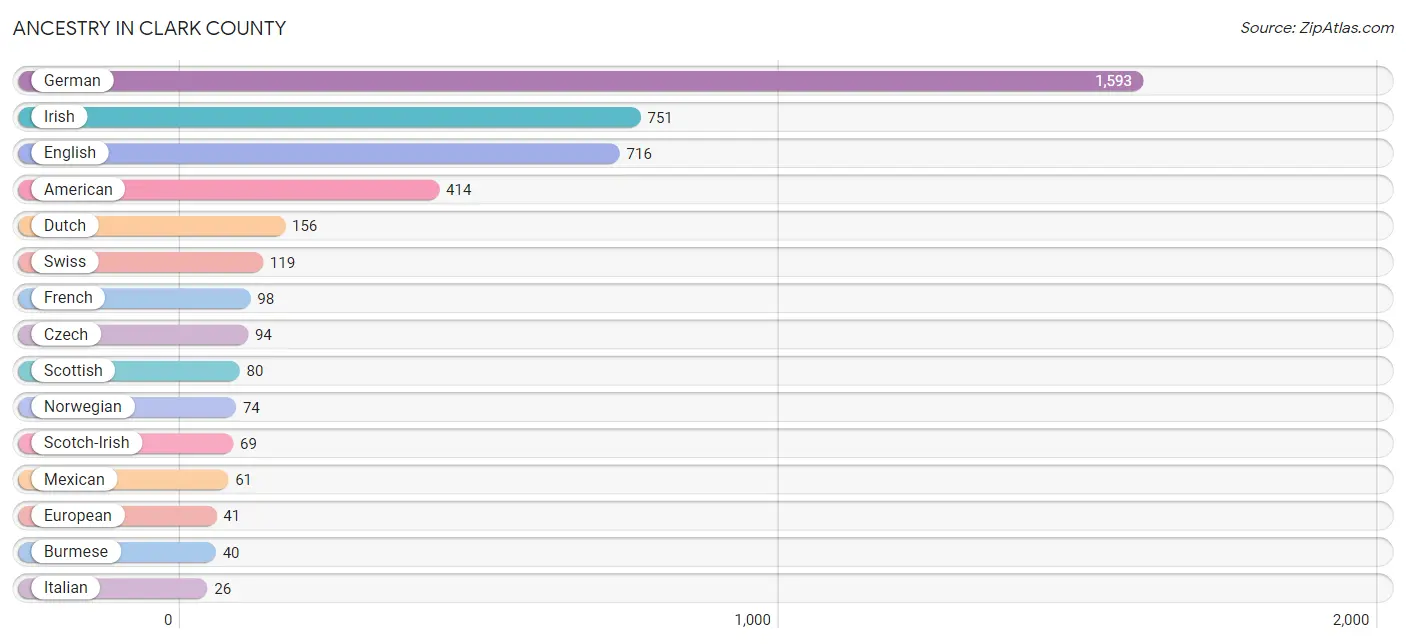
Ancestry in Clark County
The most populous ancestries reported in Clark County are German (1,593 | 23.8%), Irish (751 | 11.2%), English (716 | 10.7%), American (414 | 6.2%), and Dutch (156 | 2.3%), together accounting for 54.2% of all Clark County residents.
| Ancestry | # Population | % Population |
| American | 414 | 6.2% |
| Austrian | 5 | 0.1% |
| Blackfeet | 3 | 0.0% |
| Brazilian | 3 | 0.0% |
| British | 25 | 0.4% |
| Burmese | 40 | 0.6% |
| Cherokee | 20 | 0.3% |
| Czech | 94 | 1.4% |
| Danish | 6 | 0.1% |
| Dutch | 156 | 2.3% |
| English | 716 | 10.7% |
| European | 41 | 0.6% |
| French | 98 | 1.5% |
| German | 1,593 | 23.8% |
| Greek | 7 | 0.1% |
| Hungarian | 5 | 0.1% |
| Irish | 751 | 11.2% |
| Italian | 26 | 0.4% |
| Mexican | 61 | 0.9% |
| Norwegian | 74 | 1.1% |
| Polish | 13 | 0.2% |
| Puerto Rican | 3 | 0.0% |
| Scandinavian | 10 | 0.2% |
| Scotch-Irish | 69 | 1.0% |
| Scottish | 80 | 1.2% |
| Sioux | 23 | 0.3% |
| Sri Lankan | 2 | 0.0% |
| Swedish | 14 | 0.2% |
| Swiss | 119 | 1.8% |
| Thai | 20 | 0.3% |
| Welsh | 14 | 0.2% | View All 31 Rows |
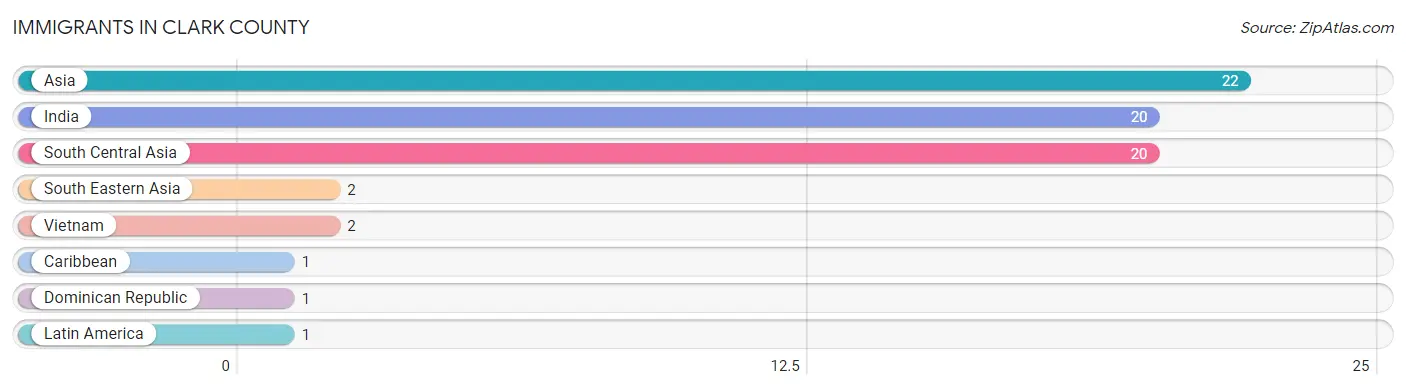
Immigrants in Clark County
The most numerous immigrant groups reported in Clark County came from Asia (22 | 0.3%), India (20 | 0.3%), South Central Asia (20 | 0.3%), South Eastern Asia (2 | 0.0%), and Vietnam (2 | 0.0%), together accounting for 1.0% of all Clark County residents.
| Immigration Origin | # Population | % Population |
| Asia | 22 | 0.3% |
| Caribbean | 1 | 0.0% |
| Dominican Republic | 1 | 0.0% |
| India | 20 | 0.3% |
| Latin America | 1 | 0.0% |
| South Central Asia | 20 | 0.3% |
| South Eastern Asia | 2 | 0.0% |
| Vietnam | 2 | 0.0% | View All 8 Rows |
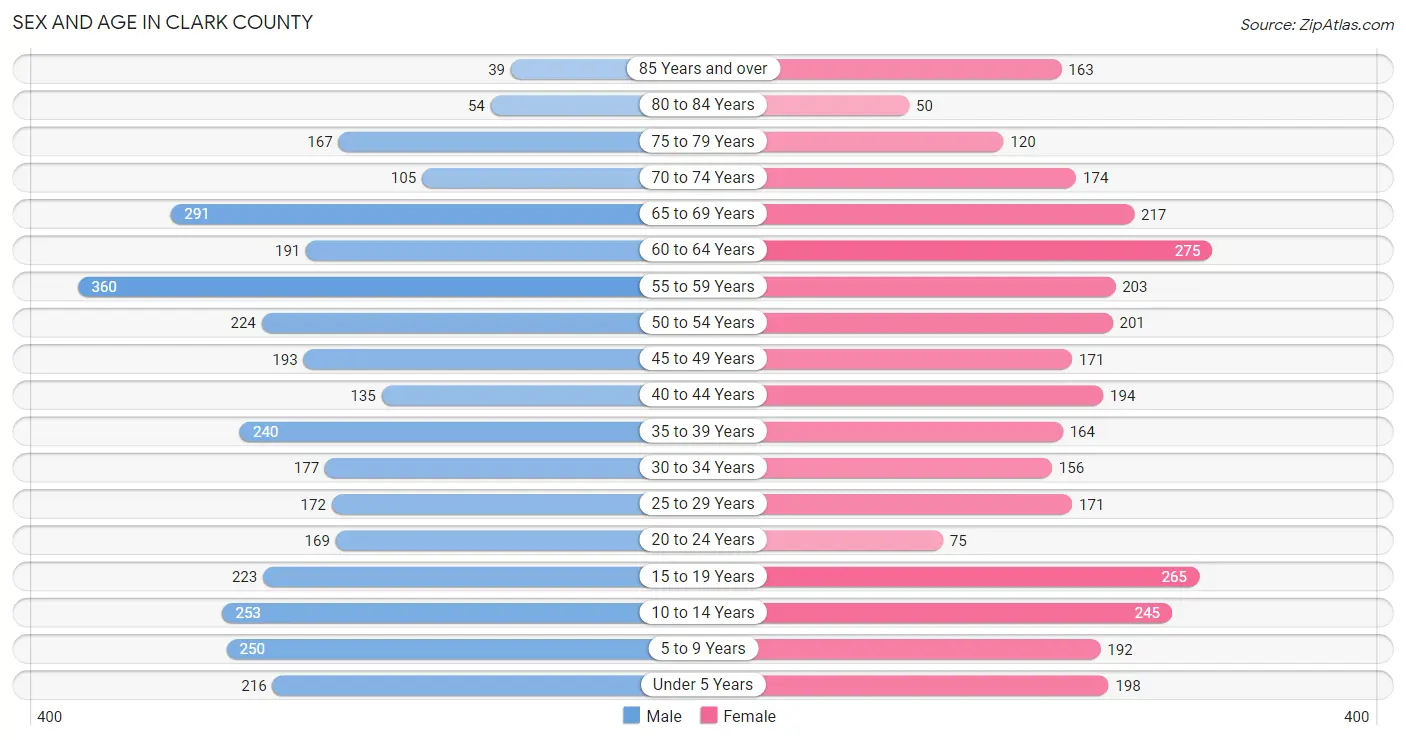
Sex and Age in Clark County
Sex and Age in Clark County
The most populous age groups in Clark County are 55 to 59 Years (360 | 10.4%) for men and 60 to 64 Years (275 | 8.5%) for women.
| Age Bracket | Male | Female |
| Under 5 Years | 216 (6.2%) | 198 (6.1%) |
| 5 to 9 Years | 250 (7.2%) | 192 (5.9%) |
| 10 to 14 Years | 253 (7.3%) | 245 (7.6%) |
| 15 to 19 Years | 223 (6.5%) | 265 (8.2%) |
| 20 to 24 Years | 169 (4.9%) | 75 (2.3%) |
| 25 to 29 Years | 172 (5.0%) | 171 (5.3%) |
| 30 to 34 Years | 177 (5.1%) | 156 (4.8%) |
| 35 to 39 Years | 240 (6.9%) | 164 (5.1%) |
| 40 to 44 Years | 135 (3.9%) | 194 (6.0%) |
| 45 to 49 Years | 193 (5.6%) | 171 (5.3%) |
| 50 to 54 Years | 224 (6.5%) | 201 (6.2%) |
| 55 to 59 Years | 360 (10.4%) | 203 (6.3%) |
| 60 to 64 Years | 191 (5.5%) | 275 (8.5%) |
| 65 to 69 Years | 291 (8.4%) | 217 (6.7%) |
| 70 to 74 Years | 105 (3.0%) | 174 (5.4%) |
| 75 to 79 Years | 167 (4.8%) | 120 (3.7%) |
| 80 to 84 Years | 54 (1.6%) | 50 (1.5%) |
| 85 Years and over | 39 (1.1%) | 163 (5.0%) |
| Total | 3,459 (100.0%) | 3,234 (100.0%) |
Families and Households in Clark County
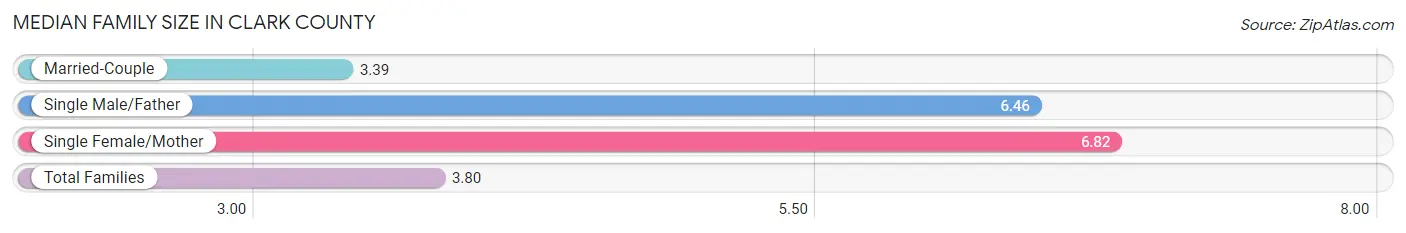
Median Family Size in Clark County
The median family size in Clark County is 3.80 persons per family, with single female/mother families (89 | 6.1%) accounting for the largest median family size of 6.82 persons per family. On the other hand, married-couple families (1,277 | 87.5%) represent the smallest median family size with 3.39 persons per family.
| Family Type | # Families | Family Size |
| Married-Couple | 1,277 (87.5%) | 3.39 |
| Single Male/Father | 94 (6.4%) | 6.46 |
| Single Female/Mother | 89 (6.1%) | 6.82 |
| Total Families | 1,460 (100.0%) | 3.80 |
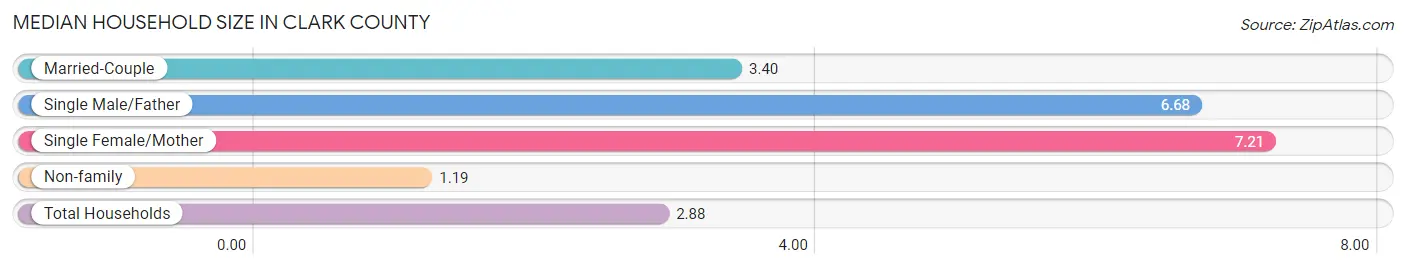
Median Household Size in Clark County
The median household size in Clark County is 2.88 persons per household, with single female/mother households (89 | 3.9%) accounting for the largest median household size of 7.21 persons per household. non-family households (840 | 36.5%) represent the smallest median household size with 1.19 persons per household.
| Household Type | # Households | Household Size |
| Married-Couple | 1,277 (55.5%) | 3.40 |
| Single Male/Father | 94 (4.1%) | 6.68 |
| Single Female/Mother | 89 (3.9%) | 7.21 |
| Non-family | 840 (36.5%) | 1.19 |
| Total Households | 2,300 (100.0%) | 2.88 |
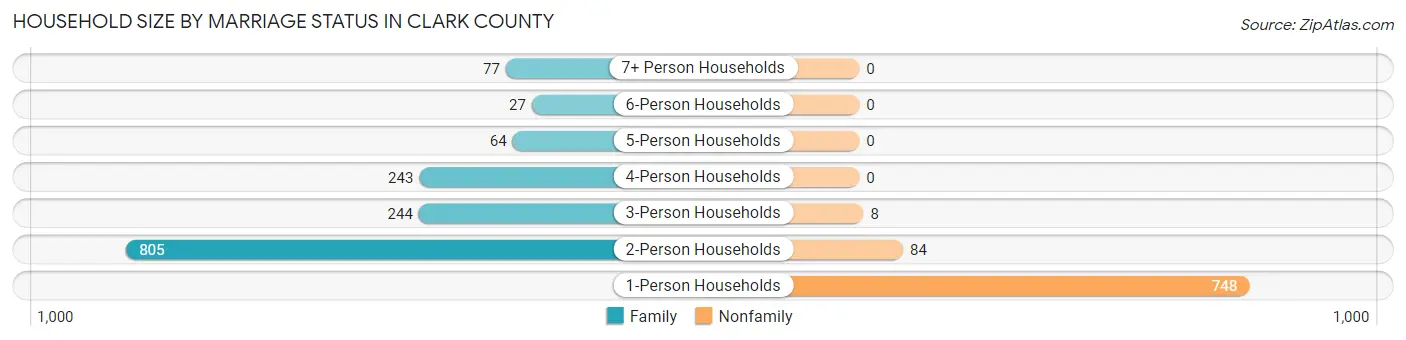
Household Size by Marriage Status in Clark County
Out of a total of 2,300 households in Clark County, 1,460 (63.5%) are family households, while 840 (36.5%) are nonfamily households. The most numerous type of family households are 2-person households, comprising 805, and the most common type of nonfamily households are 1-person households, comprising 748.
| Household Size | Family Households | Nonfamily Households |
| 1-Person Households | - | 748 (32.5%) |
| 2-Person Households | 805 (35.0%) | 84 (3.6%) |
| 3-Person Households | 244 (10.6%) | 8 (0.4%) |
| 4-Person Households | 243 (10.6%) | 0 (0.0%) |
| 5-Person Households | 64 (2.8%) | 0 (0.0%) |
| 6-Person Households | 27 (1.2%) | 0 (0.0%) |
| 7+ Person Households | 77 (3.4%) | 0 (0.0%) |
| Total | 1,460 (63.5%) | 840 (36.5%) |
Female Fertility in Clark County
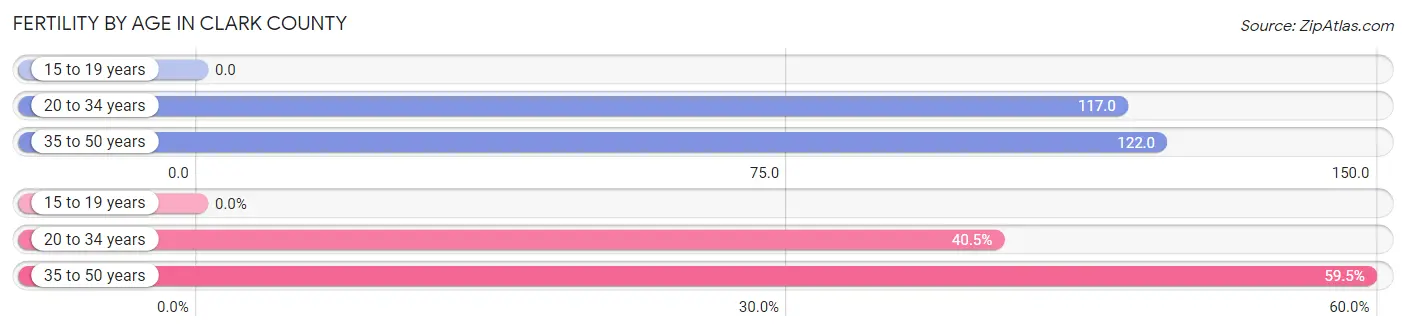
Fertility by Age in Clark County
Average fertility rate in Clark County is 94.0 births per 1,000 women. Women in the age bracket of 35 to 50 years have the highest fertility rate with 122.0 births per 1,000 women. Women in the age bracket of 35 to 50 years acount for 59.5% of all women with births.
| Age Bracket | Women with Births | Births / 1,000 Women |
| 15 to 19 years | 0 (0.0%) | 0.0 |
| 20 to 34 years | 47 (40.5%) | 117.0 |
| 35 to 50 years | 69 (59.5%) | 122.0 |
| Total | 116 (100.0%) | 94.0 |
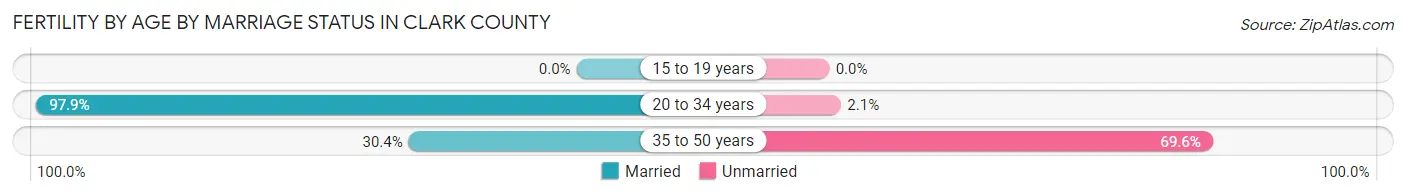
Fertility by Age by Marriage Status in Clark County
57.8% of women with births (116) in Clark County are married. The highest percentage of unmarried women with births falls into 35 to 50 years age bracket with 69.6% of them unmarried at the time of birth, while the lowest percentage of unmarried women with births belong to 20 to 34 years age bracket with 2.1% of them unmarried.
| Age Bracket | Married | Unmarried |
| 15 to 19 years | 0 (0.0%) | 0 (0.0%) |
| 20 to 34 years | 46 (97.9%) | 1 (2.1%) |
| 35 to 50 years | 21 (30.4%) | 48 (69.6%) |
| Total | 67 (57.8%) | 49 (42.2%) |
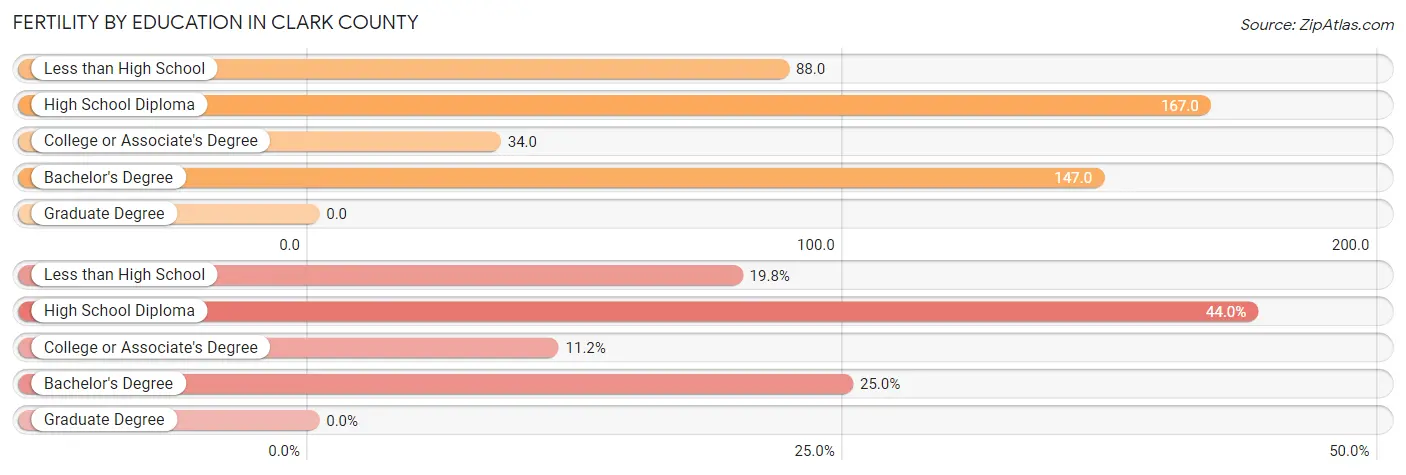
Fertility by Education in Clark County
| Educational Attainment | Women with Births | Births / 1,000 Women |
| Less than High School | 23 (19.8%) | 88.0 |
| High School Diploma | 51 (44.0%) | 167.0 |
| College or Associate's Degree | 13 (11.2%) | 34.0 |
| Bachelor's Degree | 29 (25.0%) | 147.0 |
| Graduate Degree | 0 (0.0%) | 0.0 |
| Total | 116 (100.0%) | 94.0 |
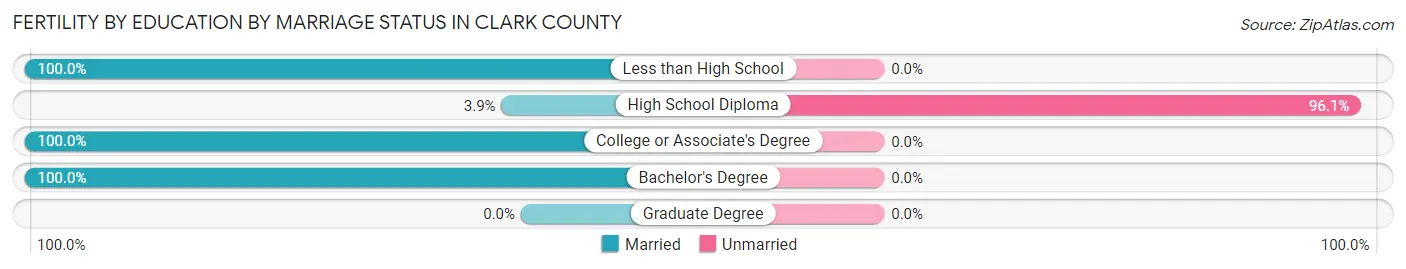
Fertility by Education by Marriage Status in Clark County
42.2% of women with births in Clark County are unmarried. Women with the educational attainment of less than high school are most likely to be married with 100.0% of them married at childbirth, while women with the educational attainment of high school diploma are least likely to be married with 96.1% of them unmarried at childbirth.
| Educational Attainment | Married | Unmarried |
| Less than High School | 23 (100.0%) | 0 (0.0%) |
| High School Diploma | 2 (3.9%) | 49 (96.1%) |
| College or Associate's Degree | 13 (100.0%) | 0 (0.0%) |
| Bachelor's Degree | 29 (100.0%) | 0 (0.0%) |
| Graduate Degree | 0 (0.0%) | 0 (0.0%) |
| Total | 67 (57.8%) | 49 (42.2%) |
Employment Characteristics in Clark County
Employment by Class of Employer in Clark County
Among the 2,832 employed individuals in Clark County, private company employees (2,101 | 74.2%), self-employed (not incorporated) (256 | 9.0%), and local government employees (187 | 6.6%) make up the most common classes of employment.
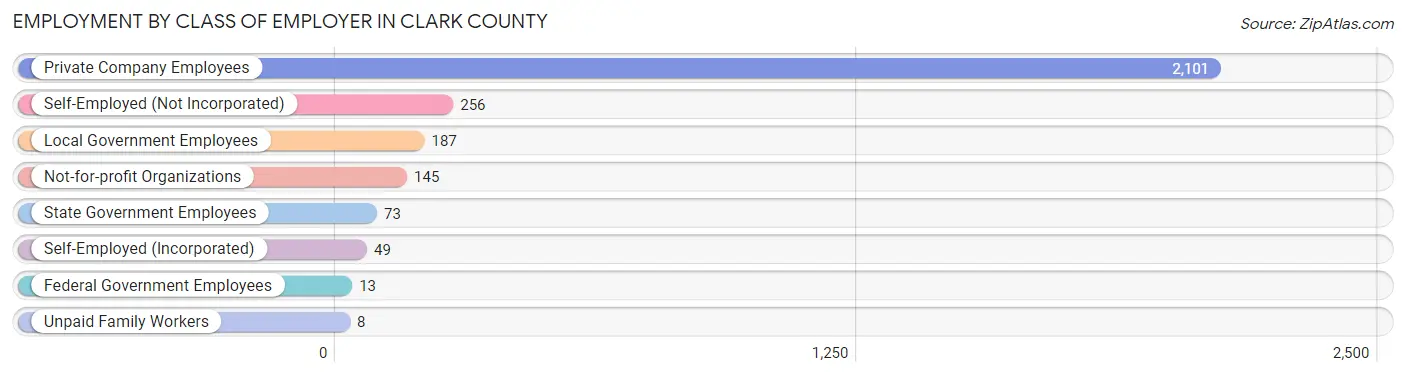
| Employer Class | # Employees | % Employees |
| Private Company Employees | 2,101 | 74.2% |
| Self-Employed (Incorporated) | 49 | 1.7% |
| Self-Employed (Not Incorporated) | 256 | 9.0% |
| Not-for-profit Organizations | 145 | 5.1% |
| Local Government Employees | 187 | 6.6% |
| State Government Employees | 73 | 2.6% |
| Federal Government Employees | 13 | 0.5% |
| Unpaid Family Workers | 8 | 0.3% |
| Total | 2,832 | 100.0% |
Employment Status by Age in Clark County
According to the labor force statistics for Clark County, out of the total population over 16 years of age (5,206), 57.5% or 2,993 individuals are in the labor force, with 3.9% or 117 of them unemployed. The age group with the highest labor force participation rate is 25 to 29 years, with 96.5% or 331 individuals in the labor force. Within the labor force, the 20 to 24 years age range has the highest percentage of unemployed individuals, with 19.4% or 30 of them being unemployed.
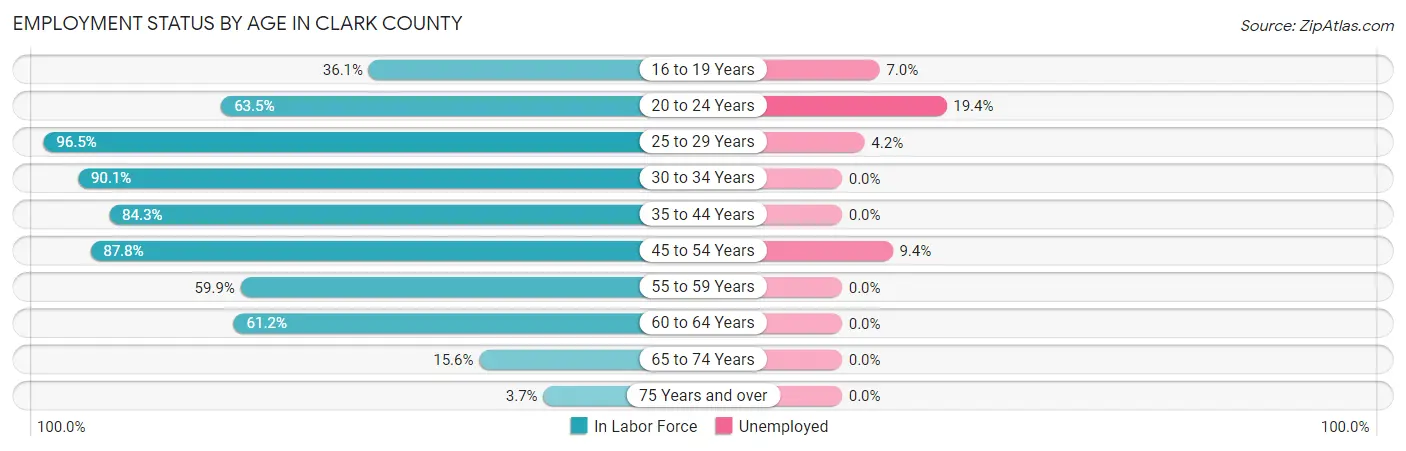
| Age Bracket | In Labor Force | Unemployed |
| 16 to 19 Years | 128 (36.1%) | 9 (7.0%) |
| 20 to 24 Years | 155 (63.5%) | 30 (19.4%) |
| 25 to 29 Years | 331 (96.5%) | 14 (4.2%) |
| 30 to 34 Years | 300 (90.1%) | 0 (0.0%) |
| 35 to 44 Years | 618 (84.3%) | 0 (0.0%) |
| 45 to 54 Years | 693 (87.8%) | 65 (9.4%) |
| 55 to 59 Years | 337 (59.9%) | 0 (0.0%) |
| 60 to 64 Years | 285 (61.2%) | 0 (0.0%) |
| 65 to 74 Years | 123 (15.6%) | 0 (0.0%) |
| 75 Years and over | 22 (3.7%) | 0 (0.0%) |
| Total | 2,993 (57.5%) | 117 (3.9%) |
Employment Status by Educational Attainment in Clark County
According to labor force statistics for Clark County, 79.5% of individuals (2,565) out of the total population between 25 and 64 years of age (3,227) are in the labor force, with 3.1% or 80 of them being unemployed. The group with the highest labor force participation rate are those with the educational attainment of bachelor's degree or higher, with 88.1% or 424 individuals in the labor force. Within the labor force, individuals with less than high school education have the highest percentage of unemployment, with 9.0% or 14 of them being unemployed.
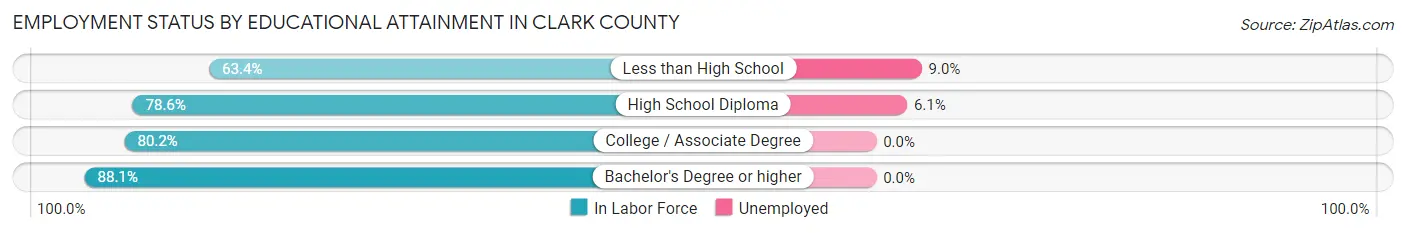
| Educational Attainment | In Labor Force | Unemployed |
| Less than High School | 156 (63.4%) | 22 (9.0%) |
| High School Diploma | 1,059 (78.6%) | 82 (6.1%) |
| College / Associate Degree | 925 (80.2%) | 0 (0.0%) |
| Bachelor's Degree or higher | 424 (88.1%) | 0 (0.0%) |
| Total | 2,565 (79.5%) | 100 (3.1%) |
Employment Occupations by Sex in Clark County
Management, Business, Science and Arts Occupations
The most common Management, Business, Science and Arts occupations in Clark County are Management (251 | 8.7%), Community & Social Service (182 | 6.3%), Health Diagnosing & Treating (158 | 5.5%), Education Instruction & Library (127 | 4.4%), and Health Technologists (86 | 3.0%).
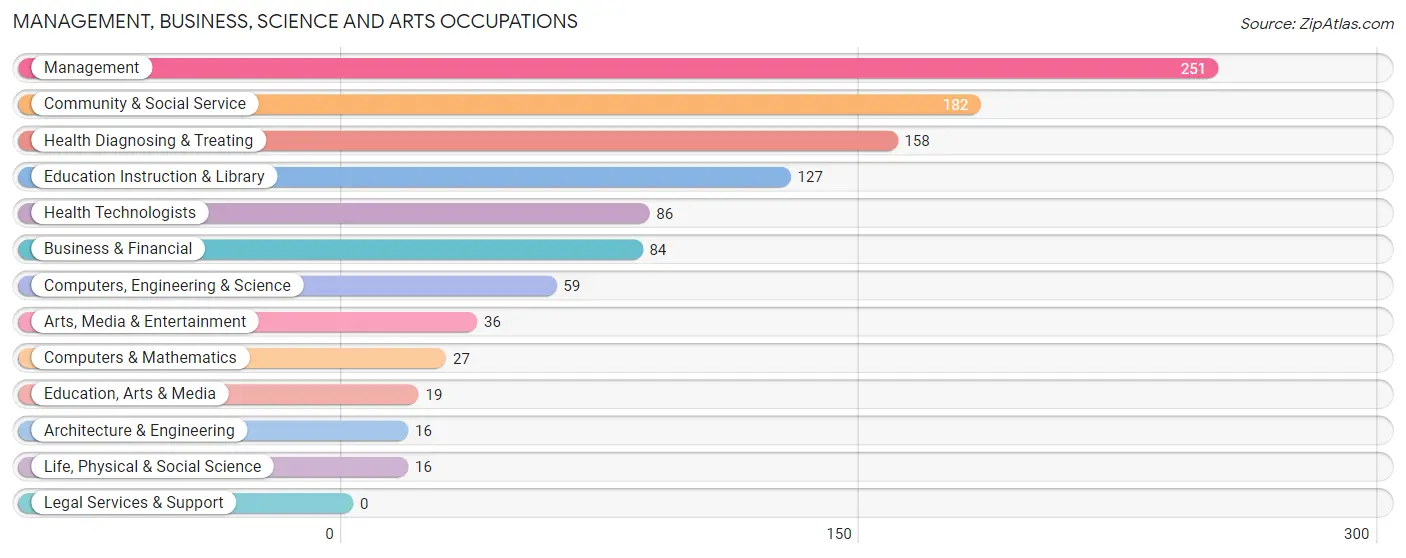
Management, Business, Science and Arts Occupations by Sex
Within the Management, Business, Science and Arts occupations in Clark County, the most male-oriented occupations are Architecture & Engineering (100.0%), Education, Arts & Media (63.2%), and Management (53.0%), while the most female-oriented occupations are Computers & Mathematics (100.0%), Life, Physical & Social Science (100.0%), and Health Diagnosing & Treating (100.0%).
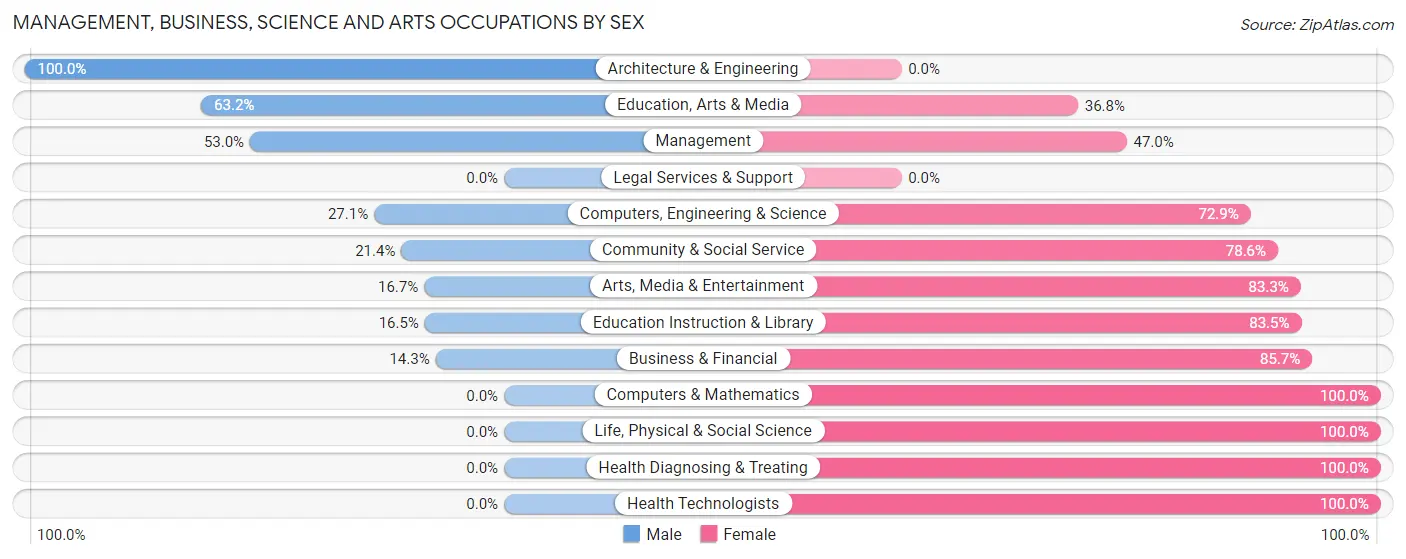
| Occupation | Male | Female |
| Management | 133 (53.0%) | 118 (47.0%) |
| Business & Financial | 12 (14.3%) | 72 (85.7%) |
| Computers, Engineering & Science | 16 (27.1%) | 43 (72.9%) |
| Computers & Mathematics | 0 (0.0%) | 27 (100.0%) |
| Architecture & Engineering | 16 (100.0%) | 0 (0.0%) |
| Life, Physical & Social Science | 0 (0.0%) | 16 (100.0%) |
| Community & Social Service | 39 (21.4%) | 143 (78.6%) |
| Education, Arts & Media | 12 (63.2%) | 7 (36.8%) |
| Legal Services & Support | 0 (0.0%) | 0 (0.0%) |
| Education Instruction & Library | 21 (16.5%) | 106 (83.5%) |
| Arts, Media & Entertainment | 6 (16.7%) | 30 (83.3%) |
| Health Diagnosing & Treating | 0 (0.0%) | 158 (100.0%) |
| Health Technologists | 0 (0.0%) | 86 (100.0%) |
| Total (Category) | 200 (27.3%) | 534 (72.8%) |
| Total (Overall) | 1,552 (54.0%) | 1,322 (46.0%) |
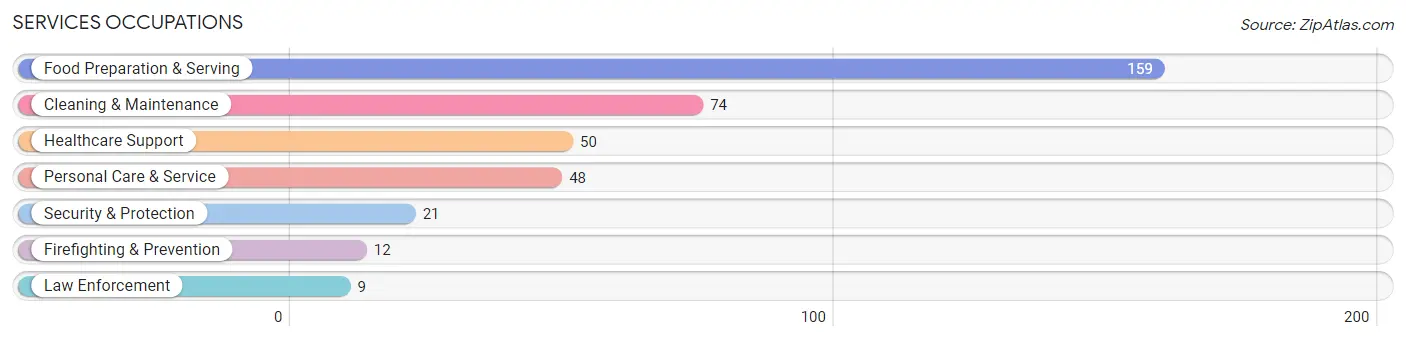
Services Occupations
The most common Services occupations in Clark County are Food Preparation & Serving (159 | 5.5%), Cleaning & Maintenance (74 | 2.6%), Healthcare Support (50 | 1.7%), Personal Care & Service (48 | 1.7%), and Security & Protection (21 | 0.7%).
Services Occupations by Sex
Within the Services occupations in Clark County, the most male-oriented occupations are Firefighting & Prevention (66.7%), Cleaning & Maintenance (59.5%), and Security & Protection (52.4%), while the most female-oriented occupations are Healthcare Support (100.0%), Food Preparation & Serving (76.7%), and Law Enforcement (66.7%).
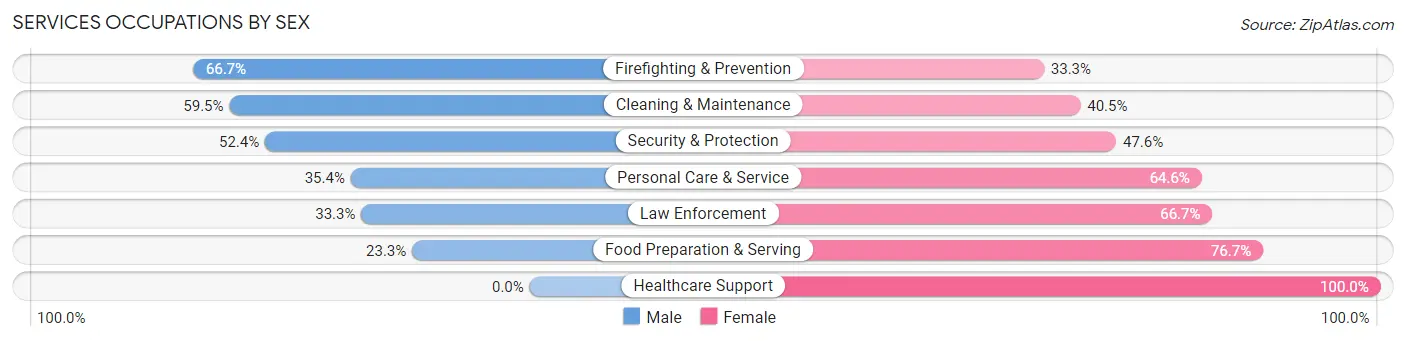
| Occupation | Male | Female |
| Healthcare Support | 0 (0.0%) | 50 (100.0%) |
| Security & Protection | 11 (52.4%) | 10 (47.6%) |
| Firefighting & Prevention | 8 (66.7%) | 4 (33.3%) |
| Law Enforcement | 3 (33.3%) | 6 (66.7%) |
| Food Preparation & Serving | 37 (23.3%) | 122 (76.7%) |
| Cleaning & Maintenance | 44 (59.5%) | 30 (40.5%) |
| Personal Care & Service | 17 (35.4%) | 31 (64.6%) |
| Total (Category) | 109 (31.0%) | 243 (69.0%) |
| Total (Overall) | 1,552 (54.0%) | 1,322 (46.0%) |
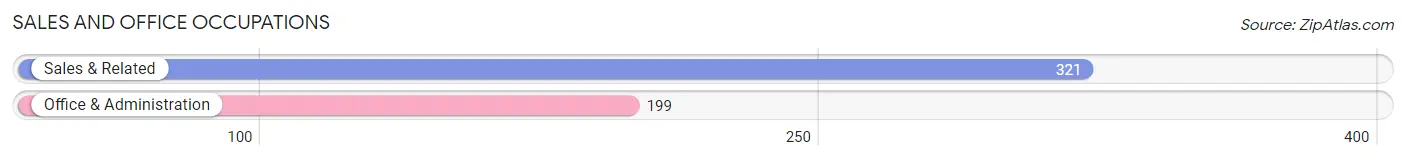
Sales and Office Occupations
The most common Sales and Office occupations in Clark County are Sales & Related (321 | 11.2%), and Office & Administration (199 | 6.9%).
Sales and Office Occupations by Sex
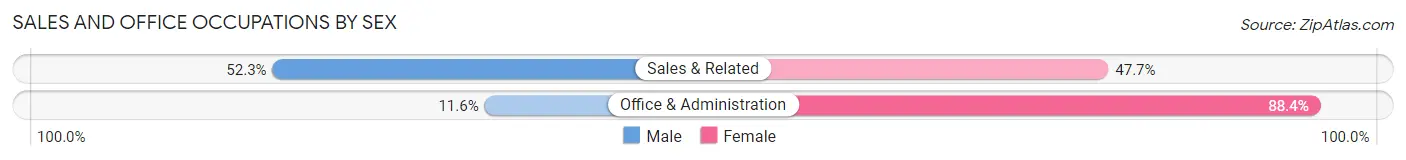
| Occupation | Male | Female |
| Sales & Related | 168 (52.3%) | 153 (47.7%) |
| Office & Administration | 23 (11.6%) | 176 (88.4%) |
| Total (Category) | 191 (36.7%) | 329 (63.3%) |
| Total (Overall) | 1,552 (54.0%) | 1,322 (46.0%) |
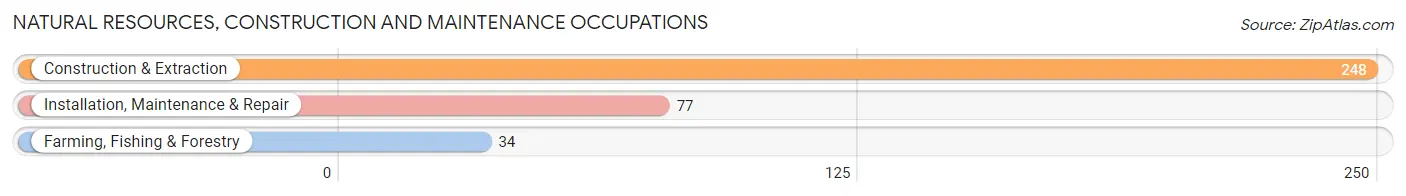
Natural Resources, Construction and Maintenance Occupations
The most common Natural Resources, Construction and Maintenance occupations in Clark County are Construction & Extraction (248 | 8.6%), Installation, Maintenance & Repair (77 | 2.7%), and Farming, Fishing & Forestry (34 | 1.2%).
Natural Resources, Construction and Maintenance Occupations by Sex
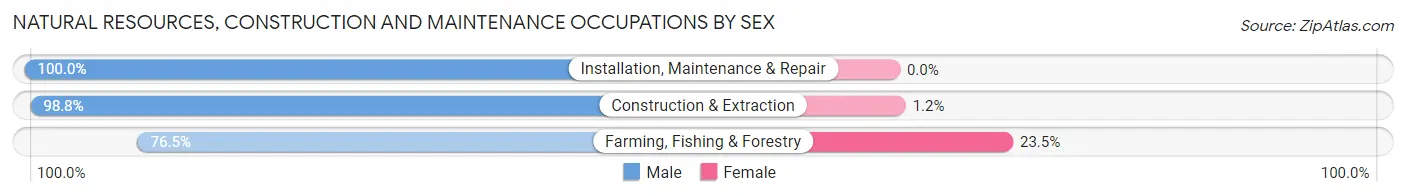
| Occupation | Male | Female |
| Farming, Fishing & Forestry | 26 (76.5%) | 8 (23.5%) |
| Construction & Extraction | 245 (98.8%) | 3 (1.2%) |
| Installation, Maintenance & Repair | 77 (100.0%) | 0 (0.0%) |
| Total (Category) | 348 (96.9%) | 11 (3.1%) |
| Total (Overall) | 1,552 (54.0%) | 1,322 (46.0%) |
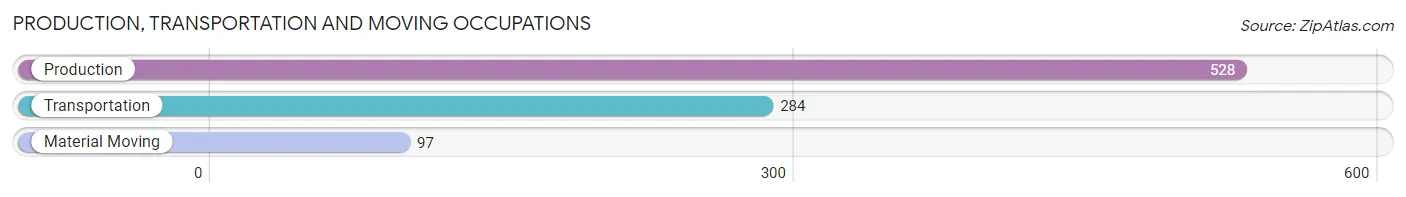
Production, Transportation and Moving Occupations
The most common Production, Transportation and Moving occupations in Clark County are Production (528 | 18.4%), Transportation (284 | 9.9%), and Material Moving (97 | 3.4%).
Production, Transportation and Moving Occupations by Sex
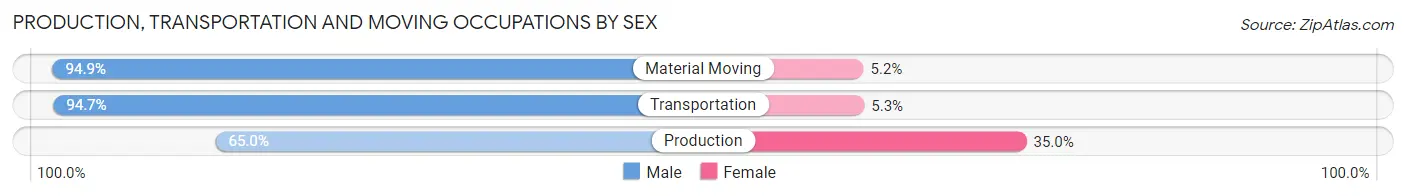
| Occupation | Male | Female |
| Production | 343 (65.0%) | 185 (35.0%) |
| Transportation | 269 (94.7%) | 15 (5.3%) |
| Material Moving | 92 (94.9%) | 5 (5.1%) |
| Total (Category) | 704 (77.4%) | 205 (22.6%) |
| Total (Overall) | 1,552 (54.0%) | 1,322 (46.0%) |
Employment Industries by Sex in Clark County
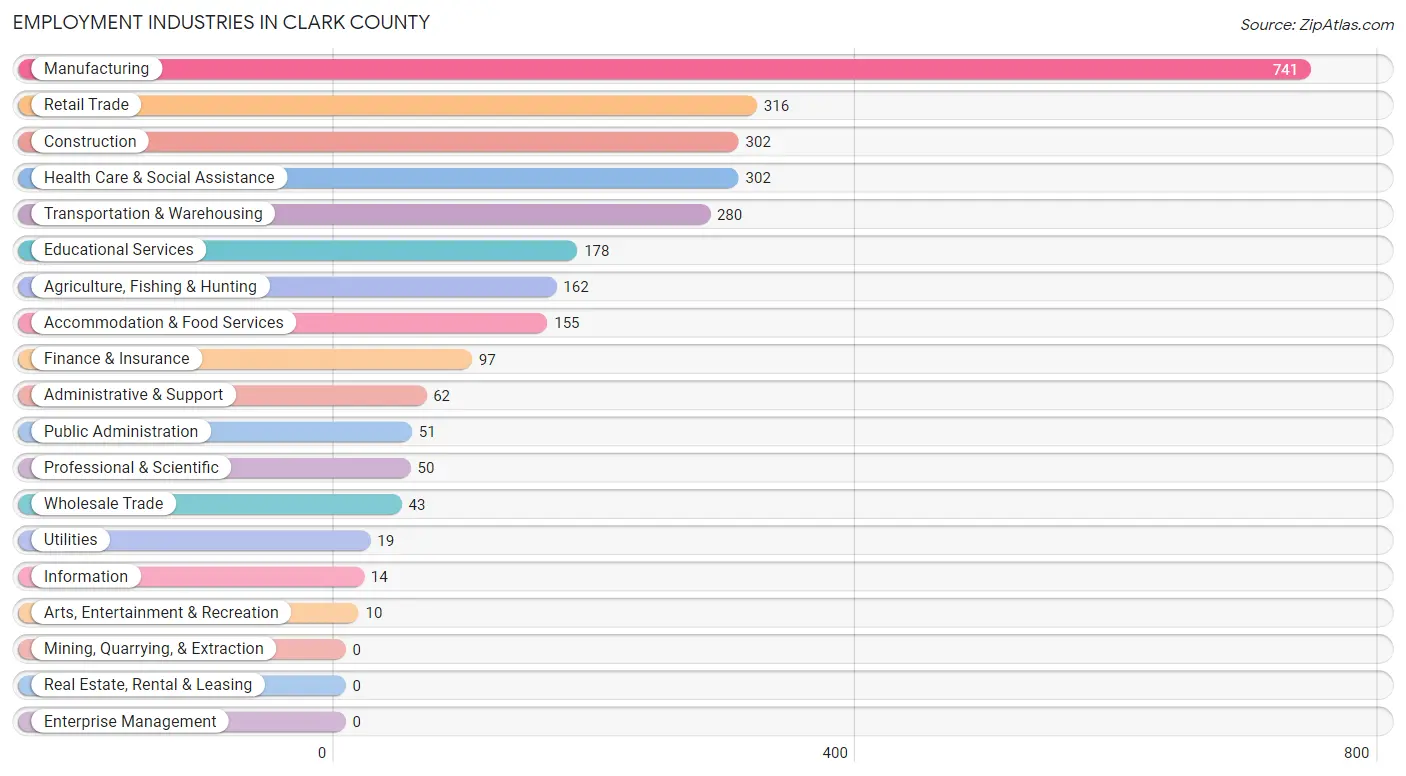
Employment Industries in Clark County
The major employment industries in Clark County include Manufacturing (741 | 25.8%), Retail Trade (316 | 11.0%), Construction (302 | 10.5%), Health Care & Social Assistance (302 | 10.5%), and Transportation & Warehousing (280 | 9.7%).
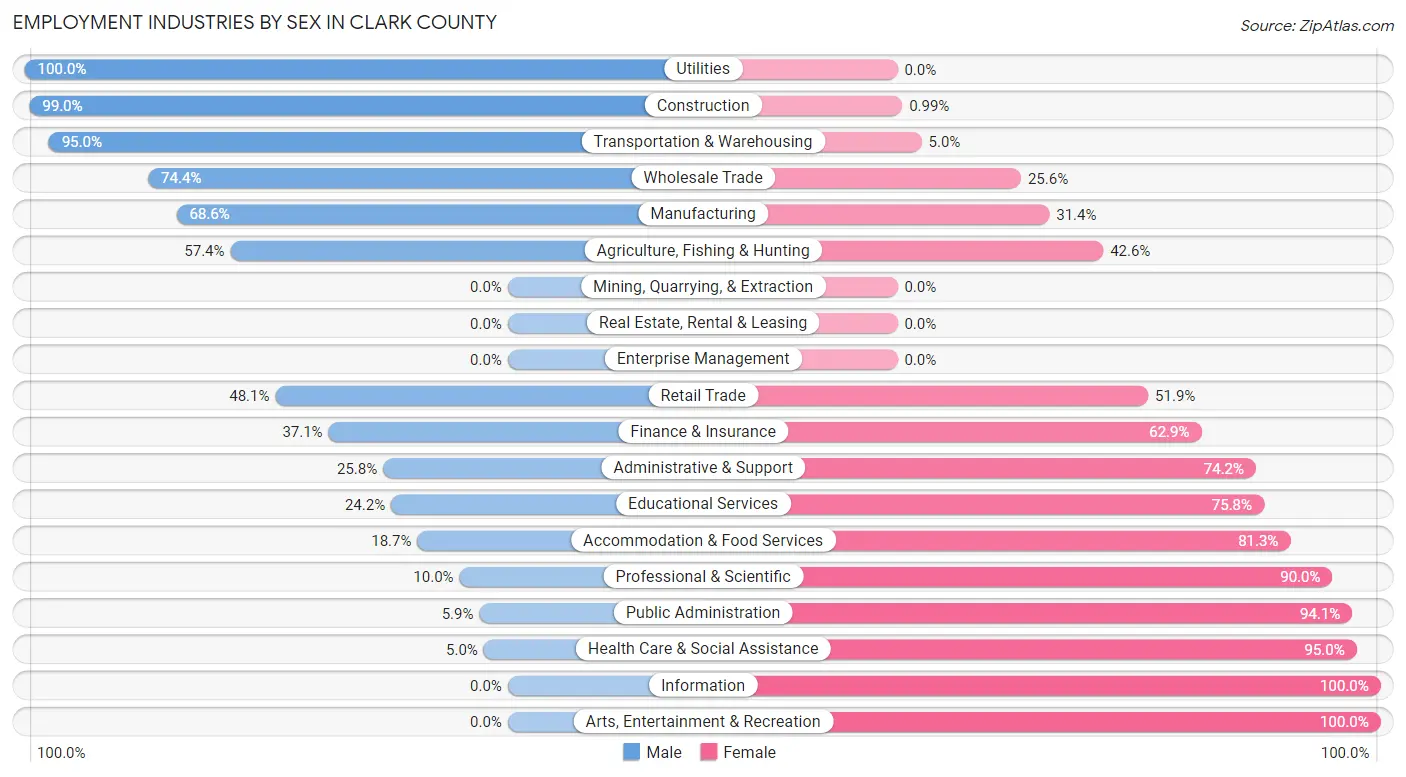
Employment Industries by Sex in Clark County
The Clark County industries that see more men than women are Utilities (100.0%), Construction (99.0%), and Transportation & Warehousing (95.0%), whereas the industries that tend to have a higher number of women are Information (100.0%), Arts, Entertainment & Recreation (100.0%), and Health Care & Social Assistance (95.0%).
| Industry | Male | Female |
| Agriculture, Fishing & Hunting | 93 (57.4%) | 69 (42.6%) |
| Mining, Quarrying, & Extraction | 0 (0.0%) | 0 (0.0%) |
| Construction | 299 (99.0%) | 3 (1.0%) |
| Manufacturing | 508 (68.6%) | 233 (31.4%) |
| Wholesale Trade | 32 (74.4%) | 11 (25.6%) |
| Retail Trade | 152 (48.1%) | 164 (51.9%) |
| Transportation & Warehousing | 266 (95.0%) | 14 (5.0%) |
| Utilities | 19 (100.0%) | 0 (0.0%) |
| Information | 0 (0.0%) | 14 (100.0%) |
| Finance & Insurance | 36 (37.1%) | 61 (62.9%) |
| Real Estate, Rental & Leasing | 0 (0.0%) | 0 (0.0%) |
| Professional & Scientific | 5 (10.0%) | 45 (90.0%) |
| Enterprise Management | 0 (0.0%) | 0 (0.0%) |
| Administrative & Support | 16 (25.8%) | 46 (74.2%) |
| Educational Services | 43 (24.2%) | 135 (75.8%) |
| Health Care & Social Assistance | 15 (5.0%) | 287 (95.0%) |
| Arts, Entertainment & Recreation | 0 (0.0%) | 10 (100.0%) |
| Accommodation & Food Services | 29 (18.7%) | 126 (81.3%) |
| Public Administration | 3 (5.9%) | 48 (94.1%) |
| Total | 1,552 (54.0%) | 1,322 (46.0%) |
Education in Clark County
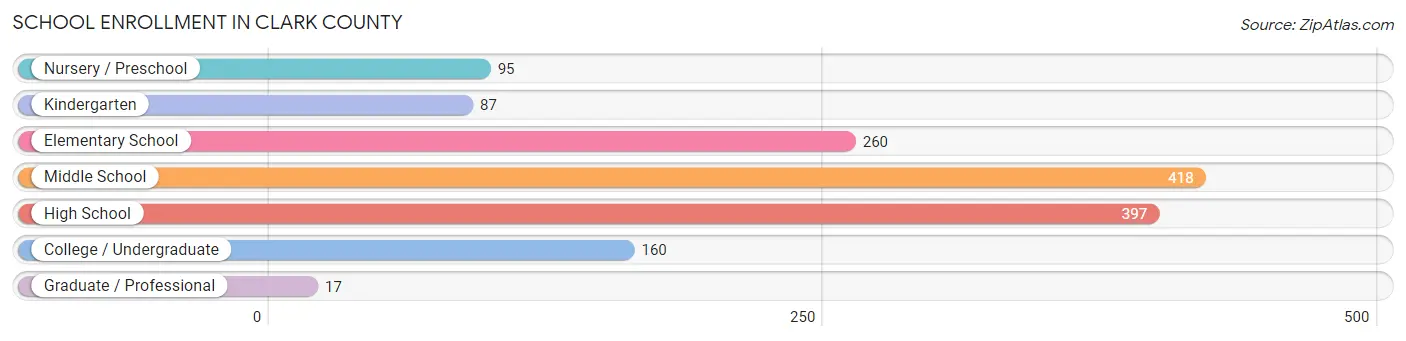
School Enrollment in Clark County
The most common levels of schooling among the 1,434 students in Clark County are middle school (418 | 29.1%), high school (397 | 27.7%), and elementary school (260 | 18.1%).
| School Level | # Students | % Students |
| Nursery / Preschool | 95 | 6.6% |
| Kindergarten | 87 | 6.1% |
| Elementary School | 260 | 18.1% |
| Middle School | 418 | 29.1% |
| High School | 397 | 27.7% |
| College / Undergraduate | 160 | 11.2% |
| Graduate / Professional | 17 | 1.2% |
| Total | 1,434 | 100.0% |
School Enrollment by Age by Funding Source in Clark County
Out of a total of 1,434 students who are enrolled in schools in Clark County, 287 (20.0%) attend a private institution, while the remaining 1,147 (80.0%) are enrolled in public schools. The age group of 35 years and over has the highest likelihood of being enrolled in private schools, with 5 (41.7% in the age bracket) enrolled. Conversely, the age group of 18 to 19 year olds has the lowest likelihood of being enrolled in a private school, with 158 (100.0% in the age bracket) attending a public institution.
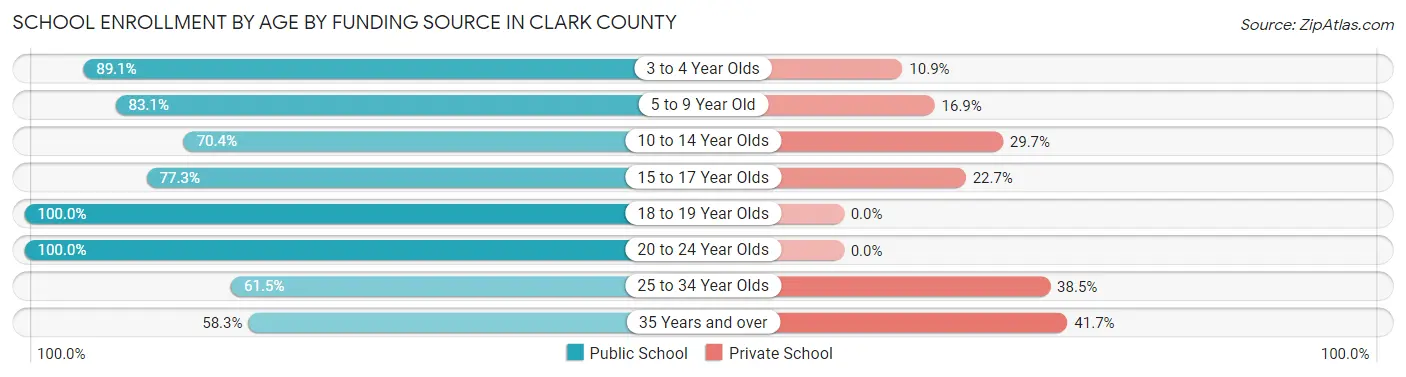
| Age Bracket | Public School | Private School |
| 3 to 4 Year Olds | 57 (89.1%) | 7 (10.9%) |
| 5 to 9 Year Old | 299 (83.1%) | 61 (16.9%) |
| 10 to 14 Year Olds | 318 (70.4%) | 134 (29.6%) |
| 15 to 17 Year Olds | 204 (77.3%) | 60 (22.7%) |
| 18 to 19 Year Olds | 158 (100.0%) | 0 (0.0%) |
| 20 to 24 Year Olds | 72 (100.0%) | 0 (0.0%) |
| 25 to 34 Year Olds | 32 (61.5%) | 20 (38.5%) |
| 35 Years and over | 7 (58.3%) | 5 (41.7%) |
| Total | 1,147 (80.0%) | 287 (20.0%) |
Educational Attainment by Field of Study in Clark County
Education (234 | 35.8%), science & technology (129 | 19.8%), psychology (83 | 12.7%), business (76 | 11.6%), and bio, nature & agricultural (50 | 7.7%) are the most common fields of study among 653 individuals in Clark County who have obtained a bachelor's degree or higher.
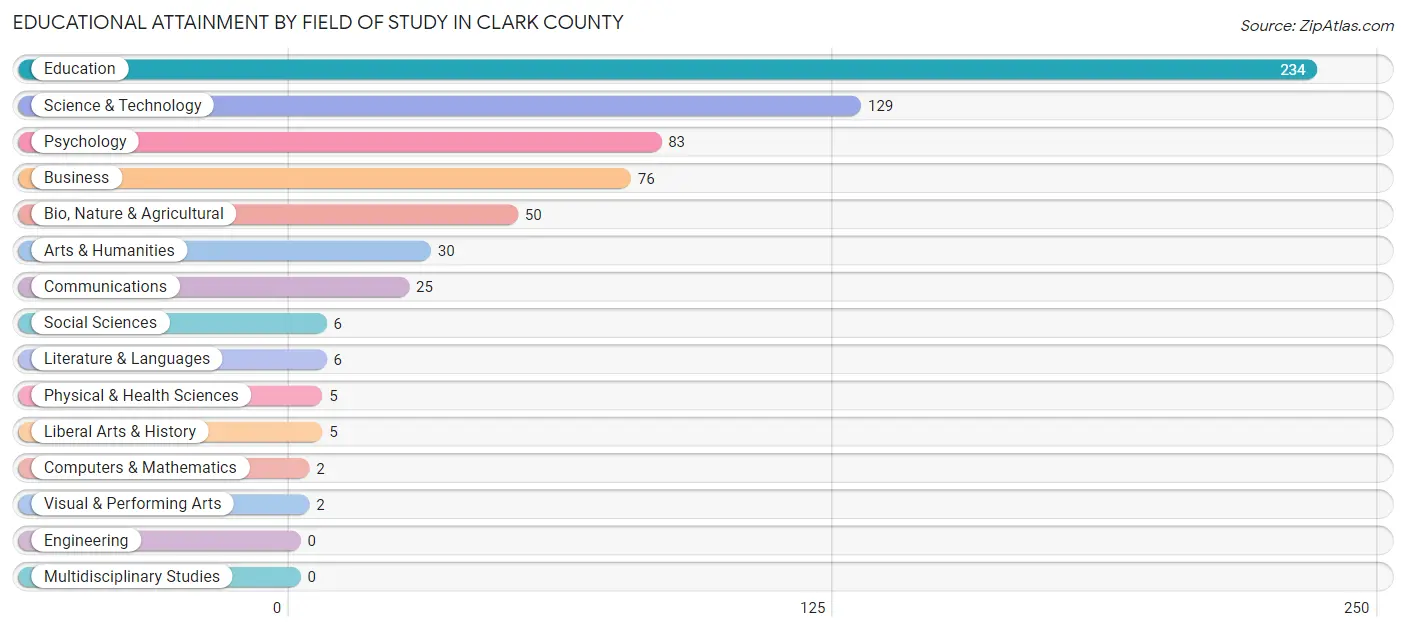
| Field of Study | # Graduates | % Graduates |
| Computers & Mathematics | 2 | 0.3% |
| Bio, Nature & Agricultural | 50 | 7.7% |
| Physical & Health Sciences | 5 | 0.8% |
| Psychology | 83 | 12.7% |
| Social Sciences | 6 | 0.9% |
| Engineering | 0 | 0.0% |
| Multidisciplinary Studies | 0 | 0.0% |
| Science & Technology | 129 | 19.8% |
| Business | 76 | 11.6% |
| Education | 234 | 35.8% |
| Literature & Languages | 6 | 0.9% |
| Liberal Arts & History | 5 | 0.8% |
| Visual & Performing Arts | 2 | 0.3% |
| Communications | 25 | 3.8% |
| Arts & Humanities | 30 | 4.6% |
| Total | 653 | 100.0% |
Transportation & Commute in Clark County
Vehicle Availability by Sex in Clark County
The most prevalent vehicle ownership categories in Clark County are males with 2 vehicles (608, accounting for 39.5%) and females with 2 vehicles (460, making up 47.1%).
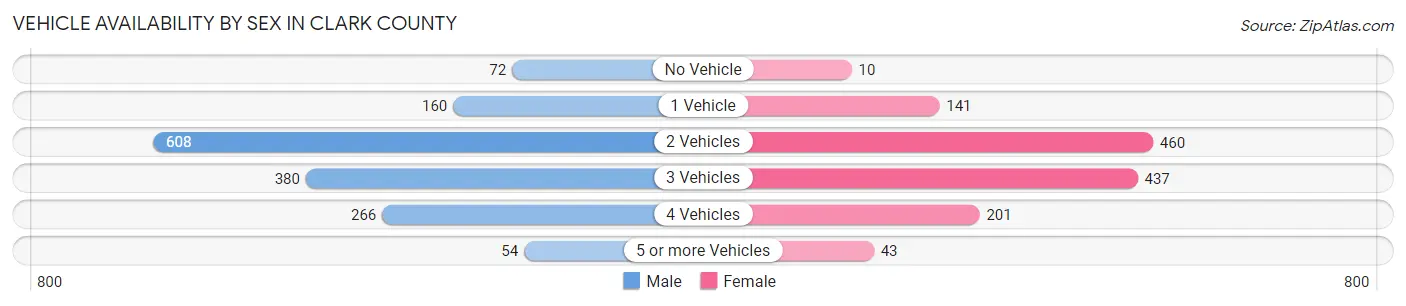
| Vehicles Available | Male | Female |
| No Vehicle | 72 (4.7%) | 10 (0.8%) |
| 1 Vehicle | 160 (10.4%) | 141 (10.9%) |
| 2 Vehicles | 608 (39.5%) | 460 (35.6%) |
| 3 Vehicles | 380 (24.7%) | 437 (33.8%) |
| 4 Vehicles | 266 (17.3%) | 201 (15.6%) |
| 5 or more Vehicles | 54 (3.5%) | 43 (3.3%) |
| Total | 1,540 (100.0%) | 1,292 (100.0%) |
Commute Time in Clark County
The most frequently occuring commute durations in Clark County are 45 to 59 minutes (375 commuters, 14.2%), 5 to 9 minutes (338 commuters, 12.8%), and 15 to 19 minutes (321 commuters, 12.2%).
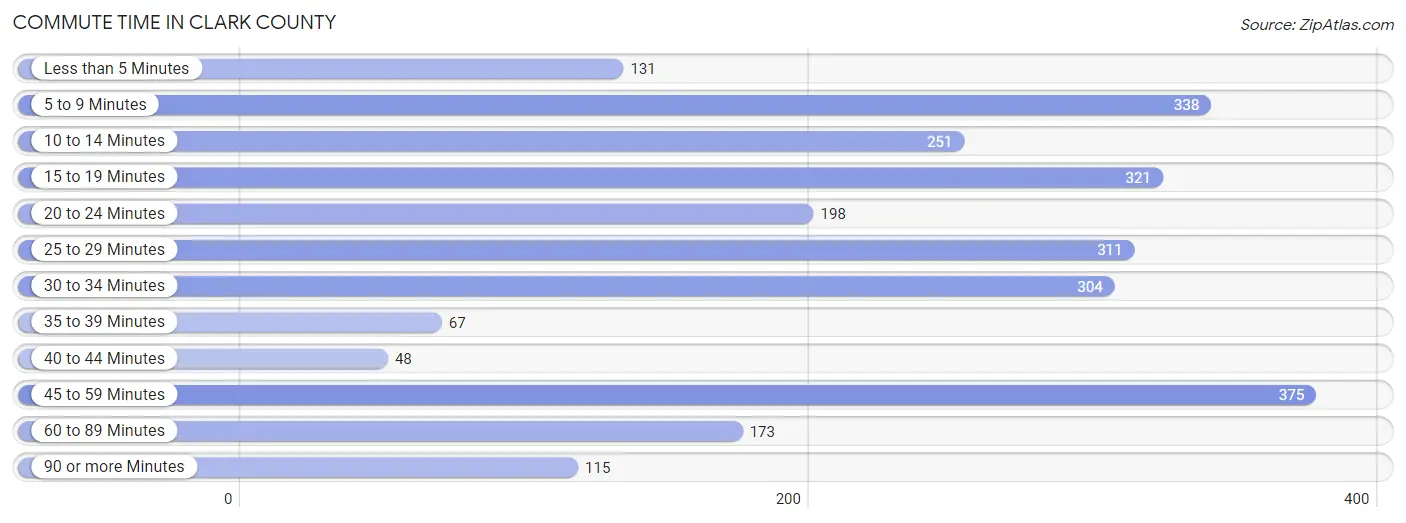
| Commute Time | # Commuters | % Commuters |
| Less than 5 Minutes | 131 | 5.0% |
| 5 to 9 Minutes | 338 | 12.8% |
| 10 to 14 Minutes | 251 | 9.5% |
| 15 to 19 Minutes | 321 | 12.2% |
| 20 to 24 Minutes | 198 | 7.5% |
| 25 to 29 Minutes | 311 | 11.8% |
| 30 to 34 Minutes | 304 | 11.6% |
| 35 to 39 Minutes | 67 | 2.5% |
| 40 to 44 Minutes | 48 | 1.8% |
| 45 to 59 Minutes | 375 | 14.2% |
| 60 to 89 Minutes | 173 | 6.6% |
| 90 or more Minutes | 115 | 4.4% |
Commute Time by Sex in Clark County
The most common commute times in Clark County are 25 to 29 minutes (209 commuters, 14.3%) for males and 45 to 59 minutes (226 commuters, 19.3%) for females.
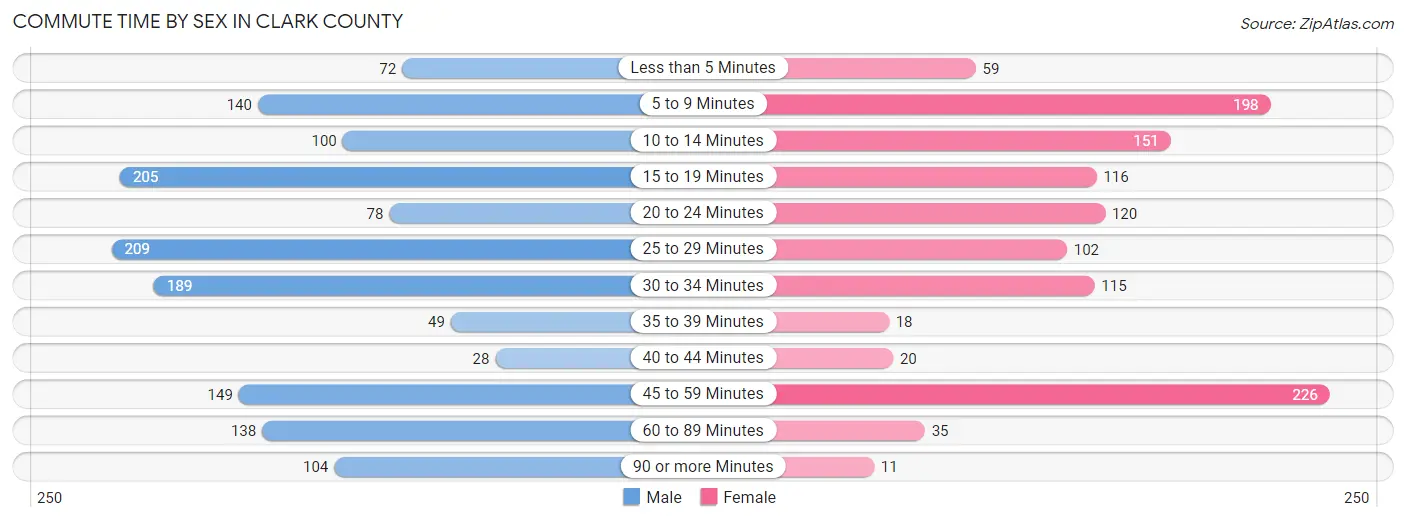
| Commute Time | Male | Female |
| Less than 5 Minutes | 72 (4.9%) | 59 (5.0%) |
| 5 to 9 Minutes | 140 (9.6%) | 198 (16.9%) |
| 10 to 14 Minutes | 100 (6.8%) | 151 (12.9%) |
| 15 to 19 Minutes | 205 (14.0%) | 116 (9.9%) |
| 20 to 24 Minutes | 78 (5.3%) | 120 (10.2%) |
| 25 to 29 Minutes | 209 (14.3%) | 102 (8.7%) |
| 30 to 34 Minutes | 189 (12.9%) | 115 (9.8%) |
| 35 to 39 Minutes | 49 (3.4%) | 18 (1.5%) |
| 40 to 44 Minutes | 28 (1.9%) | 20 (1.7%) |
| 45 to 59 Minutes | 149 (10.2%) | 226 (19.3%) |
| 60 to 89 Minutes | 138 (9.5%) | 35 (3.0%) |
| 90 or more Minutes | 104 (7.1%) | 11 (0.9%) |
Time of Departure to Work by Sex in Clark County
The most frequent times of departure to work in Clark County are 12:00 PM to 3:59 PM (291, 19.9%) for males and 7:30 AM to 7:59 AM (266, 22.7%) for females.
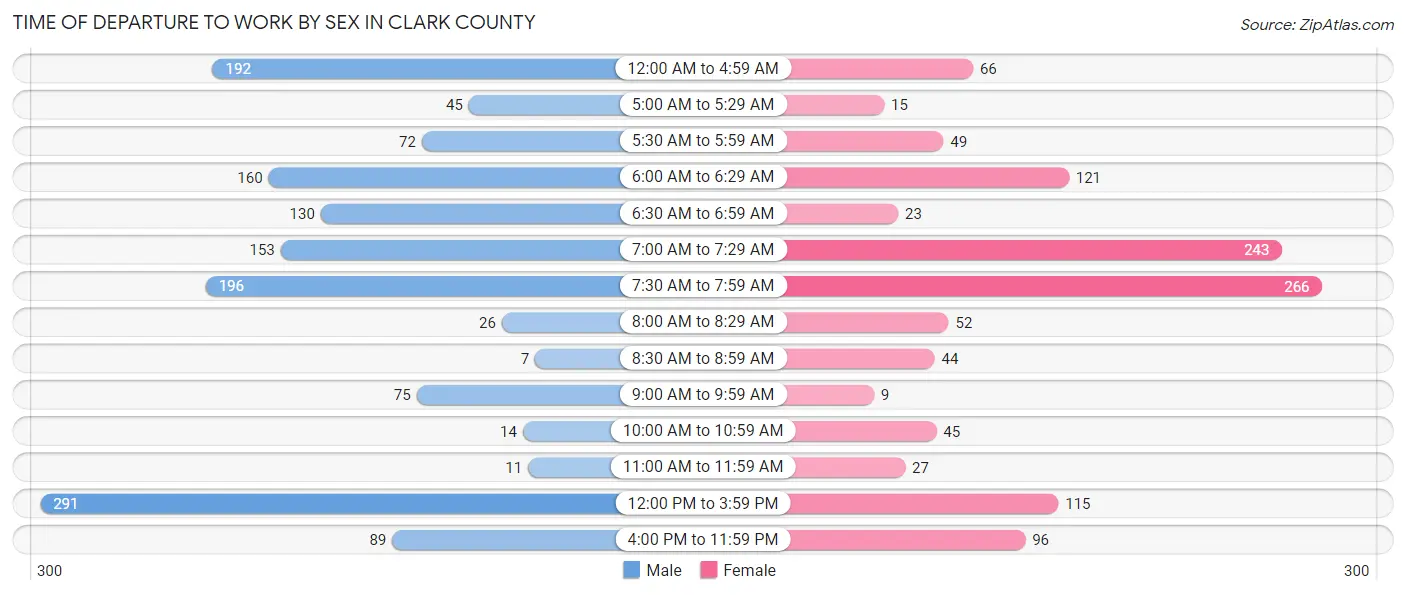
| Time of Departure | Male | Female |
| 12:00 AM to 4:59 AM | 192 (13.1%) | 66 (5.6%) |
| 5:00 AM to 5:29 AM | 45 (3.1%) | 15 (1.3%) |
| 5:30 AM to 5:59 AM | 72 (4.9%) | 49 (4.2%) |
| 6:00 AM to 6:29 AM | 160 (11.0%) | 121 (10.3%) |
| 6:30 AM to 6:59 AM | 130 (8.9%) | 23 (2.0%) |
| 7:00 AM to 7:29 AM | 153 (10.5%) | 243 (20.7%) |
| 7:30 AM to 7:59 AM | 196 (13.4%) | 266 (22.7%) |
| 8:00 AM to 8:29 AM | 26 (1.8%) | 52 (4.4%) |
| 8:30 AM to 8:59 AM | 7 (0.5%) | 44 (3.8%) |
| 9:00 AM to 9:59 AM | 75 (5.1%) | 9 (0.8%) |
| 10:00 AM to 10:59 AM | 14 (1.0%) | 45 (3.8%) |
| 11:00 AM to 11:59 AM | 11 (0.7%) | 27 (2.3%) |
| 12:00 PM to 3:59 PM | 291 (19.9%) | 115 (9.8%) |
| 4:00 PM to 11:59 PM | 89 (6.1%) | 96 (8.2%) |
| Total | 1,461 (100.0%) | 1,171 (100.0%) |
Housing Occupancy in Clark County
Occupancy by Ownership in Clark County
Of the total 2,300 dwellings in Clark County, owner-occupied units account for 1,804 (78.4%), while renter-occupied units make up 496 (21.6%).
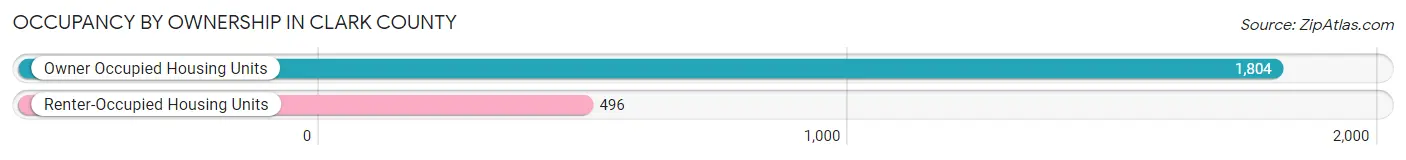
| Occupancy | # Housing Units | % Housing Units |
| Owner Occupied Housing Units | 1,804 | 78.4% |
| Renter-Occupied Housing Units | 496 | 21.6% |
| Total Occupied Housing Units | 2,300 | 100.0% |
Occupancy by Household Size in Clark County
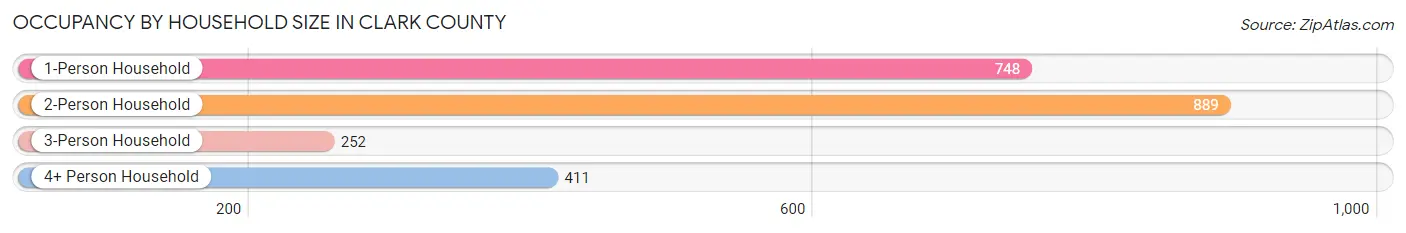
| Household Size | # Housing Units | % Housing Units |
| 1-Person Household | 748 | 32.5% |
| 2-Person Household | 889 | 38.7% |
| 3-Person Household | 252 | 11.0% |
| 4+ Person Household | 411 | 17.9% |
| Total Housing Units | 2,300 | 100.0% |
Occupancy by Ownership by Household Size in Clark County
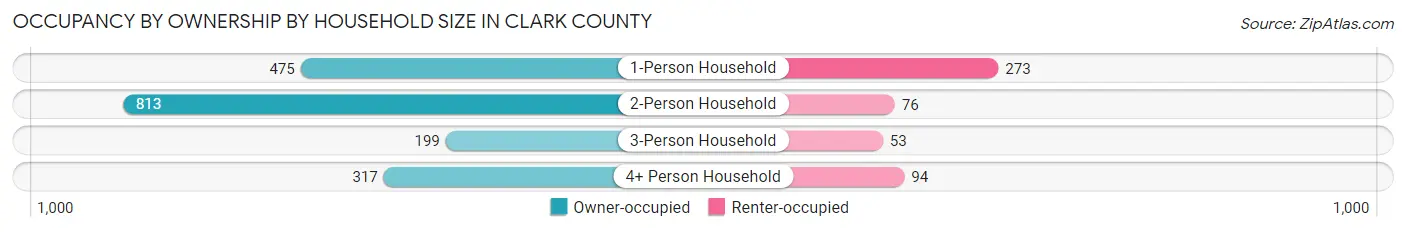
| Household Size | Owner-occupied | Renter-occupied |
| 1-Person Household | 475 (63.5%) | 273 (36.5%) |
| 2-Person Household | 813 (91.4%) | 76 (8.6%) |
| 3-Person Household | 199 (79.0%) | 53 (21.0%) |
| 4+ Person Household | 317 (77.1%) | 94 (22.9%) |
| Total Housing Units | 1,804 (78.4%) | 496 (21.6%) |
Occupancy by Educational Attainment in Clark County
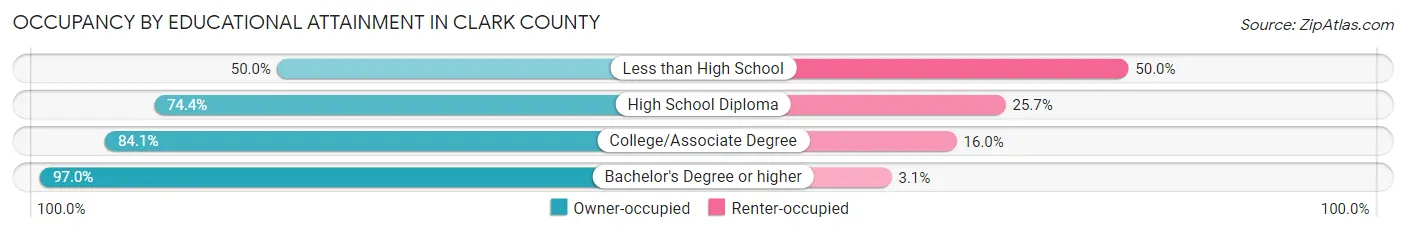
| Household Size | Owner-occupied | Renter-occupied |
| Less than High School | 110 (50.0%) | 110 (50.0%) |
| High School Diploma | 806 (74.4%) | 278 (25.7%) |
| College/Associate Degree | 506 (84.1%) | 96 (16.0%) |
| Bachelor's Degree or higher | 382 (97.0%) | 12 (3.0%) |
Occupancy by Age of Householder in Clark County
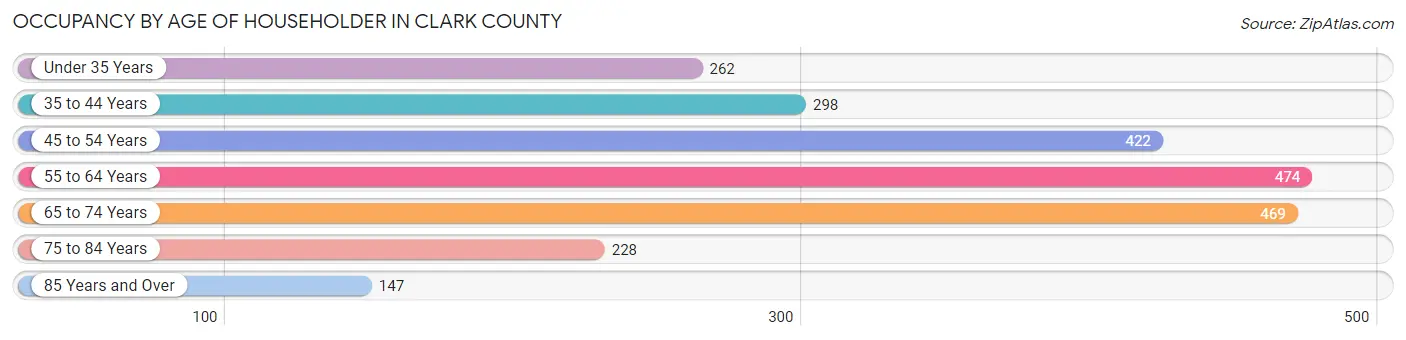
| Age Bracket | # Households | % Households |
| Under 35 Years | 262 | 11.4% |
| 35 to 44 Years | 298 | 13.0% |
| 45 to 54 Years | 422 | 18.3% |
| 55 to 64 Years | 474 | 20.6% |
| 65 to 74 Years | 469 | 20.4% |
| 75 to 84 Years | 228 | 9.9% |
| 85 Years and Over | 147 | 6.4% |
| Total | 2,300 | 100.0% |
Housing Finances in Clark County
Median Income by Occupancy in Clark County
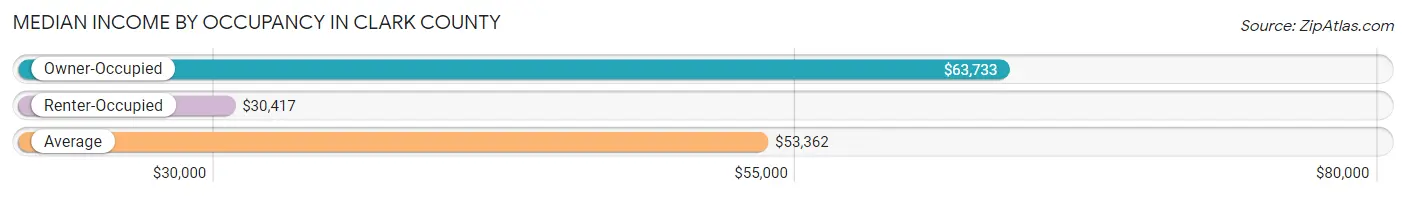
| Occupancy Type | # Households | Median Income |
| Owner-Occupied | 1,804 (78.4%) | $63,733 |
| Renter-Occupied | 496 (21.6%) | $30,417 |
| Average | 2,300 (100.0%) | $53,362 |
Occupancy by Householder Income Bracket in Clark County
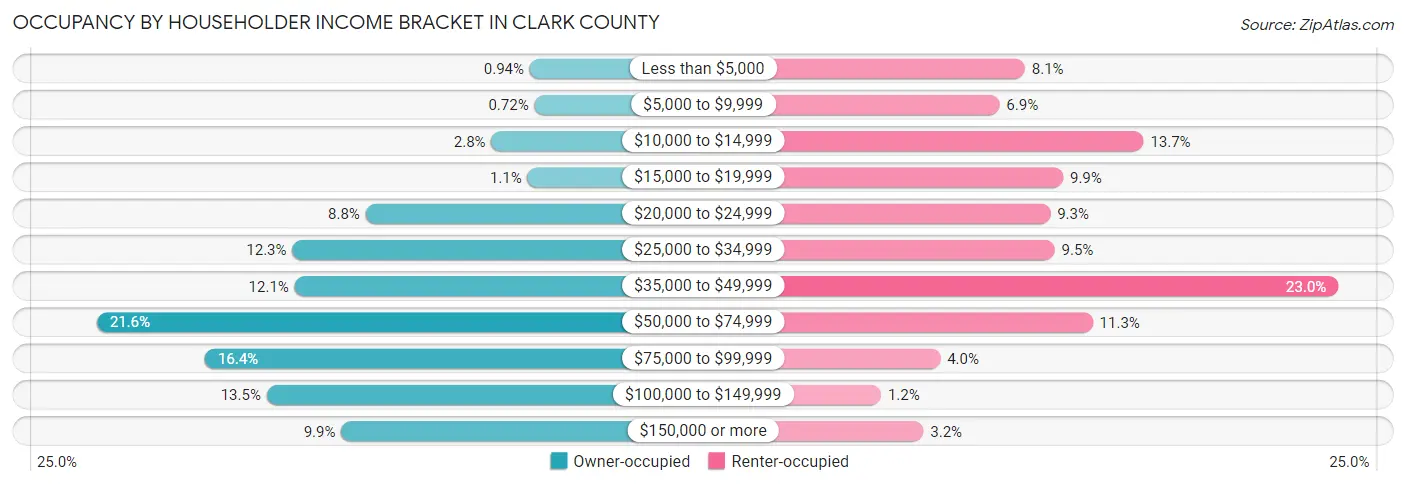
| Income Bracket | Owner-occupied | Renter-occupied |
| Less than $5,000 | 17 (0.9%) | 40 (8.1%) |
| $5,000 to $9,999 | 13 (0.7%) | 34 (6.9%) |
| $10,000 to $14,999 | 50 (2.8%) | 68 (13.7%) |
| $15,000 to $19,999 | 19 (1.1%) | 49 (9.9%) |
| $20,000 to $24,999 | 158 (8.8%) | 46 (9.3%) |
| $25,000 to $34,999 | 221 (12.2%) | 47 (9.5%) |
| $35,000 to $49,999 | 219 (12.1%) | 114 (23.0%) |
| $50,000 to $74,999 | 389 (21.6%) | 56 (11.3%) |
| $75,000 to $99,999 | 296 (16.4%) | 20 (4.0%) |
| $100,000 to $149,999 | 243 (13.5%) | 6 (1.2%) |
| $150,000 or more | 179 (9.9%) | 16 (3.2%) |
| Total | 1,804 (100.0%) | 496 (100.0%) |
Monthly Housing Cost Tiers in Clark County
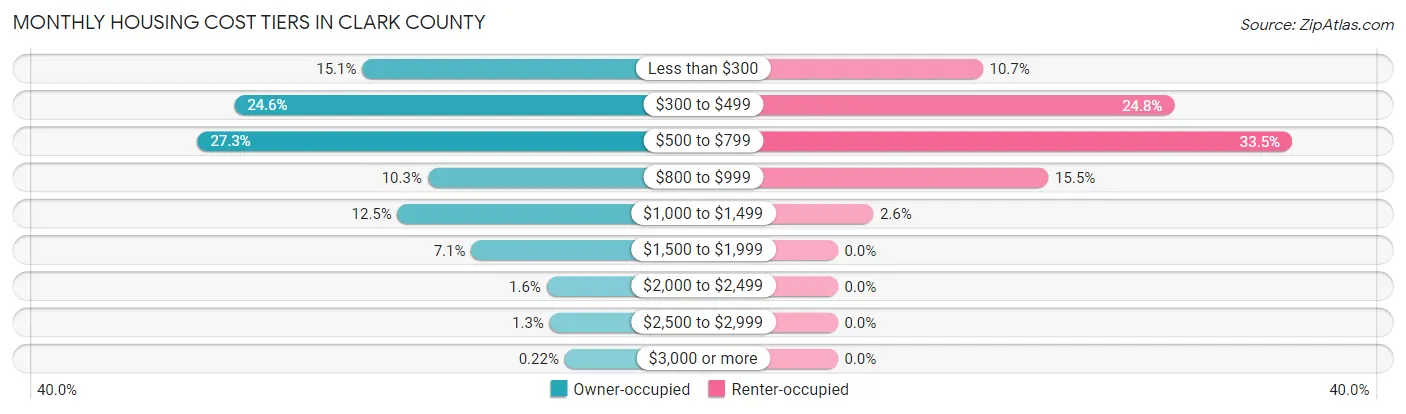
| Monthly Cost | Owner-occupied | Renter-occupied |
| Less than $300 | 273 (15.1%) | 53 (10.7%) |
| $300 to $499 | 443 (24.6%) | 123 (24.8%) |
| $500 to $799 | 492 (27.3%) | 166 (33.5%) |
| $800 to $999 | 186 (10.3%) | 77 (15.5%) |
| $1,000 to $1,499 | 226 (12.5%) | 13 (2.6%) |
| $1,500 to $1,999 | 128 (7.1%) | 0 (0.0%) |
| $2,000 to $2,499 | 28 (1.5%) | 0 (0.0%) |
| $2,500 to $2,999 | 24 (1.3%) | 0 (0.0%) |
| $3,000 or more | 4 (0.2%) | 0 (0.0%) |
| Total | 1,804 (100.0%) | 496 (100.0%) |
Physical Housing Characteristics in Clark County
Housing Structures in Clark County
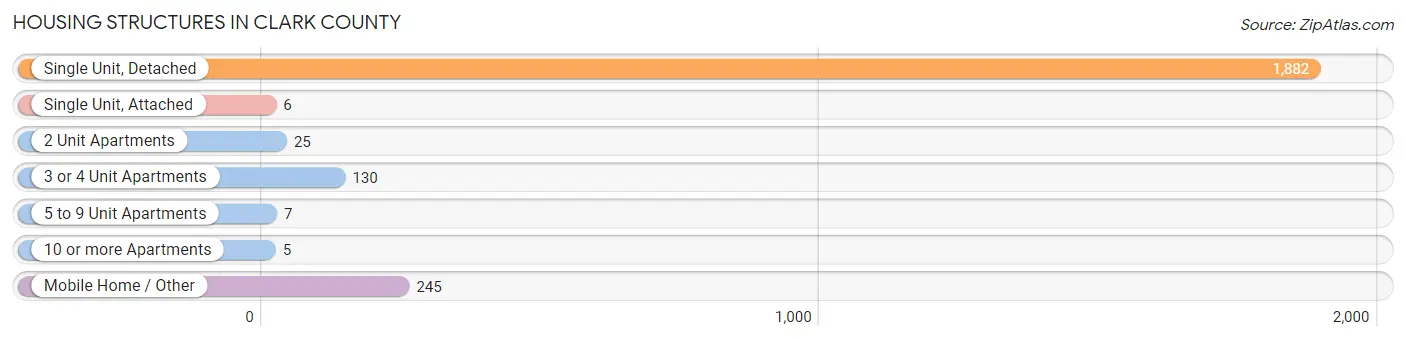
| Structure Type | # Housing Units | % Housing Units |
| Single Unit, Detached | 1,882 | 81.8% |
| Single Unit, Attached | 6 | 0.3% |
| 2 Unit Apartments | 25 | 1.1% |
| 3 or 4 Unit Apartments | 130 | 5.7% |
| 5 to 9 Unit Apartments | 7 | 0.3% |
| 10 or more Apartments | 5 | 0.2% |
| Mobile Home / Other | 245 | 10.6% |
| Total | 2,300 | 100.0% |
Housing Structures by Occupancy in Clark County
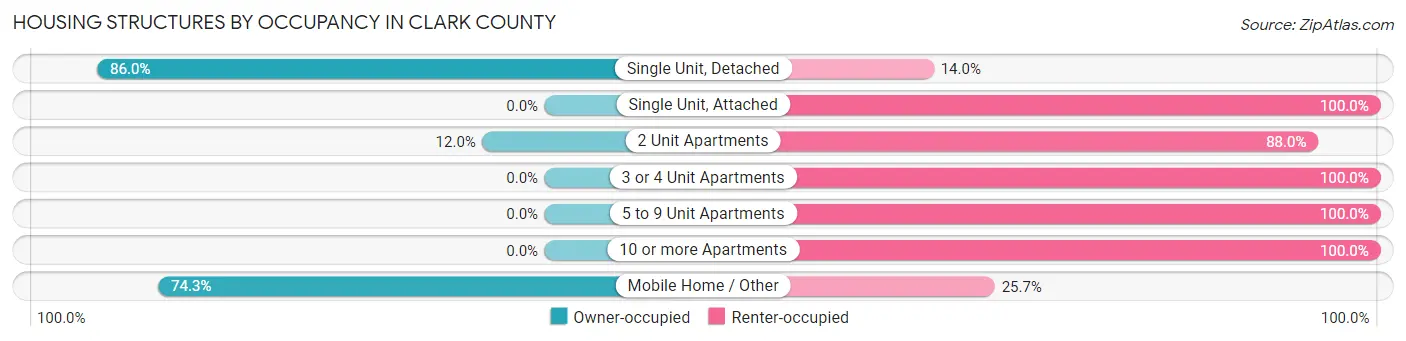
| Structure Type | Owner-occupied | Renter-occupied |
| Single Unit, Detached | 1,619 (86.0%) | 263 (14.0%) |
| Single Unit, Attached | 0 (0.0%) | 6 (100.0%) |
| 2 Unit Apartments | 3 (12.0%) | 22 (88.0%) |
| 3 or 4 Unit Apartments | 0 (0.0%) | 130 (100.0%) |
| 5 to 9 Unit Apartments | 0 (0.0%) | 7 (100.0%) |
| 10 or more Apartments | 0 (0.0%) | 5 (100.0%) |
| Mobile Home / Other | 182 (74.3%) | 63 (25.7%) |
| Total | 1,804 (78.4%) | 496 (21.6%) |
Housing Structures by Number of Rooms in Clark County
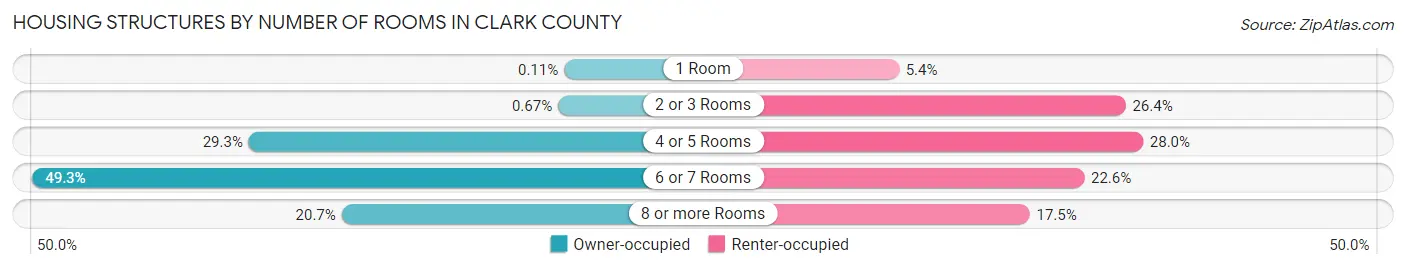
| Number of Rooms | Owner-occupied | Renter-occupied |
| 1 Room | 2 (0.1%) | 27 (5.4%) |
| 2 or 3 Rooms | 12 (0.7%) | 131 (26.4%) |
| 4 or 5 Rooms | 528 (29.3%) | 139 (28.0%) |
| 6 or 7 Rooms | 889 (49.3%) | 112 (22.6%) |
| 8 or more Rooms | 373 (20.7%) | 87 (17.5%) |
| Total | 1,804 (100.0%) | 496 (100.0%) |
Housing Structure by Heating Type in Clark County
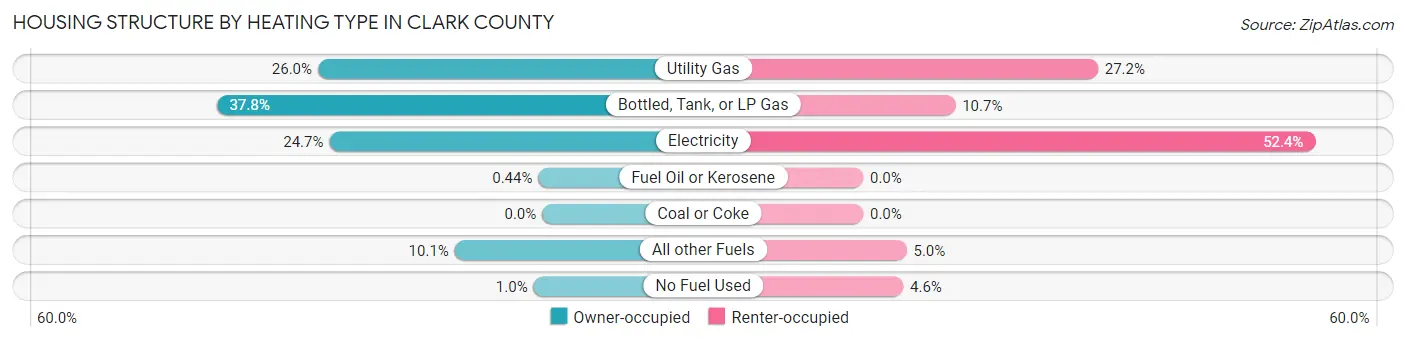
| Heating Type | Owner-occupied | Renter-occupied |
| Utility Gas | 469 (26.0%) | 135 (27.2%) |
| Bottled, Tank, or LP Gas | 681 (37.8%) | 53 (10.7%) |
| Electricity | 445 (24.7%) | 260 (52.4%) |
| Fuel Oil or Kerosene | 8 (0.4%) | 0 (0.0%) |
| Coal or Coke | 0 (0.0%) | 0 (0.0%) |
| All other Fuels | 183 (10.1%) | 25 (5.0%) |
| No Fuel Used | 18 (1.0%) | 23 (4.6%) |
| Total | 1,804 (100.0%) | 496 (100.0%) |
Household Vehicle Usage in Clark County
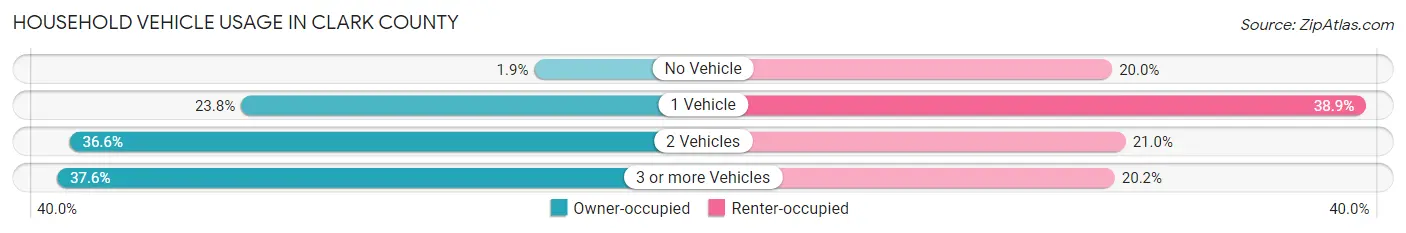
| Vehicles per Household | Owner-occupied | Renter-occupied |
| No Vehicle | 35 (1.9%) | 99 (20.0%) |
| 1 Vehicle | 430 (23.8%) | 193 (38.9%) |
| 2 Vehicles | 661 (36.6%) | 104 (21.0%) |
| 3 or more Vehicles | 678 (37.6%) | 100 (20.2%) |
| Total | 1,804 (100.0%) | 496 (100.0%) |
Real Estate & Mortgages in Clark County
Real Estate and Mortgage Overview in Clark County
| Characteristic | Without Mortgage | With Mortgage |
| Housing Units | 1,137 | 667 |
| Median Property Value | $115,200 | $144,100 |
| Median Household Income | $47,846 | $88 |
| Monthly Housing Costs | $430 | $4 |
| Real Estate Taxes | $1,146 | $9 |
Property Value by Mortgage Status in Clark County
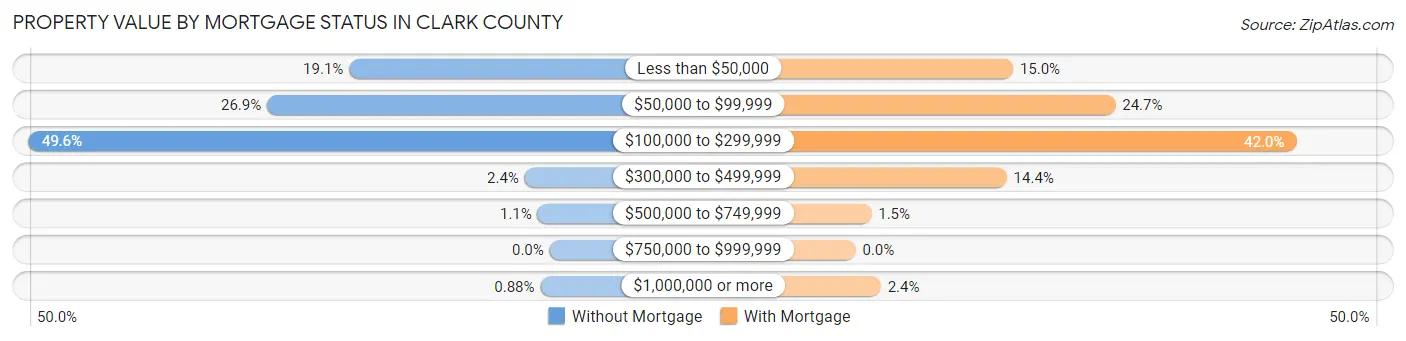
| Property Value | Without Mortgage | With Mortgage |
| Less than $50,000 | 217 (19.1%) | 100 (15.0%) |
| $50,000 to $99,999 | 306 (26.9%) | 165 (24.7%) |
| $100,000 to $299,999 | 564 (49.6%) | 280 (42.0%) |
| $300,000 to $499,999 | 27 (2.4%) | 96 (14.4%) |
| $500,000 to $749,999 | 13 (1.1%) | 10 (1.5%) |
| $750,000 to $999,999 | 0 (0.0%) | 0 (0.0%) |
| $1,000,000 or more | 10 (0.9%) | 16 (2.4%) |
| Total | 1,137 (100.0%) | 667 (100.0%) |
Household Income by Mortgage Status in Clark County
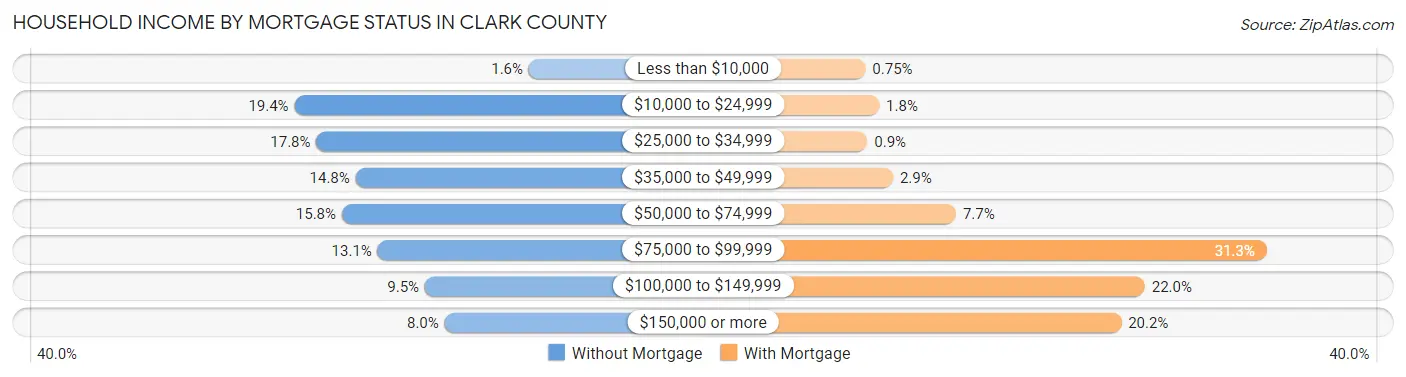
| Household Income | Without Mortgage | With Mortgage |
| Less than $10,000 | 18 (1.6%) | 5 (0.7%) |
| $10,000 to $24,999 | 221 (19.4%) | 12 (1.8%) |
| $25,000 to $34,999 | 202 (17.8%) | 6 (0.9%) |
| $35,000 to $49,999 | 168 (14.8%) | 19 (2.9%) |
| $50,000 to $74,999 | 180 (15.8%) | 51 (7.6%) |
| $75,000 to $99,999 | 149 (13.1%) | 209 (31.3%) |
| $100,000 to $149,999 | 108 (9.5%) | 147 (22.0%) |
| $150,000 or more | 91 (8.0%) | 135 (20.2%) |
| Total | 1,137 (100.0%) | 667 (100.0%) |
Property Value to Household Income Ratio in Clark County
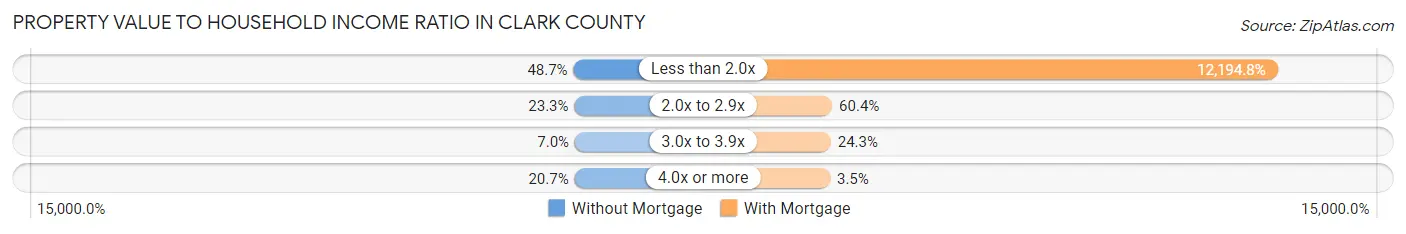
| Value-to-Income Ratio | Without Mortgage | With Mortgage |
| Less than 2.0x | 554 (48.7%) | 81,339 (12,194.8%) |
| 2.0x to 2.9x | 265 (23.3%) | 403 (60.4%) |
| 3.0x to 3.9x | 79 (7.0%) | 162 (24.3%) |
| 4.0x or more | 235 (20.7%) | 23 (3.5%) |
| Total | 1,137 (100.0%) | 667 (100.0%) |
Real Estate Taxes by Mortgage Status in Clark County
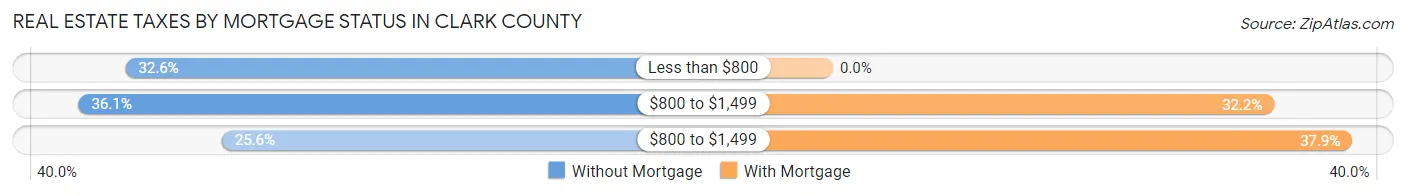
| Property Taxes | Without Mortgage | With Mortgage |
| Less than $800 | 371 (32.6%) | 0 (0.0%) |
| $800 to $1,499 | 410 (36.1%) | 215 (32.2%) |
| $800 to $1,499 | 291 (25.6%) | 253 (37.9%) |
| Total | 1,137 (100.0%) | 667 (100.0%) |
Health & Disability in Clark County
Health Insurance Coverage by Age in Clark County
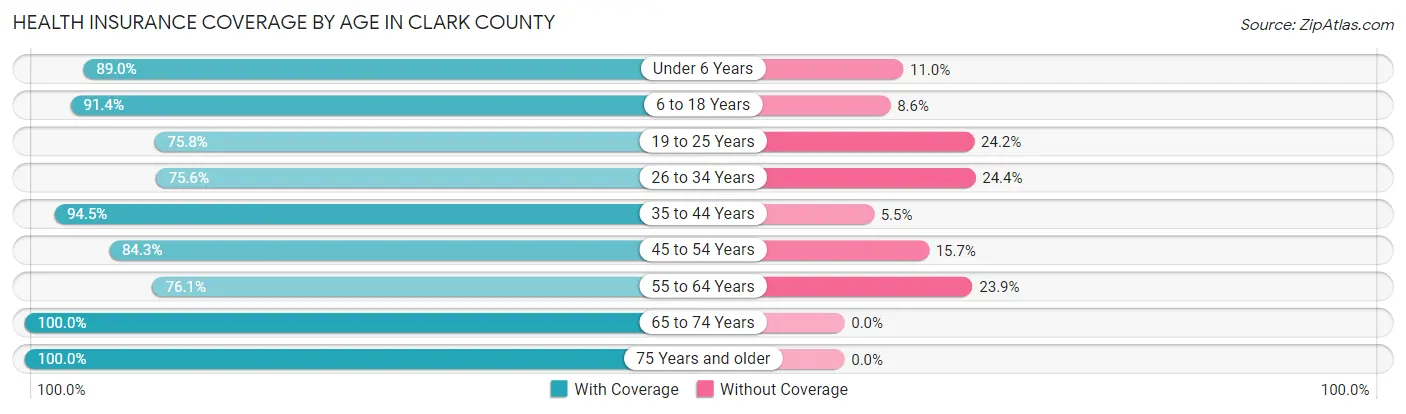
| Age Bracket | With Coverage | Without Coverage |
| Under 6 Years | 455 (89.0%) | 56 (11.0%) |
| 6 to 18 Years | 1,142 (91.4%) | 107 (8.6%) |
| 19 to 25 Years | 288 (75.8%) | 92 (24.2%) |
| 26 to 34 Years | 464 (75.6%) | 150 (24.4%) |
| 35 to 44 Years | 673 (94.5%) | 39 (5.5%) |
| 45 to 54 Years | 664 (84.3%) | 124 (15.7%) |
| 55 to 64 Years | 765 (76.1%) | 240 (23.9%) |
| 65 to 74 Years | 785 (100.0%) | 0 (0.0%) |
| 75 Years and older | 569 (100.0%) | 0 (0.0%) |
| Total | 5,805 (87.8%) | 808 (12.2%) |
Health Insurance Coverage by Citizenship Status in Clark County
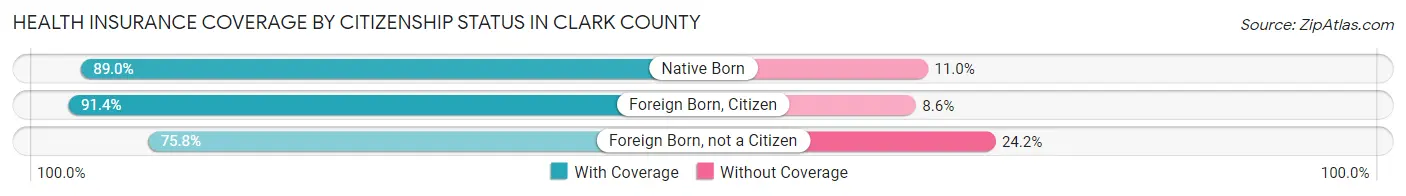
| Citizenship Status | With Coverage | Without Coverage |
| Native Born | 455 (89.0%) | 56 (11.0%) |
| Foreign Born, Citizen | 1,142 (91.4%) | 107 (8.6%) |
| Foreign Born, not a Citizen | 288 (75.8%) | 92 (24.2%) |
Health Insurance Coverage by Household Income in Clark County
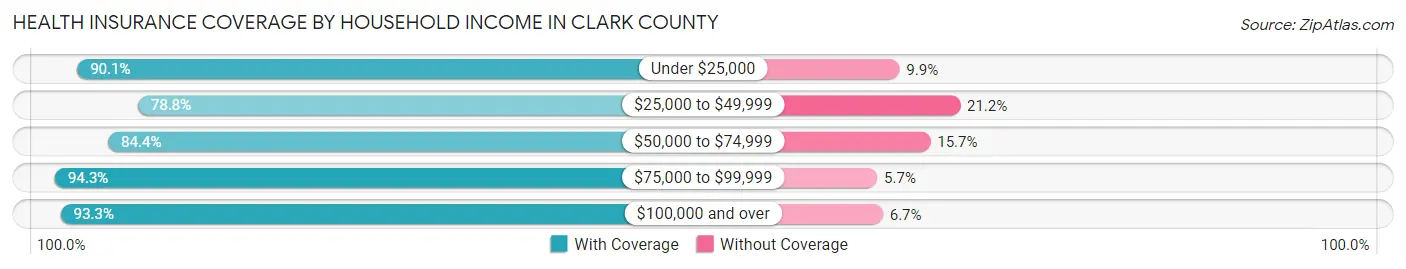
| Household Income | With Coverage | Without Coverage |
| Under $25,000 | 695 (90.1%) | 76 (9.9%) |
| $25,000 to $49,999 | 1,225 (78.8%) | 330 (21.2%) |
| $50,000 to $74,999 | 1,180 (84.4%) | 219 (15.7%) |
| $75,000 to $99,999 | 1,044 (94.3%) | 63 (5.7%) |
| $100,000 and over | 1,661 (93.3%) | 120 (6.7%) |
Public vs Private Health Insurance Coverage by Age in Clark County
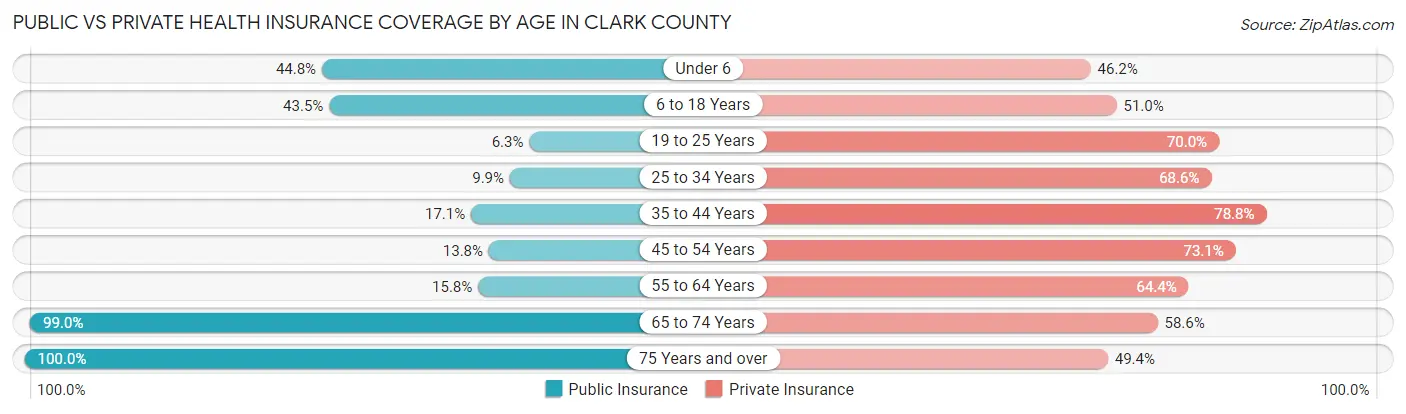
| Age Bracket | Public Insurance | Private Insurance |
| Under 6 | 229 (44.8%) | 236 (46.2%) |
| 6 to 18 Years | 543 (43.5%) | 637 (51.0%) |
| 19 to 25 Years | 24 (6.3%) | 266 (70.0%) |
| 25 to 34 Years | 61 (9.9%) | 421 (68.6%) |
| 35 to 44 Years | 122 (17.1%) | 561 (78.8%) |
| 45 to 54 Years | 109 (13.8%) | 576 (73.1%) |
| 55 to 64 Years | 159 (15.8%) | 647 (64.4%) |
| 65 to 74 Years | 777 (99.0%) | 460 (58.6%) |
| 75 Years and over | 569 (100.0%) | 281 (49.4%) |
| Total | 2,593 (39.2%) | 4,085 (61.8%) |
Disability Status by Sex by Age in Clark County
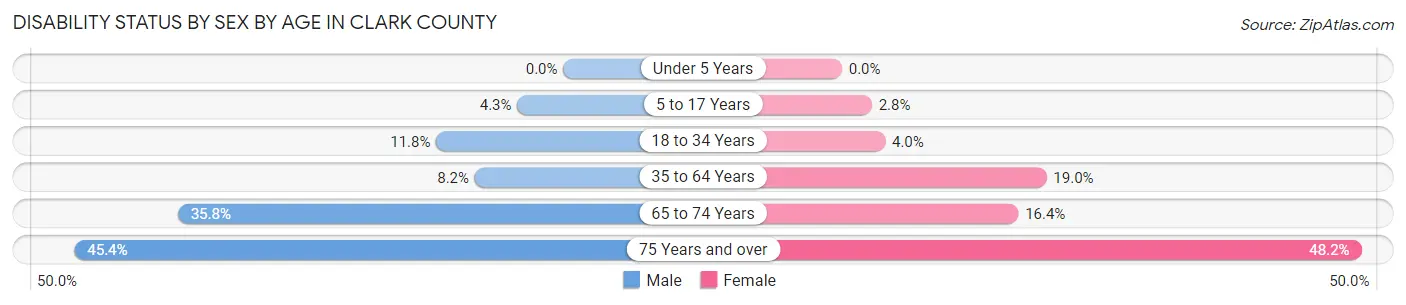
| Age Bracket | Male | Female |
| Under 5 Years | 0 (0.0%) | 0 (0.0%) |
| 5 to 17 Years | 28 (4.3%) | 16 (2.8%) |
| 18 to 34 Years | 69 (11.8%) | 21 (4.0%) |
| 35 to 64 Years | 108 (8.2%) | 226 (19.0%) |
| 65 to 74 Years | 141 (35.8%) | 64 (16.4%) |
| 75 Years and over | 118 (45.4%) | 149 (48.2%) |
Disability Class by Sex by Age in Clark County
Disability Class: Hearing Difficulty
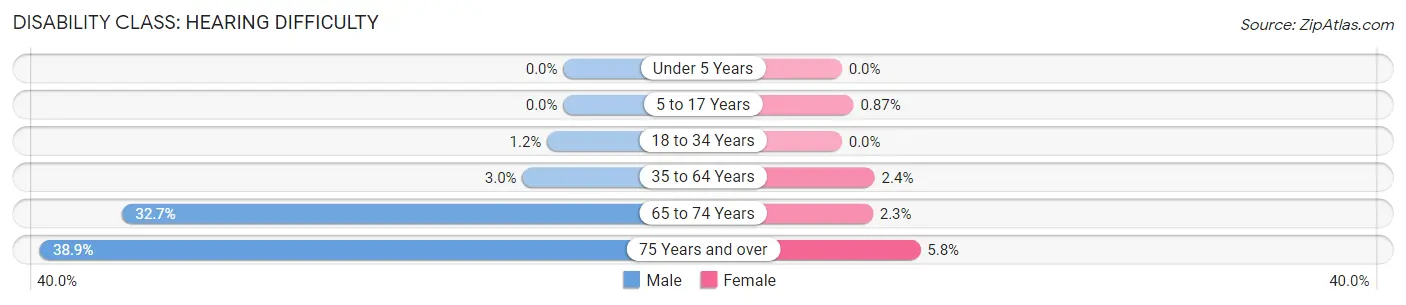
| Age Bracket | Male | Female |
| Under 5 Years | 0 (0.0%) | 0 (0.0%) |
| 5 to 17 Years | 0 (0.0%) | 5 (0.9%) |
| 18 to 34 Years | 7 (1.2%) | 0 (0.0%) |
| 35 to 64 Years | 40 (3.0%) | 29 (2.4%) |
| 65 to 74 Years | 129 (32.7%) | 9 (2.3%) |
| 75 Years and over | 101 (38.9%) | 18 (5.8%) |
Disability Class: Vision Difficulty
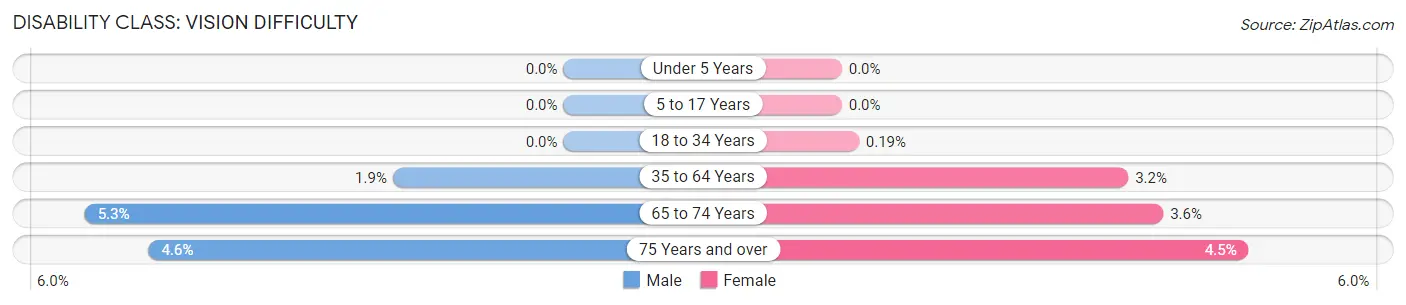
| Age Bracket | Male | Female |
| Under 5 Years | 0 (0.0%) | 0 (0.0%) |
| 5 to 17 Years | 0 (0.0%) | 0 (0.0%) |
| 18 to 34 Years | 0 (0.0%) | 1 (0.2%) |
| 35 to 64 Years | 25 (1.9%) | 38 (3.2%) |
| 65 to 74 Years | 21 (5.3%) | 14 (3.6%) |
| 75 Years and over | 12 (4.6%) | 14 (4.5%) |
Disability Class: Cognitive Difficulty
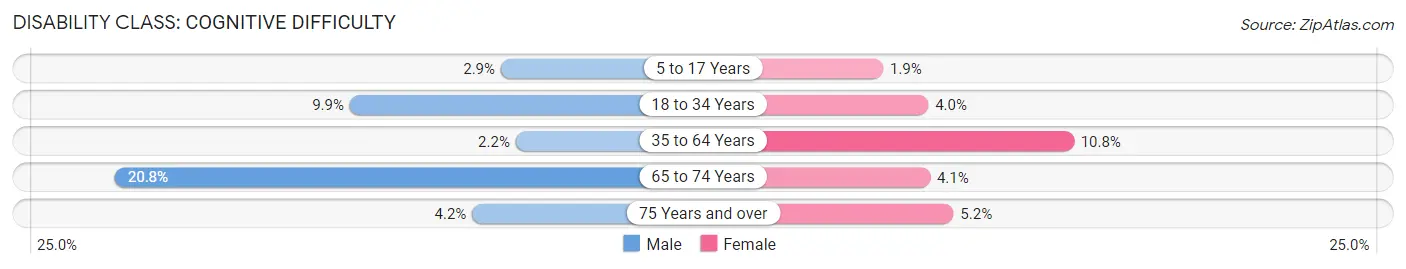
| Age Bracket | Male | Female |
| 5 to 17 Years | 19 (2.9%) | 11 (1.9%) |
| 18 to 34 Years | 58 (9.9%) | 21 (4.0%) |
| 35 to 64 Years | 29 (2.2%) | 128 (10.8%) |
| 65 to 74 Years | 82 (20.8%) | 16 (4.1%) |
| 75 Years and over | 11 (4.2%) | 16 (5.2%) |
Disability Class: Ambulatory Difficulty
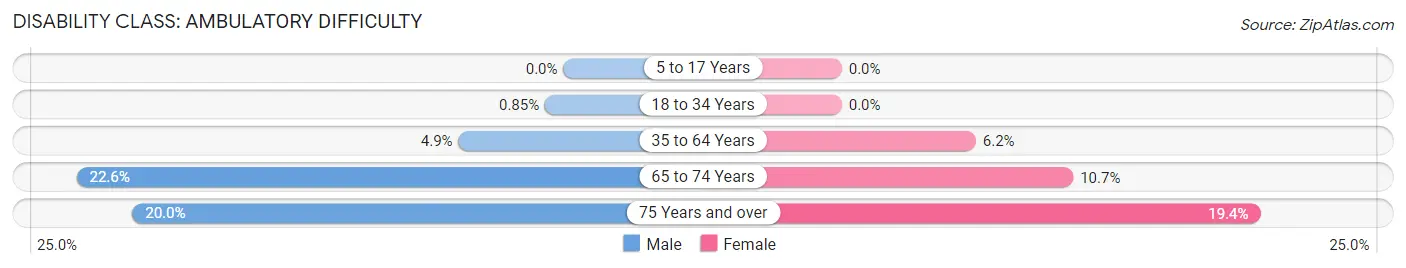
| Age Bracket | Male | Female |
| 5 to 17 Years | 0 (0.0%) | 0 (0.0%) |
| 18 to 34 Years | 5 (0.9%) | 0 (0.0%) |
| 35 to 64 Years | 64 (4.9%) | 74 (6.2%) |
| 65 to 74 Years | 89 (22.6%) | 42 (10.7%) |
| 75 Years and over | 52 (20.0%) | 60 (19.4%) |
Disability Class: Self-Care Difficulty
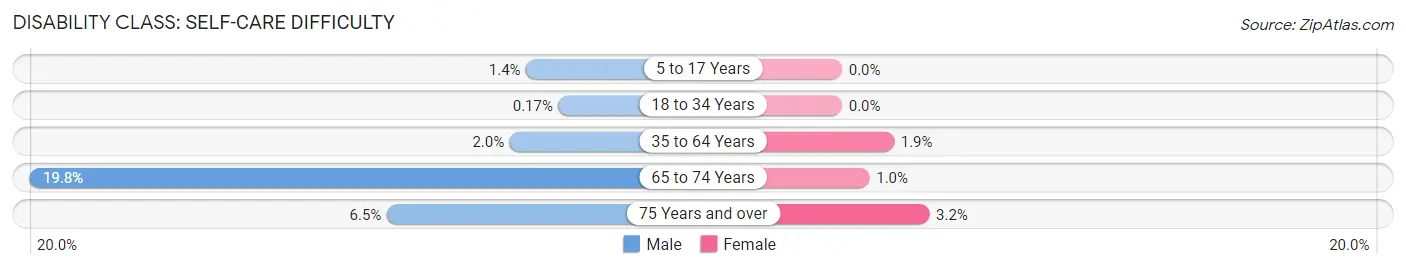
| Age Bracket | Male | Female |
| 5 to 17 Years | 9 (1.4%) | 0 (0.0%) |
| 18 to 34 Years | 1 (0.2%) | 0 (0.0%) |
| 35 to 64 Years | 26 (2.0%) | 23 (1.9%) |
| 65 to 74 Years | 78 (19.8%) | 4 (1.0%) |
| 75 Years and over | 17 (6.5%) | 10 (3.2%) |
Technology Access in Clark County
Computing Device Access in Clark County
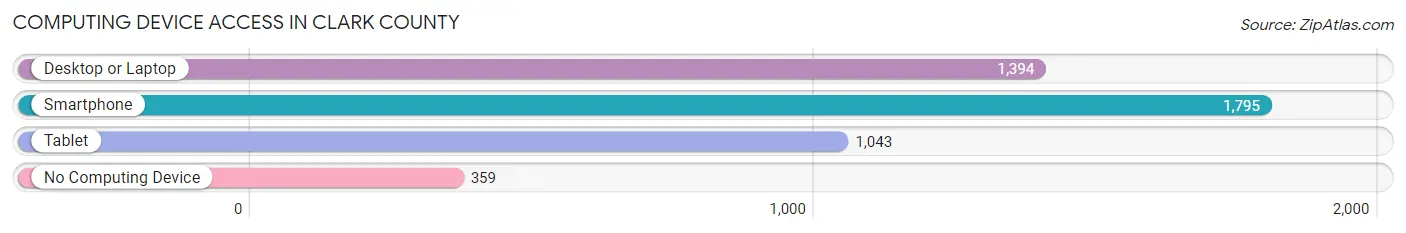
| Device Type | # Households | % Households |
| Desktop or Laptop | 1,394 | 60.6% |
| Smartphone | 1,795 | 78.0% |
| Tablet | 1,043 | 45.4% |
| No Computing Device | 359 | 15.6% |
| Total | 2,300 | 100.0% |
Internet Access in Clark County
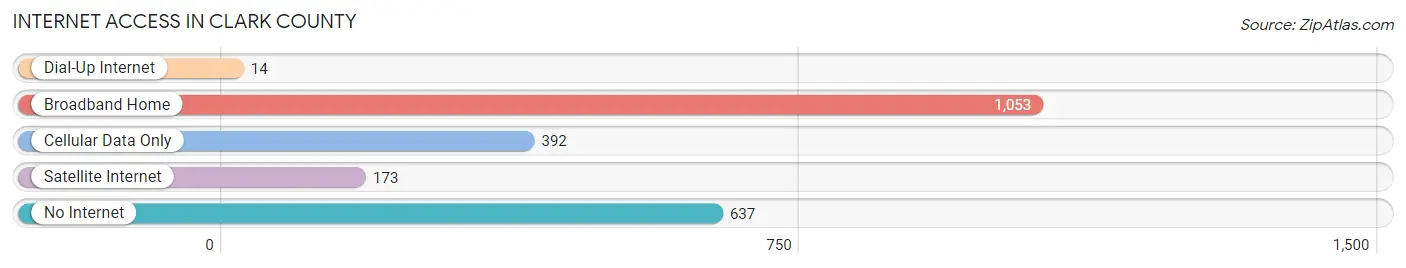
| Internet Type | # Households | % Households |
| Dial-Up Internet | 14 | 0.6% |
| Broadband Home | 1,053 | 45.8% |
| Cellular Data Only | 392 | 17.0% |
| Satellite Internet | 173 | 7.5% |
| No Internet | 637 | 27.7% |
| Total | 2,300 | 100.0% |
Clark County Summary
Clark County is located in the northeastern corner of Missouri, and is bordered by Scotland, Schuyler, Lewis, Knox, and Adair counties. The county seat is Kahoka, and the county was named after William Clark, the explorer of the Lewis and Clark Expedition. The county has a total area of 517 square miles, and a population of 7,139 as of the 2010 census.
History
The area that is now Clark County was first settled in 1819 by a group of settlers from Kentucky. The county was officially organized in 1836, and was named after William Clark, the explorer of the Lewis and Clark Expedition. The county seat was originally located in Alexandria, but was moved to Kahoka in 1841.
During the Civil War, Clark County was a divided county, with many of the residents supporting the Union, while others supported the Confederacy. The county was the site of several skirmishes during the war, and the county courthouse in Kahoka was burned by Confederate forces in 1864.
Geography
Clark County is located in the northeastern corner of Missouri, and is bordered by Scotland, Schuyler, Lewis, Knox, and Adair counties. The county has a total area of 517 square miles, and is mostly flat, with some rolling hills in the northern part of the county. The county is drained by the Fabius River, which flows through the county from north to south.
The county is mostly rural, with the majority of the population living in small towns and villages. The largest town in the county is Kahoka, which is the county seat. Other towns in the county include Alexandria, Revere, Wayland, and Wyaconda.
Economy
The economy of Clark County is largely based on agriculture. The county is home to a number of large farms, and the main crops grown in the county are corn, soybeans, and wheat. The county also has a number of small businesses, including a number of restaurants, stores, and other services.
Demographics
As of the 2010 census, the population of Clark County was 7,139. The racial makeup of the county was 97.2% White, 0.7% African American, 0.2% Native American, 0.2% Asian, 0.1% Pacific Islander, 0.5% from other races, and 1.1% from two or more races. Hispanic or Latino of any race were 1.3% of the population.
The median income for a household in the county was $37,917, and the median income for a family was $45,938. The per capita income for the county was $17,945. About 11.2% of families and 14.2% of the population were below the poverty line, including 17.2% of those under age 18 and 11.2% of those age 65 or over.
Common Questions
What is Per Capita Income in Clark County?
Per Capita income in Clark County is $26,417.
What is the Median Family Income in Clark County?
Median Family Income in Clark County is $69,212.
What is the Median Household income in Clark County?
Median Household Income in Clark County is $53,362.
What is Income or Wage Gap in Clark County?
Income or Wage Gap in Clark County is 21.4%.
Women in Clark County earn 78.6 cents for every dollar earned by a man.
What is Inequality or Gini Index in Clark County?
Inequality or Gini Index in Clark County is 0.43.
What is the Total Population of Clark County?
Total Population of Clark County is 6,693.
What is the Total Male Population of Clark County?
Total Male Population of Clark County is 3,459.
What is the Total Female Population of Clark County?
Total Female Population of Clark County is 3,234.
What is the Ratio of Males per 100 Females in Clark County?
There are 106.96 Males per 100 Females in Clark County.
What is the Ratio of Females per 100 Males in Clark County?
There are 93.50 Females per 100 Males in Clark County.
What is the Median Population Age in Clark County?
Median Population Age in Clark County is 42.8 Years.
What is the Average Family Size in Clark County
Average Family Size in Clark County is 3.8 People.
What is the Average Household Size in Clark County
Average Household Size in Clark County is 2.9 People.
How Large is the Labor Force in Clark County?
There are 2,993 People in the Labor Forcein in Clark County.
What is the Percentage of People in the Labor Force in Clark County?
57.5% of People are in the Labor Force in Clark County.
What is the Unemployment Rate in Clark County?
Unemployment Rate in Clark County is 3.9%.