Christian County, MO Map & Demographics
Christian County Map
Christian County Overview
$35,587
PER CAPITA INCOME
$87,975
AVG FAMILY INCOME
$75,787
AVG HOUSEHOLD INCOME
31.1%
WAGE / INCOME GAP [ % ]
68.9¢/ $1
WAGE / INCOME GAP [ $ ]
$11,543
FAMILY INCOME DEFICIT
0.42
INEQUALITY / GINI INDEX
89,568
TOTAL POPULATION
43,917
MALE POPULATION
45,651
FEMALE POPULATION
96.20
MALES / 100 FEMALES
103.95
FEMALES / 100 MALES
39.1
MEDIAN AGE
3.1
AVG FAMILY SIZE
2.7
AVG HOUSEHOLD SIZE
45,552
LABOR FORCE [ PEOPLE ]
65.4%
PERCENT IN LABOR FORCE
3.6%
UNEMPLOYMENT RATE
Christian County Area Codes
Income in Christian County
Income Overview in Christian County
Per Capita Income in Christian County is $35,587, while median incomes of families and households are $87,975 and $75,787 respectively.
| Characteristic | Number | Measure |
| Per Capita Income | 89,568 | $35,587 |
| Median Family Income | 24,874 | $87,975 |
| Mean Family Income | 24,874 | $107,614 |
| Median Household Income | 33,411 | $75,787 |
| Mean Household Income | 33,411 | $94,137 |
| Income Deficit | 24,874 | $11,543 |
| Wage / Income Gap (%) | 89,568 | 31.12% |
| Wage / Income Gap ($) | 89,568 | 68.88¢ per $1 |
| Gini / Inequality Index | 89,568 | 0.42 |
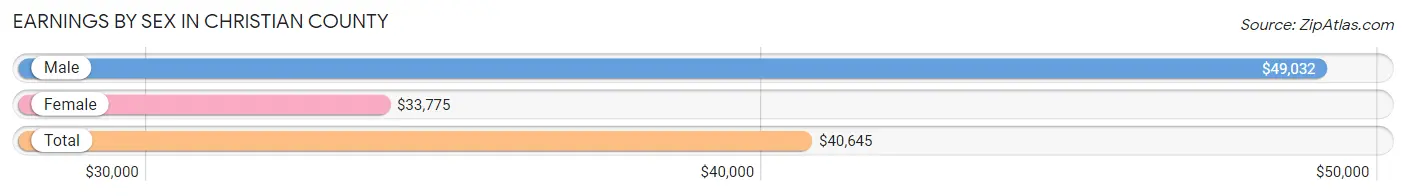
Earnings by Sex in Christian County
Average Earnings in Christian County are $40,645, $49,032 for men and $33,775 for women, a difference of 31.1%.
| Sex | Number | Average Earnings |
| Male | 25,064 (52.8%) | $49,032 |
| Female | 22,404 (47.2%) | $33,775 |
| Total | 47,468 (100.0%) | $40,645 |
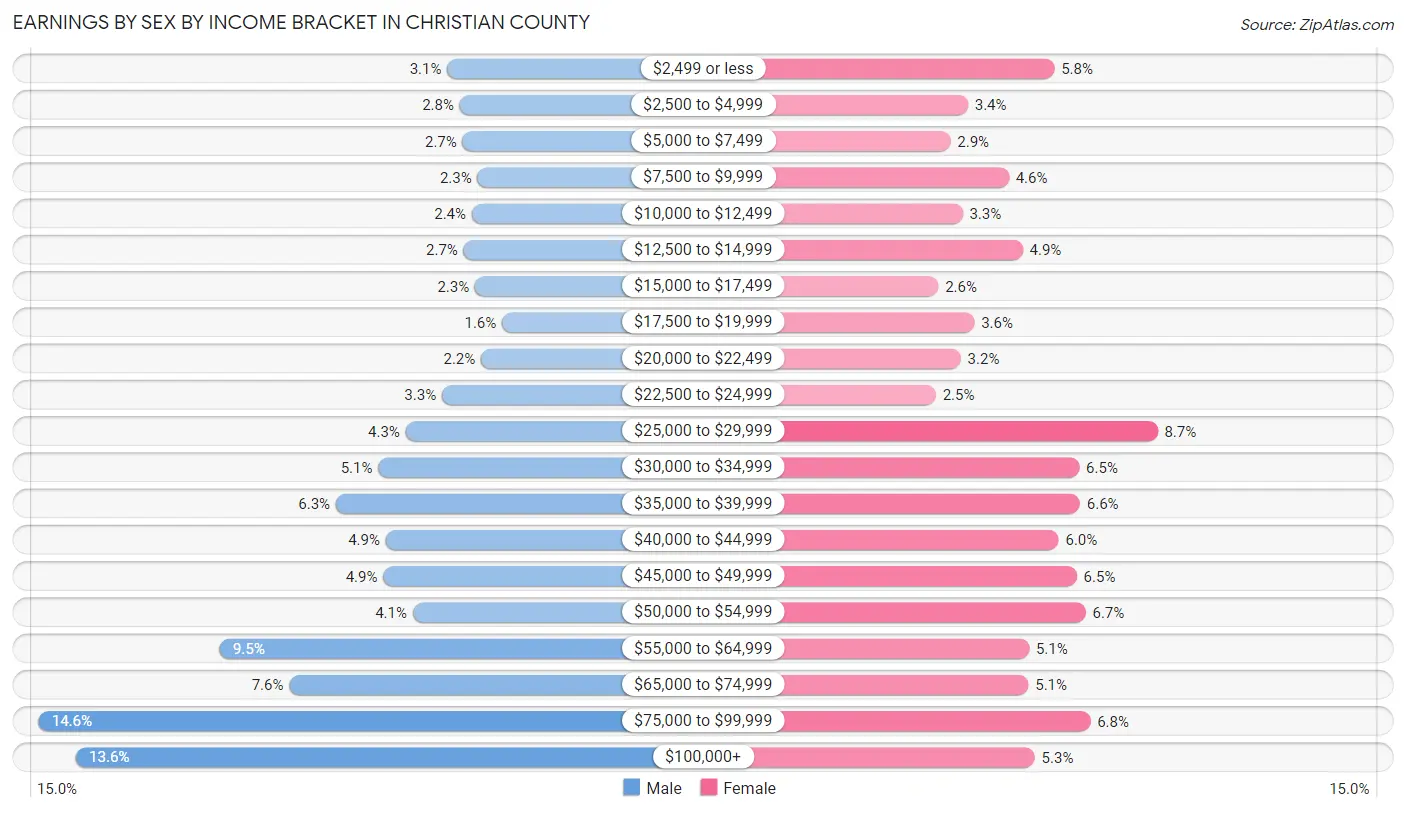
Earnings by Sex by Income Bracket in Christian County
The most common earnings brackets in Christian County are $75,000 to $99,999 for men (3,659 | 14.6%) and $25,000 to $29,999 for women (1,955 | 8.7%).
| Income | Male | Female |
| $2,499 or less | 783 (3.1%) | 1,306 (5.8%) |
| $2,500 to $4,999 | 694 (2.8%) | 762 (3.4%) |
| $5,000 to $7,499 | 675 (2.7%) | 651 (2.9%) |
| $7,500 to $9,999 | 570 (2.3%) | 1,019 (4.5%) |
| $10,000 to $12,499 | 610 (2.4%) | 729 (3.3%) |
| $12,500 to $14,999 | 666 (2.7%) | 1,106 (4.9%) |
| $15,000 to $17,499 | 586 (2.3%) | 576 (2.6%) |
| $17,500 to $19,999 | 396 (1.6%) | 802 (3.6%) |
| $20,000 to $22,499 | 545 (2.2%) | 718 (3.2%) |
| $22,500 to $24,999 | 820 (3.3%) | 560 (2.5%) |
| $25,000 to $29,999 | 1,076 (4.3%) | 1,955 (8.7%) |
| $30,000 to $34,999 | 1,269 (5.1%) | 1,464 (6.5%) |
| $35,000 to $39,999 | 1,566 (6.2%) | 1,468 (6.6%) |
| $40,000 to $44,999 | 1,215 (4.9%) | 1,334 (5.9%) |
| $45,000 to $49,999 | 1,233 (4.9%) | 1,447 (6.5%) |
| $50,000 to $54,999 | 1,026 (4.1%) | 1,504 (6.7%) |
| $55,000 to $64,999 | 2,383 (9.5%) | 1,146 (5.1%) |
| $65,000 to $74,999 | 1,896 (7.6%) | 1,142 (5.1%) |
| $75,000 to $99,999 | 3,659 (14.6%) | 1,532 (6.8%) |
| $100,000+ | 3,396 (13.6%) | 1,183 (5.3%) |
| Total | 25,064 (100.0%) | 22,404 (100.0%) |
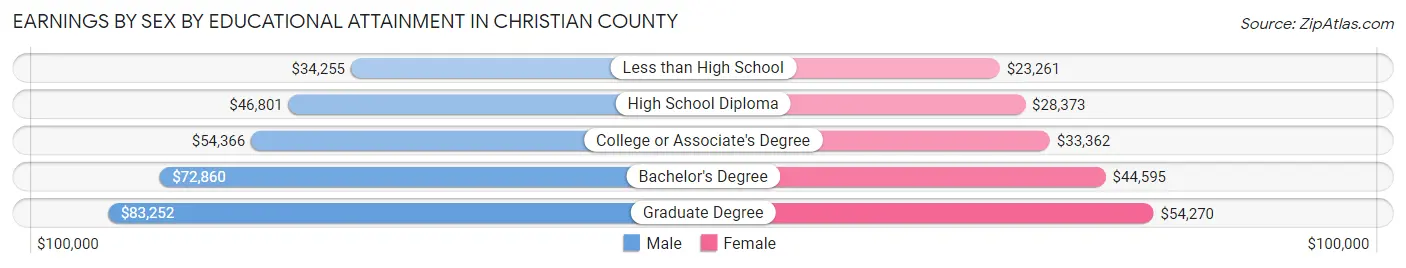
Earnings by Sex by Educational Attainment in Christian County
Average earnings in Christian County are $56,361 for men and $37,952 for women, a difference of 32.7%. Men with an educational attainment of graduate degree enjoy the highest average annual earnings of $83,252, while those with less than high school education earn the least with $34,255. Women with an educational attainment of graduate degree earn the most with the average annual earnings of $54,270, while those with less than high school education have the smallest earnings of $23,261.
| Educational Attainment | Male Income | Female Income |
| Less than High School | $34,255 | $23,261 |
| High School Diploma | $46,801 | $28,373 |
| College or Associate's Degree | $54,366 | $33,362 |
| Bachelor's Degree | $72,860 | $44,595 |
| Graduate Degree | $83,252 | $54,270 |
| Total | $56,361 | $37,952 |
Family Income in Christian County
Family Income Brackets in Christian County
According to the Christian County family income data, there are 5,796 families falling into the $100,000 to $149,999 income range, which is the most common income bracket and makes up 23.3% of all families. Conversely, the $10,000 to $14,999 income bracket is the least frequent group with only 298 families (1.2%) belonging to this category.
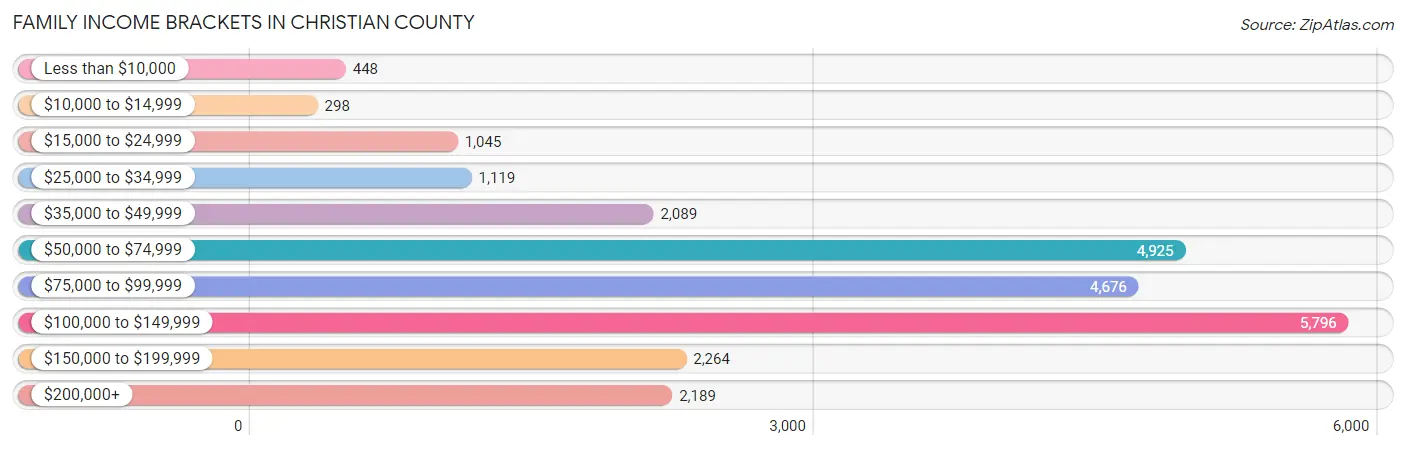
| Income Bracket | # Families | % Families |
| Less than $10,000 | 448 | 1.8% |
| $10,000 to $14,999 | 298 | 1.2% |
| $15,000 to $24,999 | 1,045 | 4.2% |
| $25,000 to $34,999 | 1,119 | 4.5% |
| $35,000 to $49,999 | 2,089 | 8.4% |
| $50,000 to $74,999 | 4,925 | 19.8% |
| $75,000 to $99,999 | 4,676 | 18.8% |
| $100,000 to $149,999 | 5,796 | 23.3% |
| $150,000 to $199,999 | 2,264 | 9.1% |
| $200,000+ | 2,189 | 8.8% |
Family Income by Famaliy Size in Christian County
6-person families (874 | 3.5%) account for the highest median family income in Christian County with $108,799 per family, while 2-person families (11,314 | 45.5%) have the highest median income of $38,842 per family member.
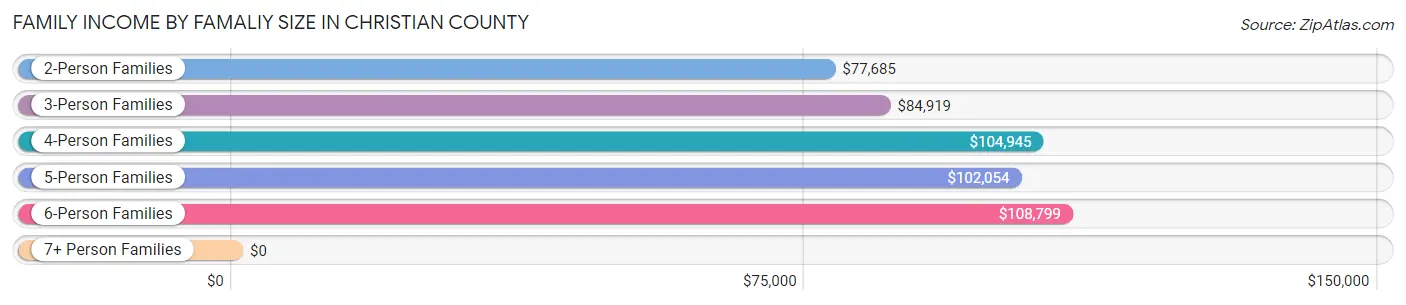
| Income Bracket | # Families | Median Income |
| 2-Person Families | 11,314 (45.5%) | $77,685 |
| 3-Person Families | 5,062 (20.3%) | $84,919 |
| 4-Person Families | 5,382 (21.6%) | $104,945 |
| 5-Person Families | 1,888 (7.6%) | $102,054 |
| 6-Person Families | 874 (3.5%) | $108,799 |
| 7+ Person Families | 354 (1.4%) | $0 |
| Total | 24,874 (100.0%) | $87,975 |
Family Income by Number of Earners in Christian County
The median family income in Christian County is $87,975, with families comprising 3+ earners (2,934) having the highest median family income of $135,194, while families with no earners (3,354) have the lowest median family income of $53,939, accounting for 11.8% and 13.5% of families, respectively.
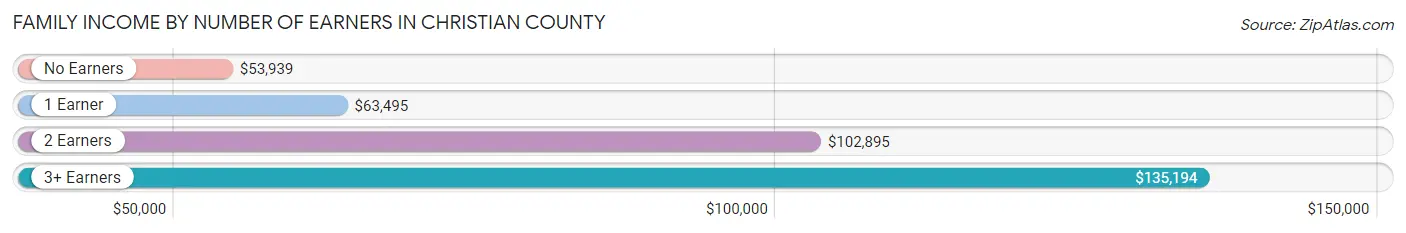
| Number of Earners | # Families | Median Income |
| No Earners | 3,354 (13.5%) | $53,939 |
| 1 Earner | 7,760 (31.2%) | $63,495 |
| 2 Earners | 10,826 (43.5%) | $102,895 |
| 3+ Earners | 2,934 (11.8%) | $135,194 |
| Total | 24,874 (100.0%) | $87,975 |
Household Income in Christian County
Household Income Brackets in Christian County
With 6,615 households falling in the category, the $100,000 to $149,999 income range is the most frequent in Christian County, accounting for 19.8% of all households. In contrast, only 936 households (2.8%) fall into the less than $10,000 income bracket, making it the least populous group.
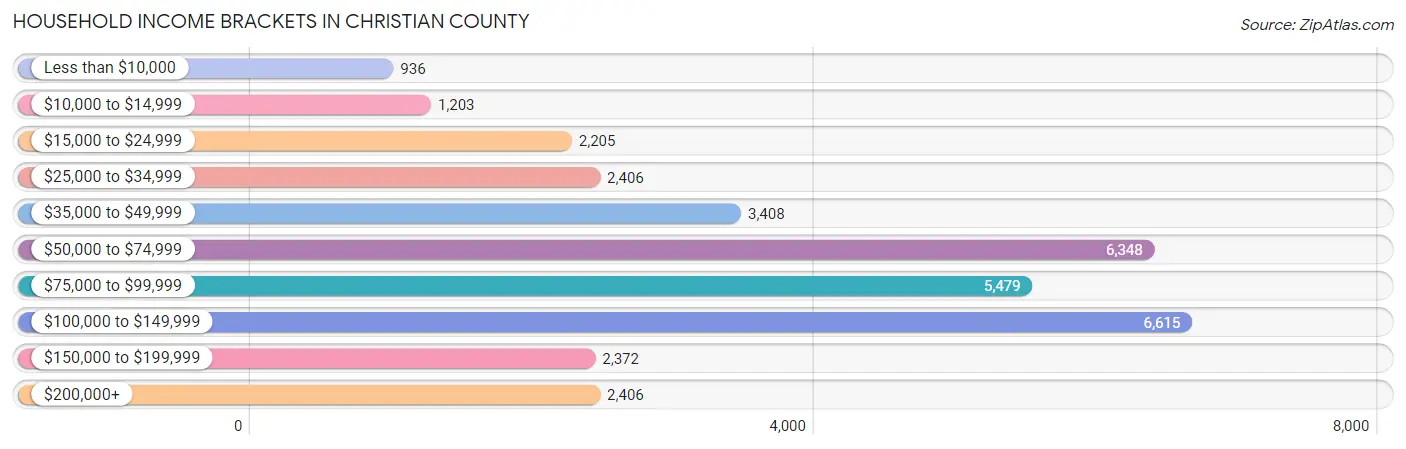
| Income Bracket | # Households | % Households |
| Less than $10,000 | 936 | 2.8% |
| $10,000 to $14,999 | 1,203 | 3.6% |
| $15,000 to $24,999 | 2,205 | 6.6% |
| $25,000 to $34,999 | 2,406 | 7.2% |
| $35,000 to $49,999 | 3,408 | 10.2% |
| $50,000 to $74,999 | 6,348 | 19.0% |
| $75,000 to $99,999 | 5,479 | 16.4% |
| $100,000 to $149,999 | 6,615 | 19.8% |
| $150,000 to $199,999 | 2,372 | 7.1% |
| $200,000+ | 2,406 | 7.2% |
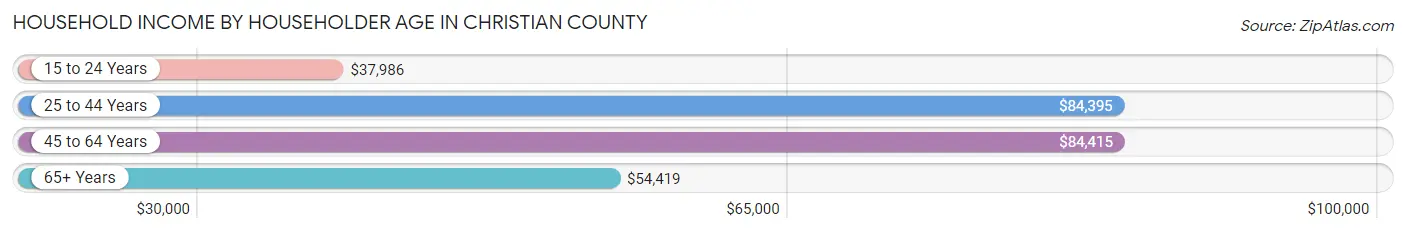
Household Income by Householder Age in Christian County
The median household income in Christian County is $75,787, with the highest median household income of $84,415 found in the 45 to 64 years age bracket for the primary householder. A total of 12,070 households (36.1%) fall into this category. Meanwhile, the 15 to 24 years age bracket for the primary householder has the lowest median household income of $37,986, with 827 households (2.5%) in this group.
| Income Bracket | # Households | Median Income |
| 15 to 24 Years | 827 (2.5%) | $37,986 |
| 25 to 44 Years | 11,786 (35.3%) | $84,395 |
| 45 to 64 Years | 12,070 (36.1%) | $84,415 |
| 65+ Years | 8,728 (26.1%) | $54,419 |
| Total | 33,411 (100.0%) | $75,787 |
Poverty in Christian County
Income Below Poverty by Sex and Age in Christian County
With 8.4% poverty level for males and 9.0% for females among the residents of Christian County, 5 year old males and 12 to 14 year old females are the most vulnerable to poverty, with 116 males (19.6%) and 457 females (19.5%) in their respective age groups living below the poverty level.
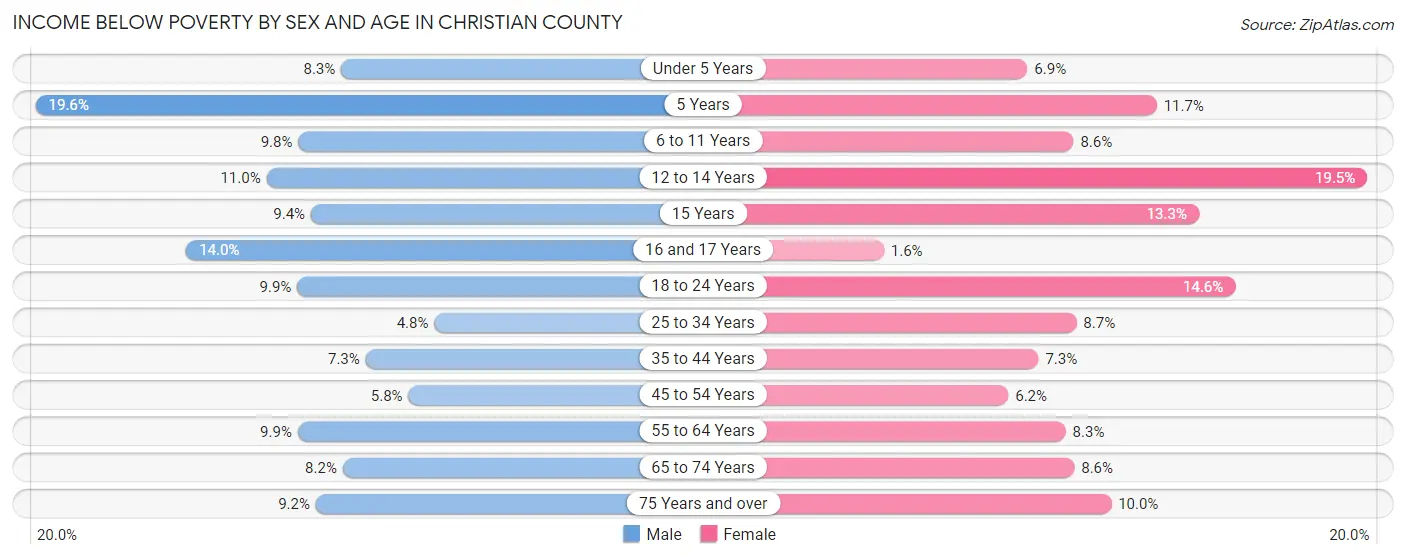
| Age Bracket | Male | Female |
| Under 5 Years | 212 (8.3%) | 186 (6.9%) |
| 5 Years | 116 (19.6%) | 54 (11.7%) |
| 6 to 11 Years | 376 (9.8%) | 300 (8.6%) |
| 12 to 14 Years | 231 (11.0%) | 457 (19.5%) |
| 15 Years | 71 (9.4%) | 73 (13.3%) |
| 16 and 17 Years | 187 (14.0%) | 20 (1.6%) |
| 18 to 24 Years | 325 (9.9%) | 455 (14.6%) |
| 25 to 34 Years | 262 (4.8%) | 515 (8.7%) |
| 35 to 44 Years | 451 (7.3%) | 448 (7.3%) |
| 45 to 54 Years | 325 (5.8%) | 338 (6.2%) |
| 55 to 64 Years | 521 (9.9%) | 498 (8.3%) |
| 65 to 74 Years | 331 (8.2%) | 394 (8.6%) |
| 75 Years and over | 221 (9.2%) | 315 (10.0%) |
| Total | 3,629 (8.4%) | 4,053 (9.0%) |
Income Above Poverty by Sex and Age in Christian County
According to the poverty statistics in Christian County, males aged 25 to 34 years and females aged 16 and 17 years are the age groups that are most secure financially, with 95.2% of males and 98.4% of females in these age groups living above the poverty line.
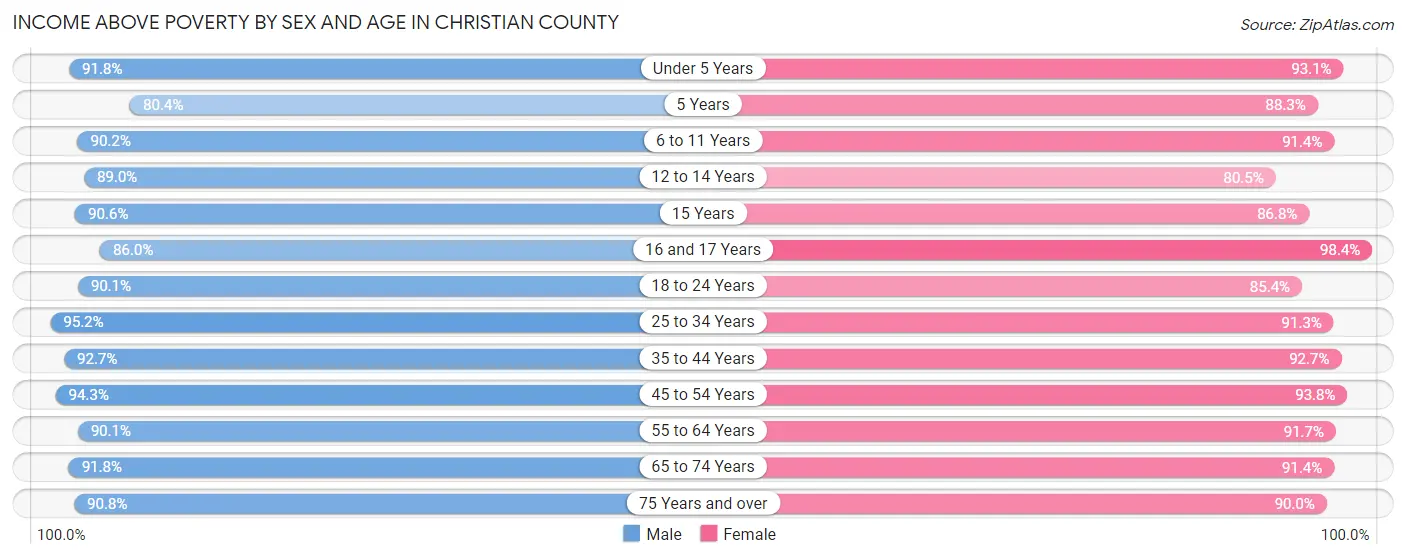
| Age Bracket | Male | Female |
| Under 5 Years | 2,357 (91.7%) | 2,513 (93.1%) |
| 5 Years | 476 (80.4%) | 408 (88.3%) |
| 6 to 11 Years | 3,445 (90.2%) | 3,187 (91.4%) |
| 12 to 14 Years | 1,866 (89.0%) | 1,886 (80.5%) |
| 15 Years | 687 (90.6%) | 478 (86.8%) |
| 16 and 17 Years | 1,149 (86.0%) | 1,264 (98.4%) |
| 18 to 24 Years | 2,963 (90.1%) | 2,662 (85.4%) |
| 25 to 34 Years | 5,209 (95.2%) | 5,398 (91.3%) |
| 35 to 44 Years | 5,692 (92.7%) | 5,688 (92.7%) |
| 45 to 54 Years | 5,326 (94.3%) | 5,129 (93.8%) |
| 55 to 64 Years | 4,763 (90.1%) | 5,497 (91.7%) |
| 65 to 74 Years | 3,710 (91.8%) | 4,173 (91.4%) |
| 75 Years and over | 2,185 (90.8%) | 2,834 (90.0%) |
| Total | 39,828 (91.6%) | 41,117 (91.0%) |
Income Below Poverty Among Married-Couple Families in Christian County
The poverty statistics for married-couple families in Christian County show that 3.7% or 765 of the total 20,602 families live below the poverty line. Families with 5 or more children have the highest poverty rate of 11.2%, comprising of 15 families. On the other hand, families with 1 or 2 children have the lowest poverty rate of 2.0%, which includes 147 families.
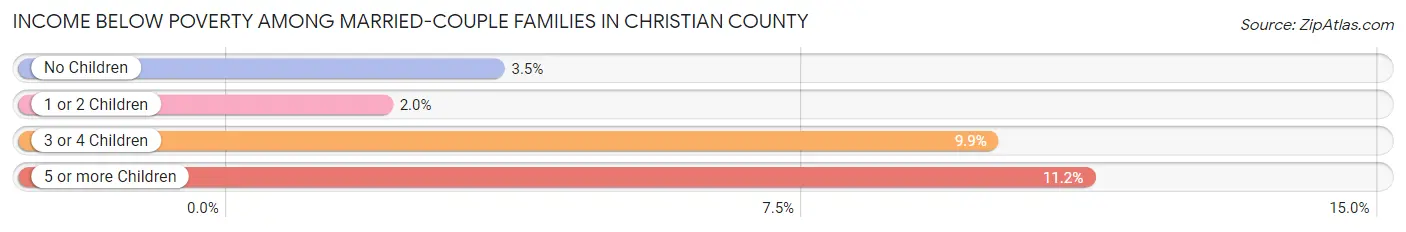
| Children | Above Poverty | Below Poverty |
| No Children | 10,561 (96.5%) | 381 (3.5%) |
| 1 or 2 Children | 7,143 (98.0%) | 147 (2.0%) |
| 3 or 4 Children | 2,014 (90.1%) | 222 (9.9%) |
| 5 or more Children | 119 (88.8%) | 15 (11.2%) |
| Total | 19,837 (96.3%) | 765 (3.7%) |
Income Below Poverty Among Single-Parent Households in Christian County
According to the poverty data in Christian County, 14.9% or 197 single-father households and 17.8% or 526 single-mother households are living below the poverty line. Among single-father households, those with 3 or 4 children have the highest poverty rate, with 53 households (31.4%) experiencing poverty. Likewise, among single-mother households, those with 1 or 2 children have the highest poverty rate, with 439 households (23.8%) falling below the poverty line.
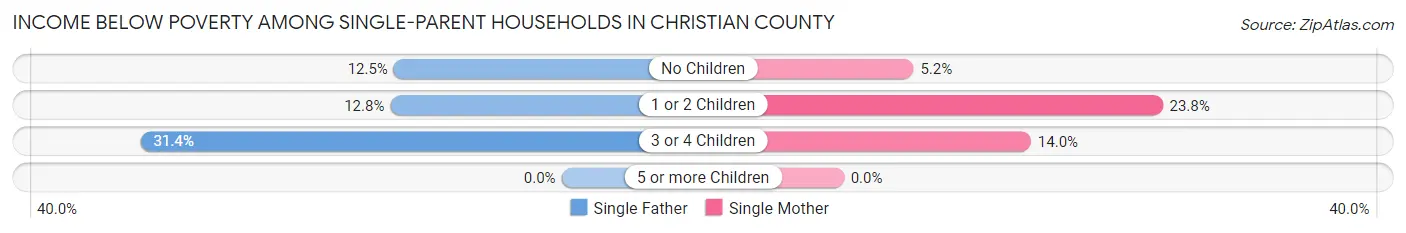
| Children | Single Father | Single Mother |
| No Children | 53 (12.5%) | 40 (5.2%) |
| 1 or 2 Children | 91 (12.8%) | 439 (23.8%) |
| 3 or 4 Children | 53 (31.4%) | 47 (14.0%) |
| 5 or more Children | 0 (0.0%) | 0 (0.0%) |
| Total | 197 (14.9%) | 526 (17.8%) |
Income Below Poverty Among Married-Couple vs Single-Parent Households in Christian County
The poverty data for Christian County shows that 765 of the married-couple family households (3.7%) and 723 of the single-parent households (16.9%) are living below the poverty level. Within the married-couple family households, those with 5 or more children have the highest poverty rate, with 15 households (11.2%) falling below the poverty line. Among the single-parent households, those with 1 or 2 children have the highest poverty rate, with 530 household (20.7%) living below poverty.
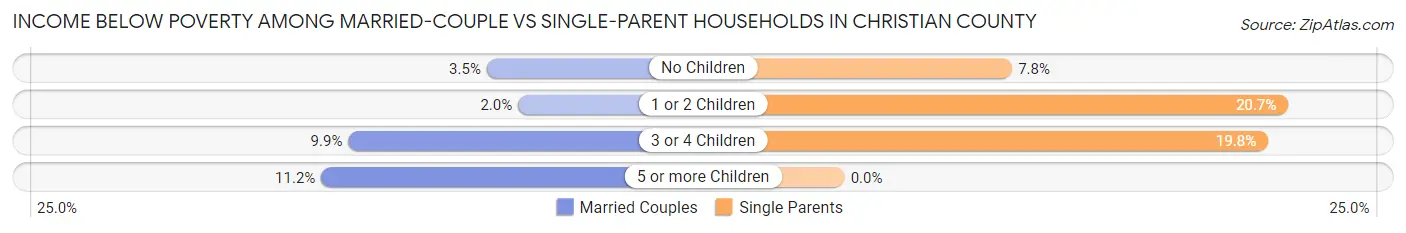
| Children | Married-Couple Families | Single-Parent Households |
| No Children | 381 (3.5%) | 93 (7.8%) |
| 1 or 2 Children | 147 (2.0%) | 530 (20.7%) |
| 3 or 4 Children | 222 (9.9%) | 100 (19.8%) |
| 5 or more Children | 15 (11.2%) | 0 (0.0%) |
| Total | 765 (3.7%) | 723 (16.9%) |
Race in Christian County
The most populous races in Christian County are White / Caucasian (82,941 | 92.6%), Two or more Races (3,680 | 4.1%), and Hispanic or Latino (3,094 | 3.5%).
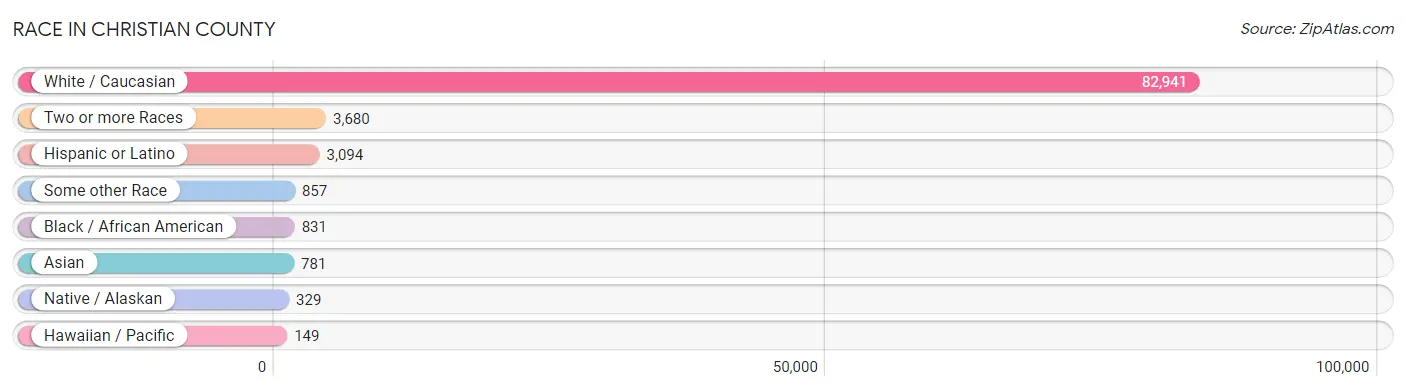
| Race | # Population | % Population |
| Asian | 781 | 0.9% |
| Black / African American | 831 | 0.9% |
| Hawaiian / Pacific | 149 | 0.2% |
| Hispanic or Latino | 3,094 | 3.5% |
| Native / Alaskan | 329 | 0.4% |
| White / Caucasian | 82,941 | 92.6% |
| Two or more Races | 3,680 | 4.1% |
| Some other Race | 857 | 1.0% |
| Total | 89,568 | 100.0% |
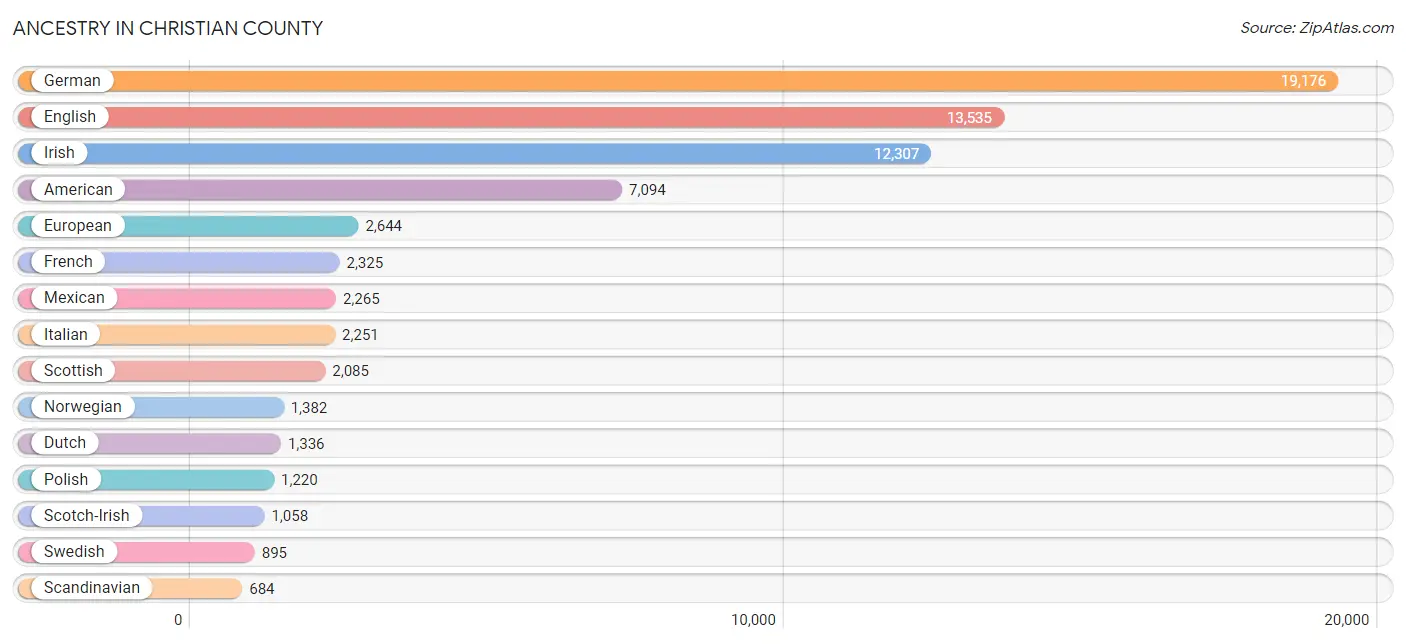
Ancestry in Christian County
The most populous ancestries reported in Christian County are German (19,176 | 21.4%), English (13,535 | 15.1%), Irish (12,307 | 13.7%), American (7,094 | 7.9%), and European (2,644 | 2.9%), together accounting for 61.1% of all Christian County residents.
| Ancestry | # Population | % Population |
| African | 223 | 0.3% |
| American | 7,094 | 7.9% |
| Arab | 142 | 0.2% |
| Armenian | 6 | 0.0% |
| Australian | 3 | 0.0% |
| Austrian | 64 | 0.1% |
| Barbadian | 22 | 0.0% |
| Bhutanese | 113 | 0.1% |
| Blackfeet | 60 | 0.1% |
| Brazilian | 237 | 0.3% |
| British | 430 | 0.5% |
| Bulgarian | 6 | 0.0% |
| Burmese | 286 | 0.3% |
| Cajun | 8 | 0.0% |
| Canadian | 143 | 0.2% |
| Celtic | 94 | 0.1% |
| Central American | 100 | 0.1% |
| Central American Indian | 74 | 0.1% |
| Cherokee | 519 | 0.6% |
| Chilean | 40 | 0.0% |
| Choctaw | 21 | 0.0% |
| Colombian | 1 | 0.0% |
| Creek | 39 | 0.0% |
| Croatian | 82 | 0.1% |
| Crow | 3 | 0.0% |
| Czech | 324 | 0.4% |
| Czechoslovakian | 197 | 0.2% |
| Danish | 443 | 0.5% |
| Dutch | 1,336 | 1.5% |
| Dutch West Indian | 5 | 0.0% |
| Eastern European | 408 | 0.5% |
| Ecuadorian | 45 | 0.1% |
| Egyptian | 6 | 0.0% |
| English | 13,535 | 15.1% |
| European | 2,644 | 2.9% |
| Finnish | 86 | 0.1% |
| French | 2,325 | 2.6% |
| French American Indian | 3 | 0.0% |
| French Canadian | 272 | 0.3% |
| German | 19,176 | 21.4% |
| German Russian | 27 | 0.0% |
| Ghanaian | 157 | 0.2% |
| Greek | 123 | 0.1% |
| Guamanian / Chamorro | 106 | 0.1% |
| Guatemalan | 38 | 0.0% |
| Haitian | 23 | 0.0% |
| Honduran | 62 | 0.1% |
| Hungarian | 219 | 0.2% |
| Indian (Asian) | 101 | 0.1% |
| Iranian | 1 | 0.0% |
| Irish | 12,307 | 13.7% |
| Iroquois | 103 | 0.1% |
| Italian | 2,251 | 2.5% |
| Korean | 316 | 0.4% |
| Latvian | 3 | 0.0% |
| Lebanese | 71 | 0.1% |
| Lithuanian | 54 | 0.1% |
| Lumbee | 24 | 0.0% |
| Mexican | 2,265 | 2.5% |
| Mexican American Indian | 38 | 0.0% |
| Native Hawaiian | 230 | 0.3% |
| Navajo | 76 | 0.1% |
| Northern European | 222 | 0.3% |
| Norwegian | 1,382 | 1.5% |
| Osage | 6 | 0.0% |
| Palestinian | 46 | 0.1% |
| Pennsylvania German | 29 | 0.0% |
| Peruvian | 109 | 0.1% |
| Polish | 1,220 | 1.4% |
| Portuguese | 315 | 0.4% |
| Potawatomi | 1 | 0.0% |
| Puerto Rican | 209 | 0.2% |
| Puget Sound Salish | 14 | 0.0% |
| Romanian | 117 | 0.1% |
| Russian | 183 | 0.2% |
| Scandinavian | 684 | 0.8% |
| Scotch-Irish | 1,058 | 1.2% |
| Scottish | 2,085 | 2.3% |
| Seminole | 29 | 0.0% |
| Serbian | 3 | 0.0% |
| Sioux | 81 | 0.1% |
| Slavic | 127 | 0.1% |
| Slovak | 125 | 0.1% |
| South American | 309 | 0.3% |
| Spaniard | 78 | 0.1% |
| Spanish | 107 | 0.1% |
| Sri Lankan | 222 | 0.3% |
| Subsaharan African | 380 | 0.4% |
| Swedish | 895 | 1.0% |
| Swiss | 437 | 0.5% |
| Thai | 62 | 0.1% |
| Trinidadian and Tobagonian | 36 | 0.0% |
| Ukrainian | 242 | 0.3% |
| Venezuelan | 114 | 0.1% |
| Welsh | 435 | 0.5% |
| West Indian | 74 | 0.1% |
| Yaqui | 165 | 0.2% |
| Yugoslavian | 6 | 0.0% | View All 98 Rows |
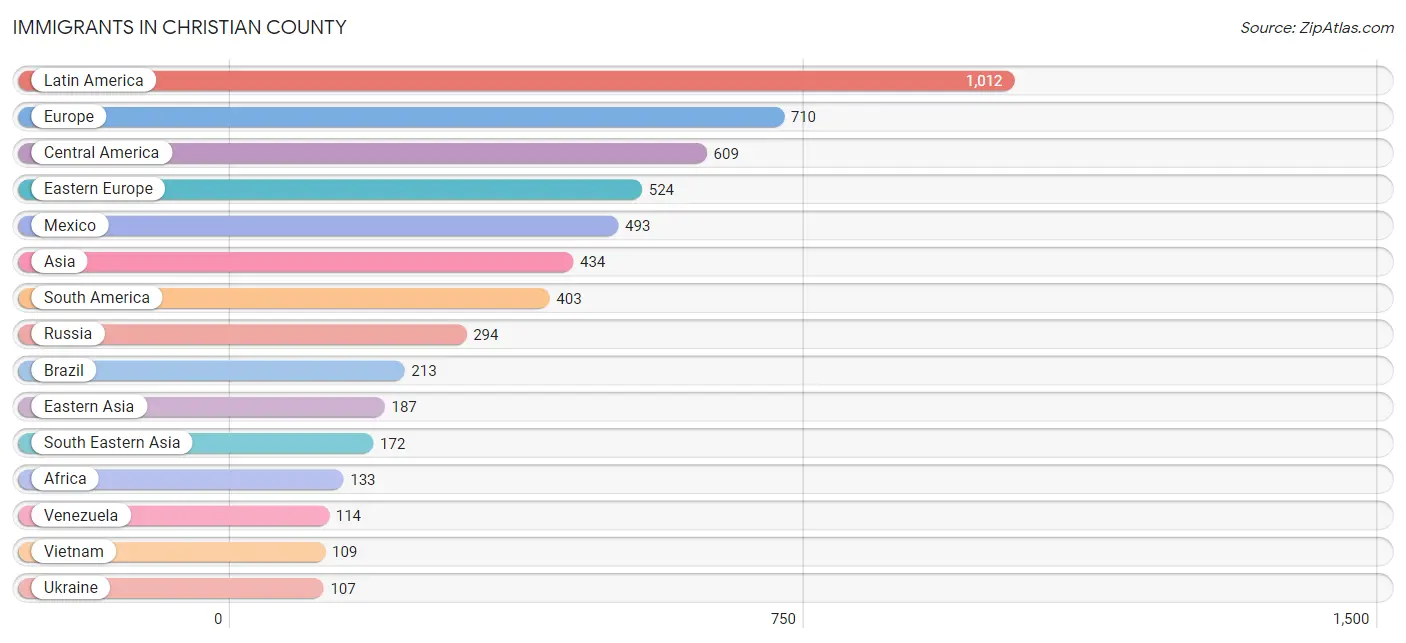
Immigrants in Christian County
The most numerous immigrant groups reported in Christian County came from Latin America (1,012 | 1.1%), Europe (710 | 0.8%), Central America (609 | 0.7%), Eastern Europe (524 | 0.6%), and Mexico (493 | 0.5%), together accounting for 3.7% of all Christian County residents.
| Immigration Origin | # Population | % Population |
| Africa | 133 | 0.2% |
| Asia | 434 | 0.5% |
| Azores | 27 | 0.0% |
| Belarus | 6 | 0.0% |
| Brazil | 213 | 0.2% |
| Bulgaria | 6 | 0.0% |
| Canada | 54 | 0.1% |
| Central America | 609 | 0.7% |
| Chile | 40 | 0.0% |
| China | 78 | 0.1% |
| Colombia | 1 | 0.0% |
| Czechoslovakia | 16 | 0.0% |
| Eastern Africa | 38 | 0.0% |
| Eastern Asia | 187 | 0.2% |
| Eastern Europe | 524 | 0.6% |
| England | 24 | 0.0% |
| Europe | 710 | 0.8% |
| Germany | 78 | 0.1% |
| Ghana | 93 | 0.1% |
| Guatemala | 38 | 0.0% |
| Honduras | 76 | 0.1% |
| India | 29 | 0.0% |
| Iran | 1 | 0.0% |
| Ireland | 10 | 0.0% |
| Israel | 19 | 0.0% |
| Japan | 12 | 0.0% |
| Kenya | 38 | 0.0% |
| Korea | 97 | 0.1% |
| Latin America | 1,012 | 1.1% |
| Malaysia | 2 | 0.0% |
| Mexico | 493 | 0.5% |
| Moldova | 34 | 0.0% |
| Netherlands | 12 | 0.0% |
| Nicaragua | 2 | 0.0% |
| Nigeria | 2 | 0.0% |
| Northern Europe | 69 | 0.1% |
| Peru | 35 | 0.0% |
| Philippines | 60 | 0.1% |
| Poland | 2 | 0.0% |
| Portugal | 27 | 0.0% |
| Romania | 45 | 0.1% |
| Russia | 294 | 0.3% |
| Scotland | 21 | 0.0% |
| Singapore | 1 | 0.0% |
| South America | 403 | 0.4% |
| South Central Asia | 56 | 0.1% |
| South Eastern Asia | 172 | 0.2% |
| Southern Europe | 27 | 0.0% |
| Ukraine | 107 | 0.1% |
| Venezuela | 114 | 0.1% |
| Vietnam | 109 | 0.1% |
| Western Africa | 95 | 0.1% |
| Western Asia | 19 | 0.0% |
| Western Europe | 90 | 0.1% | View All 54 Rows |
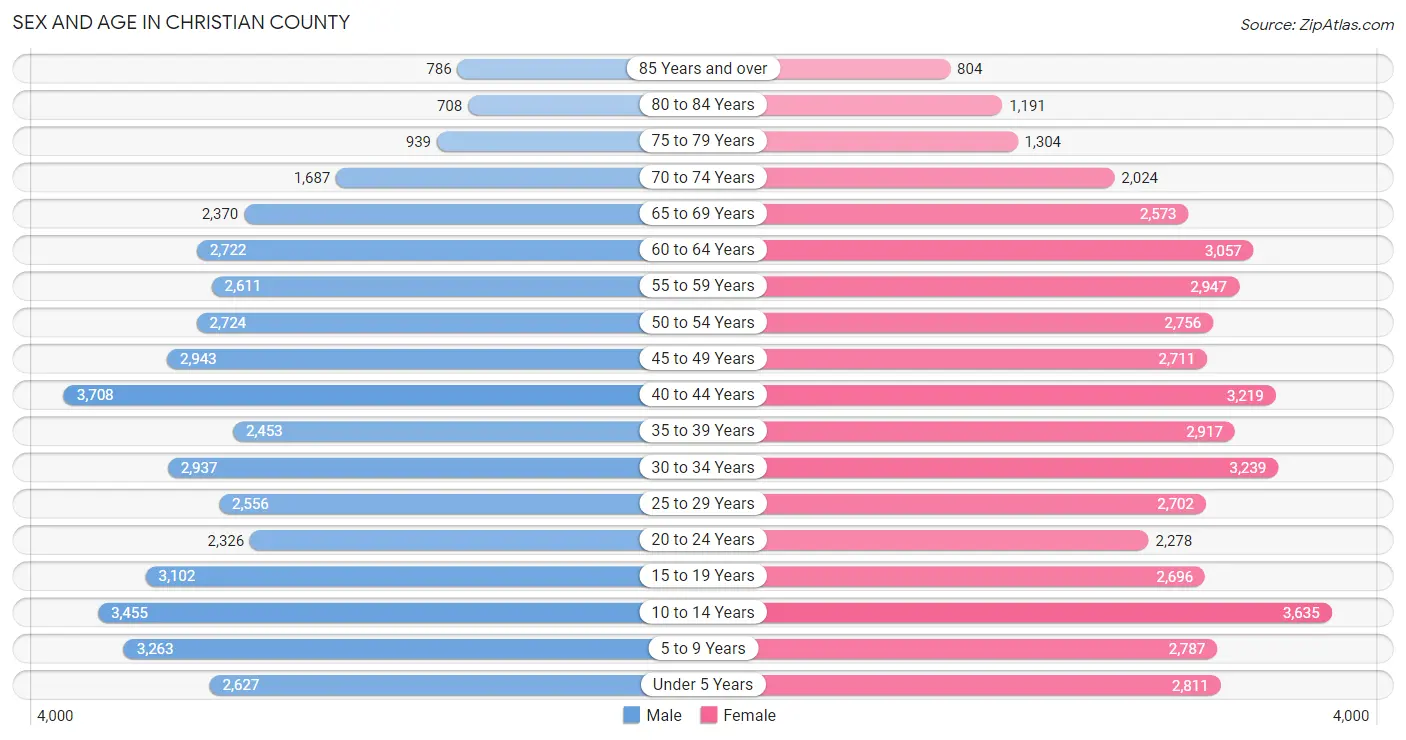
Sex and Age in Christian County
Sex and Age in Christian County
The most populous age groups in Christian County are 40 to 44 Years (3,708 | 8.4%) for men and 10 to 14 Years (3,635 | 8.0%) for women.
| Age Bracket | Male | Female |
| Under 5 Years | 2,627 (6.0%) | 2,811 (6.2%) |
| 5 to 9 Years | 3,263 (7.4%) | 2,787 (6.1%) |
| 10 to 14 Years | 3,455 (7.9%) | 3,635 (8.0%) |
| 15 to 19 Years | 3,102 (7.1%) | 2,696 (5.9%) |
| 20 to 24 Years | 2,326 (5.3%) | 2,278 (5.0%) |
| 25 to 29 Years | 2,556 (5.8%) | 2,702 (5.9%) |
| 30 to 34 Years | 2,937 (6.7%) | 3,239 (7.1%) |
| 35 to 39 Years | 2,453 (5.6%) | 2,917 (6.4%) |
| 40 to 44 Years | 3,708 (8.4%) | 3,219 (7.0%) |
| 45 to 49 Years | 2,943 (6.7%) | 2,711 (5.9%) |
| 50 to 54 Years | 2,724 (6.2%) | 2,756 (6.0%) |
| 55 to 59 Years | 2,611 (5.9%) | 2,947 (6.5%) |
| 60 to 64 Years | 2,722 (6.2%) | 3,057 (6.7%) |
| 65 to 69 Years | 2,370 (5.4%) | 2,573 (5.6%) |
| 70 to 74 Years | 1,687 (3.8%) | 2,024 (4.4%) |
| 75 to 79 Years | 939 (2.1%) | 1,304 (2.9%) |
| 80 to 84 Years | 708 (1.6%) | 1,191 (2.6%) |
| 85 Years and over | 786 (1.8%) | 804 (1.8%) |
| Total | 43,917 (100.0%) | 45,651 (100.0%) |
Families and Households in Christian County
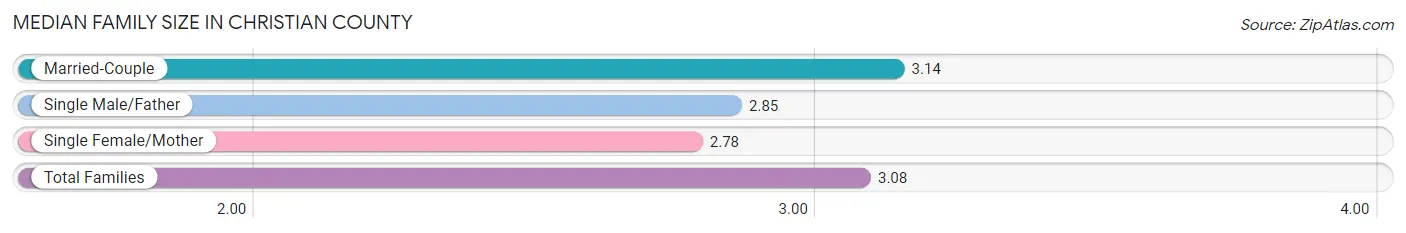
Median Family Size in Christian County
The median family size in Christian County is 3.08 persons per family, with married-couple families (20,602 | 82.8%) accounting for the largest median family size of 3.14 persons per family. On the other hand, single female/mother families (2,954 | 11.9%) represent the smallest median family size with 2.78 persons per family.
| Family Type | # Families | Family Size |
| Married-Couple | 20,602 (82.8%) | 3.14 |
| Single Male/Father | 1,318 (5.3%) | 2.85 |
| Single Female/Mother | 2,954 (11.9%) | 2.78 |
| Total Families | 24,874 (100.0%) | 3.08 |
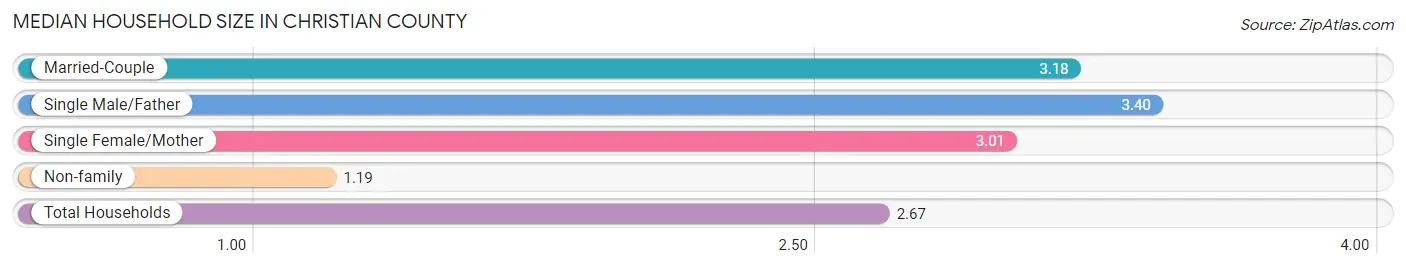
Median Household Size in Christian County
The median household size in Christian County is 2.67 persons per household, with single male/father households (1,318 | 3.9%) accounting for the largest median household size of 3.4 persons per household. non-family households (8,537 | 25.6%) represent the smallest median household size with 1.19 persons per household.
| Household Type | # Households | Household Size |
| Married-Couple | 20,602 (61.7%) | 3.18 |
| Single Male/Father | 1,318 (3.9%) | 3.40 |
| Single Female/Mother | 2,954 (8.8%) | 3.01 |
| Non-family | 8,537 (25.6%) | 1.19 |
| Total Households | 33,411 (100.0%) | 2.67 |
Household Size by Marriage Status in Christian County
Out of a total of 33,411 households in Christian County, 24,874 (74.5%) are family households, while 8,537 (25.6%) are nonfamily households. The most numerous type of family households are 2-person households, comprising 10,844, and the most common type of nonfamily households are 1-person households, comprising 7,337.
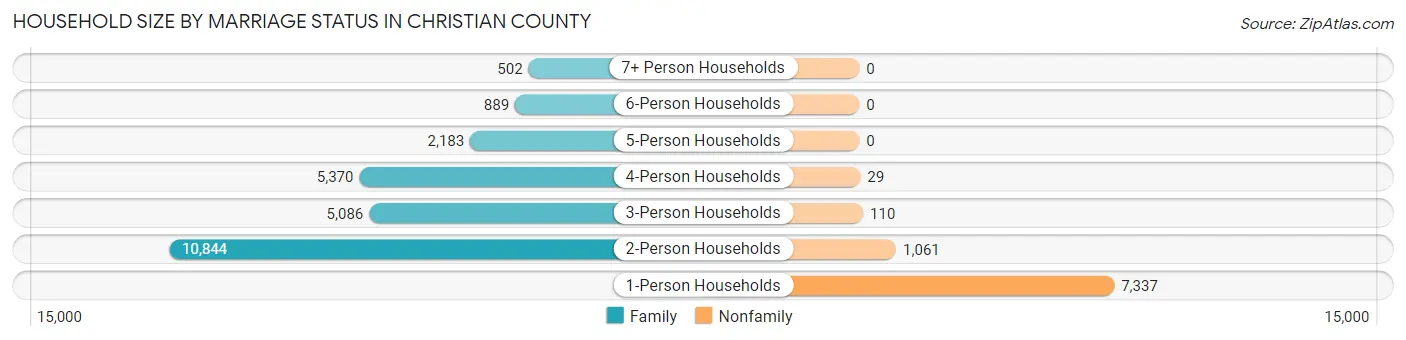
| Household Size | Family Households | Nonfamily Households |
| 1-Person Households | - | 7,337 (22.0%) |
| 2-Person Households | 10,844 (32.5%) | 1,061 (3.2%) |
| 3-Person Households | 5,086 (15.2%) | 110 (0.3%) |
| 4-Person Households | 5,370 (16.1%) | 29 (0.1%) |
| 5-Person Households | 2,183 (6.5%) | 0 (0.0%) |
| 6-Person Households | 889 (2.7%) | 0 (0.0%) |
| 7+ Person Households | 502 (1.5%) | 0 (0.0%) |
| Total | 24,874 (74.5%) | 8,537 (25.6%) |
Female Fertility in Christian County
Fertility by Age in Christian County
Average fertility rate in Christian County is 64.0 births per 1,000 women. Women in the age bracket of 20 to 34 years have the highest fertility rate with 133.0 births per 1,000 women. Women in the age bracket of 20 to 34 years acount for 85.1% of all women with births.
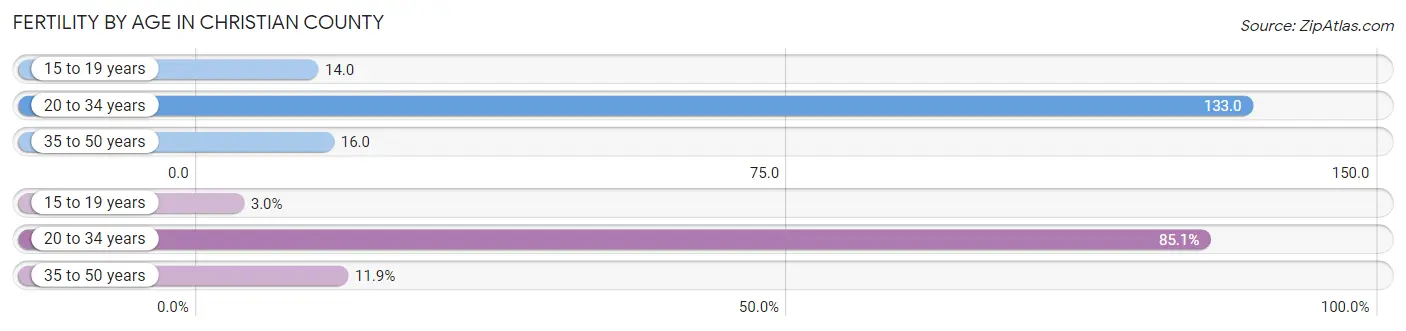
| Age Bracket | Women with Births | Births / 1,000 Women |
| 15 to 19 years | 39 (3.0%) | 14.0 |
| 20 to 34 years | 1,096 (85.1%) | 133.0 |
| 35 to 50 years | 153 (11.9%) | 16.0 |
| Total | 1,288 (100.0%) | 64.0 |
Fertility by Age by Marriage Status in Christian County
76.4% of women with births (1,288) in Christian County are married. The highest percentage of unmarried women with births falls into 15 to 19 years age bracket with 71.8% of them unmarried at the time of birth, while the lowest percentage of unmarried women with births belong to 35 to 50 years age bracket with 0.0% of them unmarried.
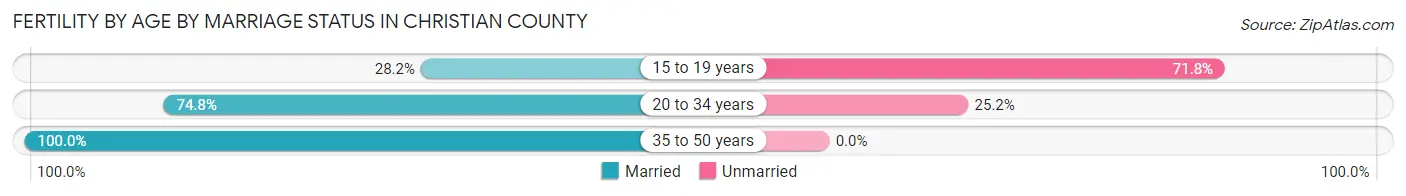
| Age Bracket | Married | Unmarried |
| 15 to 19 years | 11 (28.2%) | 28 (71.8%) |
| 20 to 34 years | 820 (74.8%) | 276 (25.2%) |
| 35 to 50 years | 153 (100.0%) | 0 (0.0%) |
| Total | 984 (76.4%) | 304 (23.6%) |
Fertility by Education in Christian County
Average fertility rate in Christian County is 64.0 births per 1,000 women. Women with the education attainment of college or associate's degree have the highest fertility rate of 87.0 births per 1,000 women, while women with the education attainment of less than high school have the lowest fertility at 28.0 births per 1,000 women. Women with the education attainment of college or associate's degree represent 46.9% of all women with births.
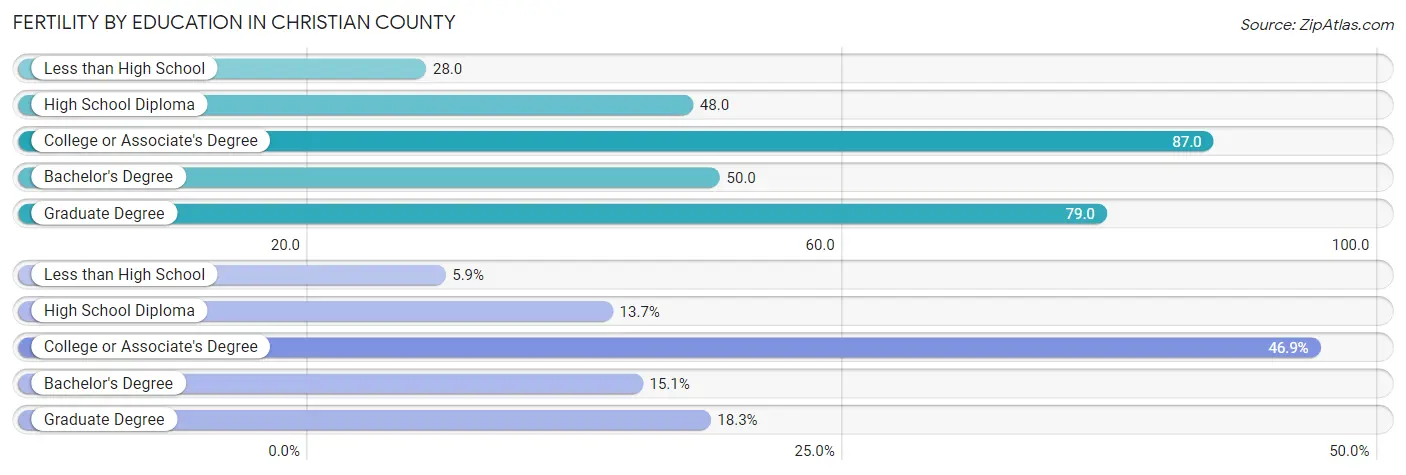
| Educational Attainment | Women with Births | Births / 1,000 Women |
| Less than High School | 76 (5.9%) | 28.0 |
| High School Diploma | 177 (13.7%) | 48.0 |
| College or Associate's Degree | 604 (46.9%) | 87.0 |
| Bachelor's Degree | 195 (15.1%) | 50.0 |
| Graduate Degree | 236 (18.3%) | 79.0 |
| Total | 1,288 (100.0%) | 64.0 |
Fertility by Education by Marriage Status in Christian County
23.6% of women with births in Christian County are unmarried. Women with the educational attainment of bachelor's degree are most likely to be married with 100.0% of them married at childbirth, while women with the educational attainment of high school diploma are least likely to be married with 43.5% of them unmarried at childbirth.
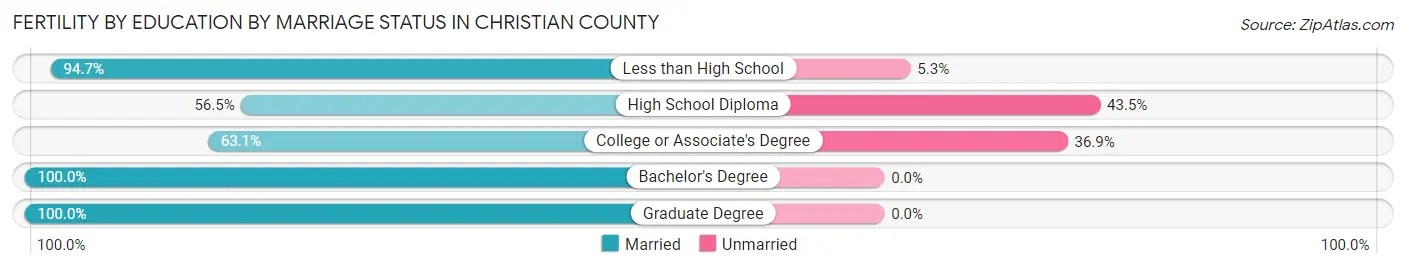
| Educational Attainment | Married | Unmarried |
| Less than High School | 72 (94.7%) | 4 (5.3%) |
| High School Diploma | 100 (56.5%) | 77 (43.5%) |
| College or Associate's Degree | 381 (63.1%) | 223 (36.9%) |
| Bachelor's Degree | 195 (100.0%) | 0 (0.0%) |
| Graduate Degree | 236 (100.0%) | 0 (0.0%) |
| Total | 984 (76.4%) | 304 (23.6%) |
Employment Characteristics in Christian County
Employment by Class of Employer in Christian County
Among the 43,032 employed individuals in Christian County, private company employees (27,507 | 63.9%), not-for-profit organizations (5,580 | 13.0%), and local government employees (3,147 | 7.3%) make up the most common classes of employment.
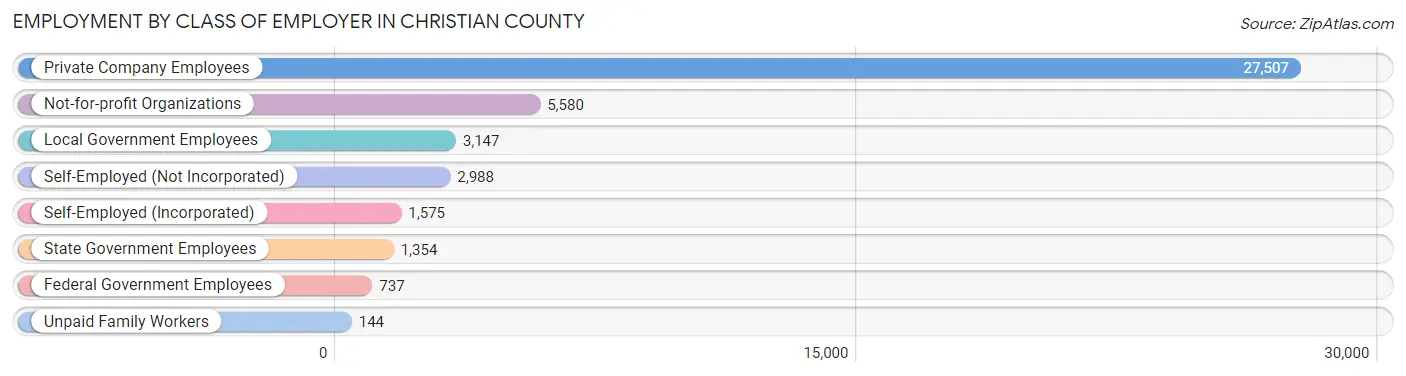
| Employer Class | # Employees | % Employees |
| Private Company Employees | 27,507 | 63.9% |
| Self-Employed (Incorporated) | 1,575 | 3.7% |
| Self-Employed (Not Incorporated) | 2,988 | 6.9% |
| Not-for-profit Organizations | 5,580 | 13.0% |
| Local Government Employees | 3,147 | 7.3% |
| State Government Employees | 1,354 | 3.2% |
| Federal Government Employees | 737 | 1.7% |
| Unpaid Family Workers | 144 | 0.3% |
| Total | 43,032 | 100.0% |
Employment Status by Age in Christian County
According to the labor force statistics for Christian County, out of the total population over 16 years of age (69,651), 65.4% or 45,552 individuals are in the labor force, with 3.6% or 1,640 of them unemployed. The age group with the highest labor force participation rate is 35 to 44 years, with 87.3% or 10,735 individuals in the labor force. Within the labor force, the 16 to 19 years age range has the highest percentage of unemployed individuals, with 9.6% or 231 of them being unemployed.
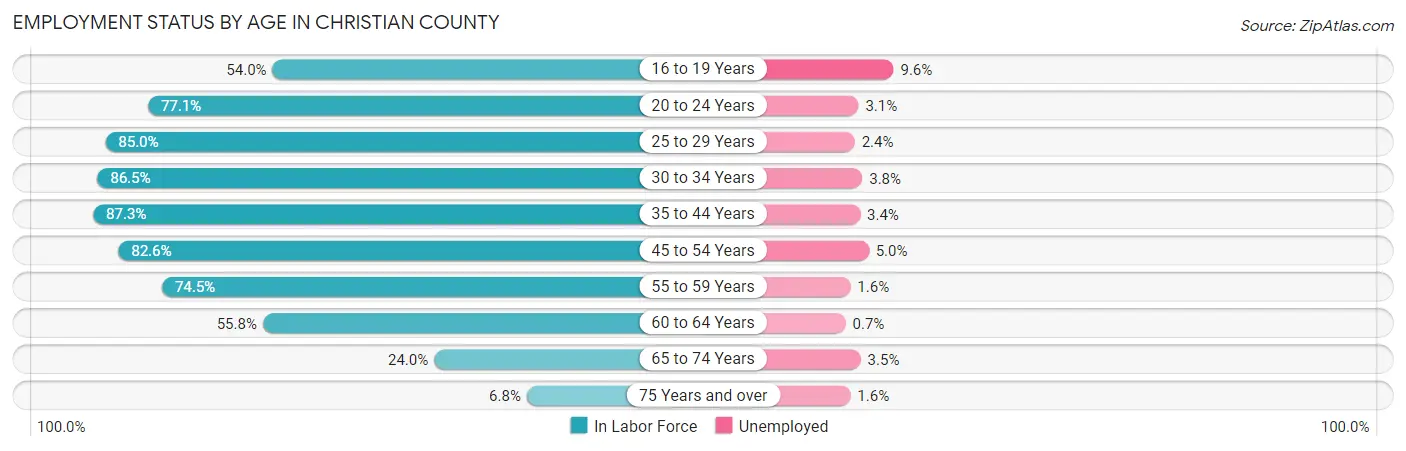
| Age Bracket | In Labor Force | Unemployed |
| 16 to 19 Years | 2,408 (54.0%) | 231 (9.6%) |
| 20 to 24 Years | 3,550 (77.1%) | 110 (3.1%) |
| 25 to 29 Years | 4,469 (85.0%) | 107 (2.4%) |
| 30 to 34 Years | 5,342 (86.5%) | 203 (3.8%) |
| 35 to 44 Years | 10,735 (87.3%) | 365 (3.4%) |
| 45 to 54 Years | 9,197 (82.6%) | 460 (5.0%) |
| 55 to 59 Years | 4,141 (74.5%) | 66 (1.6%) |
| 60 to 64 Years | 3,225 (55.8%) | 23 (0.7%) |
| 65 to 74 Years | 2,077 (24.0%) | 73 (3.5%) |
| 75 Years and over | 390 (6.8%) | 6 (1.6%) |
| Total | 45,552 (65.4%) | 1,640 (3.6%) |
Employment Status by Educational Attainment in Christian County
According to labor force statistics for Christian County, 80.3% of individuals (37,100) out of the total population between 25 and 64 years of age (46,202) are in the labor force, with 3.3% or 1,224 of them being unemployed. The group with the highest labor force participation rate are those with the educational attainment of bachelor's degree or higher, with 86.9% or 14,057 individuals in the labor force. Within the labor force, individuals with less than high school education have the highest percentage of unemployment, with 10.9% or 213 of them being unemployed.
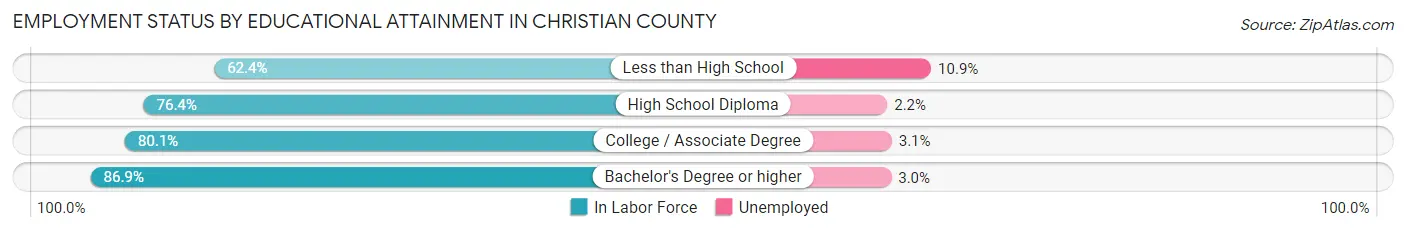
| Educational Attainment | In Labor Force | Unemployed |
| Less than High School | 1,957 (62.4%) | 342 (10.9%) |
| High School Diploma | 8,735 (76.4%) | 252 (2.2%) |
| College / Associate Degree | 12,381 (80.1%) | 479 (3.1%) |
| Bachelor's Degree or higher | 14,057 (86.9%) | 485 (3.0%) |
| Total | 37,100 (80.3%) | 1,525 (3.3%) |
Employment Occupations by Sex in Christian County
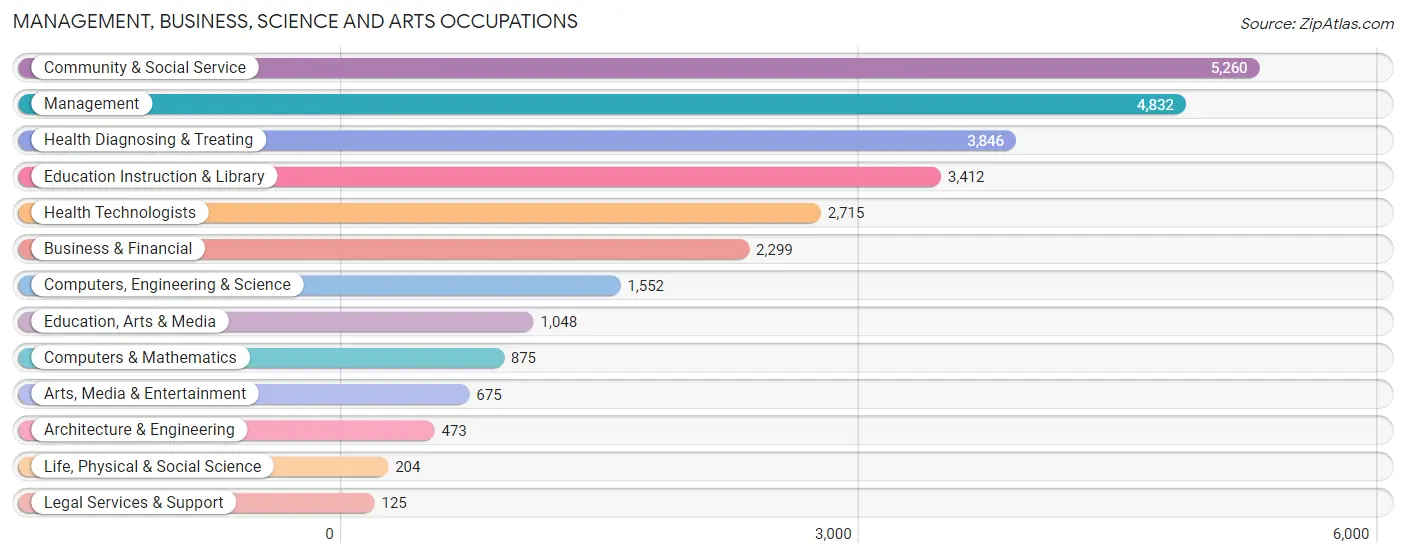
Management, Business, Science and Arts Occupations
The most common Management, Business, Science and Arts occupations in Christian County are Community & Social Service (5,260 | 12.0%), Management (4,832 | 11.0%), Health Diagnosing & Treating (3,846 | 8.8%), Education Instruction & Library (3,412 | 7.8%), and Health Technologists (2,715 | 6.2%).
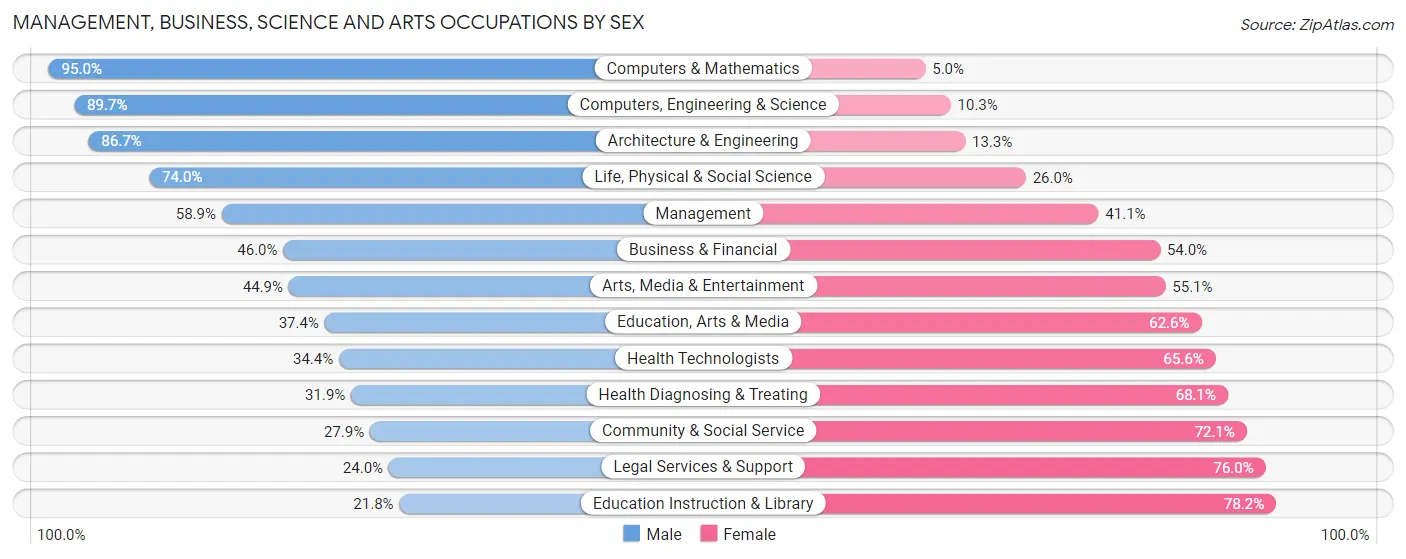
Management, Business, Science and Arts Occupations by Sex
Within the Management, Business, Science and Arts occupations in Christian County, the most male-oriented occupations are Computers & Mathematics (95.0%), Computers, Engineering & Science (89.7%), and Architecture & Engineering (86.7%), while the most female-oriented occupations are Education Instruction & Library (78.2%), Legal Services & Support (76.0%), and Community & Social Service (72.1%).
| Occupation | Male | Female |
| Management | 2,844 (58.9%) | 1,988 (41.1%) |
| Business & Financial | 1,058 (46.0%) | 1,241 (54.0%) |
| Computers, Engineering & Science | 1,392 (89.7%) | 160 (10.3%) |
| Computers & Mathematics | 831 (95.0%) | 44 (5.0%) |
| Architecture & Engineering | 410 (86.7%) | 63 (13.3%) |
| Life, Physical & Social Science | 151 (74.0%) | 53 (26.0%) |
| Community & Social Service | 1,469 (27.9%) | 3,791 (72.1%) |
| Education, Arts & Media | 392 (37.4%) | 656 (62.6%) |
| Legal Services & Support | 30 (24.0%) | 95 (76.0%) |
| Education Instruction & Library | 744 (21.8%) | 2,668 (78.2%) |
| Arts, Media & Entertainment | 303 (44.9%) | 372 (55.1%) |
| Health Diagnosing & Treating | 1,226 (31.9%) | 2,620 (68.1%) |
| Health Technologists | 934 (34.4%) | 1,781 (65.6%) |
| Total (Category) | 7,989 (44.9%) | 9,800 (55.1%) |
| Total (Overall) | 23,041 (52.6%) | 20,748 (47.4%) |
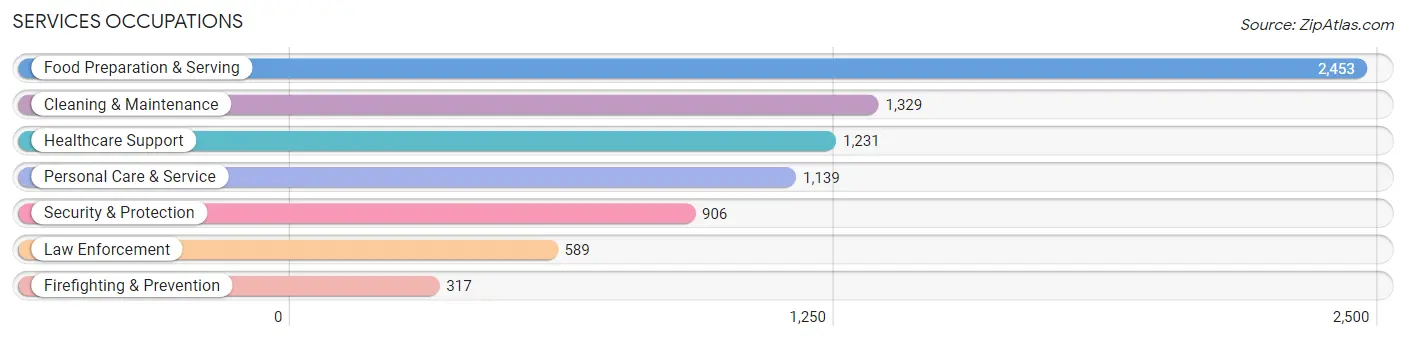
Services Occupations
The most common Services occupations in Christian County are Food Preparation & Serving (2,453 | 5.6%), Cleaning & Maintenance (1,329 | 3.0%), Healthcare Support (1,231 | 2.8%), Personal Care & Service (1,139 | 2.6%), and Security & Protection (906 | 2.1%).
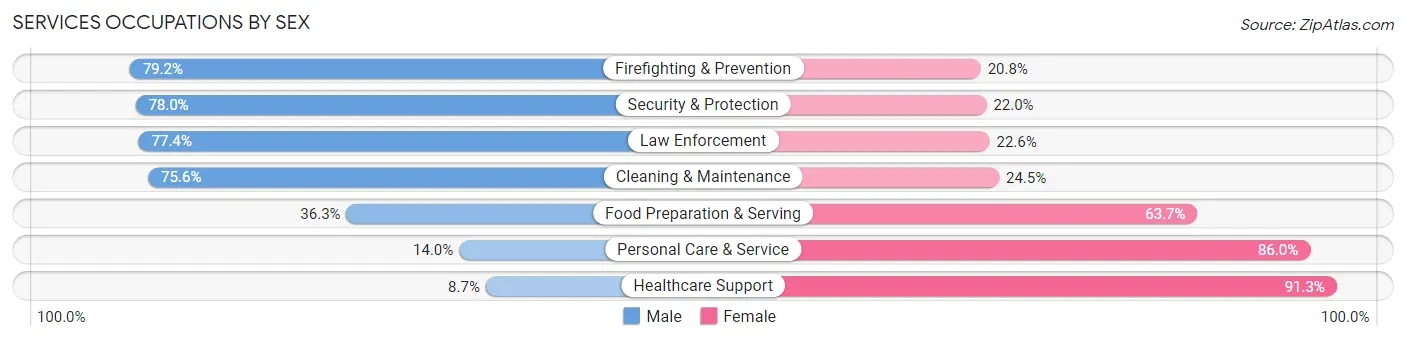
Services Occupations by Sex
Within the Services occupations in Christian County, the most male-oriented occupations are Firefighting & Prevention (79.2%), Security & Protection (78.0%), and Law Enforcement (77.4%), while the most female-oriented occupations are Healthcare Support (91.3%), Personal Care & Service (86.0%), and Food Preparation & Serving (63.7%).
| Occupation | Male | Female |
| Healthcare Support | 107 (8.7%) | 1,124 (91.3%) |
| Security & Protection | 707 (78.0%) | 199 (22.0%) |
| Firefighting & Prevention | 251 (79.2%) | 66 (20.8%) |
| Law Enforcement | 456 (77.4%) | 133 (22.6%) |
| Food Preparation & Serving | 890 (36.3%) | 1,563 (63.7%) |
| Cleaning & Maintenance | 1,004 (75.5%) | 325 (24.4%) |
| Personal Care & Service | 159 (14.0%) | 980 (86.0%) |
| Total (Category) | 2,867 (40.6%) | 4,191 (59.4%) |
| Total (Overall) | 23,041 (52.6%) | 20,748 (47.4%) |
Sales and Office Occupations
The most common Sales and Office occupations in Christian County are Office & Administration (4,892 | 11.2%), and Sales & Related (4,548 | 10.4%).

Sales and Office Occupations by Sex
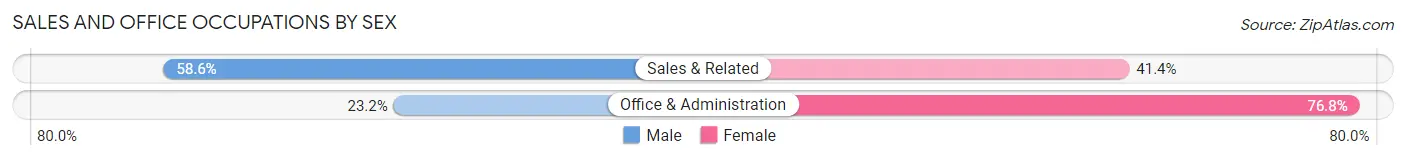
| Occupation | Male | Female |
| Sales & Related | 2,667 (58.6%) | 1,881 (41.4%) |
| Office & Administration | 1,137 (23.2%) | 3,755 (76.8%) |
| Total (Category) | 3,804 (40.3%) | 5,636 (59.7%) |
| Total (Overall) | 23,041 (52.6%) | 20,748 (47.4%) |
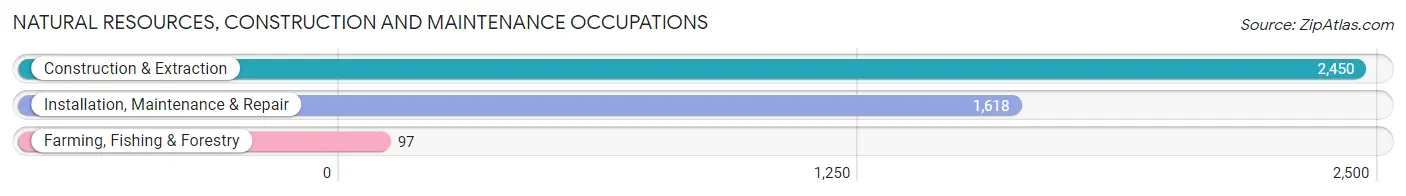
Natural Resources, Construction and Maintenance Occupations
The most common Natural Resources, Construction and Maintenance occupations in Christian County are Construction & Extraction (2,450 | 5.6%), Installation, Maintenance & Repair (1,618 | 3.7%), and Farming, Fishing & Forestry (97 | 0.2%).
Natural Resources, Construction and Maintenance Occupations by Sex
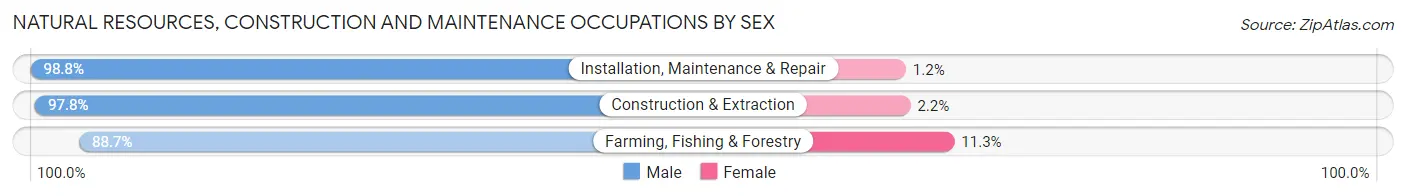
| Occupation | Male | Female |
| Farming, Fishing & Forestry | 86 (88.7%) | 11 (11.3%) |
| Construction & Extraction | 2,396 (97.8%) | 54 (2.2%) |
| Installation, Maintenance & Repair | 1,598 (98.8%) | 20 (1.2%) |
| Total (Category) | 4,080 (98.0%) | 85 (2.0%) |
| Total (Overall) | 23,041 (52.6%) | 20,748 (47.4%) |
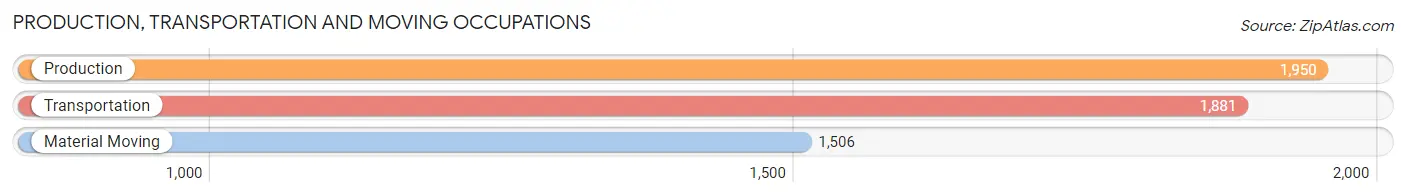
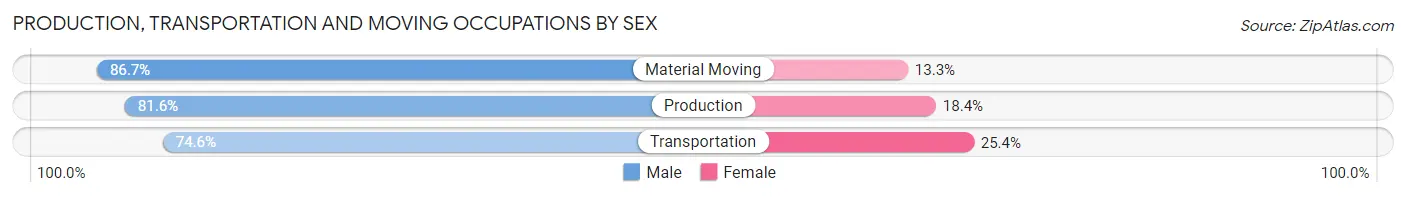
Production, Transportation and Moving Occupations
The most common Production, Transportation and Moving occupations in Christian County are Production (1,950 | 4.4%), Transportation (1,881 | 4.3%), and Material Moving (1,506 | 3.4%).
Production, Transportation and Moving Occupations by Sex
| Occupation | Male | Female |
| Production | 1,591 (81.6%) | 359 (18.4%) |
| Transportation | 1,404 (74.6%) | 477 (25.4%) |
| Material Moving | 1,306 (86.7%) | 200 (13.3%) |
| Total (Category) | 4,301 (80.6%) | 1,036 (19.4%) |
| Total (Overall) | 23,041 (52.6%) | 20,748 (47.4%) |
Employment Industries by Sex in Christian County
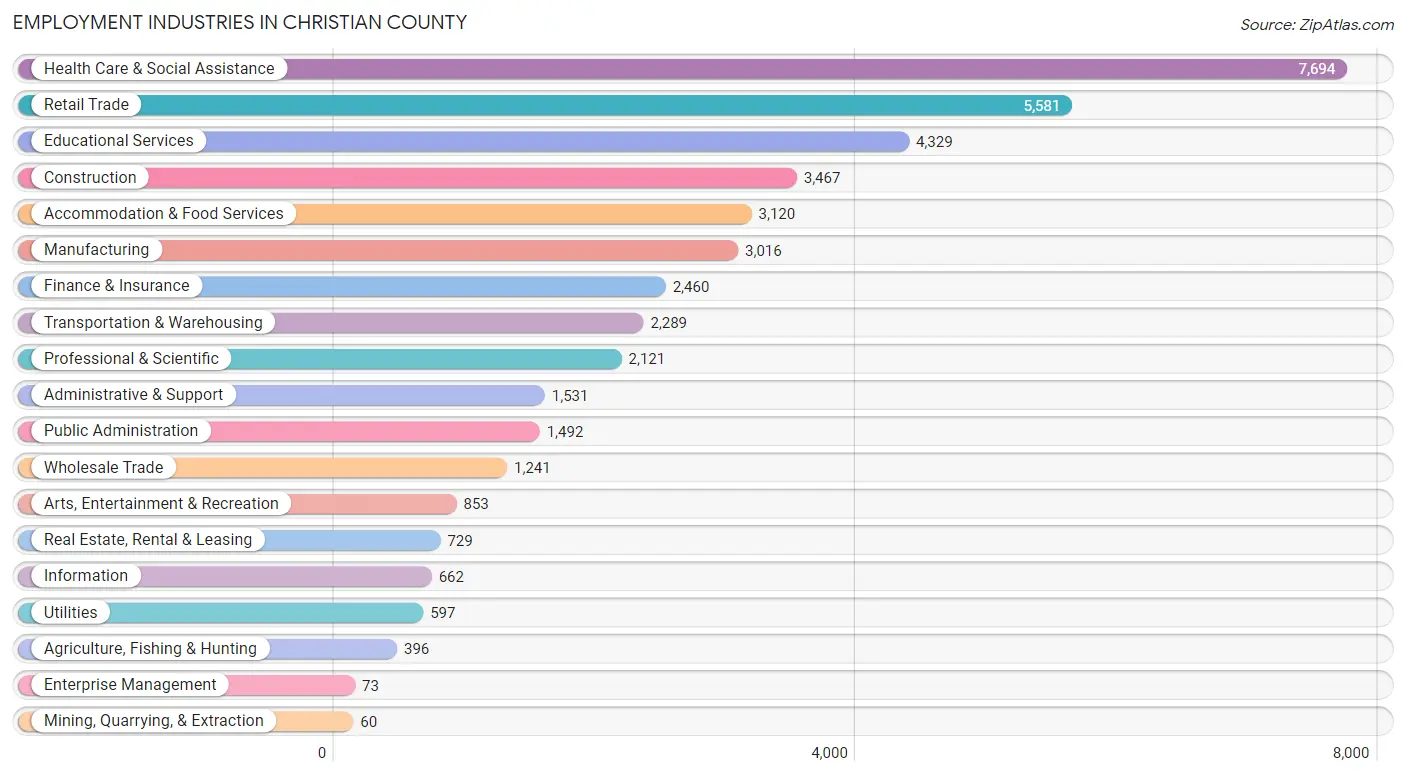
Employment Industries in Christian County
The major employment industries in Christian County include Health Care & Social Assistance (7,694 | 17.6%), Retail Trade (5,581 | 12.8%), Educational Services (4,329 | 9.9%), Construction (3,467 | 7.9%), and Accommodation & Food Services (3,120 | 7.1%).
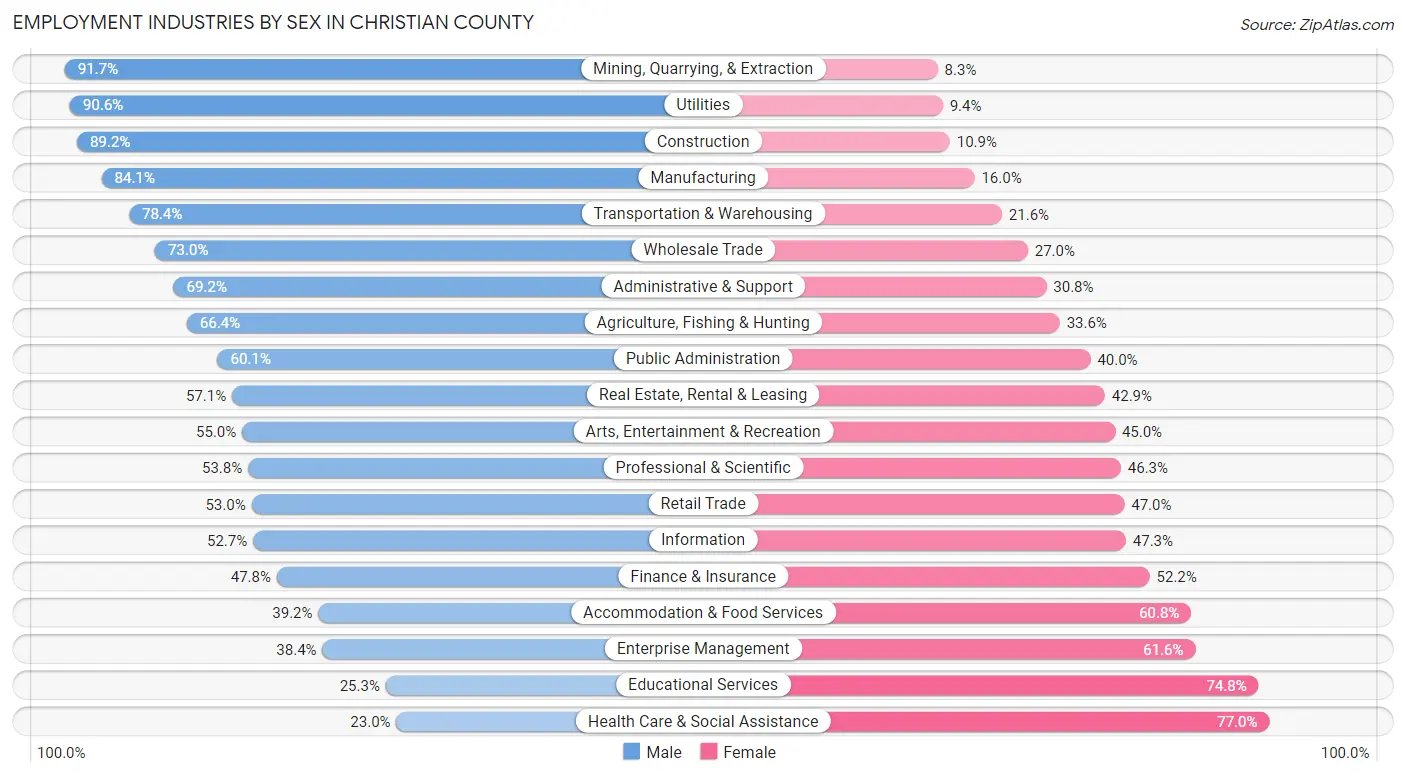
Employment Industries by Sex in Christian County
The Christian County industries that see more men than women are Mining, Quarrying, & Extraction (91.7%), Utilities (90.6%), and Construction (89.1%), whereas the industries that tend to have a higher number of women are Health Care & Social Assistance (77.0%), Educational Services (74.8%), and Enterprise Management (61.6%).
| Industry | Male | Female |
| Agriculture, Fishing & Hunting | 263 (66.4%) | 133 (33.6%) |
| Mining, Quarrying, & Extraction | 55 (91.7%) | 5 (8.3%) |
| Construction | 3,091 (89.1%) | 376 (10.8%) |
| Manufacturing | 2,535 (84.1%) | 481 (16.0%) |
| Wholesale Trade | 906 (73.0%) | 335 (27.0%) |
| Retail Trade | 2,960 (53.0%) | 2,621 (47.0%) |
| Transportation & Warehousing | 1,794 (78.4%) | 495 (21.6%) |
| Utilities | 541 (90.6%) | 56 (9.4%) |
| Information | 349 (52.7%) | 313 (47.3%) |
| Finance & Insurance | 1,176 (47.8%) | 1,284 (52.2%) |
| Real Estate, Rental & Leasing | 416 (57.1%) | 313 (42.9%) |
| Professional & Scientific | 1,140 (53.7%) | 981 (46.3%) |
| Enterprise Management | 28 (38.4%) | 45 (61.6%) |
| Administrative & Support | 1,059 (69.2%) | 472 (30.8%) |
| Educational Services | 1,093 (25.3%) | 3,236 (74.8%) |
| Health Care & Social Assistance | 1,773 (23.0%) | 5,921 (77.0%) |
| Arts, Entertainment & Recreation | 469 (55.0%) | 384 (45.0%) |
| Accommodation & Food Services | 1,223 (39.2%) | 1,897 (60.8%) |
| Public Administration | 896 (60.1%) | 596 (40.0%) |
| Total | 23,041 (52.6%) | 20,748 (47.4%) |
Education in Christian County
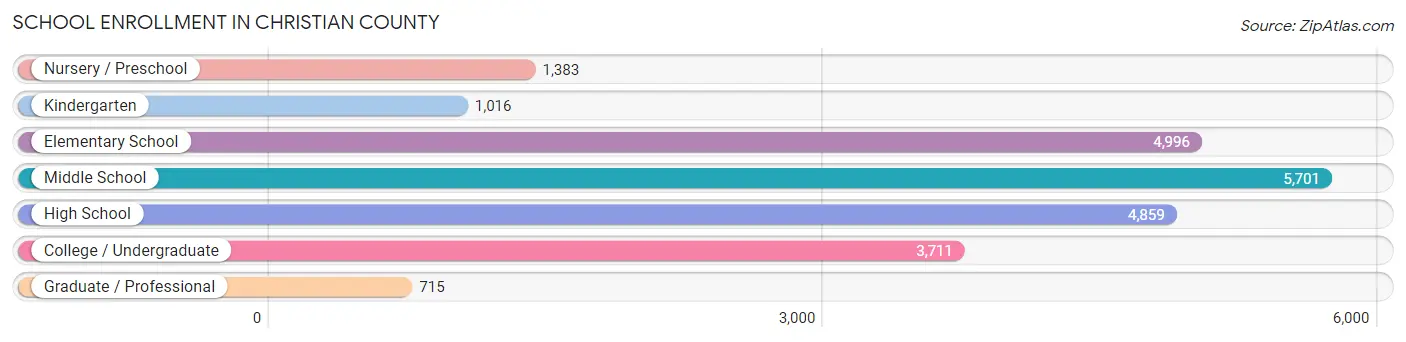
School Enrollment in Christian County
The most common levels of schooling among the 22,381 students in Christian County are middle school (5,701 | 25.5%), elementary school (4,996 | 22.3%), and high school (4,859 | 21.7%).
| School Level | # Students | % Students |
| Nursery / Preschool | 1,383 | 6.2% |
| Kindergarten | 1,016 | 4.5% |
| Elementary School | 4,996 | 22.3% |
| Middle School | 5,701 | 25.5% |
| High School | 4,859 | 21.7% |
| College / Undergraduate | 3,711 | 16.6% |
| Graduate / Professional | 715 | 3.2% |
| Total | 22,381 | 100.0% |
School Enrollment by Age by Funding Source in Christian County
Out of a total of 22,381 students who are enrolled in schools in Christian County, 3,626 (16.2%) attend a private institution, while the remaining 18,755 (83.8%) are enrolled in public schools. The age group of 3 to 4 year olds has the highest likelihood of being enrolled in private schools, with 334 (29.7% in the age bracket) enrolled. Conversely, the age group of 20 to 24 year olds has the lowest likelihood of being enrolled in a private school, with 1,541 (91.8% in the age bracket) attending a public institution.
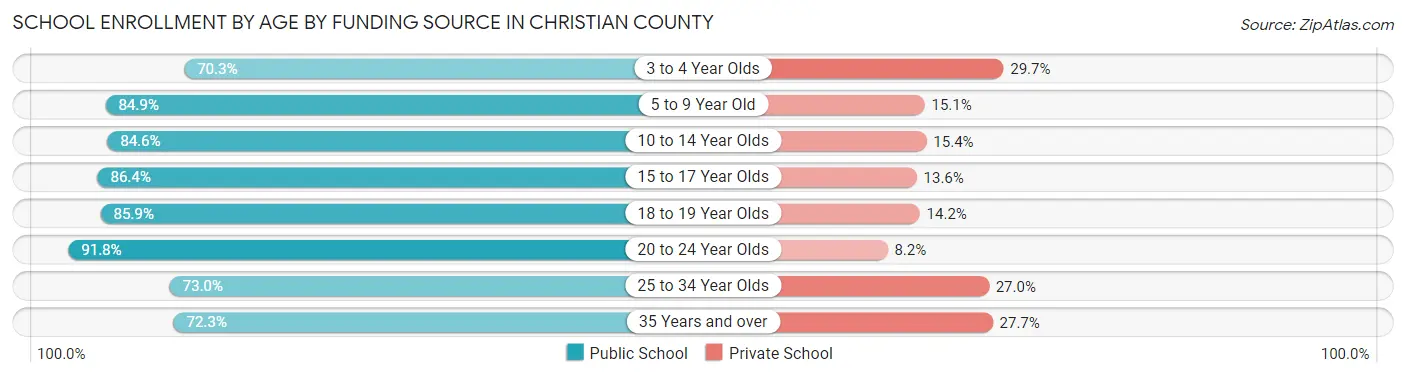
| Age Bracket | Public School | Private School |
| 3 to 4 Year Olds | 789 (70.3%) | 334 (29.7%) |
| 5 to 9 Year Old | 4,648 (84.9%) | 825 (15.1%) |
| 10 to 14 Year Olds | 5,891 (84.6%) | 1,073 (15.4%) |
| 15 to 17 Year Olds | 3,390 (86.4%) | 533 (13.6%) |
| 18 to 19 Year Olds | 1,074 (85.9%) | 177 (14.1%) |
| 20 to 24 Year Olds | 1,541 (91.8%) | 137 (8.2%) |
| 25 to 34 Year Olds | 732 (73.0%) | 271 (27.0%) |
| 35 Years and over | 698 (72.3%) | 268 (27.7%) |
| Total | 18,755 (83.8%) | 3,626 (16.2%) |
Educational Attainment by Field of Study in Christian County
Business (4,303 | 20.6%), education (4,274 | 20.5%), science & technology (2,453 | 11.8%), bio, nature & agricultural (1,945 | 9.3%), and psychology (1,237 | 5.9%) are the most common fields of study among 20,851 individuals in Christian County who have obtained a bachelor's degree or higher.
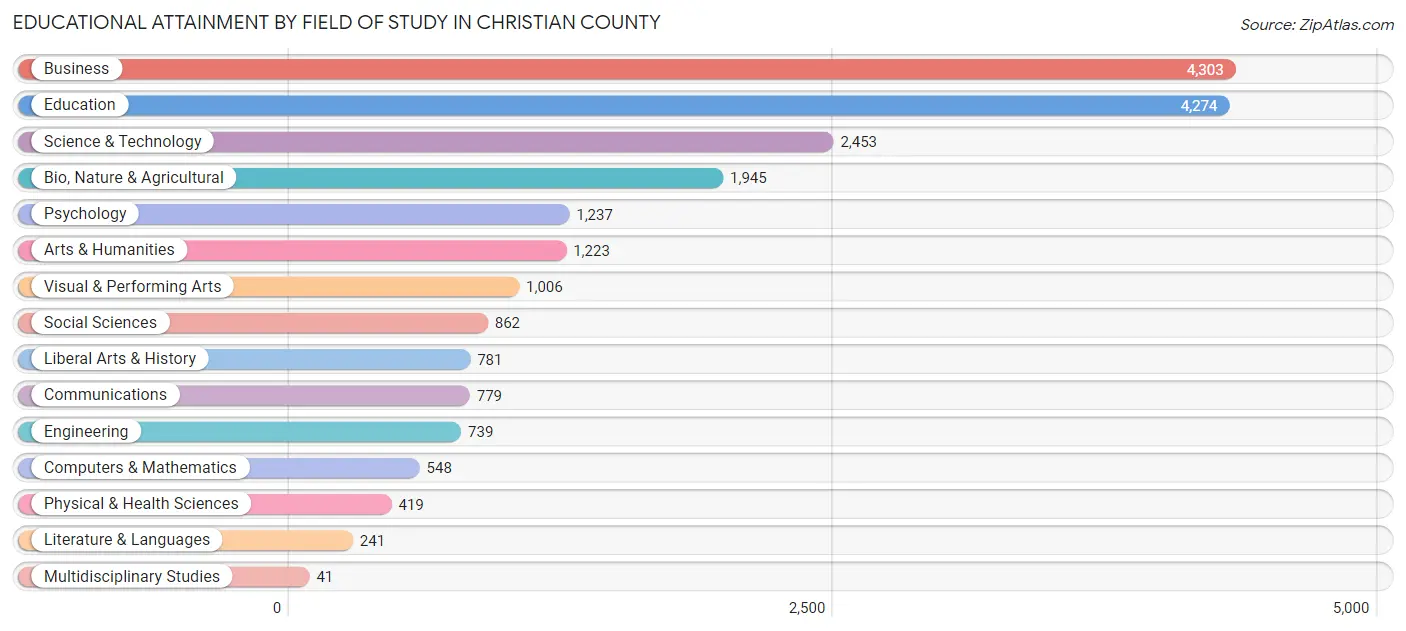
| Field of Study | # Graduates | % Graduates |
| Computers & Mathematics | 548 | 2.6% |
| Bio, Nature & Agricultural | 1,945 | 9.3% |
| Physical & Health Sciences | 419 | 2.0% |
| Psychology | 1,237 | 5.9% |
| Social Sciences | 862 | 4.1% |
| Engineering | 739 | 3.5% |
| Multidisciplinary Studies | 41 | 0.2% |
| Science & Technology | 2,453 | 11.8% |
| Business | 4,303 | 20.6% |
| Education | 4,274 | 20.5% |
| Literature & Languages | 241 | 1.2% |
| Liberal Arts & History | 781 | 3.7% |
| Visual & Performing Arts | 1,006 | 4.8% |
| Communications | 779 | 3.7% |
| Arts & Humanities | 1,223 | 5.9% |
| Total | 20,851 | 100.0% |
Transportation & Commute in Christian County
Vehicle Availability by Sex in Christian County
The most prevalent vehicle ownership categories in Christian County are males with 2 vehicles (9,899, accounting for 43.9%) and females with 2 vehicles (8,589, making up 48.3%).
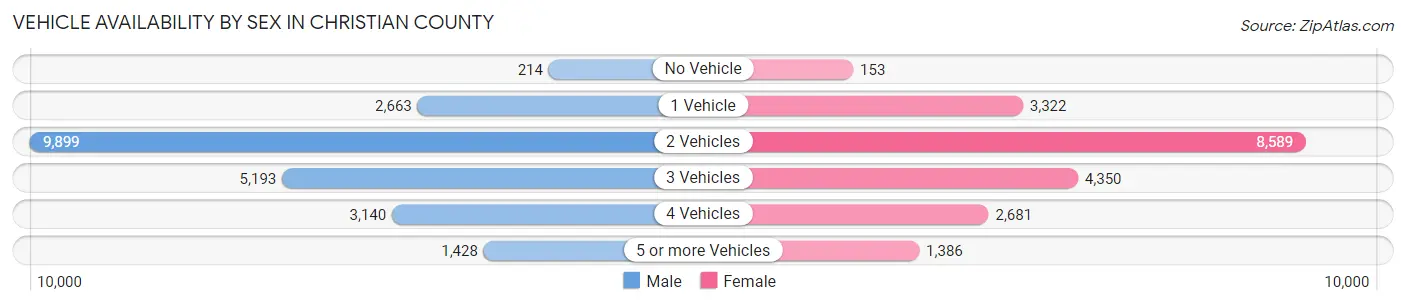
| Vehicles Available | Male | Female |
| No Vehicle | 214 (0.9%) | 153 (0.7%) |
| 1 Vehicle | 2,663 (11.8%) | 3,322 (16.2%) |
| 2 Vehicles | 9,899 (43.9%) | 8,589 (41.9%) |
| 3 Vehicles | 5,193 (23.0%) | 4,350 (21.2%) |
| 4 Vehicles | 3,140 (13.9%) | 2,681 (13.1%) |
| 5 or more Vehicles | 1,428 (6.3%) | 1,386 (6.8%) |
| Total | 22,537 (100.0%) | 20,481 (100.0%) |
Commute Time in Christian County
The most frequently occuring commute durations in Christian County are 30 to 34 minutes (7,377 commuters, 18.4%), 20 to 24 minutes (6,769 commuters, 16.9%), and 15 to 19 minutes (5,566 commuters, 13.9%).
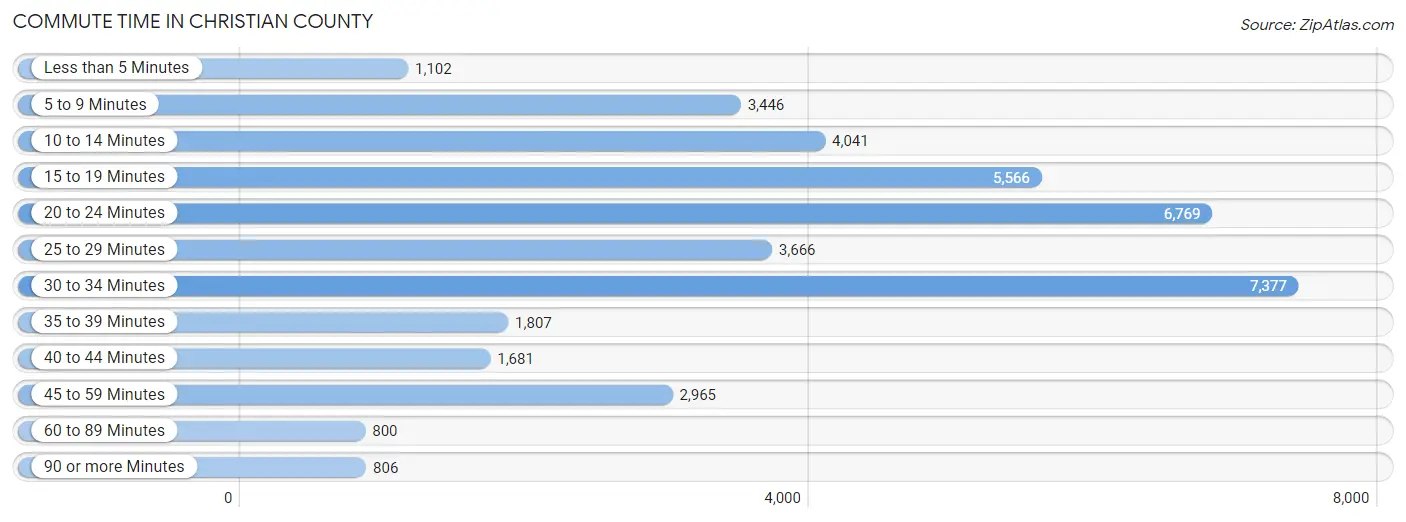
| Commute Time | # Commuters | % Commuters |
| Less than 5 Minutes | 1,102 | 2.8% |
| 5 to 9 Minutes | 3,446 | 8.6% |
| 10 to 14 Minutes | 4,041 | 10.1% |
| 15 to 19 Minutes | 5,566 | 13.9% |
| 20 to 24 Minutes | 6,769 | 16.9% |
| 25 to 29 Minutes | 3,666 | 9.2% |
| 30 to 34 Minutes | 7,377 | 18.4% |
| 35 to 39 Minutes | 1,807 | 4.5% |
| 40 to 44 Minutes | 1,681 | 4.2% |
| 45 to 59 Minutes | 2,965 | 7.4% |
| 60 to 89 Minutes | 800 | 2.0% |
| 90 or more Minutes | 806 | 2.0% |
Commute Time by Sex in Christian County
The most common commute times in Christian County are 30 to 34 minutes (4,341 commuters, 20.4%) for males and 15 to 19 minutes (3,370 commuters, 18.0%) for females.
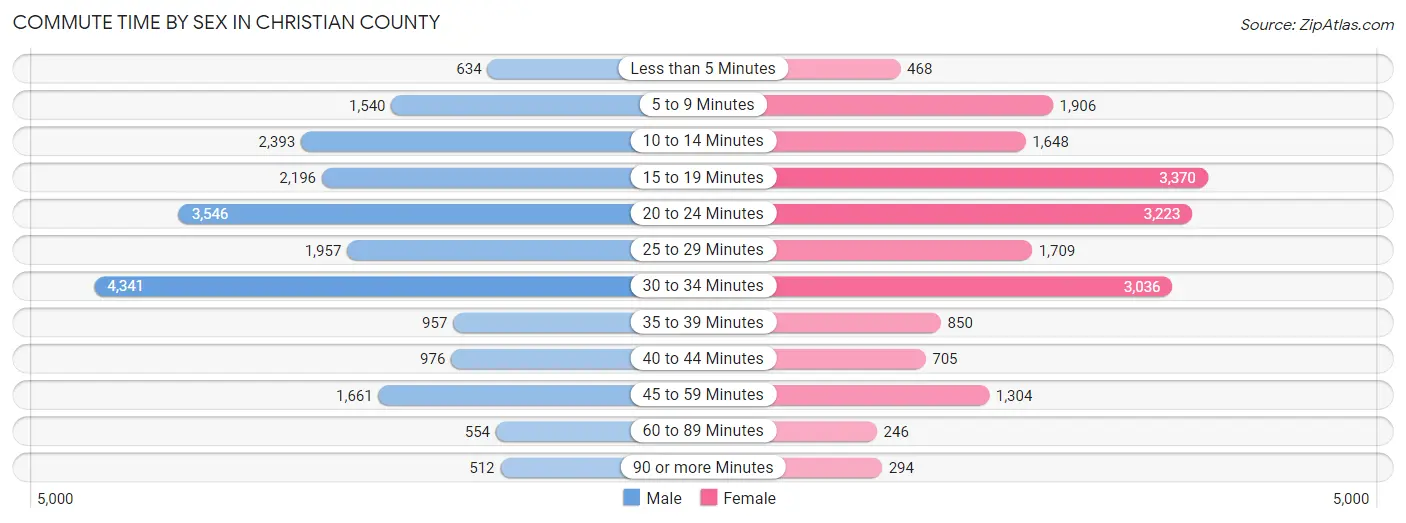
| Commute Time | Male | Female |
| Less than 5 Minutes | 634 (3.0%) | 468 (2.5%) |
| 5 to 9 Minutes | 1,540 (7.2%) | 1,906 (10.2%) |
| 10 to 14 Minutes | 2,393 (11.3%) | 1,648 (8.8%) |
| 15 to 19 Minutes | 2,196 (10.3%) | 3,370 (18.0%) |
| 20 to 24 Minutes | 3,546 (16.7%) | 3,223 (17.2%) |
| 25 to 29 Minutes | 1,957 (9.2%) | 1,709 (9.1%) |
| 30 to 34 Minutes | 4,341 (20.4%) | 3,036 (16.2%) |
| 35 to 39 Minutes | 957 (4.5%) | 850 (4.5%) |
| 40 to 44 Minutes | 976 (4.6%) | 705 (3.8%) |
| 45 to 59 Minutes | 1,661 (7.8%) | 1,304 (7.0%) |
| 60 to 89 Minutes | 554 (2.6%) | 246 (1.3%) |
| 90 or more Minutes | 512 (2.4%) | 294 (1.6%) |
Time of Departure to Work by Sex in Christian County
The most frequent times of departure to work in Christian County are 7:00 AM to 7:29 AM (3,664, 17.2%) for males and 7:00 AM to 7:29 AM (3,466, 18.5%) for females.
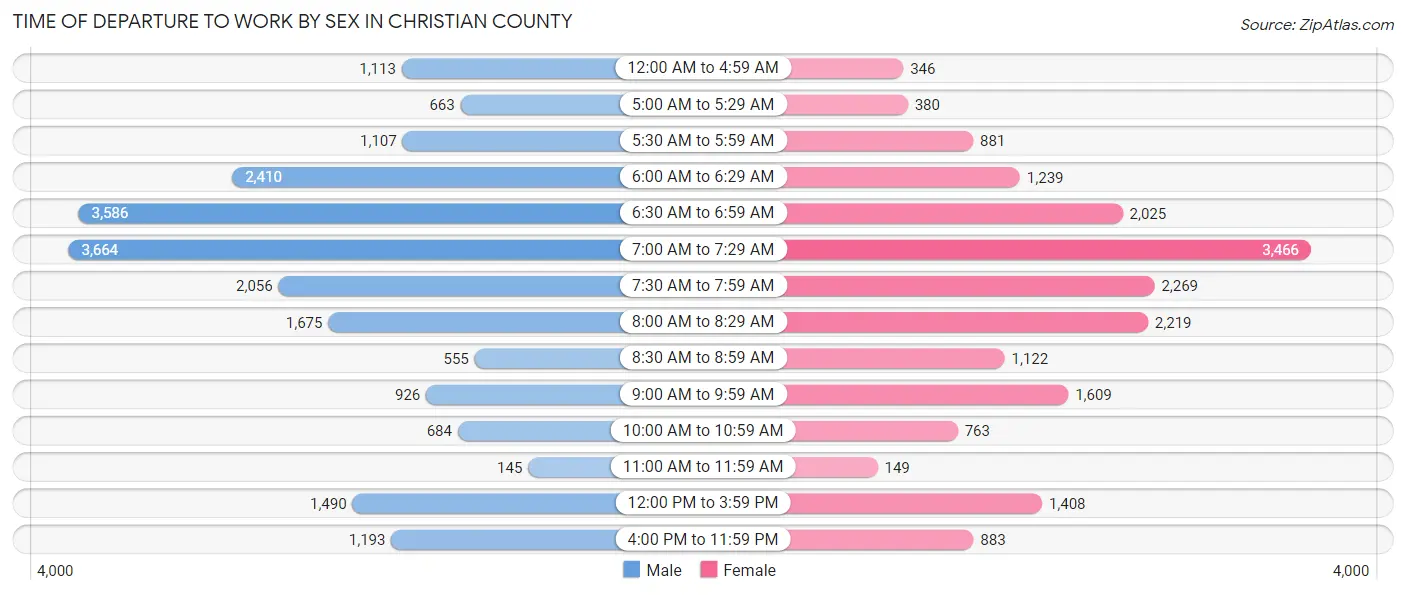
| Time of Departure | Male | Female |
| 12:00 AM to 4:59 AM | 1,113 (5.2%) | 346 (1.8%) |
| 5:00 AM to 5:29 AM | 663 (3.1%) | 380 (2.0%) |
| 5:30 AM to 5:59 AM | 1,107 (5.2%) | 881 (4.7%) |
| 6:00 AM to 6:29 AM | 2,410 (11.3%) | 1,239 (6.6%) |
| 6:30 AM to 6:59 AM | 3,586 (16.9%) | 2,025 (10.8%) |
| 7:00 AM to 7:29 AM | 3,664 (17.2%) | 3,466 (18.5%) |
| 7:30 AM to 7:59 AM | 2,056 (9.7%) | 2,269 (12.1%) |
| 8:00 AM to 8:29 AM | 1,675 (7.9%) | 2,219 (11.8%) |
| 8:30 AM to 8:59 AM | 555 (2.6%) | 1,122 (6.0%) |
| 9:00 AM to 9:59 AM | 926 (4.3%) | 1,609 (8.6%) |
| 10:00 AM to 10:59 AM | 684 (3.2%) | 763 (4.1%) |
| 11:00 AM to 11:59 AM | 145 (0.7%) | 149 (0.8%) |
| 12:00 PM to 3:59 PM | 1,490 (7.0%) | 1,408 (7.5%) |
| 4:00 PM to 11:59 PM | 1,193 (5.6%) | 883 (4.7%) |
| Total | 21,267 (100.0%) | 18,759 (100.0%) |
Housing Occupancy in Christian County
Occupancy by Ownership in Christian County
Of the total 33,411 dwellings in Christian County, owner-occupied units account for 25,368 (75.9%), while renter-occupied units make up 8,043 (24.1%).
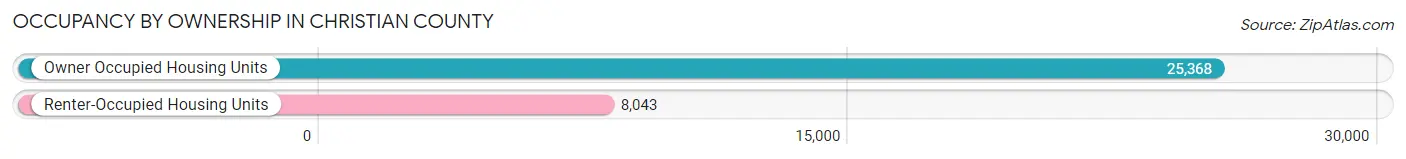
| Occupancy | # Housing Units | % Housing Units |
| Owner Occupied Housing Units | 25,368 | 75.9% |
| Renter-Occupied Housing Units | 8,043 | 24.1% |
| Total Occupied Housing Units | 33,411 | 100.0% |
Occupancy by Household Size in Christian County
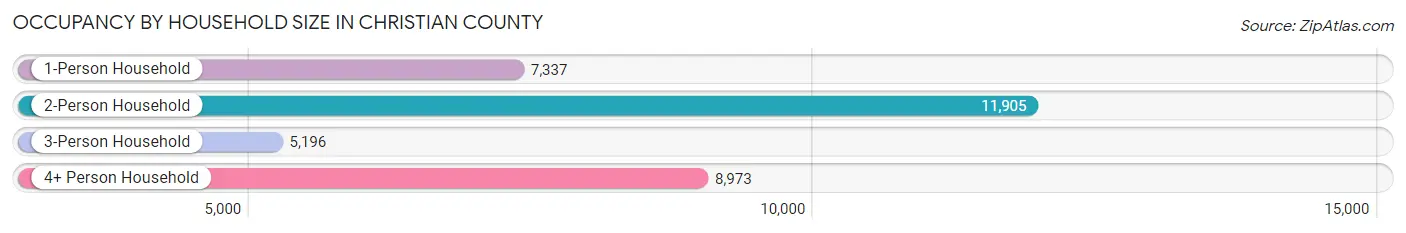
| Household Size | # Housing Units | % Housing Units |
| 1-Person Household | 7,337 | 22.0% |
| 2-Person Household | 11,905 | 35.6% |
| 3-Person Household | 5,196 | 15.5% |
| 4+ Person Household | 8,973 | 26.9% |
| Total Housing Units | 33,411 | 100.0% |
Occupancy by Ownership by Household Size in Christian County
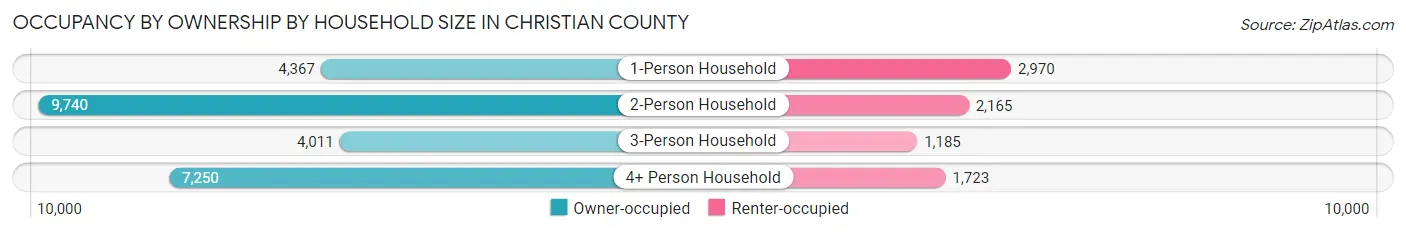
| Household Size | Owner-occupied | Renter-occupied |
| 1-Person Household | 4,367 (59.5%) | 2,970 (40.5%) |
| 2-Person Household | 9,740 (81.8%) | 2,165 (18.2%) |
| 3-Person Household | 4,011 (77.2%) | 1,185 (22.8%) |
| 4+ Person Household | 7,250 (80.8%) | 1,723 (19.2%) |
| Total Housing Units | 25,368 (75.9%) | 8,043 (24.1%) |
Occupancy by Educational Attainment in Christian County
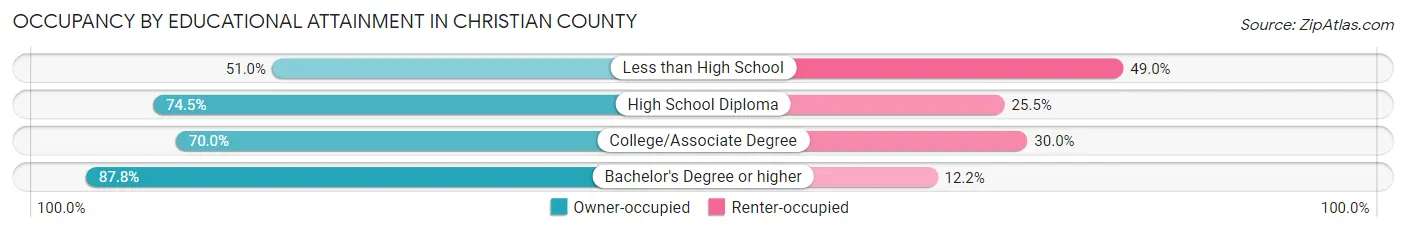
| Household Size | Owner-occupied | Renter-occupied |
| Less than High School | 1,042 (51.0%) | 1,002 (49.0%) |
| High School Diploma | 6,339 (74.5%) | 2,167 (25.5%) |
| College/Associate Degree | 8,232 (70.0%) | 3,524 (30.0%) |
| Bachelor's Degree or higher | 9,755 (87.8%) | 1,350 (12.2%) |
Occupancy by Age of Householder in Christian County
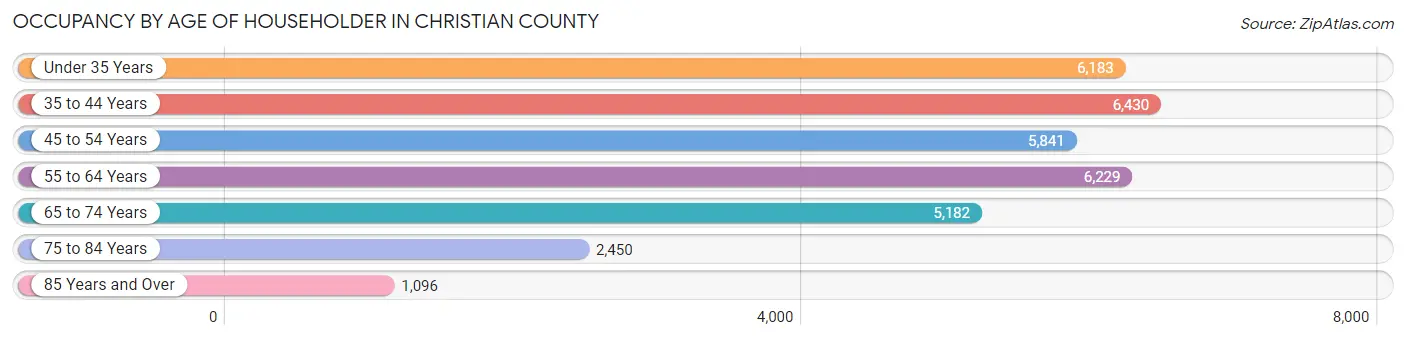
| Age Bracket | # Households | % Households |
| Under 35 Years | 6,183 | 18.5% |
| 35 to 44 Years | 6,430 | 19.3% |
| 45 to 54 Years | 5,841 | 17.5% |
| 55 to 64 Years | 6,229 | 18.6% |
| 65 to 74 Years | 5,182 | 15.5% |
| 75 to 84 Years | 2,450 | 7.3% |
| 85 Years and Over | 1,096 | 3.3% |
| Total | 33,411 | 100.0% |
Housing Finances in Christian County
Median Income by Occupancy in Christian County
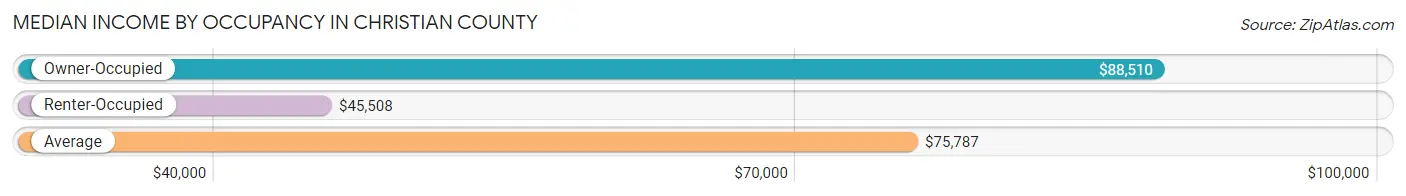
| Occupancy Type | # Households | Median Income |
| Owner-Occupied | 25,368 (75.9%) | $88,510 |
| Renter-Occupied | 8,043 (24.1%) | $45,508 |
| Average | 33,411 (100.0%) | $75,787 |
Occupancy by Householder Income Bracket in Christian County
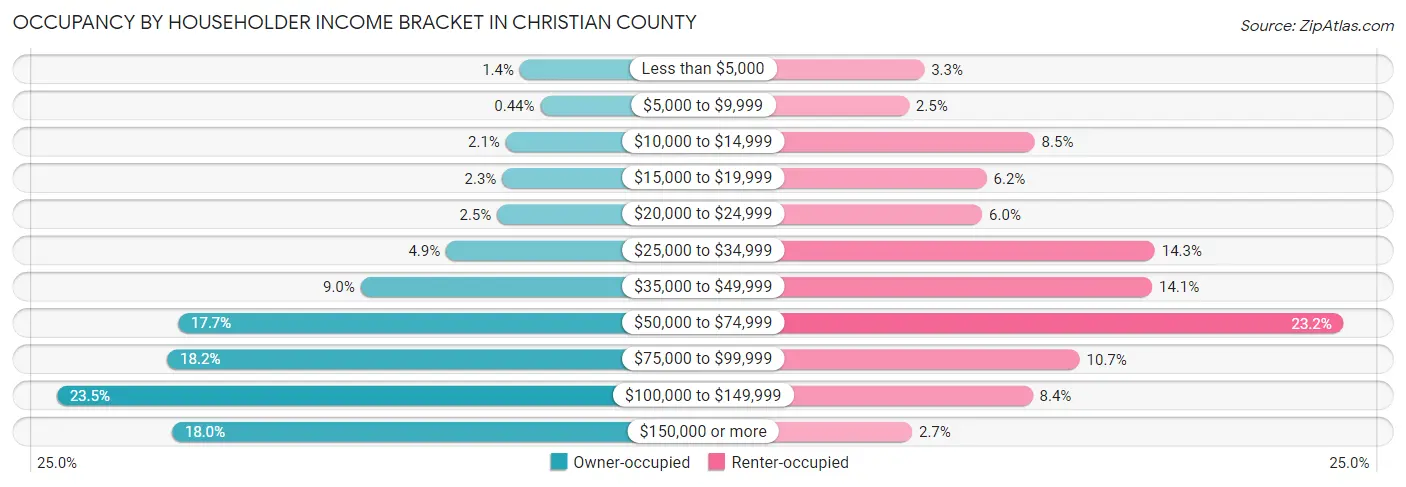
| Income Bracket | Owner-occupied | Renter-occupied |
| Less than $5,000 | 359 (1.4%) | 263 (3.3%) |
| $5,000 to $9,999 | 112 (0.4%) | 204 (2.5%) |
| $10,000 to $14,999 | 529 (2.1%) | 686 (8.5%) |
| $15,000 to $19,999 | 574 (2.3%) | 502 (6.2%) |
| $20,000 to $24,999 | 633 (2.5%) | 485 (6.0%) |
| $25,000 to $34,999 | 1,251 (4.9%) | 1,146 (14.2%) |
| $35,000 to $49,999 | 2,284 (9.0%) | 1,136 (14.1%) |
| $50,000 to $74,999 | 4,490 (17.7%) | 1,869 (23.2%) |
| $75,000 to $99,999 | 4,620 (18.2%) | 858 (10.7%) |
| $100,000 to $149,999 | 5,953 (23.5%) | 678 (8.4%) |
| $150,000 or more | 4,563 (18.0%) | 216 (2.7%) |
| Total | 25,368 (100.0%) | 8,043 (100.0%) |
Monthly Housing Cost Tiers in Christian County
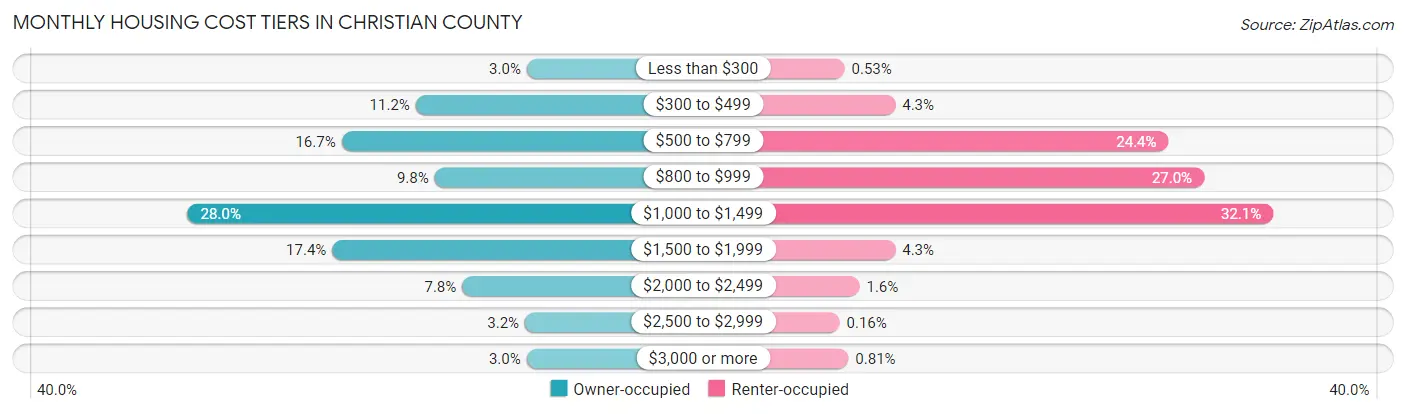
| Monthly Cost | Owner-occupied | Renter-occupied |
| Less than $300 | 767 (3.0%) | 43 (0.5%) |
| $300 to $499 | 2,841 (11.2%) | 343 (4.3%) |
| $500 to $799 | 4,227 (16.7%) | 1,960 (24.4%) |
| $800 to $999 | 2,488 (9.8%) | 2,171 (27.0%) |
| $1,000 to $1,499 | 7,103 (28.0%) | 2,580 (32.1%) |
| $1,500 to $1,999 | 4,401 (17.3%) | 343 (4.3%) |
| $2,000 to $2,499 | 1,973 (7.8%) | 131 (1.6%) |
| $2,500 to $2,999 | 800 (3.2%) | 13 (0.2%) |
| $3,000 or more | 768 (3.0%) | 65 (0.8%) |
| Total | 25,368 (100.0%) | 8,043 (100.0%) |
Physical Housing Characteristics in Christian County
Housing Structures in Christian County
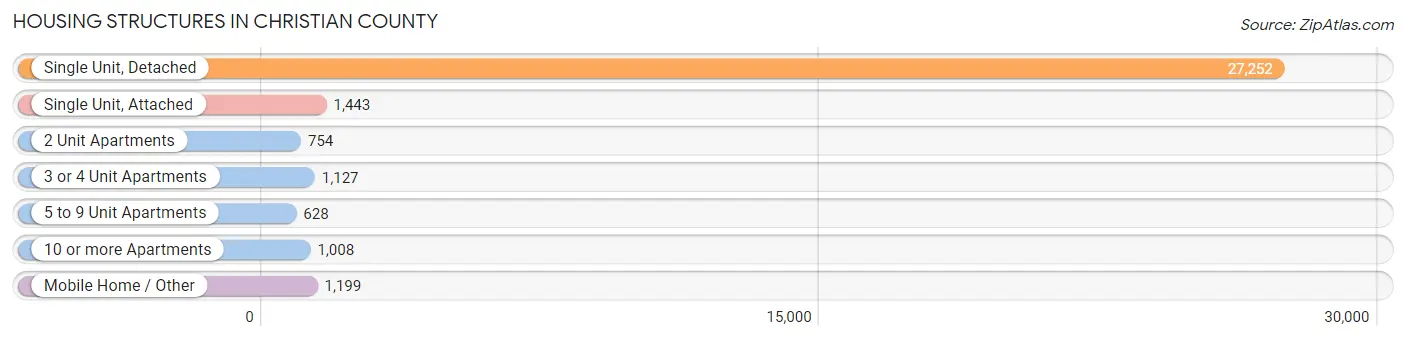
| Structure Type | # Housing Units | % Housing Units |
| Single Unit, Detached | 27,252 | 81.6% |
| Single Unit, Attached | 1,443 | 4.3% |
| 2 Unit Apartments | 754 | 2.3% |
| 3 or 4 Unit Apartments | 1,127 | 3.4% |
| 5 to 9 Unit Apartments | 628 | 1.9% |
| 10 or more Apartments | 1,008 | 3.0% |
| Mobile Home / Other | 1,199 | 3.6% |
| Total | 33,411 | 100.0% |
Housing Structures by Occupancy in Christian County
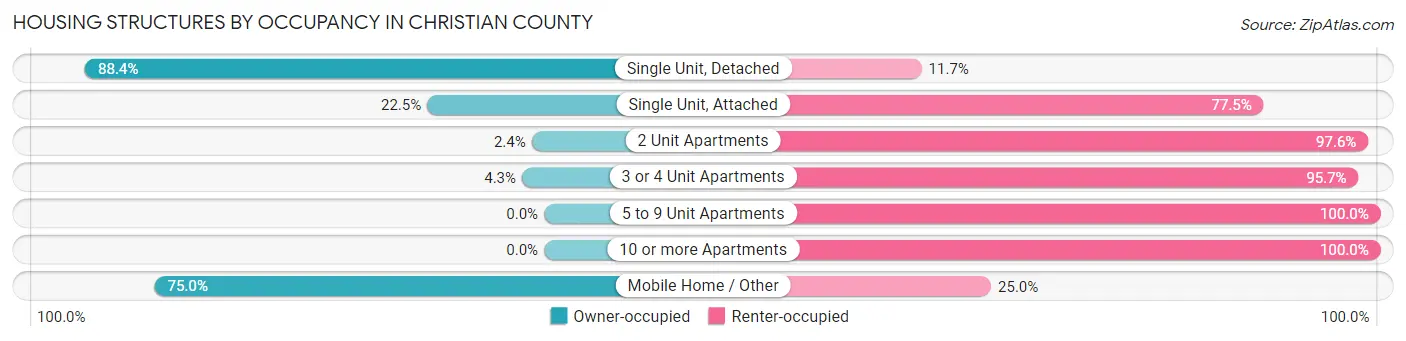
| Structure Type | Owner-occupied | Renter-occupied |
| Single Unit, Detached | 24,078 (88.3%) | 3,174 (11.7%) |
| Single Unit, Attached | 325 (22.5%) | 1,118 (77.5%) |
| 2 Unit Apartments | 18 (2.4%) | 736 (97.6%) |
| 3 or 4 Unit Apartments | 48 (4.3%) | 1,079 (95.7%) |
| 5 to 9 Unit Apartments | 0 (0.0%) | 628 (100.0%) |
| 10 or more Apartments | 0 (0.0%) | 1,008 (100.0%) |
| Mobile Home / Other | 899 (75.0%) | 300 (25.0%) |
| Total | 25,368 (75.9%) | 8,043 (24.1%) |
Housing Structures by Number of Rooms in Christian County
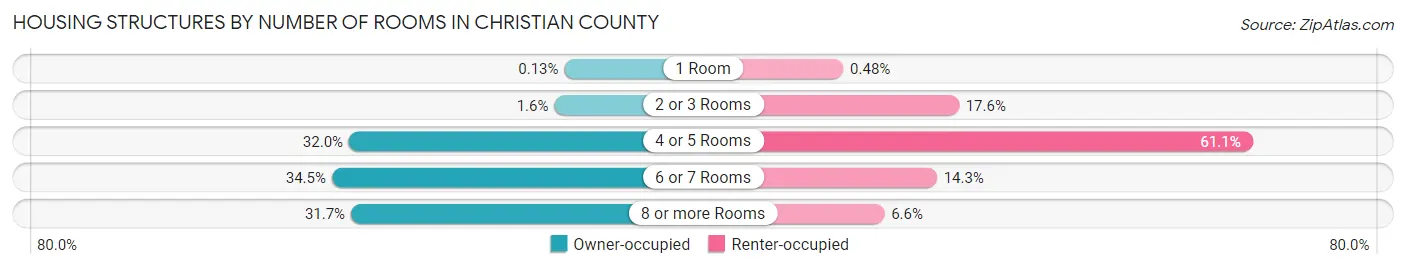
| Number of Rooms | Owner-occupied | Renter-occupied |
| 1 Room | 32 (0.1%) | 39 (0.5%) |
| 2 or 3 Rooms | 411 (1.6%) | 1,414 (17.6%) |
| 4 or 5 Rooms | 8,120 (32.0%) | 4,910 (61.1%) |
| 6 or 7 Rooms | 8,761 (34.5%) | 1,152 (14.3%) |
| 8 or more Rooms | 8,044 (31.7%) | 528 (6.6%) |
| Total | 25,368 (100.0%) | 8,043 (100.0%) |
Housing Structure by Heating Type in Christian County
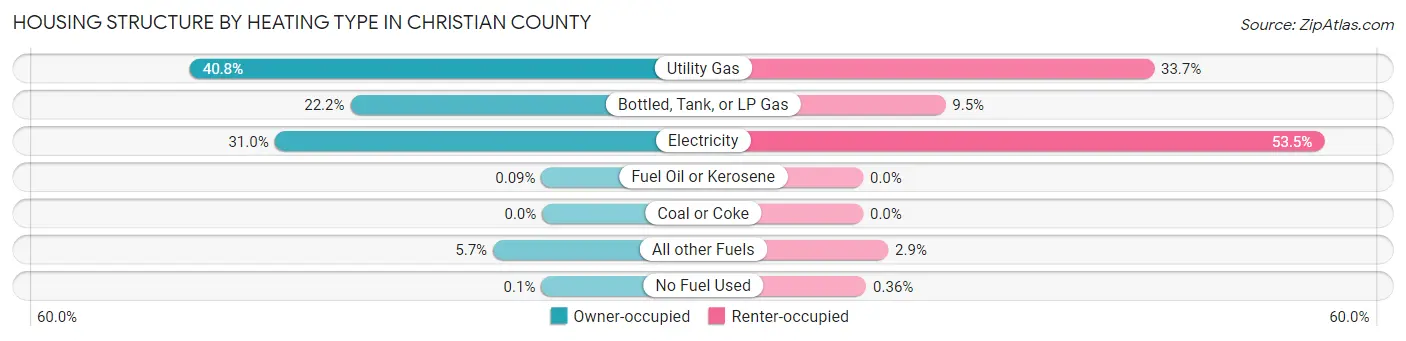
| Heating Type | Owner-occupied | Renter-occupied |
| Utility Gas | 10,361 (40.8%) | 2,714 (33.7%) |
| Bottled, Tank, or LP Gas | 5,643 (22.2%) | 767 (9.5%) |
| Electricity | 7,871 (31.0%) | 4,299 (53.4%) |
| Fuel Oil or Kerosene | 22 (0.1%) | 0 (0.0%) |
| Coal or Coke | 0 (0.0%) | 0 (0.0%) |
| All other Fuels | 1,446 (5.7%) | 234 (2.9%) |
| No Fuel Used | 25 (0.1%) | 29 (0.4%) |
| Total | 25,368 (100.0%) | 8,043 (100.0%) |
Household Vehicle Usage in Christian County
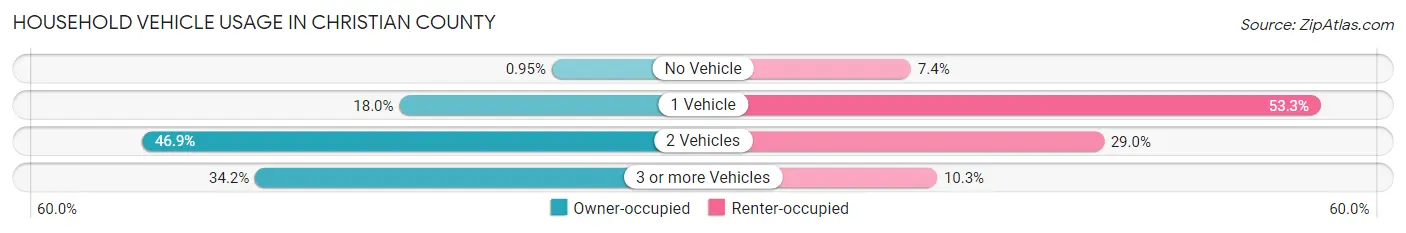
| Vehicles per Household | Owner-occupied | Renter-occupied |
| No Vehicle | 242 (0.9%) | 594 (7.4%) |
| 1 Vehicle | 4,571 (18.0%) | 4,288 (53.3%) |
| 2 Vehicles | 11,885 (46.9%) | 2,332 (29.0%) |
| 3 or more Vehicles | 8,670 (34.2%) | 829 (10.3%) |
| Total | 25,368 (100.0%) | 8,043 (100.0%) |
Real Estate & Mortgages in Christian County
Real Estate and Mortgage Overview in Christian County
| Characteristic | Without Mortgage | With Mortgage |
| Housing Units | 7,996 | 17,372 |
| Median Property Value | $222,500 | $232,300 |
| Median Household Income | $61,777 | $3,696 |
| Monthly Housing Costs | $525 | $768 |
| Real Estate Taxes | $1,611 | $310 |
Property Value by Mortgage Status in Christian County
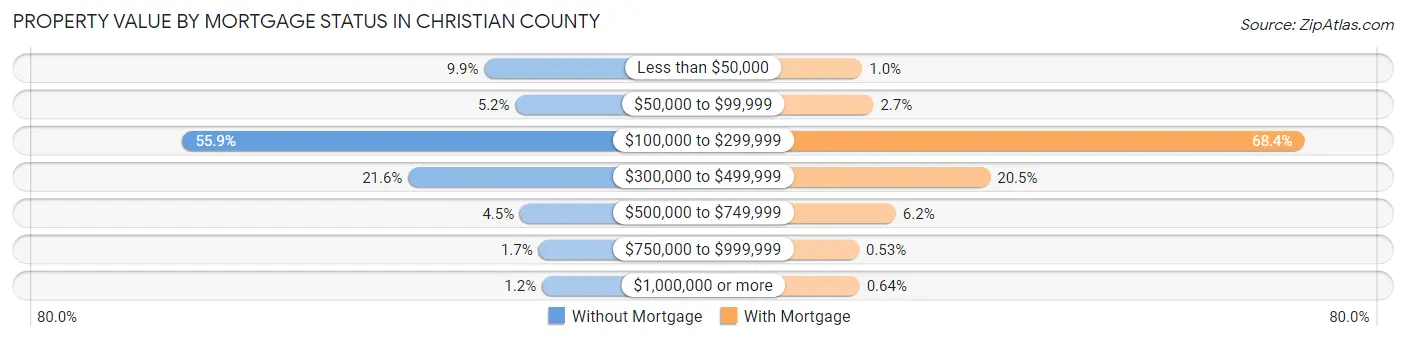
| Property Value | Without Mortgage | With Mortgage |
| Less than $50,000 | 795 (9.9%) | 181 (1.0%) |
| $50,000 to $99,999 | 417 (5.2%) | 474 (2.7%) |
| $100,000 to $299,999 | 4,473 (55.9%) | 11,879 (68.4%) |
| $300,000 to $499,999 | 1,723 (21.5%) | 3,566 (20.5%) |
| $500,000 to $749,999 | 360 (4.5%) | 1,068 (6.1%) |
| $750,000 to $999,999 | 135 (1.7%) | 92 (0.5%) |
| $1,000,000 or more | 93 (1.2%) | 112 (0.6%) |
| Total | 7,996 (100.0%) | 17,372 (100.0%) |
Household Income by Mortgage Status in Christian County
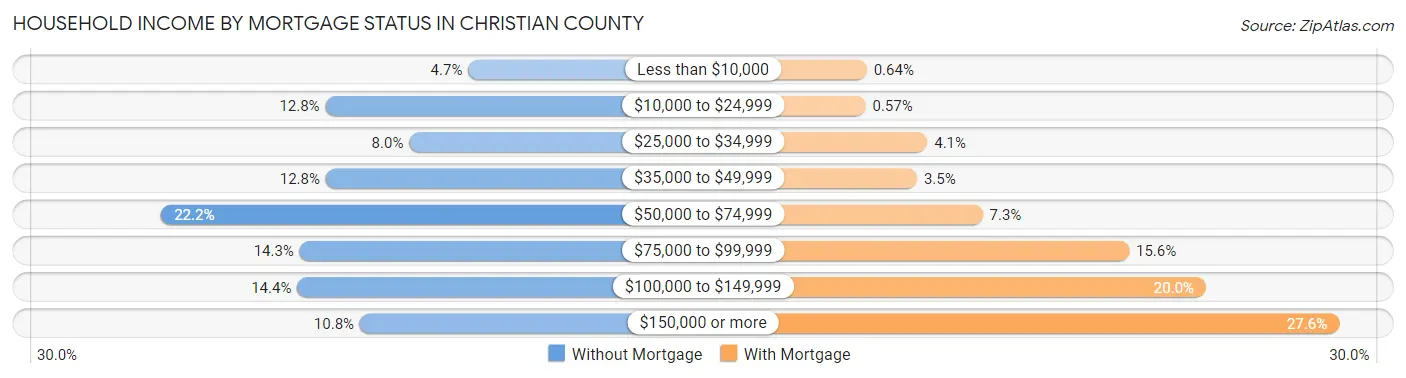
| Household Income | Without Mortgage | With Mortgage |
| Less than $10,000 | 372 (4.6%) | 111 (0.6%) |
| $10,000 to $24,999 | 1,024 (12.8%) | 99 (0.6%) |
| $25,000 to $34,999 | 641 (8.0%) | 712 (4.1%) |
| $35,000 to $49,999 | 1,023 (12.8%) | 610 (3.5%) |
| $50,000 to $74,999 | 1,774 (22.2%) | 1,261 (7.3%) |
| $75,000 to $99,999 | 1,142 (14.3%) | 2,716 (15.6%) |
| $100,000 to $149,999 | 1,153 (14.4%) | 3,478 (20.0%) |
| $150,000 or more | 867 (10.8%) | 4,800 (27.6%) |
| Total | 7,996 (100.0%) | 17,372 (100.0%) |
Property Value to Household Income Ratio in Christian County
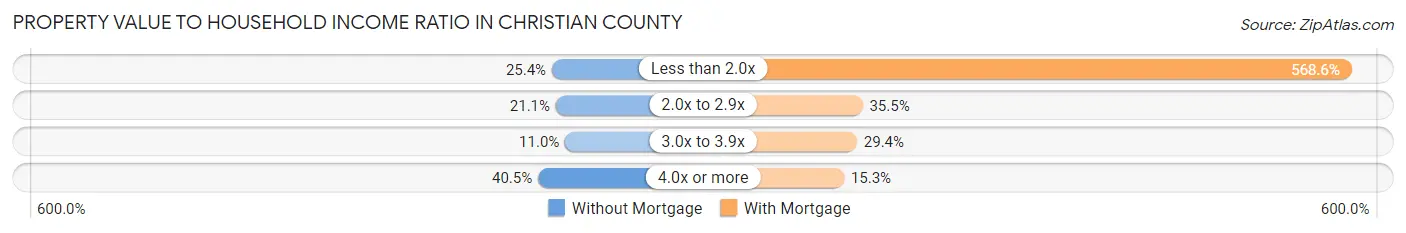
| Value-to-Income Ratio | Without Mortgage | With Mortgage |
| Less than 2.0x | 2,028 (25.4%) | 98,769 (568.6%) |
| 2.0x to 2.9x | 1,687 (21.1%) | 6,160 (35.5%) |
| 3.0x to 3.9x | 879 (11.0%) | 5,105 (29.4%) |
| 4.0x or more | 3,238 (40.5%) | 2,657 (15.3%) |
| Total | 7,996 (100.0%) | 17,372 (100.0%) |
Real Estate Taxes by Mortgage Status in Christian County
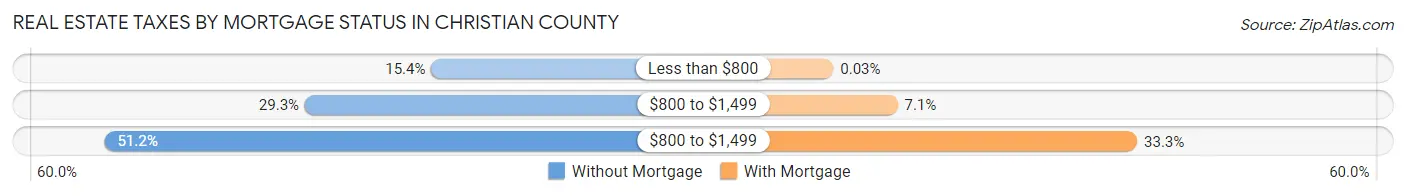
| Property Taxes | Without Mortgage | With Mortgage |
| Less than $800 | 1,234 (15.4%) | 6 (0.0%) |
| $800 to $1,499 | 2,341 (29.3%) | 1,228 (7.1%) |
| $800 to $1,499 | 4,097 (51.2%) | 5,788 (33.3%) |
| Total | 7,996 (100.0%) | 17,372 (100.0%) |
Health & Disability in Christian County
Health Insurance Coverage by Age in Christian County
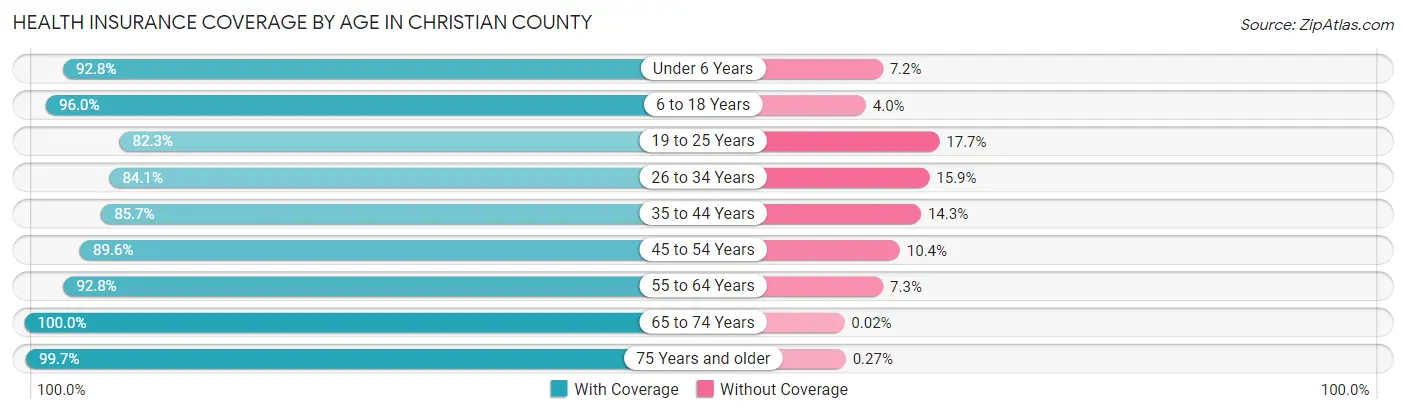
| Age Bracket | With Coverage | Without Coverage |
| Under 6 Years | 6,083 (92.8%) | 470 (7.2%) |
| 6 to 18 Years | 16,276 (96.0%) | 682 (4.0%) |
| 19 to 25 Years | 5,280 (82.3%) | 1,138 (17.7%) |
| 26 to 34 Years | 8,650 (84.1%) | 1,630 (15.9%) |
| 35 to 44 Years | 10,509 (85.7%) | 1,754 (14.3%) |
| 45 to 54 Years | 9,966 (89.6%) | 1,152 (10.4%) |
| 55 to 64 Years | 10,461 (92.7%) | 818 (7.2%) |
| 65 to 74 Years | 8,606 (100.0%) | 2 (0.0%) |
| 75 Years and older | 5,540 (99.7%) | 15 (0.3%) |
| Total | 81,371 (91.4%) | 7,661 (8.6%) |
Health Insurance Coverage by Citizenship Status in Christian County
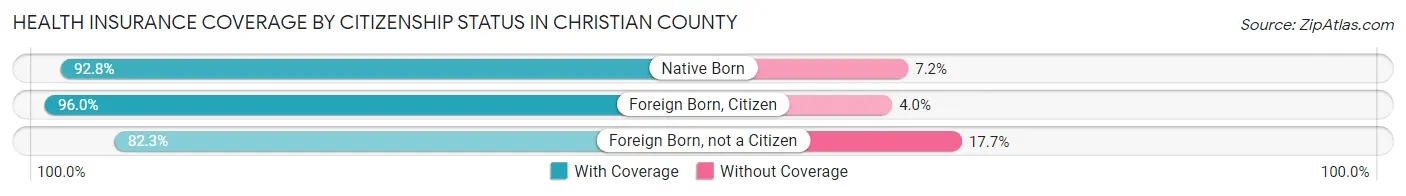
| Citizenship Status | With Coverage | Without Coverage |
| Native Born | 6,083 (92.8%) | 470 (7.2%) |
| Foreign Born, Citizen | 16,276 (96.0%) | 682 (4.0%) |
| Foreign Born, not a Citizen | 5,280 (82.3%) | 1,138 (17.7%) |
Health Insurance Coverage by Household Income in Christian County
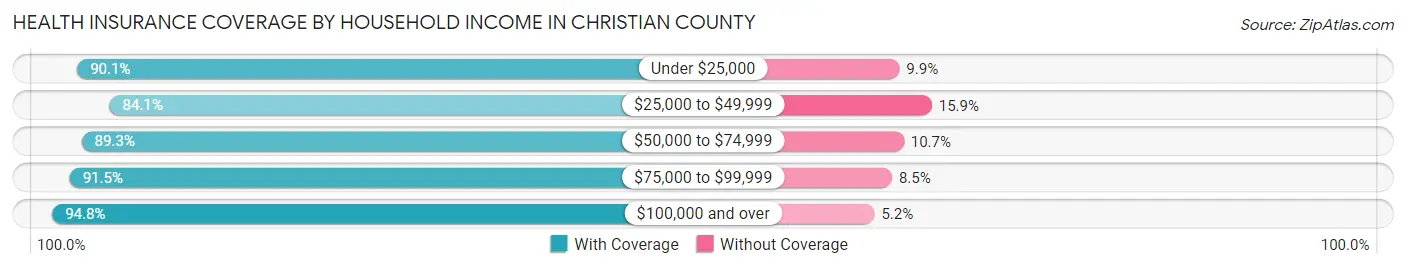
| Household Income | With Coverage | Without Coverage |
| Under $25,000 | 6,305 (90.1%) | 690 (9.9%) |
| $25,000 to $49,999 | 10,230 (84.1%) | 1,938 (15.9%) |
| $50,000 to $74,999 | 14,504 (89.3%) | 1,735 (10.7%) |
| $75,000 to $99,999 | 14,452 (91.5%) | 1,335 (8.5%) |
| $100,000 and over | 35,790 (94.8%) | 1,955 (5.2%) |
Public vs Private Health Insurance Coverage by Age in Christian County
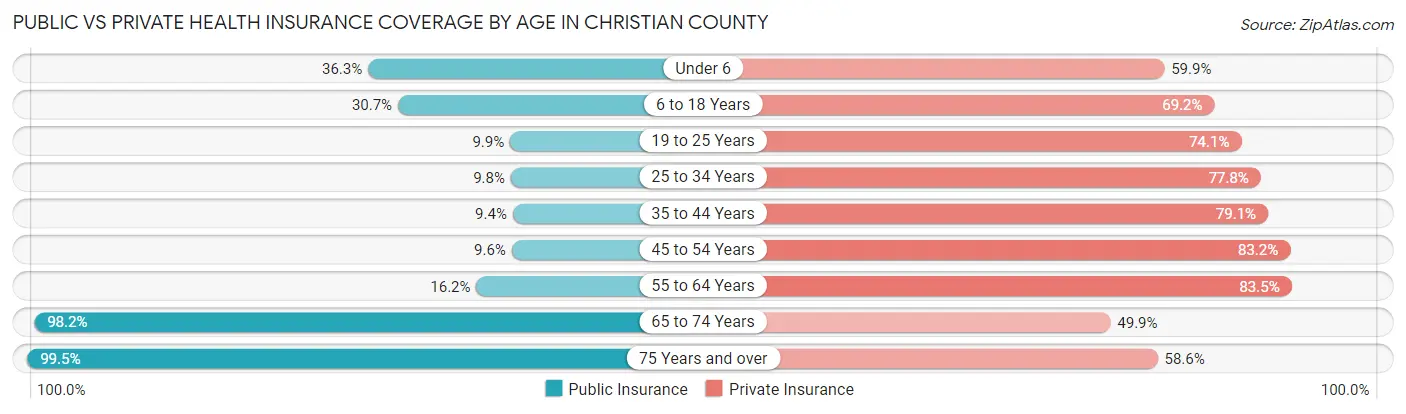
| Age Bracket | Public Insurance | Private Insurance |
| Under 6 | 2,376 (36.3%) | 3,922 (59.9%) |
| 6 to 18 Years | 5,206 (30.7%) | 11,726 (69.2%) |
| 19 to 25 Years | 635 (9.9%) | 4,758 (74.1%) |
| 25 to 34 Years | 1,003 (9.8%) | 7,993 (77.7%) |
| 35 to 44 Years | 1,151 (9.4%) | 9,699 (79.1%) |
| 45 to 54 Years | 1,066 (9.6%) | 9,250 (83.2%) |
| 55 to 64 Years | 1,821 (16.2%) | 9,413 (83.5%) |
| 65 to 74 Years | 8,454 (98.2%) | 4,291 (49.8%) |
| 75 Years and over | 5,527 (99.5%) | 3,256 (58.6%) |
| Total | 27,239 (30.6%) | 64,308 (72.2%) |
Disability Status by Sex by Age in Christian County
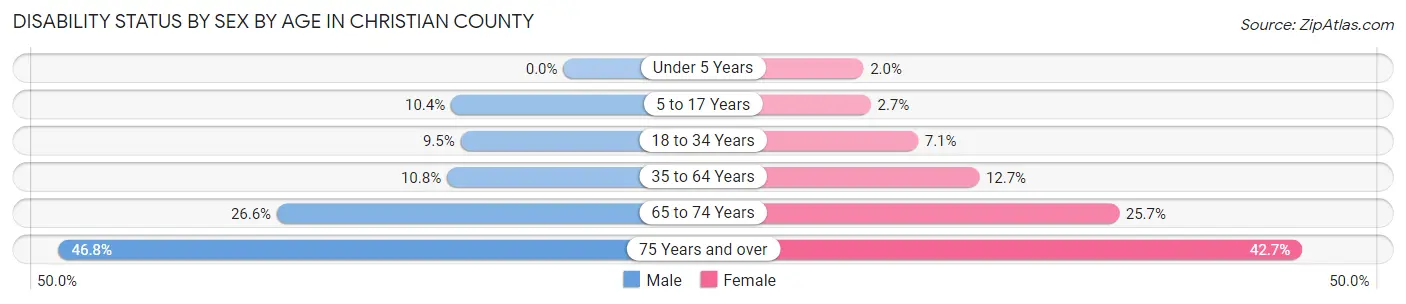
| Age Bracket | Male | Female |
| Under 5 Years | 0 (0.0%) | 56 (2.0%) |
| 5 to 17 Years | 918 (10.4%) | 220 (2.7%) |
| 18 to 34 Years | 833 (9.5%) | 633 (7.0%) |
| 35 to 64 Years | 1,845 (10.8%) | 2,239 (12.7%) |
| 65 to 74 Years | 1,074 (26.6%) | 1,174 (25.7%) |
| 75 Years and over | 1,127 (46.8%) | 1,345 (42.7%) |
Disability Class by Sex by Age in Christian County
Disability Class: Hearing Difficulty
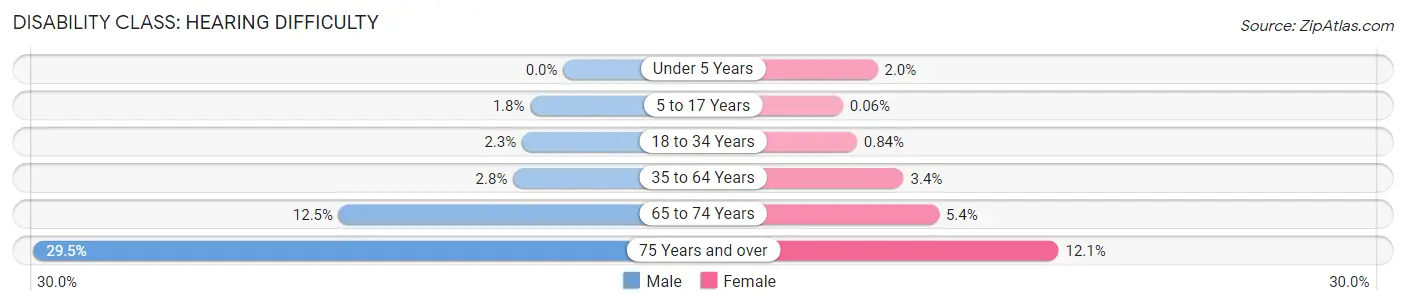
| Age Bracket | Male | Female |
| Under 5 Years | 0 (0.0%) | 56 (2.0%) |
| 5 to 17 Years | 162 (1.8%) | 5 (0.1%) |
| 18 to 34 Years | 201 (2.3%) | 75 (0.8%) |
| 35 to 64 Years | 476 (2.8%) | 605 (3.4%) |
| 65 to 74 Years | 505 (12.5%) | 247 (5.4%) |
| 75 Years and over | 710 (29.5%) | 380 (12.1%) |
Disability Class: Vision Difficulty
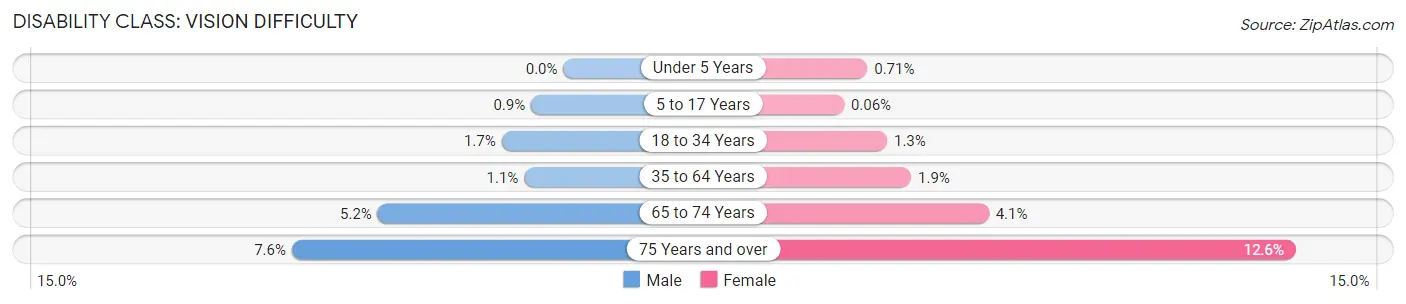
| Age Bracket | Male | Female |
| Under 5 Years | 0 (0.0%) | 20 (0.7%) |
| 5 to 17 Years | 79 (0.9%) | 5 (0.1%) |
| 18 to 34 Years | 150 (1.7%) | 113 (1.3%) |
| 35 to 64 Years | 187 (1.1%) | 339 (1.9%) |
| 65 to 74 Years | 209 (5.2%) | 187 (4.1%) |
| 75 Years and over | 182 (7.6%) | 398 (12.6%) |
Disability Class: Cognitive Difficulty
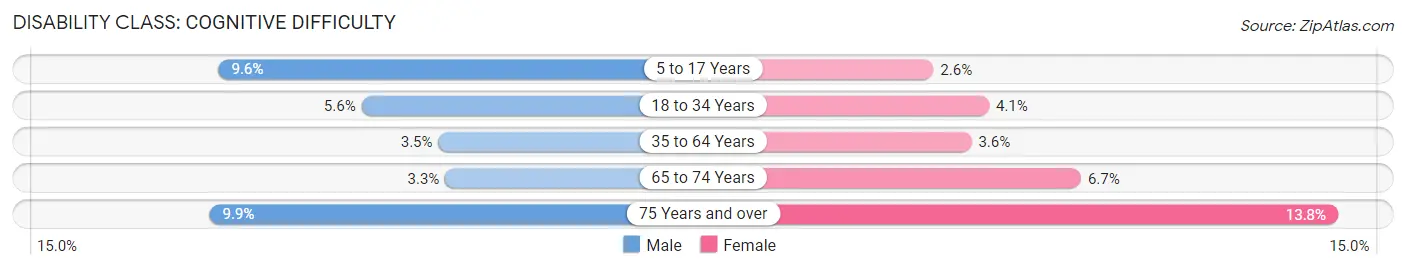
| Age Bracket | Male | Female |
| 5 to 17 Years | 846 (9.6%) | 210 (2.5%) |
| 18 to 34 Years | 491 (5.6%) | 368 (4.1%) |
| 35 to 64 Years | 594 (3.5%) | 635 (3.6%) |
| 65 to 74 Years | 133 (3.3%) | 304 (6.7%) |
| 75 Years and over | 237 (9.9%) | 435 (13.8%) |
Disability Class: Ambulatory Difficulty
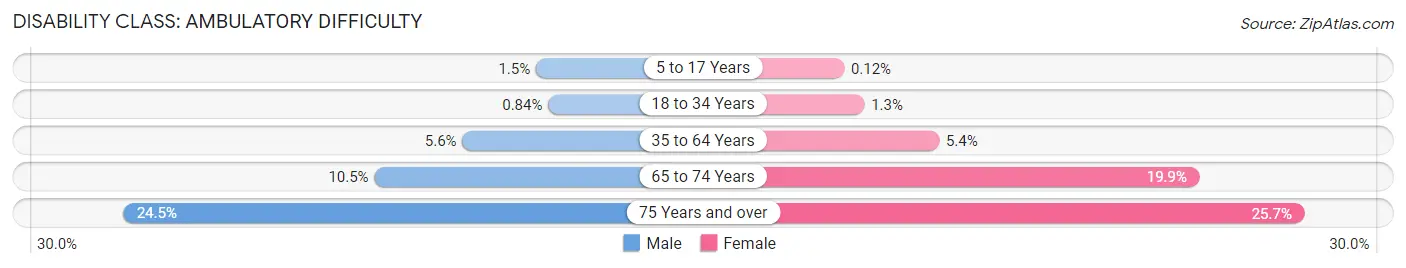
| Age Bracket | Male | Female |
| 5 to 17 Years | 134 (1.5%) | 10 (0.1%) |
| 18 to 34 Years | 73 (0.8%) | 112 (1.3%) |
| 35 to 64 Years | 959 (5.6%) | 952 (5.4%) |
| 65 to 74 Years | 425 (10.5%) | 908 (19.9%) |
| 75 Years and over | 589 (24.5%) | 810 (25.7%) |
Disability Class: Self-Care Difficulty
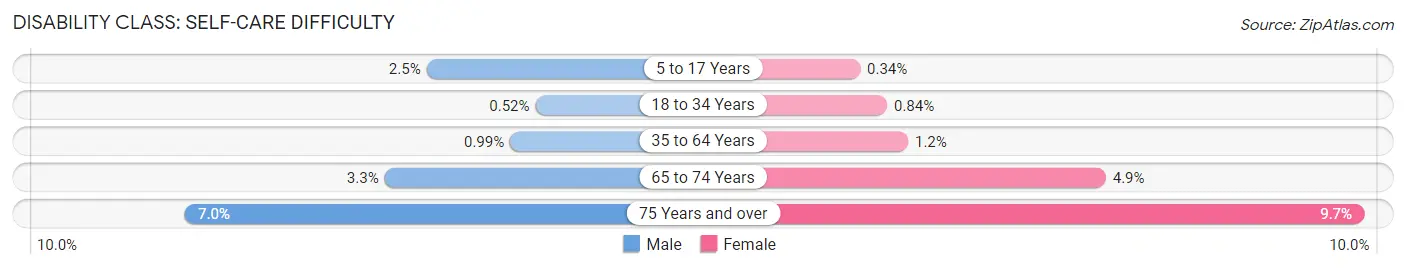
| Age Bracket | Male | Female |
| 5 to 17 Years | 224 (2.5%) | 28 (0.3%) |
| 18 to 34 Years | 45 (0.5%) | 75 (0.8%) |
| 35 to 64 Years | 169 (1.0%) | 216 (1.2%) |
| 65 to 74 Years | 134 (3.3%) | 224 (4.9%) |
| 75 Years and over | 169 (7.0%) | 305 (9.7%) |
Technology Access in Christian County
Computing Device Access in Christian County
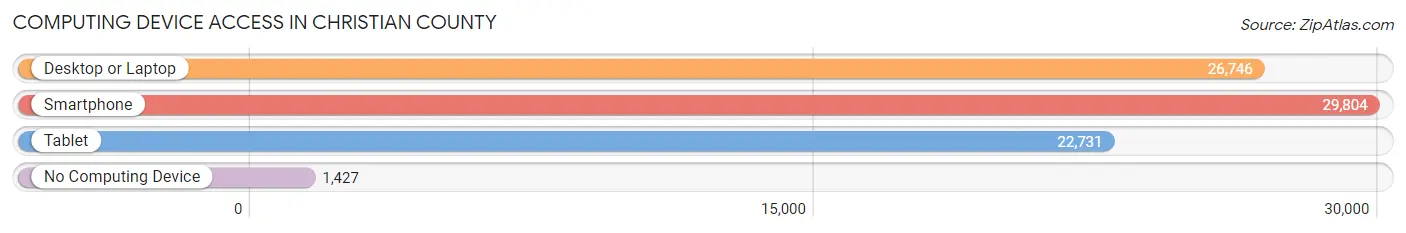
| Device Type | # Households | % Households |
| Desktop or Laptop | 26,746 | 80.0% |
| Smartphone | 29,804 | 89.2% |
| Tablet | 22,731 | 68.0% |
| No Computing Device | 1,427 | 4.3% |
| Total | 33,411 | 100.0% |
Internet Access in Christian County
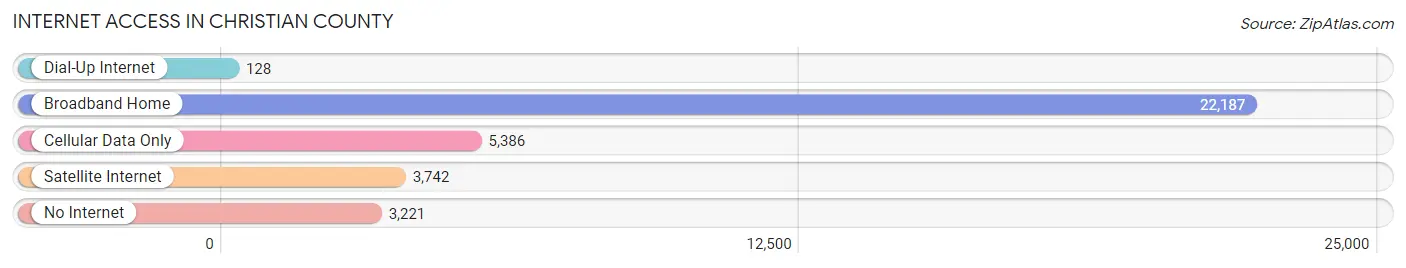
| Internet Type | # Households | % Households |
| Dial-Up Internet | 128 | 0.4% |
| Broadband Home | 22,187 | 66.4% |
| Cellular Data Only | 5,386 | 16.1% |
| Satellite Internet | 3,742 | 11.2% |
| No Internet | 3,221 | 9.6% |
| Total | 33,411 | 100.0% |
Christian County Summary
Christian County is located in the southwestern corner of Missouri, and is bordered by Taney, Greene, Webster, Douglas, and Stone counties. The county seat is Ozark, and the county was established in 1859. As of the 2010 census, the population was 77,422, making it the 16th most populous county in Missouri.
Geography
Christian County covers an area of 576 square miles, and is located in the Ozark Plateau region of Missouri. The county is mostly hilly and forested, with the highest point being the summit of Mount Zion, at 1,717 feet. The Finley River, James River, and Sac River all flow through the county.
Economy
Christian County’s economy is largely based on agriculture, with the main crops being corn, soybeans, wheat, and hay. The county is also home to several manufacturing companies, including Bass Pro Shops, which is headquartered in Springfield. Tourism is also an important part of the economy, with the county being home to several state parks, including Table Rock Lake State Park and Lake Taneycomo State Park.
Demographics
As of the 2010 census, the population of Christian County was 77,422, with a population density of 134 people per square mile. The racial makeup of the county was 92.3% White, 3.3% Black or African American, 0.5% Native American, 0.7% Asian, 0.1% Pacific Islander, 1.2% from other races, and 2.0% from two or more races. Hispanic or Latino of any race were 3.2% of the population.
The median income for a household in the county was $41,945, and the median income for a family was $50,945. The per capita income for the county was $21,845. About 11.2% of families and 14.7% of the population were below the poverty line, including 19.2% of those under age 18 and 9.2% of those age 65 or over.
Education
Christian County is served by the Ozark School District, which consists of seven elementary schools, two middle schools, and one high school. The county is also home to several private schools, including Ozark Christian School and Ozark Adventist Academy. The county is also home to several higher education institutions, including Missouri State University-West Plains, Ozarks Technical Community College, and Southwest Baptist University.
Conclusion
Christian County is a rural county located in the southwestern corner of Missouri. The county is largely agricultural, with the main crops being corn, soybeans, wheat, and hay. The county is also home to several manufacturing companies, and tourism is an important part of the economy. The population of the county is 77,422, and the median income for a household is $41,945. The county is served by the Ozark School District, and is home to several higher education institutions.
Common Questions
What is Per Capita Income in Christian County?
Per Capita income in Christian County is $35,587.
What is the Median Family Income in Christian County?
Median Family Income in Christian County is $87,975.
What is the Median Household income in Christian County?
Median Household Income in Christian County is $75,787.
What is Income or Wage Gap in Christian County?
Income or Wage Gap in Christian County is 31.1%.
Women in Christian County earn 68.9 cents for every dollar earned by a man.
What is Family Income Deficit in Christian County?
Family Income Deficit in Christian County is $11,543.
Families that are below poverty line in Christian County earn $11,543 less on average than the poverty threshold level.
What is Inequality or Gini Index in Christian County?
Inequality or Gini Index in Christian County is 0.42.
What is the Total Population of Christian County?
Total Population of Christian County is 89,568.
What is the Total Male Population of Christian County?
Total Male Population of Christian County is 43,917.
What is the Total Female Population of Christian County?
Total Female Population of Christian County is 45,651.
What is the Ratio of Males per 100 Females in Christian County?
There are 96.20 Males per 100 Females in Christian County.
What is the Ratio of Females per 100 Males in Christian County?
There are 103.95 Females per 100 Males in Christian County.
What is the Median Population Age in Christian County?
Median Population Age in Christian County is 39.1 Years.
What is the Average Family Size in Christian County
Average Family Size in Christian County is 3.1 People.
What is the Average Household Size in Christian County
Average Household Size in Christian County is 2.7 People.
How Large is the Labor Force in Christian County?
There are 45,552 People in the Labor Forcein in Christian County.
What is the Percentage of People in the Labor Force in Christian County?
65.4% of People are in the Labor Force in Christian County.
What is the Unemployment Rate in Christian County?
Unemployment Rate in Christian County is 3.6%.