Chariton County, MO Map & Demographics
Chariton County Map
Chariton County Overview
$28,616
PER CAPITA INCOME
$74,349
AVG FAMILY INCOME
$61,910
AVG HOUSEHOLD INCOME
23.4%
WAGE / INCOME GAP [ % ]
76.6¢/ $1
WAGE / INCOME GAP [ $ ]
$10,031
FAMILY INCOME DEFICIT
0.41
INEQUALITY / GINI INDEX
7,417
TOTAL POPULATION
3,706
MALE POPULATION
3,711
FEMALE POPULATION
99.87
MALES / 100 FEMALES
100.13
FEMALES / 100 MALES
45.7
MEDIAN AGE
3.5
AVG FAMILY SIZE
2.8
AVG HOUSEHOLD SIZE
3,345
LABOR FORCE [ PEOPLE ]
56.1%
PERCENT IN LABOR FORCE
4.3%
UNEMPLOYMENT RATE
Chariton County Area Codes
Income in Chariton County
Income Overview in Chariton County
Per Capita Income in Chariton County is $28,616, while median incomes of families and households are $74,349 and $61,910 respectively.
| Characteristic | Number | Measure |
| Per Capita Income | 7,417 | $28,616 |
| Median Family Income | 1,775 | $74,349 |
| Mean Family Income | 1,775 | $87,949 |
| Median Household Income | 2,591 | $61,910 |
| Mean Household Income | 2,591 | $73,277 |
| Income Deficit | 1,775 | $10,031 |
| Wage / Income Gap (%) | 7,417 | 23.43% |
| Wage / Income Gap ($) | 7,417 | 76.57¢ per $1 |
| Gini / Inequality Index | 7,417 | 0.41 |
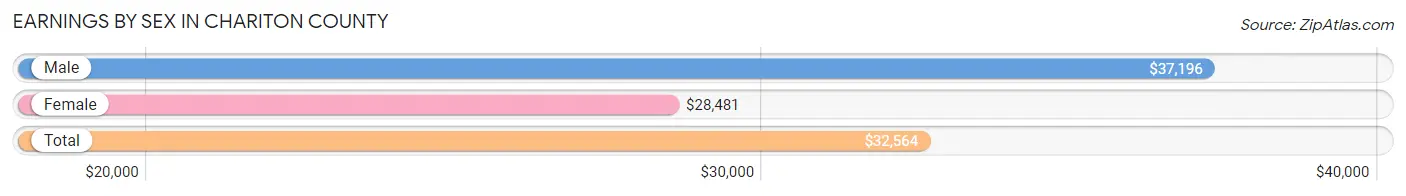
Earnings by Sex in Chariton County
Average Earnings in Chariton County are $32,564, $37,196 for men and $28,481 for women, a difference of 23.4%.
| Sex | Number | Average Earnings |
| Male | 1,839 (52.8%) | $37,196 |
| Female | 1,641 (47.2%) | $28,481 |
| Total | 3,480 (100.0%) | $32,564 |
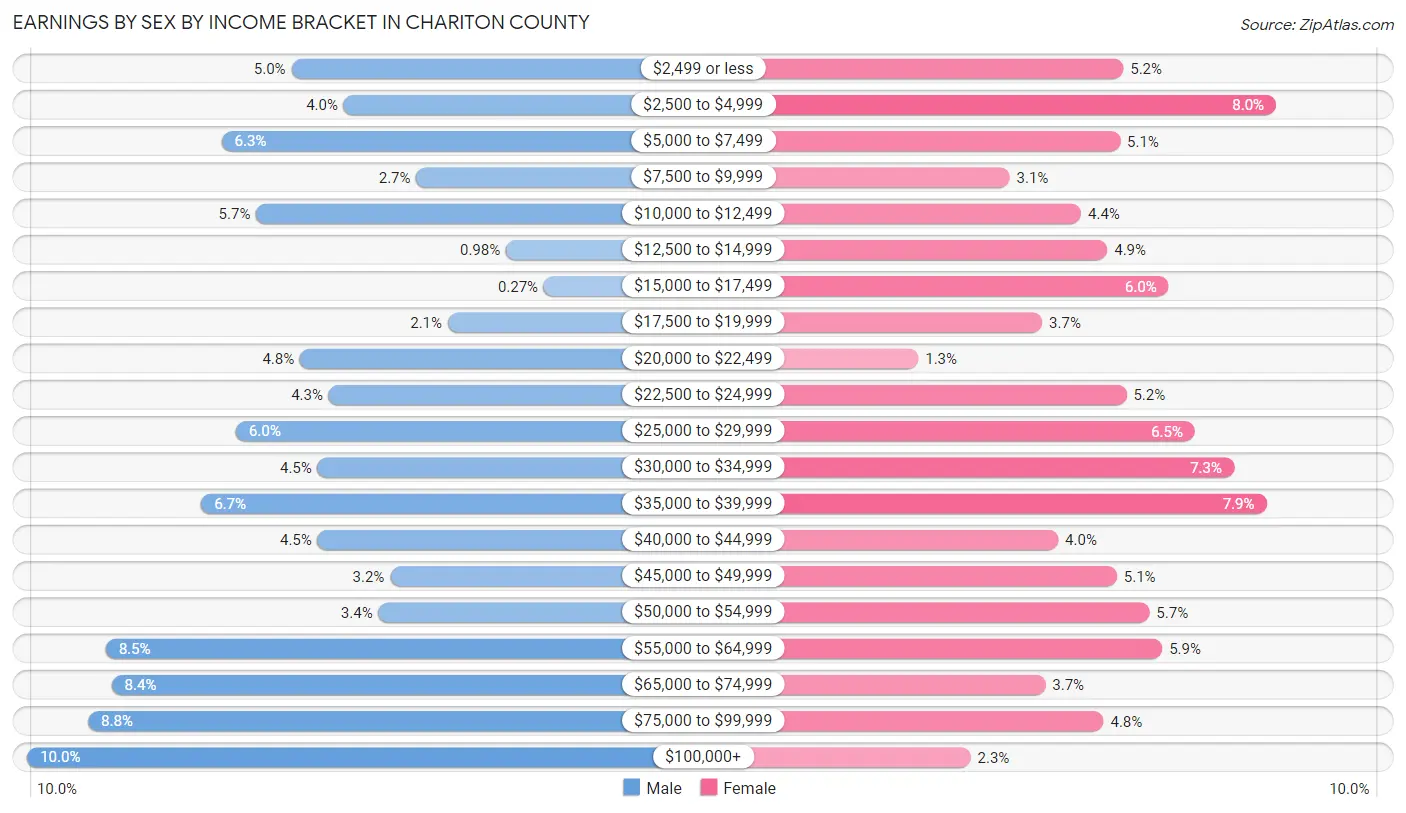
Earnings by Sex by Income Bracket in Chariton County
The most common earnings brackets in Chariton County are $100,000+ for men (183 | 10.0%) and $2,500 to $4,999 for women (132 | 8.0%).
| Income | Male | Female |
| $2,499 or less | 92 (5.0%) | 85 (5.2%) |
| $2,500 to $4,999 | 74 (4.0%) | 132 (8.0%) |
| $5,000 to $7,499 | 116 (6.3%) | 84 (5.1%) |
| $7,500 to $9,999 | 49 (2.7%) | 50 (3.0%) |
| $10,000 to $12,499 | 104 (5.7%) | 72 (4.4%) |
| $12,500 to $14,999 | 18 (1.0%) | 80 (4.9%) |
| $15,000 to $17,499 | 5 (0.3%) | 99 (6.0%) |
| $17,500 to $19,999 | 38 (2.1%) | 60 (3.7%) |
| $20,000 to $22,499 | 89 (4.8%) | 22 (1.3%) |
| $22,500 to $24,999 | 79 (4.3%) | 86 (5.2%) |
| $25,000 to $29,999 | 111 (6.0%) | 107 (6.5%) |
| $30,000 to $34,999 | 83 (4.5%) | 119 (7.2%) |
| $35,000 to $39,999 | 123 (6.7%) | 129 (7.9%) |
| $40,000 to $44,999 | 83 (4.5%) | 65 (4.0%) |
| $45,000 to $49,999 | 58 (3.2%) | 83 (5.1%) |
| $50,000 to $54,999 | 62 (3.4%) | 93 (5.7%) |
| $55,000 to $64,999 | 156 (8.5%) | 97 (5.9%) |
| $65,000 to $74,999 | 154 (8.4%) | 61 (3.7%) |
| $75,000 to $99,999 | 162 (8.8%) | 79 (4.8%) |
| $100,000+ | 183 (10.0%) | 38 (2.3%) |
| Total | 1,839 (100.0%) | 1,641 (100.0%) |
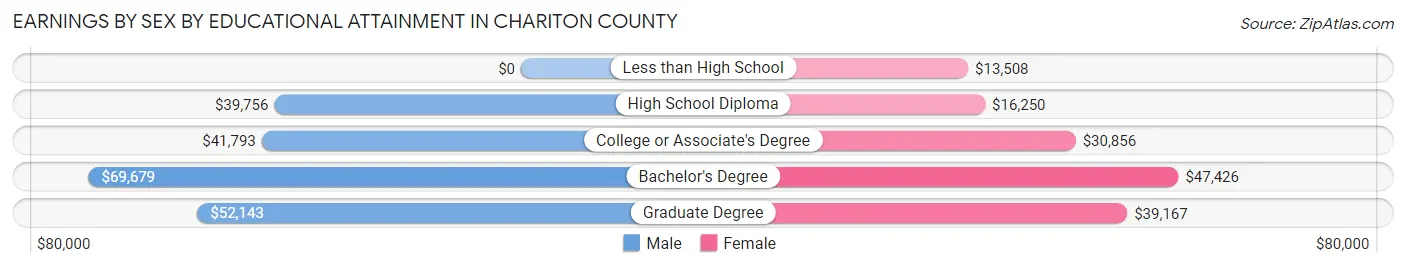
Earnings by Sex by Educational Attainment in Chariton County
Average earnings in Chariton County are $43,625 for men and $30,229 for women, a difference of 30.7%. Men with an educational attainment of bachelor's degree enjoy the highest average annual earnings of $69,679, while those with high school diploma education earn the least with $39,756. Women with an educational attainment of bachelor's degree earn the most with the average annual earnings of $47,426, while those with less than high school education have the smallest earnings of $13,508.
| Educational Attainment | Male Income | Female Income |
| Less than High School | - | - |
| High School Diploma | $39,756 | $16,250 |
| College or Associate's Degree | $41,793 | $30,856 |
| Bachelor's Degree | $69,679 | $47,426 |
| Graduate Degree | $52,143 | $39,167 |
| Total | $43,625 | $30,229 |
Family Income in Chariton County
Family Income Brackets in Chariton County
According to the Chariton County family income data, there are 414 families falling into the $50,000 to $74,999 income range, which is the most common income bracket and makes up 23.3% of all families. Conversely, the less than $10,000 income bracket is the least frequent group with only 44 families (2.5%) belonging to this category.
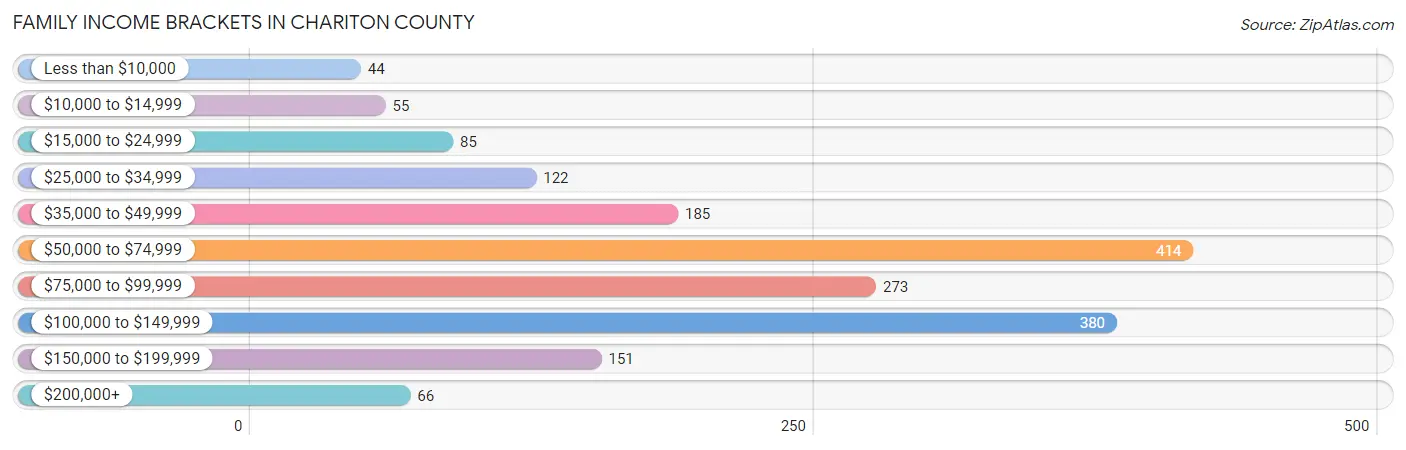
| Income Bracket | # Families | % Families |
| Less than $10,000 | 44 | 2.5% |
| $10,000 to $14,999 | 55 | 3.1% |
| $15,000 to $24,999 | 85 | 4.8% |
| $25,000 to $34,999 | 122 | 6.9% |
| $35,000 to $49,999 | 185 | 10.4% |
| $50,000 to $74,999 | 414 | 23.3% |
| $75,000 to $99,999 | 273 | 15.4% |
| $100,000 to $149,999 | 380 | 21.4% |
| $150,000 to $199,999 | 151 | 8.5% |
| $200,000+ | 66 | 3.7% |
Family Income by Famaliy Size in Chariton County
5-person families (98 | 5.5%) account for the highest median family income in Chariton County with $109,583 per family, while 2-person families (1,019 | 57.4%) have the highest median income of $32,886 per family member.
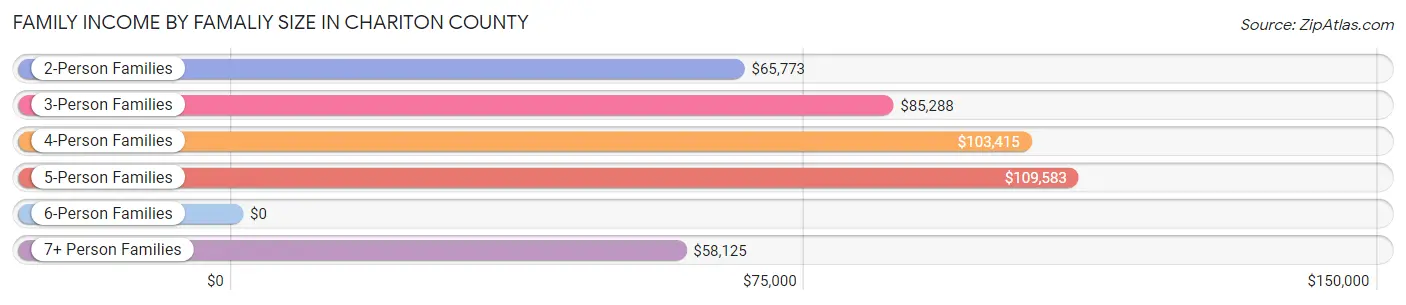
| Income Bracket | # Families | Median Income |
| 2-Person Families | 1,019 (57.4%) | $65,773 |
| 3-Person Families | 245 (13.8%) | $85,288 |
| 4-Person Families | 324 (18.2%) | $103,415 |
| 5-Person Families | 98 (5.5%) | $109,583 |
| 6-Person Families | 54 (3.0%) | $0 |
| 7+ Person Families | 35 (2.0%) | $58,125 |
| Total | 1,775 (100.0%) | $74,349 |
Family Income by Number of Earners in Chariton County
The median family income in Chariton County is $74,349, with families comprising 3+ earners (169) having the highest median family income of $104,650, while families with no earners (382) have the lowest median family income of $49,500, accounting for 9.5% and 21.5% of families, respectively.
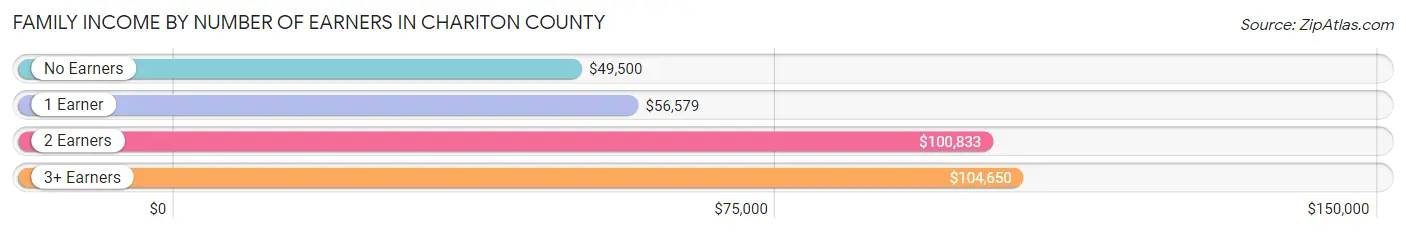
| Number of Earners | # Families | Median Income |
| No Earners | 382 (21.5%) | $49,500 |
| 1 Earner | 524 (29.5%) | $56,579 |
| 2 Earners | 700 (39.4%) | $100,833 |
| 3+ Earners | 169 (9.5%) | $104,650 |
| Total | 1,775 (100.0%) | $74,349 |
Household Income in Chariton County
Household Income Brackets in Chariton County
With 580 households falling in the category, the $50,000 to $74,999 income range is the most frequent in Chariton County, accounting for 22.4% of all households. In contrast, only 75 households (2.9%) fall into the $200,000+ income bracket, making it the least populous group.
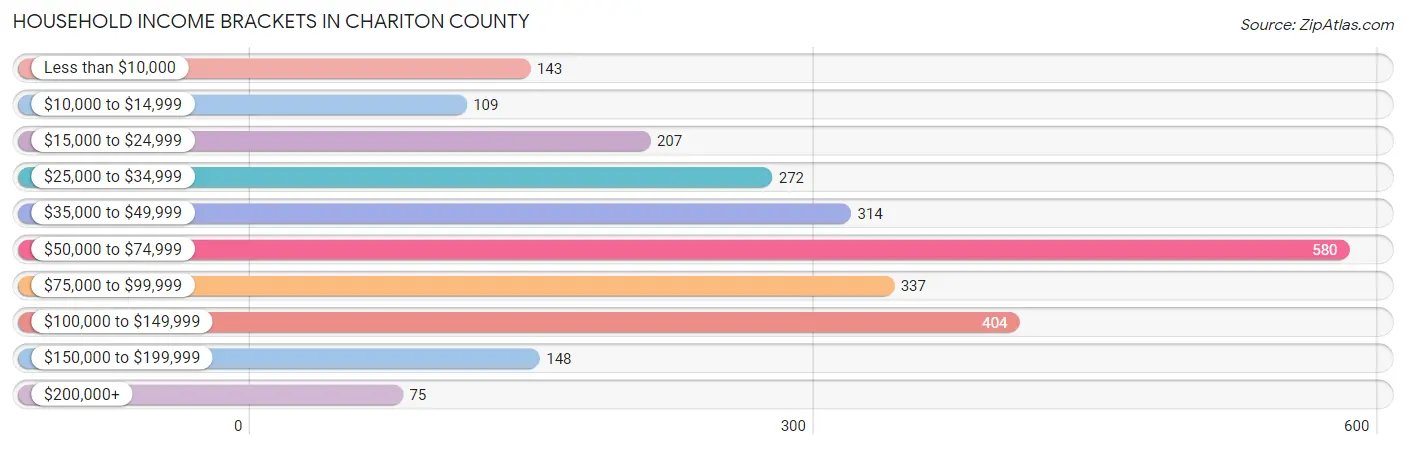
| Income Bracket | # Households | % Households |
| Less than $10,000 | 143 | 5.5% |
| $10,000 to $14,999 | 109 | 4.2% |
| $15,000 to $24,999 | 207 | 8.0% |
| $25,000 to $34,999 | 272 | 10.5% |
| $35,000 to $49,999 | 314 | 12.1% |
| $50,000 to $74,999 | 580 | 22.4% |
| $75,000 to $99,999 | 337 | 13.0% |
| $100,000 to $149,999 | 404 | 15.6% |
| $150,000 to $199,999 | 148 | 5.7% |
| $200,000+ | 75 | 2.9% |
Household Income by Householder Age in Chariton County
The median household income in Chariton County is $61,910, with the highest median household income of $78,690 found in the 25 to 44 years age bracket for the primary householder. A total of 624 households (24.1%) fall into this category. Meanwhile, the 15 to 24 years age bracket for the primary householder has the lowest median household income of $47,083, with 45 households (1.7%) in this group.
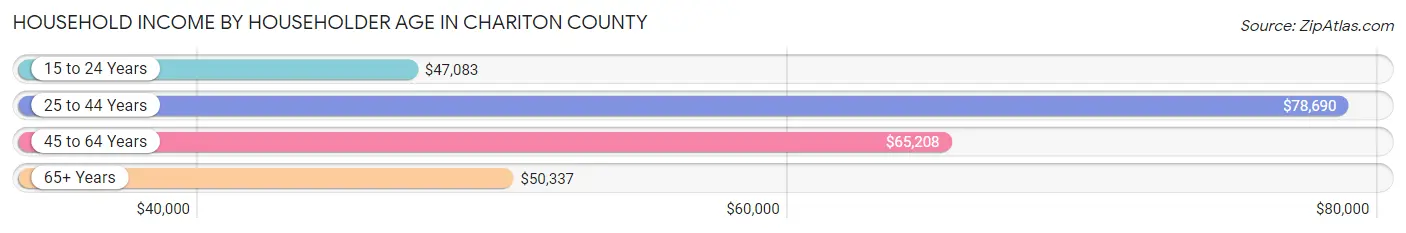
| Income Bracket | # Households | Median Income |
| 15 to 24 Years | 45 (1.7%) | $47,083 |
| 25 to 44 Years | 624 (24.1%) | $78,690 |
| 45 to 64 Years | 951 (36.7%) | $65,208 |
| 65+ Years | 971 (37.5%) | $50,337 |
| Total | 2,591 (100.0%) | $61,910 |
Poverty in Chariton County
Income Below Poverty by Sex and Age in Chariton County
With 13.1% poverty level for males and 13.5% for females among the residents of Chariton County, under 5 year old males and under 5 year old females are the most vulnerable to poverty, with 108 males (45.6%) and 76 females (39.0%) in their respective age groups living below the poverty level.
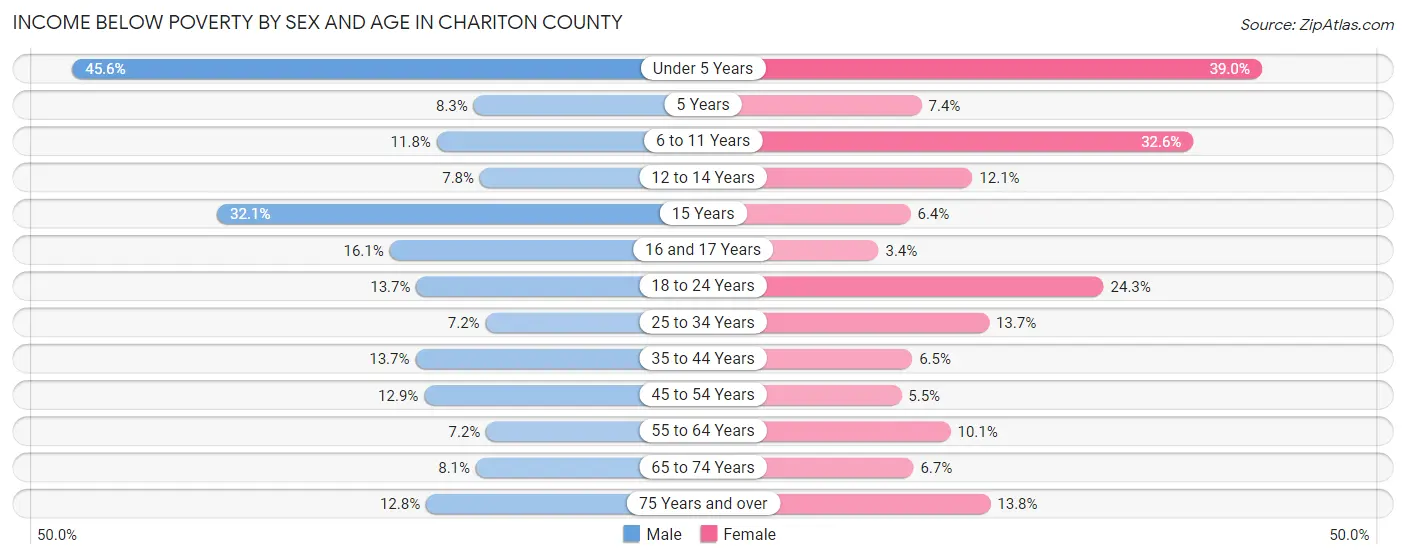
| Age Bracket | Male | Female |
| Under 5 Years | 108 (45.6%) | 76 (39.0%) |
| 5 Years | 3 (8.3%) | 4 (7.4%) |
| 6 to 11 Years | 38 (11.8%) | 75 (32.6%) |
| 12 to 14 Years | 10 (7.7%) | 20 (12.1%) |
| 15 Years | 9 (32.1%) | 3 (6.4%) |
| 16 and 17 Years | 20 (16.1%) | 3 (3.4%) |
| 18 to 24 Years | 37 (13.7%) | 61 (24.3%) |
| 25 to 34 Years | 25 (7.2%) | 47 (13.7%) |
| 35 to 44 Years | 50 (13.7%) | 24 (6.5%) |
| 45 to 54 Years | 50 (12.9%) | 21 (5.5%) |
| 55 to 64 Years | 38 (7.2%) | 54 (10.1%) |
| 65 to 74 Years | 39 (8.1%) | 30 (6.7%) |
| 75 Years and over | 44 (12.8%) | 64 (13.8%) |
| Total | 471 (13.1%) | 482 (13.5%) |
Income Above Poverty by Sex and Age in Chariton County
According to the poverty statistics in Chariton County, males aged 55 to 64 years and females aged 16 and 17 years are the age groups that are most secure financially, with 92.8% of males and 96.6% of females in these age groups living above the poverty line.
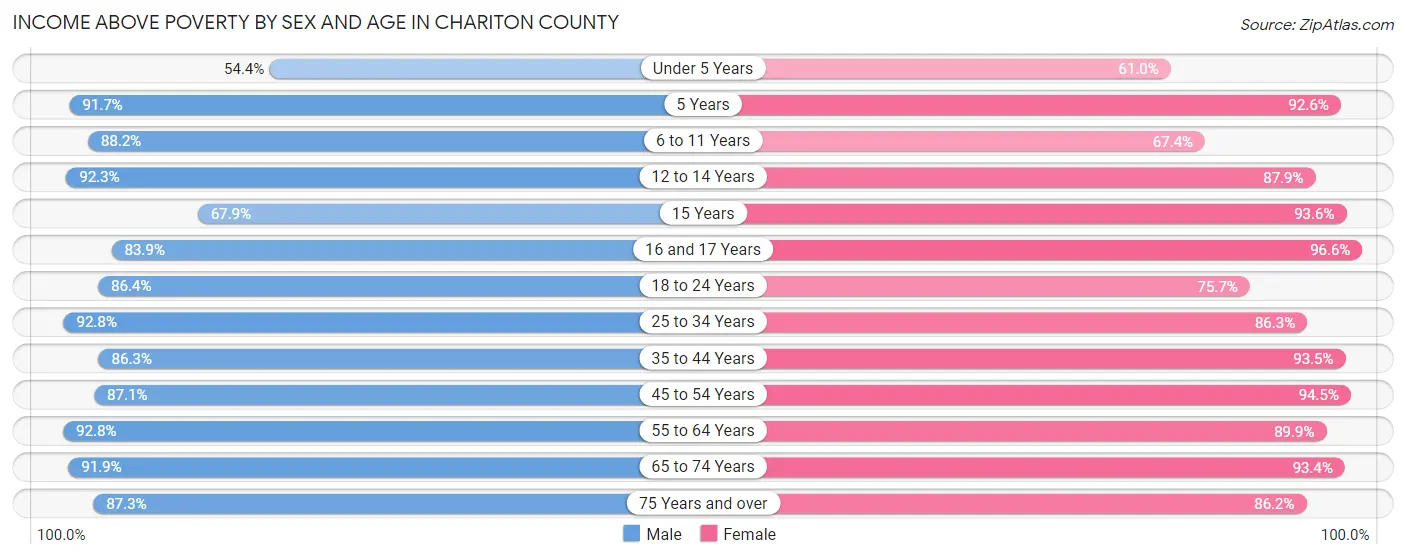
| Age Bracket | Male | Female |
| Under 5 Years | 129 (54.4%) | 119 (61.0%) |
| 5 Years | 33 (91.7%) | 50 (92.6%) |
| 6 to 11 Years | 285 (88.2%) | 155 (67.4%) |
| 12 to 14 Years | 119 (92.2%) | 145 (87.9%) |
| 15 Years | 19 (67.9%) | 44 (93.6%) |
| 16 and 17 Years | 104 (83.9%) | 85 (96.6%) |
| 18 to 24 Years | 234 (86.4%) | 190 (75.7%) |
| 25 to 34 Years | 321 (92.8%) | 297 (86.3%) |
| 35 to 44 Years | 314 (86.3%) | 343 (93.5%) |
| 45 to 54 Years | 337 (87.1%) | 359 (94.5%) |
| 55 to 64 Years | 493 (92.8%) | 481 (89.9%) |
| 65 to 74 Years | 441 (91.9%) | 421 (93.3%) |
| 75 Years and over | 301 (87.3%) | 400 (86.2%) |
| Total | 3,130 (86.9%) | 3,089 (86.5%) |
Income Below Poverty Among Married-Couple Families in Chariton County
The poverty statistics for married-couple families in Chariton County show that 5.1% or 78 of the total 1,525 families live below the poverty line. Families with 5 or more children have the highest poverty rate of 38.1%, comprising of 8 families. On the other hand, families with no children have the lowest poverty rate of 3.5%, which includes 36 families.
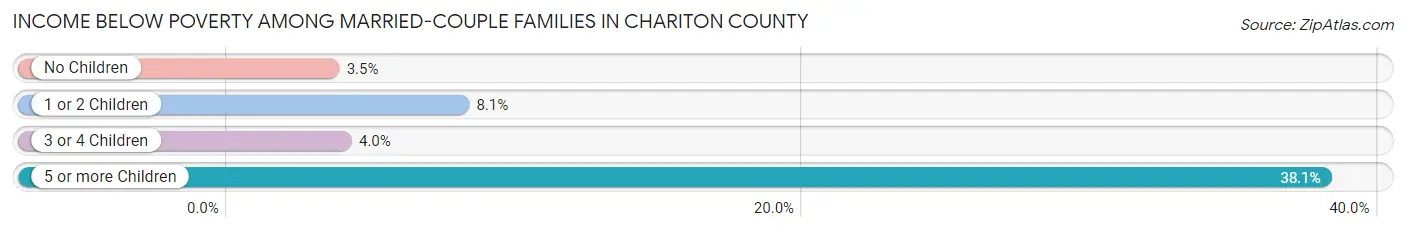
| Children | Above Poverty | Below Poverty |
| No Children | 982 (96.5%) | 36 (3.5%) |
| 1 or 2 Children | 331 (91.9%) | 29 (8.1%) |
| 3 or 4 Children | 121 (96.0%) | 5 (4.0%) |
| 5 or more Children | 13 (61.9%) | 8 (38.1%) |
| Total | 1,447 (94.9%) | 78 (5.1%) |
Income Below Poverty Among Single-Parent Households in Chariton County
According to the poverty data in Chariton County, 25.8% or 25 single-father households and 36.6% or 56 single-mother households are living below the poverty line. Among single-father households, those with 3 or 4 children have the highest poverty rate, with 10 households (71.4%) experiencing poverty. Likewise, among single-mother households, those with 3 or 4 children have the highest poverty rate, with 21 households (58.3%) falling below the poverty line.
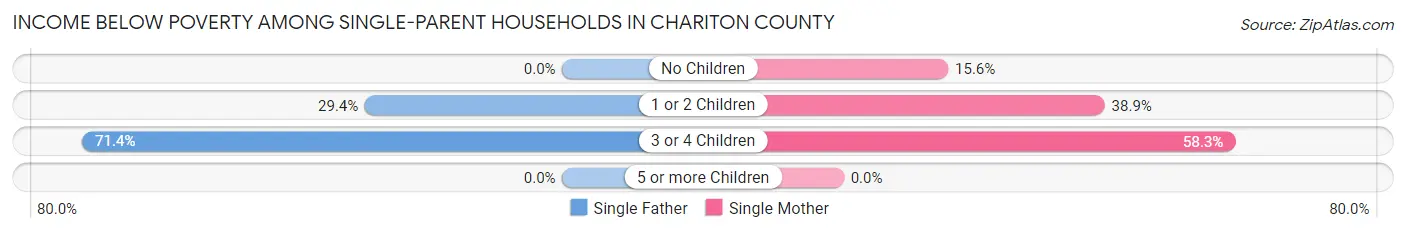
| Children | Single Father | Single Mother |
| No Children | 0 (0.0%) | 7 (15.6%) |
| 1 or 2 Children | 15 (29.4%) | 28 (38.9%) |
| 3 or 4 Children | 10 (71.4%) | 21 (58.3%) |
| 5 or more Children | 0 (0.0%) | 0 (0.0%) |
| Total | 25 (25.8%) | 56 (36.6%) |
Income Below Poverty Among Married-Couple vs Single-Parent Households in Chariton County
The poverty data for Chariton County shows that 78 of the married-couple family households (5.1%) and 81 of the single-parent households (32.4%) are living below the poverty level. Within the married-couple family households, those with 5 or more children have the highest poverty rate, with 8 households (38.1%) falling below the poverty line. Among the single-parent households, those with 3 or 4 children have the highest poverty rate, with 31 household (62.0%) living below poverty.
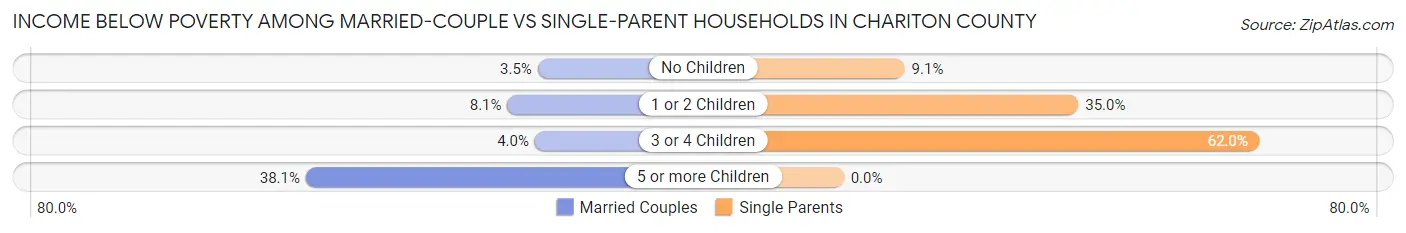
| Children | Married-Couple Families | Single-Parent Households |
| No Children | 36 (3.5%) | 7 (9.1%) |
| 1 or 2 Children | 29 (8.1%) | 43 (35.0%) |
| 3 or 4 Children | 5 (4.0%) | 31 (62.0%) |
| 5 or more Children | 8 (38.1%) | 0 (0.0%) |
| Total | 78 (5.1%) | 81 (32.4%) |
Race in Chariton County
The most populous races in Chariton County are White / Caucasian (6,981 | 94.1%), Black / African American (200 | 2.7%), and Two or more Races (152 | 2.1%).
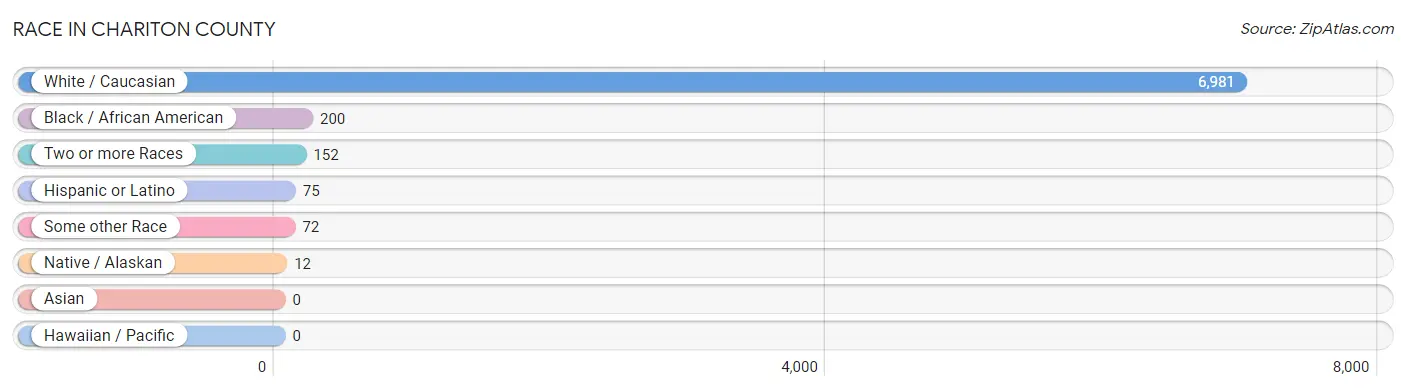
| Race | # Population | % Population |
| Asian | 0 | 0.0% |
| Black / African American | 200 | 2.7% |
| Hawaiian / Pacific | 0 | 0.0% |
| Hispanic or Latino | 75 | 1.0% |
| Native / Alaskan | 12 | 0.2% |
| White / Caucasian | 6,981 | 94.1% |
| Two or more Races | 152 | 2.1% |
| Some other Race | 72 | 1.0% |
| Total | 7,417 | 100.0% |
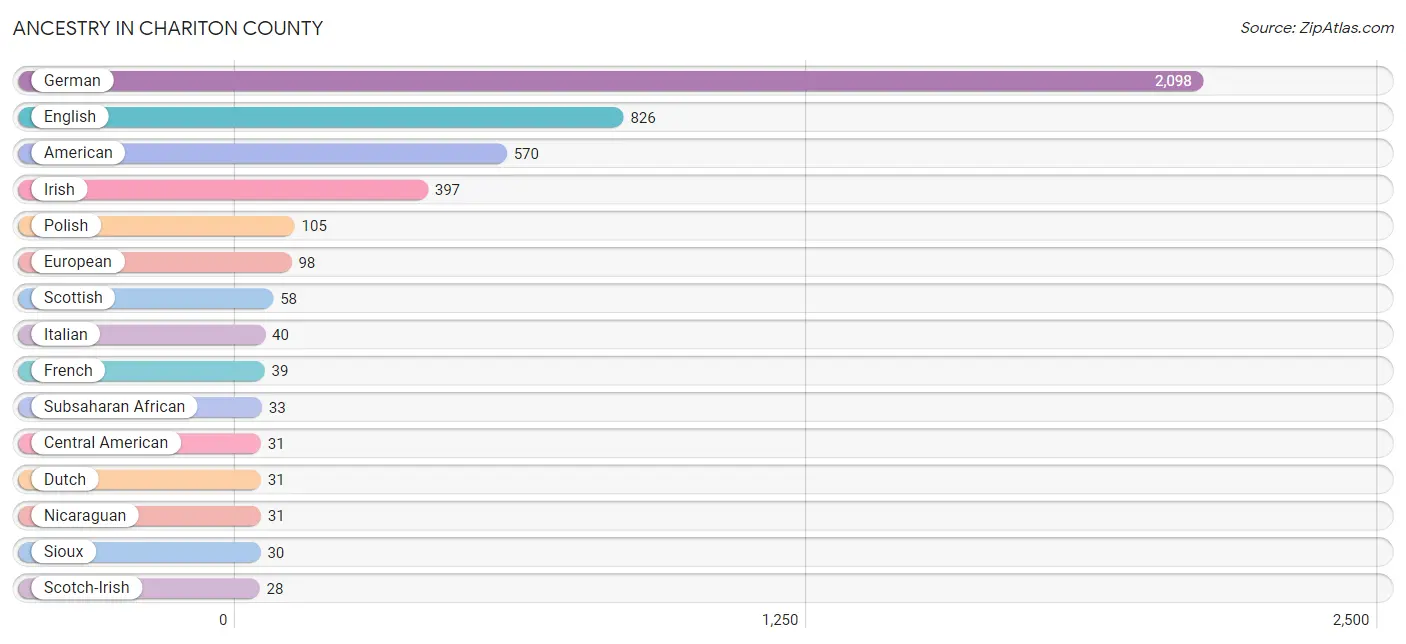
Ancestry in Chariton County
The most populous ancestries reported in Chariton County are German (2,098 | 28.3%), English (826 | 11.1%), American (570 | 7.7%), Irish (397 | 5.3%), and Polish (105 | 1.4%), together accounting for 53.9% of all Chariton County residents.
| Ancestry | # Population | % Population |
| African | 4 | 0.1% |
| American | 570 | 7.7% |
| Austrian | 8 | 0.1% |
| Blackfeet | 2 | 0.0% |
| British | 19 | 0.3% |
| Celtic | 1 | 0.0% |
| Central American | 31 | 0.4% |
| Cherokee | 9 | 0.1% |
| Cheyenne | 6 | 0.1% |
| Choctaw | 3 | 0.0% |
| Colombian | 7 | 0.1% |
| Czech | 20 | 0.3% |
| Danish | 4 | 0.1% |
| Dutch | 31 | 0.4% |
| Eastern European | 2 | 0.0% |
| English | 826 | 11.1% |
| European | 98 | 1.3% |
| Finnish | 4 | 0.1% |
| French | 39 | 0.5% |
| French American Indian | 1 | 0.0% |
| French Canadian | 10 | 0.1% |
| German | 2,098 | 28.3% |
| Hungarian | 5 | 0.1% |
| Irish | 397 | 5.3% |
| Italian | 40 | 0.5% |
| Mexican | 16 | 0.2% |
| New Zealander | 1 | 0.0% |
| Nicaraguan | 31 | 0.4% |
| Northern European | 11 | 0.2% |
| Norwegian | 15 | 0.2% |
| Peruvian | 11 | 0.2% |
| Polish | 105 | 1.4% |
| Russian | 11 | 0.2% |
| Scandinavian | 15 | 0.2% |
| Scotch-Irish | 28 | 0.4% |
| Scottish | 58 | 0.8% |
| Sioux | 30 | 0.4% |
| Slovak | 5 | 0.1% |
| South American | 18 | 0.2% |
| Subsaharan African | 33 | 0.4% |
| Swedish | 23 | 0.3% |
| Swiss | 13 | 0.2% |
| Ugandan | 5 | 0.1% |
| Ukrainian | 7 | 0.1% |
| Welsh | 24 | 0.3% | View All 45 Rows |
Immigrants in Chariton County
The most numerous immigrant groups reported in Chariton County came from Latin America (54 | 0.7%), Central America (31 | 0.4%), Nicaragua (31 | 0.4%), Africa (24 | 0.3%), and Eastern Africa (24 | 0.3%), together accounting for 2.2% of all Chariton County residents.
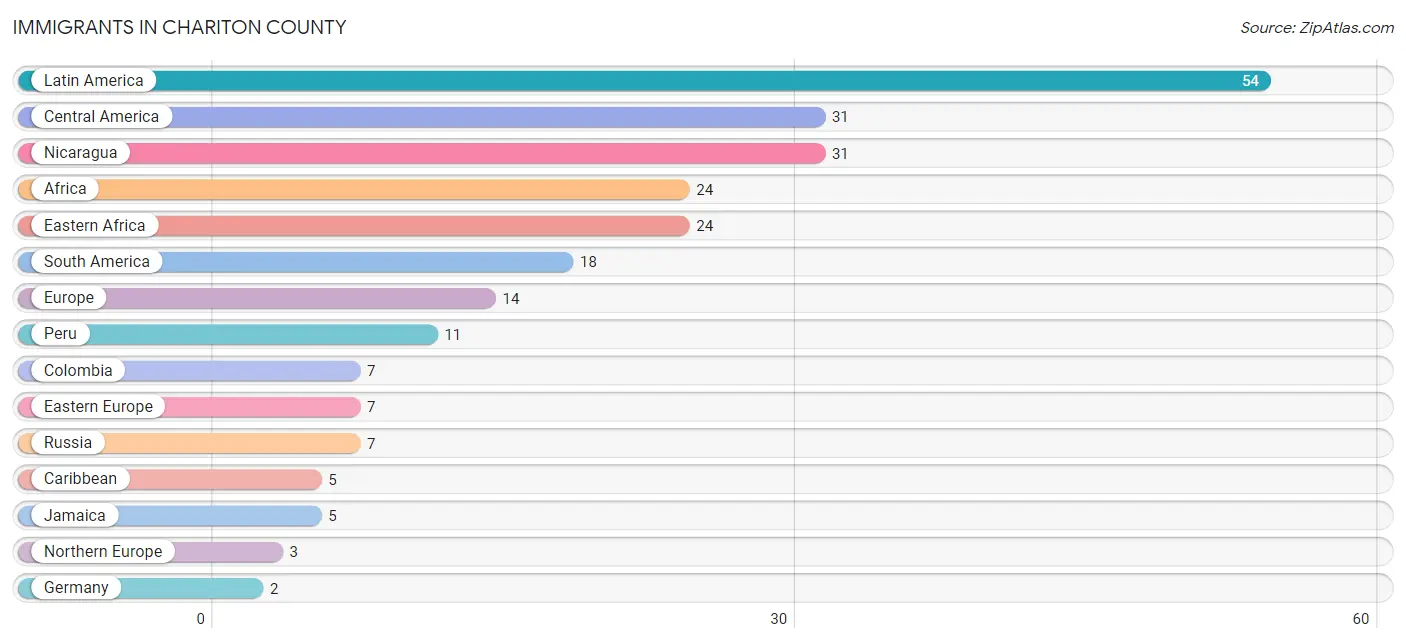
| Immigration Origin | # Population | % Population |
| Africa | 24 | 0.3% |
| Caribbean | 5 | 0.1% |
| Central America | 31 | 0.4% |
| Colombia | 7 | 0.1% |
| Eastern Africa | 24 | 0.3% |
| Eastern Europe | 7 | 0.1% |
| Europe | 14 | 0.2% |
| Germany | 2 | 0.0% |
| Italy | 2 | 0.0% |
| Jamaica | 5 | 0.1% |
| Latin America | 54 | 0.7% |
| Nicaragua | 31 | 0.4% |
| Northern Europe | 3 | 0.0% |
| Peru | 11 | 0.2% |
| Russia | 7 | 0.1% |
| South America | 18 | 0.2% |
| Southern Europe | 2 | 0.0% |
| Western Europe | 2 | 0.0% | View All 18 Rows |
Sex and Age in Chariton County
Sex and Age in Chariton County
The most populous age groups in Chariton County are 55 to 59 Years (315 | 8.5%) for men and 60 to 64 Years (324 | 8.7%) for women.
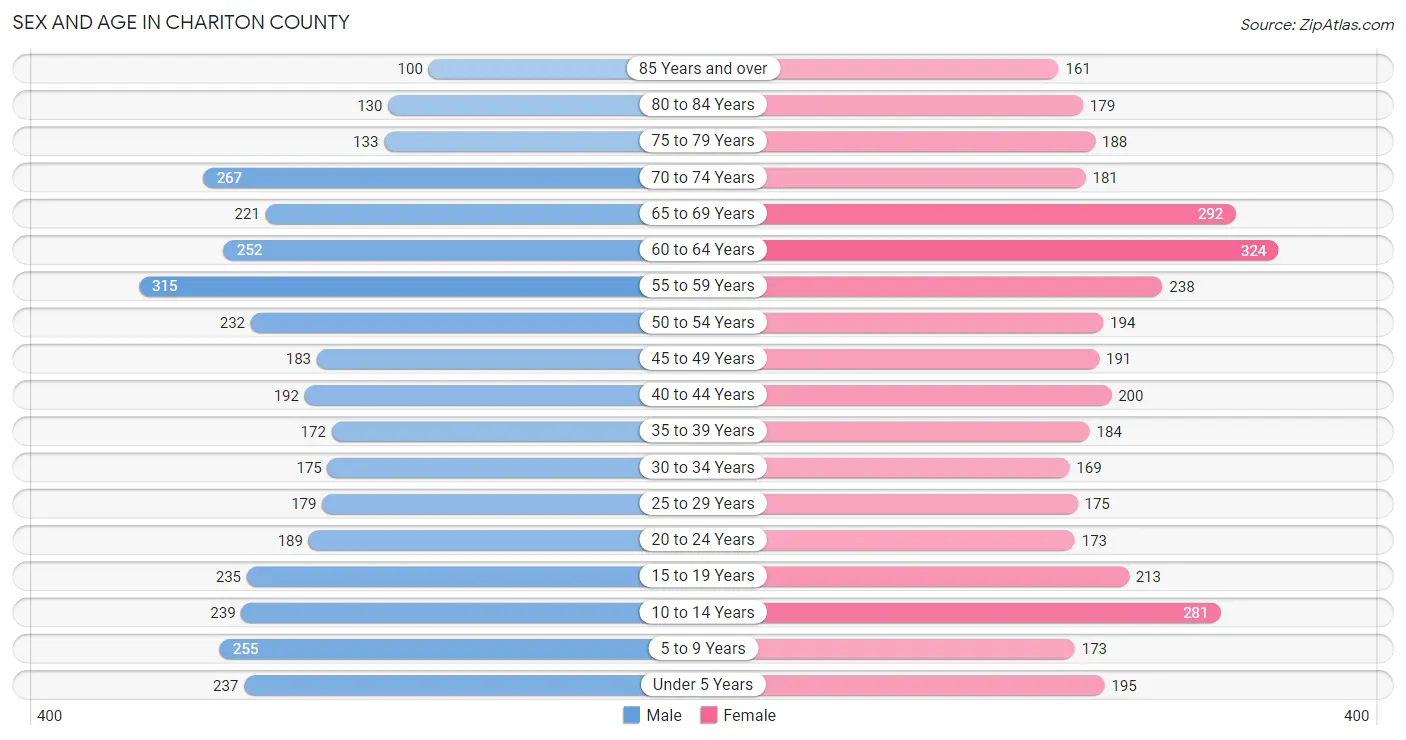
| Age Bracket | Male | Female |
| Under 5 Years | 237 (6.4%) | 195 (5.2%) |
| 5 to 9 Years | 255 (6.9%) | 173 (4.7%) |
| 10 to 14 Years | 239 (6.5%) | 281 (7.6%) |
| 15 to 19 Years | 235 (6.3%) | 213 (5.7%) |
| 20 to 24 Years | 189 (5.1%) | 173 (4.7%) |
| 25 to 29 Years | 179 (4.8%) | 175 (4.7%) |
| 30 to 34 Years | 175 (4.7%) | 169 (4.5%) |
| 35 to 39 Years | 172 (4.6%) | 184 (5.0%) |
| 40 to 44 Years | 192 (5.2%) | 200 (5.4%) |
| 45 to 49 Years | 183 (4.9%) | 191 (5.1%) |
| 50 to 54 Years | 232 (6.3%) | 194 (5.2%) |
| 55 to 59 Years | 315 (8.5%) | 238 (6.4%) |
| 60 to 64 Years | 252 (6.8%) | 324 (8.7%) |
| 65 to 69 Years | 221 (6.0%) | 292 (7.9%) |
| 70 to 74 Years | 267 (7.2%) | 181 (4.9%) |
| 75 to 79 Years | 133 (3.6%) | 188 (5.1%) |
| 80 to 84 Years | 130 (3.5%) | 179 (4.8%) |
| 85 Years and over | 100 (2.7%) | 161 (4.3%) |
| Total | 3,706 (100.0%) | 3,711 (100.0%) |
Families and Households in Chariton County
Median Family Size in Chariton County
The median family size in Chariton County is 3.49 persons per family, with single female/mother families (153 | 8.6%) accounting for the largest median family size of 4.94 persons per family. On the other hand, married-couple families (1,525 | 85.9%) represent the smallest median family size with 3.35 persons per family.
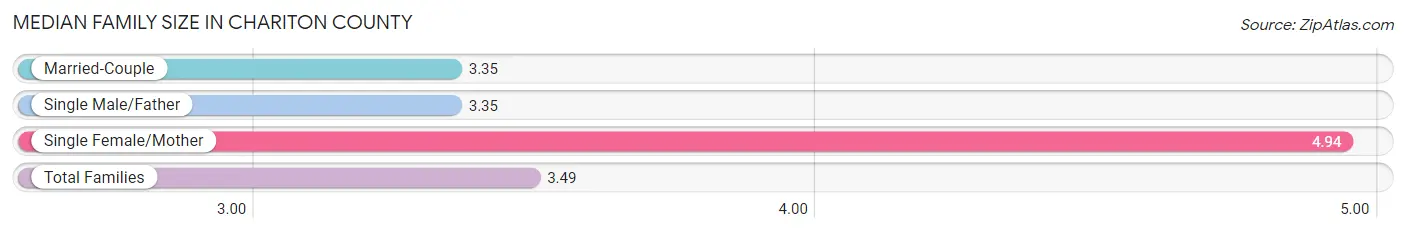
| Family Type | # Families | Family Size |
| Married-Couple | 1,525 (85.9%) | 3.35 |
| Single Male/Father | 97 (5.5%) | 3.35 |
| Single Female/Mother | 153 (8.6%) | 4.94 |
| Total Families | 1,775 (100.0%) | 3.49 |
Median Household Size in Chariton County
The median household size in Chariton County is 2.77 persons per household, with single female/mother households (153 | 5.9%) accounting for the largest median household size of 5.19 persons per household. non-family households (816 | 31.5%) represent the smallest median household size with 1.11 persons per household.
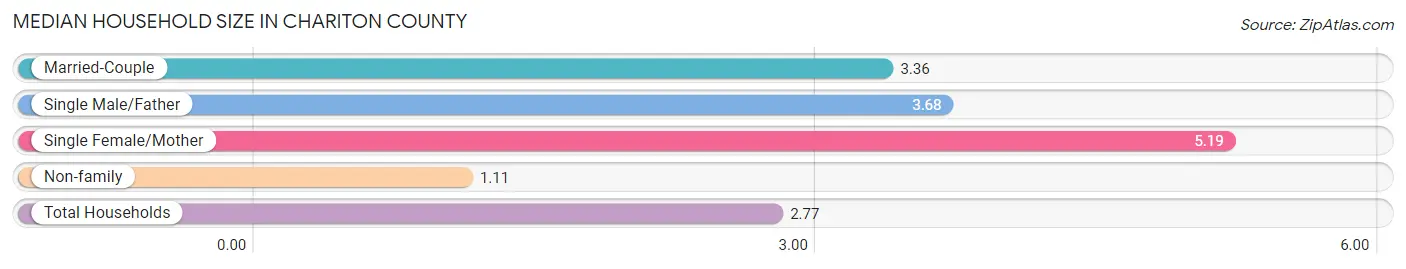
| Household Type | # Households | Household Size |
| Married-Couple | 1,525 (58.9%) | 3.36 |
| Single Male/Father | 97 (3.7%) | 3.68 |
| Single Female/Mother | 153 (5.9%) | 5.19 |
| Non-family | 816 (31.5%) | 1.11 |
| Total Households | 2,591 (100.0%) | 2.77 |
Household Size by Marriage Status in Chariton County
Out of a total of 2,591 households in Chariton County, 1,775 (68.5%) are family households, while 816 (31.5%) are nonfamily households. The most numerous type of family households are 2-person households, comprising 994, and the most common type of nonfamily households are 1-person households, comprising 741.
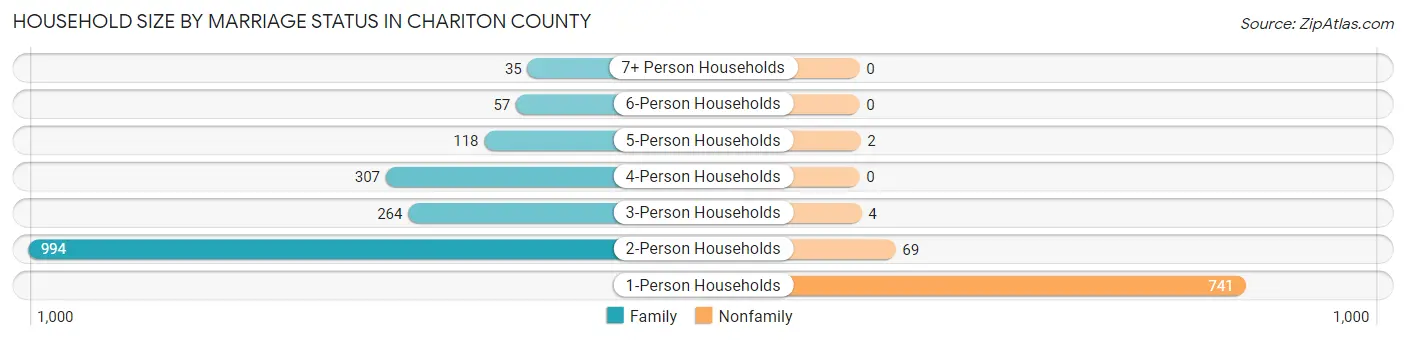
| Household Size | Family Households | Nonfamily Households |
| 1-Person Households | - | 741 (28.6%) |
| 2-Person Households | 994 (38.4%) | 69 (2.7%) |
| 3-Person Households | 264 (10.2%) | 4 (0.2%) |
| 4-Person Households | 307 (11.8%) | 0 (0.0%) |
| 5-Person Households | 118 (4.5%) | 2 (0.1%) |
| 6-Person Households | 57 (2.2%) | 0 (0.0%) |
| 7+ Person Households | 35 (1.3%) | 0 (0.0%) |
| Total | 1,775 (68.5%) | 816 (31.5%) |
Female Fertility in Chariton County
Fertility by Age in Chariton County
Average fertility rate in Chariton County is 66.0 births per 1,000 women. Women in the age bracket of 20 to 34 years have the highest fertility rate with 162.0 births per 1,000 women. Women in the age bracket of 20 to 34 years acount for 95.5% of all women with births.
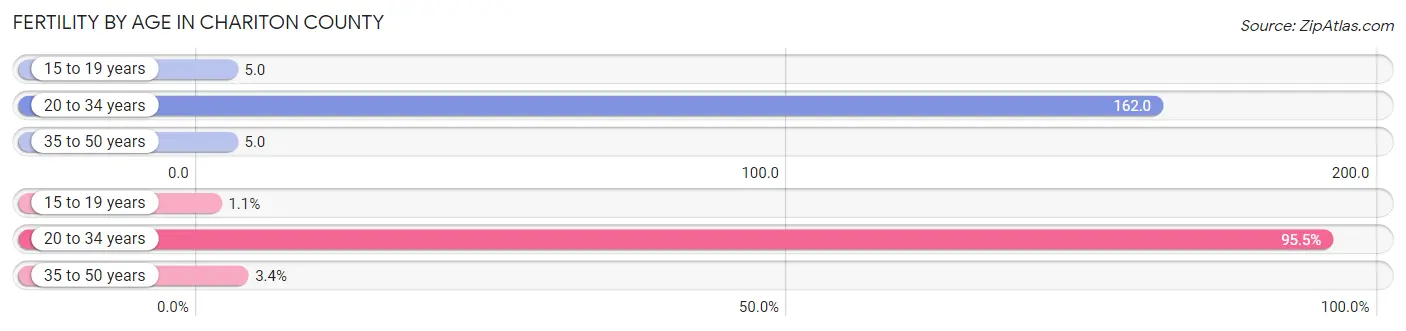
| Age Bracket | Women with Births | Births / 1,000 Women |
| 15 to 19 years | 1 (1.1%) | 5.0 |
| 20 to 34 years | 84 (95.5%) | 162.0 |
| 35 to 50 years | 3 (3.4%) | 5.0 |
| Total | 88 (100.0%) | 66.0 |
Fertility by Age by Marriage Status in Chariton County
65.9% of women with births (88) in Chariton County are married. The highest percentage of unmarried women with births falls into 15 to 19 years age bracket with 100.0% of them unmarried at the time of birth, while the lowest percentage of unmarried women with births belong to 35 to 50 years age bracket with 0.0% of them unmarried.
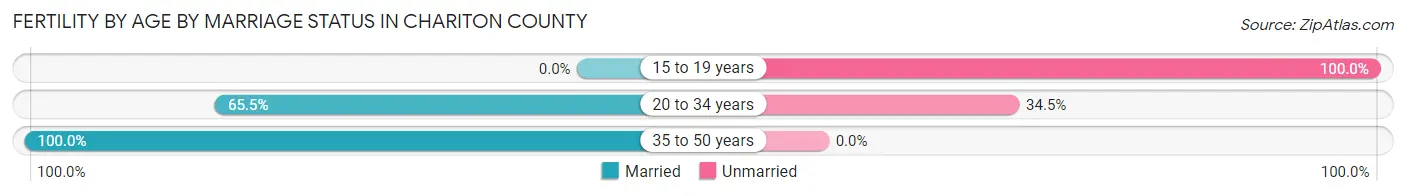
| Age Bracket | Married | Unmarried |
| 15 to 19 years | 0 (0.0%) | 1 (100.0%) |
| 20 to 34 years | 55 (65.5%) | 29 (34.5%) |
| 35 to 50 years | 3 (100.0%) | 0 (0.0%) |
| Total | 58 (65.9%) | 30 (34.1%) |
Fertility by Education in Chariton County
Average fertility rate in Chariton County is 66.0 births per 1,000 women. Women with the education attainment of college or associate's degree have the highest fertility rate of 111.0 births per 1,000 women, while women with the education attainment of less than high school have the lowest fertility at 11.0 births per 1,000 women. Women with the education attainment of college or associate's degree represent 53.4% of all women with births.
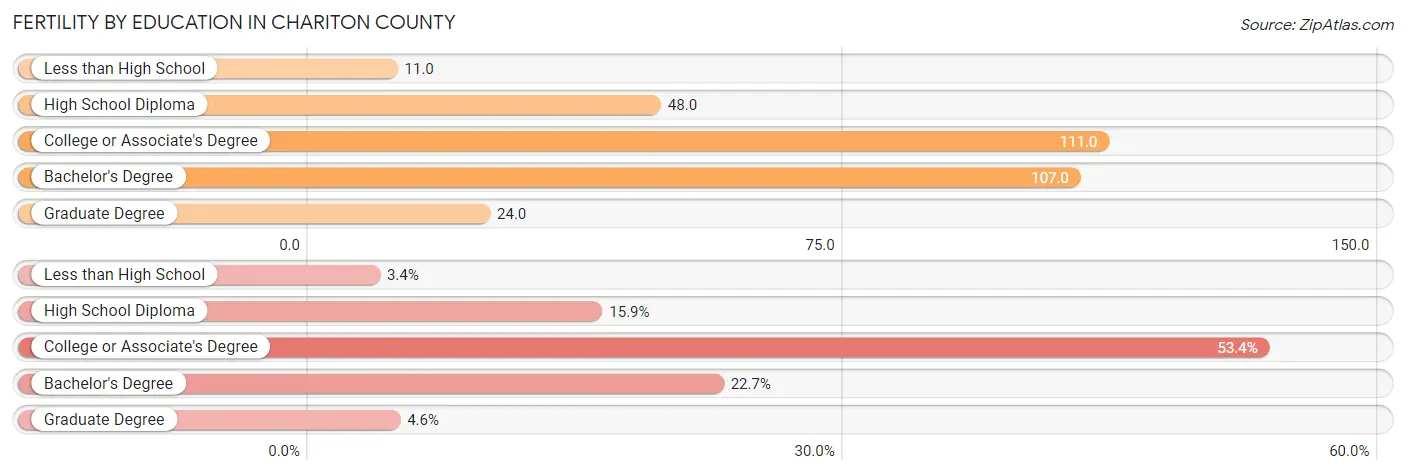
| Educational Attainment | Women with Births | Births / 1,000 Women |
| Less than High School | 3 (3.4%) | 11.0 |
| High School Diploma | 14 (15.9%) | 48.0 |
| College or Associate's Degree | 47 (53.4%) | 111.0 |
| Bachelor's Degree | 20 (22.7%) | 107.0 |
| Graduate Degree | 4 (4.5%) | 24.0 |
| Total | 88 (100.0%) | 66.0 |
Fertility by Education by Marriage Status in Chariton County
34.1% of women with births in Chariton County are unmarried. Women with the educational attainment of bachelor's degree are most likely to be married with 100.0% of them married at childbirth, while women with the educational attainment of high school diploma are least likely to be married with 100.0% of them unmarried at childbirth.
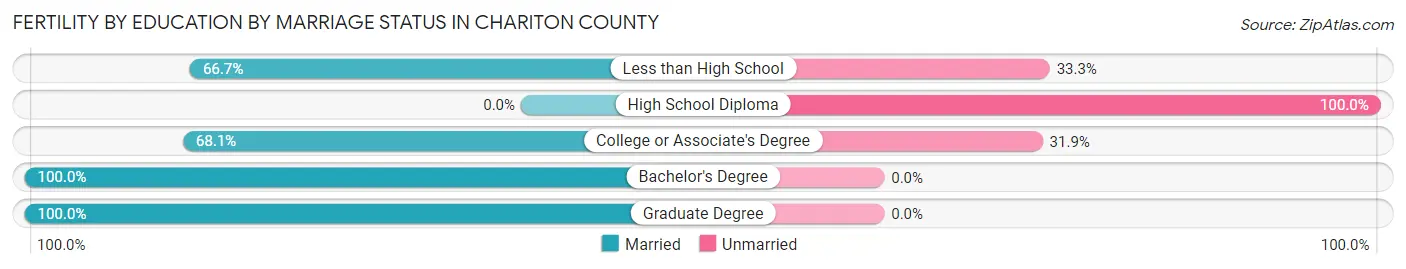
| Educational Attainment | Married | Unmarried |
| Less than High School | 2 (66.7%) | 1 (33.3%) |
| High School Diploma | 0 (0.0%) | 14 (100.0%) |
| College or Associate's Degree | 32 (68.1%) | 15 (31.9%) |
| Bachelor's Degree | 20 (100.0%) | 0 (0.0%) |
| Graduate Degree | 4 (100.0%) | 0 (0.0%) |
| Total | 58 (65.9%) | 30 (34.1%) |
Employment Characteristics in Chariton County
Employment by Class of Employer in Chariton County
Among the 3,172 employed individuals in Chariton County, private company employees (1,963 | 61.9%), self-employed (not incorporated) (390 | 12.3%), and local government employees (297 | 9.4%) make up the most common classes of employment.
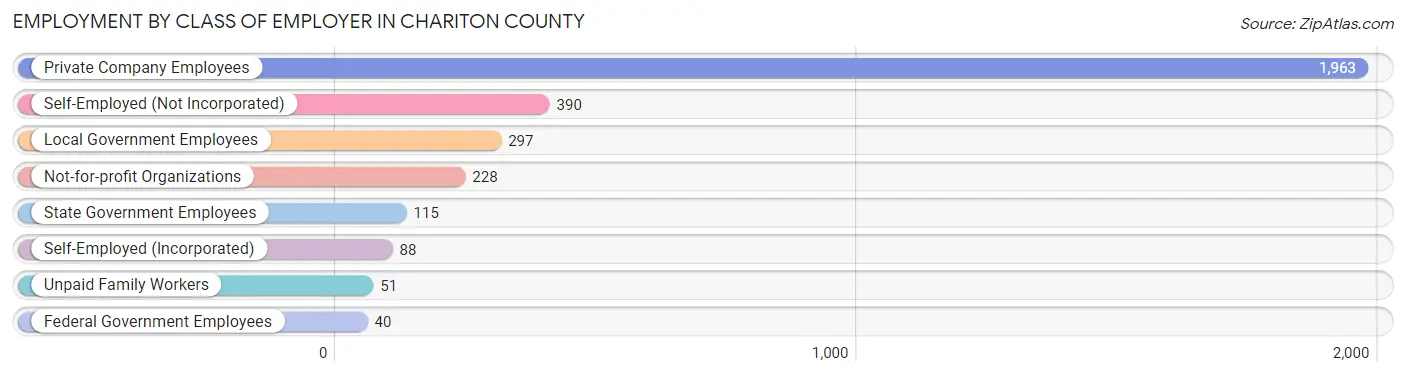
| Employer Class | # Employees | % Employees |
| Private Company Employees | 1,963 | 61.9% |
| Self-Employed (Incorporated) | 88 | 2.8% |
| Self-Employed (Not Incorporated) | 390 | 12.3% |
| Not-for-profit Organizations | 228 | 7.2% |
| Local Government Employees | 297 | 9.4% |
| State Government Employees | 115 | 3.6% |
| Federal Government Employees | 40 | 1.3% |
| Unpaid Family Workers | 51 | 1.6% |
| Total | 3,172 | 100.0% |
Employment Status by Age in Chariton County
According to the labor force statistics for Chariton County, out of the total population over 16 years of age (5,962), 56.1% or 3,345 individuals are in the labor force, with 4.3% or 144 of them unemployed. The age group with the highest labor force participation rate is 25 to 29 years, with 89.3% or 316 individuals in the labor force. Within the labor force, the 60 to 64 years age range has the highest percentage of unemployed individuals, with 14.7% or 55 of them being unemployed.
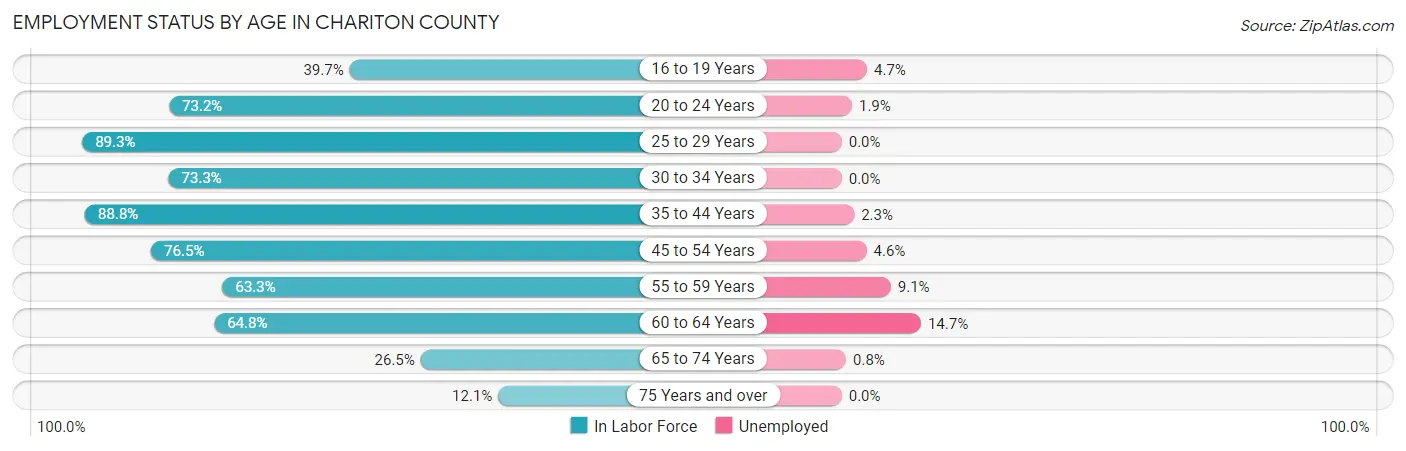
| Age Bracket | In Labor Force | Unemployed |
| 16 to 19 Years | 148 (39.7%) | 7 (4.7%) |
| 20 to 24 Years | 265 (73.2%) | 5 (1.9%) |
| 25 to 29 Years | 316 (89.3%) | 0 (0.0%) |
| 30 to 34 Years | 252 (73.3%) | 0 (0.0%) |
| 35 to 44 Years | 664 (88.8%) | 15 (2.3%) |
| 45 to 54 Years | 612 (76.5%) | 28 (4.6%) |
| 55 to 59 Years | 350 (63.3%) | 32 (9.1%) |
| 60 to 64 Years | 373 (64.8%) | 55 (14.7%) |
| 65 to 74 Years | 255 (26.5%) | 2 (0.8%) |
| 75 Years and over | 108 (12.1%) | 0 (0.0%) |
| Total | 3,345 (56.1%) | 144 (4.3%) |
Employment Status by Educational Attainment in Chariton County
According to labor force statistics for Chariton County, 76.1% of individuals (2,568) out of the total population between 25 and 64 years of age (3,375) are in the labor force, with 5.1% or 131 of them being unemployed. The group with the highest labor force participation rate are those with the educational attainment of bachelor's degree or higher, with 85.6% or 726 individuals in the labor force. Within the labor force, individuals with less than high school education have the highest percentage of unemployment, with 12.2% or 12 of them being unemployed.
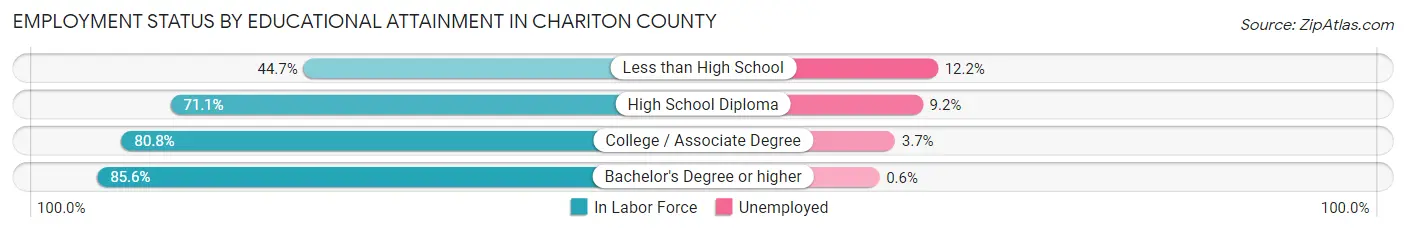
| Educational Attainment | In Labor Force | Unemployed |
| Less than High School | 98 (44.7%) | 27 (12.2%) |
| High School Diploma | 899 (71.1%) | 116 (9.2%) |
| College / Associate Degree | 843 (80.8%) | 39 (3.7%) |
| Bachelor's Degree or higher | 726 (85.6%) | 5 (0.6%) |
| Total | 2,568 (76.1%) | 172 (5.1%) |
Employment Occupations by Sex in Chariton County
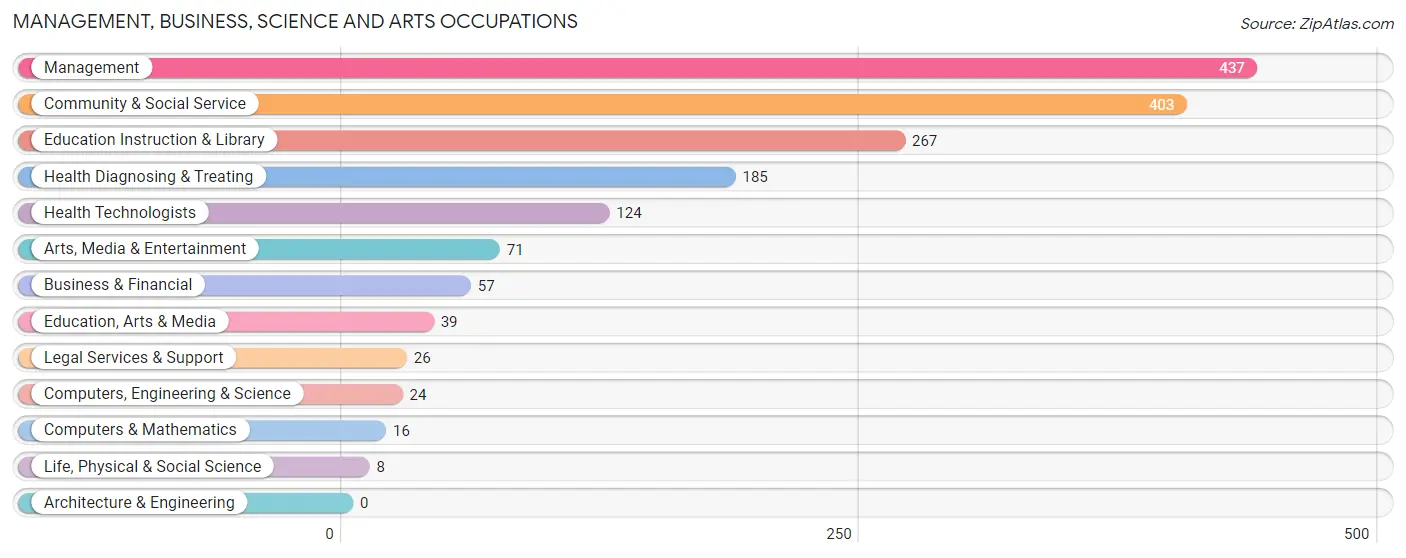
Management, Business, Science and Arts Occupations
The most common Management, Business, Science and Arts occupations in Chariton County are Management (437 | 13.7%), Community & Social Service (403 | 12.6%), Education Instruction & Library (267 | 8.4%), Health Diagnosing & Treating (185 | 5.8%), and Health Technologists (124 | 3.9%).
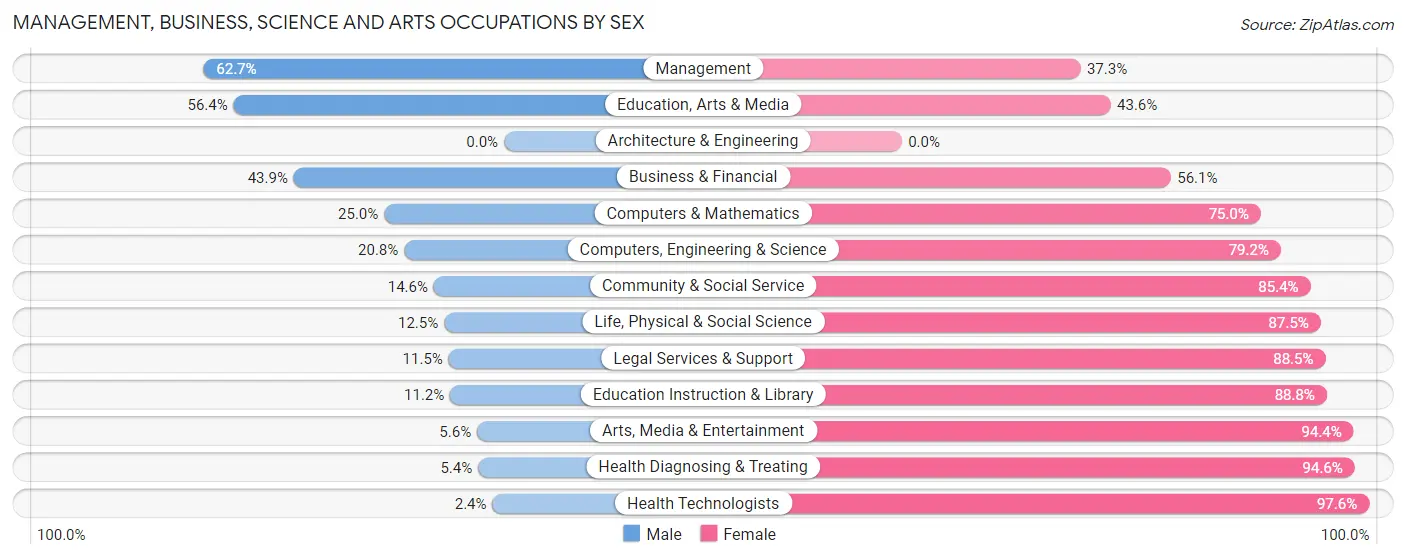
Management, Business, Science and Arts Occupations by Sex
Within the Management, Business, Science and Arts occupations in Chariton County, the most male-oriented occupations are Management (62.7%), Education, Arts & Media (56.4%), and Business & Financial (43.9%), while the most female-oriented occupations are Health Technologists (97.6%), Health Diagnosing & Treating (94.6%), and Arts, Media & Entertainment (94.4%).
| Occupation | Male | Female |
| Management | 274 (62.7%) | 163 (37.3%) |
| Business & Financial | 25 (43.9%) | 32 (56.1%) |
| Computers, Engineering & Science | 5 (20.8%) | 19 (79.2%) |
| Computers & Mathematics | 4 (25.0%) | 12 (75.0%) |
| Architecture & Engineering | 0 (0.0%) | 0 (0.0%) |
| Life, Physical & Social Science | 1 (12.5%) | 7 (87.5%) |
| Community & Social Service | 59 (14.6%) | 344 (85.4%) |
| Education, Arts & Media | 22 (56.4%) | 17 (43.6%) |
| Legal Services & Support | 3 (11.5%) | 23 (88.5%) |
| Education Instruction & Library | 30 (11.2%) | 237 (88.8%) |
| Arts, Media & Entertainment | 4 (5.6%) | 67 (94.4%) |
| Health Diagnosing & Treating | 10 (5.4%) | 175 (94.6%) |
| Health Technologists | 3 (2.4%) | 121 (97.6%) |
| Total (Category) | 373 (33.7%) | 733 (66.3%) |
| Total (Overall) | 1,695 (53.0%) | 1,504 (47.0%) |
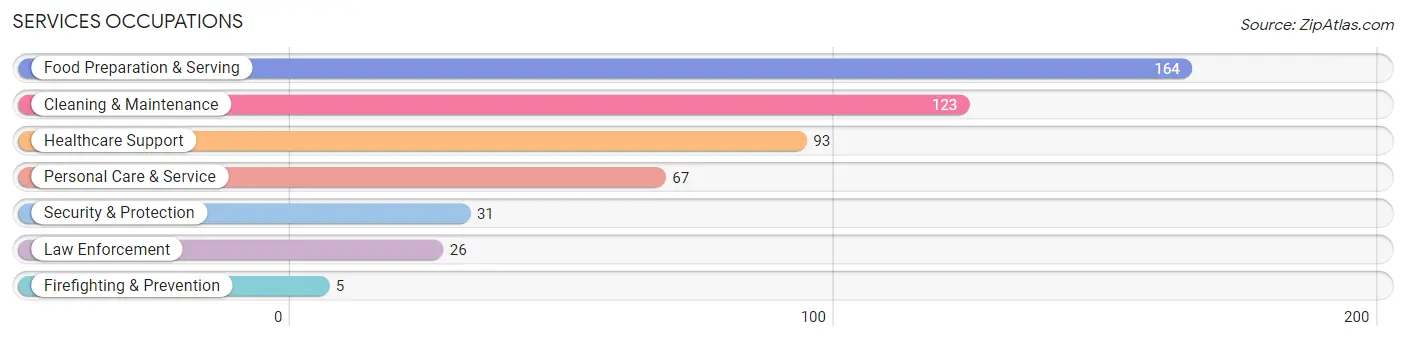
Services Occupations
The most common Services occupations in Chariton County are Food Preparation & Serving (164 | 5.1%), Cleaning & Maintenance (123 | 3.8%), Healthcare Support (93 | 2.9%), Personal Care & Service (67 | 2.1%), and Security & Protection (31 | 1.0%).
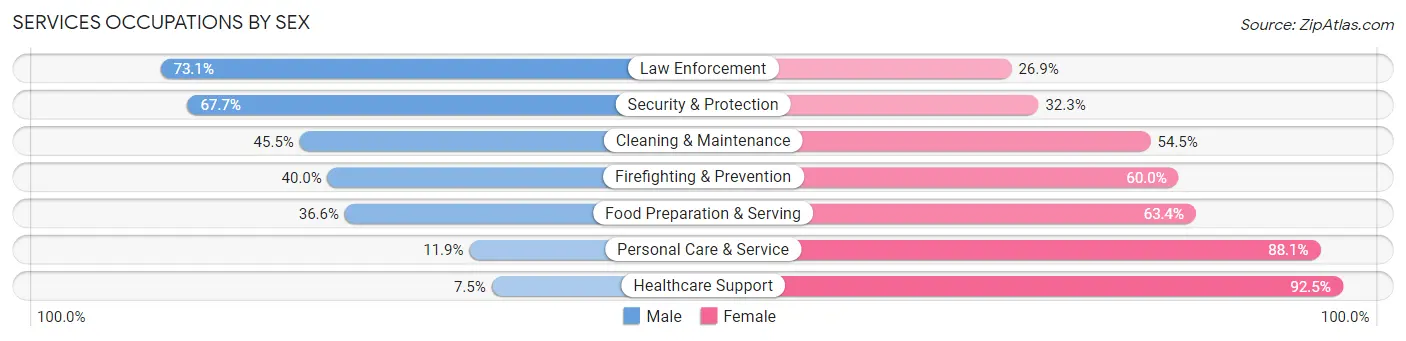
Services Occupations by Sex
Within the Services occupations in Chariton County, the most male-oriented occupations are Law Enforcement (73.1%), Security & Protection (67.7%), and Cleaning & Maintenance (45.5%), while the most female-oriented occupations are Healthcare Support (92.5%), Personal Care & Service (88.1%), and Food Preparation & Serving (63.4%).
| Occupation | Male | Female |
| Healthcare Support | 7 (7.5%) | 86 (92.5%) |
| Security & Protection | 21 (67.7%) | 10 (32.3%) |
| Firefighting & Prevention | 2 (40.0%) | 3 (60.0%) |
| Law Enforcement | 19 (73.1%) | 7 (26.9%) |
| Food Preparation & Serving | 60 (36.6%) | 104 (63.4%) |
| Cleaning & Maintenance | 56 (45.5%) | 67 (54.5%) |
| Personal Care & Service | 8 (11.9%) | 59 (88.1%) |
| Total (Category) | 152 (31.8%) | 326 (68.2%) |
| Total (Overall) | 1,695 (53.0%) | 1,504 (47.0%) |
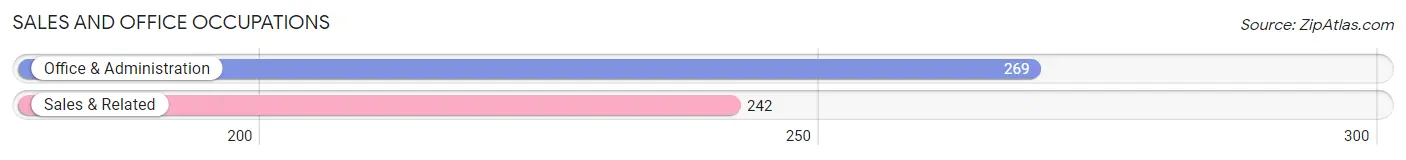
Sales and Office Occupations
The most common Sales and Office occupations in Chariton County are Office & Administration (269 | 8.4%), and Sales & Related (242 | 7.6%).
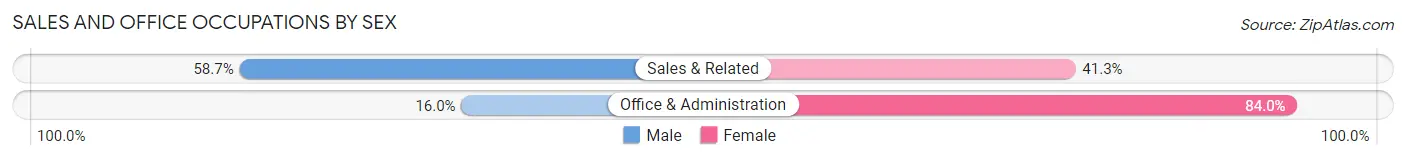
Sales and Office Occupations by Sex
| Occupation | Male | Female |
| Sales & Related | 142 (58.7%) | 100 (41.3%) |
| Office & Administration | 43 (16.0%) | 226 (84.0%) |
| Total (Category) | 185 (36.2%) | 326 (63.8%) |
| Total (Overall) | 1,695 (53.0%) | 1,504 (47.0%) |
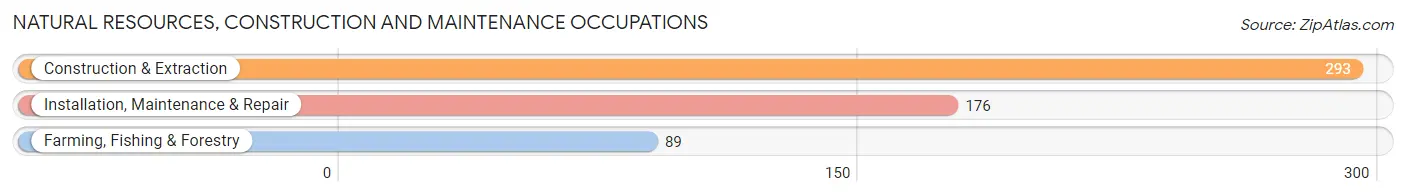
Natural Resources, Construction and Maintenance Occupations
The most common Natural Resources, Construction and Maintenance occupations in Chariton County are Construction & Extraction (293 | 9.2%), Installation, Maintenance & Repair (176 | 5.5%), and Farming, Fishing & Forestry (89 | 2.8%).
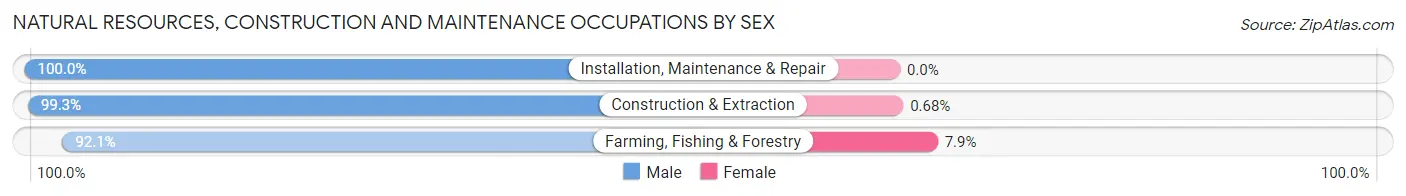
Natural Resources, Construction and Maintenance Occupations by Sex
| Occupation | Male | Female |
| Farming, Fishing & Forestry | 82 (92.1%) | 7 (7.9%) |
| Construction & Extraction | 291 (99.3%) | 2 (0.7%) |
| Installation, Maintenance & Repair | 176 (100.0%) | 0 (0.0%) |
| Total (Category) | 549 (98.4%) | 9 (1.6%) |
| Total (Overall) | 1,695 (53.0%) | 1,504 (47.0%) |
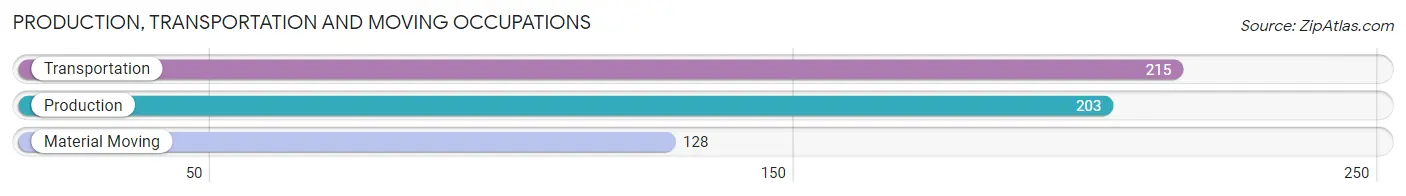
Production, Transportation and Moving Occupations
The most common Production, Transportation and Moving occupations in Chariton County are Transportation (215 | 6.7%), Production (203 | 6.4%), and Material Moving (128 | 4.0%).
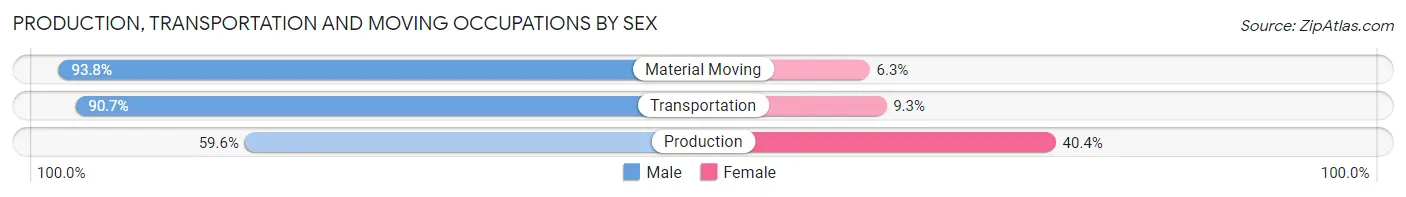
Production, Transportation and Moving Occupations by Sex
| Occupation | Male | Female |
| Production | 121 (59.6%) | 82 (40.4%) |
| Transportation | 195 (90.7%) | 20 (9.3%) |
| Material Moving | 120 (93.8%) | 8 (6.2%) |
| Total (Category) | 436 (79.8%) | 110 (20.2%) |
| Total (Overall) | 1,695 (53.0%) | 1,504 (47.0%) |
Employment Industries by Sex in Chariton County
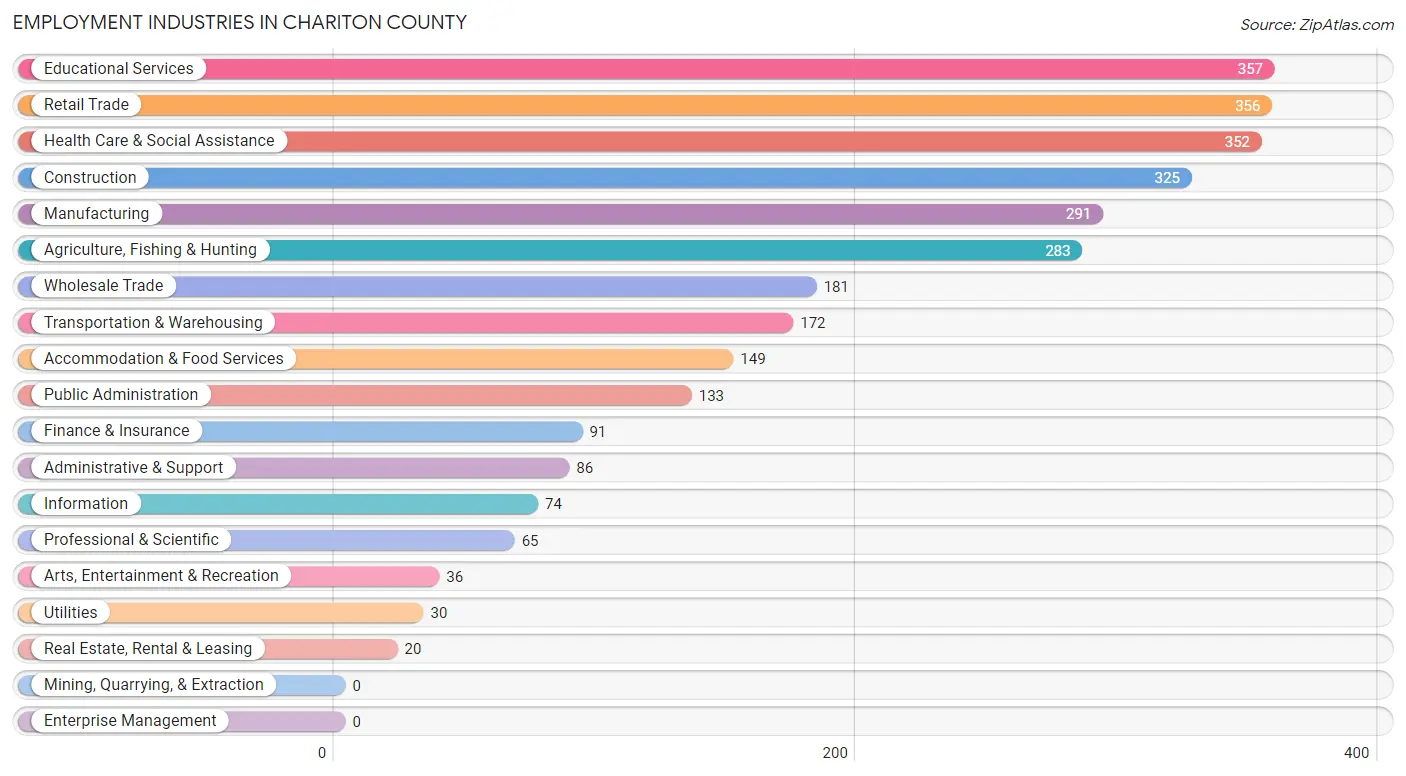
Employment Industries in Chariton County
The major employment industries in Chariton County include Educational Services (357 | 11.2%), Retail Trade (356 | 11.1%), Health Care & Social Assistance (352 | 11.0%), Construction (325 | 10.2%), and Manufacturing (291 | 9.1%).
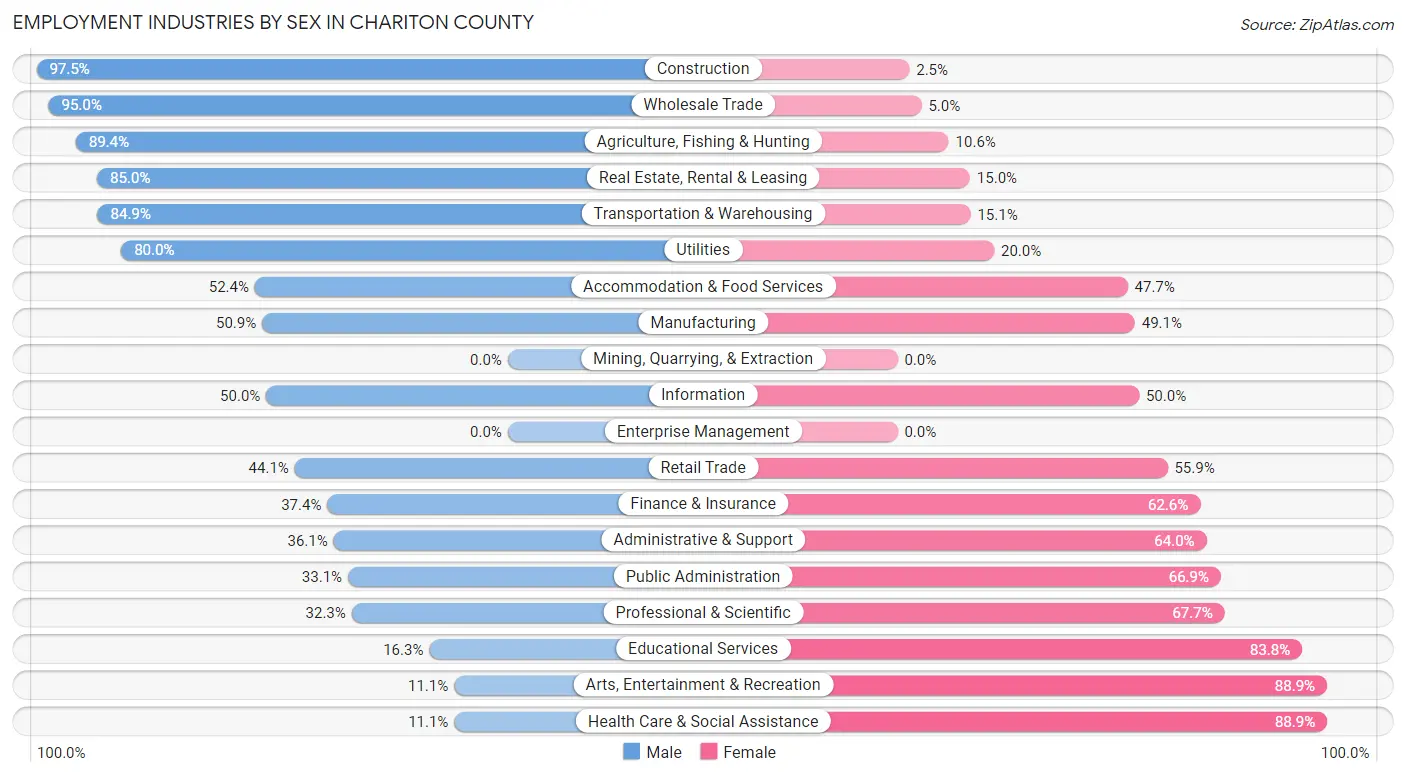
Employment Industries by Sex in Chariton County
The Chariton County industries that see more men than women are Construction (97.5%), Wholesale Trade (95.0%), and Agriculture, Fishing & Hunting (89.4%), whereas the industries that tend to have a higher number of women are Health Care & Social Assistance (88.9%), Arts, Entertainment & Recreation (88.9%), and Educational Services (83.8%).
| Industry | Male | Female |
| Agriculture, Fishing & Hunting | 253 (89.4%) | 30 (10.6%) |
| Mining, Quarrying, & Extraction | 0 (0.0%) | 0 (0.0%) |
| Construction | 317 (97.5%) | 8 (2.5%) |
| Manufacturing | 148 (50.9%) | 143 (49.1%) |
| Wholesale Trade | 172 (95.0%) | 9 (5.0%) |
| Retail Trade | 157 (44.1%) | 199 (55.9%) |
| Transportation & Warehousing | 146 (84.9%) | 26 (15.1%) |
| Utilities | 24 (80.0%) | 6 (20.0%) |
| Information | 37 (50.0%) | 37 (50.0%) |
| Finance & Insurance | 34 (37.4%) | 57 (62.6%) |
| Real Estate, Rental & Leasing | 17 (85.0%) | 3 (15.0%) |
| Professional & Scientific | 21 (32.3%) | 44 (67.7%) |
| Enterprise Management | 0 (0.0%) | 0 (0.0%) |
| Administrative & Support | 31 (36.0%) | 55 (63.9%) |
| Educational Services | 58 (16.3%) | 299 (83.8%) |
| Health Care & Social Assistance | 39 (11.1%) | 313 (88.9%) |
| Arts, Entertainment & Recreation | 4 (11.1%) | 32 (88.9%) |
| Accommodation & Food Services | 78 (52.3%) | 71 (47.6%) |
| Public Administration | 44 (33.1%) | 89 (66.9%) |
| Total | 1,695 (53.0%) | 1,504 (47.0%) |
Education in Chariton County
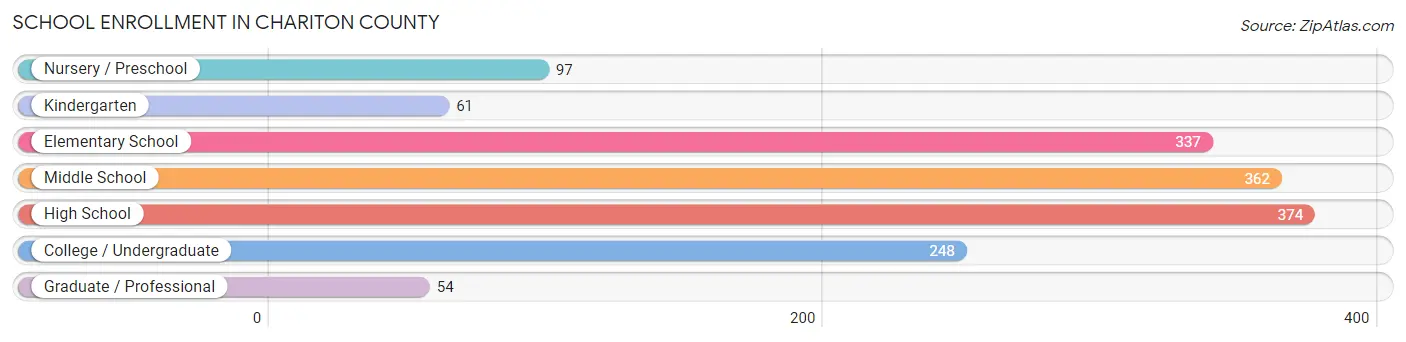
School Enrollment in Chariton County
The most common levels of schooling among the 1,533 students in Chariton County are high school (374 | 24.4%), middle school (362 | 23.6%), and elementary school (337 | 22.0%).
| School Level | # Students | % Students |
| Nursery / Preschool | 97 | 6.3% |
| Kindergarten | 61 | 4.0% |
| Elementary School | 337 | 22.0% |
| Middle School | 362 | 23.6% |
| High School | 374 | 24.4% |
| College / Undergraduate | 248 | 16.2% |
| Graduate / Professional | 54 | 3.5% |
| Total | 1,533 | 100.0% |
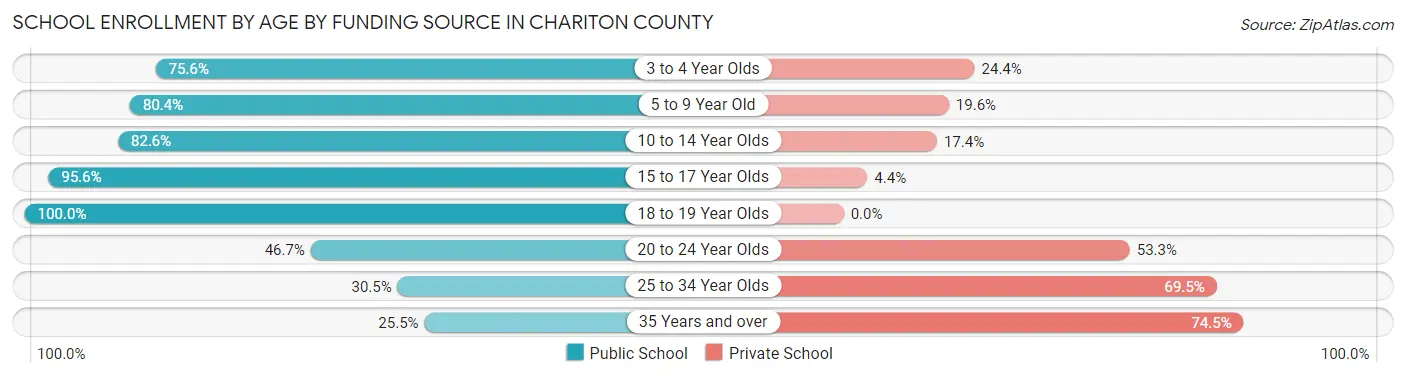
School Enrollment by Age by Funding Source in Chariton County
Out of a total of 1,533 students who are enrolled in schools in Chariton County, 365 (23.8%) attend a private institution, while the remaining 1,168 (76.2%) are enrolled in public schools. The age group of 35 years and over has the highest likelihood of being enrolled in private schools, with 35 (74.5% in the age bracket) enrolled. Conversely, the age group of 18 to 19 year olds has the lowest likelihood of being enrolled in a private school, with 85 (100.0% in the age bracket) attending a public institution.
| Age Bracket | Public School | Private School |
| 3 to 4 Year Olds | 31 (75.6%) | 10 (24.4%) |
| 5 to 9 Year Old | 320 (80.4%) | 78 (19.6%) |
| 10 to 14 Year Olds | 404 (82.6%) | 85 (17.4%) |
| 15 to 17 Year Olds | 216 (95.6%) | 10 (4.4%) |
| 18 to 19 Year Olds | 85 (100.0%) | 0 (0.0%) |
| 20 to 24 Year Olds | 71 (46.7%) | 81 (53.3%) |
| 25 to 34 Year Olds | 29 (30.5%) | 66 (69.5%) |
| 35 Years and over | 12 (25.5%) | 35 (74.5%) |
| Total | 1,168 (76.2%) | 365 (23.8%) |
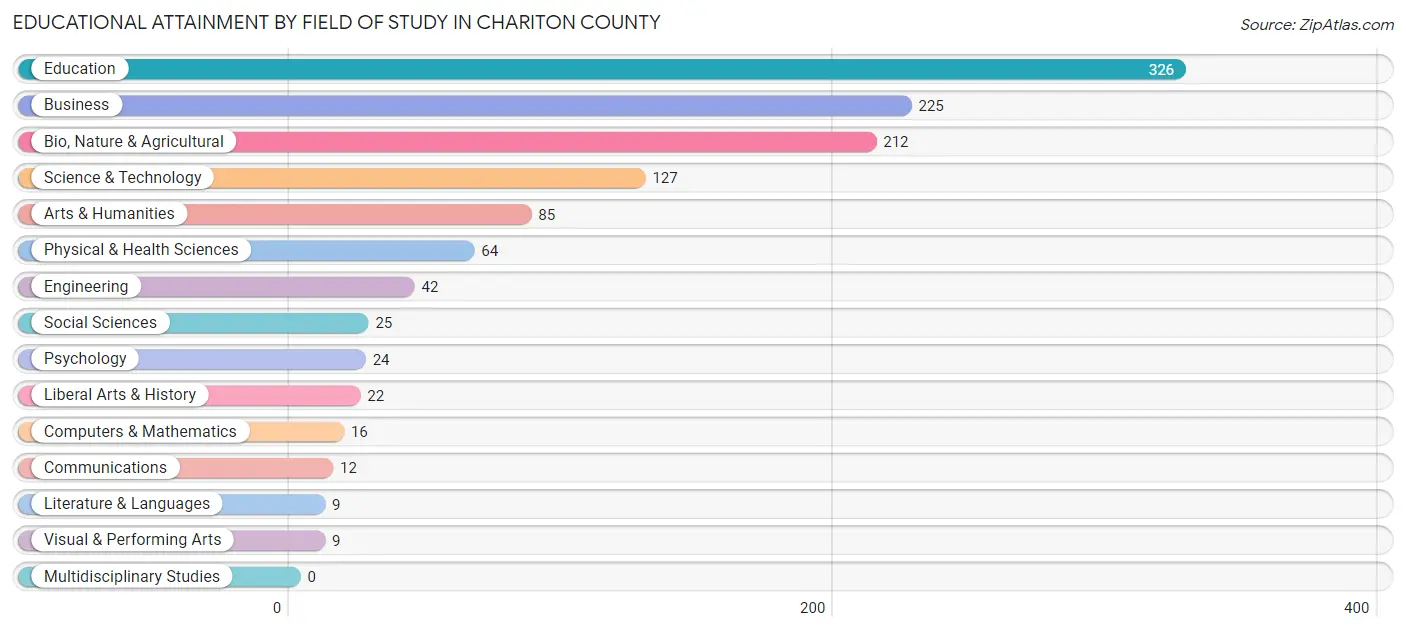
Educational Attainment by Field of Study in Chariton County
Education (326 | 27.2%), business (225 | 18.8%), bio, nature & agricultural (212 | 17.7%), science & technology (127 | 10.6%), and arts & humanities (85 | 7.1%) are the most common fields of study among 1,198 individuals in Chariton County who have obtained a bachelor's degree or higher.
| Field of Study | # Graduates | % Graduates |
| Computers & Mathematics | 16 | 1.3% |
| Bio, Nature & Agricultural | 212 | 17.7% |
| Physical & Health Sciences | 64 | 5.3% |
| Psychology | 24 | 2.0% |
| Social Sciences | 25 | 2.1% |
| Engineering | 42 | 3.5% |
| Multidisciplinary Studies | 0 | 0.0% |
| Science & Technology | 127 | 10.6% |
| Business | 225 | 18.8% |
| Education | 326 | 27.2% |
| Literature & Languages | 9 | 0.7% |
| Liberal Arts & History | 22 | 1.8% |
| Visual & Performing Arts | 9 | 0.7% |
| Communications | 12 | 1.0% |
| Arts & Humanities | 85 | 7.1% |
| Total | 1,198 | 100.0% |
Transportation & Commute in Chariton County
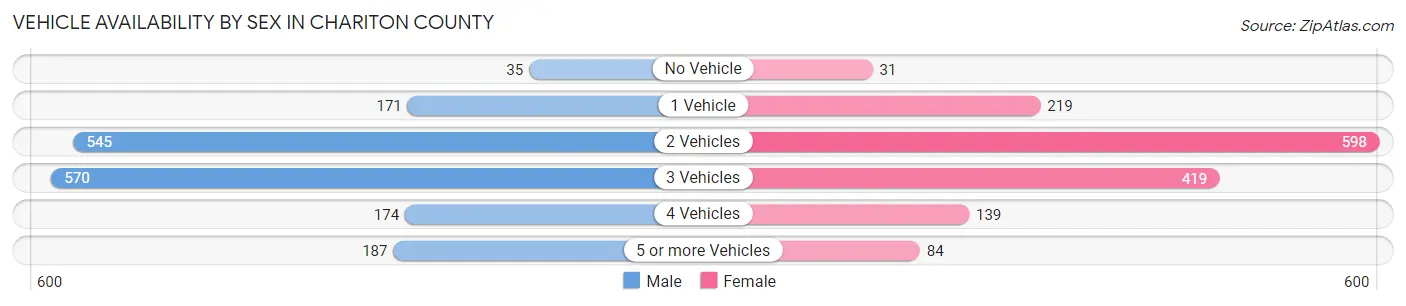
Vehicle Availability by Sex in Chariton County
The most prevalent vehicle ownership categories in Chariton County are males with 3 vehicles (570, accounting for 33.9%) and females with 3 vehicles (419, making up 38.3%).
| Vehicles Available | Male | Female |
| No Vehicle | 35 (2.1%) | 31 (2.1%) |
| 1 Vehicle | 171 (10.2%) | 219 (14.7%) |
| 2 Vehicles | 545 (32.4%) | 598 (40.1%) |
| 3 Vehicles | 570 (33.9%) | 419 (28.1%) |
| 4 Vehicles | 174 (10.3%) | 139 (9.3%) |
| 5 or more Vehicles | 187 (11.1%) | 84 (5.6%) |
| Total | 1,682 (100.0%) | 1,490 (100.0%) |
Commute Time in Chariton County
The most frequently occuring commute durations in Chariton County are 5 to 9 minutes (496 commuters, 16.7%), 30 to 34 minutes (406 commuters, 13.7%), and 10 to 14 minutes (367 commuters, 12.4%).
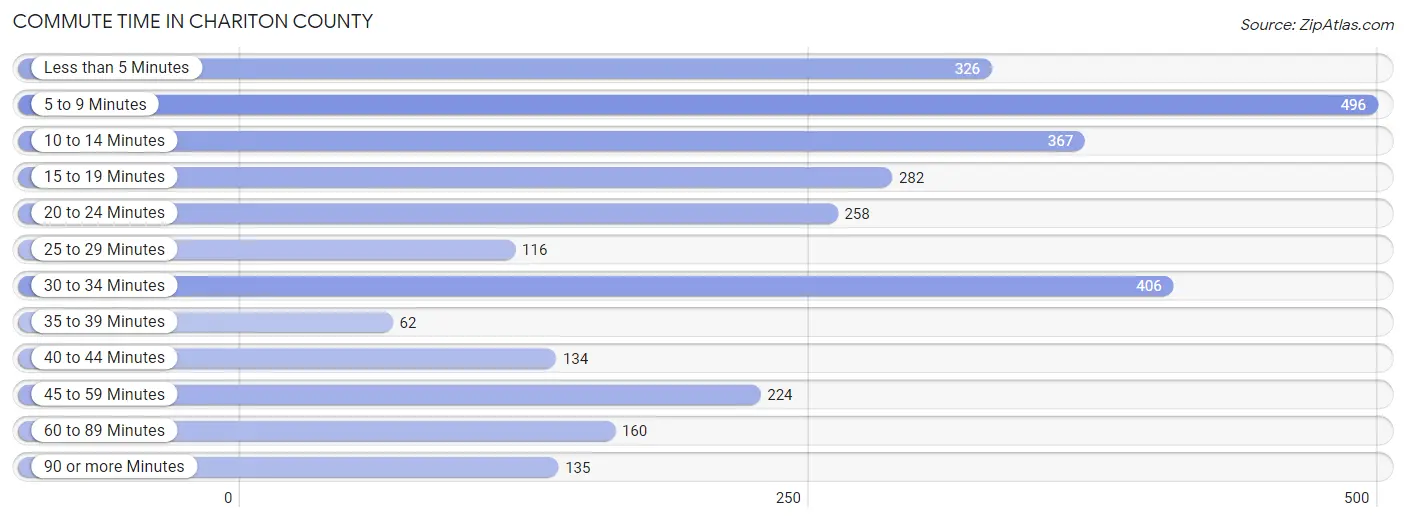
| Commute Time | # Commuters | % Commuters |
| Less than 5 Minutes | 326 | 11.0% |
| 5 to 9 Minutes | 496 | 16.7% |
| 10 to 14 Minutes | 367 | 12.4% |
| 15 to 19 Minutes | 282 | 9.5% |
| 20 to 24 Minutes | 258 | 8.7% |
| 25 to 29 Minutes | 116 | 3.9% |
| 30 to 34 Minutes | 406 | 13.7% |
| 35 to 39 Minutes | 62 | 2.1% |
| 40 to 44 Minutes | 134 | 4.5% |
| 45 to 59 Minutes | 224 | 7.5% |
| 60 to 89 Minutes | 160 | 5.4% |
| 90 or more Minutes | 135 | 4.5% |
Commute Time by Sex in Chariton County
The most common commute times in Chariton County are 5 to 9 minutes (306 commuters, 19.7%) for males and 30 to 34 minutes (206 commuters, 14.6%) for females.
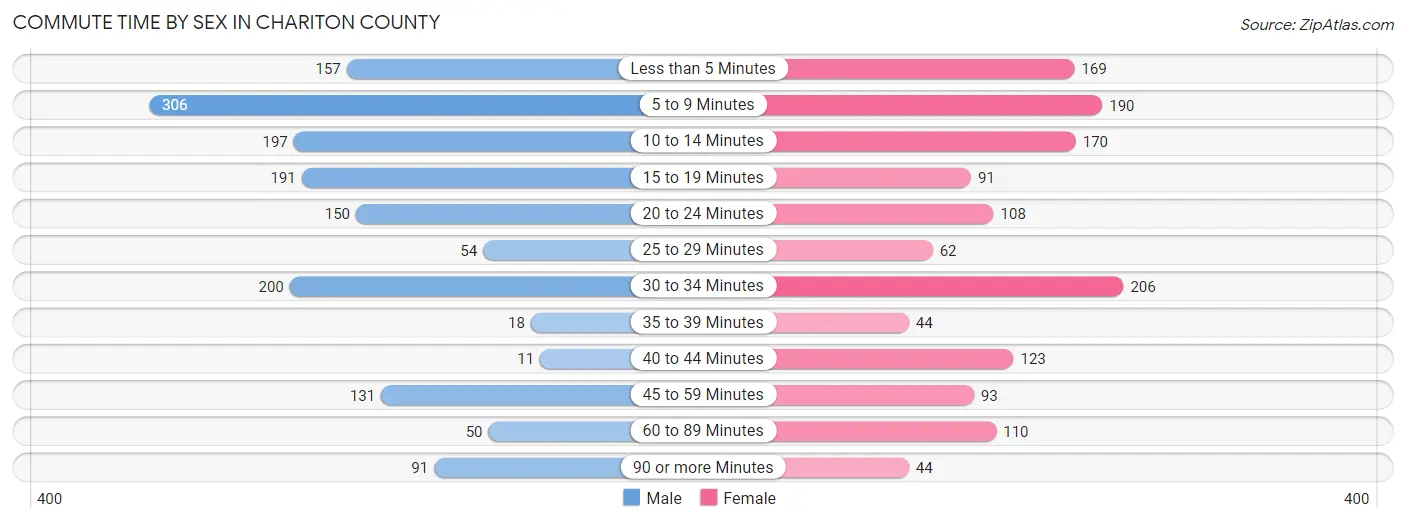
| Commute Time | Male | Female |
| Less than 5 Minutes | 157 (10.1%) | 169 (12.0%) |
| 5 to 9 Minutes | 306 (19.7%) | 190 (13.5%) |
| 10 to 14 Minutes | 197 (12.7%) | 170 (12.1%) |
| 15 to 19 Minutes | 191 (12.3%) | 91 (6.5%) |
| 20 to 24 Minutes | 150 (9.6%) | 108 (7.7%) |
| 25 to 29 Minutes | 54 (3.5%) | 62 (4.4%) |
| 30 to 34 Minutes | 200 (12.9%) | 206 (14.6%) |
| 35 to 39 Minutes | 18 (1.2%) | 44 (3.1%) |
| 40 to 44 Minutes | 11 (0.7%) | 123 (8.7%) |
| 45 to 59 Minutes | 131 (8.4%) | 93 (6.6%) |
| 60 to 89 Minutes | 50 (3.2%) | 110 (7.8%) |
| 90 or more Minutes | 91 (5.9%) | 44 (3.1%) |
Time of Departure to Work by Sex in Chariton County
The most frequent times of departure to work in Chariton County are 7:00 AM to 7:29 AM (247, 15.9%) for males and 6:30 AM to 6:59 AM (312, 22.1%) for females.
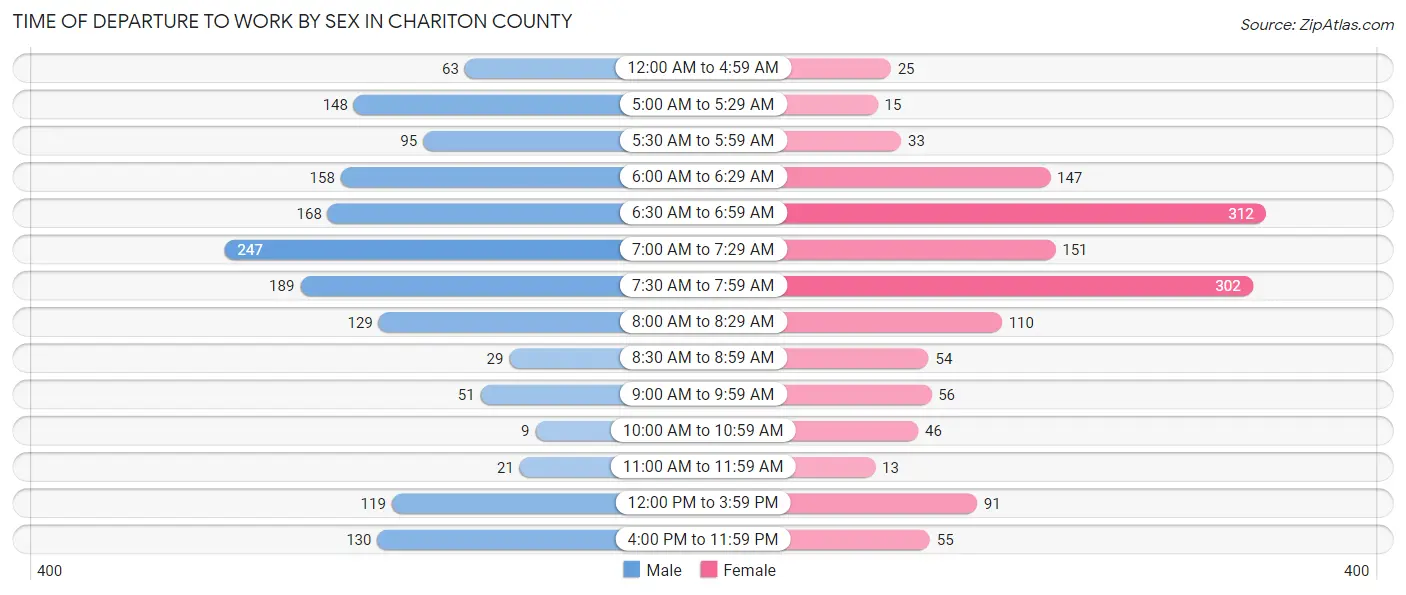
| Time of Departure | Male | Female |
| 12:00 AM to 4:59 AM | 63 (4.1%) | 25 (1.8%) |
| 5:00 AM to 5:29 AM | 148 (9.5%) | 15 (1.1%) |
| 5:30 AM to 5:59 AM | 95 (6.1%) | 33 (2.3%) |
| 6:00 AM to 6:29 AM | 158 (10.2%) | 147 (10.4%) |
| 6:30 AM to 6:59 AM | 168 (10.8%) | 312 (22.1%) |
| 7:00 AM to 7:29 AM | 247 (15.9%) | 151 (10.7%) |
| 7:30 AM to 7:59 AM | 189 (12.1%) | 302 (21.4%) |
| 8:00 AM to 8:29 AM | 129 (8.3%) | 110 (7.8%) |
| 8:30 AM to 8:59 AM | 29 (1.9%) | 54 (3.8%) |
| 9:00 AM to 9:59 AM | 51 (3.3%) | 56 (4.0%) |
| 10:00 AM to 10:59 AM | 9 (0.6%) | 46 (3.3%) |
| 11:00 AM to 11:59 AM | 21 (1.3%) | 13 (0.9%) |
| 12:00 PM to 3:59 PM | 119 (7.6%) | 91 (6.5%) |
| 4:00 PM to 11:59 PM | 130 (8.4%) | 55 (3.9%) |
| Total | 1,556 (100.0%) | 1,410 (100.0%) |
Housing Occupancy in Chariton County
Occupancy by Ownership in Chariton County
Of the total 2,591 dwellings in Chariton County, owner-occupied units account for 2,116 (81.7%), while renter-occupied units make up 475 (18.3%).
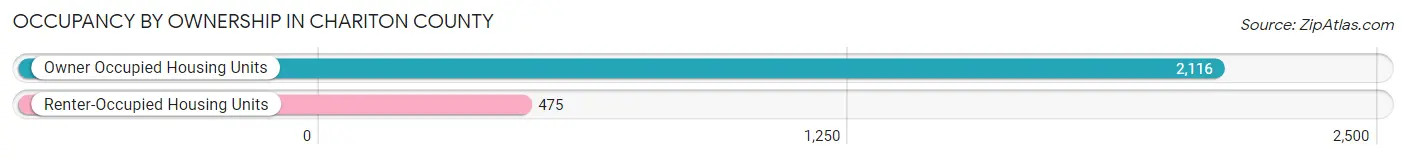
| Occupancy | # Housing Units | % Housing Units |
| Owner Occupied Housing Units | 2,116 | 81.7% |
| Renter-Occupied Housing Units | 475 | 18.3% |
| Total Occupied Housing Units | 2,591 | 100.0% |
Occupancy by Household Size in Chariton County
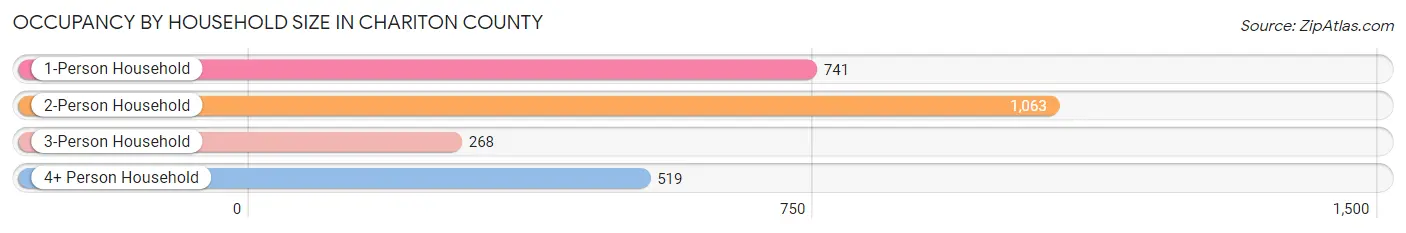
| Household Size | # Housing Units | % Housing Units |
| 1-Person Household | 741 | 28.6% |
| 2-Person Household | 1,063 | 41.0% |
| 3-Person Household | 268 | 10.3% |
| 4+ Person Household | 519 | 20.0% |
| Total Housing Units | 2,591 | 100.0% |
Occupancy by Ownership by Household Size in Chariton County
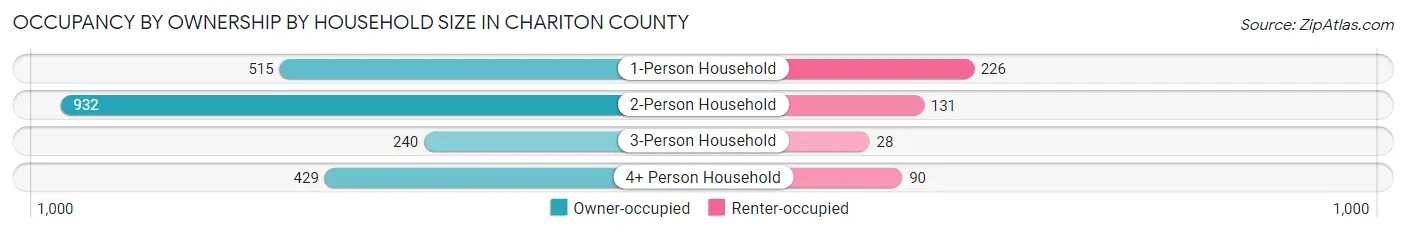
| Household Size | Owner-occupied | Renter-occupied |
| 1-Person Household | 515 (69.5%) | 226 (30.5%) |
| 2-Person Household | 932 (87.7%) | 131 (12.3%) |
| 3-Person Household | 240 (89.5%) | 28 (10.4%) |
| 4+ Person Household | 429 (82.7%) | 90 (17.3%) |
| Total Housing Units | 2,116 (81.7%) | 475 (18.3%) |
Occupancy by Educational Attainment in Chariton County
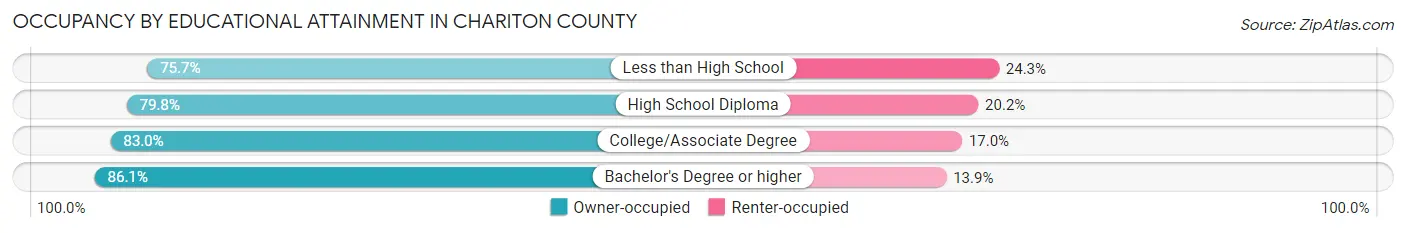
| Household Size | Owner-occupied | Renter-occupied |
| Less than High School | 140 (75.7%) | 45 (24.3%) |
| High School Diploma | 939 (79.8%) | 238 (20.2%) |
| College/Associate Degree | 566 (83.0%) | 116 (17.0%) |
| Bachelor's Degree or higher | 471 (86.1%) | 76 (13.9%) |
Occupancy by Age of Householder in Chariton County
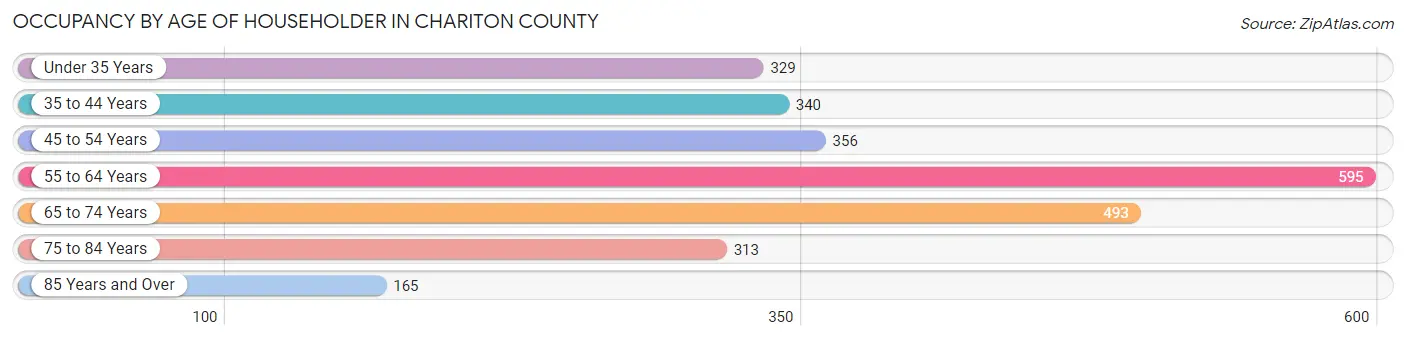
| Age Bracket | # Households | % Households |
| Under 35 Years | 329 | 12.7% |
| 35 to 44 Years | 340 | 13.1% |
| 45 to 54 Years | 356 | 13.7% |
| 55 to 64 Years | 595 | 23.0% |
| 65 to 74 Years | 493 | 19.0% |
| 75 to 84 Years | 313 | 12.1% |
| 85 Years and Over | 165 | 6.4% |
| Total | 2,591 | 100.0% |
Housing Finances in Chariton County
Median Income by Occupancy in Chariton County
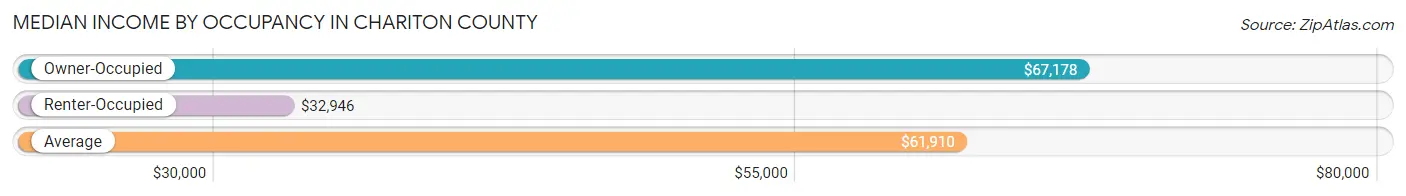
| Occupancy Type | # Households | Median Income |
| Owner-Occupied | 2,116 (81.7%) | $67,178 |
| Renter-Occupied | 475 (18.3%) | $32,946 |
| Average | 2,591 (100.0%) | $61,910 |
Occupancy by Householder Income Bracket in Chariton County
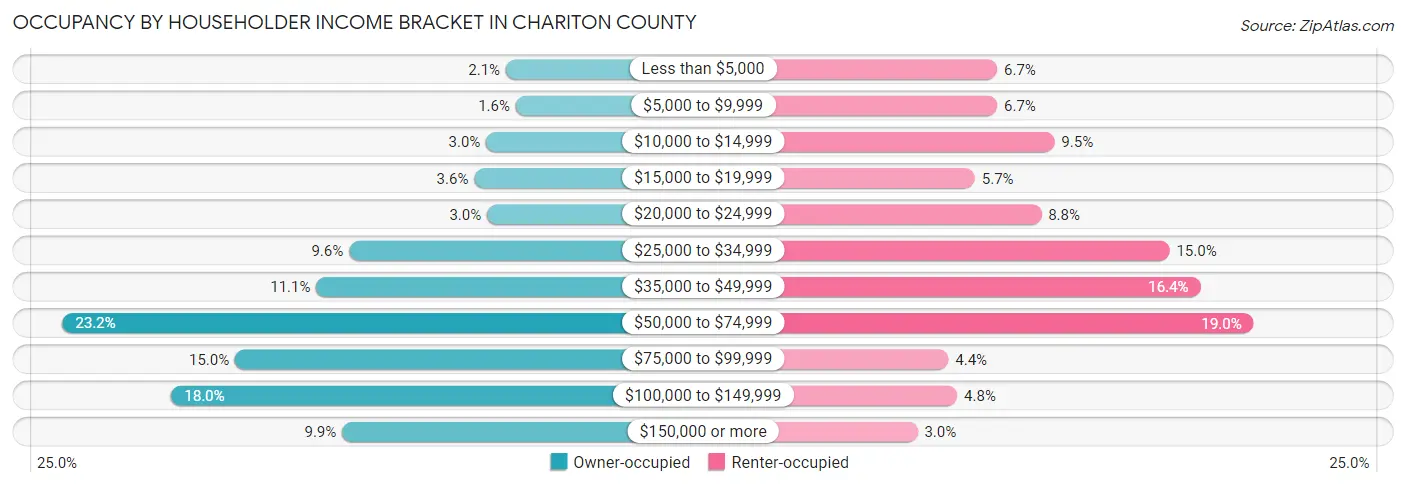
| Income Bracket | Owner-occupied | Renter-occupied |
| Less than $5,000 | 44 (2.1%) | 32 (6.7%) |
| $5,000 to $9,999 | 34 (1.6%) | 32 (6.7%) |
| $10,000 to $14,999 | 64 (3.0%) | 45 (9.5%) |
| $15,000 to $19,999 | 76 (3.6%) | 27 (5.7%) |
| $20,000 to $24,999 | 63 (3.0%) | 42 (8.8%) |
| $25,000 to $34,999 | 202 (9.6%) | 71 (14.9%) |
| $35,000 to $49,999 | 235 (11.1%) | 78 (16.4%) |
| $50,000 to $74,999 | 491 (23.2%) | 90 (19.0%) |
| $75,000 to $99,999 | 317 (15.0%) | 21 (4.4%) |
| $100,000 to $149,999 | 381 (18.0%) | 23 (4.8%) |
| $150,000 or more | 209 (9.9%) | 14 (2.9%) |
| Total | 2,116 (100.0%) | 475 (100.0%) |
Monthly Housing Cost Tiers in Chariton County
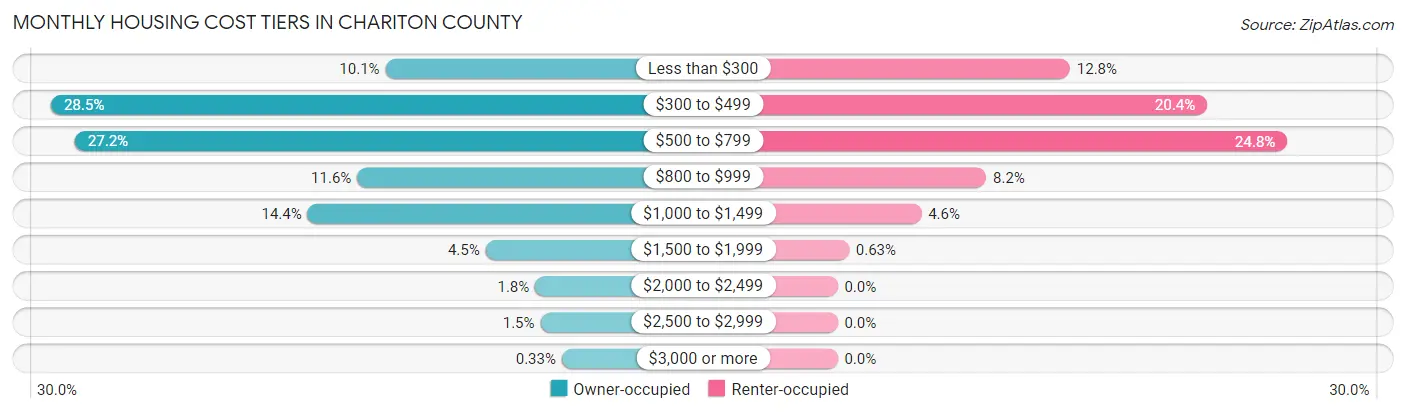
| Monthly Cost | Owner-occupied | Renter-occupied |
| Less than $300 | 213 (10.1%) | 61 (12.8%) |
| $300 to $499 | 604 (28.5%) | 97 (20.4%) |
| $500 to $799 | 576 (27.2%) | 118 (24.8%) |
| $800 to $999 | 246 (11.6%) | 39 (8.2%) |
| $1,000 to $1,499 | 304 (14.4%) | 22 (4.6%) |
| $1,500 to $1,999 | 96 (4.5%) | 3 (0.6%) |
| $2,000 to $2,499 | 38 (1.8%) | 0 (0.0%) |
| $2,500 to $2,999 | 32 (1.5%) | 0 (0.0%) |
| $3,000 or more | 7 (0.3%) | 0 (0.0%) |
| Total | 2,116 (100.0%) | 475 (100.0%) |
Physical Housing Characteristics in Chariton County
Housing Structures in Chariton County
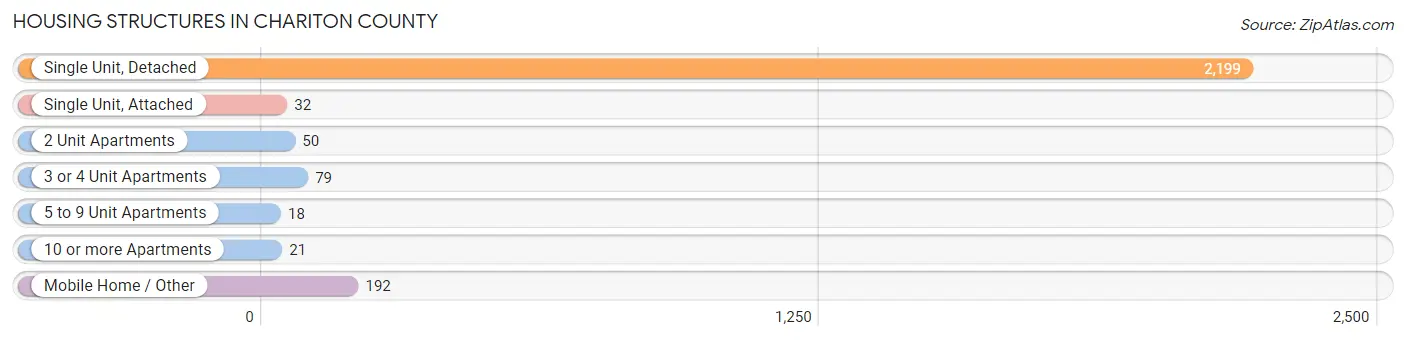
| Structure Type | # Housing Units | % Housing Units |
| Single Unit, Detached | 2,199 | 84.9% |
| Single Unit, Attached | 32 | 1.2% |
| 2 Unit Apartments | 50 | 1.9% |
| 3 or 4 Unit Apartments | 79 | 3.0% |
| 5 to 9 Unit Apartments | 18 | 0.7% |
| 10 or more Apartments | 21 | 0.8% |
| Mobile Home / Other | 192 | 7.4% |
| Total | 2,591 | 100.0% |
Housing Structures by Occupancy in Chariton County
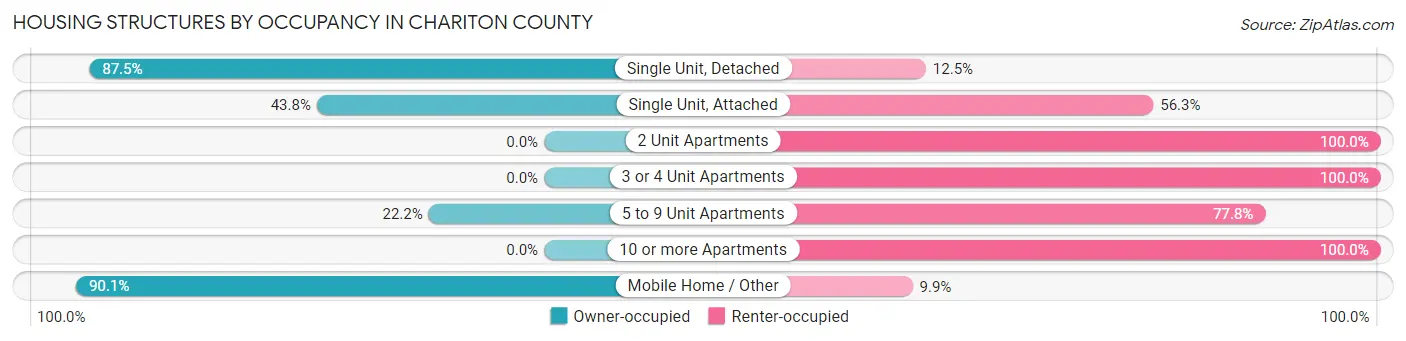
| Structure Type | Owner-occupied | Renter-occupied |
| Single Unit, Detached | 1,925 (87.5%) | 274 (12.5%) |
| Single Unit, Attached | 14 (43.8%) | 18 (56.2%) |
| 2 Unit Apartments | 0 (0.0%) | 50 (100.0%) |
| 3 or 4 Unit Apartments | 0 (0.0%) | 79 (100.0%) |
| 5 to 9 Unit Apartments | 4 (22.2%) | 14 (77.8%) |
| 10 or more Apartments | 0 (0.0%) | 21 (100.0%) |
| Mobile Home / Other | 173 (90.1%) | 19 (9.9%) |
| Total | 2,116 (81.7%) | 475 (18.3%) |
Housing Structures by Number of Rooms in Chariton County
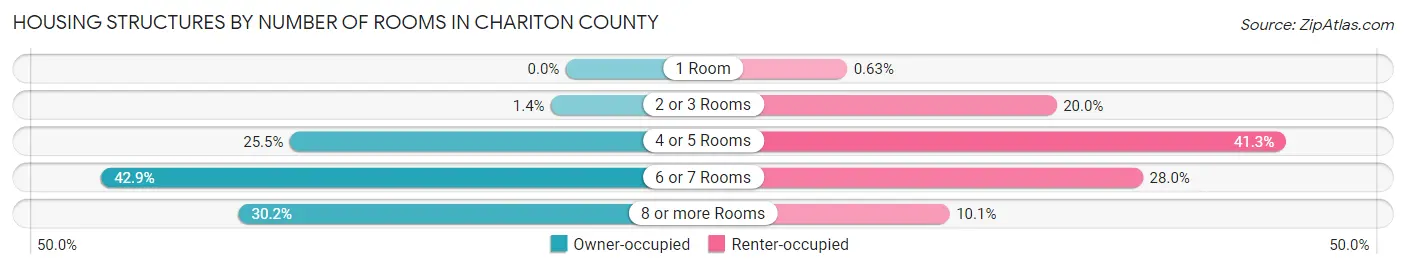
| Number of Rooms | Owner-occupied | Renter-occupied |
| 1 Room | 0 (0.0%) | 3 (0.6%) |
| 2 or 3 Rooms | 29 (1.4%) | 95 (20.0%) |
| 4 or 5 Rooms | 540 (25.5%) | 196 (41.3%) |
| 6 or 7 Rooms | 908 (42.9%) | 133 (28.0%) |
| 8 or more Rooms | 639 (30.2%) | 48 (10.1%) |
| Total | 2,116 (100.0%) | 475 (100.0%) |
Housing Structure by Heating Type in Chariton County
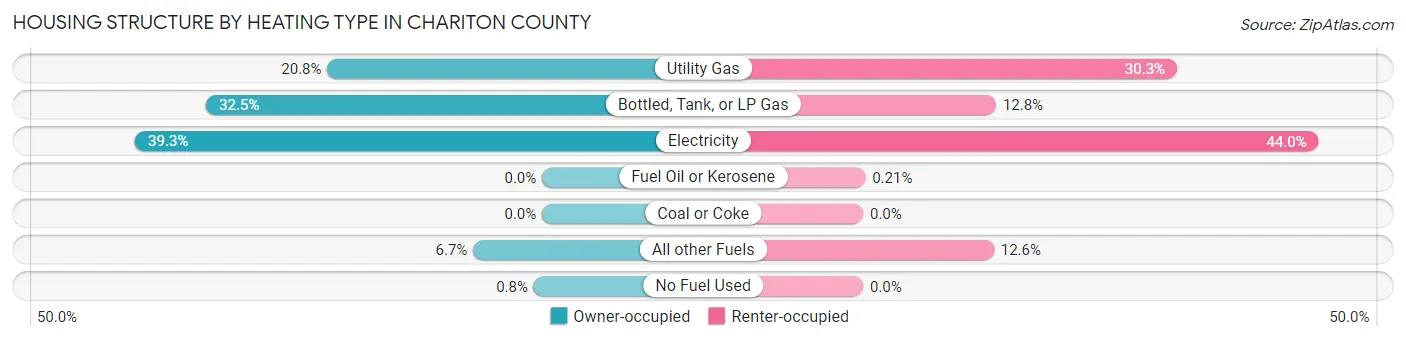
| Heating Type | Owner-occupied | Renter-occupied |
| Utility Gas | 439 (20.7%) | 144 (30.3%) |
| Bottled, Tank, or LP Gas | 687 (32.5%) | 61 (12.8%) |
| Electricity | 832 (39.3%) | 209 (44.0%) |
| Fuel Oil or Kerosene | 0 (0.0%) | 1 (0.2%) |
| Coal or Coke | 0 (0.0%) | 0 (0.0%) |
| All other Fuels | 141 (6.7%) | 60 (12.6%) |
| No Fuel Used | 17 (0.8%) | 0 (0.0%) |
| Total | 2,116 (100.0%) | 475 (100.0%) |
Household Vehicle Usage in Chariton County
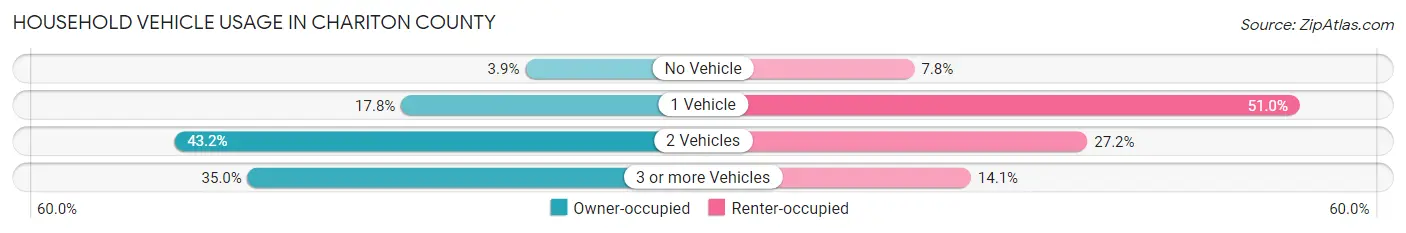
| Vehicles per Household | Owner-occupied | Renter-occupied |
| No Vehicle | 83 (3.9%) | 37 (7.8%) |
| 1 Vehicle | 377 (17.8%) | 242 (50.9%) |
| 2 Vehicles | 915 (43.2%) | 129 (27.2%) |
| 3 or more Vehicles | 741 (35.0%) | 67 (14.1%) |
| Total | 2,116 (100.0%) | 475 (100.0%) |
Real Estate & Mortgages in Chariton County
Real Estate and Mortgage Overview in Chariton County
| Characteristic | Without Mortgage | With Mortgage |
| Housing Units | 1,321 | 795 |
| Median Property Value | $111,500 | $145,700 |
| Median Household Income | $61,063 | $74 |
| Monthly Housing Costs | $455 | $4 |
| Real Estate Taxes | $889 | $20 |
Property Value by Mortgage Status in Chariton County
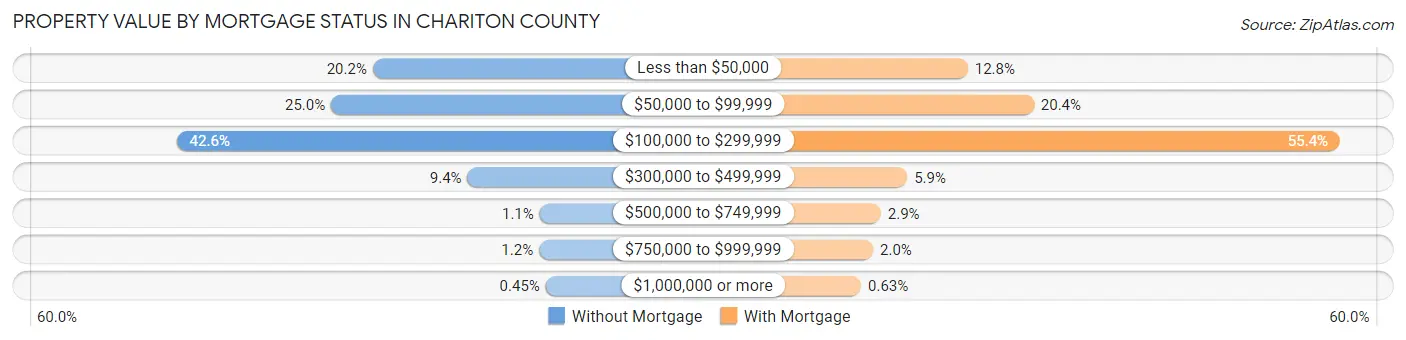
| Property Value | Without Mortgage | With Mortgage |
| Less than $50,000 | 267 (20.2%) | 102 (12.8%) |
| $50,000 to $99,999 | 330 (25.0%) | 162 (20.4%) |
| $100,000 to $299,999 | 563 (42.6%) | 440 (55.3%) |
| $300,000 to $499,999 | 124 (9.4%) | 47 (5.9%) |
| $500,000 to $749,999 | 15 (1.1%) | 23 (2.9%) |
| $750,000 to $999,999 | 16 (1.2%) | 16 (2.0%) |
| $1,000,000 or more | 6 (0.4%) | 5 (0.6%) |
| Total | 1,321 (100.0%) | 795 (100.0%) |
Household Income by Mortgage Status in Chariton County
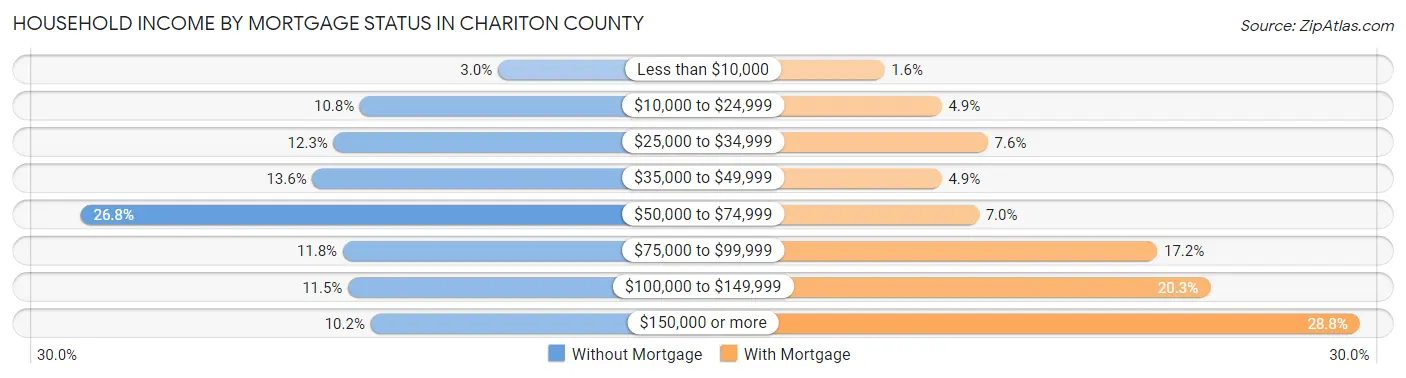
| Household Income | Without Mortgage | With Mortgage |
| Less than $10,000 | 39 (2.9%) | 13 (1.6%) |
| $10,000 to $24,999 | 143 (10.8%) | 39 (4.9%) |
| $25,000 to $34,999 | 163 (12.3%) | 60 (7.5%) |
| $35,000 to $49,999 | 179 (13.6%) | 39 (4.9%) |
| $50,000 to $74,999 | 354 (26.8%) | 56 (7.0%) |
| $75,000 to $99,999 | 156 (11.8%) | 137 (17.2%) |
| $100,000 to $149,999 | 152 (11.5%) | 161 (20.3%) |
| $150,000 or more | 135 (10.2%) | 229 (28.8%) |
| Total | 1,321 (100.0%) | 795 (100.0%) |
Property Value to Household Income Ratio in Chariton County
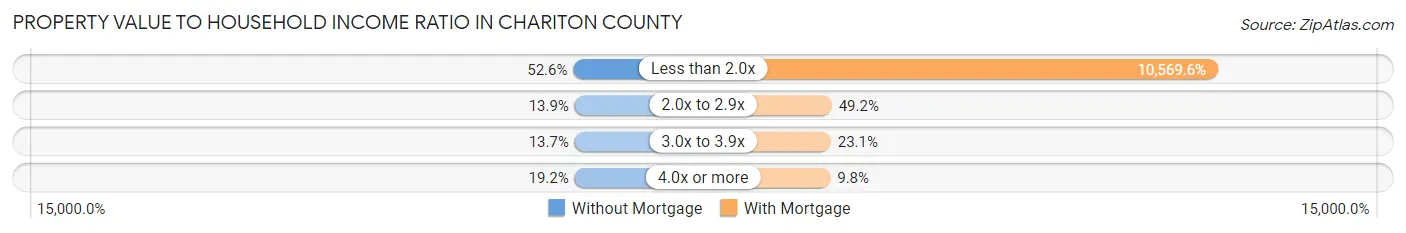
| Value-to-Income Ratio | Without Mortgage | With Mortgage |
| Less than 2.0x | 695 (52.6%) | 84,028 (10,569.6%) |
| 2.0x to 2.9x | 183 (13.9%) | 391 (49.2%) |
| 3.0x to 3.9x | 181 (13.7%) | 184 (23.1%) |
| 4.0x or more | 254 (19.2%) | 78 (9.8%) |
| Total | 1,321 (100.0%) | 795 (100.0%) |
Real Estate Taxes by Mortgage Status in Chariton County
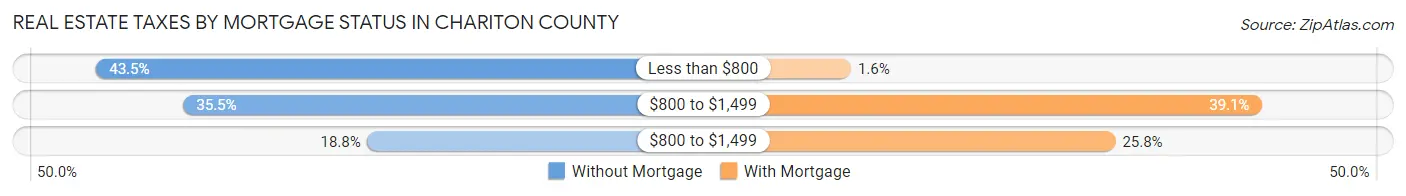
| Property Taxes | Without Mortgage | With Mortgage |
| Less than $800 | 574 (43.4%) | 13 (1.6%) |
| $800 to $1,499 | 469 (35.5%) | 311 (39.1%) |
| $800 to $1,499 | 248 (18.8%) | 205 (25.8%) |
| Total | 1,321 (100.0%) | 795 (100.0%) |
Health & Disability in Chariton County
Health Insurance Coverage by Age in Chariton County
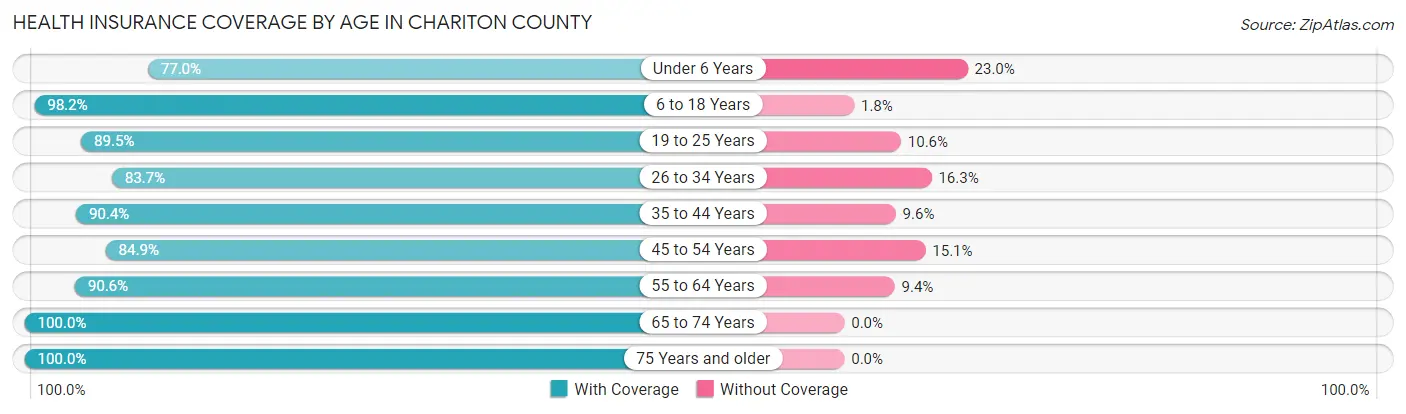
| Age Bracket | With Coverage | Without Coverage |
| Under 6 Years | 402 (77.0%) | 120 (23.0%) |
| 6 to 18 Years | 1,240 (98.2%) | 23 (1.8%) |
| 19 to 25 Years | 390 (89.4%) | 46 (10.5%) |
| 26 to 34 Years | 551 (83.7%) | 107 (16.3%) |
| 35 to 44 Years | 661 (90.4%) | 70 (9.6%) |
| 45 to 54 Years | 651 (84.9%) | 116 (15.1%) |
| 55 to 64 Years | 966 (90.6%) | 100 (9.4%) |
| 65 to 74 Years | 931 (100.0%) | 0 (0.0%) |
| 75 Years and older | 809 (100.0%) | 0 (0.0%) |
| Total | 6,601 (91.9%) | 582 (8.1%) |
Health Insurance Coverage by Citizenship Status in Chariton County
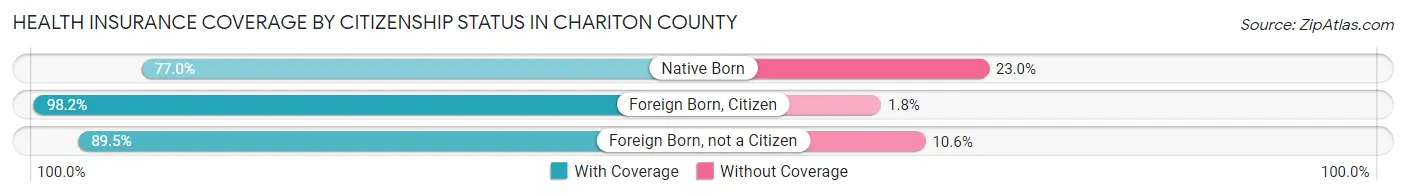
| Citizenship Status | With Coverage | Without Coverage |
| Native Born | 402 (77.0%) | 120 (23.0%) |
| Foreign Born, Citizen | 1,240 (98.2%) | 23 (1.8%) |
| Foreign Born, not a Citizen | 390 (89.4%) | 46 (10.5%) |
Health Insurance Coverage by Household Income in Chariton County
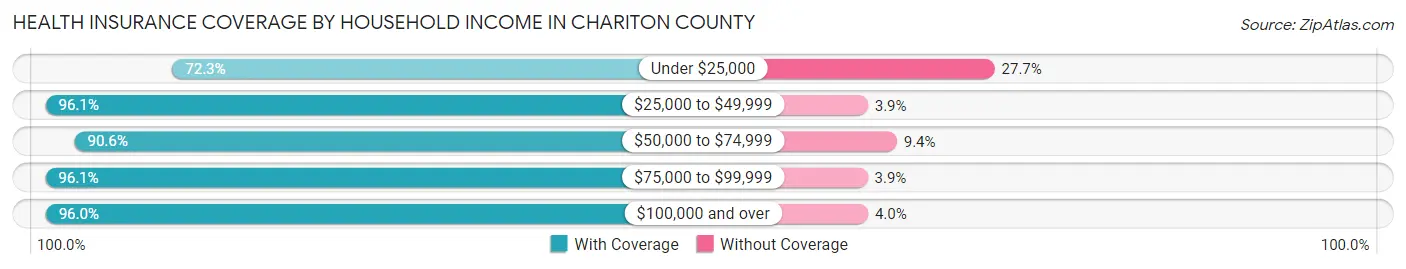
| Household Income | With Coverage | Without Coverage |
| Under $25,000 | 632 (72.3%) | 242 (27.7%) |
| $25,000 to $49,999 | 1,223 (96.1%) | 50 (3.9%) |
| $50,000 to $74,999 | 1,431 (90.6%) | 148 (9.4%) |
| $75,000 to $99,999 | 1,035 (96.1%) | 42 (3.9%) |
| $100,000 and over | 2,280 (96.0%) | 94 (4.0%) |
Public vs Private Health Insurance Coverage by Age in Chariton County
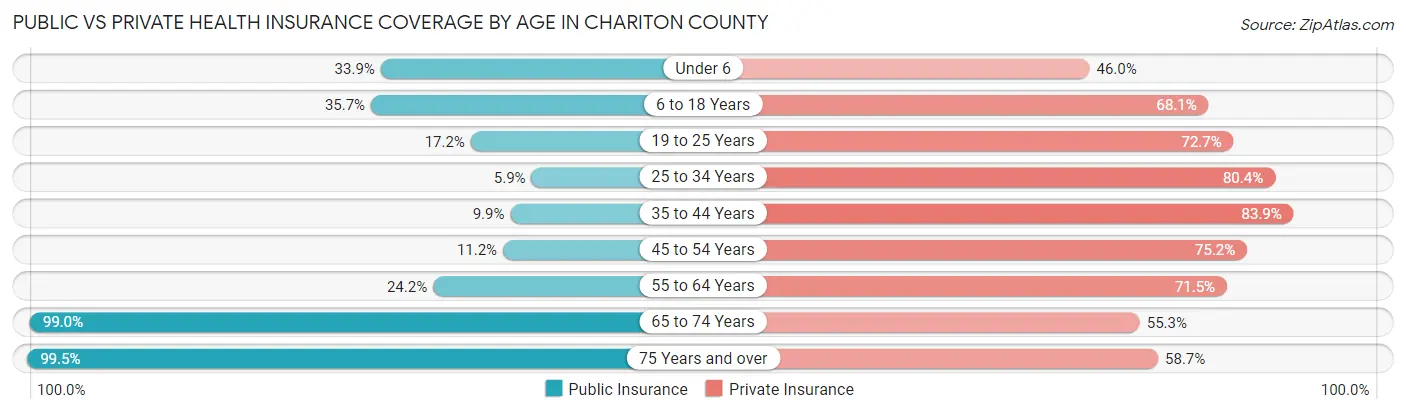
| Age Bracket | Public Insurance | Private Insurance |
| Under 6 | 177 (33.9%) | 240 (46.0%) |
| 6 to 18 Years | 451 (35.7%) | 860 (68.1%) |
| 19 to 25 Years | 75 (17.2%) | 317 (72.7%) |
| 25 to 34 Years | 39 (5.9%) | 529 (80.4%) |
| 35 to 44 Years | 72 (9.9%) | 613 (83.9%) |
| 45 to 54 Years | 86 (11.2%) | 577 (75.2%) |
| 55 to 64 Years | 258 (24.2%) | 762 (71.5%) |
| 65 to 74 Years | 922 (99.0%) | 515 (55.3%) |
| 75 Years and over | 805 (99.5%) | 475 (58.7%) |
| Total | 2,885 (40.2%) | 4,888 (68.0%) |
Disability Status by Sex by Age in Chariton County
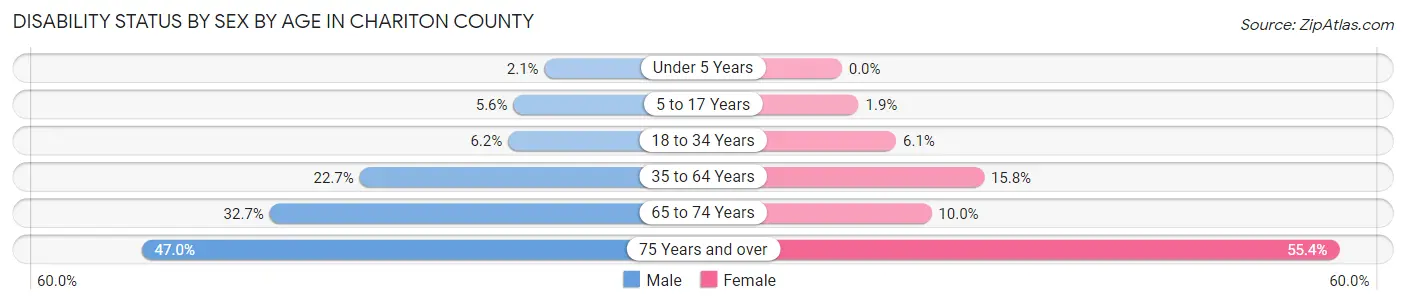
| Age Bracket | Male | Female |
| Under 5 Years | 5 (2.1%) | 0 (0.0%) |
| 5 to 17 Years | 36 (5.6%) | 11 (1.9%) |
| 18 to 34 Years | 38 (6.2%) | 36 (6.0%) |
| 35 to 64 Years | 291 (22.7%) | 203 (15.8%) |
| 65 to 74 Years | 157 (32.7%) | 45 (10.0%) |
| 75 Years and over | 162 (47.0%) | 257 (55.4%) |
Disability Class by Sex by Age in Chariton County
Disability Class: Hearing Difficulty
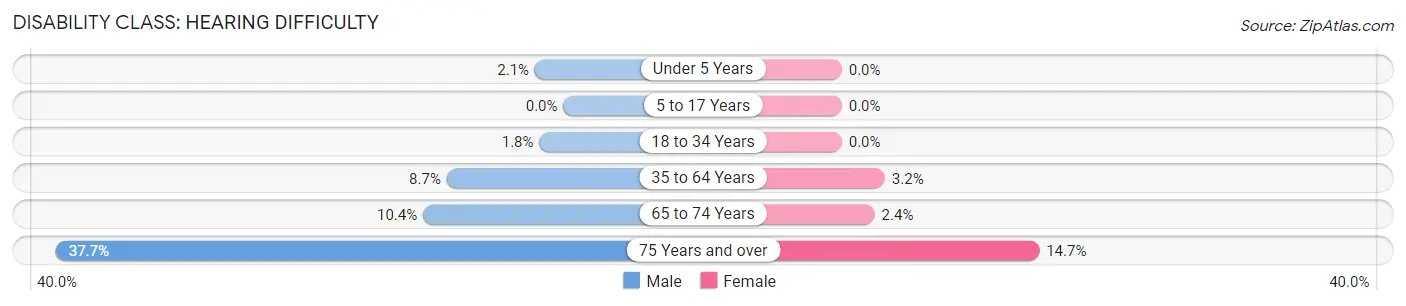
| Age Bracket | Male | Female |
| Under 5 Years | 5 (2.1%) | 0 (0.0%) |
| 5 to 17 Years | 0 (0.0%) | 0 (0.0%) |
| 18 to 34 Years | 11 (1.8%) | 0 (0.0%) |
| 35 to 64 Years | 111 (8.7%) | 41 (3.2%) |
| 65 to 74 Years | 50 (10.4%) | 11 (2.4%) |
| 75 Years and over | 130 (37.7%) | 68 (14.7%) |
Disability Class: Vision Difficulty
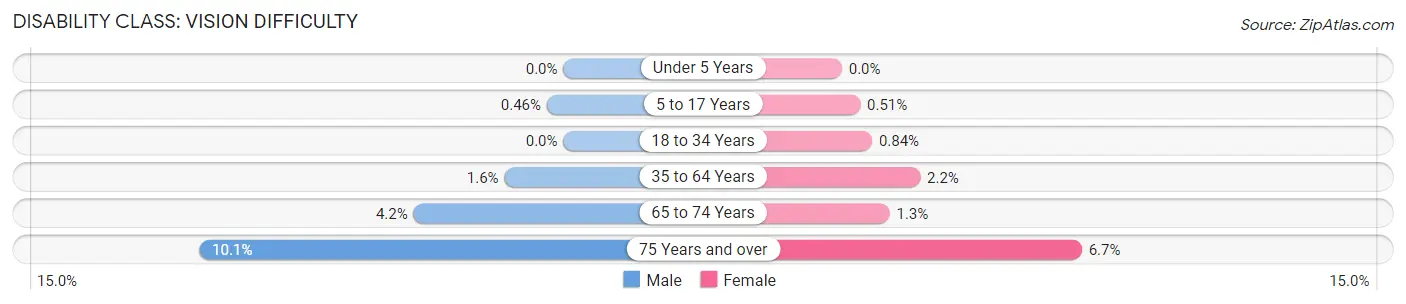
| Age Bracket | Male | Female |
| Under 5 Years | 0 (0.0%) | 0 (0.0%) |
| 5 to 17 Years | 3 (0.5%) | 3 (0.5%) |
| 18 to 34 Years | 0 (0.0%) | 5 (0.8%) |
| 35 to 64 Years | 21 (1.6%) | 28 (2.2%) |
| 65 to 74 Years | 20 (4.2%) | 6 (1.3%) |
| 75 Years and over | 35 (10.1%) | 31 (6.7%) |
Disability Class: Cognitive Difficulty
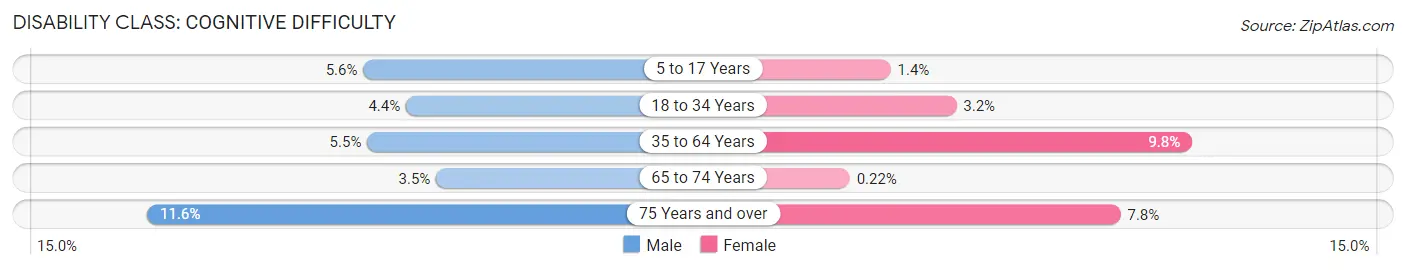
| Age Bracket | Male | Female |
| 5 to 17 Years | 36 (5.6%) | 8 (1.4%) |
| 18 to 34 Years | 27 (4.4%) | 19 (3.2%) |
| 35 to 64 Years | 70 (5.5%) | 125 (9.8%) |
| 65 to 74 Years | 17 (3.5%) | 1 (0.2%) |
| 75 Years and over | 40 (11.6%) | 36 (7.8%) |
Disability Class: Ambulatory Difficulty
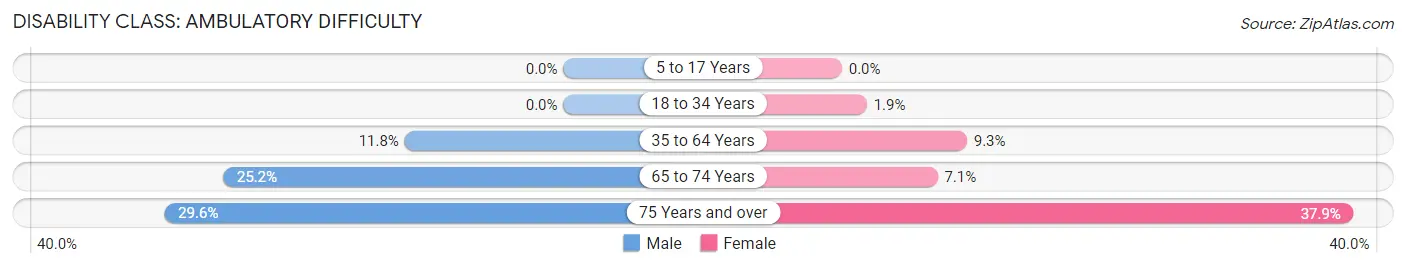
| Age Bracket | Male | Female |
| 5 to 17 Years | 0 (0.0%) | 0 (0.0%) |
| 18 to 34 Years | 0 (0.0%) | 11 (1.8%) |
| 35 to 64 Years | 151 (11.8%) | 119 (9.3%) |
| 65 to 74 Years | 121 (25.2%) | 32 (7.1%) |
| 75 Years and over | 102 (29.6%) | 176 (37.9%) |
Disability Class: Self-Care Difficulty
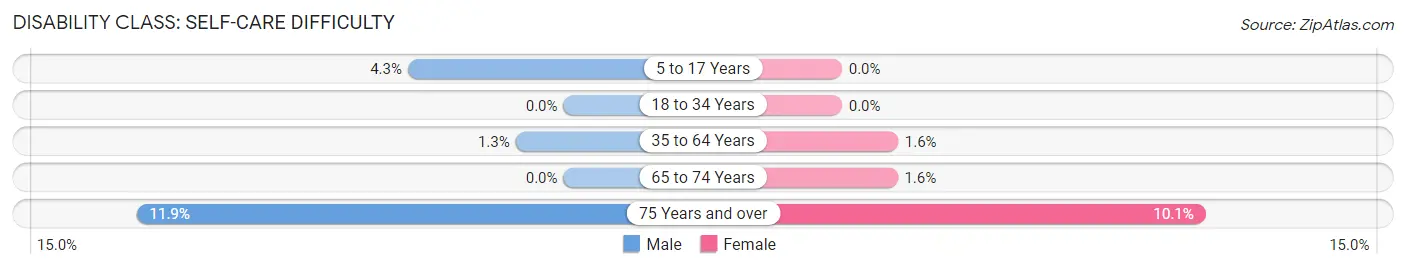
| Age Bracket | Male | Female |
| 5 to 17 Years | 28 (4.3%) | 0 (0.0%) |
| 18 to 34 Years | 0 (0.0%) | 0 (0.0%) |
| 35 to 64 Years | 17 (1.3%) | 20 (1.6%) |
| 65 to 74 Years | 0 (0.0%) | 7 (1.5%) |
| 75 Years and over | 41 (11.9%) | 47 (10.1%) |
Technology Access in Chariton County
Computing Device Access in Chariton County
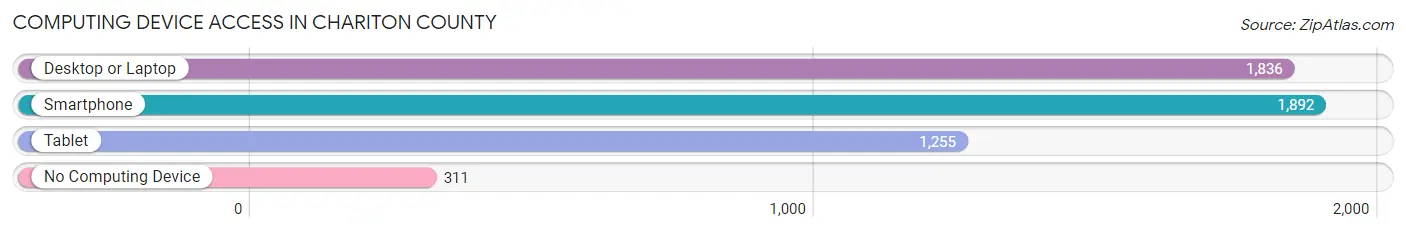
| Device Type | # Households | % Households |
| Desktop or Laptop | 1,836 | 70.9% |
| Smartphone | 1,892 | 73.0% |
| Tablet | 1,255 | 48.4% |
| No Computing Device | 311 | 12.0% |
| Total | 2,591 | 100.0% |
Internet Access in Chariton County
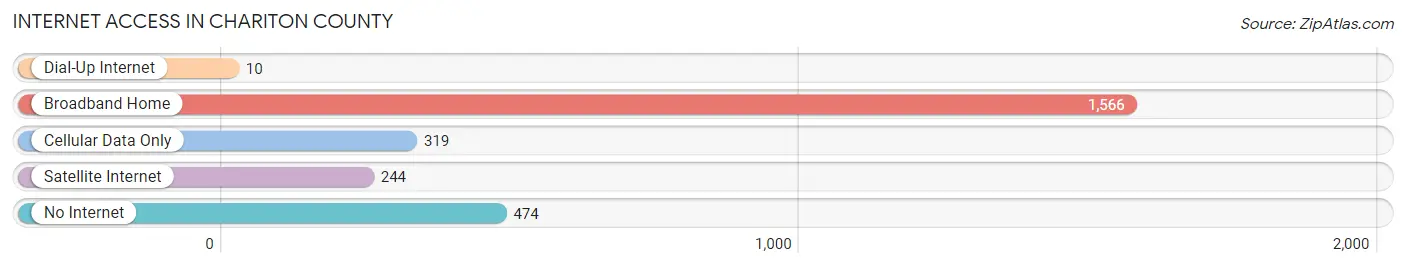
| Internet Type | # Households | % Households |
| Dial-Up Internet | 10 | 0.4% |
| Broadband Home | 1,566 | 60.4% |
| Cellular Data Only | 319 | 12.3% |
| Satellite Internet | 244 | 9.4% |
| No Internet | 474 | 18.3% |
| Total | 2,591 | 100.0% |
Chariton County Summary
Chariton County is located in the northern part of Missouri, in the United States. It is bordered by Adair County to the north, Macon County to the east, Randolph County to the south, and Linn County to the west. The county seat is Keytesville, and the largest city is Salisbury. The county was organized in 1820 and named after the Chariton River, which runs through the county.
Geography
Chariton County covers an area of 576 square miles, with a population of 8,845 people as of the 2020 census. The county is mostly rural, with rolling hills and wooded areas. The highest point in the county is located in the northwest corner, at an elevation of 1,039 feet. The Chariton River runs through the county, and there are several small lakes and ponds scattered throughout.
The climate of Chariton County is humid continental, with hot summers and cold winters. The average annual temperature is around 54°F, and the average annual precipitation is around 40 inches.
Economy
The economy of Chariton County is largely based on agriculture. The county is home to several large farms, and the main crops grown are corn, soybeans, wheat, and hay. Livestock production is also important, with cattle, hogs, and poultry being the main animals raised.
The county also has a small manufacturing sector, with several small factories producing a variety of products. There are also several small businesses in the county, including restaurants, retail stores, and service providers.
Demographics
As of the 2020 census, the population of Chariton County was 8,845 people. The racial makeup of the county was 95.3% White, 1.7% Black or African American, 0.3% Native American, 0.2% Asian, 0.1% Pacific Islander, 0.7% from other races, and 1.9% from two or more races. Hispanic or Latino of any race were 2.2% of the population.
The median household income in Chariton County was $41,945, and the median family income was $50,945. The per capita income was $20,945. About 11.3% of the population was below the poverty line.
Education
Chariton County is served by the Keytesville R-III School District, which includes Keytesville Elementary School, Keytesville Middle School, and Keytesville High School. There are also several private schools in the county, including Salisbury Christian Academy and St. Joseph Catholic School.
The county is also home to Central Methodist University, a private liberal arts university located in Fayette. The university offers a variety of undergraduate and graduate degree programs.
Conclusion
Chariton County is a rural county located in northern Missouri. It is home to a variety of agricultural and manufacturing businesses, and the population is mostly White. The county is served by the Keytesville R-III School District, as well as several private schools. Central Methodist University is also located in the county.
Common Questions
What is Per Capita Income in Chariton County?
Per Capita income in Chariton County is $28,616.
What is the Median Family Income in Chariton County?
Median Family Income in Chariton County is $74,349.
What is the Median Household income in Chariton County?
Median Household Income in Chariton County is $61,910.
What is Income or Wage Gap in Chariton County?
Income or Wage Gap in Chariton County is 23.4%.
Women in Chariton County earn 76.6 cents for every dollar earned by a man.
What is Family Income Deficit in Chariton County?
Family Income Deficit in Chariton County is $10,031.
Families that are below poverty line in Chariton County earn $10,031 less on average than the poverty threshold level.
What is Inequality or Gini Index in Chariton County?
Inequality or Gini Index in Chariton County is 0.41.
What is the Total Population of Chariton County?
Total Population of Chariton County is 7,417.
What is the Total Male Population of Chariton County?
Total Male Population of Chariton County is 3,706.
What is the Total Female Population of Chariton County?
Total Female Population of Chariton County is 3,711.
What is the Ratio of Males per 100 Females in Chariton County?
There are 99.87 Males per 100 Females in Chariton County.
What is the Ratio of Females per 100 Males in Chariton County?
There are 100.13 Females per 100 Males in Chariton County.
What is the Median Population Age in Chariton County?
Median Population Age in Chariton County is 45.7 Years.
What is the Average Family Size in Chariton County
Average Family Size in Chariton County is 3.5 People.
What is the Average Household Size in Chariton County
Average Household Size in Chariton County is 2.8 People.
How Large is the Labor Force in Chariton County?
There are 3,345 People in the Labor Forcein in Chariton County.
What is the Percentage of People in the Labor Force in Chariton County?
56.1% of People are in the Labor Force in Chariton County.
What is the Unemployment Rate in Chariton County?
Unemployment Rate in Chariton County is 4.3%.