Cedar County, MO Map & Demographics
Cedar County Map
Cedar County Overview
$27,243
PER CAPITA INCOME
$57,762
AVG FAMILY INCOME
$43,589
AVG HOUSEHOLD INCOME
41.7%
WAGE / INCOME GAP [ % ]
58.3¢/ $1
WAGE / INCOME GAP [ $ ]
$11,302
FAMILY INCOME DEFICIT
0.53
INEQUALITY / GINI INDEX
14,314
TOTAL POPULATION
7,313
MALE POPULATION
7,001
FEMALE POPULATION
104.46
MALES / 100 FEMALES
95.73
FEMALES / 100 MALES
44.8
MEDIAN AGE
3.3
AVG FAMILY SIZE
2.6
AVG HOUSEHOLD SIZE
5,499
LABOR FORCE [ PEOPLE ]
48.3%
PERCENT IN LABOR FORCE
2.5%
UNEMPLOYMENT RATE
Cedar County Area Codes
Income in Cedar County
Income Overview in Cedar County
Per Capita Income in Cedar County is $27,243, while median incomes of families and households are $57,762 and $43,589 respectively.
| Characteristic | Number | Measure |
| Per Capita Income | 14,314 | $27,243 |
| Median Family Income | 3,517 | $57,762 |
| Mean Family Income | 3,517 | $92,858 |
| Median Household Income | 5,476 | $43,589 |
| Mean Household Income | 5,476 | $72,146 |
| Income Deficit | 3,517 | $11,302 |
| Wage / Income Gap (%) | 14,314 | 41.68% |
| Wage / Income Gap ($) | 14,314 | 58.32¢ per $1 |
| Gini / Inequality Index | 14,314 | 0.53 |
Earnings by Sex in Cedar County
Average Earnings in Cedar County are $25,878, $38,710 for men and $22,574 for women, a difference of 41.7%.
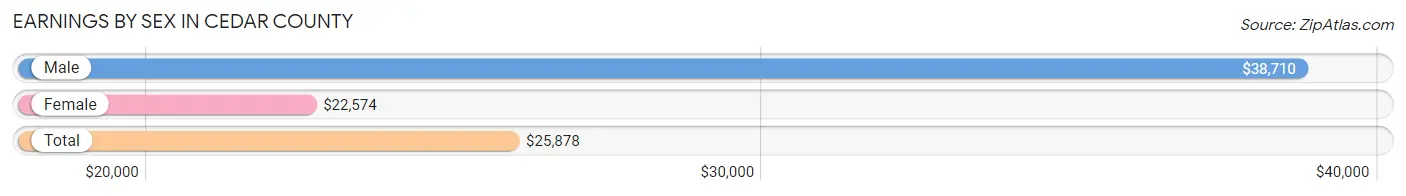
| Sex | Number | Average Earnings |
| Male | 3,144 (52.9%) | $38,710 |
| Female | 2,800 (47.1%) | $22,574 |
| Total | 5,944 (100.0%) | $25,878 |
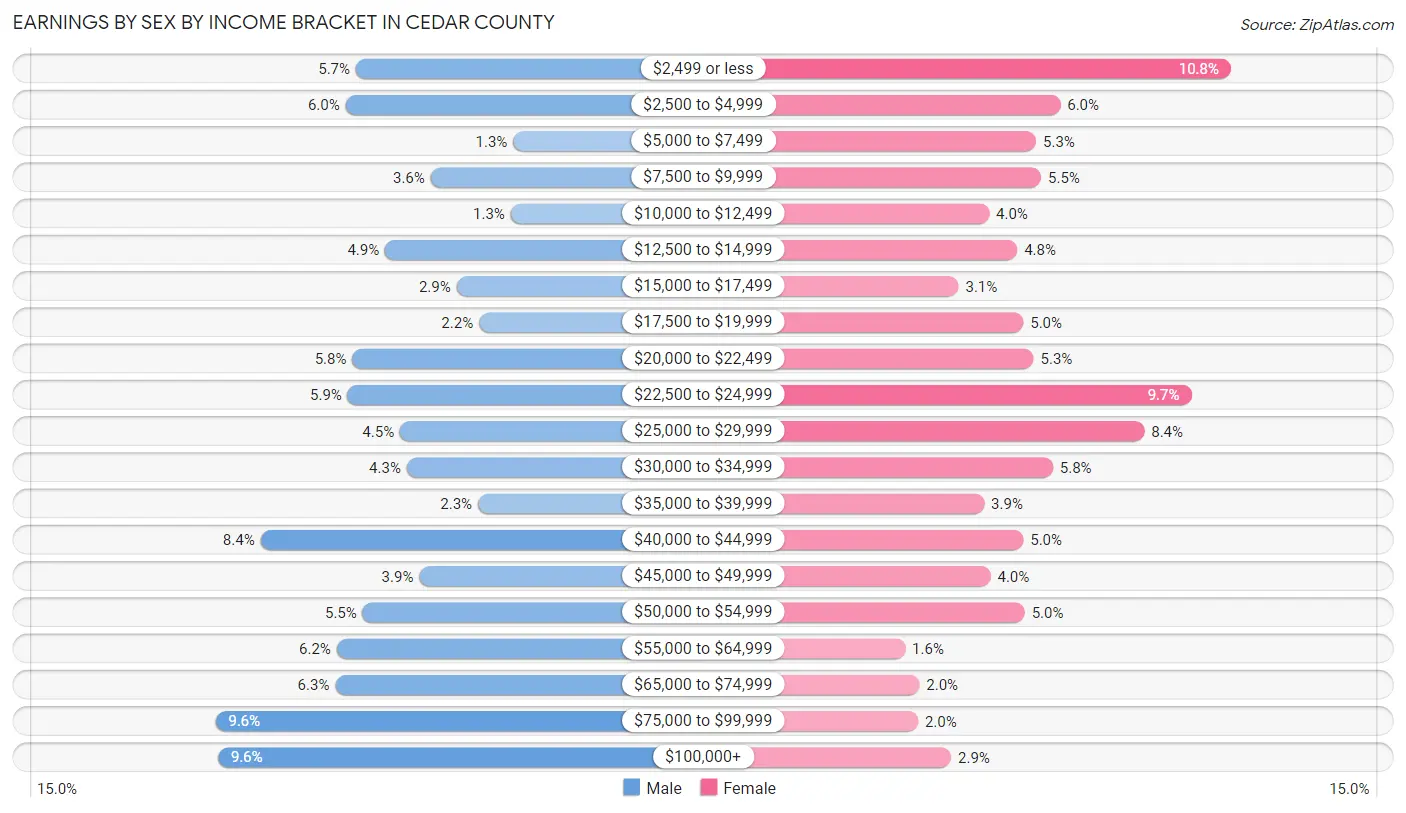
Earnings by Sex by Income Bracket in Cedar County
The most common earnings brackets in Cedar County are $75,000 to $99,999 for men (303 | 9.6%) and $2,499 or less for women (302 | 10.8%).
| Income | Male | Female |
| $2,499 or less | 179 (5.7%) | 302 (10.8%) |
| $2,500 to $4,999 | 188 (6.0%) | 168 (6.0%) |
| $5,000 to $7,499 | 40 (1.3%) | 149 (5.3%) |
| $7,500 to $9,999 | 113 (3.6%) | 153 (5.5%) |
| $10,000 to $12,499 | 42 (1.3%) | 112 (4.0%) |
| $12,500 to $14,999 | 153 (4.9%) | 134 (4.8%) |
| $15,000 to $17,499 | 90 (2.9%) | 88 (3.1%) |
| $17,500 to $19,999 | 70 (2.2%) | 139 (5.0%) |
| $20,000 to $22,499 | 182 (5.8%) | 147 (5.2%) |
| $22,500 to $24,999 | 186 (5.9%) | 271 (9.7%) |
| $25,000 to $29,999 | 140 (4.4%) | 234 (8.4%) |
| $30,000 to $34,999 | 134 (4.3%) | 162 (5.8%) |
| $35,000 to $39,999 | 71 (2.3%) | 108 (3.9%) |
| $40,000 to $44,999 | 263 (8.4%) | 139 (5.0%) |
| $45,000 to $49,999 | 123 (3.9%) | 113 (4.0%) |
| $50,000 to $54,999 | 173 (5.5%) | 140 (5.0%) |
| $55,000 to $64,999 | 196 (6.2%) | 46 (1.6%) |
| $65,000 to $74,999 | 197 (6.3%) | 57 (2.0%) |
| $75,000 to $99,999 | 303 (9.6%) | 56 (2.0%) |
| $100,000+ | 301 (9.6%) | 82 (2.9%) |
| Total | 3,144 (100.0%) | 2,800 (100.0%) |
Earnings by Sex by Educational Attainment in Cedar County
Average earnings in Cedar County are $42,885 for men and $23,509 for women, a difference of 45.2%. Men with an educational attainment of college or associate's degree enjoy the highest average annual earnings of $53,958, while those with high school diploma education earn the least with $29,085. Women with an educational attainment of bachelor's degree earn the most with the average annual earnings of $41,136, while those with high school diploma education have the smallest earnings of $20,393.
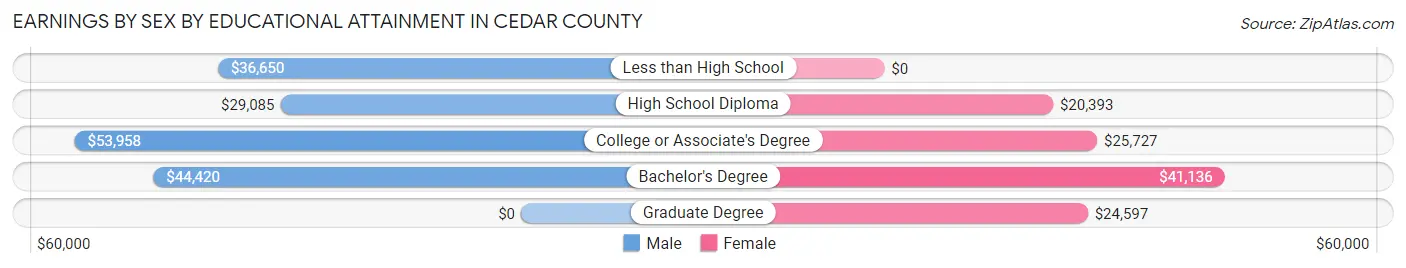
| Educational Attainment | Male Income | Female Income |
| Less than High School | $36,650 | $0 |
| High School Diploma | $29,085 | $20,393 |
| College or Associate's Degree | $53,958 | $25,727 |
| Bachelor's Degree | $44,420 | $41,136 |
| Graduate Degree | - | - |
| Total | $42,885 | $23,509 |
Family Income in Cedar County
Family Income Brackets in Cedar County
According to the Cedar County family income data, there are 647 families falling into the $50,000 to $74,999 income range, which is the most common income bracket and makes up 18.4% of all families. Conversely, the $10,000 to $14,999 income bracket is the least frequent group with only 46 families (1.3%) belonging to this category.
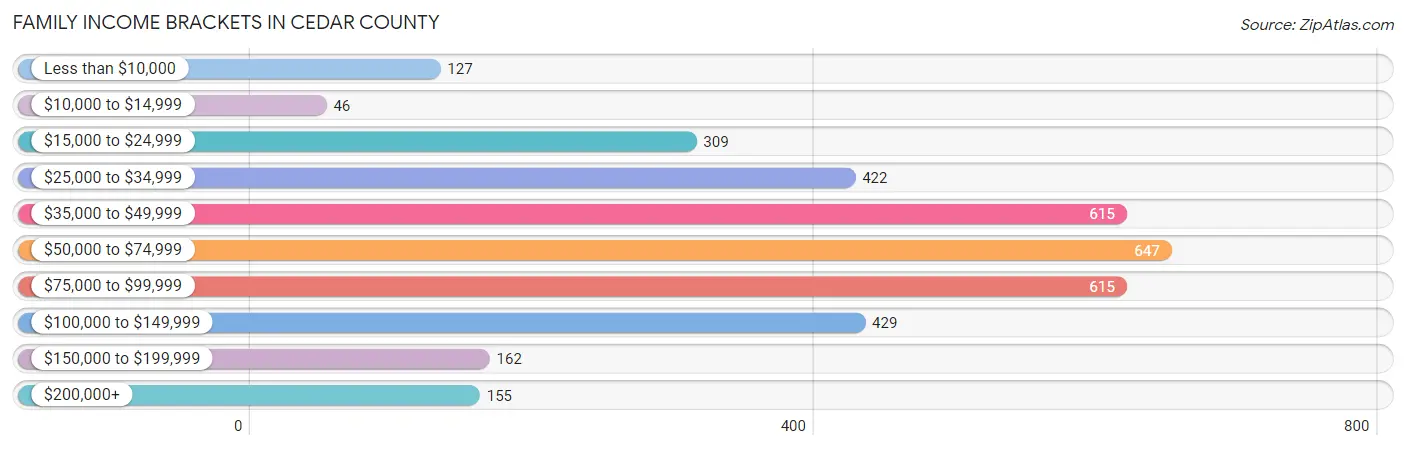
| Income Bracket | # Families | % Families |
| Less than $10,000 | 127 | 3.6% |
| $10,000 to $14,999 | 46 | 1.3% |
| $15,000 to $24,999 | 309 | 8.8% |
| $25,000 to $34,999 | 422 | 12.0% |
| $35,000 to $49,999 | 615 | 17.5% |
| $50,000 to $74,999 | 647 | 18.4% |
| $75,000 to $99,999 | 615 | 17.5% |
| $100,000 to $149,999 | 429 | 12.2% |
| $150,000 to $199,999 | 162 | 4.6% |
| $200,000+ | 155 | 4.4% |
Family Income by Famaliy Size in Cedar County
5-person families (446 | 12.7%) account for the highest median family income in Cedar County with $86,250 per family, while 3-person families (476 | 13.5%) have the highest median income of $25,965 per family member.
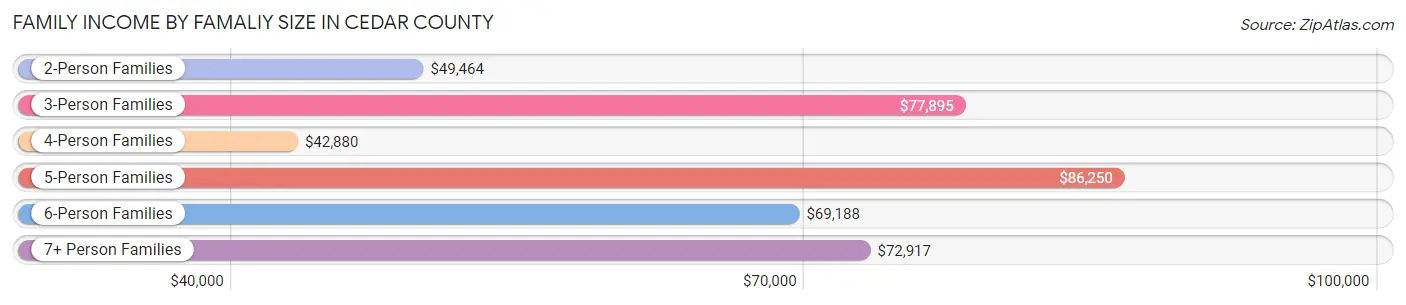
| Income Bracket | # Families | Median Income |
| 2-Person Families | 1,980 (56.3%) | $49,464 |
| 3-Person Families | 476 (13.5%) | $77,895 |
| 4-Person Families | 391 (11.1%) | $42,880 |
| 5-Person Families | 446 (12.7%) | $86,250 |
| 6-Person Families | 69 (2.0%) | $69,188 |
| 7+ Person Families | 155 (4.4%) | $72,917 |
| Total | 3,517 (100.0%) | $57,762 |
Family Income by Number of Earners in Cedar County
The median family income in Cedar County is $57,762, with families comprising 2 earners (1,577) having the highest median family income of $80,819, while families with no earners (990) have the lowest median family income of $33,750, accounting for 44.8% and 28.1% of families, respectively.
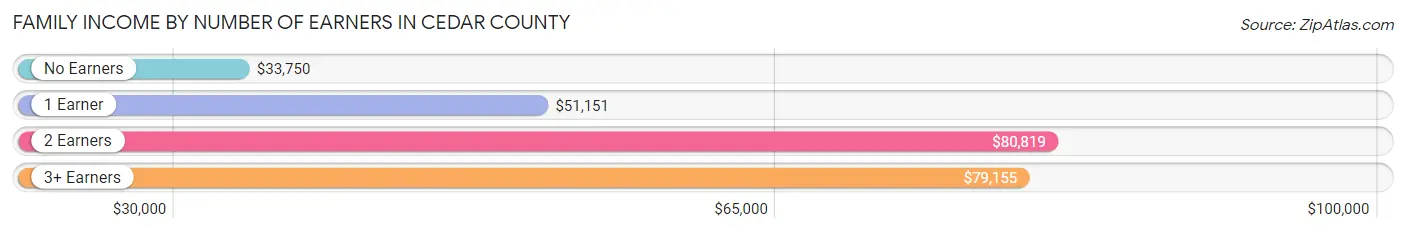
| Number of Earners | # Families | Median Income |
| No Earners | 990 (28.1%) | $33,750 |
| 1 Earner | 794 (22.6%) | $51,151 |
| 2 Earners | 1,577 (44.8%) | $80,819 |
| 3+ Earners | 156 (4.4%) | $79,155 |
| Total | 3,517 (100.0%) | $57,762 |
Household Income in Cedar County
Household Income Brackets in Cedar County
With 986 households falling in the category, the $15,000 to $24,999 income range is the most frequent in Cedar County, accounting for 18.0% of all households. In contrast, only 153 households (2.8%) fall into the $200,000+ income bracket, making it the least populous group.
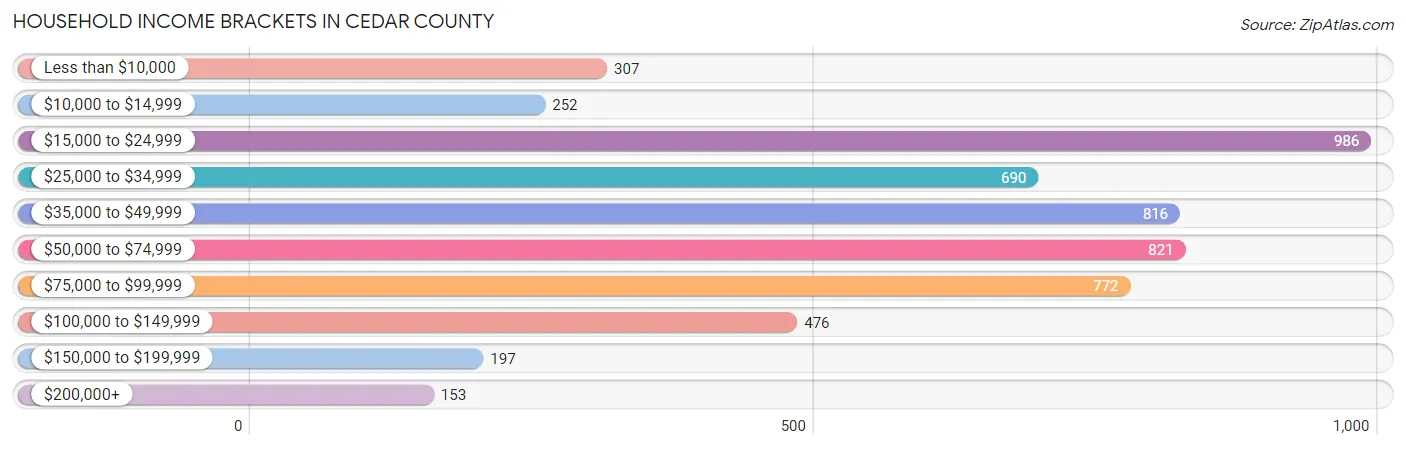
| Income Bracket | # Households | % Households |
| Less than $10,000 | 307 | 5.6% |
| $10,000 to $14,999 | 252 | 4.6% |
| $15,000 to $24,999 | 986 | 18.0% |
| $25,000 to $34,999 | 690 | 12.6% |
| $35,000 to $49,999 | 816 | 14.9% |
| $50,000 to $74,999 | 821 | 15.0% |
| $75,000 to $99,999 | 772 | 14.1% |
| $100,000 to $149,999 | 476 | 8.7% |
| $150,000 to $199,999 | 197 | 3.6% |
| $200,000+ | 153 | 2.8% |
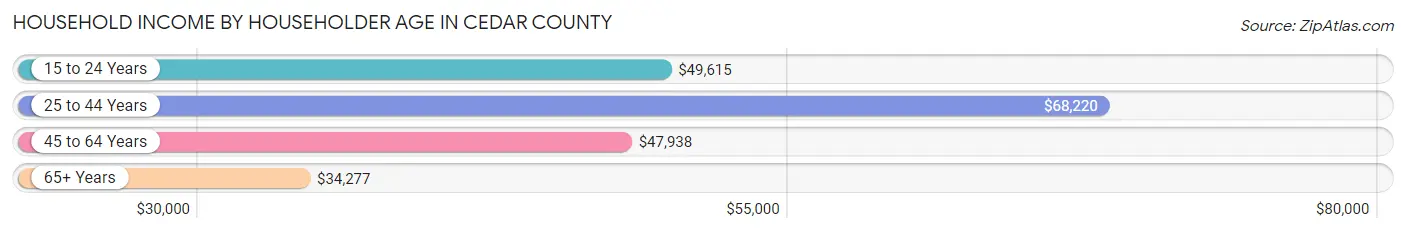
Household Income by Householder Age in Cedar County
The median household income in Cedar County is $43,589, with the highest median household income of $68,220 found in the 25 to 44 years age bracket for the primary householder. A total of 1,174 households (21.4%) fall into this category. Meanwhile, the 65+ years age bracket for the primary householder has the lowest median household income of $34,277, with 2,055 households (37.5%) in this group.
| Income Bracket | # Households | Median Income |
| 15 to 24 Years | 116 (2.1%) | $49,615 |
| 25 to 44 Years | 1,174 (21.4%) | $68,220 |
| 45 to 64 Years | 2,131 (38.9%) | $47,938 |
| 65+ Years | 2,055 (37.5%) | $34,277 |
| Total | 5,476 (100.0%) | $43,589 |
Poverty in Cedar County
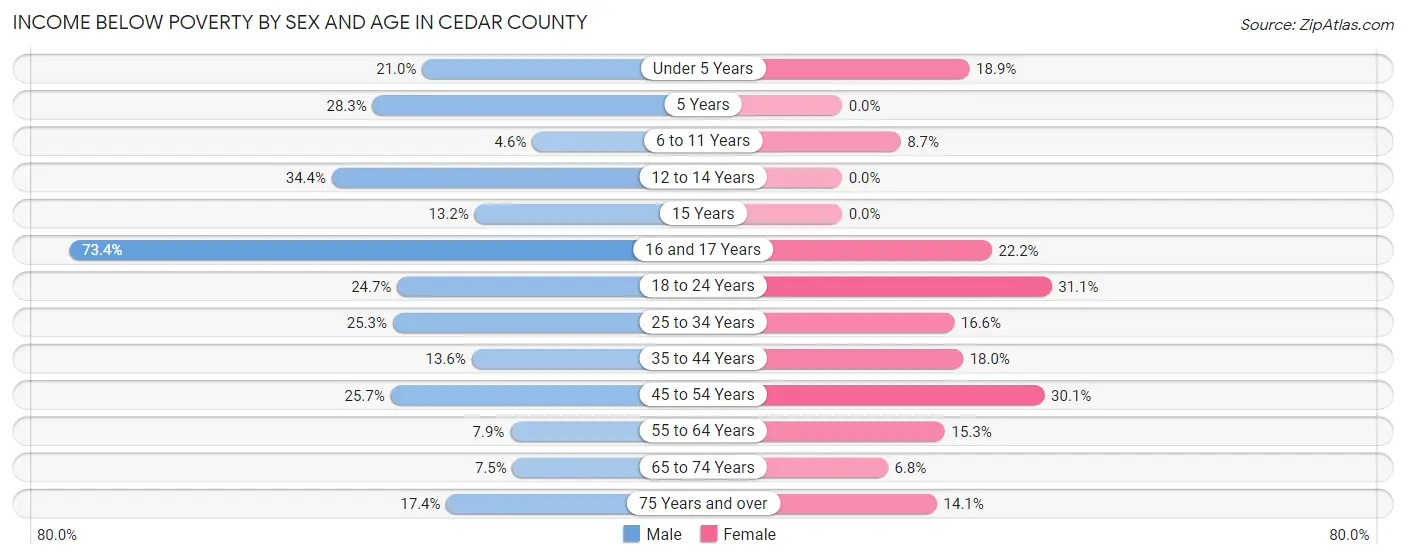
Income Below Poverty by Sex and Age in Cedar County
With 20.1% poverty level for males and 16.5% for females among the residents of Cedar County, 16 and 17 year old males and 18 to 24 year old females are the most vulnerable to poverty, with 204 males (73.4%) and 135 females (31.1%) in their respective age groups living below the poverty level.
| Age Bracket | Male | Female |
| Under 5 Years | 101 (20.9%) | 83 (18.9%) |
| 5 Years | 34 (28.3%) | 0 (0.0%) |
| 6 to 11 Years | 12 (4.6%) | 63 (8.7%) |
| 12 to 14 Years | 195 (34.4%) | 0 (0.0%) |
| 15 Years | 17 (13.2%) | 0 (0.0%) |
| 16 and 17 Years | 204 (73.4%) | 54 (22.2%) |
| 18 to 24 Years | 129 (24.7%) | 135 (31.1%) |
| 25 to 34 Years | 175 (25.3%) | 112 (16.6%) |
| 35 to 44 Years | 93 (13.6%) | 128 (17.9%) |
| 45 to 54 Years | 222 (25.7%) | 241 (30.0%) |
| 55 to 64 Years | 83 (7.9%) | 150 (15.3%) |
| 65 to 74 Years | 68 (7.5%) | 58 (6.8%) |
| 75 Years and over | 111 (17.4%) | 118 (14.1%) |
| Total | 1,444 (20.1%) | 1,142 (16.5%) |
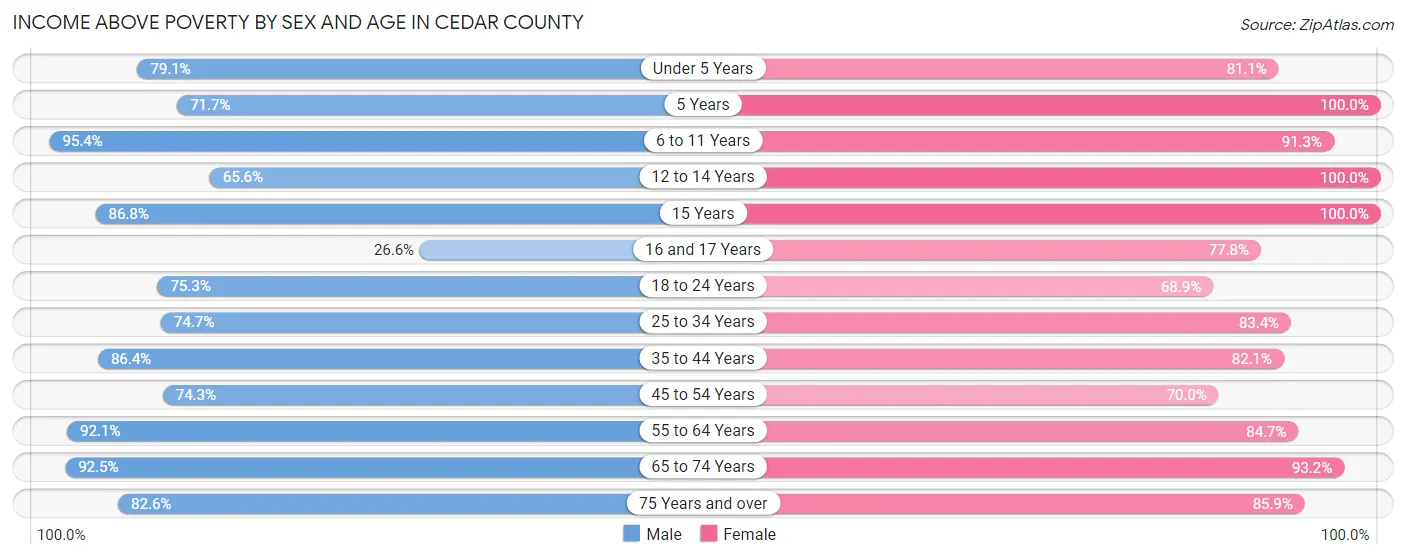
Income Above Poverty by Sex and Age in Cedar County
According to the poverty statistics in Cedar County, males aged 6 to 11 years and females aged 5 years are the age groups that are most secure financially, with 95.4% of males and 100.0% of females in these age groups living above the poverty line.
| Age Bracket | Male | Female |
| Under 5 Years | 381 (79.0%) | 356 (81.1%) |
| 5 Years | 86 (71.7%) | 22 (100.0%) |
| 6 to 11 Years | 248 (95.4%) | 663 (91.3%) |
| 12 to 14 Years | 372 (65.6%) | 103 (100.0%) |
| 15 Years | 112 (86.8%) | 76 (100.0%) |
| 16 and 17 Years | 74 (26.6%) | 189 (77.8%) |
| 18 to 24 Years | 394 (75.3%) | 299 (68.9%) |
| 25 to 34 Years | 516 (74.7%) | 561 (83.4%) |
| 35 to 44 Years | 590 (86.4%) | 585 (82.1%) |
| 45 to 54 Years | 643 (74.3%) | 561 (70.0%) |
| 55 to 64 Years | 969 (92.1%) | 833 (84.7%) |
| 65 to 74 Years | 834 (92.5%) | 796 (93.2%) |
| 75 Years and over | 528 (82.6%) | 720 (85.9%) |
| Total | 5,747 (79.9%) | 5,764 (83.5%) |
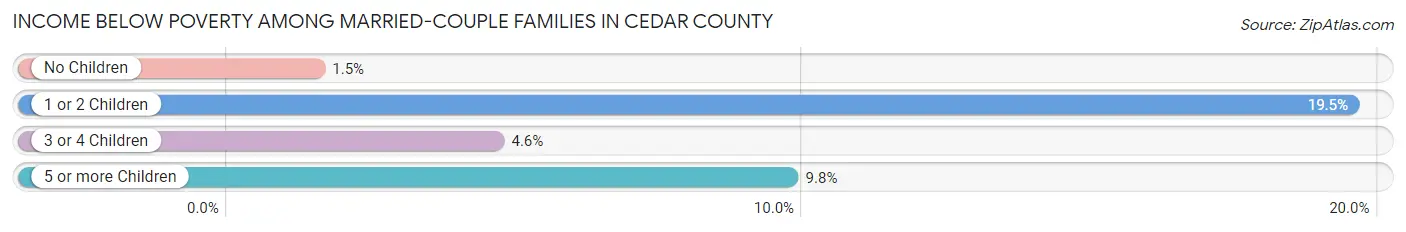
Income Below Poverty Among Married-Couple Families in Cedar County
The poverty statistics for married-couple families in Cedar County show that 6.1% or 177 of the total 2,911 families live below the poverty line. Families with 1 or 2 children have the highest poverty rate of 19.5%, comprising of 125 families. On the other hand, families with no children have the lowest poverty rate of 1.5%, which includes 27 families.
| Children | Above Poverty | Below Poverty |
| No Children | 1,750 (98.5%) | 27 (1.5%) |
| 1 or 2 Children | 515 (80.5%) | 125 (19.5%) |
| 3 or 4 Children | 432 (95.4%) | 21 (4.6%) |
| 5 or more Children | 37 (90.2%) | 4 (9.8%) |
| Total | 2,734 (93.9%) | 177 (6.1%) |
Income Below Poverty Among Single-Parent Households in Cedar County
According to the poverty data in Cedar County, 15.1% or 22 single-father households and 40.6% or 187 single-mother households are living below the poverty line. Among single-father households, those with 1 or 2 children have the highest poverty rate, with 22 households (39.3%) experiencing poverty. Likewise, among single-mother households, those with 1 or 2 children have the highest poverty rate, with 110 households (57.0%) falling below the poverty line.
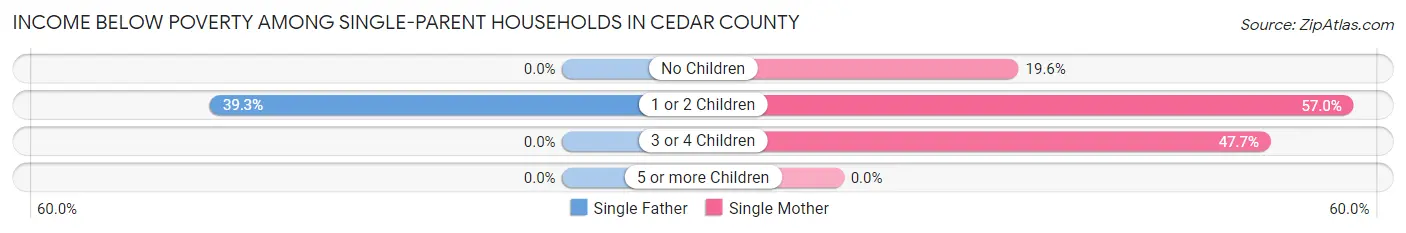
| Children | Single Father | Single Mother |
| No Children | 0 (0.0%) | 35 (19.6%) |
| 1 or 2 Children | 22 (39.3%) | 110 (57.0%) |
| 3 or 4 Children | 0 (0.0%) | 42 (47.7%) |
| 5 or more Children | 0 (0.0%) | 0 (0.0%) |
| Total | 22 (15.1%) | 187 (40.6%) |
Income Below Poverty Among Married-Couple vs Single-Parent Households in Cedar County
The poverty data for Cedar County shows that 177 of the married-couple family households (6.1%) and 209 of the single-parent households (34.5%) are living below the poverty level. Within the married-couple family households, those with 1 or 2 children have the highest poverty rate, with 125 households (19.5%) falling below the poverty line. Among the single-parent households, those with 1 or 2 children have the highest poverty rate, with 132 household (53.0%) living below poverty.
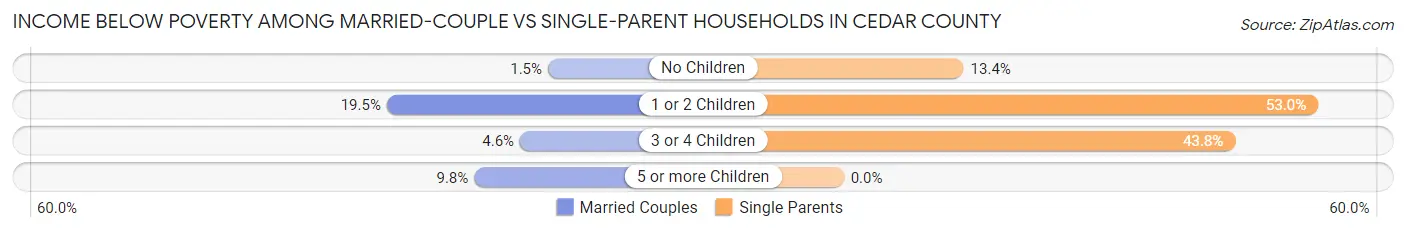
| Children | Married-Couple Families | Single-Parent Households |
| No Children | 27 (1.5%) | 35 (13.4%) |
| 1 or 2 Children | 125 (19.5%) | 132 (53.0%) |
| 3 or 4 Children | 21 (4.6%) | 42 (43.8%) |
| 5 or more Children | 4 (9.8%) | 0 (0.0%) |
| Total | 177 (6.1%) | 209 (34.5%) |
Race in Cedar County
The most populous races in Cedar County are White / Caucasian (13,377 | 93.4%), Two or more Races (626 | 4.4%), and Hispanic or Latino (371 | 2.6%).
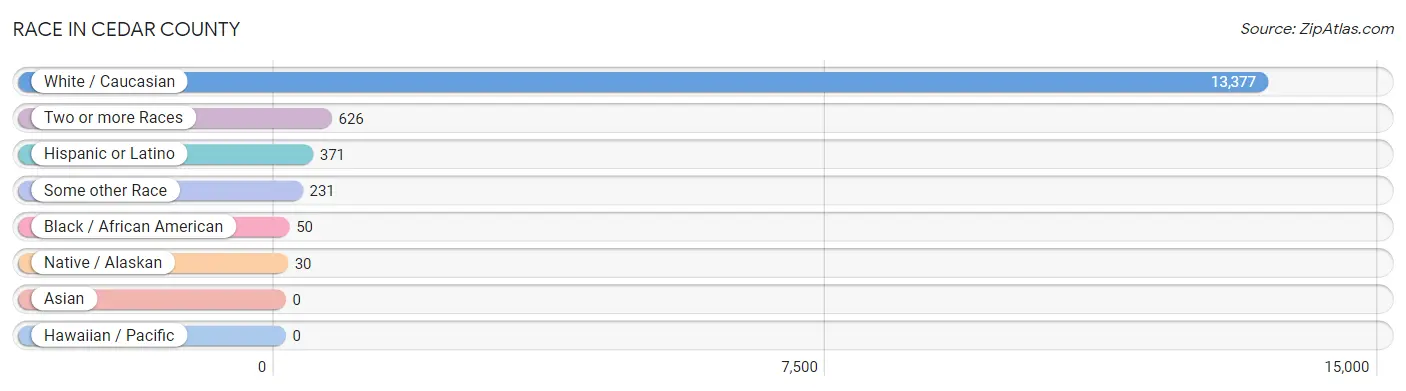
| Race | # Population | % Population |
| Asian | 0 | 0.0% |
| Black / African American | 50 | 0.4% |
| Hawaiian / Pacific | 0 | 0.0% |
| Hispanic or Latino | 371 | 2.6% |
| Native / Alaskan | 30 | 0.2% |
| White / Caucasian | 13,377 | 93.4% |
| Two or more Races | 626 | 4.4% |
| Some other Race | 231 | 1.6% |
| Total | 14,314 | 100.0% |
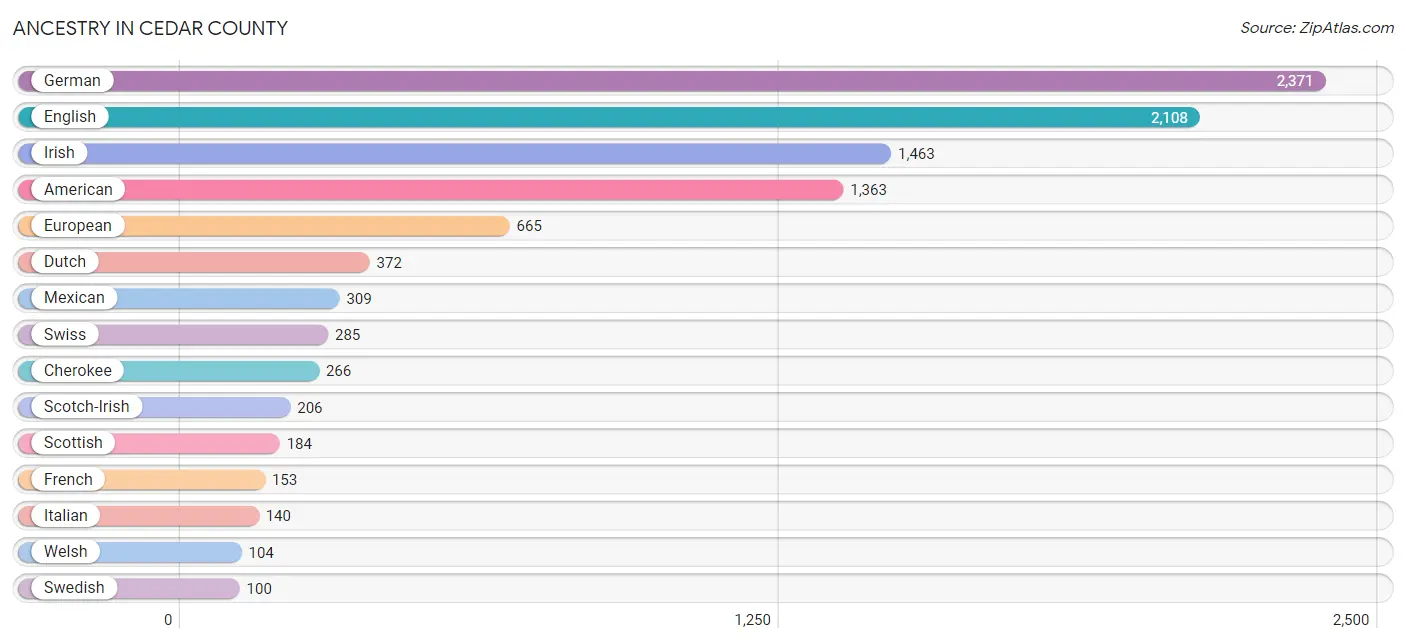
Ancestry in Cedar County
The most populous ancestries reported in Cedar County are German (2,371 | 16.6%), English (2,108 | 14.7%), Irish (1,463 | 10.2%), American (1,363 | 9.5%), and European (665 | 4.6%), together accounting for 55.7% of all Cedar County residents.
| Ancestry | # Population | % Population |
| African | 1 | 0.0% |
| American | 1,363 | 9.5% |
| Apache | 5 | 0.0% |
| Australian | 35 | 0.2% |
| Austrian | 23 | 0.2% |
| Belgian | 42 | 0.3% |
| Blackfeet | 11 | 0.1% |
| Brazilian | 78 | 0.5% |
| British | 31 | 0.2% |
| Canadian | 44 | 0.3% |
| Central American | 34 | 0.2% |
| Cherokee | 266 | 1.9% |
| Choctaw | 35 | 0.2% |
| Czech | 10 | 0.1% |
| Danish | 81 | 0.6% |
| Dutch | 372 | 2.6% |
| Eastern European | 2 | 0.0% |
| English | 2,108 | 14.7% |
| European | 665 | 4.6% |
| French | 153 | 1.1% |
| French Canadian | 13 | 0.1% |
| German | 2,371 | 16.6% |
| Guatemalan | 34 | 0.2% |
| Iranian | 6 | 0.0% |
| Irish | 1,463 | 10.2% |
| Italian | 140 | 1.0% |
| Korean | 25 | 0.2% |
| Mexican | 309 | 2.2% |
| Northern European | 3 | 0.0% |
| Norwegian | 59 | 0.4% |
| Polish | 50 | 0.4% |
| Portuguese | 52 | 0.4% |
| Potawatomi | 38 | 0.3% |
| Russian | 4 | 0.0% |
| Scandinavian | 35 | 0.2% |
| Scotch-Irish | 206 | 1.4% |
| Scottish | 184 | 1.3% |
| Sioux | 10 | 0.1% |
| Spaniard | 22 | 0.2% |
| Spanish | 4 | 0.0% |
| Subsaharan African | 1 | 0.0% |
| Swedish | 100 | 0.7% |
| Swiss | 285 | 2.0% |
| Ukrainian | 5 | 0.0% |
| Welsh | 104 | 0.7% | View All 45 Rows |
Immigrants in Cedar County
The most numerous immigrant groups reported in Cedar County came from Latin America (60 | 0.4%), Central America (41 | 0.3%), Guatemala (34 | 0.2%), Europe (31 | 0.2%), and Germany (26 | 0.2%), together accounting for 1.3% of all Cedar County residents.
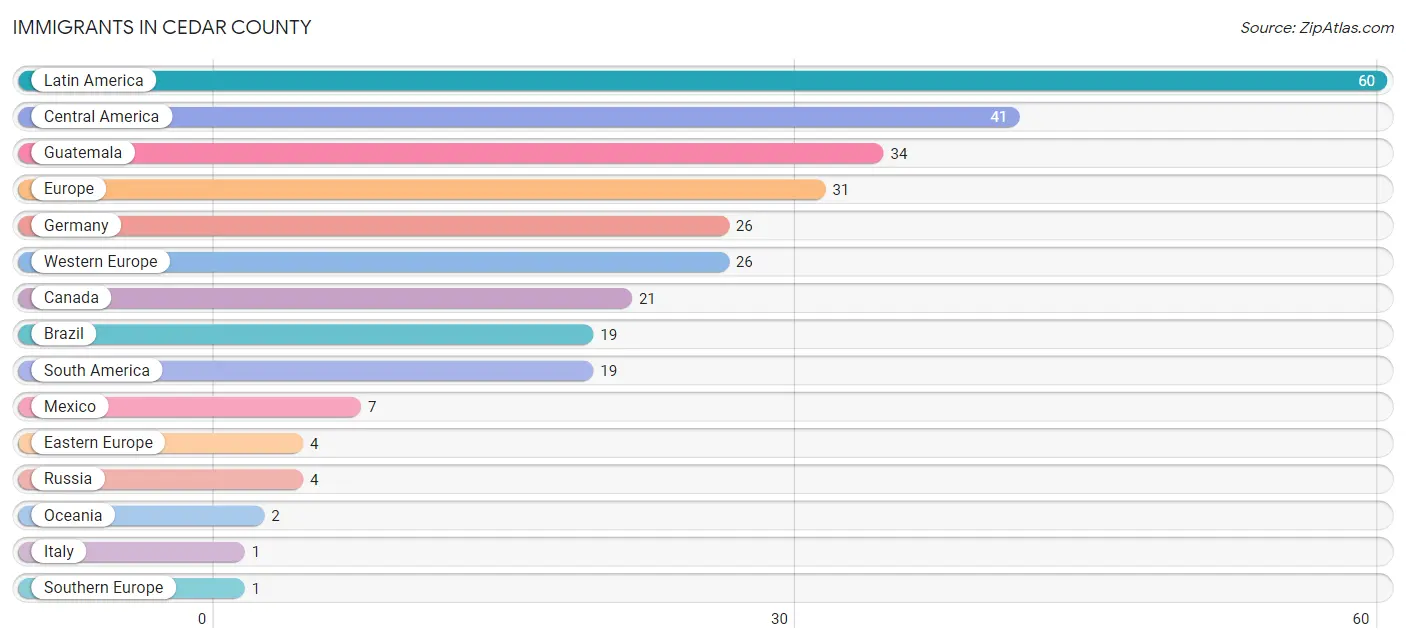
| Immigration Origin | # Population | % Population |
| Brazil | 19 | 0.1% |
| Canada | 21 | 0.2% |
| Central America | 41 | 0.3% |
| Eastern Europe | 4 | 0.0% |
| Europe | 31 | 0.2% |
| Germany | 26 | 0.2% |
| Guatemala | 34 | 0.2% |
| Italy | 1 | 0.0% |
| Latin America | 60 | 0.4% |
| Mexico | 7 | 0.1% |
| Oceania | 2 | 0.0% |
| Russia | 4 | 0.0% |
| South America | 19 | 0.1% |
| Southern Europe | 1 | 0.0% |
| Western Europe | 26 | 0.2% | View All 15 Rows |
Sex and Age in Cedar County
Sex and Age in Cedar County
The most populous age groups in Cedar County are 60 to 64 Years (682 | 9.3%) for men and 60 to 64 Years (565 | 8.1%) for women.
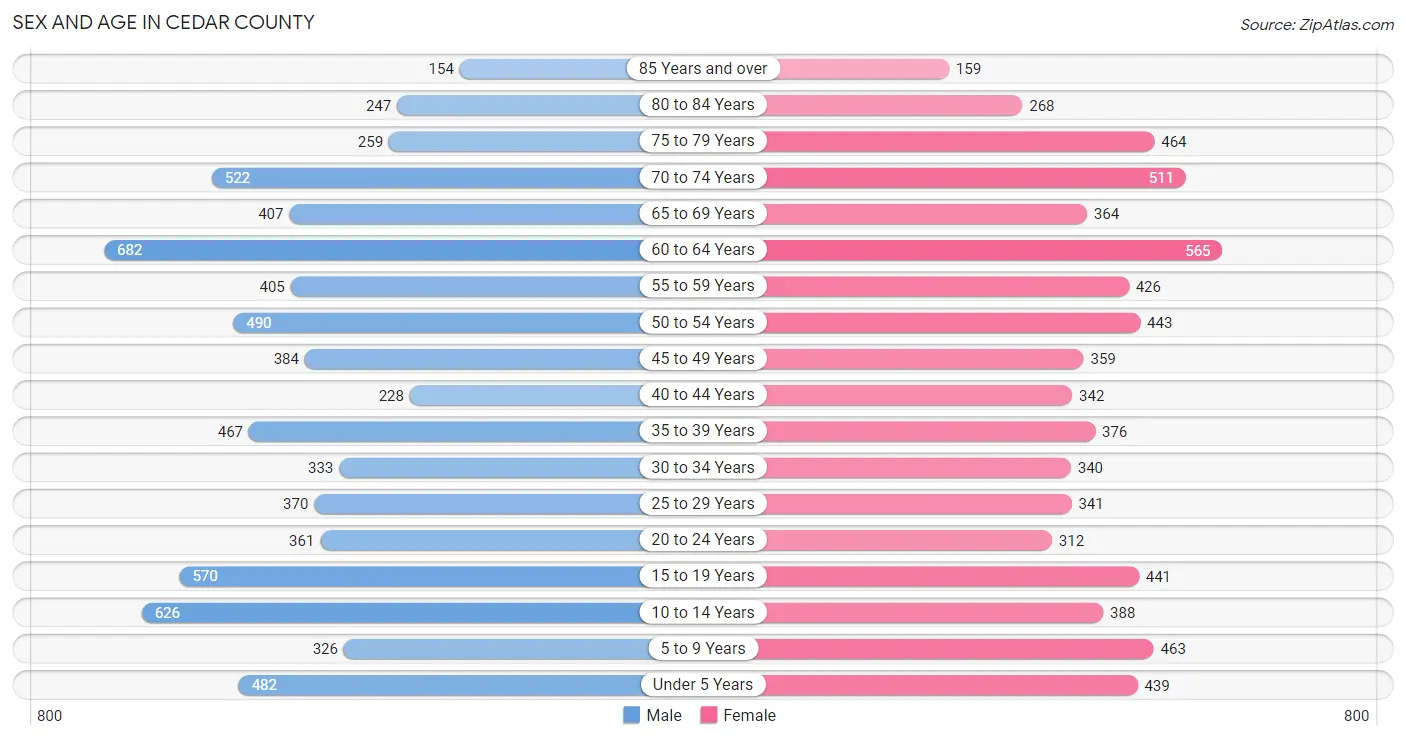
| Age Bracket | Male | Female |
| Under 5 Years | 482 (6.6%) | 439 (6.3%) |
| 5 to 9 Years | 326 (4.5%) | 463 (6.6%) |
| 10 to 14 Years | 626 (8.6%) | 388 (5.5%) |
| 15 to 19 Years | 570 (7.8%) | 441 (6.3%) |
| 20 to 24 Years | 361 (4.9%) | 312 (4.5%) |
| 25 to 29 Years | 370 (5.1%) | 341 (4.9%) |
| 30 to 34 Years | 333 (4.5%) | 340 (4.9%) |
| 35 to 39 Years | 467 (6.4%) | 376 (5.4%) |
| 40 to 44 Years | 228 (3.1%) | 342 (4.9%) |
| 45 to 49 Years | 384 (5.2%) | 359 (5.1%) |
| 50 to 54 Years | 490 (6.7%) | 443 (6.3%) |
| 55 to 59 Years | 405 (5.5%) | 426 (6.1%) |
| 60 to 64 Years | 682 (9.3%) | 565 (8.1%) |
| 65 to 69 Years | 407 (5.6%) | 364 (5.2%) |
| 70 to 74 Years | 522 (7.1%) | 511 (7.3%) |
| 75 to 79 Years | 259 (3.5%) | 464 (6.6%) |
| 80 to 84 Years | 247 (3.4%) | 268 (3.8%) |
| 85 Years and over | 154 (2.1%) | 159 (2.3%) |
| Total | 7,313 (100.0%) | 7,001 (100.0%) |
Families and Households in Cedar County
Median Family Size in Cedar County
The median family size in Cedar County is 3.27 persons per family, with single male/father families (146 | 4.2%) accounting for the largest median family size of 3.48 persons per family. On the other hand, single female/mother families (460 | 13.1%) represent the smallest median family size with 3.15 persons per family.
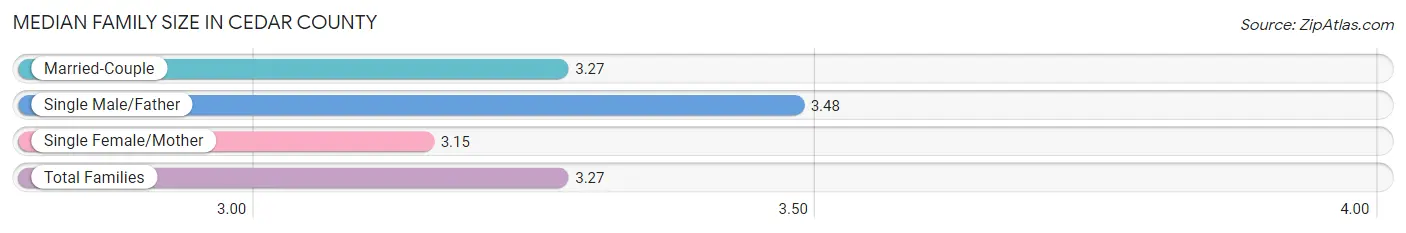
| Family Type | # Families | Family Size |
| Married-Couple | 2,911 (82.8%) | 3.27 |
| Single Male/Father | 146 (4.2%) | 3.48 |
| Single Female/Mother | 460 (13.1%) | 3.15 |
| Total Families | 3,517 (100.0%) | 3.27 |
Median Household Size in Cedar County
The median household size in Cedar County is 2.56 persons per household, with single male/father households (146 | 2.7%) accounting for the largest median household size of 3.57 persons per household. non-family households (1,959 | 35.8%) represent the smallest median household size with 1.20 persons per household.
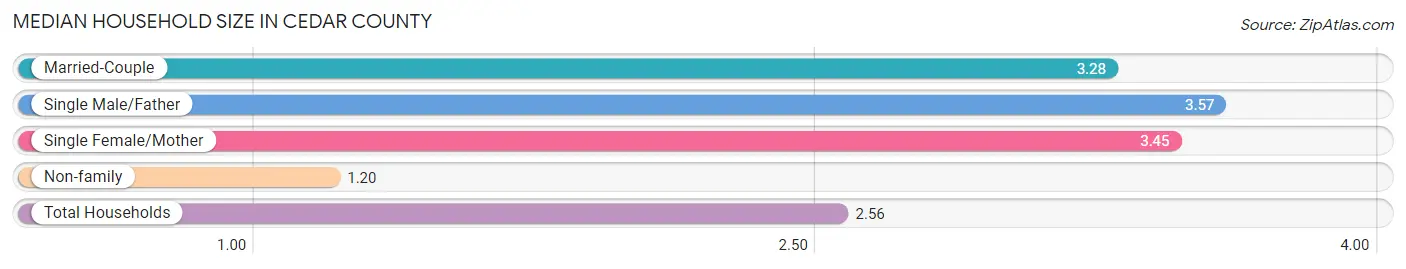
| Household Type | # Households | Household Size |
| Married-Couple | 2,911 (53.2%) | 3.28 |
| Single Male/Father | 146 (2.7%) | 3.57 |
| Single Female/Mother | 460 (8.4%) | 3.45 |
| Non-family | 1,959 (35.8%) | 1.20 |
| Total Households | 5,476 (100.0%) | 2.56 |
Household Size by Marriage Status in Cedar County
Out of a total of 5,476 households in Cedar County, 3,517 (64.2%) are family households, while 1,959 (35.8%) are nonfamily households. The most numerous type of family households are 2-person households, comprising 1,924, and the most common type of nonfamily households are 1-person households, comprising 1,643.
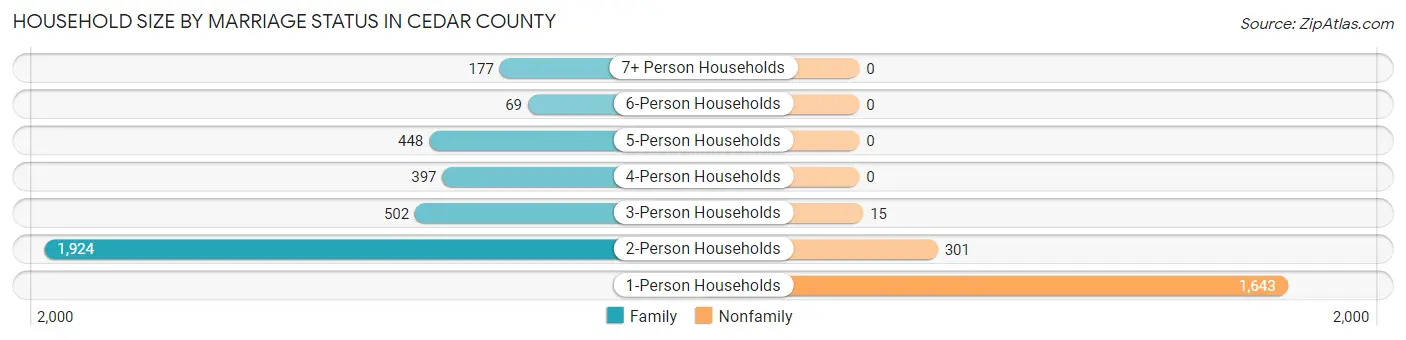
| Household Size | Family Households | Nonfamily Households |
| 1-Person Households | - | 1,643 (30.0%) |
| 2-Person Households | 1,924 (35.1%) | 301 (5.5%) |
| 3-Person Households | 502 (9.2%) | 15 (0.3%) |
| 4-Person Households | 397 (7.2%) | 0 (0.0%) |
| 5-Person Households | 448 (8.2%) | 0 (0.0%) |
| 6-Person Households | 69 (1.3%) | 0 (0.0%) |
| 7+ Person Households | 177 (3.2%) | 0 (0.0%) |
| Total | 3,517 (64.2%) | 1,959 (35.8%) |
Female Fertility in Cedar County
Fertility by Age in Cedar County
Average fertility rate in Cedar County is 87.0 births per 1,000 women. Women in the age bracket of 20 to 34 years have the highest fertility rate with 181.0 births per 1,000 women. Women in the age bracket of 20 to 34 years acount for 78.9% of all women with births.
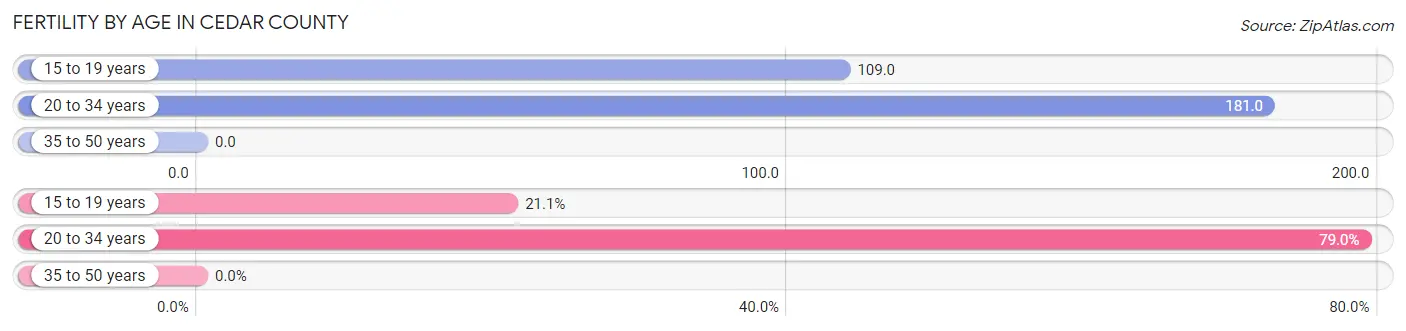
| Age Bracket | Women with Births | Births / 1,000 Women |
| 15 to 19 years | 48 (21.0%) | 109.0 |
| 20 to 34 years | 180 (78.9%) | 181.0 |
| 35 to 50 years | 0 (0.0%) | 0.0 |
| Total | 228 (100.0%) | 87.0 |
Fertility by Age by Marriage Status in Cedar County
77.2% of women with births (228) in Cedar County are married. The highest percentage of unmarried women with births falls into 15 to 19 years age bracket with 100.0% of them unmarried at the time of birth, while the lowest percentage of unmarried women with births belong to 20 to 34 years age bracket with 2.2% of them unmarried.
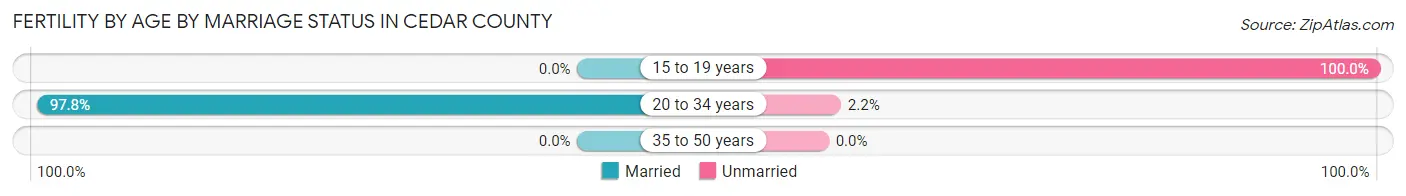
| Age Bracket | Married | Unmarried |
| 15 to 19 years | 0 (0.0%) | 48 (100.0%) |
| 20 to 34 years | 176 (97.8%) | 4 (2.2%) |
| 35 to 50 years | 0 (0.0%) | 0 (0.0%) |
| Total | 176 (77.2%) | 52 (22.8%) |
Fertility by Education in Cedar County
Average fertility rate in Cedar County is 87.0 births per 1,000 women. Women with the education attainment of high school diploma have the highest fertility rate of 109.0 births per 1,000 women, while women with the education attainment of college or associate's degree have the lowest fertility at 49.0 births per 1,000 women. Women with the education attainment of high school diploma represent 37.3% of all women with births.
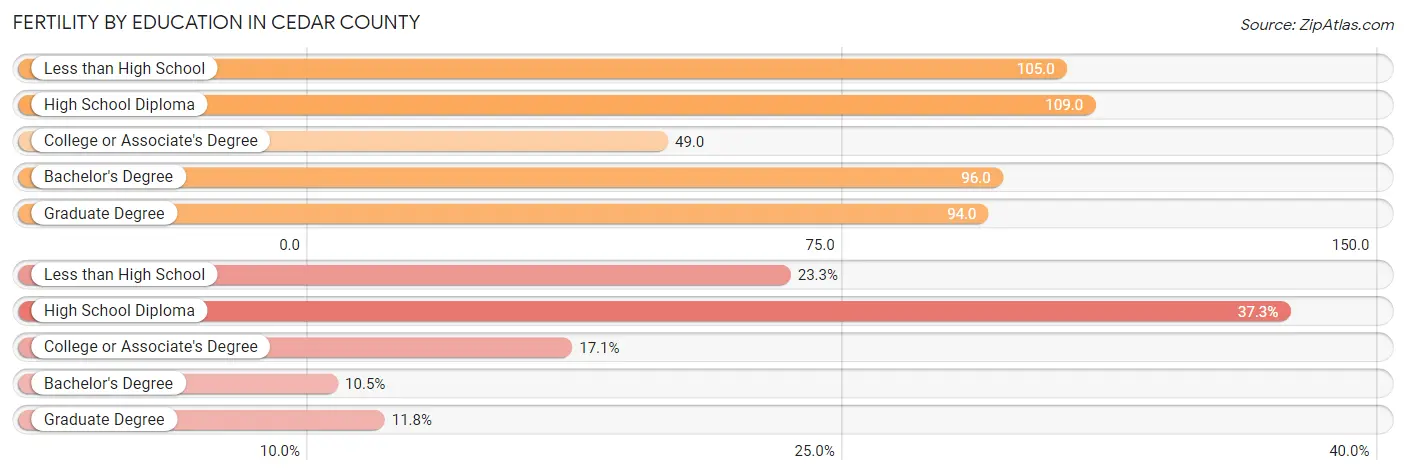
| Educational Attainment | Women with Births | Births / 1,000 Women |
| Less than High School | 53 (23.3%) | 105.0 |
| High School Diploma | 85 (37.3%) | 109.0 |
| College or Associate's Degree | 39 (17.1%) | 49.0 |
| Bachelor's Degree | 24 (10.5%) | 96.0 |
| Graduate Degree | 27 (11.8%) | 94.0 |
| Total | 228 (100.0%) | 87.0 |
Fertility by Education by Marriage Status in Cedar County
22.8% of women with births in Cedar County are unmarried. Women with the educational attainment of bachelor's degree are most likely to be married with 100.0% of them married at childbirth, while women with the educational attainment of less than high school are least likely to be married with 54.7% of them unmarried at childbirth.
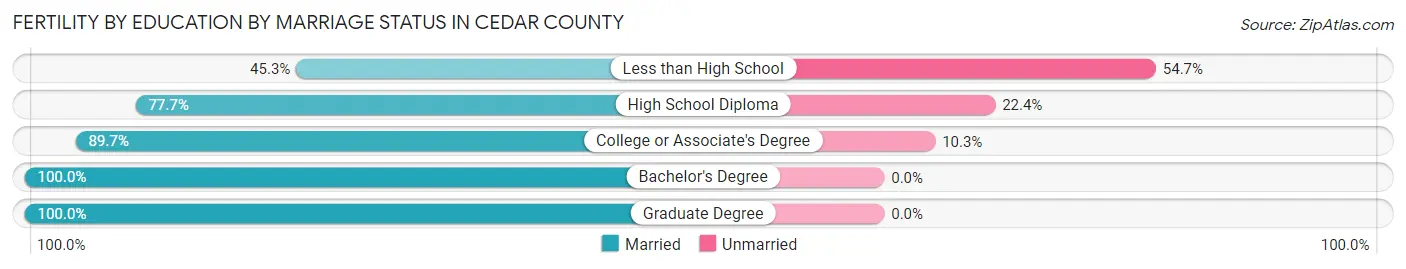
| Educational Attainment | Married | Unmarried |
| Less than High School | 24 (45.3%) | 29 (54.7%) |
| High School Diploma | 66 (77.6%) | 19 (22.4%) |
| College or Associate's Degree | 35 (89.7%) | 4 (10.3%) |
| Bachelor's Degree | 24 (100.0%) | 0 (0.0%) |
| Graduate Degree | 27 (100.0%) | 0 (0.0%) |
| Total | 176 (77.2%) | 52 (22.8%) |
Employment Characteristics in Cedar County
Employment by Class of Employer in Cedar County
Among the 5,168 employed individuals in Cedar County, private company employees (3,002 | 58.1%), self-employed (not incorporated) (703 | 13.6%), and not-for-profit organizations (549 | 10.6%) make up the most common classes of employment.
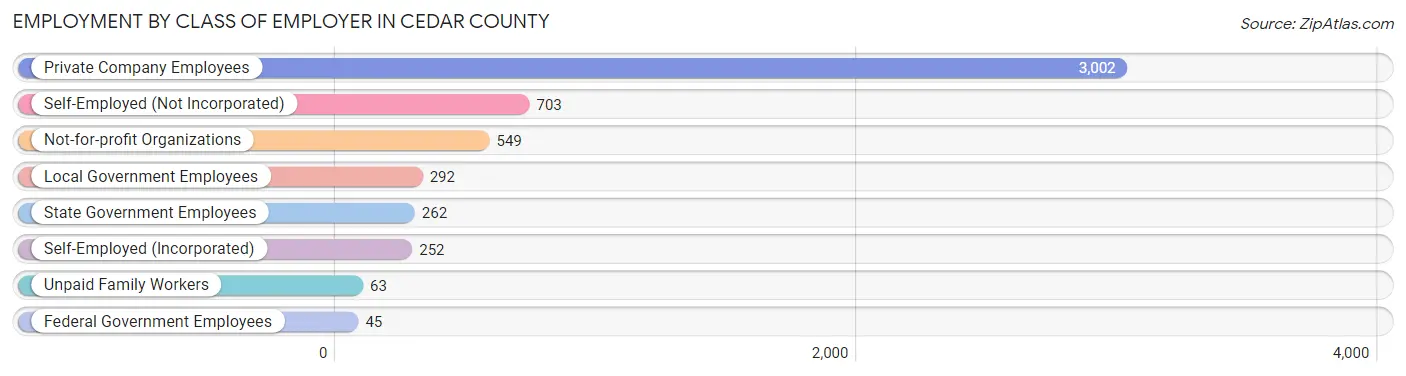
| Employer Class | # Employees | % Employees |
| Private Company Employees | 3,002 | 58.1% |
| Self-Employed (Incorporated) | 252 | 4.9% |
| Self-Employed (Not Incorporated) | 703 | 13.6% |
| Not-for-profit Organizations | 549 | 10.6% |
| Local Government Employees | 292 | 5.7% |
| State Government Employees | 262 | 5.1% |
| Federal Government Employees | 45 | 0.9% |
| Unpaid Family Workers | 63 | 1.2% |
| Total | 5,168 | 100.0% |
Employment Status by Age in Cedar County
According to the labor force statistics for Cedar County, out of the total population over 16 years of age (11,385), 48.3% or 5,499 individuals are in the labor force, with 2.5% or 137 of them unemployed. The age group with the highest labor force participation rate is 25 to 29 years, with 91.3% or 649 individuals in the labor force. Within the labor force, the 20 to 24 years age range has the highest percentage of unemployed individuals, with 17.2% or 62 of them being unemployed.
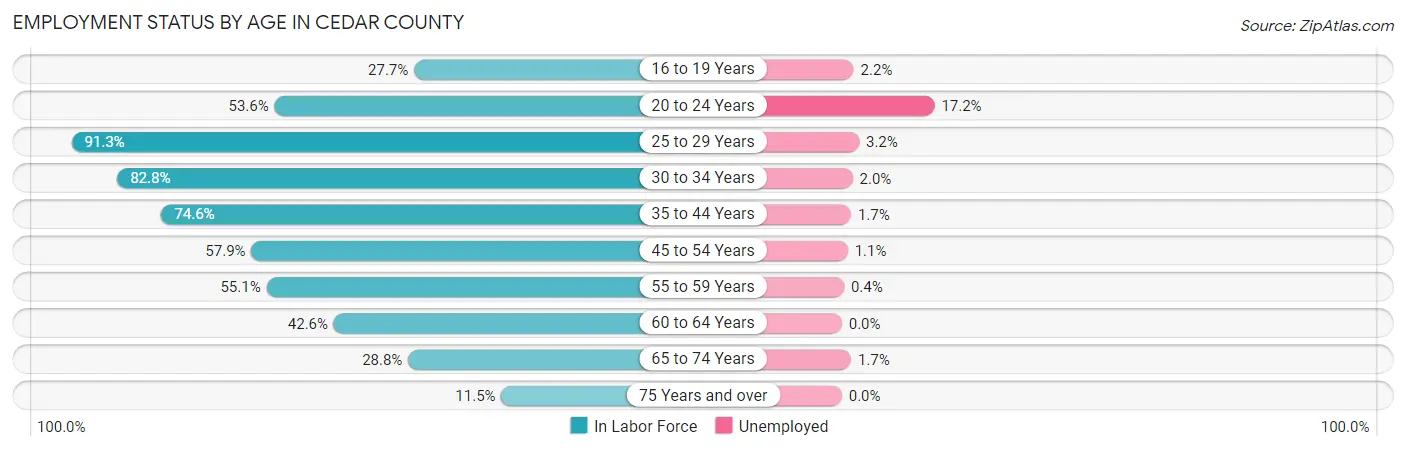
| Age Bracket | In Labor Force | Unemployed |
| 16 to 19 Years | 223 (27.7%) | 5 (2.2%) |
| 20 to 24 Years | 361 (53.6%) | 62 (17.2%) |
| 25 to 29 Years | 649 (91.3%) | 21 (3.2%) |
| 30 to 34 Years | 557 (82.8%) | 11 (2.0%) |
| 35 to 44 Years | 1,054 (74.6%) | 18 (1.7%) |
| 45 to 54 Years | 970 (57.9%) | 11 (1.1%) |
| 55 to 59 Years | 458 (55.1%) | 2 (0.4%) |
| 60 to 64 Years | 531 (42.6%) | 0 (0.0%) |
| 65 to 74 Years | 520 (28.8%) | 9 (1.7%) |
| 75 Years and over | 178 (11.5%) | 0 (0.0%) |
| Total | 5,499 (48.3%) | 137 (2.5%) |
Employment Status by Educational Attainment in Cedar County
According to labor force statistics for Cedar County, 64.4% of individuals (4,219) out of the total population between 25 and 64 years of age (6,551) are in the labor force, with 1.5% or 63 of them being unemployed. The group with the highest labor force participation rate are those with the educational attainment of bachelor's degree or higher, with 83.7% or 1,004 individuals in the labor force. Within the labor force, individuals with less than high school education have the highest percentage of unemployment, with 5.6% or 22 of them being unemployed.
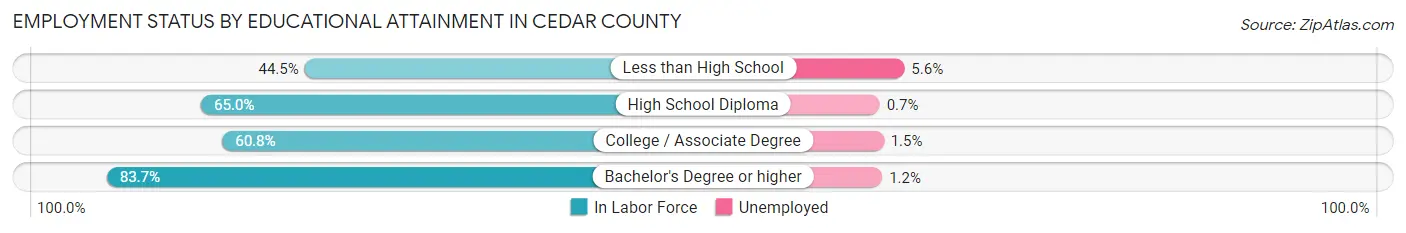
| Educational Attainment | In Labor Force | Unemployed |
| Less than High School | 390 (44.5%) | 49 (5.6%) |
| High School Diploma | 1,611 (65.0%) | 17 (0.7%) |
| College / Associate Degree | 1,214 (60.8%) | 30 (1.5%) |
| Bachelor's Degree or higher | 1,004 (83.7%) | 14 (1.2%) |
| Total | 4,219 (64.4%) | 98 (1.5%) |
Employment Occupations by Sex in Cedar County
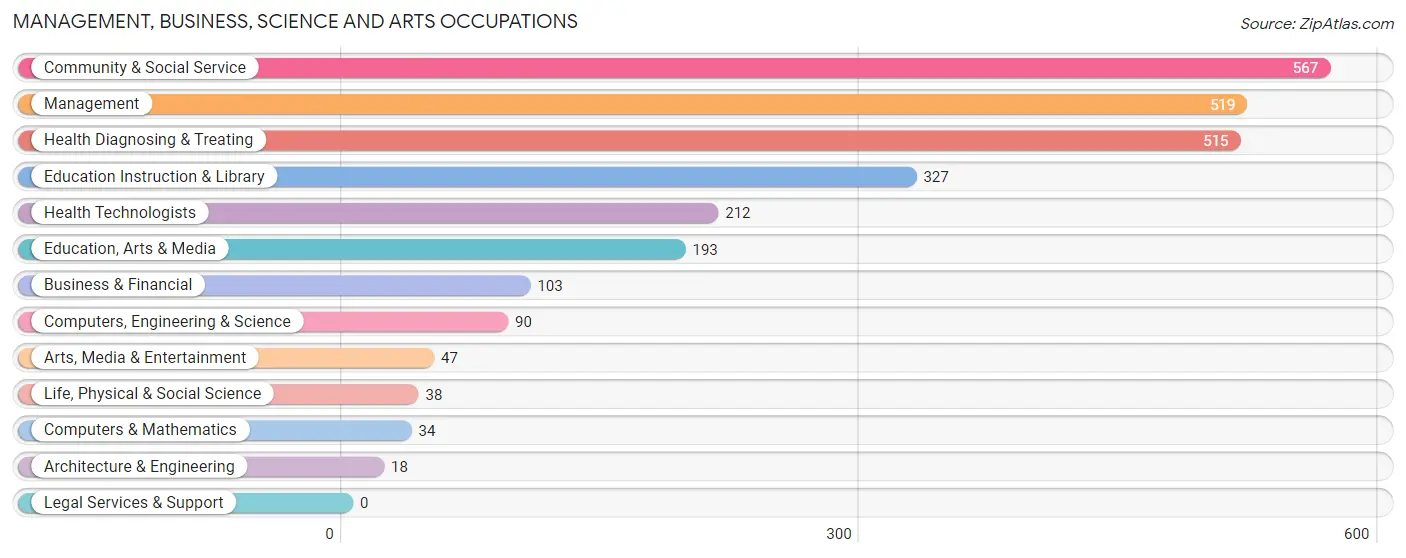
Management, Business, Science and Arts Occupations
The most common Management, Business, Science and Arts occupations in Cedar County are Community & Social Service (567 | 10.6%), Management (519 | 9.7%), Health Diagnosing & Treating (515 | 9.6%), Education Instruction & Library (327 | 6.1%), and Health Technologists (212 | 4.0%).
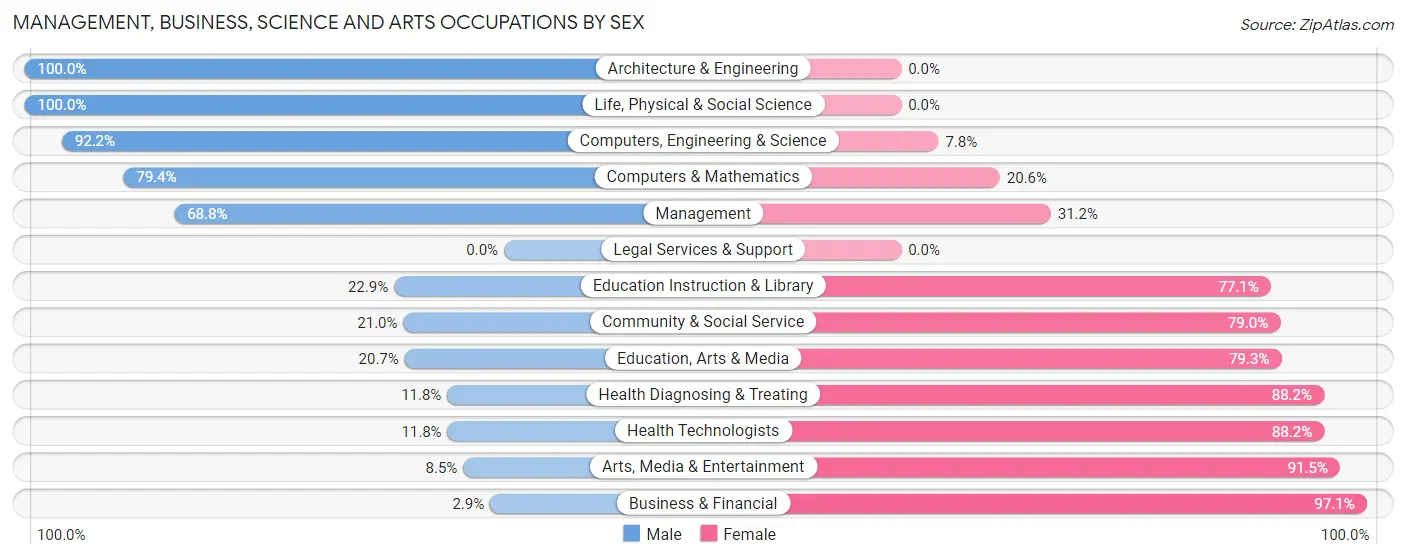
Management, Business, Science and Arts Occupations by Sex
Within the Management, Business, Science and Arts occupations in Cedar County, the most male-oriented occupations are Architecture & Engineering (100.0%), Life, Physical & Social Science (100.0%), and Computers, Engineering & Science (92.2%), while the most female-oriented occupations are Business & Financial (97.1%), Arts, Media & Entertainment (91.5%), and Health Technologists (88.2%).
| Occupation | Male | Female |
| Management | 357 (68.8%) | 162 (31.2%) |
| Business & Financial | 3 (2.9%) | 100 (97.1%) |
| Computers, Engineering & Science | 83 (92.2%) | 7 (7.8%) |
| Computers & Mathematics | 27 (79.4%) | 7 (20.6%) |
| Architecture & Engineering | 18 (100.0%) | 0 (0.0%) |
| Life, Physical & Social Science | 38 (100.0%) | 0 (0.0%) |
| Community & Social Service | 119 (21.0%) | 448 (79.0%) |
| Education, Arts & Media | 40 (20.7%) | 153 (79.3%) |
| Legal Services & Support | 0 (0.0%) | 0 (0.0%) |
| Education Instruction & Library | 75 (22.9%) | 252 (77.1%) |
| Arts, Media & Entertainment | 4 (8.5%) | 43 (91.5%) |
| Health Diagnosing & Treating | 61 (11.8%) | 454 (88.2%) |
| Health Technologists | 25 (11.8%) | 187 (88.2%) |
| Total (Category) | 623 (34.7%) | 1,171 (65.3%) |
| Total (Overall) | 2,809 (52.5%) | 2,545 (47.5%) |
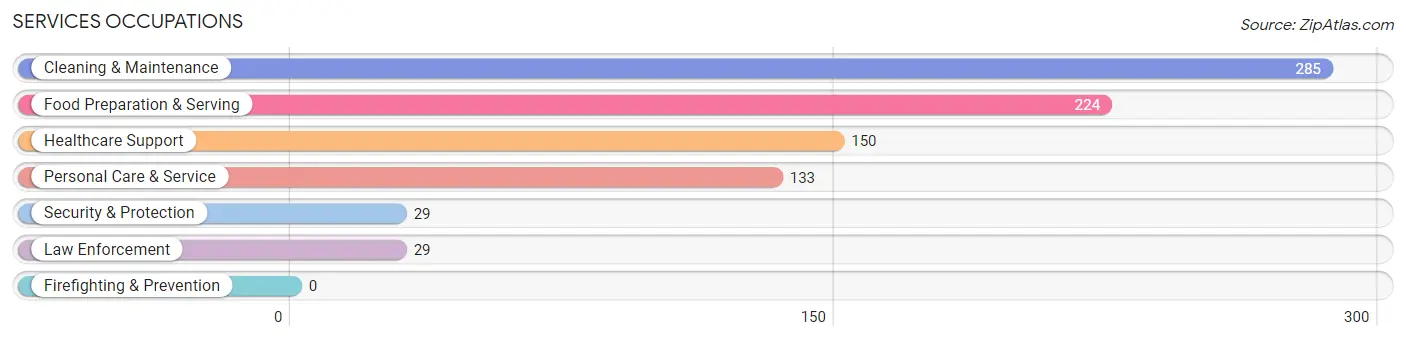
Services Occupations
The most common Services occupations in Cedar County are Cleaning & Maintenance (285 | 5.3%), Food Preparation & Serving (224 | 4.2%), Healthcare Support (150 | 2.8%), Personal Care & Service (133 | 2.5%), and Security & Protection (29 | 0.5%).
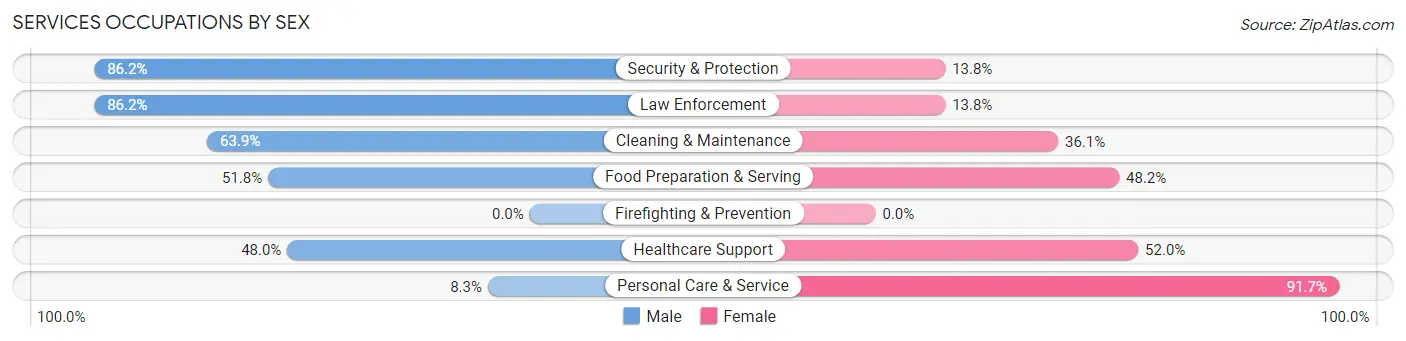
Services Occupations by Sex
Within the Services occupations in Cedar County, the most male-oriented occupations are Security & Protection (86.2%), Law Enforcement (86.2%), and Cleaning & Maintenance (63.9%), while the most female-oriented occupations are Personal Care & Service (91.7%), Healthcare Support (52.0%), and Food Preparation & Serving (48.2%).
| Occupation | Male | Female |
| Healthcare Support | 72 (48.0%) | 78 (52.0%) |
| Security & Protection | 25 (86.2%) | 4 (13.8%) |
| Firefighting & Prevention | 0 (0.0%) | 0 (0.0%) |
| Law Enforcement | 25 (86.2%) | 4 (13.8%) |
| Food Preparation & Serving | 116 (51.8%) | 108 (48.2%) |
| Cleaning & Maintenance | 182 (63.9%) | 103 (36.1%) |
| Personal Care & Service | 11 (8.3%) | 122 (91.7%) |
| Total (Category) | 406 (49.4%) | 415 (50.5%) |
| Total (Overall) | 2,809 (52.5%) | 2,545 (47.5%) |
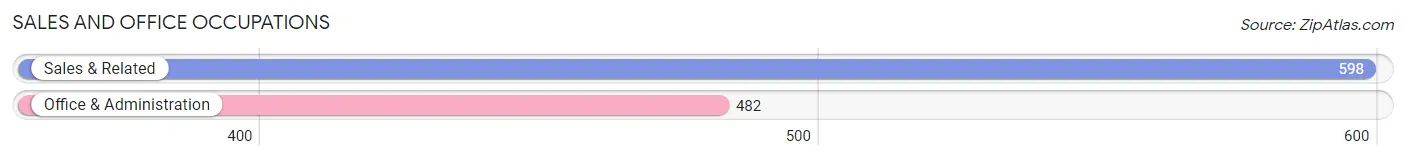
Sales and Office Occupations
The most common Sales and Office occupations in Cedar County are Sales & Related (598 | 11.2%), and Office & Administration (482 | 9.0%).
Sales and Office Occupations by Sex

| Occupation | Male | Female |
| Sales & Related | 292 (48.8%) | 306 (51.2%) |
| Office & Administration | 68 (14.1%) | 414 (85.9%) |
| Total (Category) | 360 (33.3%) | 720 (66.7%) |
| Total (Overall) | 2,809 (52.5%) | 2,545 (47.5%) |
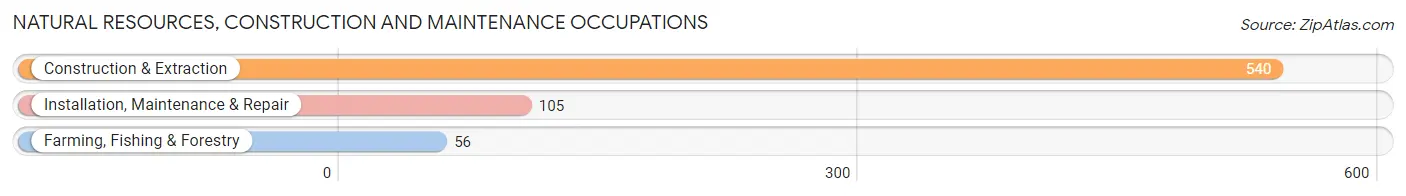
Natural Resources, Construction and Maintenance Occupations
The most common Natural Resources, Construction and Maintenance occupations in Cedar County are Construction & Extraction (540 | 10.1%), Installation, Maintenance & Repair (105 | 2.0%), and Farming, Fishing & Forestry (56 | 1.1%).
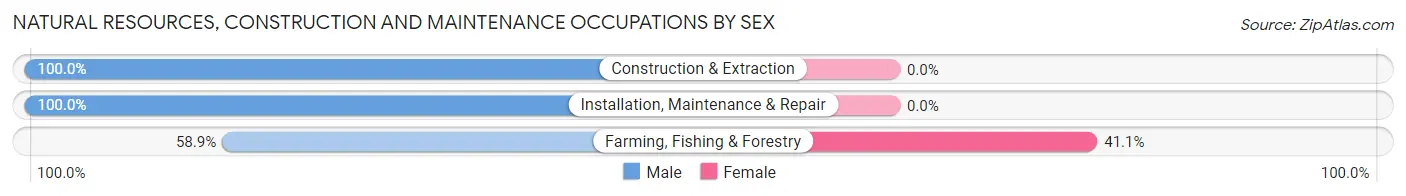
Natural Resources, Construction and Maintenance Occupations by Sex
| Occupation | Male | Female |
| Farming, Fishing & Forestry | 33 (58.9%) | 23 (41.1%) |
| Construction & Extraction | 540 (100.0%) | 0 (0.0%) |
| Installation, Maintenance & Repair | 105 (100.0%) | 0 (0.0%) |
| Total (Category) | 678 (96.7%) | 23 (3.3%) |
| Total (Overall) | 2,809 (52.5%) | 2,545 (47.5%) |
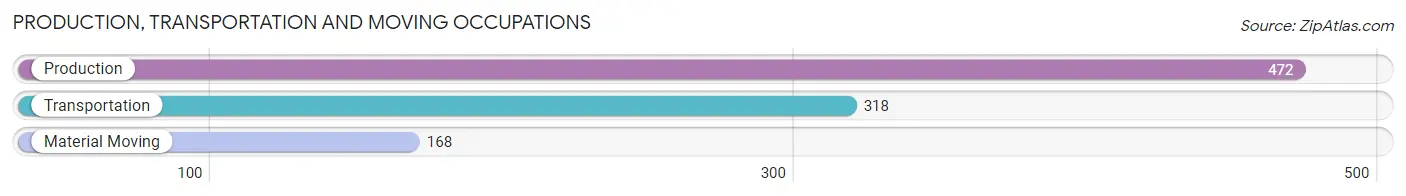
Production, Transportation and Moving Occupations
The most common Production, Transportation and Moving occupations in Cedar County are Production (472 | 8.8%), Transportation (318 | 5.9%), and Material Moving (168 | 3.1%).
Production, Transportation and Moving Occupations by Sex
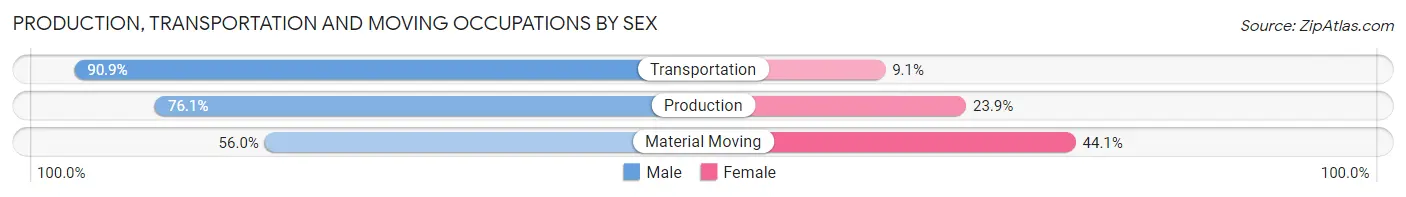
| Occupation | Male | Female |
| Production | 359 (76.1%) | 113 (23.9%) |
| Transportation | 289 (90.9%) | 29 (9.1%) |
| Material Moving | 94 (55.9%) | 74 (44.1%) |
| Total (Category) | 742 (77.4%) | 216 (22.6%) |
| Total (Overall) | 2,809 (52.5%) | 2,545 (47.5%) |
Employment Industries by Sex in Cedar County
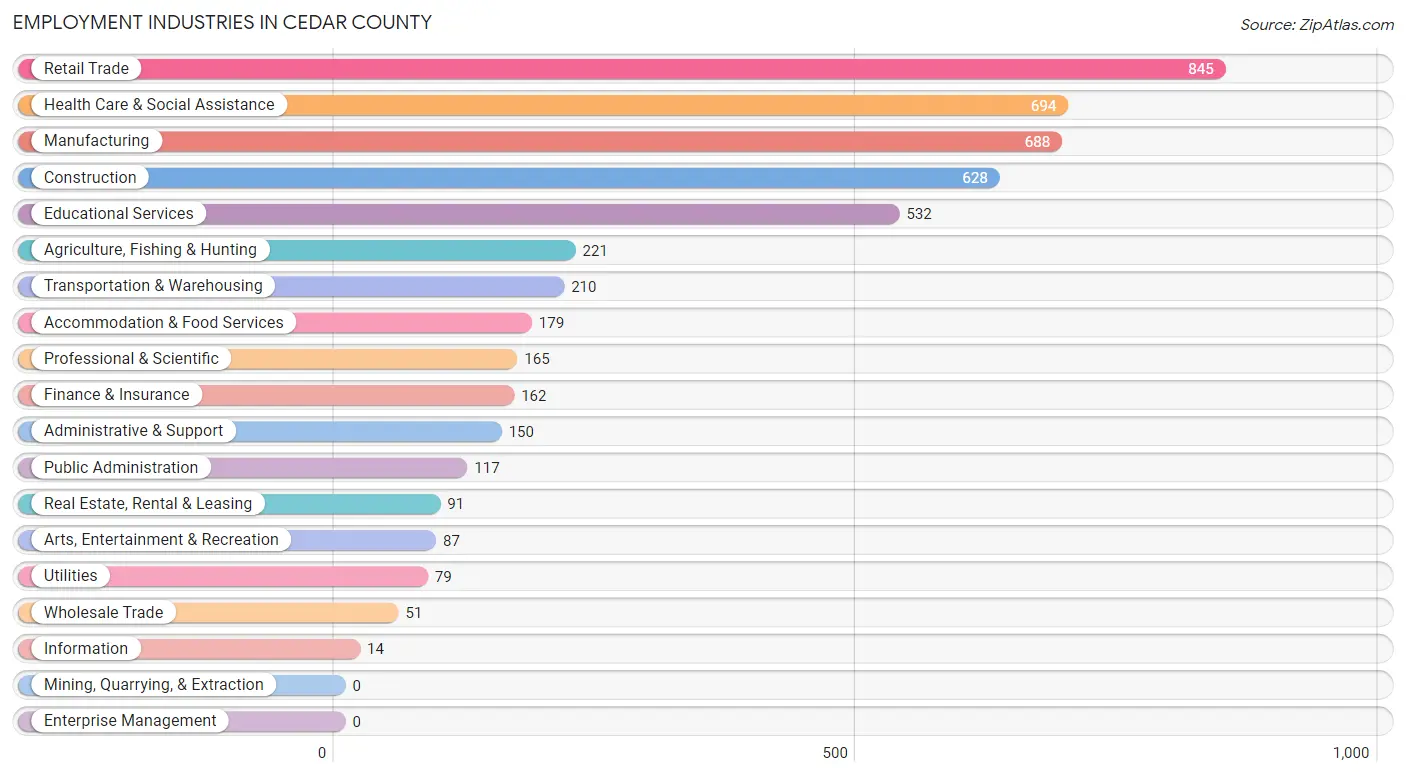
Employment Industries in Cedar County
The major employment industries in Cedar County include Retail Trade (845 | 15.8%), Health Care & Social Assistance (694 | 13.0%), Manufacturing (688 | 12.9%), Construction (628 | 11.7%), and Educational Services (532 | 9.9%).
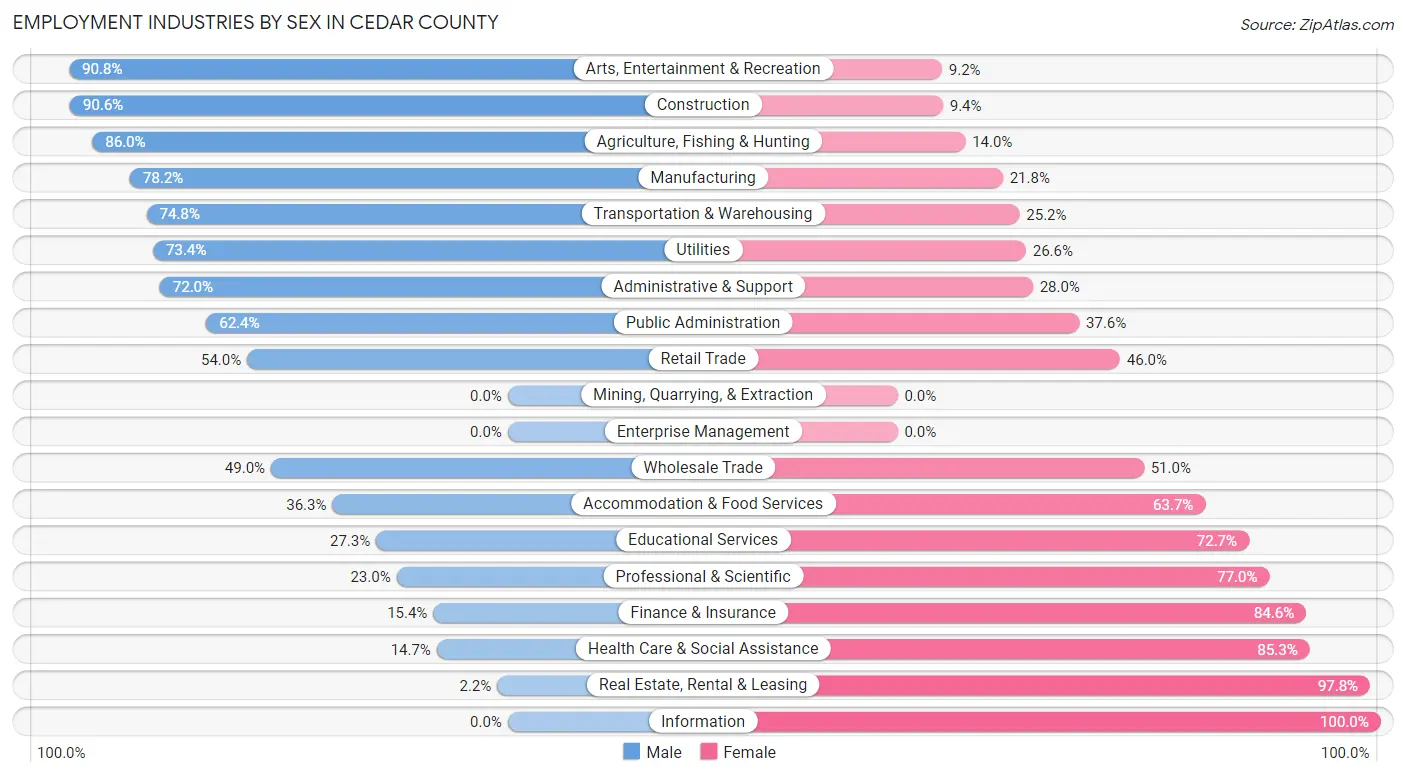
Employment Industries by Sex in Cedar County
The Cedar County industries that see more men than women are Arts, Entertainment & Recreation (90.8%), Construction (90.6%), and Agriculture, Fishing & Hunting (86.0%), whereas the industries that tend to have a higher number of women are Information (100.0%), Real Estate, Rental & Leasing (97.8%), and Health Care & Social Assistance (85.3%).
| Industry | Male | Female |
| Agriculture, Fishing & Hunting | 190 (86.0%) | 31 (14.0%) |
| Mining, Quarrying, & Extraction | 0 (0.0%) | 0 (0.0%) |
| Construction | 569 (90.6%) | 59 (9.4%) |
| Manufacturing | 538 (78.2%) | 150 (21.8%) |
| Wholesale Trade | 25 (49.0%) | 26 (51.0%) |
| Retail Trade | 456 (54.0%) | 389 (46.0%) |
| Transportation & Warehousing | 157 (74.8%) | 53 (25.2%) |
| Utilities | 58 (73.4%) | 21 (26.6%) |
| Information | 0 (0.0%) | 14 (100.0%) |
| Finance & Insurance | 25 (15.4%) | 137 (84.6%) |
| Real Estate, Rental & Leasing | 2 (2.2%) | 89 (97.8%) |
| Professional & Scientific | 38 (23.0%) | 127 (77.0%) |
| Enterprise Management | 0 (0.0%) | 0 (0.0%) |
| Administrative & Support | 108 (72.0%) | 42 (28.0%) |
| Educational Services | 145 (27.3%) | 387 (72.7%) |
| Health Care & Social Assistance | 102 (14.7%) | 592 (85.3%) |
| Arts, Entertainment & Recreation | 79 (90.8%) | 8 (9.2%) |
| Accommodation & Food Services | 65 (36.3%) | 114 (63.7%) |
| Public Administration | 73 (62.4%) | 44 (37.6%) |
| Total | 2,809 (52.5%) | 2,545 (47.5%) |
Education in Cedar County
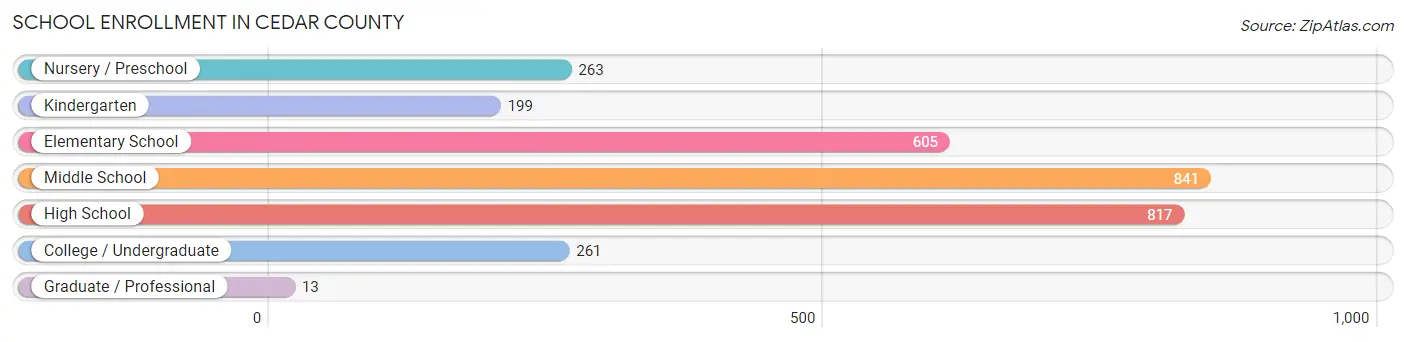
School Enrollment in Cedar County
The most common levels of schooling among the 2,999 students in Cedar County are middle school (841 | 28.0%), high school (817 | 27.2%), and elementary school (605 | 20.2%).
| School Level | # Students | % Students |
| Nursery / Preschool | 263 | 8.8% |
| Kindergarten | 199 | 6.6% |
| Elementary School | 605 | 20.2% |
| Middle School | 841 | 28.0% |
| High School | 817 | 27.2% |
| College / Undergraduate | 261 | 8.7% |
| Graduate / Professional | 13 | 0.4% |
| Total | 2,999 | 100.0% |
School Enrollment by Age by Funding Source in Cedar County
Out of a total of 2,999 students who are enrolled in schools in Cedar County, 666 (22.2%) attend a private institution, while the remaining 2,333 (77.8%) are enrolled in public schools. The age group of 25 to 34 year olds has the highest likelihood of being enrolled in private schools, with 31 (55.4% in the age bracket) enrolled. Conversely, the age group of 35 years and over has the lowest likelihood of being enrolled in a private school, with 105 (100.0% in the age bracket) attending a public institution.
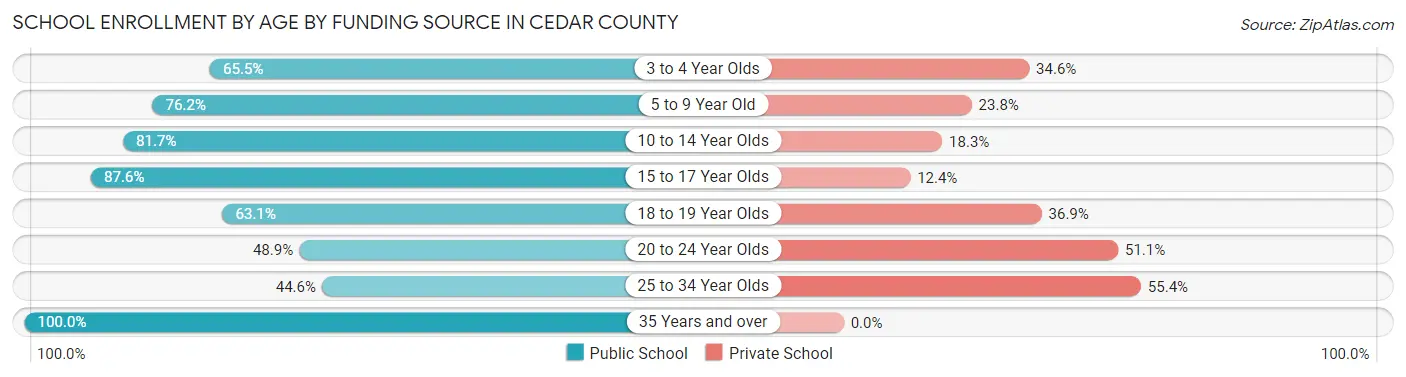
| Age Bracket | Public School | Private School |
| 3 to 4 Year Olds | 125 (65.4%) | 66 (34.5%) |
| 5 to 9 Year Old | 556 (76.2%) | 174 (23.8%) |
| 10 to 14 Year Olds | 828 (81.7%) | 186 (18.3%) |
| 15 to 17 Year Olds | 516 (87.6%) | 73 (12.4%) |
| 18 to 19 Year Olds | 113 (63.1%) | 66 (36.9%) |
| 20 to 24 Year Olds | 66 (48.9%) | 69 (51.1%) |
| 25 to 34 Year Olds | 25 (44.6%) | 31 (55.4%) |
| 35 Years and over | 105 (100.0%) | 0 (0.0%) |
| Total | 2,333 (77.8%) | 666 (22.2%) |
Educational Attainment by Field of Study in Cedar County
Education (455 | 24.8%), business (279 | 15.2%), bio, nature & agricultural (225 | 12.2%), science & technology (175 | 9.5%), and psychology (161 | 8.8%) are the most common fields of study among 1,836 individuals in Cedar County who have obtained a bachelor's degree or higher.
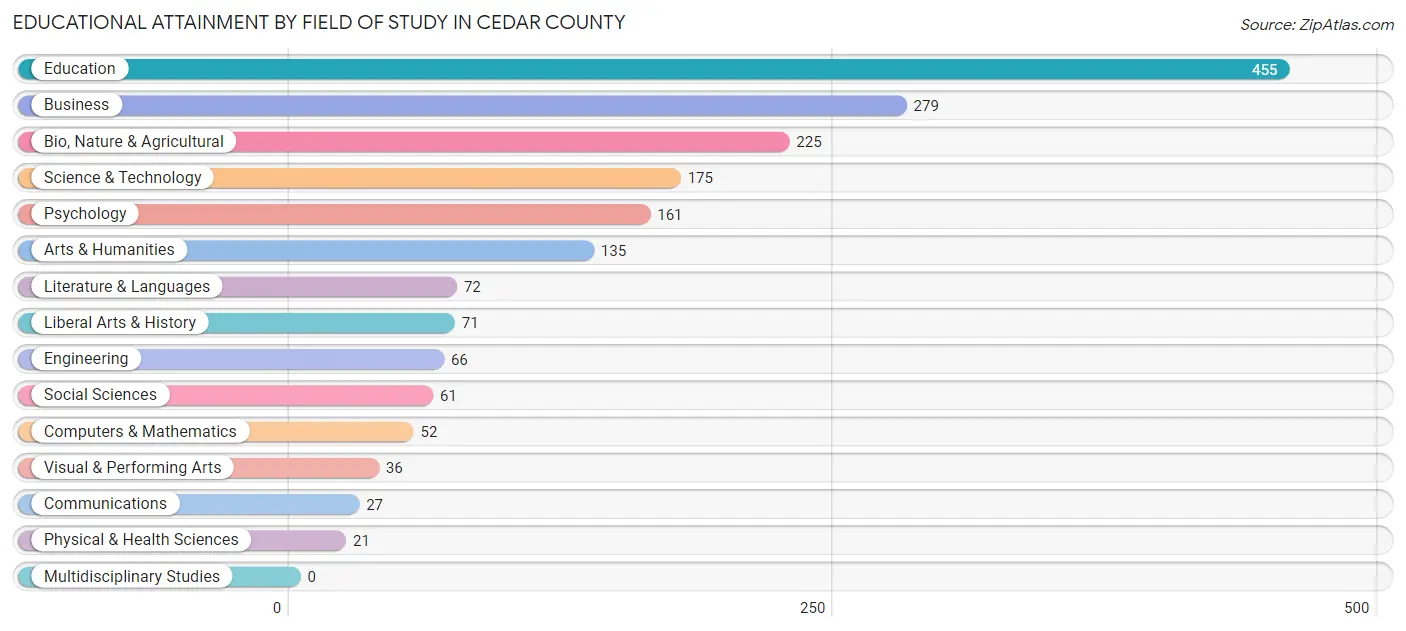
| Field of Study | # Graduates | % Graduates |
| Computers & Mathematics | 52 | 2.8% |
| Bio, Nature & Agricultural | 225 | 12.2% |
| Physical & Health Sciences | 21 | 1.1% |
| Psychology | 161 | 8.8% |
| Social Sciences | 61 | 3.3% |
| Engineering | 66 | 3.6% |
| Multidisciplinary Studies | 0 | 0.0% |
| Science & Technology | 175 | 9.5% |
| Business | 279 | 15.2% |
| Education | 455 | 24.8% |
| Literature & Languages | 72 | 3.9% |
| Liberal Arts & History | 71 | 3.9% |
| Visual & Performing Arts | 36 | 2.0% |
| Communications | 27 | 1.5% |
| Arts & Humanities | 135 | 7.3% |
| Total | 1,836 | 100.0% |
Transportation & Commute in Cedar County
Vehicle Availability by Sex in Cedar County
The most prevalent vehicle ownership categories in Cedar County are males with 3 vehicles (999, accounting for 36.1%) and females with 3 vehicles (709, making up 41.7%).
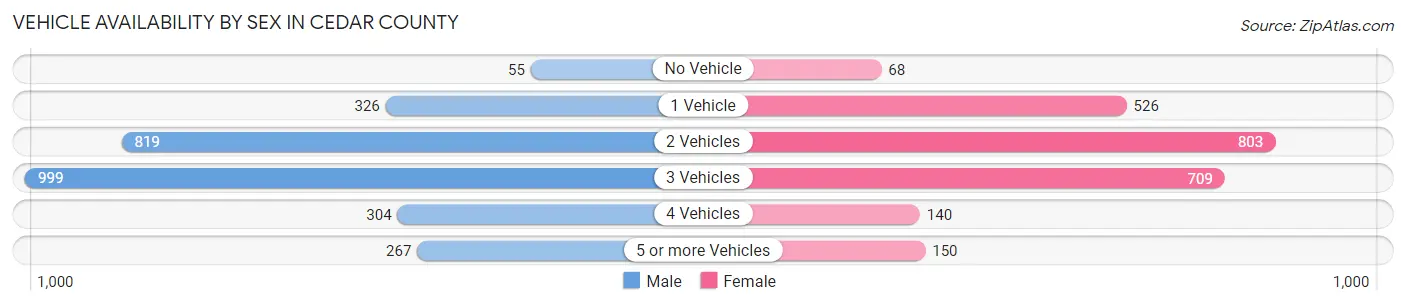
| Vehicles Available | Male | Female |
| No Vehicle | 55 (2.0%) | 68 (2.8%) |
| 1 Vehicle | 326 (11.8%) | 526 (22.0%) |
| 2 Vehicles | 819 (29.6%) | 803 (33.5%) |
| 3 Vehicles | 999 (36.1%) | 709 (29.6%) |
| 4 Vehicles | 304 (11.0%) | 140 (5.8%) |
| 5 or more Vehicles | 267 (9.6%) | 150 (6.3%) |
| Total | 2,770 (100.0%) | 2,396 (100.0%) |
Commute Time in Cedar County
The most frequently occuring commute durations in Cedar County are 5 to 9 minutes (1,169 commuters, 24.9%), less than 5 minutes (550 commuters, 11.7%), and 20 to 24 minutes (448 commuters, 9.6%).
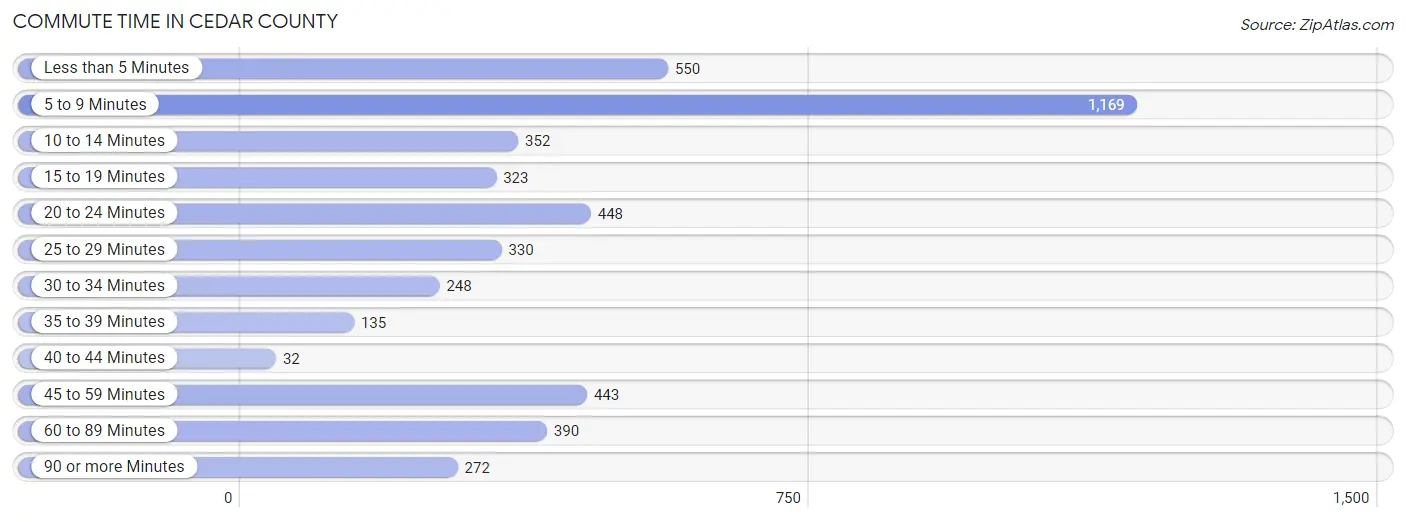
| Commute Time | # Commuters | % Commuters |
| Less than 5 Minutes | 550 | 11.7% |
| 5 to 9 Minutes | 1,169 | 24.9% |
| 10 to 14 Minutes | 352 | 7.5% |
| 15 to 19 Minutes | 323 | 6.9% |
| 20 to 24 Minutes | 448 | 9.6% |
| 25 to 29 Minutes | 330 | 7.0% |
| 30 to 34 Minutes | 248 | 5.3% |
| 35 to 39 Minutes | 135 | 2.9% |
| 40 to 44 Minutes | 32 | 0.7% |
| 45 to 59 Minutes | 443 | 9.4% |
| 60 to 89 Minutes | 390 | 8.3% |
| 90 or more Minutes | 272 | 5.8% |
Commute Time by Sex in Cedar County
The most common commute times in Cedar County are 5 to 9 minutes (670 commuters, 26.2%) for males and 5 to 9 minutes (499 commuters, 23.4%) for females.
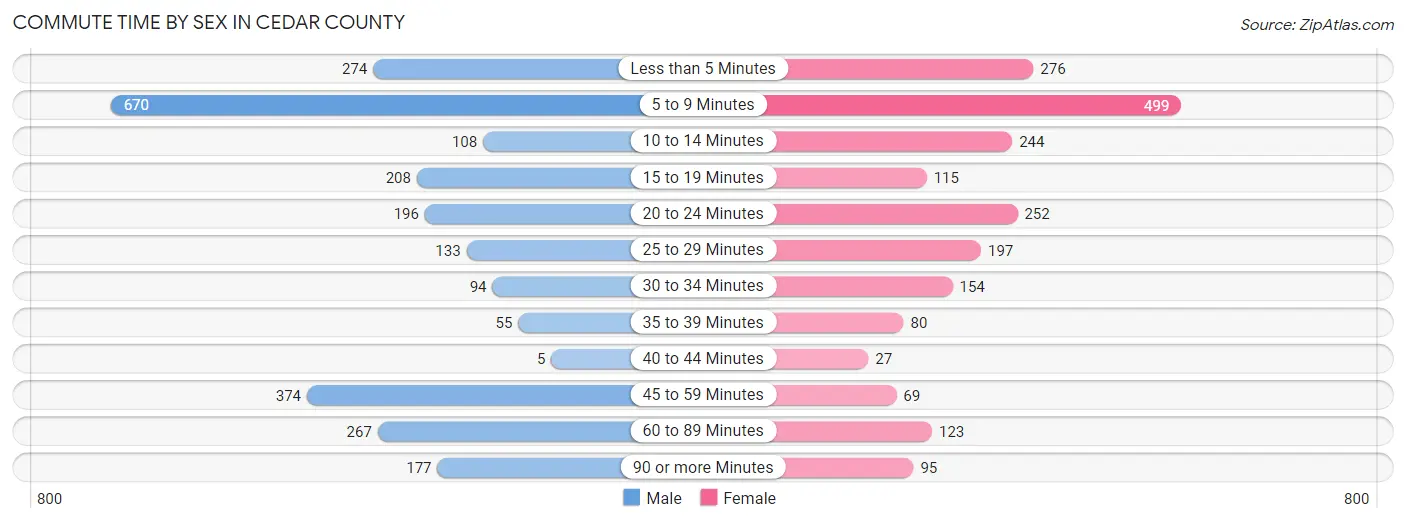
| Commute Time | Male | Female |
| Less than 5 Minutes | 274 (10.7%) | 276 (13.0%) |
| 5 to 9 Minutes | 670 (26.2%) | 499 (23.4%) |
| 10 to 14 Minutes | 108 (4.2%) | 244 (11.5%) |
| 15 to 19 Minutes | 208 (8.1%) | 115 (5.4%) |
| 20 to 24 Minutes | 196 (7.6%) | 252 (11.8%) |
| 25 to 29 Minutes | 133 (5.2%) | 197 (9.2%) |
| 30 to 34 Minutes | 94 (3.7%) | 154 (7.2%) |
| 35 to 39 Minutes | 55 (2.1%) | 80 (3.7%) |
| 40 to 44 Minutes | 5 (0.2%) | 27 (1.3%) |
| 45 to 59 Minutes | 374 (14.6%) | 69 (3.2%) |
| 60 to 89 Minutes | 267 (10.4%) | 123 (5.8%) |
| 90 or more Minutes | 177 (6.9%) | 95 (4.5%) |
Time of Departure to Work by Sex in Cedar County
The most frequent times of departure to work in Cedar County are 7:00 AM to 7:29 AM (588, 23.0%) for males and 7:00 AM to 7:29 AM (334, 15.7%) for females.
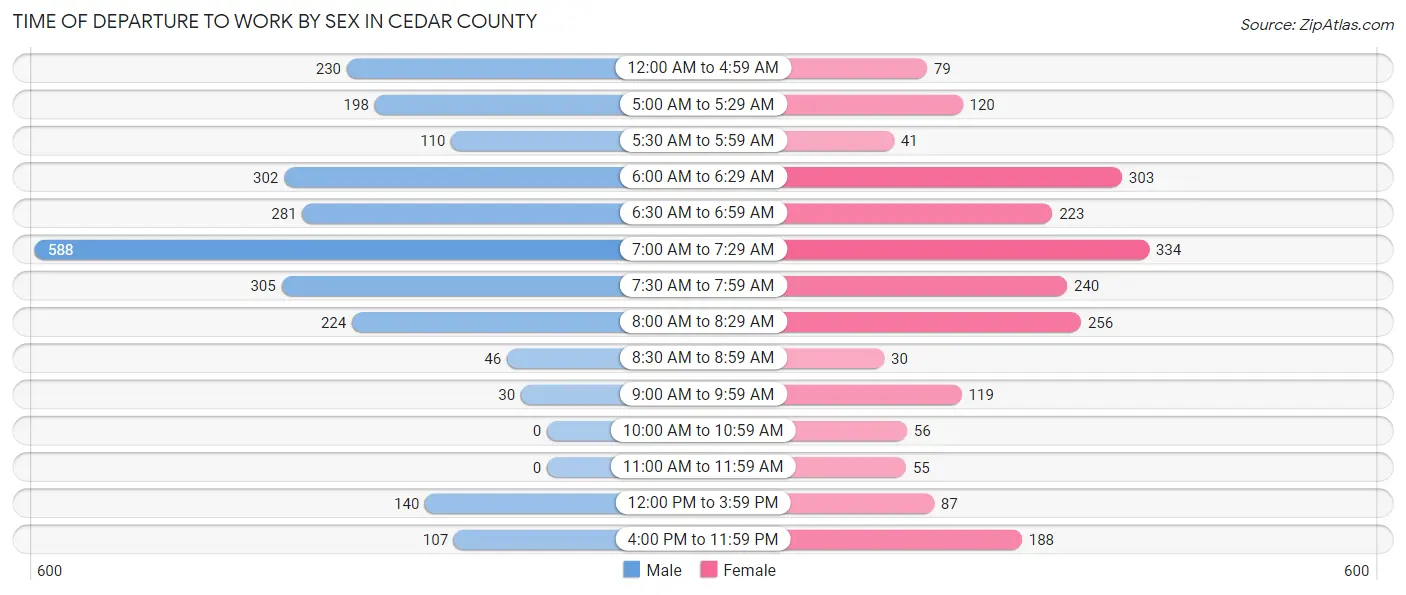
| Time of Departure | Male | Female |
| 12:00 AM to 4:59 AM | 230 (9.0%) | 79 (3.7%) |
| 5:00 AM to 5:29 AM | 198 (7.7%) | 120 (5.6%) |
| 5:30 AM to 5:59 AM | 110 (4.3%) | 41 (1.9%) |
| 6:00 AM to 6:29 AM | 302 (11.8%) | 303 (14.2%) |
| 6:30 AM to 6:59 AM | 281 (11.0%) | 223 (10.5%) |
| 7:00 AM to 7:29 AM | 588 (23.0%) | 334 (15.7%) |
| 7:30 AM to 7:59 AM | 305 (11.9%) | 240 (11.3%) |
| 8:00 AM to 8:29 AM | 224 (8.7%) | 256 (12.0%) |
| 8:30 AM to 8:59 AM | 46 (1.8%) | 30 (1.4%) |
| 9:00 AM to 9:59 AM | 30 (1.2%) | 119 (5.6%) |
| 10:00 AM to 10:59 AM | 0 (0.0%) | 56 (2.6%) |
| 11:00 AM to 11:59 AM | 0 (0.0%) | 55 (2.6%) |
| 12:00 PM to 3:59 PM | 140 (5.5%) | 87 (4.1%) |
| 4:00 PM to 11:59 PM | 107 (4.2%) | 188 (8.8%) |
| Total | 2,561 (100.0%) | 2,131 (100.0%) |
Housing Occupancy in Cedar County
Occupancy by Ownership in Cedar County
Of the total 5,476 dwellings in Cedar County, owner-occupied units account for 4,028 (73.6%), while renter-occupied units make up 1,448 (26.4%).
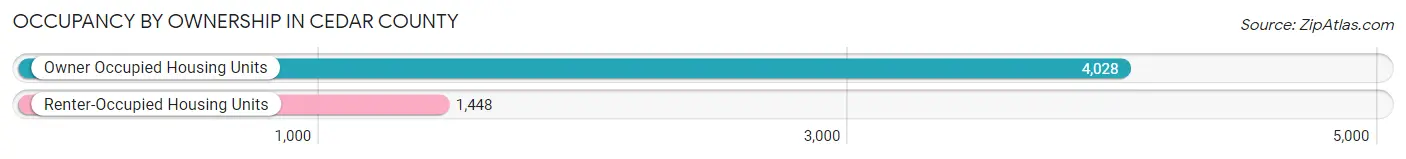
| Occupancy | # Housing Units | % Housing Units |
| Owner Occupied Housing Units | 4,028 | 73.6% |
| Renter-Occupied Housing Units | 1,448 | 26.4% |
| Total Occupied Housing Units | 5,476 | 100.0% |
Occupancy by Household Size in Cedar County
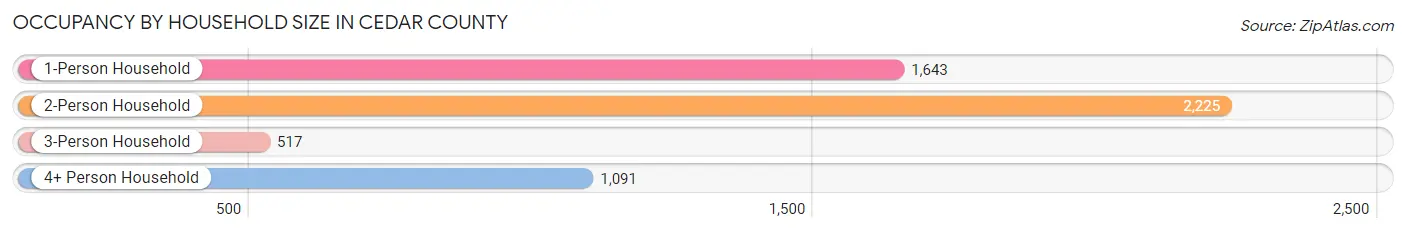
| Household Size | # Housing Units | % Housing Units |
| 1-Person Household | 1,643 | 30.0% |
| 2-Person Household | 2,225 | 40.6% |
| 3-Person Household | 517 | 9.4% |
| 4+ Person Household | 1,091 | 19.9% |
| Total Housing Units | 5,476 | 100.0% |
Occupancy by Ownership by Household Size in Cedar County
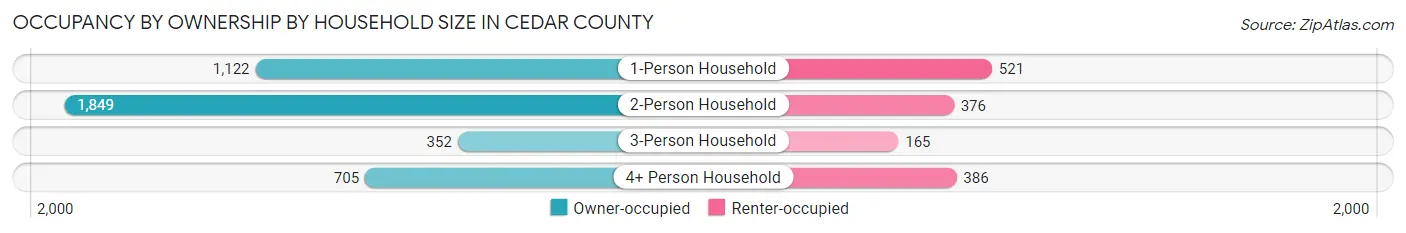
| Household Size | Owner-occupied | Renter-occupied |
| 1-Person Household | 1,122 (68.3%) | 521 (31.7%) |
| 2-Person Household | 1,849 (83.1%) | 376 (16.9%) |
| 3-Person Household | 352 (68.1%) | 165 (31.9%) |
| 4+ Person Household | 705 (64.6%) | 386 (35.4%) |
| Total Housing Units | 4,028 (73.6%) | 1,448 (26.4%) |
Occupancy by Educational Attainment in Cedar County
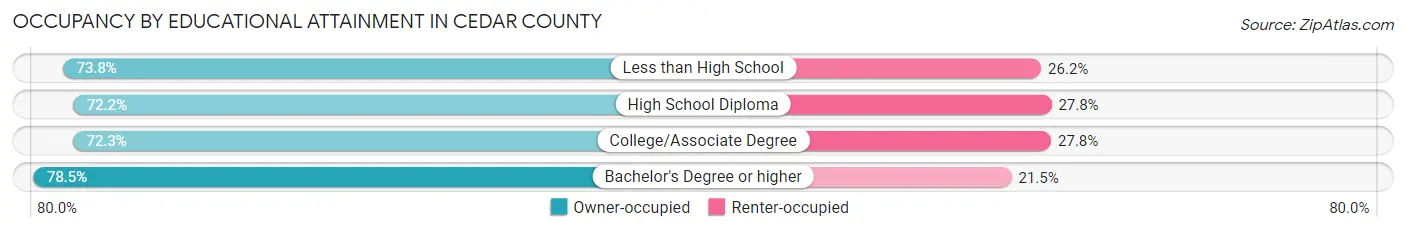
| Household Size | Owner-occupied | Renter-occupied |
| Less than High School | 488 (73.8%) | 173 (26.2%) |
| High School Diploma | 1,579 (72.2%) | 608 (27.8%) |
| College/Associate Degree | 1,182 (72.3%) | 454 (27.8%) |
| Bachelor's Degree or higher | 779 (78.5%) | 213 (21.5%) |
Occupancy by Age of Householder in Cedar County
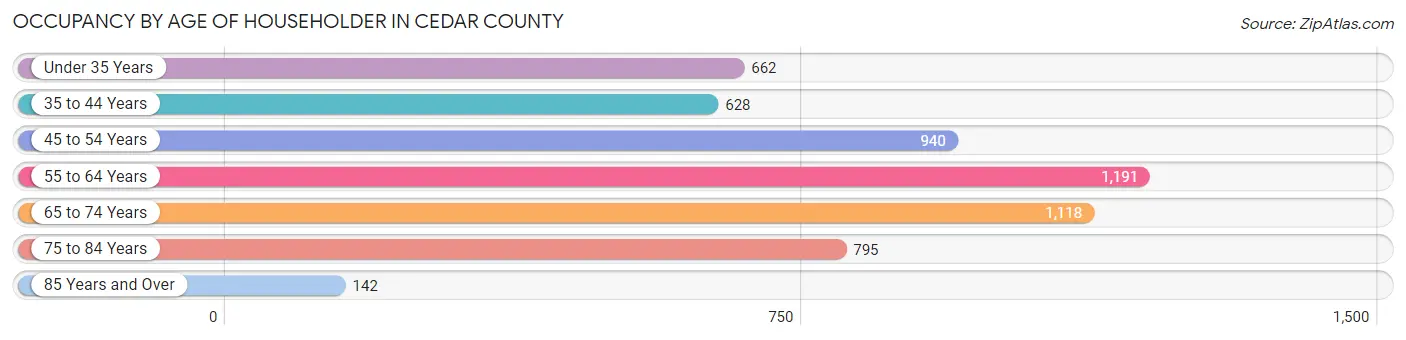
| Age Bracket | # Households | % Households |
| Under 35 Years | 662 | 12.1% |
| 35 to 44 Years | 628 | 11.5% |
| 45 to 54 Years | 940 | 17.2% |
| 55 to 64 Years | 1,191 | 21.7% |
| 65 to 74 Years | 1,118 | 20.4% |
| 75 to 84 Years | 795 | 14.5% |
| 85 Years and Over | 142 | 2.6% |
| Total | 5,476 | 100.0% |
Housing Finances in Cedar County
Median Income by Occupancy in Cedar County
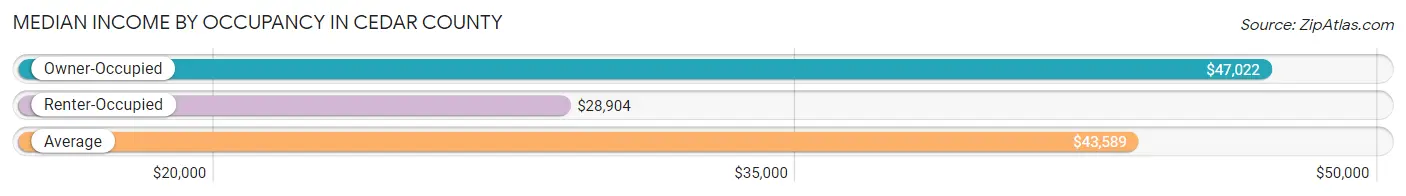
| Occupancy Type | # Households | Median Income |
| Owner-Occupied | 4,028 (73.6%) | $47,022 |
| Renter-Occupied | 1,448 (26.4%) | $28,904 |
| Average | 5,476 (100.0%) | $43,589 |
Occupancy by Householder Income Bracket in Cedar County
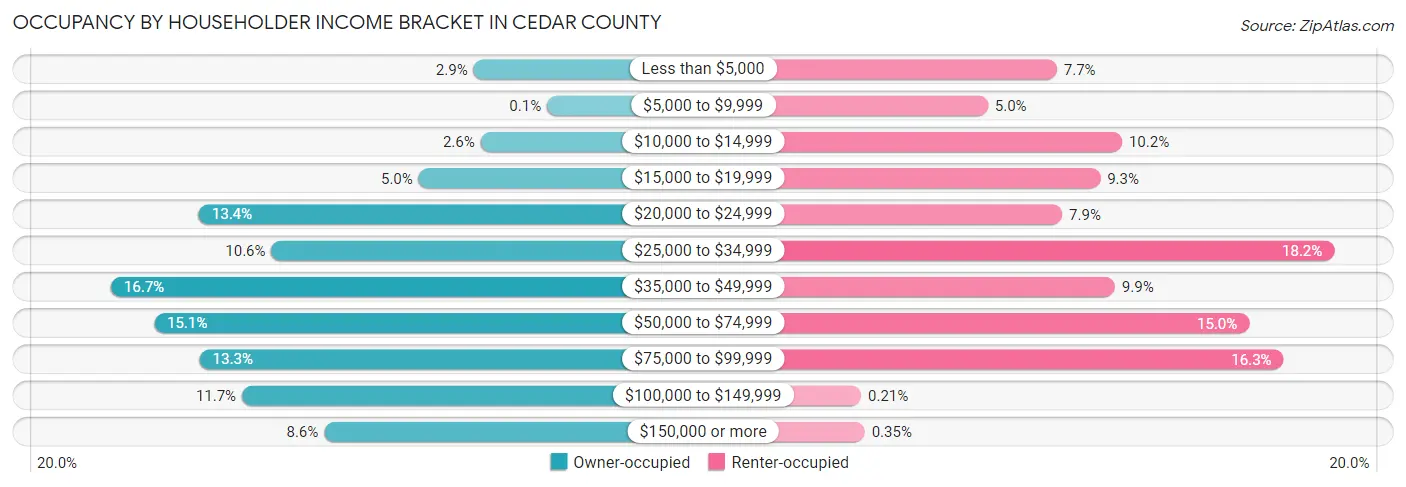
| Income Bracket | Owner-occupied | Renter-occupied |
| Less than $5,000 | 117 (2.9%) | 111 (7.7%) |
| $5,000 to $9,999 | 4 (0.1%) | 73 (5.0%) |
| $10,000 to $14,999 | 106 (2.6%) | 147 (10.2%) |
| $15,000 to $19,999 | 201 (5.0%) | 135 (9.3%) |
| $20,000 to $24,999 | 538 (13.4%) | 114 (7.9%) |
| $25,000 to $34,999 | 427 (10.6%) | 264 (18.2%) |
| $35,000 to $49,999 | 673 (16.7%) | 143 (9.9%) |
| $50,000 to $74,999 | 607 (15.1%) | 217 (15.0%) |
| $75,000 to $99,999 | 537 (13.3%) | 236 (16.3%) |
| $100,000 to $149,999 | 472 (11.7%) | 3 (0.2%) |
| $150,000 or more | 346 (8.6%) | 5 (0.4%) |
| Total | 4,028 (100.0%) | 1,448 (100.0%) |
Monthly Housing Cost Tiers in Cedar County
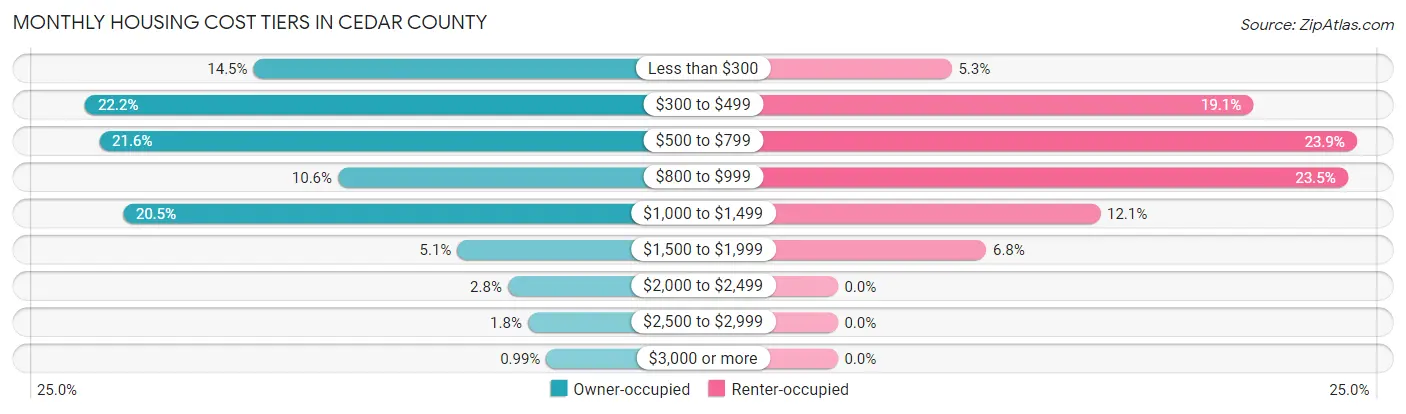
| Monthly Cost | Owner-occupied | Renter-occupied |
| Less than $300 | 583 (14.5%) | 76 (5.2%) |
| $300 to $499 | 895 (22.2%) | 277 (19.1%) |
| $500 to $799 | 869 (21.6%) | 346 (23.9%) |
| $800 to $999 | 426 (10.6%) | 340 (23.5%) |
| $1,000 to $1,499 | 825 (20.5%) | 175 (12.1%) |
| $1,500 to $1,999 | 205 (5.1%) | 99 (6.8%) |
| $2,000 to $2,499 | 111 (2.8%) | 0 (0.0%) |
| $2,500 to $2,999 | 74 (1.8%) | 0 (0.0%) |
| $3,000 or more | 40 (1.0%) | 0 (0.0%) |
| Total | 4,028 (100.0%) | 1,448 (100.0%) |
Physical Housing Characteristics in Cedar County
Housing Structures in Cedar County
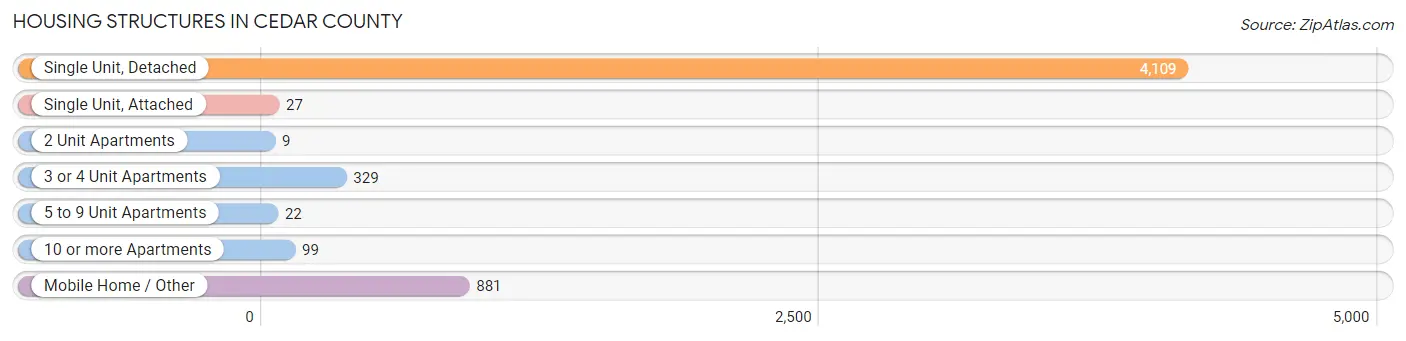
| Structure Type | # Housing Units | % Housing Units |
| Single Unit, Detached | 4,109 | 75.0% |
| Single Unit, Attached | 27 | 0.5% |
| 2 Unit Apartments | 9 | 0.2% |
| 3 or 4 Unit Apartments | 329 | 6.0% |
| 5 to 9 Unit Apartments | 22 | 0.4% |
| 10 or more Apartments | 99 | 1.8% |
| Mobile Home / Other | 881 | 16.1% |
| Total | 5,476 | 100.0% |
Housing Structures by Occupancy in Cedar County
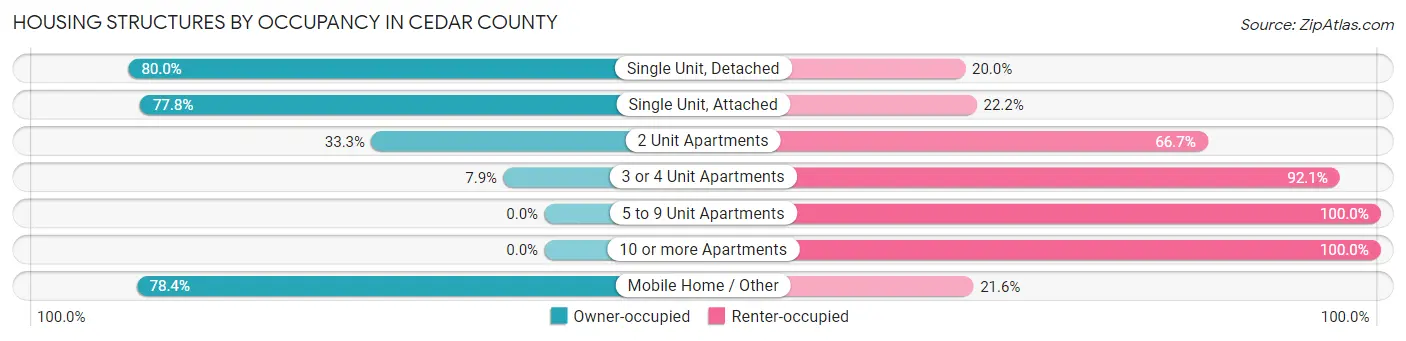
| Structure Type | Owner-occupied | Renter-occupied |
| Single Unit, Detached | 3,287 (80.0%) | 822 (20.0%) |
| Single Unit, Attached | 21 (77.8%) | 6 (22.2%) |
| 2 Unit Apartments | 3 (33.3%) | 6 (66.7%) |
| 3 or 4 Unit Apartments | 26 (7.9%) | 303 (92.1%) |
| 5 to 9 Unit Apartments | 0 (0.0%) | 22 (100.0%) |
| 10 or more Apartments | 0 (0.0%) | 99 (100.0%) |
| Mobile Home / Other | 691 (78.4%) | 190 (21.6%) |
| Total | 4,028 (73.6%) | 1,448 (26.4%) |
Housing Structures by Number of Rooms in Cedar County
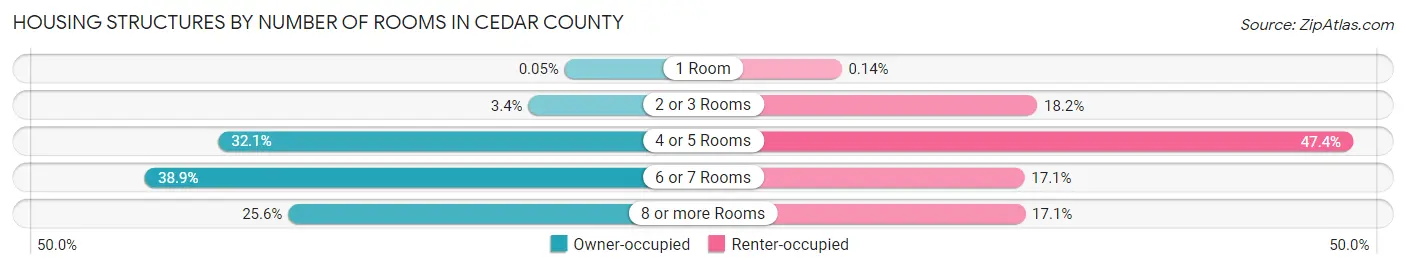
| Number of Rooms | Owner-occupied | Renter-occupied |
| 1 Room | 2 (0.1%) | 2 (0.1%) |
| 2 or 3 Rooms | 137 (3.4%) | 264 (18.2%) |
| 4 or 5 Rooms | 1,292 (32.1%) | 687 (47.4%) |
| 6 or 7 Rooms | 1,565 (38.9%) | 247 (17.1%) |
| 8 or more Rooms | 1,032 (25.6%) | 248 (17.1%) |
| Total | 4,028 (100.0%) | 1,448 (100.0%) |
Housing Structure by Heating Type in Cedar County
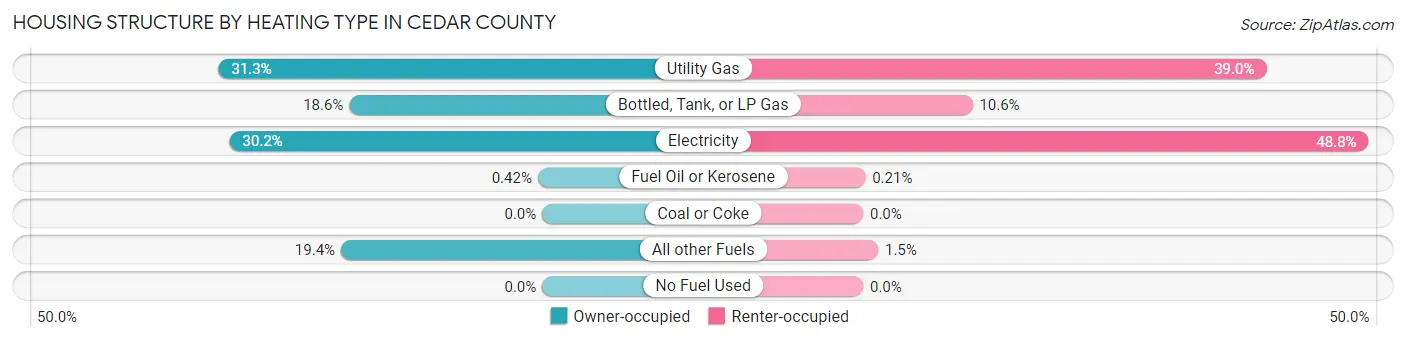
| Heating Type | Owner-occupied | Renter-occupied |
| Utility Gas | 1,260 (31.3%) | 564 (39.0%) |
| Bottled, Tank, or LP Gas | 751 (18.6%) | 153 (10.6%) |
| Electricity | 1,217 (30.2%) | 707 (48.8%) |
| Fuel Oil or Kerosene | 17 (0.4%) | 3 (0.2%) |
| Coal or Coke | 0 (0.0%) | 0 (0.0%) |
| All other Fuels | 783 (19.4%) | 21 (1.5%) |
| No Fuel Used | 0 (0.0%) | 0 (0.0%) |
| Total | 4,028 (100.0%) | 1,448 (100.0%) |
Household Vehicle Usage in Cedar County
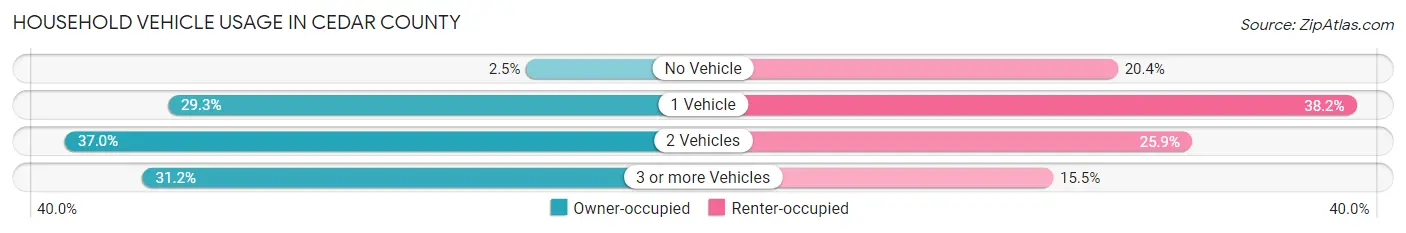
| Vehicles per Household | Owner-occupied | Renter-occupied |
| No Vehicle | 102 (2.5%) | 295 (20.4%) |
| 1 Vehicle | 1,180 (29.3%) | 553 (38.2%) |
| 2 Vehicles | 1,490 (37.0%) | 375 (25.9%) |
| 3 or more Vehicles | 1,256 (31.2%) | 225 (15.5%) |
| Total | 4,028 (100.0%) | 1,448 (100.0%) |
Real Estate & Mortgages in Cedar County
Real Estate and Mortgage Overview in Cedar County
| Characteristic | Without Mortgage | With Mortgage |
| Housing Units | 1,970 | 2,058 |
| Median Property Value | $117,200 | $166,000 |
| Median Household Income | $38,846 | $284 |
| Monthly Housing Costs | $399 | $40 |
| Real Estate Taxes | $739 | $22 |
Property Value by Mortgage Status in Cedar County
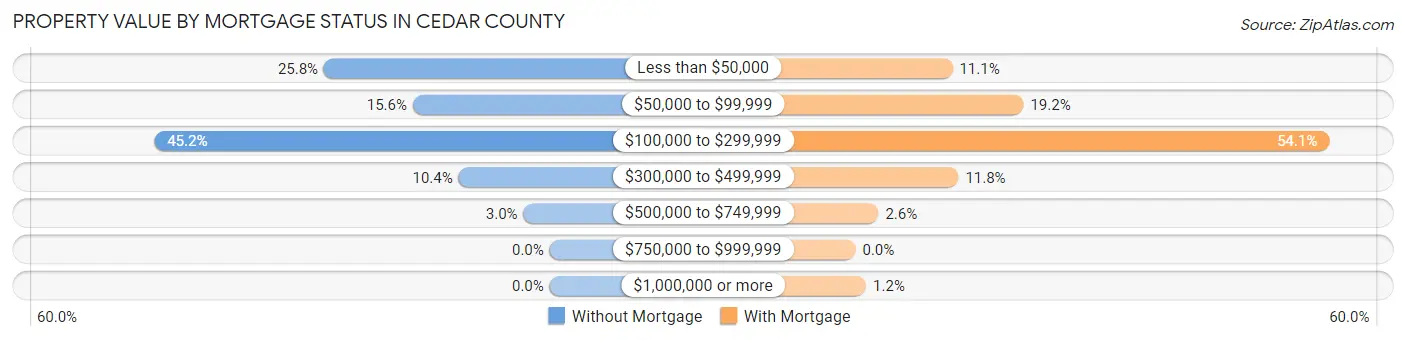
| Property Value | Without Mortgage | With Mortgage |
| Less than $50,000 | 508 (25.8%) | 228 (11.1%) |
| $50,000 to $99,999 | 308 (15.6%) | 395 (19.2%) |
| $100,000 to $299,999 | 890 (45.2%) | 1,114 (54.1%) |
| $300,000 to $499,999 | 205 (10.4%) | 242 (11.8%) |
| $500,000 to $749,999 | 59 (3.0%) | 54 (2.6%) |
| $750,000 to $999,999 | 0 (0.0%) | 0 (0.0%) |
| $1,000,000 or more | 0 (0.0%) | 25 (1.2%) |
| Total | 1,970 (100.0%) | 2,058 (100.0%) |
Household Income by Mortgage Status in Cedar County
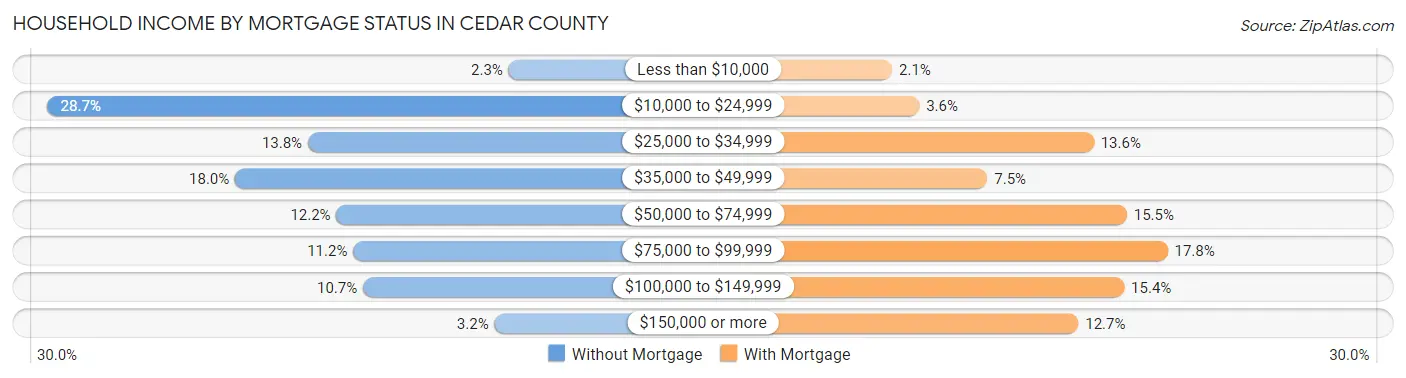
| Household Income | Without Mortgage | With Mortgage |
| Less than $10,000 | 46 (2.3%) | 43 (2.1%) |
| $10,000 to $24,999 | 565 (28.7%) | 75 (3.6%) |
| $25,000 to $34,999 | 272 (13.8%) | 280 (13.6%) |
| $35,000 to $49,999 | 354 (18.0%) | 155 (7.5%) |
| $50,000 to $74,999 | 240 (12.2%) | 319 (15.5%) |
| $75,000 to $99,999 | 221 (11.2%) | 367 (17.8%) |
| $100,000 to $149,999 | 210 (10.7%) | 316 (15.3%) |
| $150,000 or more | 62 (3.2%) | 262 (12.7%) |
| Total | 1,970 (100.0%) | 2,058 (100.0%) |
Property Value to Household Income Ratio in Cedar County
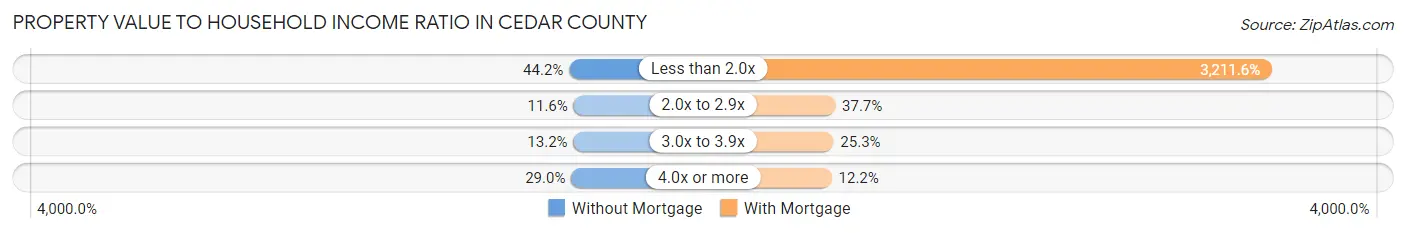
| Value-to-Income Ratio | Without Mortgage | With Mortgage |
| Less than 2.0x | 870 (44.2%) | 66,094 (3,211.6%) |
| 2.0x to 2.9x | 229 (11.6%) | 775 (37.7%) |
| 3.0x to 3.9x | 260 (13.2%) | 521 (25.3%) |
| 4.0x or more | 571 (29.0%) | 250 (12.1%) |
| Total | 1,970 (100.0%) | 2,058 (100.0%) |
Real Estate Taxes by Mortgage Status in Cedar County
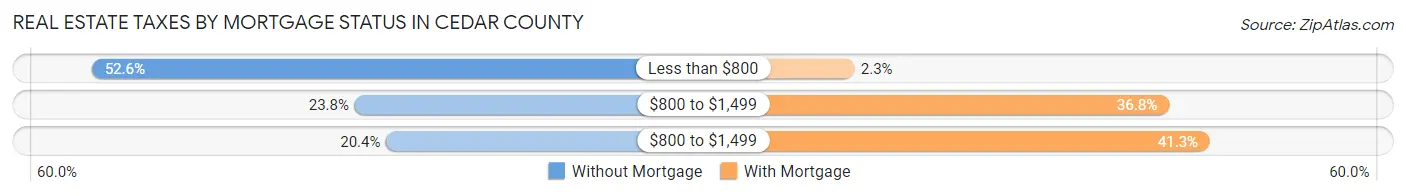
| Property Taxes | Without Mortgage | With Mortgage |
| Less than $800 | 1,037 (52.6%) | 47 (2.3%) |
| $800 to $1,499 | 469 (23.8%) | 758 (36.8%) |
| $800 to $1,499 | 401 (20.4%) | 850 (41.3%) |
| Total | 1,970 (100.0%) | 2,058 (100.0%) |
Health & Disability in Cedar County
Health Insurance Coverage by Age in Cedar County
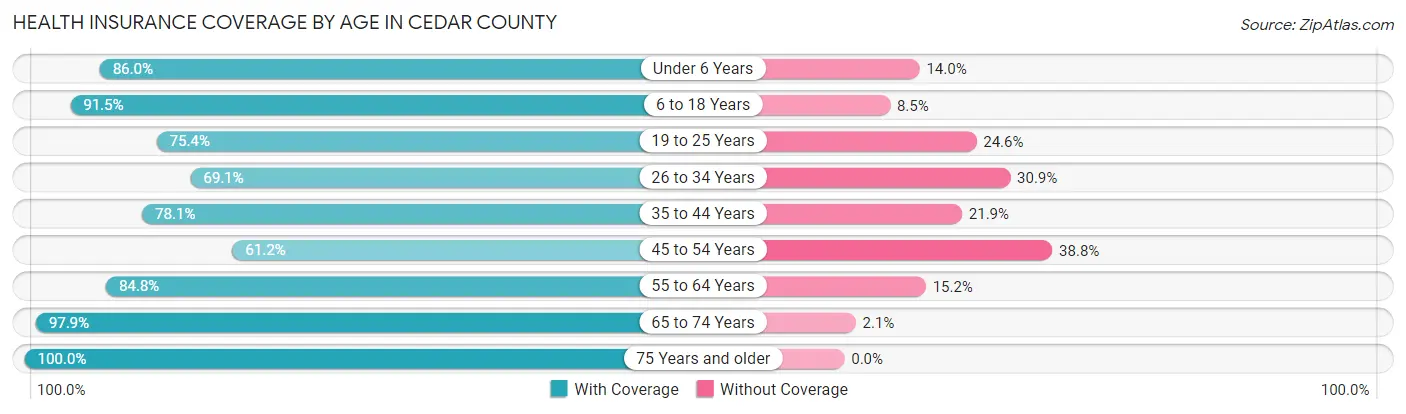
| Age Bracket | With Coverage | Without Coverage |
| Under 6 Years | 914 (86.0%) | 149 (14.0%) |
| 6 to 18 Years | 2,417 (91.5%) | 225 (8.5%) |
| 19 to 25 Years | 643 (75.4%) | 210 (24.6%) |
| 26 to 34 Years | 838 (69.1%) | 375 (30.9%) |
| 35 to 44 Years | 1,090 (78.1%) | 306 (21.9%) |
| 45 to 54 Years | 1,016 (61.2%) | 643 (38.8%) |
| 55 to 64 Years | 1,726 (84.8%) | 309 (15.2%) |
| 65 to 74 Years | 1,719 (97.9%) | 37 (2.1%) |
| 75 Years and older | 1,477 (100.0%) | 0 (0.0%) |
| Total | 11,840 (84.0%) | 2,254 (16.0%) |
Health Insurance Coverage by Citizenship Status in Cedar County
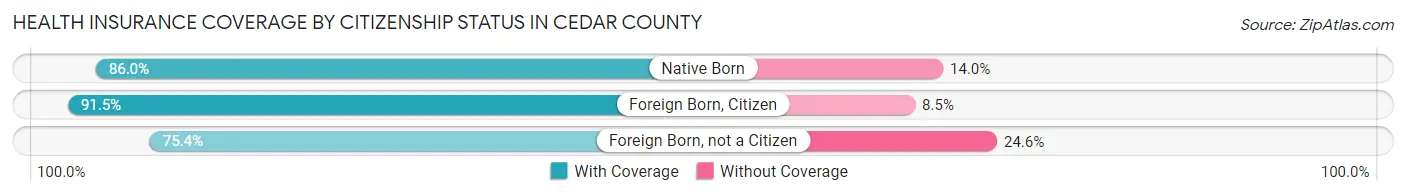
| Citizenship Status | With Coverage | Without Coverage |
| Native Born | 914 (86.0%) | 149 (14.0%) |
| Foreign Born, Citizen | 2,417 (91.5%) | 225 (8.5%) |
| Foreign Born, not a Citizen | 643 (75.4%) | 210 (24.6%) |
Health Insurance Coverage by Household Income in Cedar County
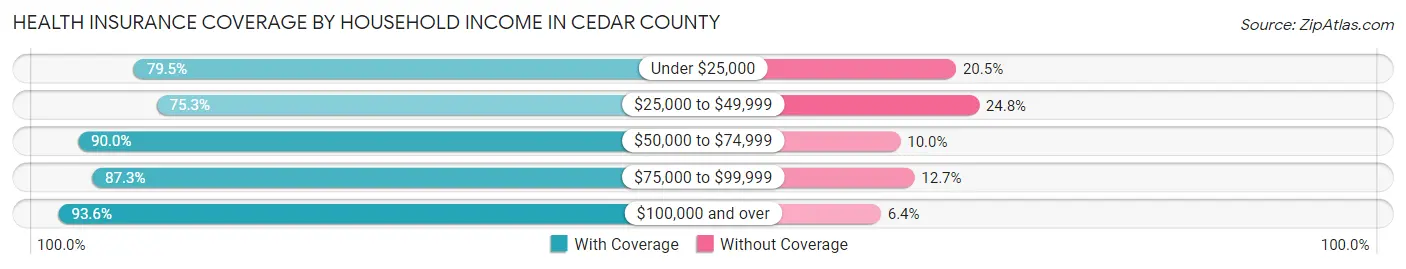
| Household Income | With Coverage | Without Coverage |
| Under $25,000 | 1,948 (79.5%) | 501 (20.5%) |
| $25,000 to $49,999 | 3,028 (75.2%) | 996 (24.7%) |
| $50,000 to $74,999 | 2,372 (90.0%) | 264 (10.0%) |
| $75,000 to $99,999 | 2,215 (87.3%) | 321 (12.7%) |
| $100,000 and over | 2,220 (93.6%) | 151 (6.4%) |
Public vs Private Health Insurance Coverage by Age in Cedar County
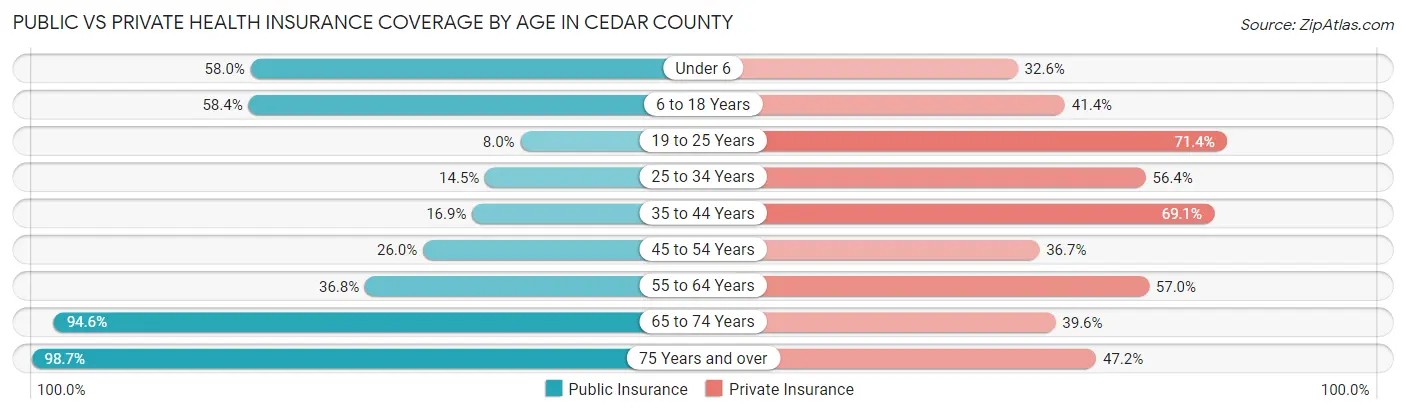
| Age Bracket | Public Insurance | Private Insurance |
| Under 6 | 617 (58.0%) | 347 (32.6%) |
| 6 to 18 Years | 1,544 (58.4%) | 1,094 (41.4%) |
| 19 to 25 Years | 68 (8.0%) | 609 (71.4%) |
| 25 to 34 Years | 176 (14.5%) | 684 (56.4%) |
| 35 to 44 Years | 236 (16.9%) | 964 (69.1%) |
| 45 to 54 Years | 432 (26.0%) | 608 (36.6%) |
| 55 to 64 Years | 749 (36.8%) | 1,160 (57.0%) |
| 65 to 74 Years | 1,661 (94.6%) | 696 (39.6%) |
| 75 Years and over | 1,458 (98.7%) | 697 (47.2%) |
| Total | 6,941 (49.2%) | 6,859 (48.7%) |
Disability Status by Sex by Age in Cedar County
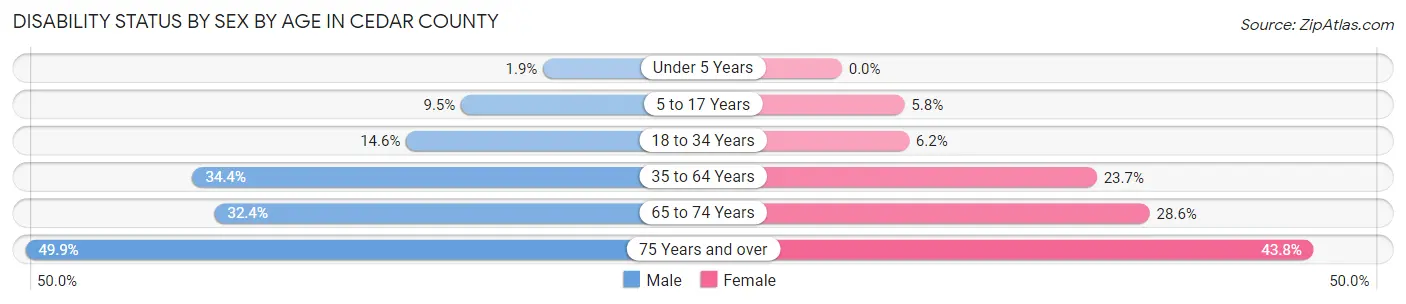
| Age Bracket | Male | Female |
| Under 5 Years | 9 (1.9%) | 0 (0.0%) |
| 5 to 17 Years | 129 (9.5%) | 68 (5.8%) |
| 18 to 34 Years | 177 (14.6%) | 69 (6.2%) |
| 35 to 64 Years | 892 (34.4%) | 591 (23.7%) |
| 65 to 74 Years | 292 (32.4%) | 244 (28.6%) |
| 75 Years and over | 319 (49.9%) | 367 (43.8%) |
Disability Class by Sex by Age in Cedar County
Disability Class: Hearing Difficulty
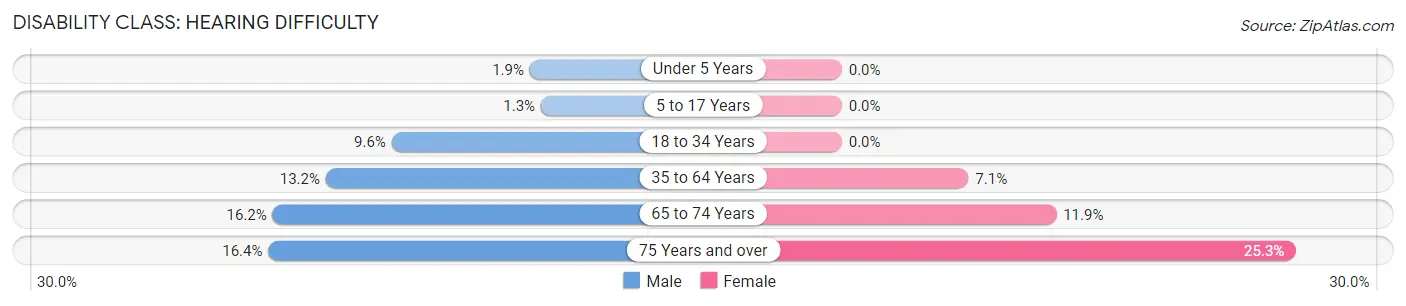
| Age Bracket | Male | Female |
| Under 5 Years | 9 (1.9%) | 0 (0.0%) |
| 5 to 17 Years | 17 (1.3%) | 0 (0.0%) |
| 18 to 34 Years | 116 (9.6%) | 0 (0.0%) |
| 35 to 64 Years | 343 (13.2%) | 176 (7.0%) |
| 65 to 74 Years | 146 (16.2%) | 102 (11.9%) |
| 75 Years and over | 105 (16.4%) | 212 (25.3%) |
Disability Class: Vision Difficulty
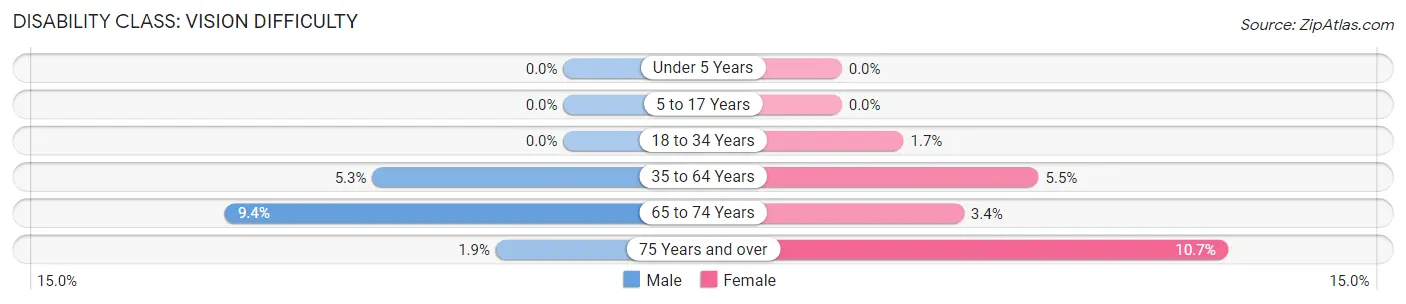
| Age Bracket | Male | Female |
| Under 5 Years | 0 (0.0%) | 0 (0.0%) |
| 5 to 17 Years | 0 (0.0%) | 0 (0.0%) |
| 18 to 34 Years | 0 (0.0%) | 19 (1.7%) |
| 35 to 64 Years | 138 (5.3%) | 137 (5.5%) |
| 65 to 74 Years | 85 (9.4%) | 29 (3.4%) |
| 75 Years and over | 12 (1.9%) | 90 (10.7%) |
Disability Class: Cognitive Difficulty
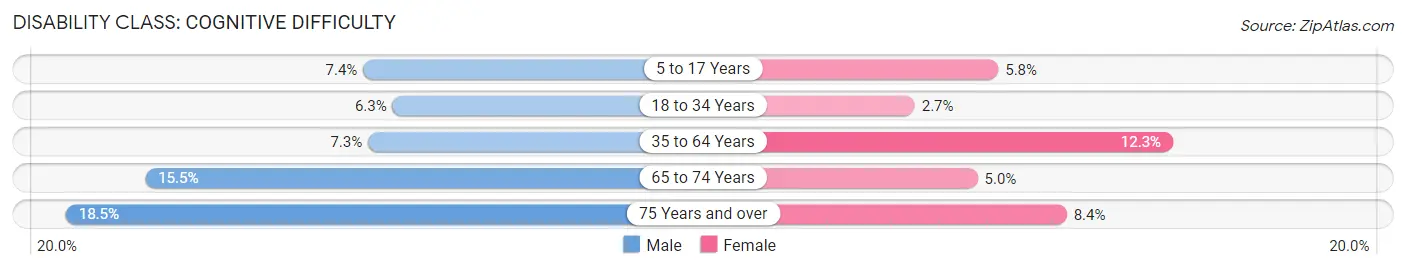
| Age Bracket | Male | Female |
| 5 to 17 Years | 101 (7.4%) | 68 (5.8%) |
| 18 to 34 Years | 77 (6.3%) | 30 (2.7%) |
| 35 to 64 Years | 188 (7.2%) | 307 (12.3%) |
| 65 to 74 Years | 140 (15.5%) | 43 (5.0%) |
| 75 Years and over | 118 (18.5%) | 70 (8.4%) |
Disability Class: Ambulatory Difficulty
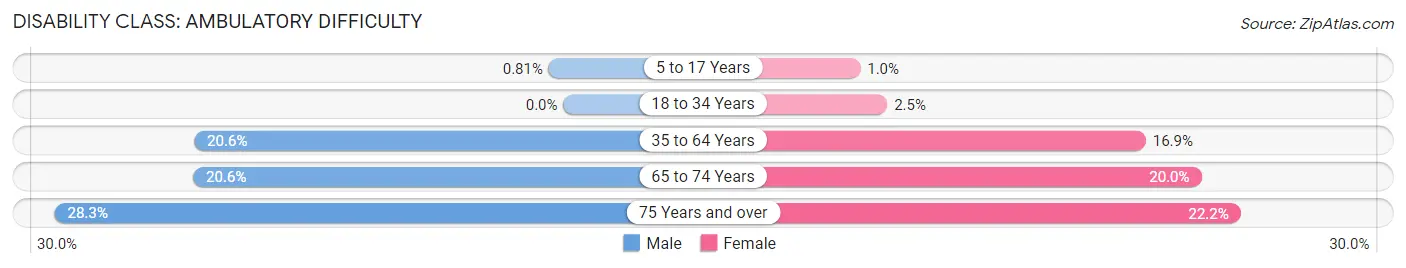
| Age Bracket | Male | Female |
| 5 to 17 Years | 11 (0.8%) | 12 (1.0%) |
| 18 to 34 Years | 0 (0.0%) | 28 (2.5%) |
| 35 to 64 Years | 533 (20.6%) | 423 (16.9%) |
| 65 to 74 Years | 186 (20.6%) | 171 (20.0%) |
| 75 Years and over | 181 (28.3%) | 186 (22.2%) |
Disability Class: Self-Care Difficulty
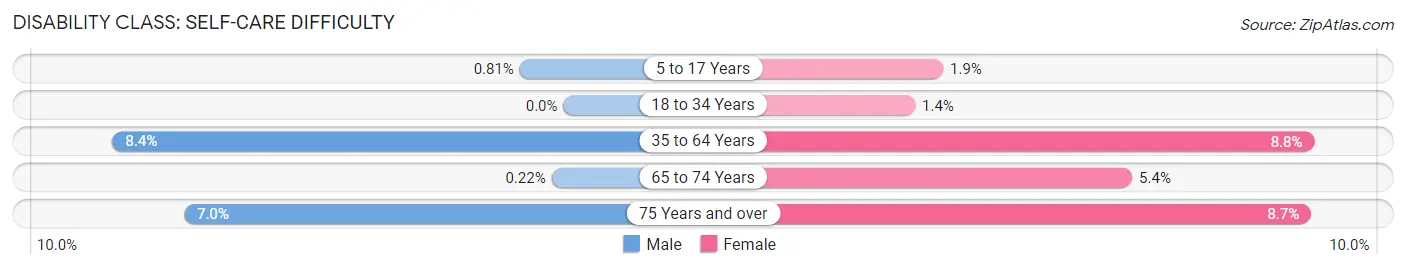
| Age Bracket | Male | Female |
| 5 to 17 Years | 11 (0.8%) | 22 (1.9%) |
| 18 to 34 Years | 0 (0.0%) | 15 (1.4%) |
| 35 to 64 Years | 217 (8.4%) | 219 (8.8%) |
| 65 to 74 Years | 2 (0.2%) | 46 (5.4%) |
| 75 Years and over | 45 (7.0%) | 73 (8.7%) |
Technology Access in Cedar County
Computing Device Access in Cedar County
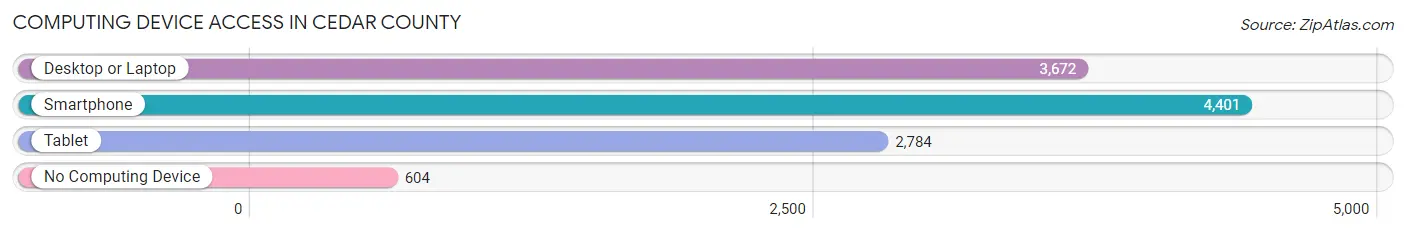
| Device Type | # Households | % Households |
| Desktop or Laptop | 3,672 | 67.1% |
| Smartphone | 4,401 | 80.4% |
| Tablet | 2,784 | 50.8% |
| No Computing Device | 604 | 11.0% |
| Total | 5,476 | 100.0% |
Internet Access in Cedar County
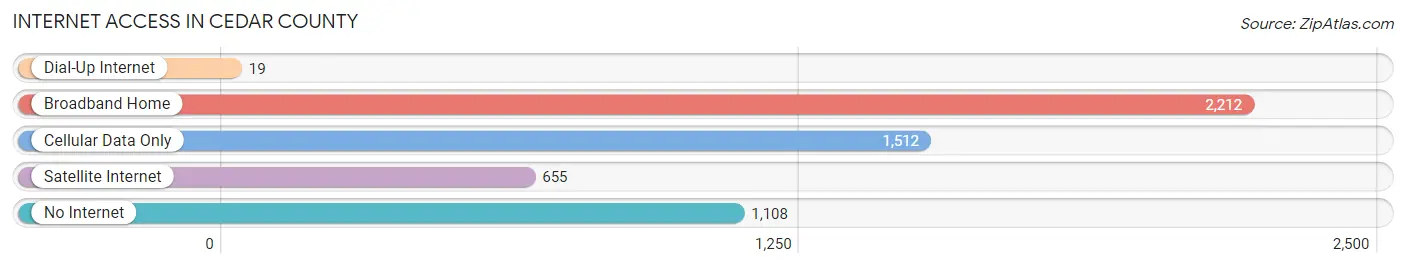
| Internet Type | # Households | % Households |
| Dial-Up Internet | 19 | 0.4% |
| Broadband Home | 2,212 | 40.4% |
| Cellular Data Only | 1,512 | 27.6% |
| Satellite Internet | 655 | 12.0% |
| No Internet | 1,108 | 20.2% |
| Total | 5,476 | 100.0% |
Cedar County Summary
Cedar County is located in the southwestern corner of Missouri, and is bordered by the states of Arkansas and Oklahoma. It is part of the Ozark Plateau region, and is known for its rolling hills and wooded areas. The county seat is Stockton, and the county has a population of approximately 13,000 people.
Geography
Cedar County is located in the southwestern corner of Missouri, and is bordered by the states of Arkansas and Oklahoma. It is part of the Ozark Plateau region, and is known for its rolling hills and wooded areas. The county is divided into two distinct regions: the Ozark Plateau in the north and the Ozark Mountains in the south. The highest point in the county is located in the Ozark Mountains, at an elevation of 1,400 feet. The county is also home to several rivers, including the Elk, Sac, and Niangua.
Economy
Cedar County’s economy is largely based on agriculture, with the majority of the county’s land being used for farming. The county is home to a variety of crops, including corn, soybeans, wheat, hay, and oats. Livestock production is also an important part of the county’s economy, with cattle, hogs, and poultry being raised in the area.
In addition to agriculture, Cedar County is home to several manufacturing companies, including a furniture factory, a woodworking plant, and a plastics factory. The county is also home to several tourist attractions, including the Stockton Lake State Park, the Cedar County Historical Museum, and the Cedar County Fairgrounds.
Demographics
As of the 2010 census, Cedar County had a population of 12,845 people. The population is spread out across the county, with the largest population centers being Stockton, El Dorado Springs, and Jerico Springs. The racial makeup of the county is 95.3% White, 0.7% African American, 0.4% Native American, 0.2% Asian, 0.1% Pacific Islander, 1.7% from other races, and 1.6% from two or more races. Hispanic or Latino of any race were 3.2% of the population.
The median income for a household in the county was $35,945, and the median income for a family was $41,945. The per capita income for the county was $17,845. About 15.2% of families and 19.2% of the population were below the poverty line, including 25.2% of those under age 18 and 11.2% of those age 65 or over.
Conclusion
Cedar County is a rural county located in the southwestern corner of Missouri. It is part of the Ozark Plateau region, and is known for its rolling hills and wooded areas. The county’s economy is largely based on agriculture, with the majority of the county’s land being used for farming. The county is also home to several manufacturing companies, tourist attractions, and a variety of other businesses. The population of Cedar County is approximately 12,845 people, and the median income for a household is $35,945.
Common Questions
What is Per Capita Income in Cedar County?
Per Capita income in Cedar County is $27,243.
What is the Median Family Income in Cedar County?
Median Family Income in Cedar County is $57,762.
What is the Median Household income in Cedar County?
Median Household Income in Cedar County is $43,589.
What is Income or Wage Gap in Cedar County?
Income or Wage Gap in Cedar County is 41.7%.
Women in Cedar County earn 58.3 cents for every dollar earned by a man.
What is Family Income Deficit in Cedar County?
Family Income Deficit in Cedar County is $11,302.
Families that are below poverty line in Cedar County earn $11,302 less on average than the poverty threshold level.
What is Inequality or Gini Index in Cedar County?
Inequality or Gini Index in Cedar County is 0.53.
What is the Total Population of Cedar County?
Total Population of Cedar County is 14,314.
What is the Total Male Population of Cedar County?
Total Male Population of Cedar County is 7,313.
What is the Total Female Population of Cedar County?
Total Female Population of Cedar County is 7,001.
What is the Ratio of Males per 100 Females in Cedar County?
There are 104.46 Males per 100 Females in Cedar County.
What is the Ratio of Females per 100 Males in Cedar County?
There are 95.73 Females per 100 Males in Cedar County.
What is the Median Population Age in Cedar County?
Median Population Age in Cedar County is 44.8 Years.
What is the Average Family Size in Cedar County
Average Family Size in Cedar County is 3.3 People.
What is the Average Household Size in Cedar County
Average Household Size in Cedar County is 2.6 People.
How Large is the Labor Force in Cedar County?
There are 5,499 People in the Labor Forcein in Cedar County.
What is the Percentage of People in the Labor Force in Cedar County?
48.3% of People are in the Labor Force in Cedar County.
What is the Unemployment Rate in Cedar County?
Unemployment Rate in Cedar County is 2.5%.