Cass County, MO Map & Demographics
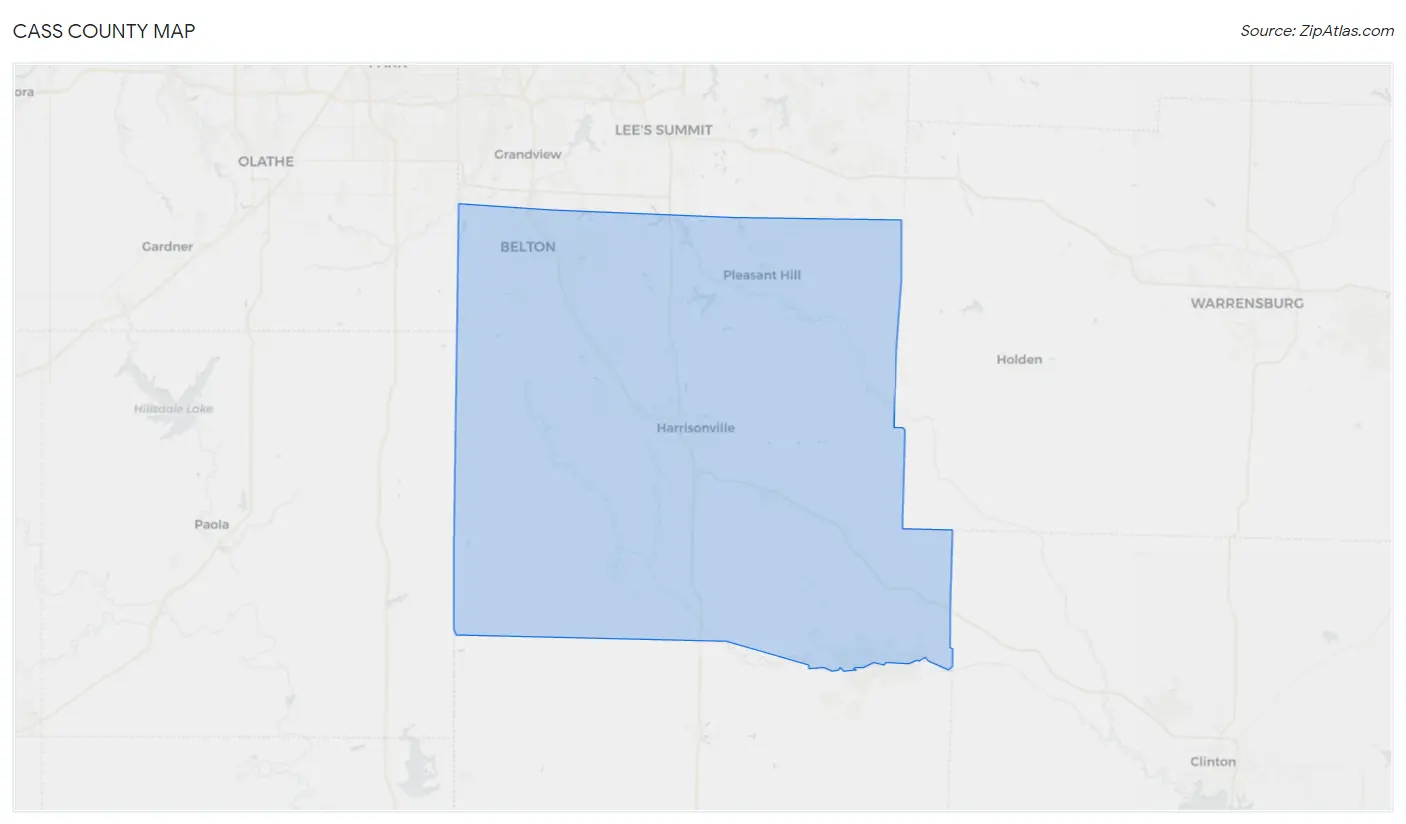
Cass County Map
Cass County Overview
$38,766
PER CAPITA INCOME
$98,960
AVG FAMILY INCOME
$82,473
AVG HOUSEHOLD INCOME
28.2%
WAGE / INCOME GAP [ % ]
71.8¢/ $1
WAGE / INCOME GAP [ $ ]
$10,088
FAMILY INCOME DEFICIT
0.40
INEQUALITY / GINI INDEX
108,205
TOTAL POPULATION
53,087
MALE POPULATION
55,118
FEMALE POPULATION
96.32
MALES / 100 FEMALES
103.83
FEMALES / 100 MALES
39.9
MEDIAN AGE
3.0
AVG FAMILY SIZE
2.6
AVG HOUSEHOLD SIZE
57,100
LABOR FORCE [ PEOPLE ]
66.6%
PERCENT IN LABOR FORCE
4.5%
UNEMPLOYMENT RATE
Income in Cass County
Income Overview in Cass County
Per Capita Income in Cass County is $38,766, while median incomes of families and households are $98,960 and $82,473 respectively.
| Characteristic | Number | Measure |
| Per Capita Income | 108,205 | $38,766 |
| Median Family Income | 30,138 | $98,960 |
| Mean Family Income | 30,138 | $113,389 |
| Median Household Income | 41,524 | $82,473 |
| Mean Household Income | 41,524 | $99,261 |
| Income Deficit | 30,138 | $10,088 |
| Wage / Income Gap (%) | 108,205 | 28.22% |
| Wage / Income Gap ($) | 108,205 | 71.78¢ per $1 |
| Gini / Inequality Index | 108,205 | 0.40 |
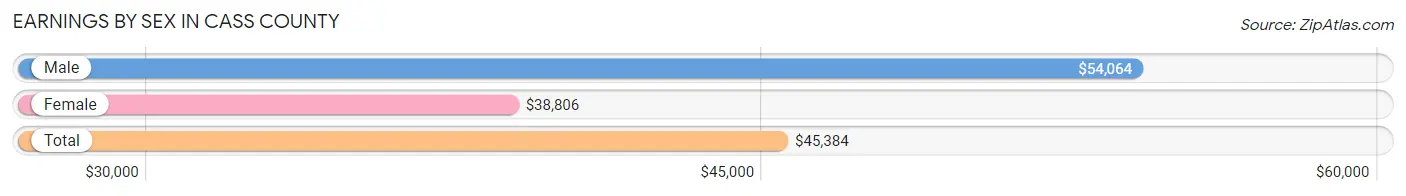
Earnings by Sex in Cass County
Average Earnings in Cass County are $45,384, $54,064 for men and $38,806 for women, a difference of 28.2%.
| Sex | Number | Average Earnings |
| Male | 30,936 (51.7%) | $54,064 |
| Female | 28,845 (48.2%) | $38,806 |
| Total | 59,781 (100.0%) | $45,384 |
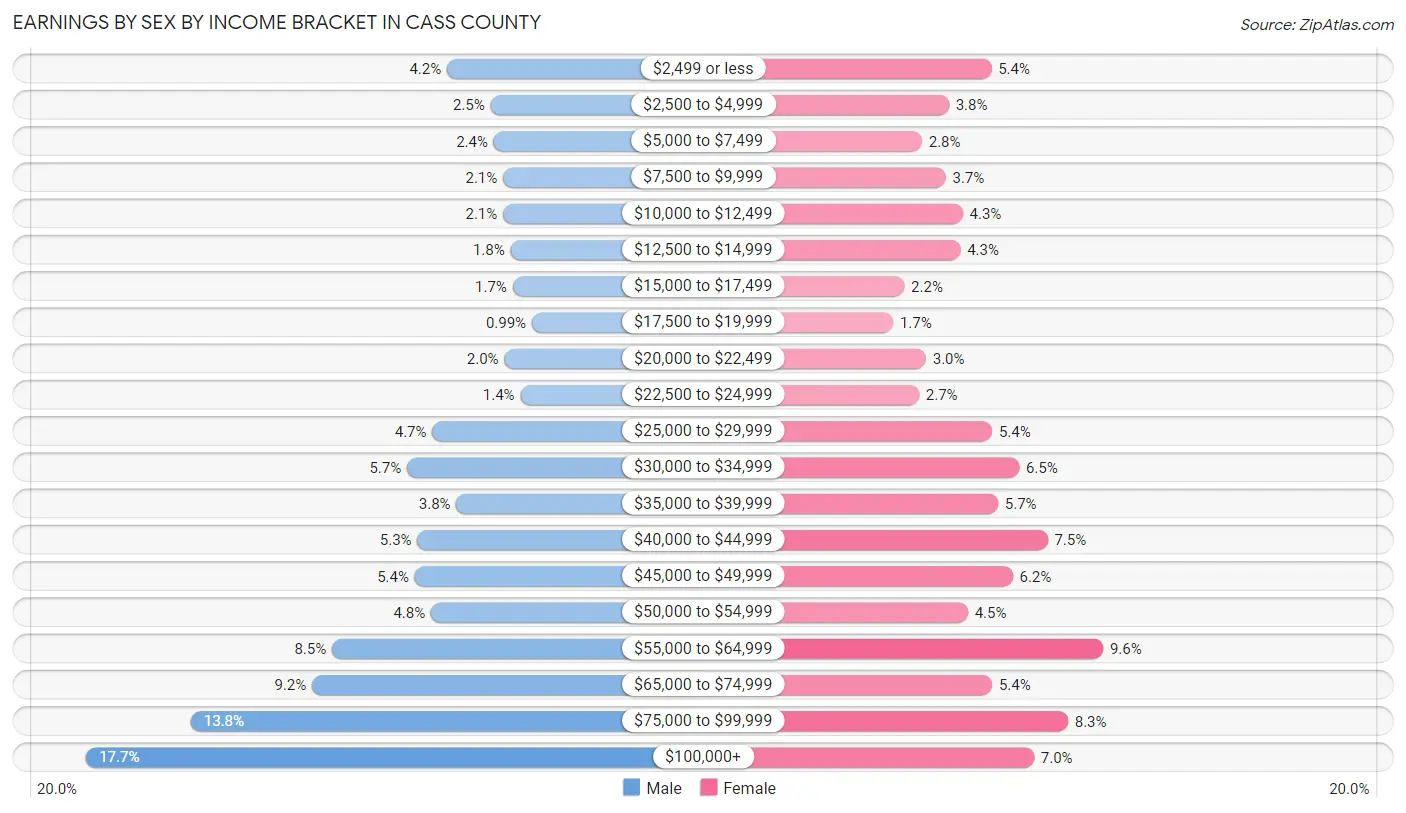
Earnings by Sex by Income Bracket in Cass County
The most common earnings brackets in Cass County are $100,000+ for men (5,472 | 17.7%) and $55,000 to $64,999 for women (2,769 | 9.6%).
| Income | Male | Female |
| $2,499 or less | 1,290 (4.2%) | 1,561 (5.4%) |
| $2,500 to $4,999 | 787 (2.5%) | 1,101 (3.8%) |
| $5,000 to $7,499 | 750 (2.4%) | 810 (2.8%) |
| $7,500 to $9,999 | 639 (2.1%) | 1,066 (3.7%) |
| $10,000 to $12,499 | 639 (2.1%) | 1,251 (4.3%) |
| $12,500 to $14,999 | 555 (1.8%) | 1,227 (4.3%) |
| $15,000 to $17,499 | 529 (1.7%) | 619 (2.1%) |
| $17,500 to $19,999 | 306 (1.0%) | 498 (1.7%) |
| $20,000 to $22,499 | 626 (2.0%) | 855 (3.0%) |
| $22,500 to $24,999 | 440 (1.4%) | 778 (2.7%) |
| $25,000 to $29,999 | 1,459 (4.7%) | 1,568 (5.4%) |
| $30,000 to $34,999 | 1,753 (5.7%) | 1,860 (6.5%) |
| $35,000 to $39,999 | 1,181 (3.8%) | 1,634 (5.7%) |
| $40,000 to $44,999 | 1,633 (5.3%) | 2,170 (7.5%) |
| $45,000 to $49,999 | 1,664 (5.4%) | 1,790 (6.2%) |
| $50,000 to $54,999 | 1,475 (4.8%) | 1,308 (4.5%) |
| $55,000 to $64,999 | 2,623 (8.5%) | 2,769 (9.6%) |
| $65,000 to $74,999 | 2,854 (9.2%) | 1,570 (5.4%) |
| $75,000 to $99,999 | 4,261 (13.8%) | 2,389 (8.3%) |
| $100,000+ | 5,472 (17.7%) | 2,021 (7.0%) |
| Total | 30,936 (100.0%) | 28,845 (100.0%) |
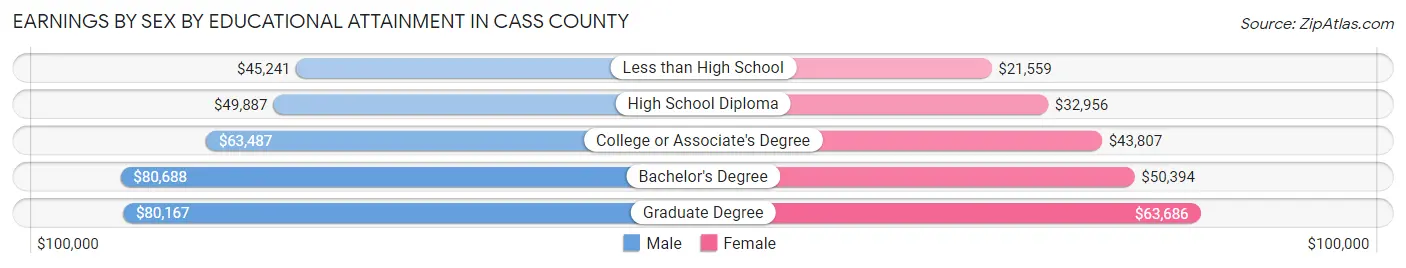
Earnings by Sex by Educational Attainment in Cass County
Average earnings in Cass County are $61,634 for men and $43,915 for women, a difference of 28.7%. Men with an educational attainment of bachelor's degree enjoy the highest average annual earnings of $80,688, while those with less than high school education earn the least with $45,241. Women with an educational attainment of graduate degree earn the most with the average annual earnings of $63,686, while those with less than high school education have the smallest earnings of $21,559.
| Educational Attainment | Male Income | Female Income |
| Less than High School | $45,241 | $21,559 |
| High School Diploma | $49,887 | $32,956 |
| College or Associate's Degree | $63,487 | $43,807 |
| Bachelor's Degree | $80,688 | $50,394 |
| Graduate Degree | $80,167 | $63,686 |
| Total | $61,634 | $43,915 |
Family Income in Cass County
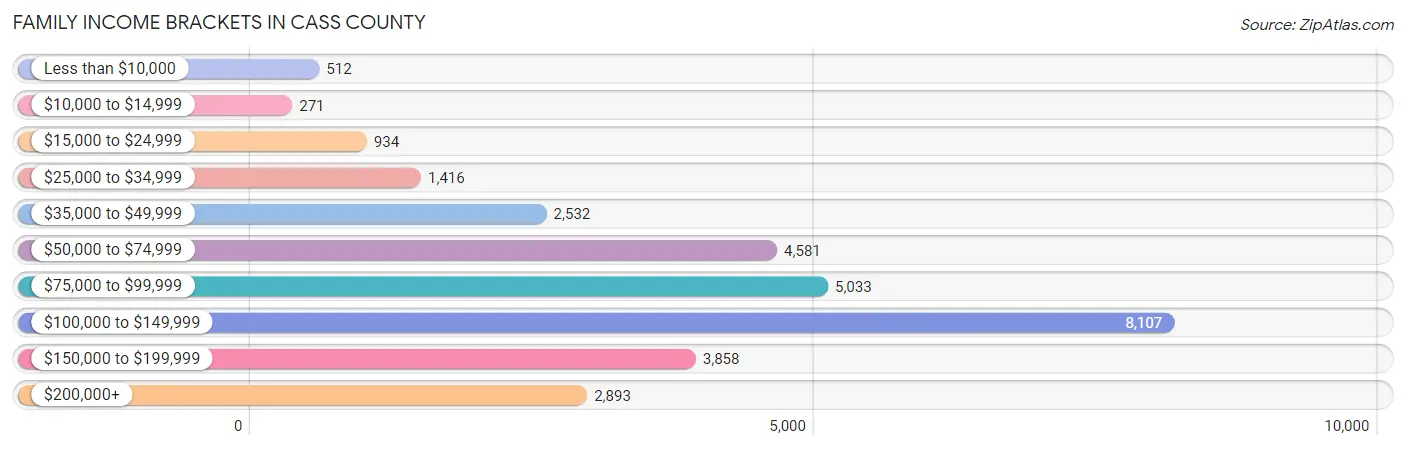
Family Income Brackets in Cass County
According to the Cass County family income data, there are 8,107 families falling into the $100,000 to $149,999 income range, which is the most common income bracket and makes up 26.9% of all families. Conversely, the $10,000 to $14,999 income bracket is the least frequent group with only 271 families (0.9%) belonging to this category.
| Income Bracket | # Families | % Families |
| Less than $10,000 | 512 | 1.7% |
| $10,000 to $14,999 | 271 | 0.9% |
| $15,000 to $24,999 | 934 | 3.1% |
| $25,000 to $34,999 | 1,416 | 4.7% |
| $35,000 to $49,999 | 2,532 | 8.4% |
| $50,000 to $74,999 | 4,581 | 15.2% |
| $75,000 to $99,999 | 5,033 | 16.7% |
| $100,000 to $149,999 | 8,107 | 26.9% |
| $150,000 to $199,999 | 3,858 | 12.8% |
| $200,000+ | 2,893 | 9.6% |
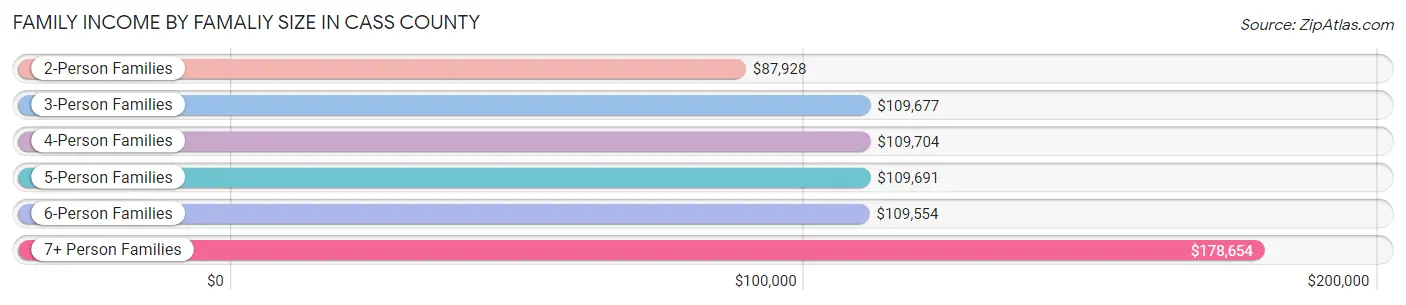
Family Income by Famaliy Size in Cass County
7+ person families (500 | 1.7%) account for the highest median family income in Cass County with $178,654 per family, while 2-person families (15,322 | 50.8%) have the highest median income of $43,964 per family member.
| Income Bracket | # Families | Median Income |
| 2-Person Families | 15,322 (50.8%) | $87,928 |
| 3-Person Families | 6,269 (20.8%) | $109,677 |
| 4-Person Families | 4,839 (16.1%) | $109,704 |
| 5-Person Families | 2,545 (8.4%) | $109,691 |
| 6-Person Families | 663 (2.2%) | $109,554 |
| 7+ Person Families | 500 (1.7%) | $178,654 |
| Total | 30,138 (100.0%) | $98,960 |
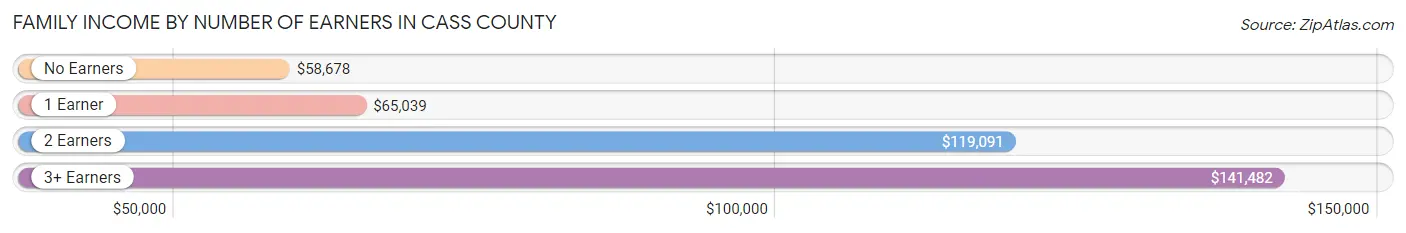
Family Income by Number of Earners in Cass County
The median family income in Cass County is $98,960, with families comprising 3+ earners (4,133) having the highest median family income of $141,482, while families with no earners (3,968) have the lowest median family income of $58,678, accounting for 13.7% and 13.2% of families, respectively.
| Number of Earners | # Families | Median Income |
| No Earners | 3,968 (13.2%) | $58,678 |
| 1 Earner | 9,289 (30.8%) | $65,039 |
| 2 Earners | 12,748 (42.3%) | $119,091 |
| 3+ Earners | 4,133 (13.7%) | $141,482 |
| Total | 30,138 (100.0%) | $98,960 |
Household Income in Cass County
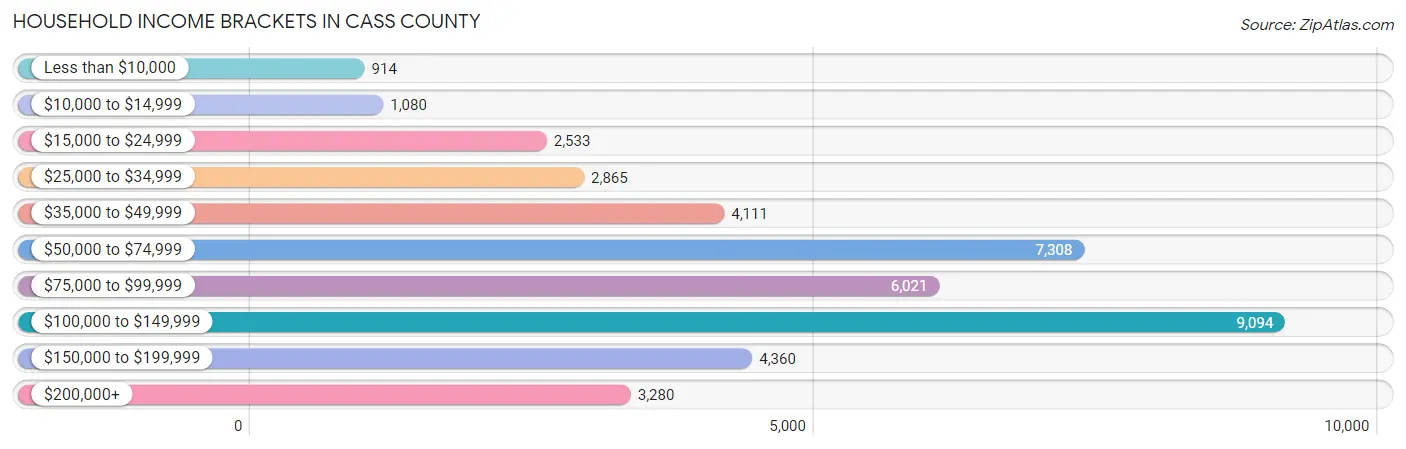
Household Income Brackets in Cass County
With 9,094 households falling in the category, the $100,000 to $149,999 income range is the most frequent in Cass County, accounting for 21.9% of all households. In contrast, only 914 households (2.2%) fall into the less than $10,000 income bracket, making it the least populous group.
| Income Bracket | # Households | % Households |
| Less than $10,000 | 914 | 2.2% |
| $10,000 to $14,999 | 1,080 | 2.6% |
| $15,000 to $24,999 | 2,533 | 6.1% |
| $25,000 to $34,999 | 2,865 | 6.9% |
| $35,000 to $49,999 | 4,111 | 9.9% |
| $50,000 to $74,999 | 7,308 | 17.6% |
| $75,000 to $99,999 | 6,021 | 14.5% |
| $100,000 to $149,999 | 9,094 | 21.9% |
| $150,000 to $199,999 | 4,360 | 10.5% |
| $200,000+ | 3,280 | 7.9% |
Household Income by Householder Age in Cass County
The median household income in Cass County is $82,473, with the highest median household income of $110,622 found in the 45 to 64 years age bracket for the primary householder. A total of 16,148 households (38.9%) fall into this category. Meanwhile, the 15 to 24 years age bracket for the primary householder has the lowest median household income of $45,430, with 1,217 households (2.9%) in this group.
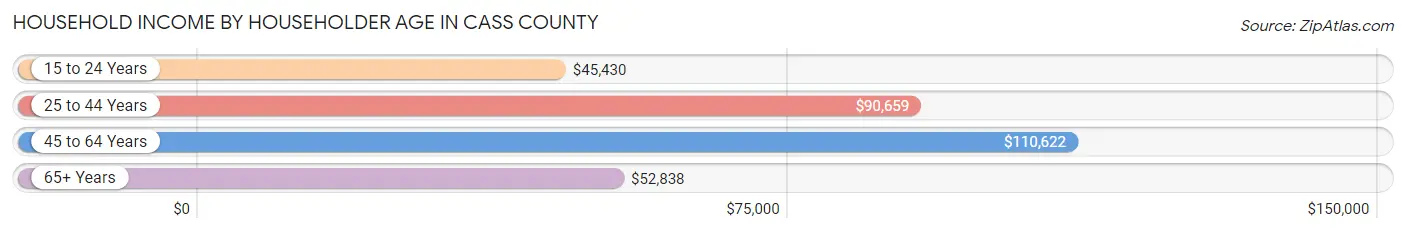
| Income Bracket | # Households | Median Income |
| 15 to 24 Years | 1,217 (2.9%) | $45,430 |
| 25 to 44 Years | 12,745 (30.7%) | $90,659 |
| 45 to 64 Years | 16,148 (38.9%) | $110,622 |
| 65+ Years | 11,414 (27.5%) | $52,838 |
| Total | 41,524 (100.0%) | $82,473 |
Poverty in Cass County
Income Below Poverty by Sex and Age in Cass County
With 5.8% poverty level for males and 8.1% for females among the residents of Cass County, under 5 year old males and 18 to 24 year old females are the most vulnerable to poverty, with 517 males (16.6%) and 848 females (20.5%) in their respective age groups living below the poverty level.
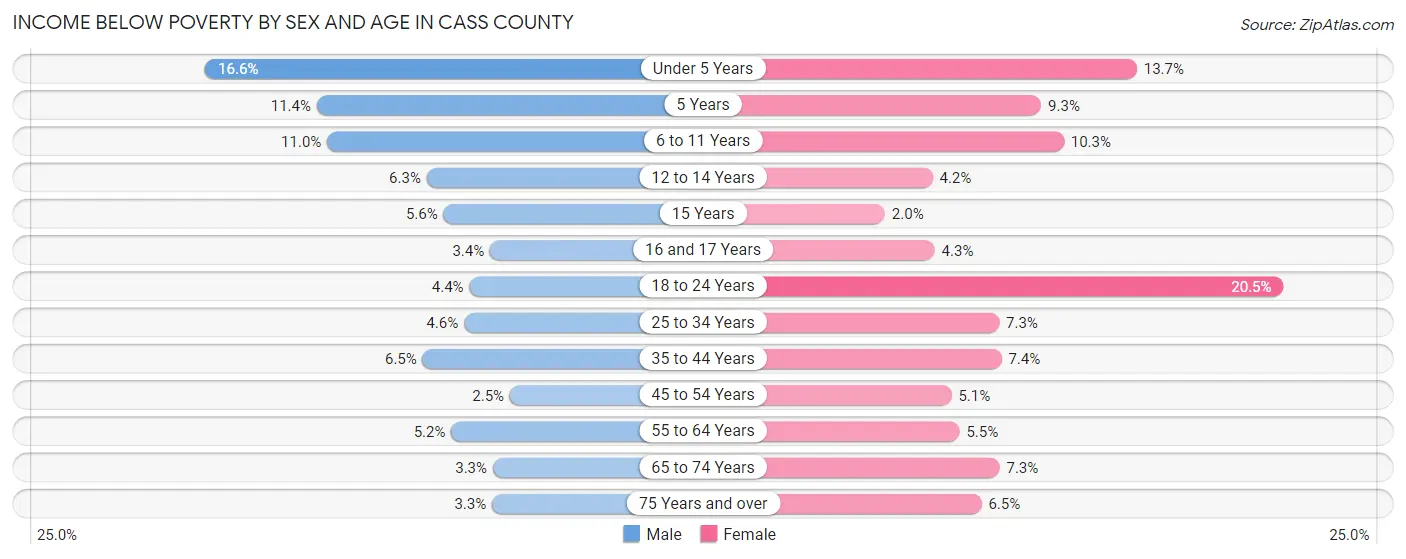
| Age Bracket | Male | Female |
| Under 5 Years | 517 (16.6%) | 418 (13.7%) |
| 5 Years | 50 (11.4%) | 63 (9.2%) |
| 6 to 11 Years | 475 (11.0%) | 448 (10.3%) |
| 12 to 14 Years | 167 (6.3%) | 84 (4.2%) |
| 15 Years | 51 (5.6%) | 12 (2.0%) |
| 16 and 17 Years | 51 (3.4%) | 72 (4.3%) |
| 18 to 24 Years | 194 (4.4%) | 848 (20.5%) |
| 25 to 34 Years | 293 (4.6%) | 457 (7.3%) |
| 35 to 44 Years | 443 (6.5%) | 522 (7.4%) |
| 45 to 54 Years | 167 (2.5%) | 348 (5.1%) |
| 55 to 64 Years | 381 (5.2%) | 424 (5.5%) |
| 65 to 74 Years | 159 (3.3%) | 403 (7.3%) |
| 75 Years and over | 104 (3.3%) | 289 (6.5%) |
| Total | 3,052 (5.8%) | 4,388 (8.1%) |
Income Above Poverty by Sex and Age in Cass County
According to the poverty statistics in Cass County, males aged 45 to 54 years and females aged 15 years are the age groups that are most secure financially, with 97.5% of males and 98.0% of females in these age groups living above the poverty line.
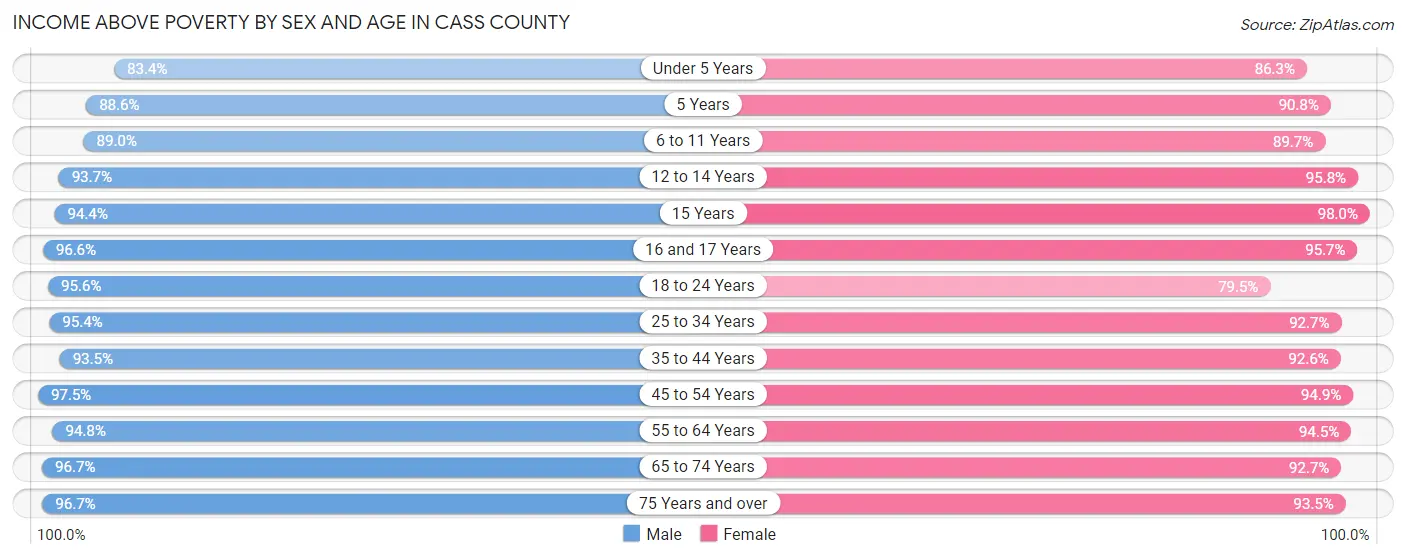
| Age Bracket | Male | Female |
| Under 5 Years | 2,594 (83.4%) | 2,635 (86.3%) |
| 5 Years | 387 (88.6%) | 618 (90.7%) |
| 6 to 11 Years | 3,858 (89.0%) | 3,900 (89.7%) |
| 12 to 14 Years | 2,467 (93.7%) | 1,910 (95.8%) |
| 15 Years | 866 (94.4%) | 587 (98.0%) |
| 16 and 17 Years | 1,447 (96.6%) | 1,600 (95.7%) |
| 18 to 24 Years | 4,252 (95.6%) | 3,291 (79.5%) |
| 25 to 34 Years | 6,065 (95.4%) | 5,803 (92.7%) |
| 35 to 44 Years | 6,338 (93.5%) | 6,526 (92.6%) |
| 45 to 54 Years | 6,557 (97.5%) | 6,488 (94.9%) |
| 55 to 64 Years | 6,942 (94.8%) | 7,336 (94.5%) |
| 65 to 74 Years | 4,703 (96.7%) | 5,104 (92.7%) |
| 75 Years and over | 3,036 (96.7%) | 4,169 (93.5%) |
| Total | 49,512 (94.2%) | 49,967 (91.9%) |
Income Below Poverty Among Married-Couple Families in Cass County
The poverty statistics for married-couple families in Cass County show that 1.9% or 437 of the total 23,308 families live below the poverty line. Families with 5 or more children have the highest poverty rate of 5.9%, comprising of 14 families. On the other hand, families with 1 or 2 children have the lowest poverty rate of 1.5%, which includes 99 families.
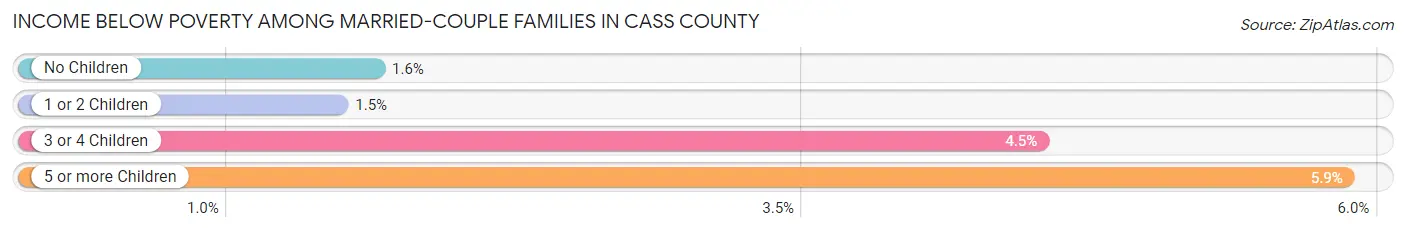
| Children | Above Poverty | Below Poverty |
| No Children | 14,219 (98.4%) | 237 (1.6%) |
| 1 or 2 Children | 6,593 (98.5%) | 99 (1.5%) |
| 3 or 4 Children | 1,834 (95.5%) | 87 (4.5%) |
| 5 or more Children | 225 (94.1%) | 14 (5.9%) |
| Total | 22,871 (98.1%) | 437 (1.9%) |
Income Below Poverty Among Single-Parent Households in Cass County
According to the poverty data in Cass County, 10.5% or 254 single-father households and 17.9% or 786 single-mother households are living below the poverty line. Among single-father households, those with 1 or 2 children have the highest poverty rate, with 221 households (14.6%) experiencing poverty. Likewise, among single-mother households, those with 5 or more children have the highest poverty rate, with 8 households (100.0%) falling below the poverty line.
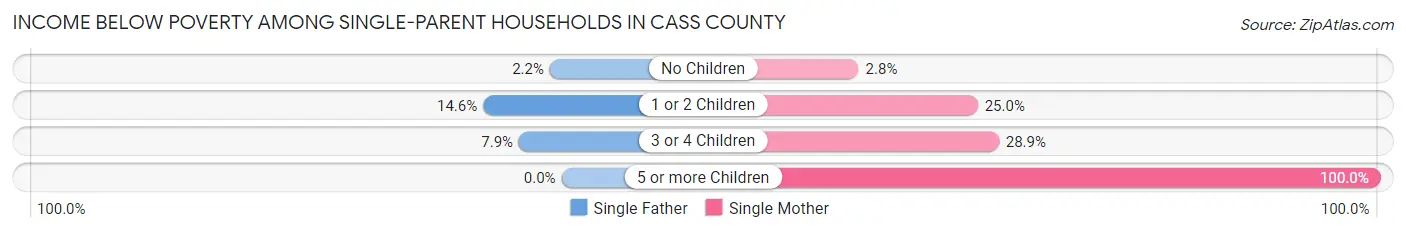
| Children | Single Father | Single Mother |
| No Children | 15 (2.2%) | 43 (2.8%) |
| 1 or 2 Children | 221 (14.6%) | 564 (25.0%) |
| 3 or 4 Children | 18 (7.9%) | 171 (28.9%) |
| 5 or more Children | 0 (0.0%) | 8 (100.0%) |
| Total | 254 (10.5%) | 786 (17.9%) |
Income Below Poverty Among Married-Couple vs Single-Parent Households in Cass County
The poverty data for Cass County shows that 437 of the married-couple family households (1.9%) and 1,040 of the single-parent households (15.2%) are living below the poverty level. Within the married-couple family households, those with 5 or more children have the highest poverty rate, with 14 households (5.9%) falling below the poverty line. Among the single-parent households, those with 5 or more children have the highest poverty rate, with 8 household (100.0%) living below poverty.
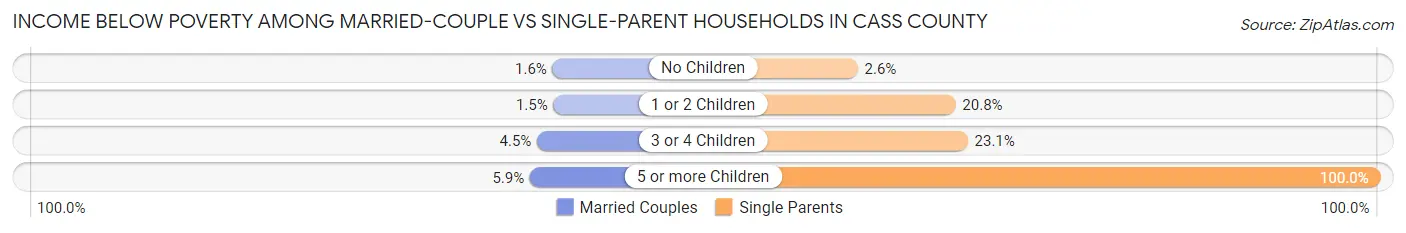
| Children | Married-Couple Families | Single-Parent Households |
| No Children | 237 (1.6%) | 58 (2.6%) |
| 1 or 2 Children | 99 (1.5%) | 785 (20.8%) |
| 3 or 4 Children | 87 (4.5%) | 189 (23.1%) |
| 5 or more Children | 14 (5.9%) | 8 (100.0%) |
| Total | 437 (1.9%) | 1,040 (15.2%) |
Race in Cass County
The most populous races in Cass County are White / Caucasian (94,004 | 86.9%), Two or more Races (6,537 | 6.0%), and Hispanic or Latino (5,264 | 4.9%).
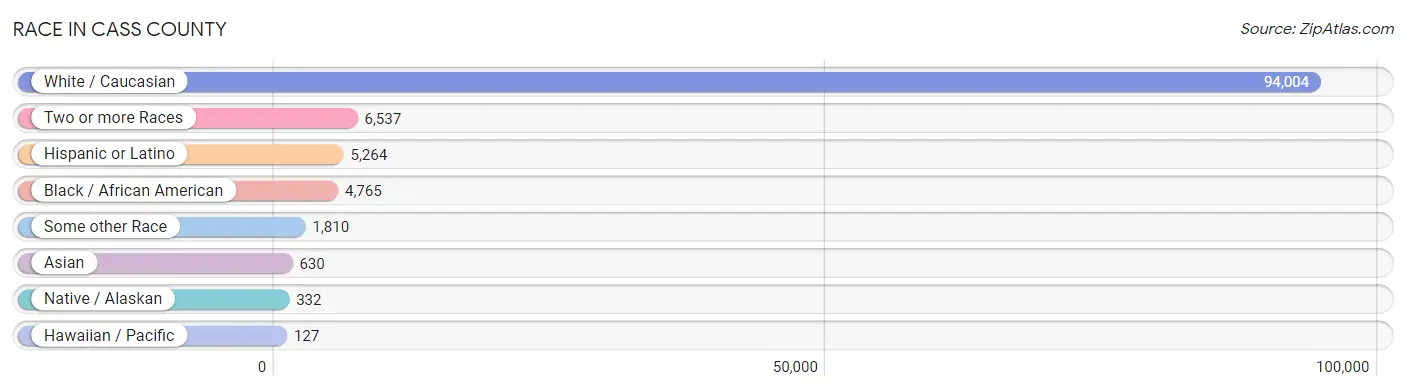
| Race | # Population | % Population |
| Asian | 630 | 0.6% |
| Black / African American | 4,765 | 4.4% |
| Hawaiian / Pacific | 127 | 0.1% |
| Hispanic or Latino | 5,264 | 4.9% |
| Native / Alaskan | 332 | 0.3% |
| White / Caucasian | 94,004 | 86.9% |
| Two or more Races | 6,537 | 6.0% |
| Some other Race | 1,810 | 1.7% |
| Total | 108,205 | 100.0% |
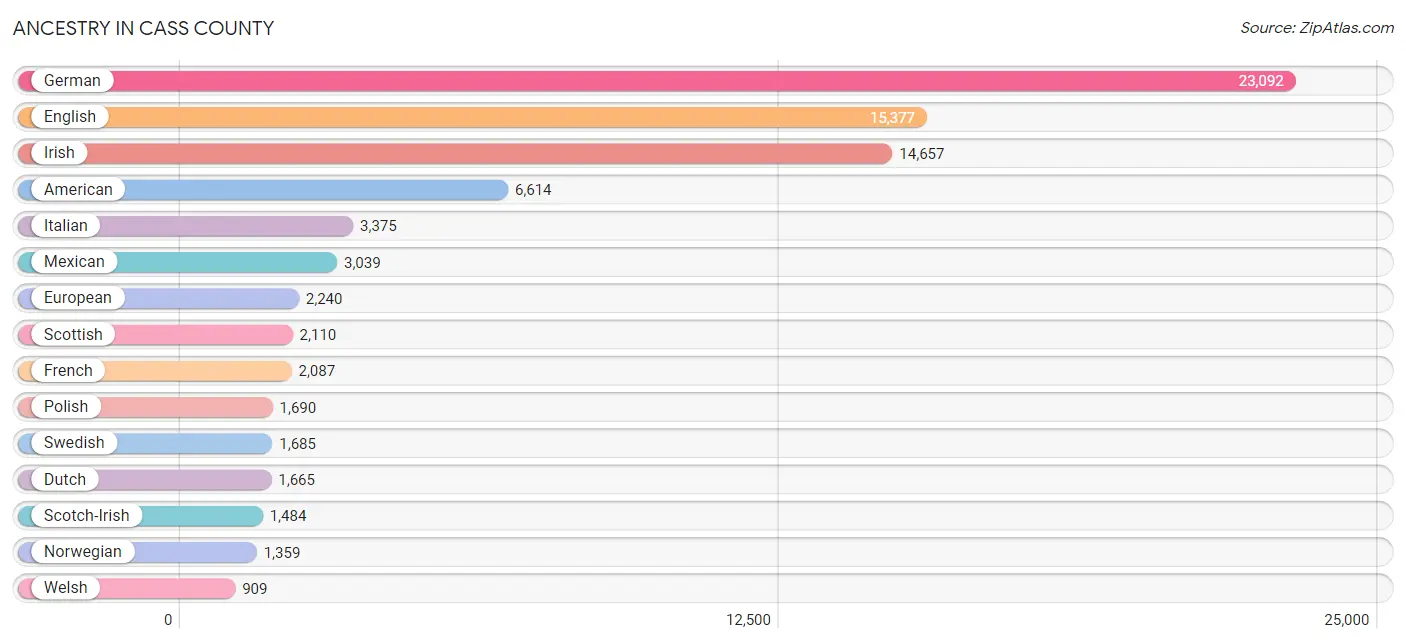
Ancestry in Cass County
The most populous ancestries reported in Cass County are German (23,092 | 21.3%), English (15,377 | 14.2%), Irish (14,657 | 13.6%), American (6,614 | 6.1%), and Italian (3,375 | 3.1%), together accounting for 58.3% of all Cass County residents.
| Ancestry | # Population | % Population |
| African | 245 | 0.2% |
| American | 6,614 | 6.1% |
| Apache | 25 | 0.0% |
| Arab | 112 | 0.1% |
| Armenian | 37 | 0.0% |
| Austrian | 183 | 0.2% |
| Belgian | 131 | 0.1% |
| Belizean | 3 | 0.0% |
| Bhutanese | 206 | 0.2% |
| Blackfeet | 138 | 0.1% |
| British | 617 | 0.6% |
| Burmese | 120 | 0.1% |
| Canadian | 120 | 0.1% |
| Central American | 487 | 0.4% |
| Central American Indian | 94 | 0.1% |
| Cherokee | 530 | 0.5% |
| Cheyenne | 40 | 0.0% |
| Chickasaw | 7 | 0.0% |
| Chinese | 24 | 0.0% |
| Chippewa | 7 | 0.0% |
| Choctaw | 84 | 0.1% |
| Colombian | 78 | 0.1% |
| Comanche | 2 | 0.0% |
| Costa Rican | 12 | 0.0% |
| Creek | 15 | 0.0% |
| Croatian | 78 | 0.1% |
| Crow | 3 | 0.0% |
| Cuban | 108 | 0.1% |
| Czech | 327 | 0.3% |
| Czechoslovakian | 65 | 0.1% |
| Danish | 404 | 0.4% |
| Delaware | 4 | 0.0% |
| Dutch | 1,665 | 1.5% |
| Eastern European | 138 | 0.1% |
| Egyptian | 29 | 0.0% |
| English | 15,377 | 14.2% |
| European | 2,240 | 2.1% |
| Fijian | 2 | 0.0% |
| Finnish | 195 | 0.2% |
| French | 2,087 | 1.9% |
| French Canadian | 205 | 0.2% |
| German | 23,092 | 21.3% |
| Greek | 239 | 0.2% |
| Guamanian / Chamorro | 106 | 0.1% |
| Guatemalan | 17 | 0.0% |
| Haitian | 79 | 0.1% |
| Honduran | 120 | 0.1% |
| Hungarian | 265 | 0.2% |
| Icelander | 13 | 0.0% |
| Indian (Asian) | 56 | 0.1% |
| Iraqi | 13 | 0.0% |
| Irish | 14,657 | 13.6% |
| Iroquois | 57 | 0.1% |
| Italian | 3,375 | 3.1% |
| Jamaican | 60 | 0.1% |
| Japanese | 9 | 0.0% |
| Korean | 369 | 0.3% |
| Laotian | 93 | 0.1% |
| Latvian | 3 | 0.0% |
| Lebanese | 53 | 0.1% |
| Lithuanian | 27 | 0.0% |
| Luxembourger | 33 | 0.0% |
| Maltese | 17 | 0.0% |
| Mexican | 3,039 | 2.8% |
| Mexican American Indian | 4 | 0.0% |
| Native Hawaiian | 270 | 0.3% |
| New Zealander | 42 | 0.0% |
| Nicaraguan | 13 | 0.0% |
| Nigerian | 131 | 0.1% |
| Northern European | 144 | 0.1% |
| Norwegian | 1,359 | 1.3% |
| Osage | 39 | 0.0% |
| Paiute | 7 | 0.0% |
| Pakistani | 97 | 0.1% |
| Panamanian | 5 | 0.0% |
| Pennsylvania German | 36 | 0.0% |
| Peruvian | 38 | 0.0% |
| Polish | 1,690 | 1.6% |
| Portuguese | 107 | 0.1% |
| Puerto Rican | 705 | 0.6% |
| Romanian | 43 | 0.0% |
| Russian | 471 | 0.4% |
| Salvadoran | 320 | 0.3% |
| Samoan | 39 | 0.0% |
| Scandinavian | 691 | 0.6% |
| Scotch-Irish | 1,484 | 1.4% |
| Scottish | 2,110 | 1.9% |
| Senegalese | 8 | 0.0% |
| Serbian | 25 | 0.0% |
| Sioux | 90 | 0.1% |
| Slavic | 20 | 0.0% |
| Slovak | 24 | 0.0% |
| Slovene | 15 | 0.0% |
| Somali | 14 | 0.0% |
| South African | 2 | 0.0% |
| South American | 139 | 0.1% |
| Spaniard | 145 | 0.1% |
| Spanish | 535 | 0.5% |
| Sri Lankan | 157 | 0.2% |
| Subsaharan African | 402 | 0.4% |
| Swedish | 1,685 | 1.6% |
| Swiss | 301 | 0.3% |
| Syrian | 9 | 0.0% |
| Thai | 315 | 0.3% |
| Tongan | 19 | 0.0% |
| Turkish | 18 | 0.0% |
| Ukrainian | 20 | 0.0% |
| Uruguayan | 4 | 0.0% |
| Venezuelan | 19 | 0.0% |
| Welsh | 909 | 0.8% |
| Yaqui | 3 | 0.0% |
| Yugoslavian | 51 | 0.1% | View All 112 Rows |
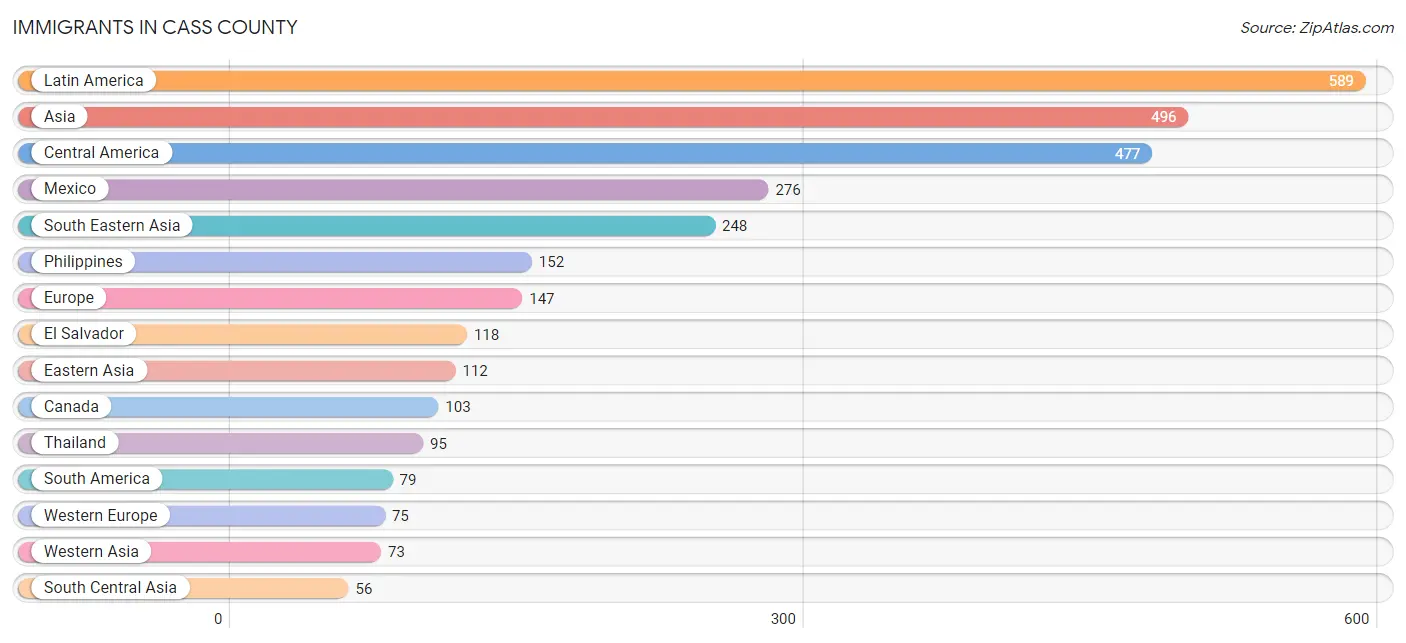
Immigrants in Cass County
The most numerous immigrant groups reported in Cass County came from Latin America (589 | 0.5%), Asia (496 | 0.5%), Central America (477 | 0.4%), Mexico (276 | 0.3%), and South Eastern Asia (248 | 0.2%), together accounting for 1.9% of all Cass County residents.
| Immigration Origin | # Population | % Population |
| Africa | 35 | 0.0% |
| Asia | 496 | 0.5% |
| Australia | 6 | 0.0% |
| Belize | 3 | 0.0% |
| Cameroon | 30 | 0.0% |
| Canada | 103 | 0.1% |
| Caribbean | 33 | 0.0% |
| Central America | 477 | 0.4% |
| China | 49 | 0.1% |
| Colombia | 41 | 0.0% |
| Congo | 2 | 0.0% |
| Costa Rica | 3 | 0.0% |
| Czechoslovakia | 14 | 0.0% |
| Eastern Asia | 112 | 0.1% |
| Eastern Europe | 30 | 0.0% |
| El Salvador | 118 | 0.1% |
| England | 33 | 0.0% |
| Europe | 147 | 0.1% |
| Germany | 54 | 0.1% |
| Guatemala | 17 | 0.0% |
| Honduras | 47 | 0.0% |
| India | 48 | 0.0% |
| Iraq | 13 | 0.0% |
| Jamaica | 33 | 0.0% |
| Japan | 54 | 0.1% |
| Korea | 9 | 0.0% |
| Latin America | 589 | 0.5% |
| Latvia | 11 | 0.0% |
| Mexico | 276 | 0.3% |
| Middle Africa | 32 | 0.0% |
| Netherlands | 21 | 0.0% |
| Nicaragua | 13 | 0.0% |
| Northern Europe | 42 | 0.0% |
| Oceania | 16 | 0.0% |
| Peru | 38 | 0.0% |
| Philippines | 152 | 0.1% |
| Poland | 1 | 0.0% |
| Russia | 4 | 0.0% |
| South Africa | 3 | 0.0% |
| South America | 79 | 0.1% |
| South Central Asia | 56 | 0.1% |
| South Eastern Asia | 248 | 0.2% |
| Sri Lanka | 8 | 0.0% |
| Thailand | 95 | 0.1% |
| Turkey | 30 | 0.0% |
| Vietnam | 1 | 0.0% |
| Western Asia | 73 | 0.1% |
| Western Europe | 75 | 0.1% | View All 48 Rows |
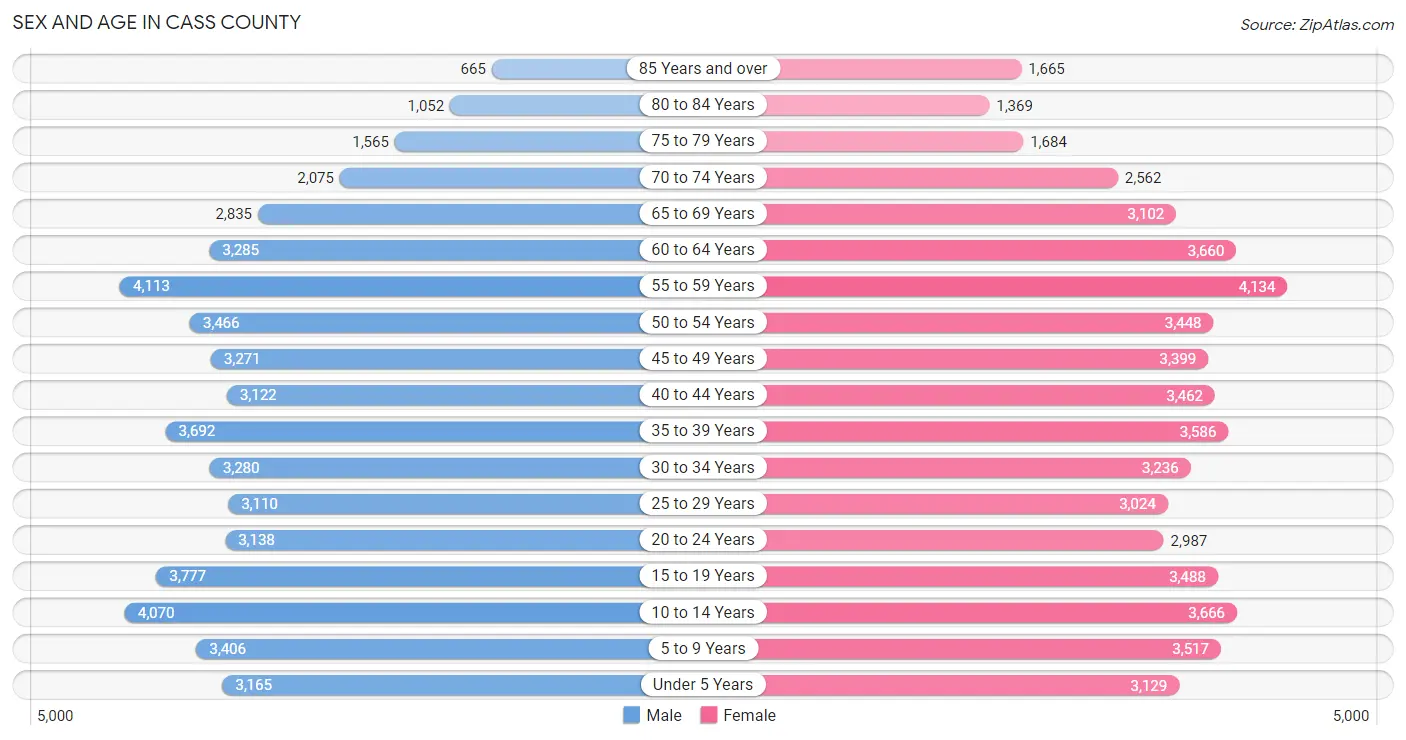
Sex and Age in Cass County
Sex and Age in Cass County
The most populous age groups in Cass County are 55 to 59 Years (4,113 | 7.7%) for men and 55 to 59 Years (4,134 | 7.5%) for women.
| Age Bracket | Male | Female |
| Under 5 Years | 3,165 (6.0%) | 3,129 (5.7%) |
| 5 to 9 Years | 3,406 (6.4%) | 3,517 (6.4%) |
| 10 to 14 Years | 4,070 (7.7%) | 3,666 (6.7%) |
| 15 to 19 Years | 3,777 (7.1%) | 3,488 (6.3%) |
| 20 to 24 Years | 3,138 (5.9%) | 2,987 (5.4%) |
| 25 to 29 Years | 3,110 (5.9%) | 3,024 (5.5%) |
| 30 to 34 Years | 3,280 (6.2%) | 3,236 (5.9%) |
| 35 to 39 Years | 3,692 (7.0%) | 3,586 (6.5%) |
| 40 to 44 Years | 3,122 (5.9%) | 3,462 (6.3%) |
| 45 to 49 Years | 3,271 (6.2%) | 3,399 (6.2%) |
| 50 to 54 Years | 3,466 (6.5%) | 3,448 (6.3%) |
| 55 to 59 Years | 4,113 (7.7%) | 4,134 (7.5%) |
| 60 to 64 Years | 3,285 (6.2%) | 3,660 (6.6%) |
| 65 to 69 Years | 2,835 (5.3%) | 3,102 (5.6%) |
| 70 to 74 Years | 2,075 (3.9%) | 2,562 (4.6%) |
| 75 to 79 Years | 1,565 (2.9%) | 1,684 (3.1%) |
| 80 to 84 Years | 1,052 (2.0%) | 1,369 (2.5%) |
| 85 Years and over | 665 (1.3%) | 1,665 (3.0%) |
| Total | 53,087 (100.0%) | 55,118 (100.0%) |
Families and Households in Cass County
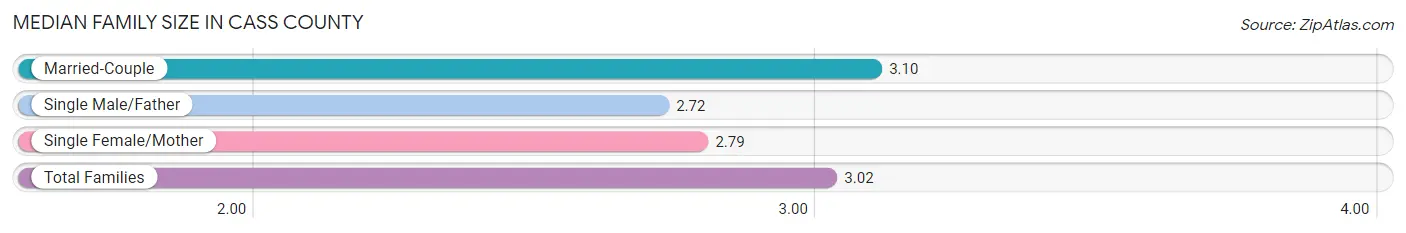
Median Family Size in Cass County
The median family size in Cass County is 3.02 persons per family, with married-couple families (23,308 | 77.3%) accounting for the largest median family size of 3.1 persons per family. On the other hand, single male/father families (2,429 | 8.1%) represent the smallest median family size with 2.72 persons per family.
| Family Type | # Families | Family Size |
| Married-Couple | 23,308 (77.3%) | 3.10 |
| Single Male/Father | 2,429 (8.1%) | 2.72 |
| Single Female/Mother | 4,401 (14.6%) | 2.79 |
| Total Families | 30,138 (100.0%) | 3.02 |
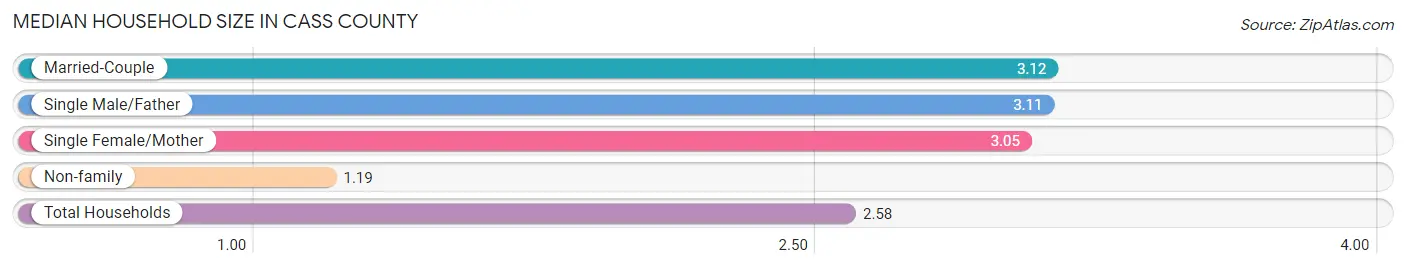
Median Household Size in Cass County
The median household size in Cass County is 2.58 persons per household, with married-couple households (23,308 | 56.1%) accounting for the largest median household size of 3.12 persons per household. non-family households (11,386 | 27.4%) represent the smallest median household size with 1.19 persons per household.
| Household Type | # Households | Household Size |
| Married-Couple | 23,308 (56.1%) | 3.12 |
| Single Male/Father | 2,429 (5.9%) | 3.11 |
| Single Female/Mother | 4,401 (10.6%) | 3.05 |
| Non-family | 11,386 (27.4%) | 1.19 |
| Total Households | 41,524 (100.0%) | 2.58 |
Household Size by Marriage Status in Cass County
Out of a total of 41,524 households in Cass County, 30,138 (72.6%) are family households, while 11,386 (27.4%) are nonfamily households. The most numerous type of family households are 2-person households, comprising 14,367, and the most common type of nonfamily households are 1-person households, comprising 9,753.
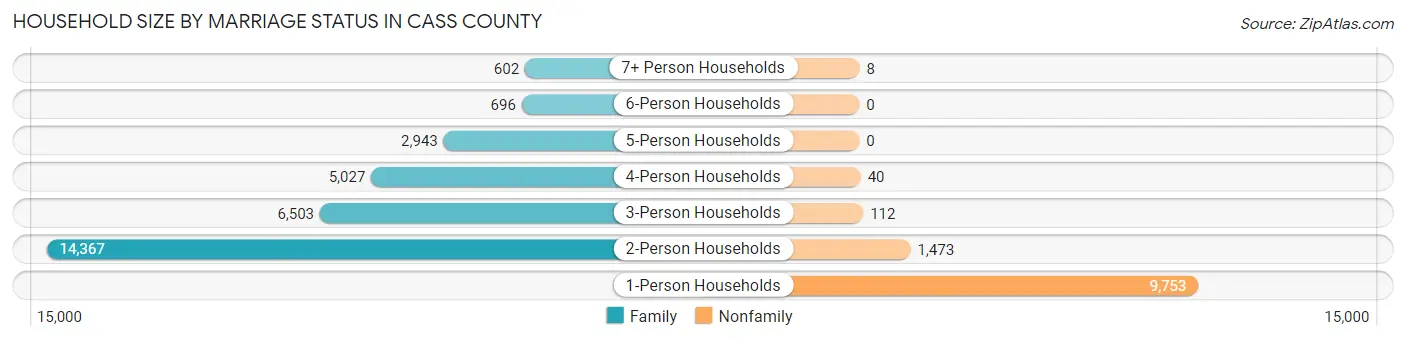
| Household Size | Family Households | Nonfamily Households |
| 1-Person Households | - | 9,753 (23.5%) |
| 2-Person Households | 14,367 (34.6%) | 1,473 (3.5%) |
| 3-Person Households | 6,503 (15.7%) | 112 (0.3%) |
| 4-Person Households | 5,027 (12.1%) | 40 (0.1%) |
| 5-Person Households | 2,943 (7.1%) | 0 (0.0%) |
| 6-Person Households | 696 (1.7%) | 0 (0.0%) |
| 7+ Person Households | 602 (1.5%) | 8 (0.0%) |
| Total | 30,138 (72.6%) | 11,386 (27.4%) |
Female Fertility in Cass County
Fertility by Age in Cass County
Average fertility rate in Cass County is 56.0 births per 1,000 women. Women in the age bracket of 20 to 34 years have the highest fertility rate with 118.0 births per 1,000 women. Women in the age bracket of 20 to 34 years acount for 81.8% of all women with births.
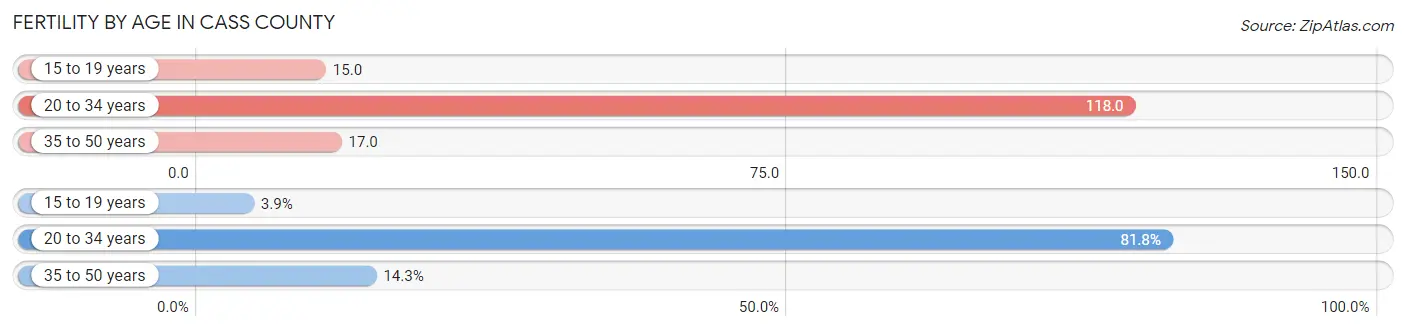
| Age Bracket | Women with Births | Births / 1,000 Women |
| 15 to 19 years | 52 (3.9%) | 15.0 |
| 20 to 34 years | 1,094 (81.8%) | 118.0 |
| 35 to 50 years | 191 (14.3%) | 17.0 |
| Total | 1,337 (100.0%) | 56.0 |
Fertility by Age by Marriage Status in Cass County
63.4% of women with births (1,337) in Cass County are married. The highest percentage of unmarried women with births falls into 15 to 19 years age bracket with 82.7% of them unmarried at the time of birth, while the lowest percentage of unmarried women with births belong to 35 to 50 years age bracket with 18.9% of them unmarried.
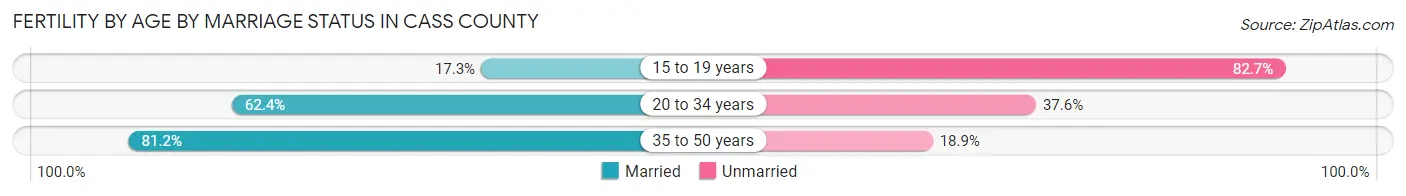
| Age Bracket | Married | Unmarried |
| 15 to 19 years | 9 (17.3%) | 43 (82.7%) |
| 20 to 34 years | 683 (62.4%) | 411 (37.6%) |
| 35 to 50 years | 155 (81.1%) | 36 (18.9%) |
| Total | 848 (63.4%) | 489 (36.6%) |
Fertility by Education in Cass County
Average fertility rate in Cass County is 56.0 births per 1,000 women. Women with the education attainment of high school diploma have the highest fertility rate of 77.0 births per 1,000 women, while women with the education attainment of less than high school have the lowest fertility at 7.0 births per 1,000 women. Women with the education attainment of high school diploma represent 33.3% of all women with births.
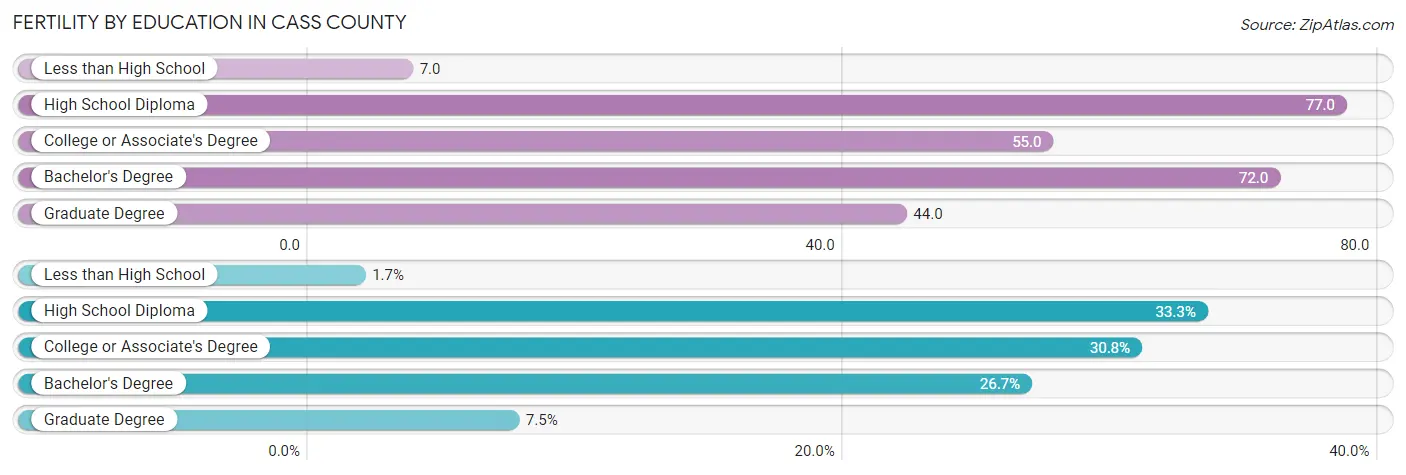
| Educational Attainment | Women with Births | Births / 1,000 Women |
| Less than High School | 23 (1.7%) | 7.0 |
| High School Diploma | 445 (33.3%) | 77.0 |
| College or Associate's Degree | 412 (30.8%) | 55.0 |
| Bachelor's Degree | 357 (26.7%) | 72.0 |
| Graduate Degree | 100 (7.5%) | 44.0 |
| Total | 1,337 (100.0%) | 56.0 |
Fertility by Education by Marriage Status in Cass County
36.6% of women with births in Cass County are unmarried. Women with the educational attainment of graduate degree are most likely to be married with 100.0% of them married at childbirth, while women with the educational attainment of high school diploma are least likely to be married with 64.3% of them unmarried at childbirth.
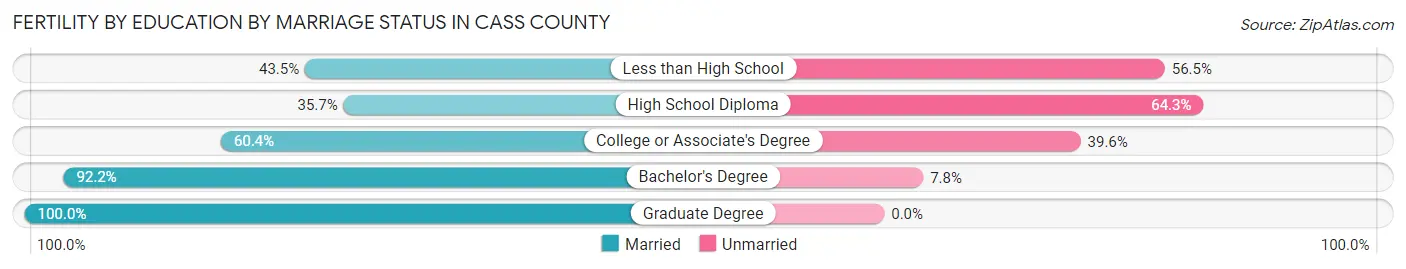
| Educational Attainment | Married | Unmarried |
| Less than High School | 10 (43.5%) | 13 (56.5%) |
| High School Diploma | 159 (35.7%) | 286 (64.3%) |
| College or Associate's Degree | 249 (60.4%) | 163 (39.6%) |
| Bachelor's Degree | 329 (92.2%) | 28 (7.8%) |
| Graduate Degree | 100 (100.0%) | 0 (0.0%) |
| Total | 848 (63.4%) | 489 (36.6%) |
Employment Characteristics in Cass County
Employment by Class of Employer in Cass County
Among the 53,652 employed individuals in Cass County, private company employees (38,578 | 71.9%), not-for-profit organizations (4,390 | 8.2%), and local government employees (3,249 | 6.1%) make up the most common classes of employment.
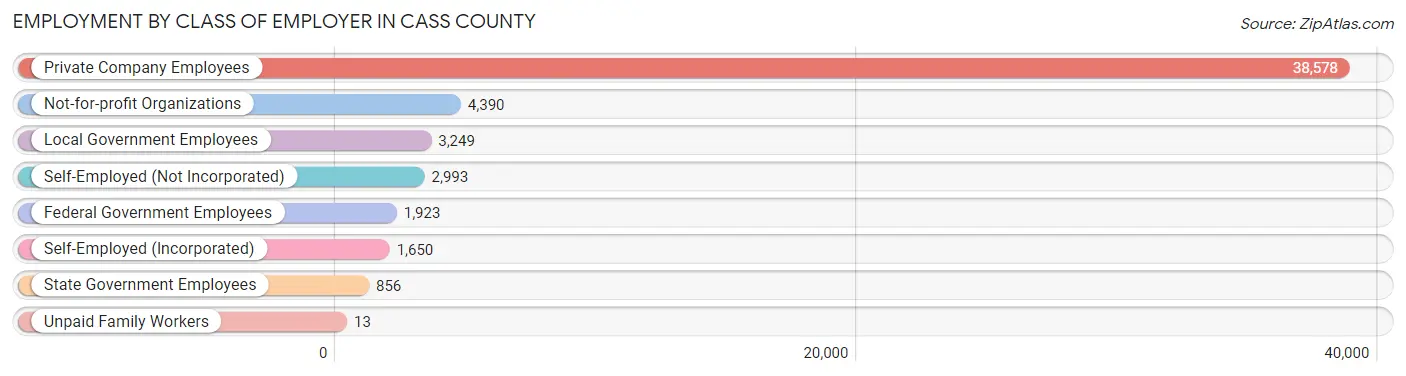
| Employer Class | # Employees | % Employees |
| Private Company Employees | 38,578 | 71.9% |
| Self-Employed (Incorporated) | 1,650 | 3.1% |
| Self-Employed (Not Incorporated) | 2,993 | 5.6% |
| Not-for-profit Organizations | 4,390 | 8.2% |
| Local Government Employees | 3,249 | 6.1% |
| State Government Employees | 856 | 1.6% |
| Federal Government Employees | 1,923 | 3.6% |
| Unpaid Family Workers | 13 | 0.0% |
| Total | 53,652 | 100.0% |
Employment Status by Age in Cass County
According to the labor force statistics for Cass County, out of the total population over 16 years of age (85,735), 66.6% or 57,100 individuals are in the labor force, with 4.5% or 2,570 of them unemployed. The age group with the highest labor force participation rate is 35 to 44 years, with 88.5% or 12,268 individuals in the labor force. Within the labor force, the 75 years and over age range has the highest percentage of unemployed individuals, with 18.9% or 91 of them being unemployed.
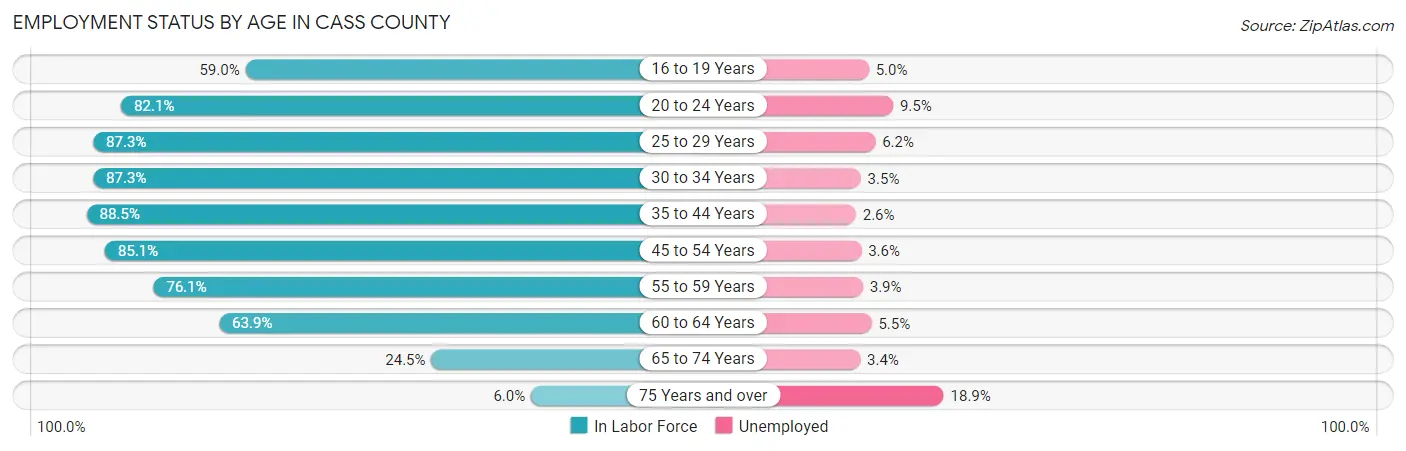
| Age Bracket | In Labor Force | Unemployed |
| 16 to 19 Years | 3,391 (59.0%) | 170 (5.0%) |
| 20 to 24 Years | 5,029 (82.1%) | 478 (9.5%) |
| 25 to 29 Years | 5,355 (87.3%) | 332 (6.2%) |
| 30 to 34 Years | 5,688 (87.3%) | 199 (3.5%) |
| 35 to 44 Years | 12,268 (88.5%) | 319 (2.6%) |
| 45 to 54 Years | 11,560 (85.1%) | 416 (3.6%) |
| 55 to 59 Years | 6,276 (76.1%) | 245 (3.9%) |
| 60 to 64 Years | 4,438 (63.9%) | 244 (5.5%) |
| 65 to 74 Years | 2,591 (24.5%) | 88 (3.4%) |
| 75 Years and over | 480 (6.0%) | 91 (18.9%) |
| Total | 57,100 (66.6%) | 2,570 (4.5%) |
Employment Status by Educational Attainment in Cass County
According to labor force statistics for Cass County, 82.5% of individuals (45,613) out of the total population between 25 and 64 years of age (55,288) are in the labor force, with 3.8% or 1,733 of them being unemployed. The group with the highest labor force participation rate are those with the educational attainment of bachelor's degree or higher, with 87.7% or 14,485 individuals in the labor force. Within the labor force, individuals with less than high school education have the highest percentage of unemployment, with 5.6% or 108 of them being unemployed.
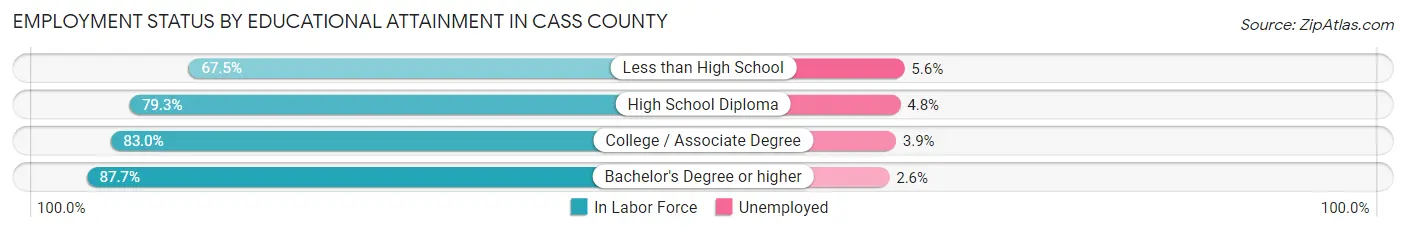
| Educational Attainment | In Labor Force | Unemployed |
| Less than High School | 1,926 (67.5%) | 160 (5.6%) |
| High School Diploma | 13,414 (79.3%) | 812 (4.8%) |
| College / Associate Degree | 15,773 (83.0%) | 741 (3.9%) |
| Bachelor's Degree or higher | 14,485 (87.7%) | 429 (2.6%) |
| Total | 45,613 (82.5%) | 2,101 (3.8%) |
Employment Occupations by Sex in Cass County
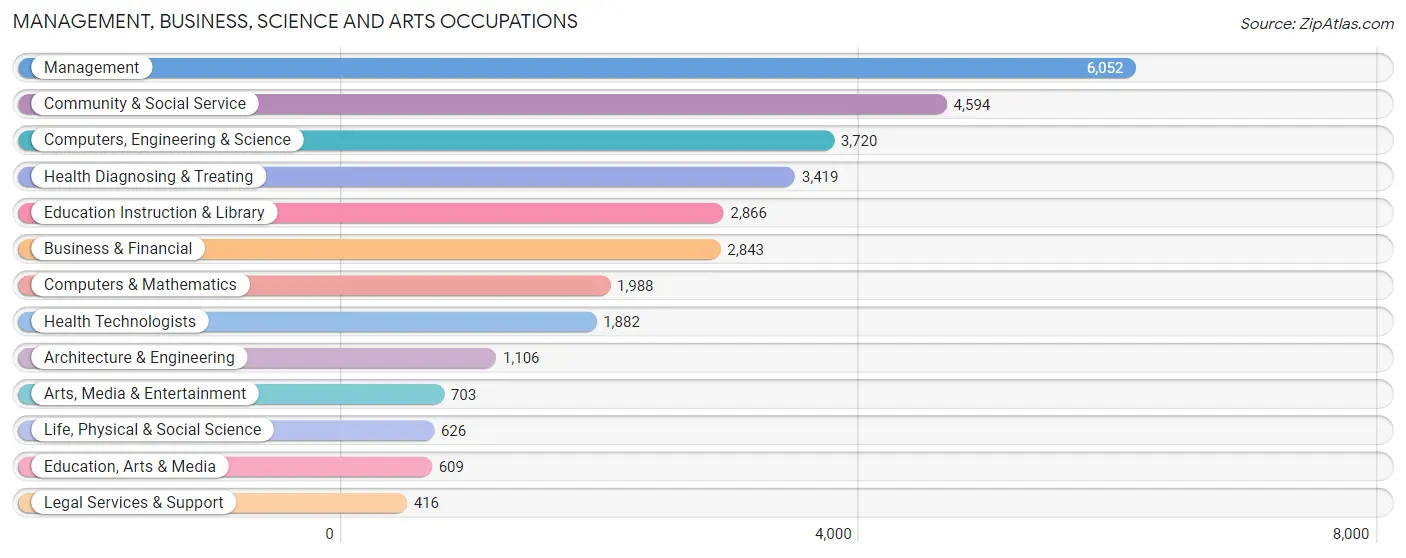
Management, Business, Science and Arts Occupations
The most common Management, Business, Science and Arts occupations in Cass County are Management (6,052 | 11.1%), Community & Social Service (4,594 | 8.4%), Computers, Engineering & Science (3,720 | 6.8%), Health Diagnosing & Treating (3,419 | 6.3%), and Education Instruction & Library (2,866 | 5.3%).
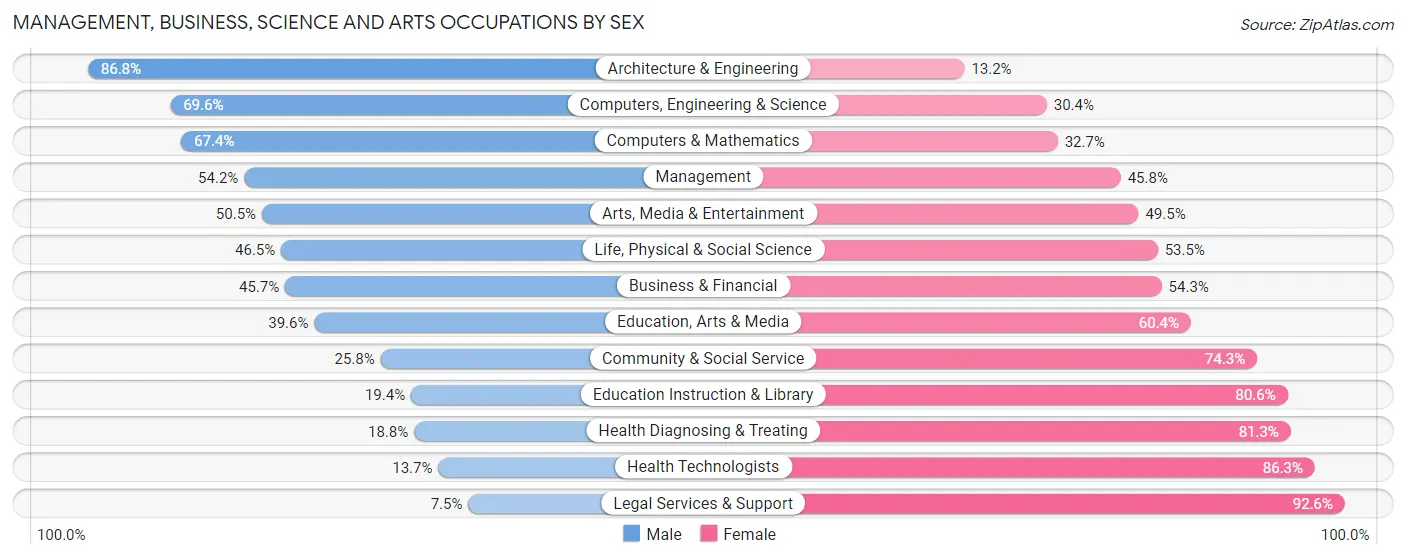
Management, Business, Science and Arts Occupations by Sex
Within the Management, Business, Science and Arts occupations in Cass County, the most male-oriented occupations are Architecture & Engineering (86.8%), Computers, Engineering & Science (69.6%), and Computers & Mathematics (67.3%), while the most female-oriented occupations are Legal Services & Support (92.5%), Health Technologists (86.3%), and Health Diagnosing & Treating (81.2%).
| Occupation | Male | Female |
| Management | 3,280 (54.2%) | 2,772 (45.8%) |
| Business & Financial | 1,298 (45.7%) | 1,545 (54.3%) |
| Computers, Engineering & Science | 2,590 (69.6%) | 1,130 (30.4%) |
| Computers & Mathematics | 1,339 (67.3%) | 649 (32.7%) |
| Architecture & Engineering | 960 (86.8%) | 146 (13.2%) |
| Life, Physical & Social Science | 291 (46.5%) | 335 (53.5%) |
| Community & Social Service | 1,183 (25.8%) | 3,411 (74.3%) |
| Education, Arts & Media | 241 (39.6%) | 368 (60.4%) |
| Legal Services & Support | 31 (7.4%) | 385 (92.5%) |
| Education Instruction & Library | 556 (19.4%) | 2,310 (80.6%) |
| Arts, Media & Entertainment | 355 (50.5%) | 348 (49.5%) |
| Health Diagnosing & Treating | 641 (18.8%) | 2,778 (81.2%) |
| Health Technologists | 258 (13.7%) | 1,624 (86.3%) |
| Total (Category) | 8,992 (43.6%) | 11,636 (56.4%) |
| Total (Overall) | 28,383 (52.1%) | 26,062 (47.9%) |
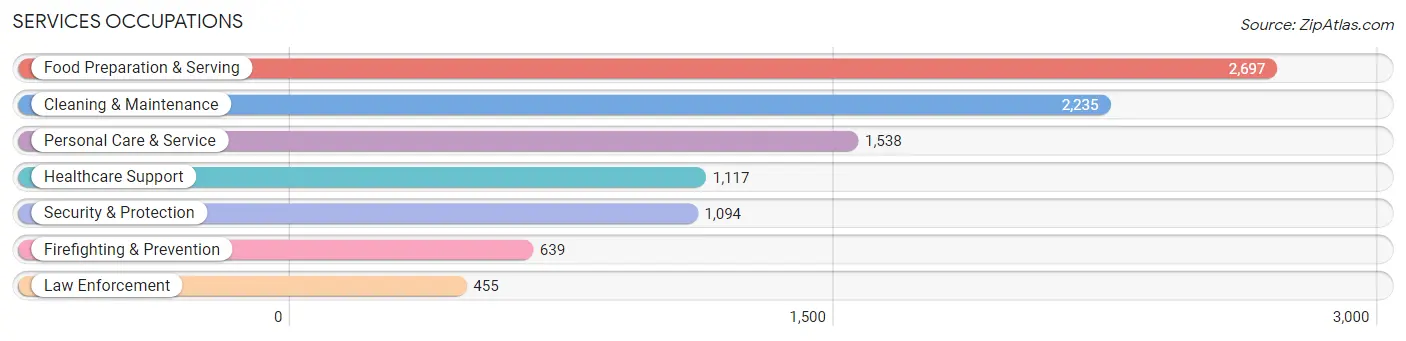
Services Occupations
The most common Services occupations in Cass County are Food Preparation & Serving (2,697 | 5.0%), Cleaning & Maintenance (2,235 | 4.1%), Personal Care & Service (1,538 | 2.8%), Healthcare Support (1,117 | 2.1%), and Security & Protection (1,094 | 2.0%).
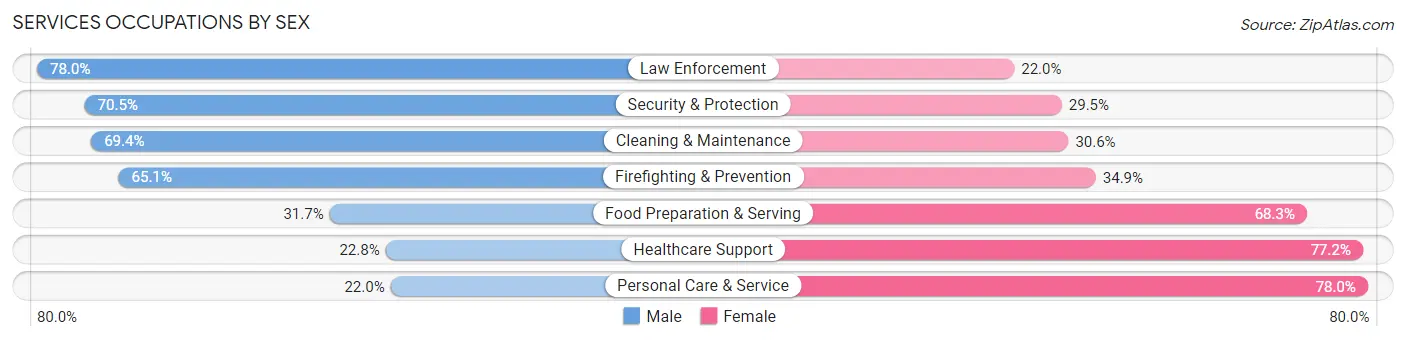
Services Occupations by Sex
Within the Services occupations in Cass County, the most male-oriented occupations are Law Enforcement (78.0%), Security & Protection (70.5%), and Cleaning & Maintenance (69.4%), while the most female-oriented occupations are Personal Care & Service (78.0%), Healthcare Support (77.2%), and Food Preparation & Serving (68.3%).
| Occupation | Male | Female |
| Healthcare Support | 255 (22.8%) | 862 (77.2%) |
| Security & Protection | 771 (70.5%) | 323 (29.5%) |
| Firefighting & Prevention | 416 (65.1%) | 223 (34.9%) |
| Law Enforcement | 355 (78.0%) | 100 (22.0%) |
| Food Preparation & Serving | 855 (31.7%) | 1,842 (68.3%) |
| Cleaning & Maintenance | 1,552 (69.4%) | 683 (30.6%) |
| Personal Care & Service | 339 (22.0%) | 1,199 (78.0%) |
| Total (Category) | 3,772 (43.4%) | 4,909 (56.6%) |
| Total (Overall) | 28,383 (52.1%) | 26,062 (47.9%) |
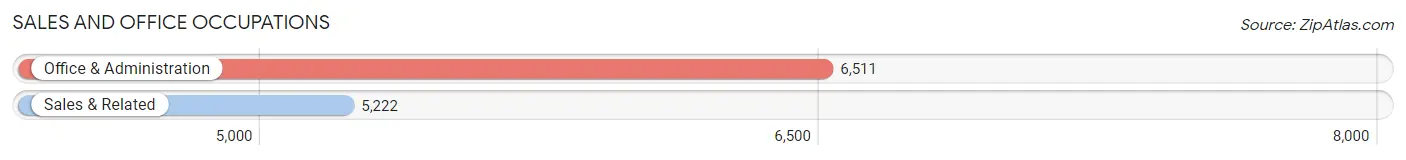
Sales and Office Occupations
The most common Sales and Office occupations in Cass County are Office & Administration (6,511 | 12.0%), and Sales & Related (5,222 | 9.6%).
Sales and Office Occupations by Sex
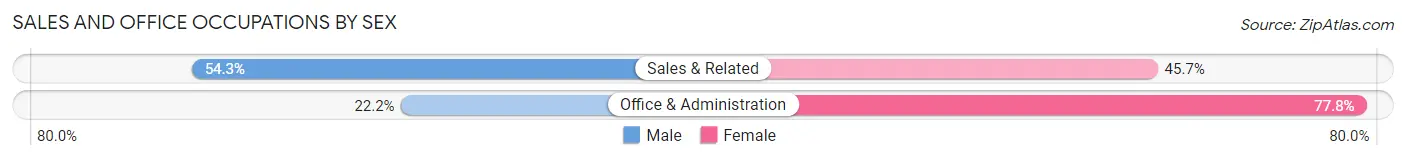
| Occupation | Male | Female |
| Sales & Related | 2,835 (54.3%) | 2,387 (45.7%) |
| Office & Administration | 1,444 (22.2%) | 5,067 (77.8%) |
| Total (Category) | 4,279 (36.5%) | 7,454 (63.5%) |
| Total (Overall) | 28,383 (52.1%) | 26,062 (47.9%) |
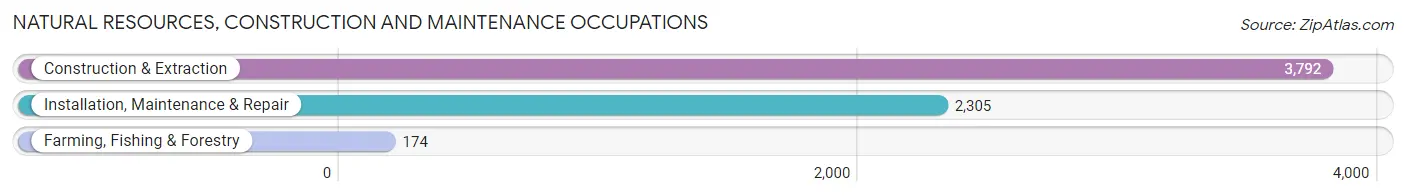
Natural Resources, Construction and Maintenance Occupations
The most common Natural Resources, Construction and Maintenance occupations in Cass County are Construction & Extraction (3,792 | 7.0%), Installation, Maintenance & Repair (2,305 | 4.2%), and Farming, Fishing & Forestry (174 | 0.3%).
Natural Resources, Construction and Maintenance Occupations by Sex
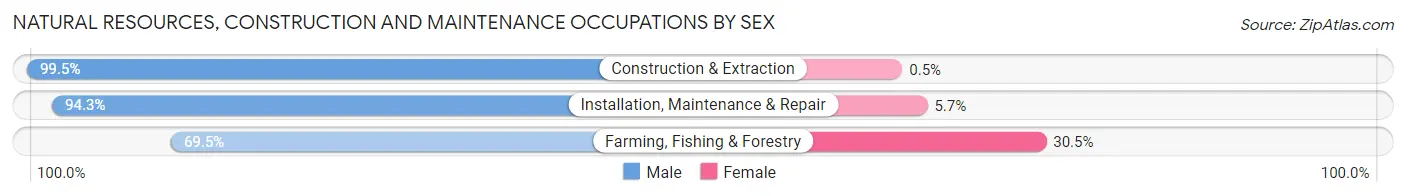
| Occupation | Male | Female |
| Farming, Fishing & Forestry | 121 (69.5%) | 53 (30.5%) |
| Construction & Extraction | 3,773 (99.5%) | 19 (0.5%) |
| Installation, Maintenance & Repair | 2,173 (94.3%) | 132 (5.7%) |
| Total (Category) | 6,067 (96.8%) | 204 (3.3%) |
| Total (Overall) | 28,383 (52.1%) | 26,062 (47.9%) |
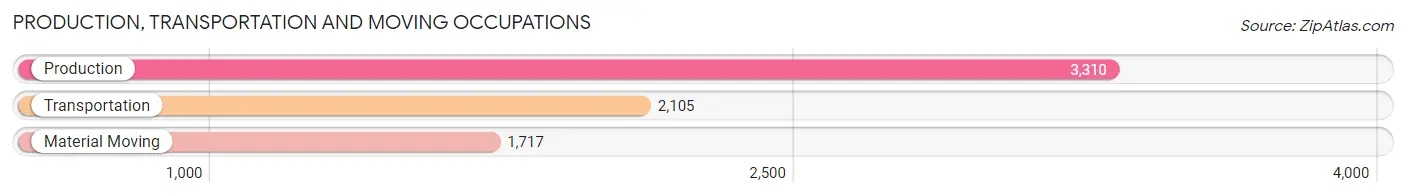
Production, Transportation and Moving Occupations
The most common Production, Transportation and Moving occupations in Cass County are Production (3,310 | 6.1%), Transportation (2,105 | 3.9%), and Material Moving (1,717 | 3.2%).
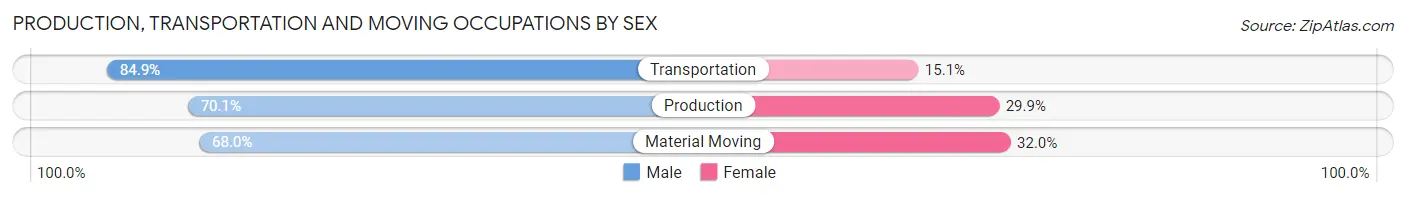
Production, Transportation and Moving Occupations by Sex
| Occupation | Male | Female |
| Production | 2,319 (70.1%) | 991 (29.9%) |
| Transportation | 1,787 (84.9%) | 318 (15.1%) |
| Material Moving | 1,167 (68.0%) | 550 (32.0%) |
| Total (Category) | 5,273 (73.9%) | 1,859 (26.1%) |
| Total (Overall) | 28,383 (52.1%) | 26,062 (47.9%) |
Employment Industries by Sex in Cass County
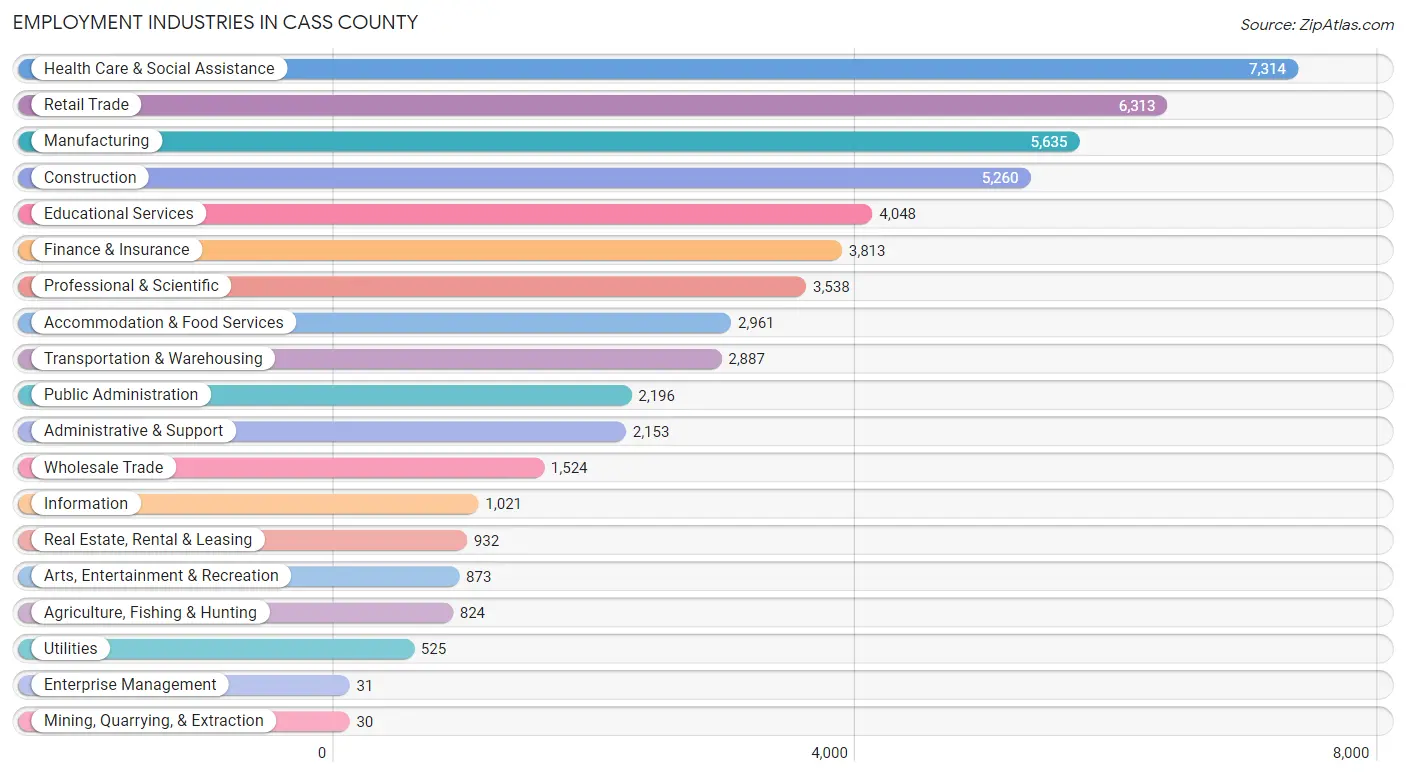
Employment Industries in Cass County
The major employment industries in Cass County include Health Care & Social Assistance (7,314 | 13.4%), Retail Trade (6,313 | 11.6%), Manufacturing (5,635 | 10.3%), Construction (5,260 | 9.7%), and Educational Services (4,048 | 7.4%).
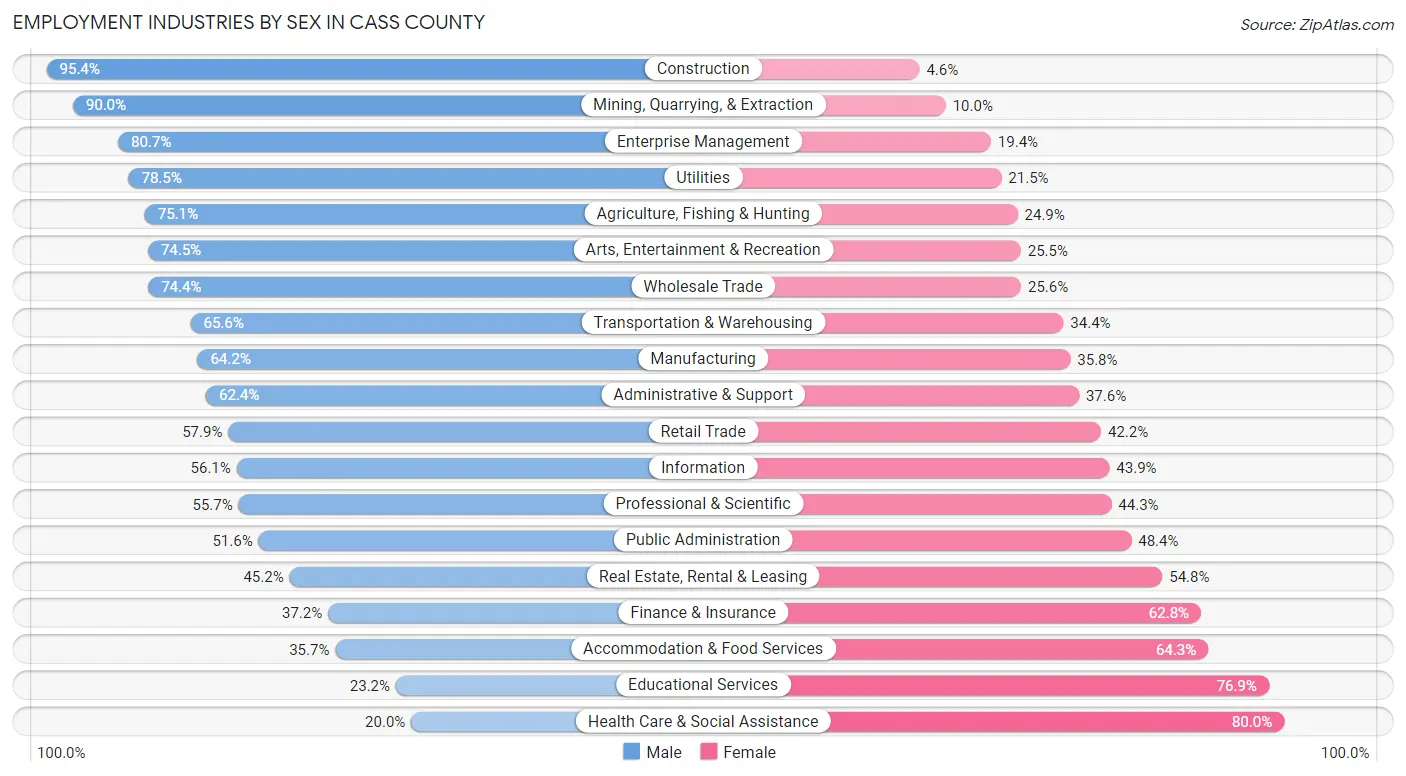
Employment Industries by Sex in Cass County
The Cass County industries that see more men than women are Construction (95.4%), Mining, Quarrying, & Extraction (90.0%), and Enterprise Management (80.6%), whereas the industries that tend to have a higher number of women are Health Care & Social Assistance (80.0%), Educational Services (76.8%), and Accommodation & Food Services (64.3%).
| Industry | Male | Female |
| Agriculture, Fishing & Hunting | 619 (75.1%) | 205 (24.9%) |
| Mining, Quarrying, & Extraction | 27 (90.0%) | 3 (10.0%) |
| Construction | 5,020 (95.4%) | 240 (4.6%) |
| Manufacturing | 3,618 (64.2%) | 2,017 (35.8%) |
| Wholesale Trade | 1,134 (74.4%) | 390 (25.6%) |
| Retail Trade | 3,652 (57.9%) | 2,661 (42.1%) |
| Transportation & Warehousing | 1,895 (65.6%) | 992 (34.4%) |
| Utilities | 412 (78.5%) | 113 (21.5%) |
| Information | 573 (56.1%) | 448 (43.9%) |
| Finance & Insurance | 1,418 (37.2%) | 2,395 (62.8%) |
| Real Estate, Rental & Leasing | 421 (45.2%) | 511 (54.8%) |
| Professional & Scientific | 1,971 (55.7%) | 1,567 (44.3%) |
| Enterprise Management | 25 (80.6%) | 6 (19.4%) |
| Administrative & Support | 1,344 (62.4%) | 809 (37.6%) |
| Educational Services | 937 (23.2%) | 3,111 (76.8%) |
| Health Care & Social Assistance | 1,462 (20.0%) | 5,852 (80.0%) |
| Arts, Entertainment & Recreation | 650 (74.5%) | 223 (25.5%) |
| Accommodation & Food Services | 1,057 (35.7%) | 1,904 (64.3%) |
| Public Administration | 1,133 (51.6%) | 1,063 (48.4%) |
| Total | 28,383 (52.1%) | 26,062 (47.9%) |
Education in Cass County
School Enrollment in Cass County
The most common levels of schooling among the 24,215 students in Cass County are middle school (6,267 | 25.9%), high school (5,844 | 24.1%), and elementary school (5,359 | 22.1%).
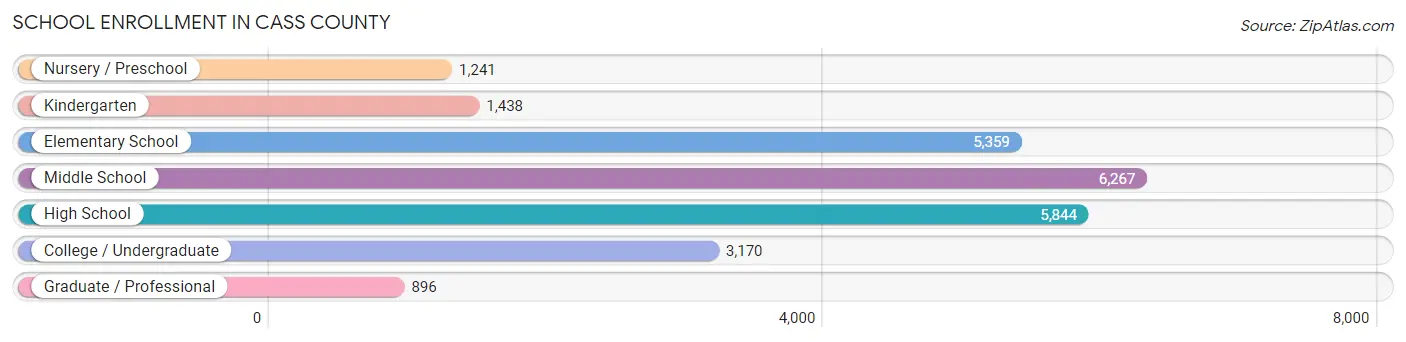
| School Level | # Students | % Students |
| Nursery / Preschool | 1,241 | 5.1% |
| Kindergarten | 1,438 | 5.9% |
| Elementary School | 5,359 | 22.1% |
| Middle School | 6,267 | 25.9% |
| High School | 5,844 | 24.1% |
| College / Undergraduate | 3,170 | 13.1% |
| Graduate / Professional | 896 | 3.7% |
| Total | 24,215 | 100.0% |
School Enrollment by Age by Funding Source in Cass County
Out of a total of 24,215 students who are enrolled in schools in Cass County, 3,245 (13.4%) attend a private institution, while the remaining 20,970 (86.6%) are enrolled in public schools. The age group of 35 years and over has the highest likelihood of being enrolled in private schools, with 263 (27.9% in the age bracket) enrolled. Conversely, the age group of 15 to 17 year olds has the lowest likelihood of being enrolled in a private school, with 4,120 (89.8% in the age bracket) attending a public institution.
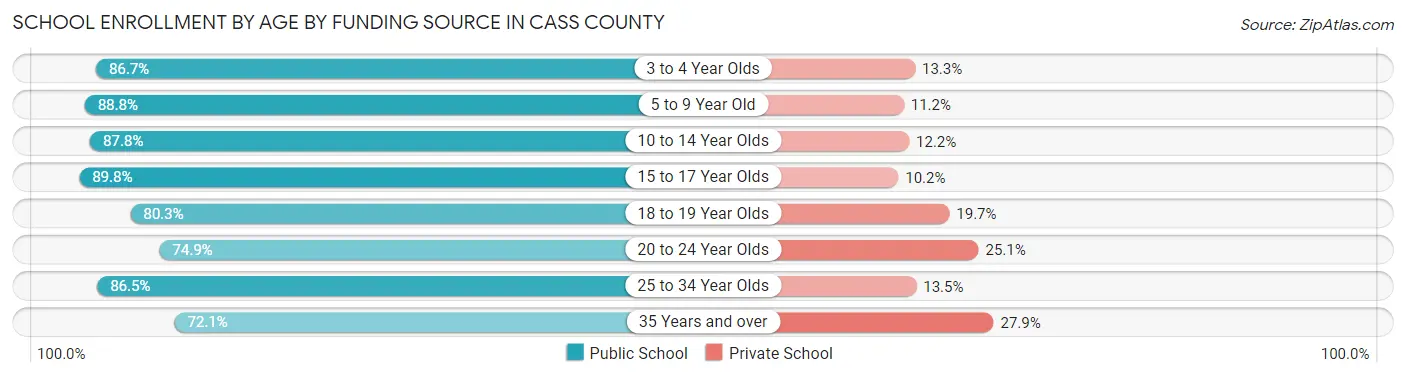
| Age Bracket | Public School | Private School |
| 3 to 4 Year Olds | 769 (86.7%) | 118 (13.3%) |
| 5 to 9 Year Old | 5,774 (88.8%) | 728 (11.2%) |
| 10 to 14 Year Olds | 6,586 (87.8%) | 914 (12.2%) |
| 15 to 17 Year Olds | 4,120 (89.8%) | 467 (10.2%) |
| 18 to 19 Year Olds | 1,240 (80.3%) | 304 (19.7%) |
| 20 to 24 Year Olds | 918 (74.9%) | 308 (25.1%) |
| 25 to 34 Year Olds | 888 (86.5%) | 139 (13.5%) |
| 35 Years and over | 679 (72.1%) | 263 (27.9%) |
| Total | 20,970 (86.6%) | 3,245 (13.4%) |
Educational Attainment by Field of Study in Cass County
Business (4,694 | 21.3%), education (4,041 | 18.3%), science & technology (2,876 | 13.0%), arts & humanities (1,652 | 7.5%), and engineering (1,306 | 5.9%) are the most common fields of study among 22,068 individuals in Cass County who have obtained a bachelor's degree or higher.
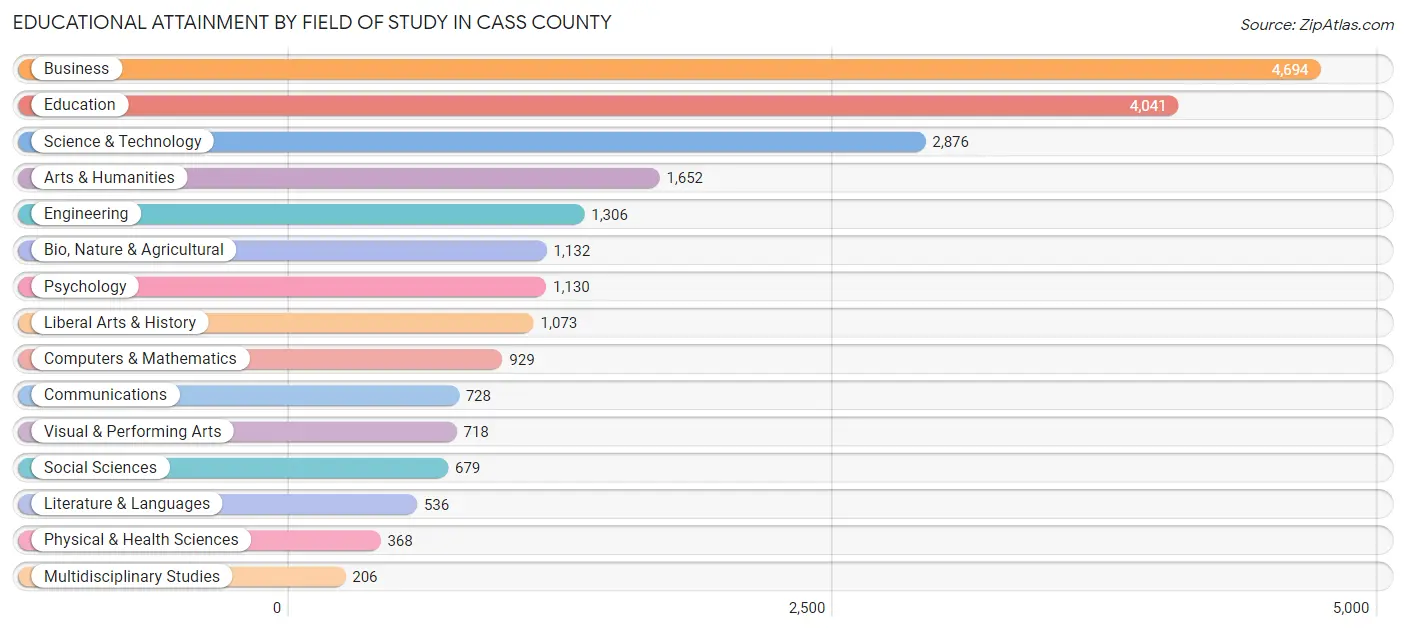
| Field of Study | # Graduates | % Graduates |
| Computers & Mathematics | 929 | 4.2% |
| Bio, Nature & Agricultural | 1,132 | 5.1% |
| Physical & Health Sciences | 368 | 1.7% |
| Psychology | 1,130 | 5.1% |
| Social Sciences | 679 | 3.1% |
| Engineering | 1,306 | 5.9% |
| Multidisciplinary Studies | 206 | 0.9% |
| Science & Technology | 2,876 | 13.0% |
| Business | 4,694 | 21.3% |
| Education | 4,041 | 18.3% |
| Literature & Languages | 536 | 2.4% |
| Liberal Arts & History | 1,073 | 4.9% |
| Visual & Performing Arts | 718 | 3.3% |
| Communications | 728 | 3.3% |
| Arts & Humanities | 1,652 | 7.5% |
| Total | 22,068 | 100.0% |
Transportation & Commute in Cass County
Vehicle Availability by Sex in Cass County
The most prevalent vehicle ownership categories in Cass County are males with 2 vehicles (11,074, accounting for 39.5%) and females with 2 vehicles (9,428, making up 43.2%).
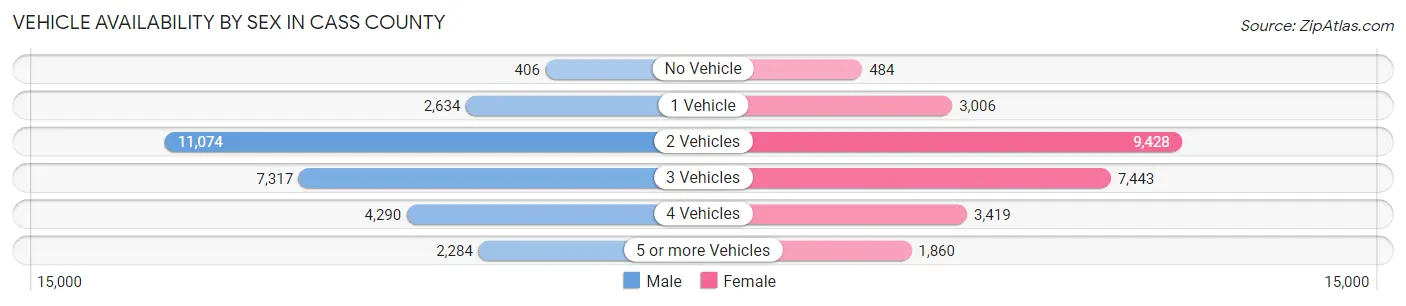
| Vehicles Available | Male | Female |
| No Vehicle | 406 (1.5%) | 484 (1.9%) |
| 1 Vehicle | 2,634 (9.4%) | 3,006 (11.7%) |
| 2 Vehicles | 11,074 (39.5%) | 9,428 (36.8%) |
| 3 Vehicles | 7,317 (26.1%) | 7,443 (29.0%) |
| 4 Vehicles | 4,290 (15.3%) | 3,419 (13.3%) |
| 5 or more Vehicles | 2,284 (8.2%) | 1,860 (7.2%) |
| Total | 28,005 (100.0%) | 25,640 (100.0%) |
Commute Time in Cass County
The most frequently occuring commute durations in Cass County are 30 to 34 minutes (7,331 commuters, 15.2%), 45 to 59 minutes (6,612 commuters, 13.7%), and 20 to 24 minutes (5,755 commuters, 11.9%).
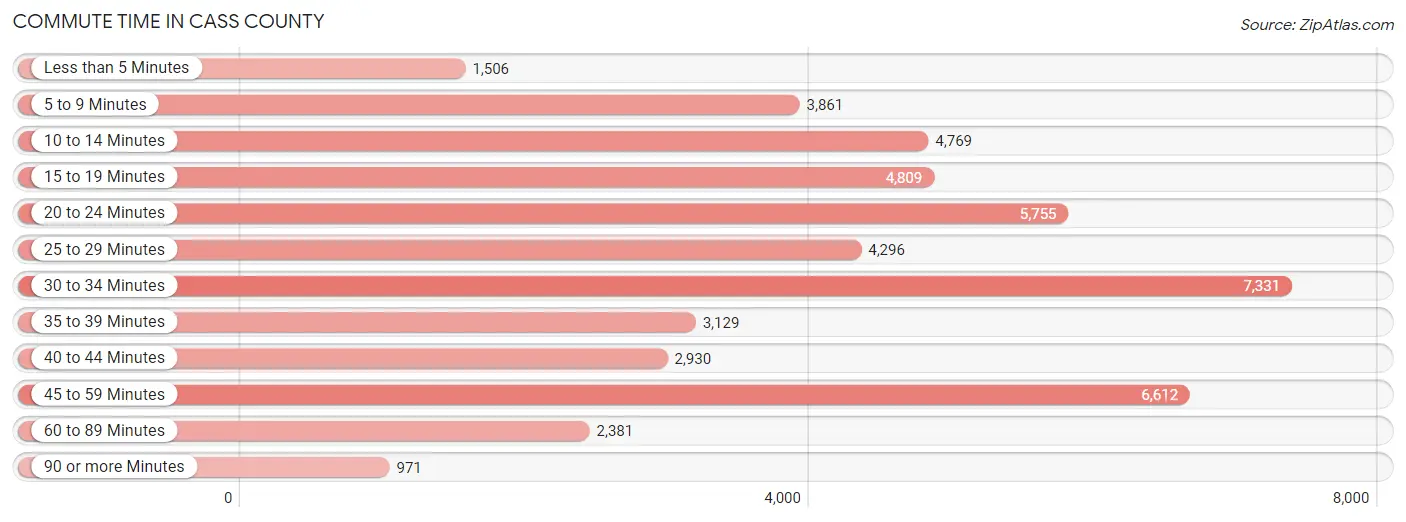
| Commute Time | # Commuters | % Commuters |
| Less than 5 Minutes | 1,506 | 3.1% |
| 5 to 9 Minutes | 3,861 | 8.0% |
| 10 to 14 Minutes | 4,769 | 9.9% |
| 15 to 19 Minutes | 4,809 | 10.0% |
| 20 to 24 Minutes | 5,755 | 11.9% |
| 25 to 29 Minutes | 4,296 | 8.9% |
| 30 to 34 Minutes | 7,331 | 15.2% |
| 35 to 39 Minutes | 3,129 | 6.5% |
| 40 to 44 Minutes | 2,930 | 6.1% |
| 45 to 59 Minutes | 6,612 | 13.7% |
| 60 to 89 Minutes | 2,381 | 4.9% |
| 90 or more Minutes | 971 | 2.0% |
Commute Time by Sex in Cass County
The most common commute times in Cass County are 30 to 34 minutes (4,272 commuters, 16.5%) for males and 20 to 24 minutes (3,088 commuters, 13.8%) for females.
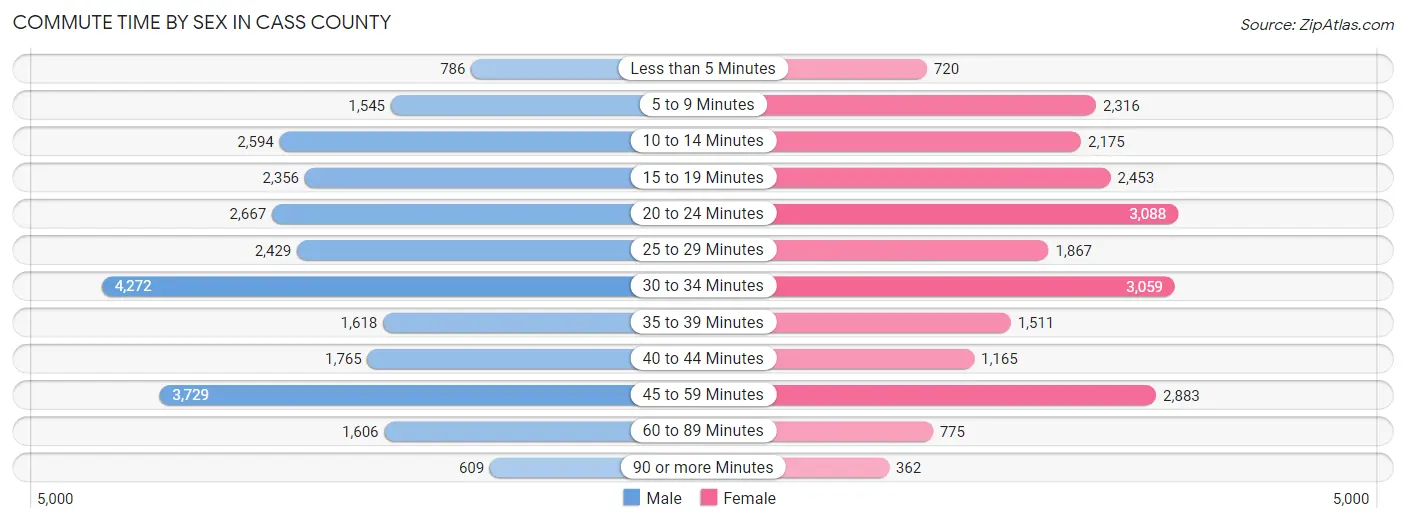
| Commute Time | Male | Female |
| Less than 5 Minutes | 786 (3.0%) | 720 (3.2%) |
| 5 to 9 Minutes | 1,545 (5.9%) | 2,316 (10.3%) |
| 10 to 14 Minutes | 2,594 (10.0%) | 2,175 (9.7%) |
| 15 to 19 Minutes | 2,356 (9.1%) | 2,453 (11.0%) |
| 20 to 24 Minutes | 2,667 (10.3%) | 3,088 (13.8%) |
| 25 to 29 Minutes | 2,429 (9.3%) | 1,867 (8.3%) |
| 30 to 34 Minutes | 4,272 (16.5%) | 3,059 (13.7%) |
| 35 to 39 Minutes | 1,618 (6.2%) | 1,511 (6.8%) |
| 40 to 44 Minutes | 1,765 (6.8%) | 1,165 (5.2%) |
| 45 to 59 Minutes | 3,729 (14.4%) | 2,883 (12.9%) |
| 60 to 89 Minutes | 1,606 (6.2%) | 775 (3.5%) |
| 90 or more Minutes | 609 (2.3%) | 362 (1.6%) |
Time of Departure to Work by Sex in Cass County
The most frequent times of departure to work in Cass County are 7:00 AM to 7:29 AM (3,726, 14.3%) for males and 7:30 AM to 7:59 AM (3,209, 14.3%) for females.
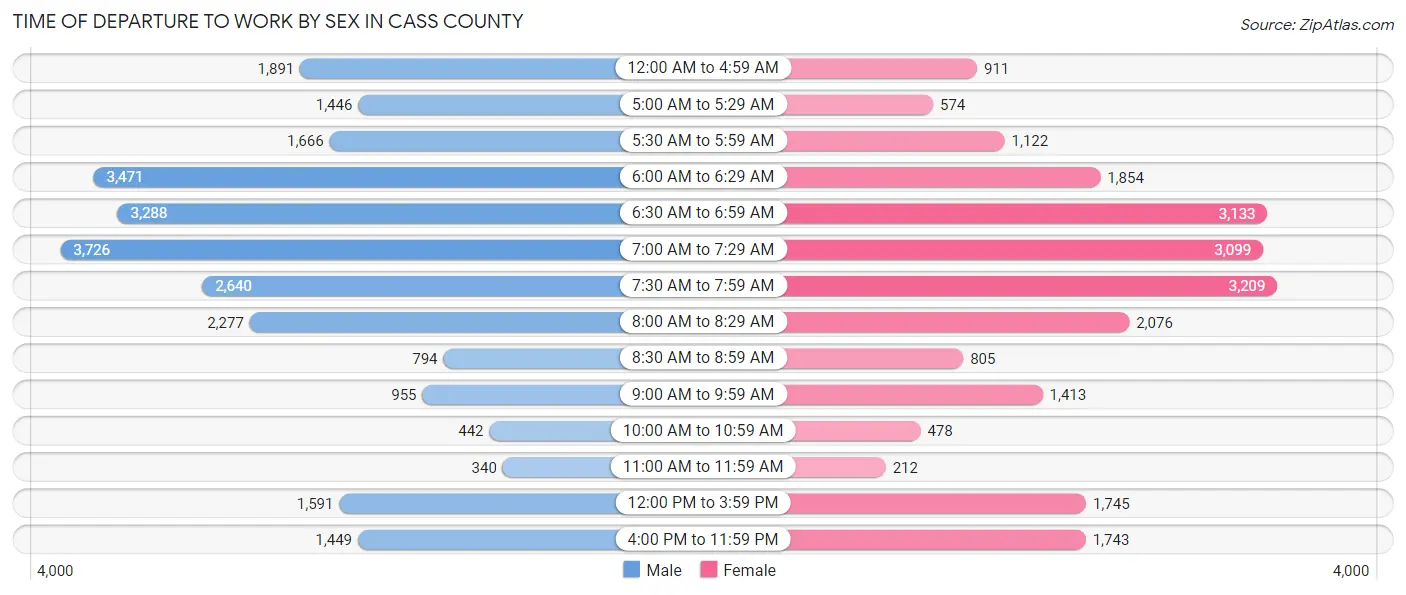
| Time of Departure | Male | Female |
| 12:00 AM to 4:59 AM | 1,891 (7.3%) | 911 (4.1%) |
| 5:00 AM to 5:29 AM | 1,446 (5.6%) | 574 (2.6%) |
| 5:30 AM to 5:59 AM | 1,666 (6.4%) | 1,122 (5.0%) |
| 6:00 AM to 6:29 AM | 3,471 (13.4%) | 1,854 (8.3%) |
| 6:30 AM to 6:59 AM | 3,288 (12.7%) | 3,133 (14.0%) |
| 7:00 AM to 7:29 AM | 3,726 (14.3%) | 3,099 (13.9%) |
| 7:30 AM to 7:59 AM | 2,640 (10.2%) | 3,209 (14.3%) |
| 8:00 AM to 8:29 AM | 2,277 (8.8%) | 2,076 (9.3%) |
| 8:30 AM to 8:59 AM | 794 (3.1%) | 805 (3.6%) |
| 9:00 AM to 9:59 AM | 955 (3.7%) | 1,413 (6.3%) |
| 10:00 AM to 10:59 AM | 442 (1.7%) | 478 (2.1%) |
| 11:00 AM to 11:59 AM | 340 (1.3%) | 212 (0.9%) |
| 12:00 PM to 3:59 PM | 1,591 (6.1%) | 1,745 (7.8%) |
| 4:00 PM to 11:59 PM | 1,449 (5.6%) | 1,743 (7.8%) |
| Total | 25,976 (100.0%) | 22,374 (100.0%) |
Housing Occupancy in Cass County
Occupancy by Ownership in Cass County
Of the total 41,524 dwellings in Cass County, owner-occupied units account for 31,622 (76.1%), while renter-occupied units make up 9,902 (23.8%).
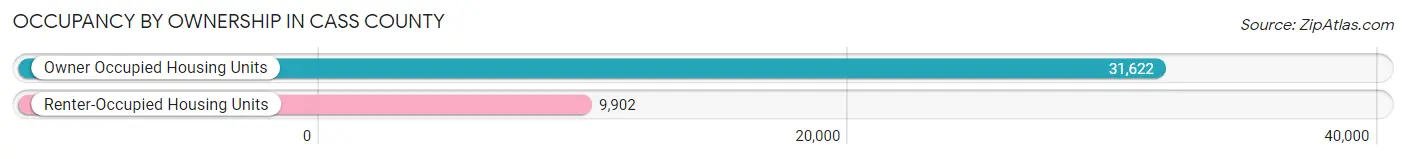
| Occupancy | # Housing Units | % Housing Units |
| Owner Occupied Housing Units | 31,622 | 76.1% |
| Renter-Occupied Housing Units | 9,902 | 23.8% |
| Total Occupied Housing Units | 41,524 | 100.0% |
Occupancy by Household Size in Cass County
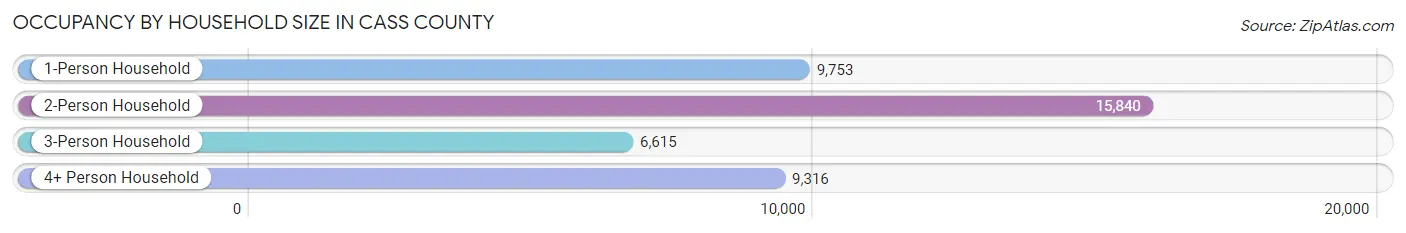
| Household Size | # Housing Units | % Housing Units |
| 1-Person Household | 9,753 | 23.5% |
| 2-Person Household | 15,840 | 38.2% |
| 3-Person Household | 6,615 | 15.9% |
| 4+ Person Household | 9,316 | 22.4% |
| Total Housing Units | 41,524 | 100.0% |
Occupancy by Ownership by Household Size in Cass County
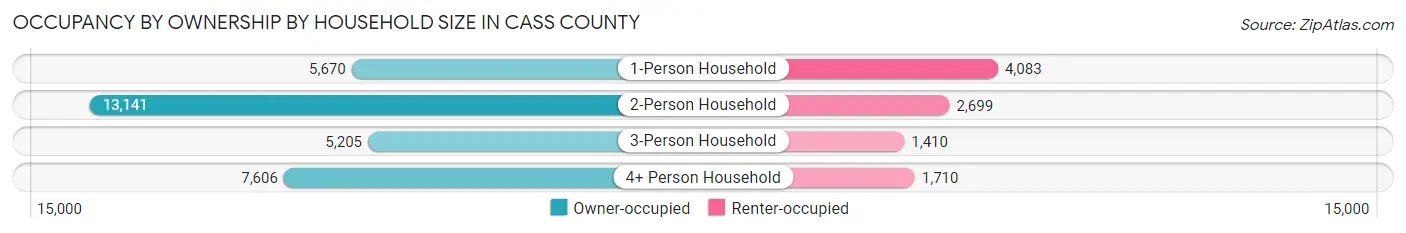
| Household Size | Owner-occupied | Renter-occupied |
| 1-Person Household | 5,670 (58.1%) | 4,083 (41.9%) |
| 2-Person Household | 13,141 (83.0%) | 2,699 (17.0%) |
| 3-Person Household | 5,205 (78.7%) | 1,410 (21.3%) |
| 4+ Person Household | 7,606 (81.6%) | 1,710 (18.4%) |
| Total Housing Units | 31,622 (76.1%) | 9,902 (23.8%) |
Occupancy by Educational Attainment in Cass County

| Household Size | Owner-occupied | Renter-occupied |
| Less than High School | 1,071 (45.2%) | 1,298 (54.8%) |
| High School Diploma | 9,066 (69.8%) | 3,928 (30.2%) |
| College/Associate Degree | 11,831 (80.5%) | 2,858 (19.5%) |
| Bachelor's Degree or higher | 9,654 (84.2%) | 1,818 (15.9%) |
Occupancy by Age of Householder in Cass County
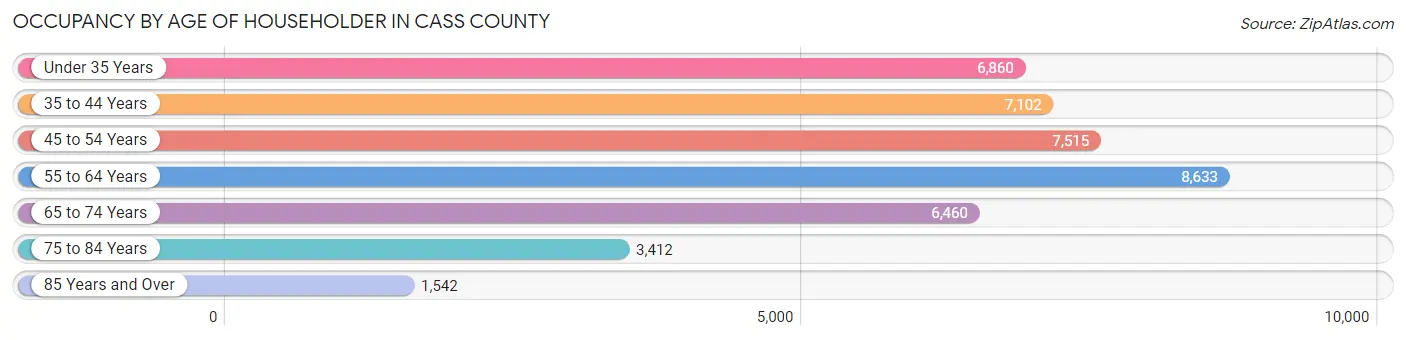
| Age Bracket | # Households | % Households |
| Under 35 Years | 6,860 | 16.5% |
| 35 to 44 Years | 7,102 | 17.1% |
| 45 to 54 Years | 7,515 | 18.1% |
| 55 to 64 Years | 8,633 | 20.8% |
| 65 to 74 Years | 6,460 | 15.6% |
| 75 to 84 Years | 3,412 | 8.2% |
| 85 Years and Over | 1,542 | 3.7% |
| Total | 41,524 | 100.0% |
Housing Finances in Cass County
Median Income by Occupancy in Cass County
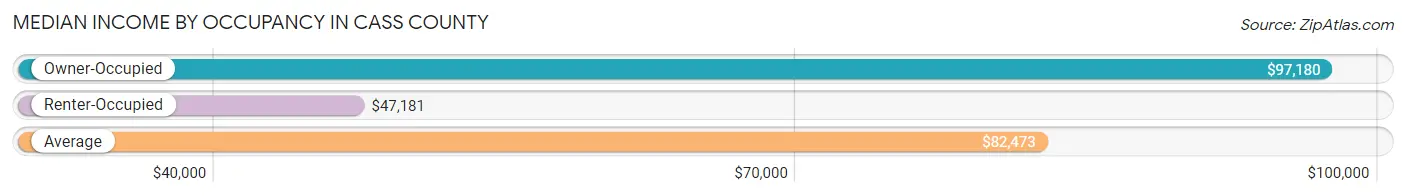
| Occupancy Type | # Households | Median Income |
| Owner-Occupied | 31,622 (76.1%) | $97,180 |
| Renter-Occupied | 9,902 (23.8%) | $47,181 |
| Average | 41,524 (100.0%) | $82,473 |
Occupancy by Householder Income Bracket in Cass County
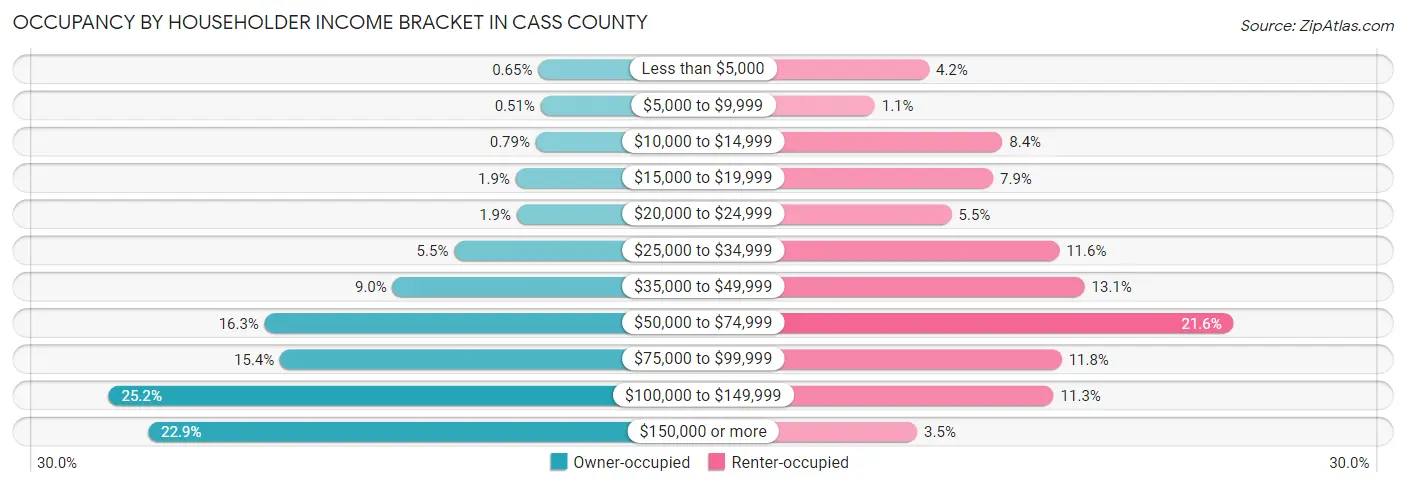
| Income Bracket | Owner-occupied | Renter-occupied |
| Less than $5,000 | 206 (0.6%) | 416 (4.2%) |
| $5,000 to $9,999 | 162 (0.5%) | 109 (1.1%) |
| $10,000 to $14,999 | 251 (0.8%) | 831 (8.4%) |
| $15,000 to $19,999 | 612 (1.9%) | 778 (7.9%) |
| $20,000 to $24,999 | 591 (1.9%) | 544 (5.5%) |
| $25,000 to $34,999 | 1,722 (5.4%) | 1,153 (11.6%) |
| $35,000 to $49,999 | 2,835 (9.0%) | 1,296 (13.1%) |
| $50,000 to $74,999 | 5,149 (16.3%) | 2,139 (21.6%) |
| $75,000 to $99,999 | 4,871 (15.4%) | 1,166 (11.8%) |
| $100,000 to $149,999 | 7,968 (25.2%) | 1,121 (11.3%) |
| $150,000 or more | 7,255 (22.9%) | 349 (3.5%) |
| Total | 31,622 (100.0%) | 9,902 (100.0%) |
Monthly Housing Cost Tiers in Cass County
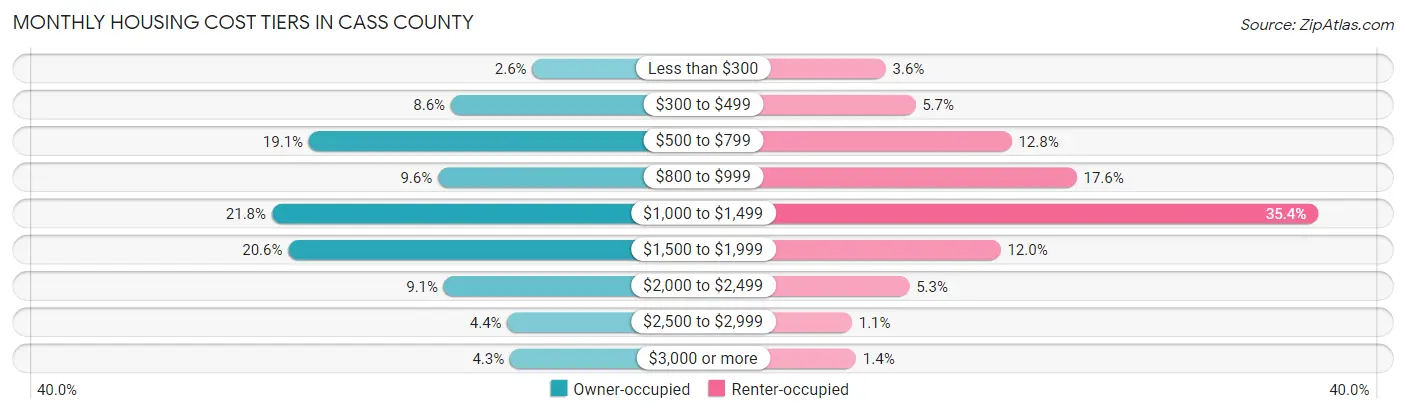
| Monthly Cost | Owner-occupied | Renter-occupied |
| Less than $300 | 822 (2.6%) | 352 (3.5%) |
| $300 to $499 | 2,720 (8.6%) | 567 (5.7%) |
| $500 to $799 | 6,027 (19.1%) | 1,269 (12.8%) |
| $800 to $999 | 3,021 (9.6%) | 1,744 (17.6%) |
| $1,000 to $1,499 | 6,892 (21.8%) | 3,504 (35.4%) |
| $1,500 to $1,999 | 6,508 (20.6%) | 1,189 (12.0%) |
| $2,000 to $2,499 | 2,884 (9.1%) | 524 (5.3%) |
| $2,500 to $2,999 | 1,405 (4.4%) | 105 (1.1%) |
| $3,000 or more | 1,343 (4.3%) | 135 (1.4%) |
| Total | 31,622 (100.0%) | 9,902 (100.0%) |
Physical Housing Characteristics in Cass County
Housing Structures in Cass County
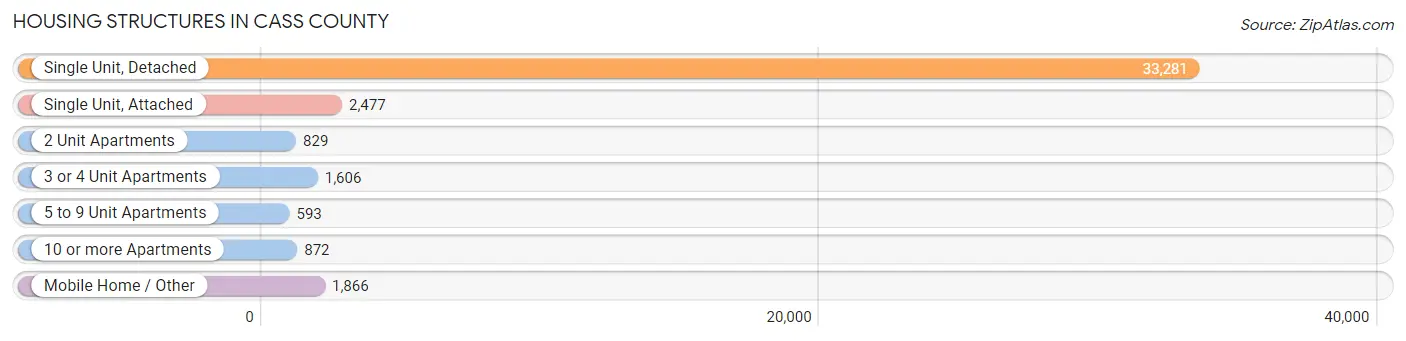
| Structure Type | # Housing Units | % Housing Units |
| Single Unit, Detached | 33,281 | 80.1% |
| Single Unit, Attached | 2,477 | 6.0% |
| 2 Unit Apartments | 829 | 2.0% |
| 3 or 4 Unit Apartments | 1,606 | 3.9% |
| 5 to 9 Unit Apartments | 593 | 1.4% |
| 10 or more Apartments | 872 | 2.1% |
| Mobile Home / Other | 1,866 | 4.5% |
| Total | 41,524 | 100.0% |
Housing Structures by Occupancy in Cass County
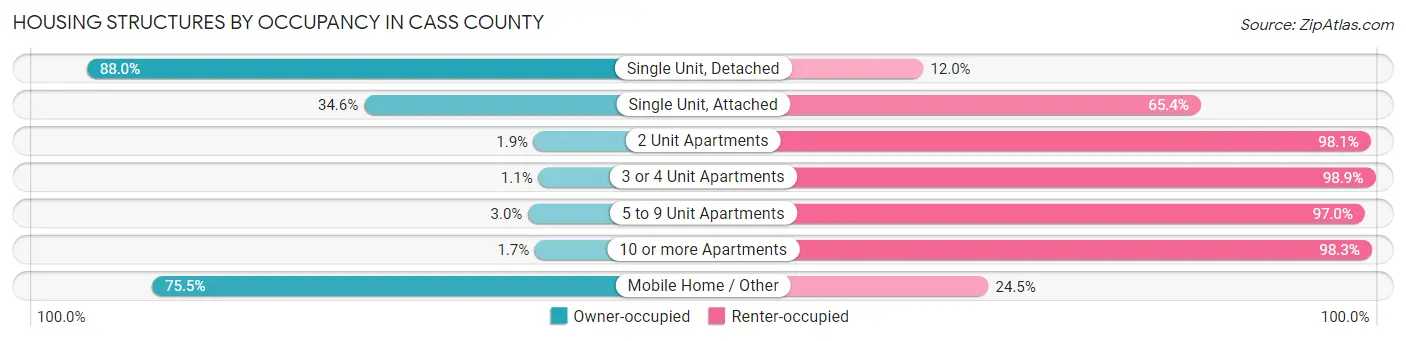
| Structure Type | Owner-occupied | Renter-occupied |
| Single Unit, Detached | 29,290 (88.0%) | 3,991 (12.0%) |
| Single Unit, Attached | 858 (34.6%) | 1,619 (65.4%) |
| 2 Unit Apartments | 16 (1.9%) | 813 (98.1%) |
| 3 or 4 Unit Apartments | 17 (1.1%) | 1,589 (98.9%) |
| 5 to 9 Unit Apartments | 18 (3.0%) | 575 (97.0%) |
| 10 or more Apartments | 15 (1.7%) | 857 (98.3%) |
| Mobile Home / Other | 1,408 (75.5%) | 458 (24.5%) |
| Total | 31,622 (76.1%) | 9,902 (23.8%) |
Housing Structures by Number of Rooms in Cass County
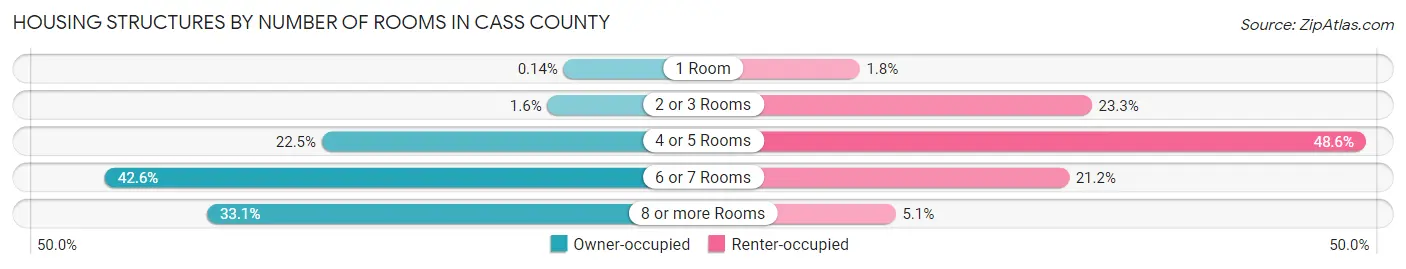
| Number of Rooms | Owner-occupied | Renter-occupied |
| 1 Room | 45 (0.1%) | 179 (1.8%) |
| 2 or 3 Rooms | 520 (1.6%) | 2,304 (23.3%) |
| 4 or 5 Rooms | 7,117 (22.5%) | 4,815 (48.6%) |
| 6 or 7 Rooms | 13,463 (42.6%) | 2,095 (21.2%) |
| 8 or more Rooms | 10,477 (33.1%) | 509 (5.1%) |
| Total | 31,622 (100.0%) | 9,902 (100.0%) |
Housing Structure by Heating Type in Cass County
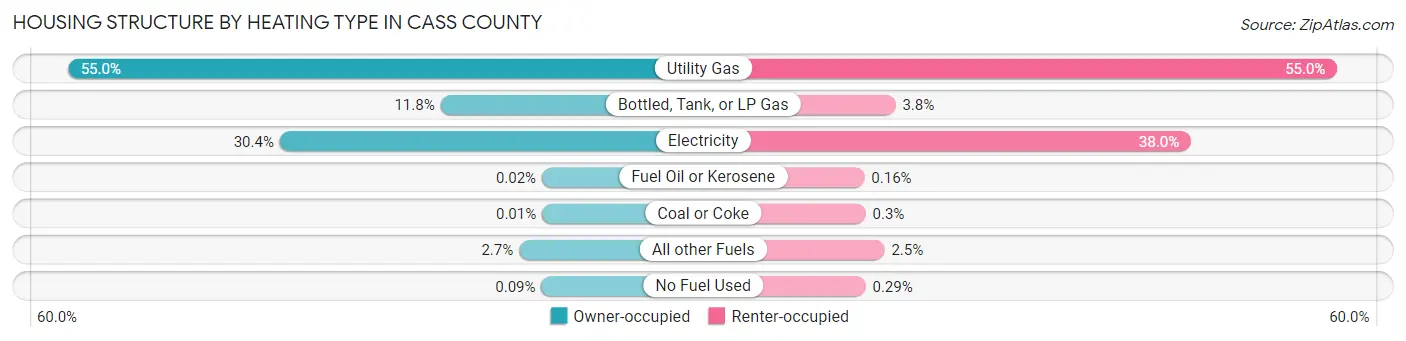
| Heating Type | Owner-occupied | Renter-occupied |
| Utility Gas | 17,393 (55.0%) | 5,443 (55.0%) |
| Bottled, Tank, or LP Gas | 3,726 (11.8%) | 372 (3.8%) |
| Electricity | 9,619 (30.4%) | 3,766 (38.0%) |
| Fuel Oil or Kerosene | 6 (0.0%) | 16 (0.2%) |
| Coal or Coke | 3 (0.0%) | 30 (0.3%) |
| All other Fuels | 845 (2.7%) | 246 (2.5%) |
| No Fuel Used | 30 (0.1%) | 29 (0.3%) |
| Total | 31,622 (100.0%) | 9,902 (100.0%) |
Household Vehicle Usage in Cass County
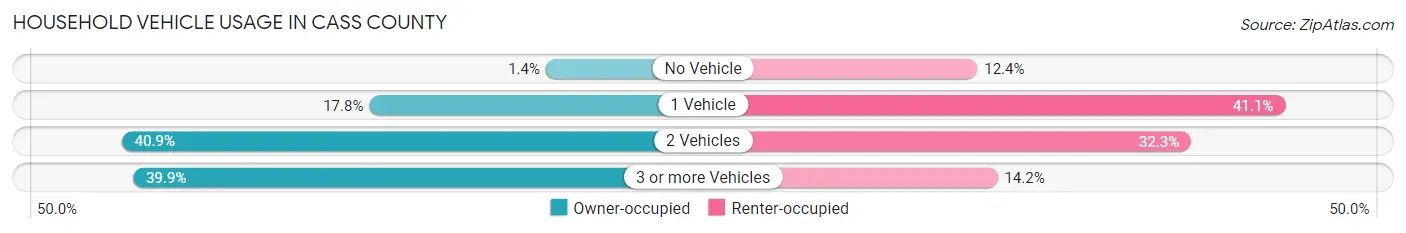
| Vehicles per Household | Owner-occupied | Renter-occupied |
| No Vehicle | 427 (1.3%) | 1,224 (12.4%) |
| 1 Vehicle | 5,638 (17.8%) | 4,069 (41.1%) |
| 2 Vehicles | 12,946 (40.9%) | 3,199 (32.3%) |
| 3 or more Vehicles | 12,611 (39.9%) | 1,410 (14.2%) |
| Total | 31,622 (100.0%) | 9,902 (100.0%) |
Real Estate & Mortgages in Cass County
Real Estate and Mortgage Overview in Cass County
| Characteristic | Without Mortgage | With Mortgage |
| Housing Units | 10,903 | 20,719 |
| Median Property Value | $224,800 | $250,400 |
| Median Household Income | $69,691 | $5,577 |
| Monthly Housing Costs | $597 | $1,310 |
| Real Estate Taxes | $2,086 | $496 |
Property Value by Mortgage Status in Cass County
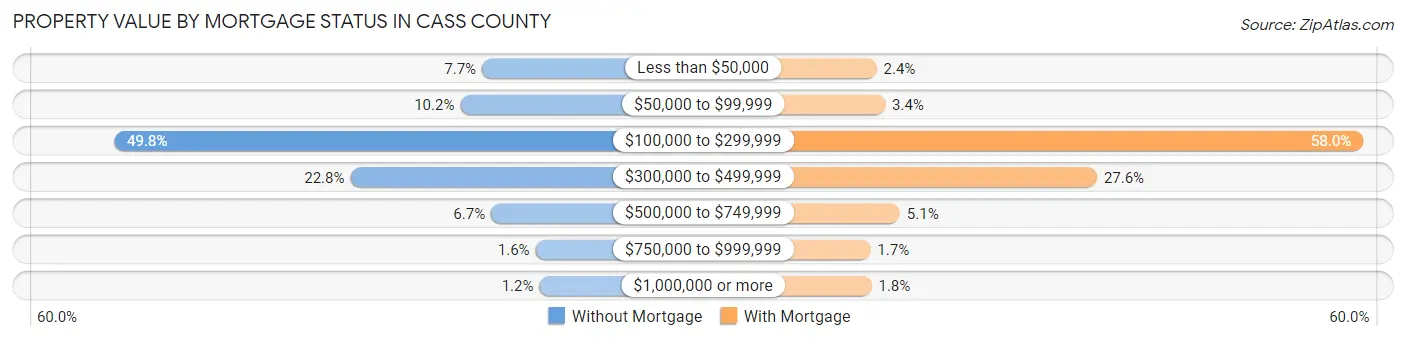
| Property Value | Without Mortgage | With Mortgage |
| Less than $50,000 | 843 (7.7%) | 500 (2.4%) |
| $50,000 to $99,999 | 1,113 (10.2%) | 700 (3.4%) |
| $100,000 to $299,999 | 5,427 (49.8%) | 12,019 (58.0%) |
| $300,000 to $499,999 | 2,484 (22.8%) | 5,717 (27.6%) |
| $500,000 to $749,999 | 730 (6.7%) | 1,051 (5.1%) |
| $750,000 to $999,999 | 177 (1.6%) | 352 (1.7%) |
| $1,000,000 or more | 129 (1.2%) | 380 (1.8%) |
| Total | 10,903 (100.0%) | 20,719 (100.0%) |
Household Income by Mortgage Status in Cass County
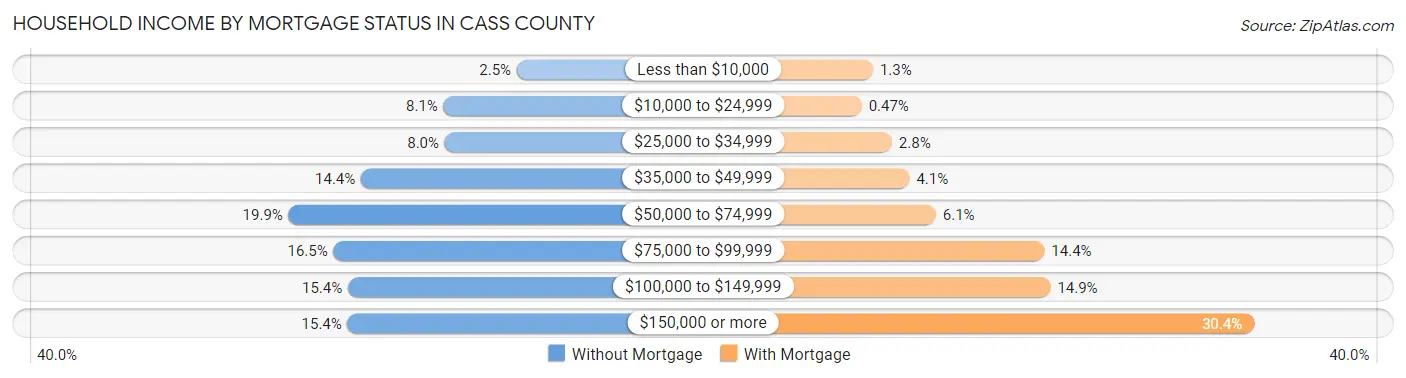
| Household Income | Without Mortgage | With Mortgage |
| Less than $10,000 | 271 (2.5%) | 276 (1.3%) |
| $10,000 to $24,999 | 880 (8.1%) | 97 (0.5%) |
| $25,000 to $34,999 | 870 (8.0%) | 574 (2.8%) |
| $35,000 to $49,999 | 1,566 (14.4%) | 852 (4.1%) |
| $50,000 to $74,999 | 2,168 (19.9%) | 1,269 (6.1%) |
| $75,000 to $99,999 | 1,795 (16.5%) | 2,981 (14.4%) |
| $100,000 to $149,999 | 1,675 (15.4%) | 3,076 (14.8%) |
| $150,000 or more | 1,678 (15.4%) | 6,293 (30.4%) |
| Total | 10,903 (100.0%) | 20,719 (100.0%) |
Property Value to Household Income Ratio in Cass County
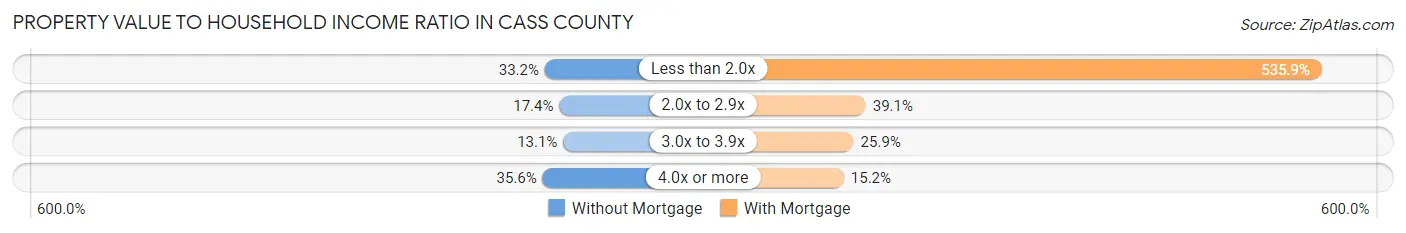
| Value-to-Income Ratio | Without Mortgage | With Mortgage |
| Less than 2.0x | 3,614 (33.2%) | 111,041 (535.9%) |
| 2.0x to 2.9x | 1,893 (17.4%) | 8,092 (39.1%) |
| 3.0x to 3.9x | 1,432 (13.1%) | 5,355 (25.9%) |
| 4.0x or more | 3,880 (35.6%) | 3,142 (15.2%) |
| Total | 10,903 (100.0%) | 20,719 (100.0%) |
Real Estate Taxes by Mortgage Status in Cass County
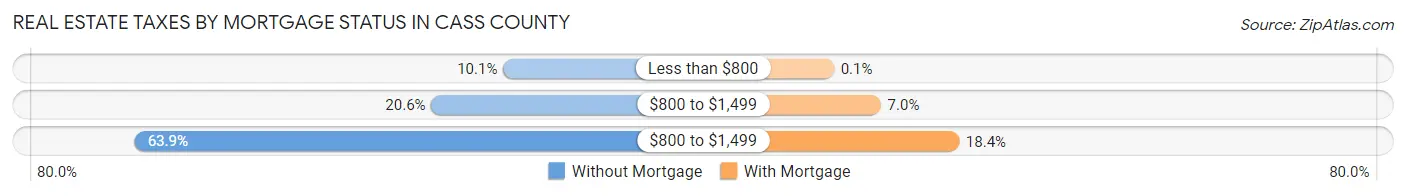
| Property Taxes | Without Mortgage | With Mortgage |
| Less than $800 | 1,097 (10.1%) | 21 (0.1%) |
| $800 to $1,499 | 2,242 (20.6%) | 1,443 (7.0%) |
| $800 to $1,499 | 6,967 (63.9%) | 3,811 (18.4%) |
| Total | 10,903 (100.0%) | 20,719 (100.0%) |
Health & Disability in Cass County
Health Insurance Coverage by Age in Cass County
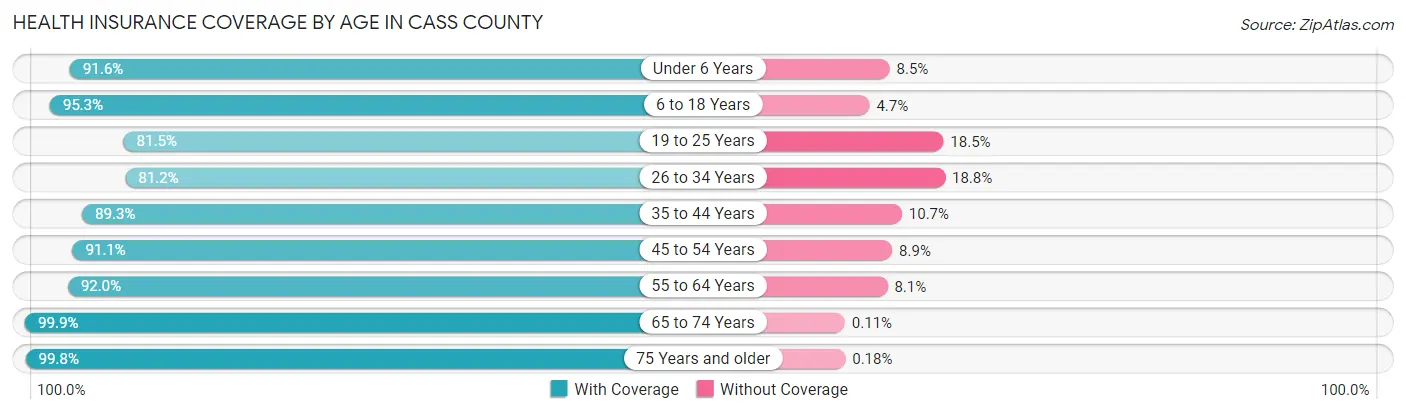
| Age Bracket | With Coverage | Without Coverage |
| Under 6 Years | 6,786 (91.5%) | 626 (8.5%) |
| 6 to 18 Years | 18,609 (95.3%) | 918 (4.7%) |
| 19 to 25 Years | 6,572 (81.5%) | 1,490 (18.5%) |
| 26 to 34 Years | 9,663 (81.2%) | 2,236 (18.8%) |
| 35 to 44 Years | 12,325 (89.3%) | 1,482 (10.7%) |
| 45 to 54 Years | 12,341 (91.1%) | 1,210 (8.9%) |
| 55 to 64 Years | 13,869 (91.9%) | 1,214 (8.1%) |
| 65 to 74 Years | 10,358 (99.9%) | 11 (0.1%) |
| 75 Years and older | 7,584 (99.8%) | 14 (0.2%) |
| Total | 98,107 (91.4%) | 9,201 (8.6%) |
Health Insurance Coverage by Citizenship Status in Cass County
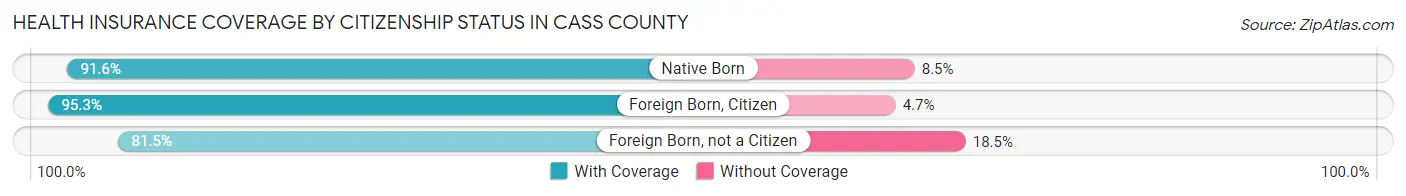
| Citizenship Status | With Coverage | Without Coverage |
| Native Born | 6,786 (91.5%) | 626 (8.5%) |
| Foreign Born, Citizen | 18,609 (95.3%) | 918 (4.7%) |
| Foreign Born, not a Citizen | 6,572 (81.5%) | 1,490 (18.5%) |
Health Insurance Coverage by Household Income in Cass County
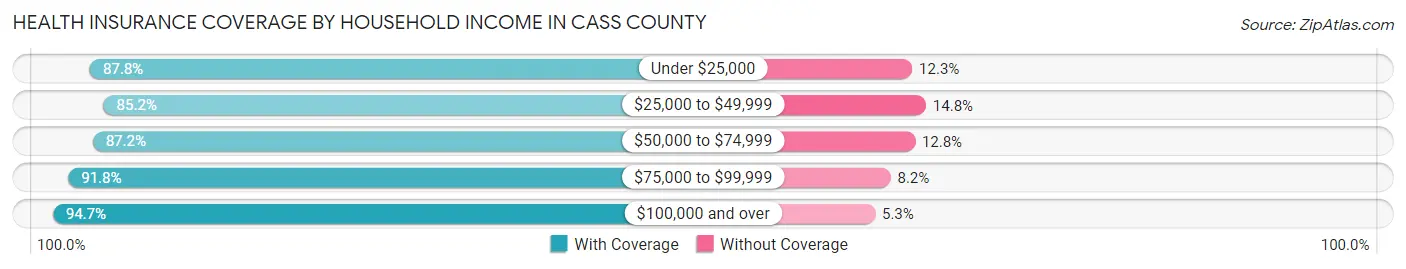
| Household Income | With Coverage | Without Coverage |
| Under $25,000 | 6,139 (87.7%) | 857 (12.2%) |
| $25,000 to $49,999 | 11,228 (85.2%) | 1,954 (14.8%) |
| $50,000 to $74,999 | 14,928 (87.2%) | 2,185 (12.8%) |
| $75,000 to $99,999 | 16,032 (91.8%) | 1,431 (8.2%) |
| $100,000 and over | 49,622 (94.7%) | 2,771 (5.3%) |
Public vs Private Health Insurance Coverage by Age in Cass County
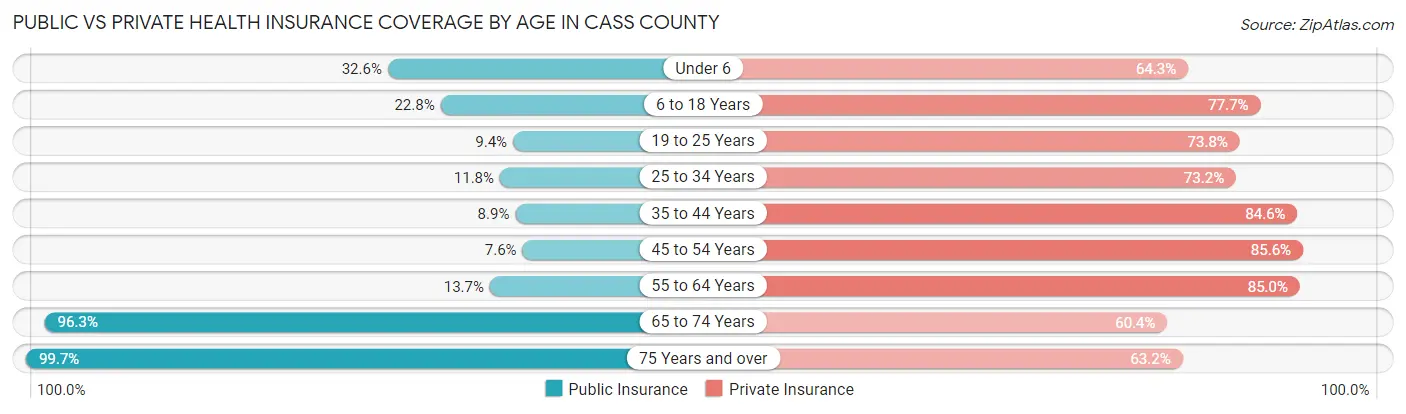
| Age Bracket | Public Insurance | Private Insurance |
| Under 6 | 2,416 (32.6%) | 4,763 (64.3%) |
| 6 to 18 Years | 4,454 (22.8%) | 15,170 (77.7%) |
| 19 to 25 Years | 755 (9.4%) | 5,953 (73.8%) |
| 25 to 34 Years | 1,402 (11.8%) | 8,705 (73.2%) |
| 35 to 44 Years | 1,233 (8.9%) | 11,677 (84.6%) |
| 45 to 54 Years | 1,028 (7.6%) | 11,597 (85.6%) |
| 55 to 64 Years | 2,061 (13.7%) | 12,820 (85.0%) |
| 65 to 74 Years | 9,984 (96.3%) | 6,265 (60.4%) |
| 75 Years and over | 7,578 (99.7%) | 4,804 (63.2%) |
| Total | 30,911 (28.8%) | 81,754 (76.2%) |
Disability Status by Sex by Age in Cass County
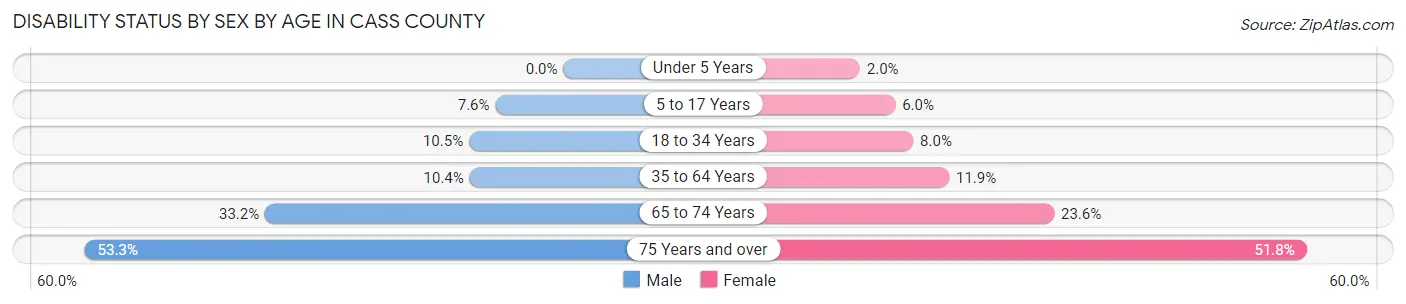
| Age Bracket | Male | Female |
| Under 5 Years | 0 (0.0%) | 63 (2.0%) |
| 5 to 17 Years | 749 (7.6%) | 562 (5.9%) |
| 18 to 34 Years | 1,136 (10.5%) | 831 (8.0%) |
| 35 to 64 Years | 2,172 (10.4%) | 2,585 (11.9%) |
| 65 to 74 Years | 1,615 (33.2%) | 1,302 (23.6%) |
| 75 Years and over | 1,674 (53.3%) | 2,307 (51.7%) |
Disability Class by Sex by Age in Cass County
Disability Class: Hearing Difficulty
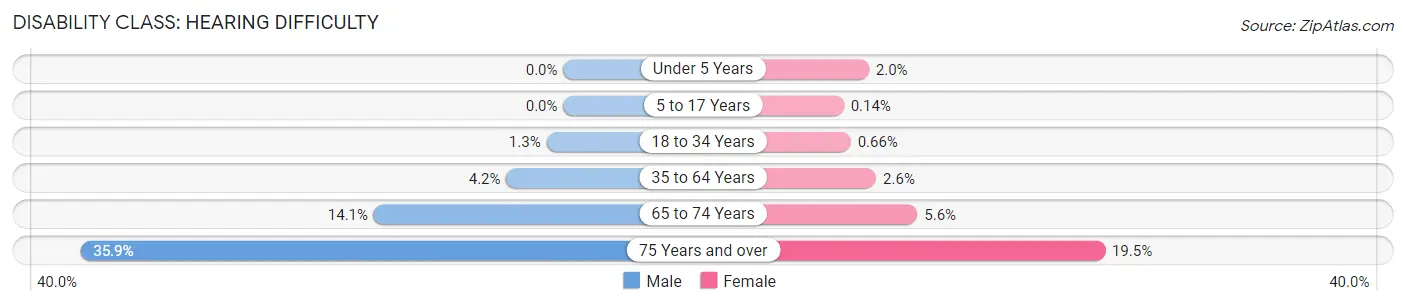
| Age Bracket | Male | Female |
| Under 5 Years | 0 (0.0%) | 63 (2.0%) |
| 5 to 17 Years | 0 (0.0%) | 13 (0.1%) |
| 18 to 34 Years | 135 (1.3%) | 69 (0.7%) |
| 35 to 64 Years | 880 (4.2%) | 553 (2.5%) |
| 65 to 74 Years | 684 (14.1%) | 309 (5.6%) |
| 75 Years and over | 1,126 (35.9%) | 871 (19.5%) |
Disability Class: Vision Difficulty
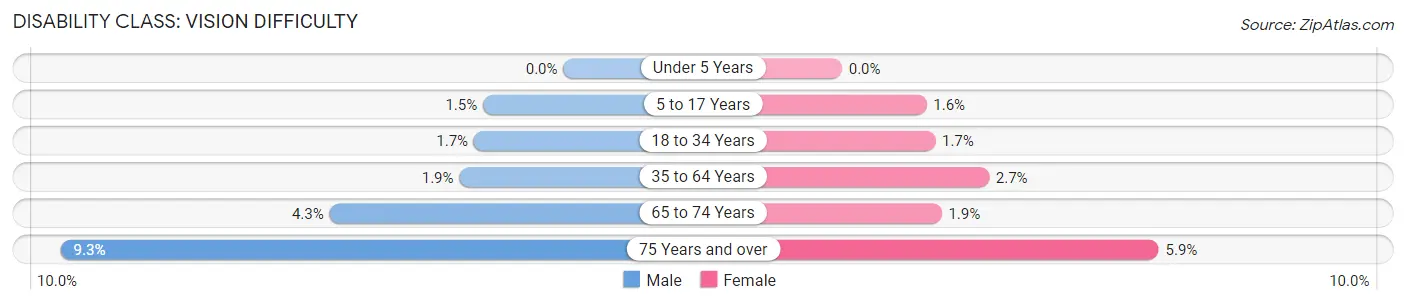
| Age Bracket | Male | Female |
| Under 5 Years | 0 (0.0%) | 0 (0.0%) |
| 5 to 17 Years | 147 (1.5%) | 148 (1.6%) |
| 18 to 34 Years | 180 (1.7%) | 181 (1.7%) |
| 35 to 64 Years | 402 (1.9%) | 590 (2.7%) |
| 65 to 74 Years | 211 (4.3%) | 102 (1.8%) |
| 75 Years and over | 293 (9.3%) | 262 (5.9%) |
Disability Class: Cognitive Difficulty
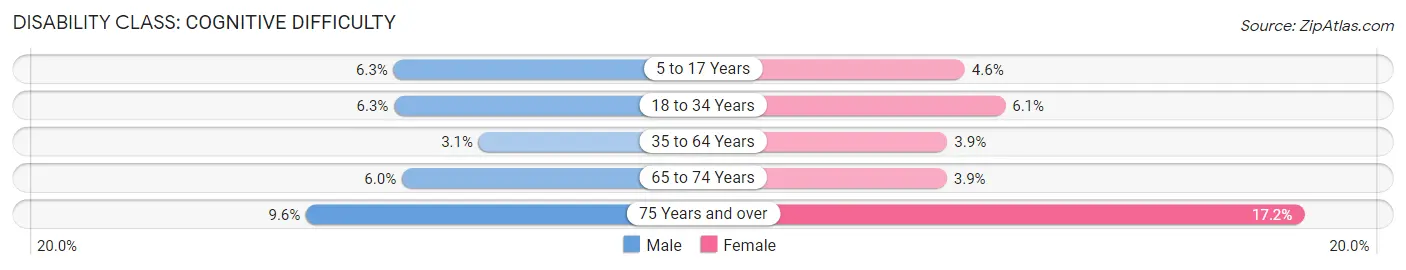
| Age Bracket | Male | Female |
| 5 to 17 Years | 623 (6.3%) | 432 (4.6%) |
| 18 to 34 Years | 679 (6.3%) | 634 (6.1%) |
| 35 to 64 Years | 652 (3.1%) | 848 (3.9%) |
| 65 to 74 Years | 291 (6.0%) | 215 (3.9%) |
| 75 Years and over | 300 (9.6%) | 765 (17.2%) |
Disability Class: Ambulatory Difficulty
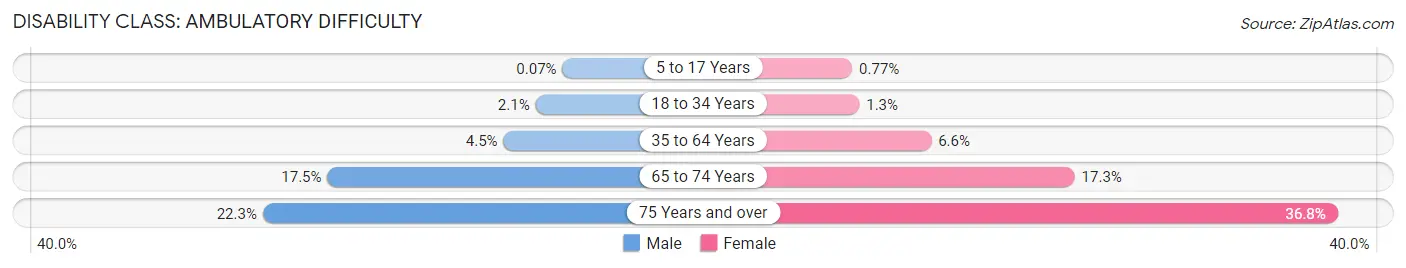
| Age Bracket | Male | Female |
| 5 to 17 Years | 7 (0.1%) | 73 (0.8%) |
| 18 to 34 Years | 224 (2.1%) | 136 (1.3%) |
| 35 to 64 Years | 925 (4.4%) | 1,437 (6.6%) |
| 65 to 74 Years | 852 (17.5%) | 952 (17.3%) |
| 75 Years and over | 701 (22.3%) | 1,641 (36.8%) |
Disability Class: Self-Care Difficulty
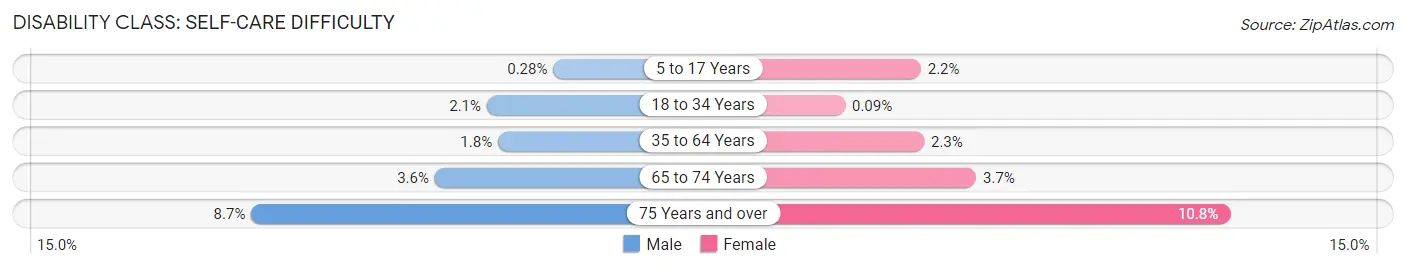
| Age Bracket | Male | Female |
| 5 to 17 Years | 28 (0.3%) | 208 (2.2%) |
| 18 to 34 Years | 230 (2.1%) | 9 (0.1%) |
| 35 to 64 Years | 379 (1.8%) | 496 (2.3%) |
| 65 to 74 Years | 174 (3.6%) | 206 (3.7%) |
| 75 Years and over | 273 (8.7%) | 482 (10.8%) |
Technology Access in Cass County
Computing Device Access in Cass County
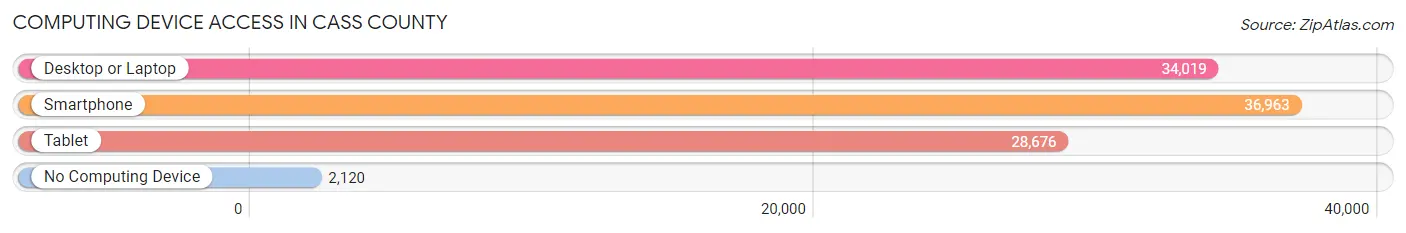
| Device Type | # Households | % Households |
| Desktop or Laptop | 34,019 | 81.9% |
| Smartphone | 36,963 | 89.0% |
| Tablet | 28,676 | 69.1% |
| No Computing Device | 2,120 | 5.1% |
| Total | 41,524 | 100.0% |
Internet Access in Cass County
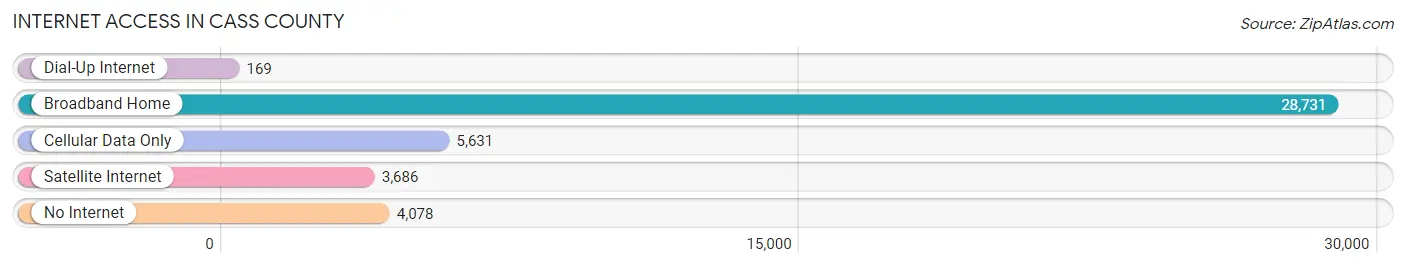
| Internet Type | # Households | % Households |
| Dial-Up Internet | 169 | 0.4% |
| Broadband Home | 28,731 | 69.2% |
| Cellular Data Only | 5,631 | 13.6% |
| Satellite Internet | 3,686 | 8.9% |
| No Internet | 4,078 | 9.8% |
| Total | 41,524 | 100.0% |
Cass County Summary
Cass County, Missouri is located in the western part of the state and is part of the Kansas City metropolitan area. It is bordered by Jackson County to the north, Bates County to the east, Johnson County to the south, and Henry and St. Clair counties to the west. The county seat is Harrisonville, and the largest city is Belton. As of the 2010 census, the population was 99,478, making it the sixth-most populous county in Missouri.
History
Cass County was established in 1835 and named after Lewis Cass, a prominent politician and military leader in the early 19th century. The county was originally part of Jackson County, but was split off in 1835. The county was largely rural until the late 19th century, when the Kansas City metropolitan area began to expand. The county experienced rapid growth in the late 20th century, as the population of the Kansas City metropolitan area increased.
Geography
Cass County covers an area of 545 square miles, making it the 25th-largest county in Missouri. The county is located in the western part of the state, and is part of the Kansas City metropolitan area. The county is mostly flat, with some rolling hills in the northern and western parts. The county is drained by the Missouri River, which forms its western border.
The county is home to several state parks, including Longview Lake, Smithville Lake, and Fleming Park. The county also contains several wildlife areas, including the Harrisonville Wildlife Area and the Smithville Wildlife Area.
Economy
Cass County has a diverse economy, with a mix of manufacturing, retail, and service industries. The county is home to several large employers, including Cerner Corporation, Hallmark Cards, and the Kansas City Chiefs. The county also has a large agricultural sector, with corn, soybeans, and hay being the main crops.
Demographics
As of the 2010 census, the population of Cass County was 99,478, making it the sixth-most populous county in Missouri. The population was spread out, with 24.3% under the age of 18, 8.2% from 18 to 24, 28.2% from 25 to 44, 25.2% from 45 to 64, and 14.1% who were 65 years of age or older. The median age was 37.4 years.
The racial makeup of the county was 87.2% White, 8.2% African American, 0.5% Native American, 1.2% Asian, 0.2% Pacific Islander, 1.2% from other races, and 1.7% from two or more races. Hispanic or Latino of any race were 3.3% of the population.
The median income for a household in the county was $50,945, and the median income for a family was $60,945. The per capita income for the county was $24,945. About 8.2% of families and 10.3% of the population were below the poverty line, including 14.2% of those under age 18 and 6.2% of those age 65 or over.
Common Questions
What is Per Capita Income in Cass County?
Per Capita income in Cass County is $38,766.
What is the Median Family Income in Cass County?
Median Family Income in Cass County is $98,960.
What is the Median Household income in Cass County?
Median Household Income in Cass County is $82,473.
What is Income or Wage Gap in Cass County?
Income or Wage Gap in Cass County is 28.2%.
Women in Cass County earn 71.8 cents for every dollar earned by a man.
What is Family Income Deficit in Cass County?
Family Income Deficit in Cass County is $10,088.
Families that are below poverty line in Cass County earn $10,088 less on average than the poverty threshold level.
What is Inequality or Gini Index in Cass County?
Inequality or Gini Index in Cass County is 0.40.
What is the Total Population of Cass County?
Total Population of Cass County is 108,205.
What is the Total Male Population of Cass County?
Total Male Population of Cass County is 53,087.
What is the Total Female Population of Cass County?
Total Female Population of Cass County is 55,118.
What is the Ratio of Males per 100 Females in Cass County?
There are 96.32 Males per 100 Females in Cass County.
What is the Ratio of Females per 100 Males in Cass County?
There are 103.83 Females per 100 Males in Cass County.
What is the Median Population Age in Cass County?
Median Population Age in Cass County is 39.9 Years.
What is the Average Family Size in Cass County
Average Family Size in Cass County is 3.0 People.
What is the Average Household Size in Cass County
Average Household Size in Cass County is 2.6 People.
How Large is the Labor Force in Cass County?
There are 57,100 People in the Labor Forcein in Cass County.
What is the Percentage of People in the Labor Force in Cass County?
66.6% of People are in the Labor Force in Cass County.
What is the Unemployment Rate in Cass County?
Unemployment Rate in Cass County is 4.5%.