Caldwell County, MO Map & Demographics
Caldwell County Map
Caldwell County Overview
$29,673
PER CAPITA INCOME
$71,362
AVG FAMILY INCOME
$58,269
AVG HOUSEHOLD INCOME
24.2%
WAGE / INCOME GAP [ % ]
75.8¢/ $1
WAGE / INCOME GAP [ $ ]
$7,604
FAMILY INCOME DEFICIT
0.43
INEQUALITY / GINI INDEX
8,876
TOTAL POPULATION
4,549
MALE POPULATION
4,327
FEMALE POPULATION
105.13
MALES / 100 FEMALES
95.12
FEMALES / 100 MALES
42.7
MEDIAN AGE
3.1
AVG FAMILY SIZE
2.5
AVG HOUSEHOLD SIZE
3,968
LABOR FORCE [ PEOPLE ]
56.2%
PERCENT IN LABOR FORCE
4.8%
UNEMPLOYMENT RATE
Income in Caldwell County
Income Overview in Caldwell County
Per Capita Income in Caldwell County is $29,673, while median incomes of families and households are $71,362 and $58,269 respectively.
| Characteristic | Number | Measure |
| Per Capita Income | 8,876 | $29,673 |
| Median Family Income | 2,278 | $71,362 |
| Mean Family Income | 2,278 | $87,525 |
| Median Household Income | 3,480 | $58,269 |
| Mean Household Income | 3,480 | $72,708 |
| Income Deficit | 2,278 | $7,604 |
| Wage / Income Gap (%) | 8,876 | 24.20% |
| Wage / Income Gap ($) | 8,876 | 75.80¢ per $1 |
| Gini / Inequality Index | 8,876 | 0.43 |
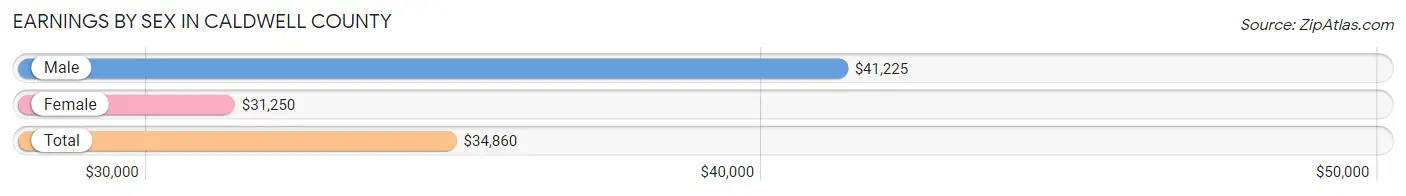
Earnings by Sex in Caldwell County
Average Earnings in Caldwell County are $34,860, $41,225 for men and $31,250 for women, a difference of 24.2%.
| Sex | Number | Average Earnings |
| Male | 2,349 (55.5%) | $41,225 |
| Female | 1,885 (44.5%) | $31,250 |
| Total | 4,234 (100.0%) | $34,860 |
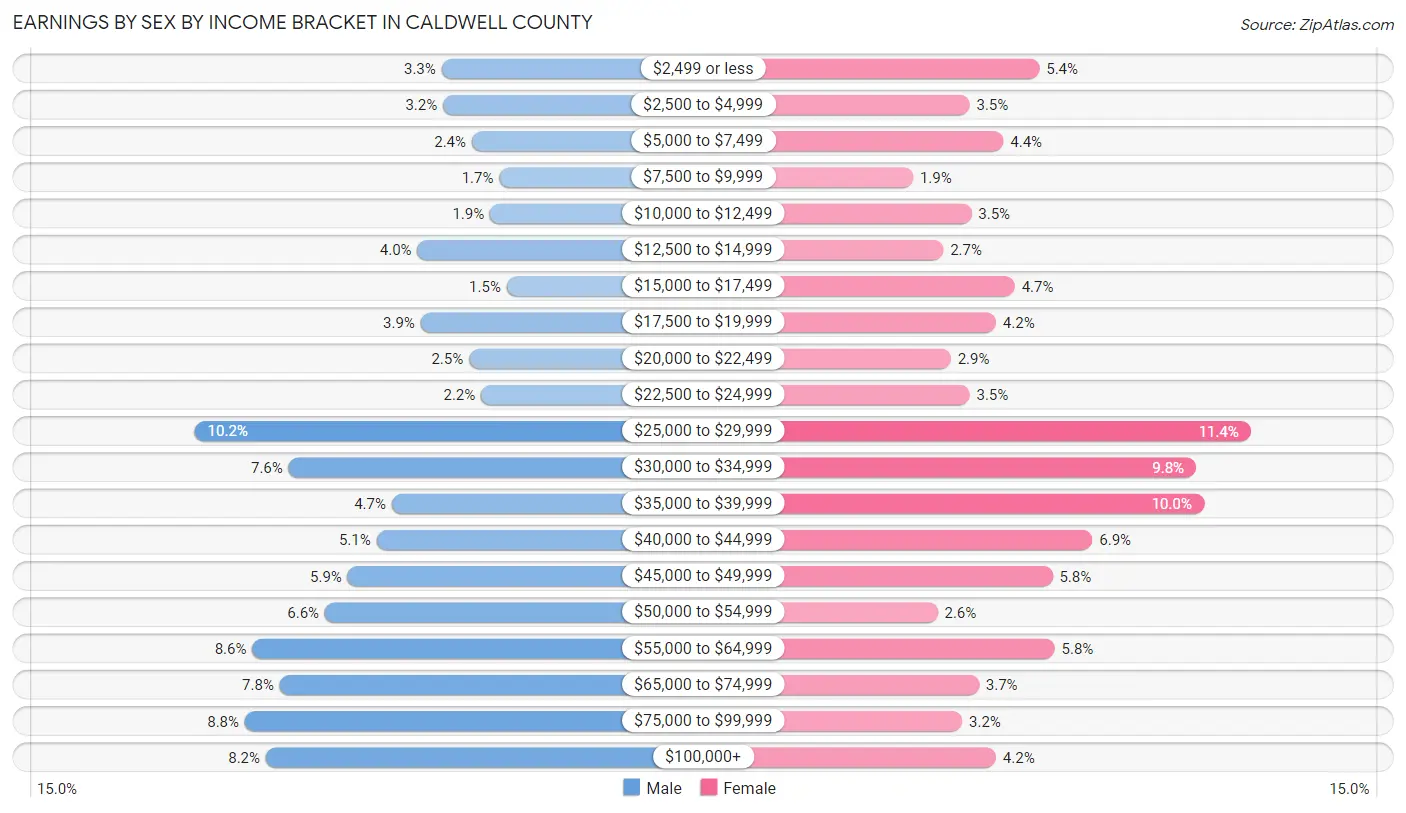
Earnings by Sex by Income Bracket in Caldwell County
The most common earnings brackets in Caldwell County are $25,000 to $29,999 for men (240 | 10.2%) and $25,000 to $29,999 for women (214 | 11.4%).
| Income | Male | Female |
| $2,499 or less | 77 (3.3%) | 102 (5.4%) |
| $2,500 to $4,999 | 76 (3.2%) | 65 (3.5%) |
| $5,000 to $7,499 | 57 (2.4%) | 83 (4.4%) |
| $7,500 to $9,999 | 39 (1.7%) | 35 (1.9%) |
| $10,000 to $12,499 | 45 (1.9%) | 66 (3.5%) |
| $12,500 to $14,999 | 93 (4.0%) | 51 (2.7%) |
| $15,000 to $17,499 | 34 (1.5%) | 89 (4.7%) |
| $17,500 to $19,999 | 91 (3.9%) | 79 (4.2%) |
| $20,000 to $22,499 | 59 (2.5%) | 55 (2.9%) |
| $22,500 to $24,999 | 51 (2.2%) | 65 (3.5%) |
| $25,000 to $29,999 | 240 (10.2%) | 214 (11.4%) |
| $30,000 to $34,999 | 178 (7.6%) | 185 (9.8%) |
| $35,000 to $39,999 | 110 (4.7%) | 189 (10.0%) |
| $40,000 to $44,999 | 120 (5.1%) | 130 (6.9%) |
| $45,000 to $49,999 | 139 (5.9%) | 109 (5.8%) |
| $50,000 to $54,999 | 154 (6.6%) | 48 (2.5%) |
| $55,000 to $64,999 | 202 (8.6%) | 110 (5.8%) |
| $65,000 to $74,999 | 184 (7.8%) | 70 (3.7%) |
| $75,000 to $99,999 | 207 (8.8%) | 61 (3.2%) |
| $100,000+ | 193 (8.2%) | 79 (4.2%) |
| Total | 2,349 (100.0%) | 1,885 (100.0%) |
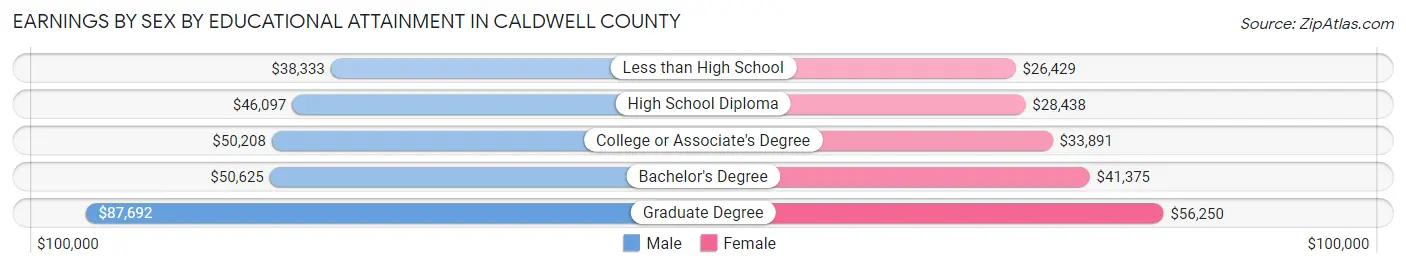
Earnings by Sex by Educational Attainment in Caldwell County
Average earnings in Caldwell County are $47,280 for men and $34,304 for women, a difference of 27.5%. Men with an educational attainment of graduate degree enjoy the highest average annual earnings of $87,692, while those with less than high school education earn the least with $38,333. Women with an educational attainment of graduate degree earn the most with the average annual earnings of $56,250, while those with less than high school education have the smallest earnings of $26,429.
| Educational Attainment | Male Income | Female Income |
| Less than High School | $38,333 | $26,429 |
| High School Diploma | $46,097 | $28,438 |
| College or Associate's Degree | $50,208 | $33,891 |
| Bachelor's Degree | $50,625 | $41,375 |
| Graduate Degree | $87,692 | $56,250 |
| Total | $47,280 | $34,304 |
Family Income in Caldwell County
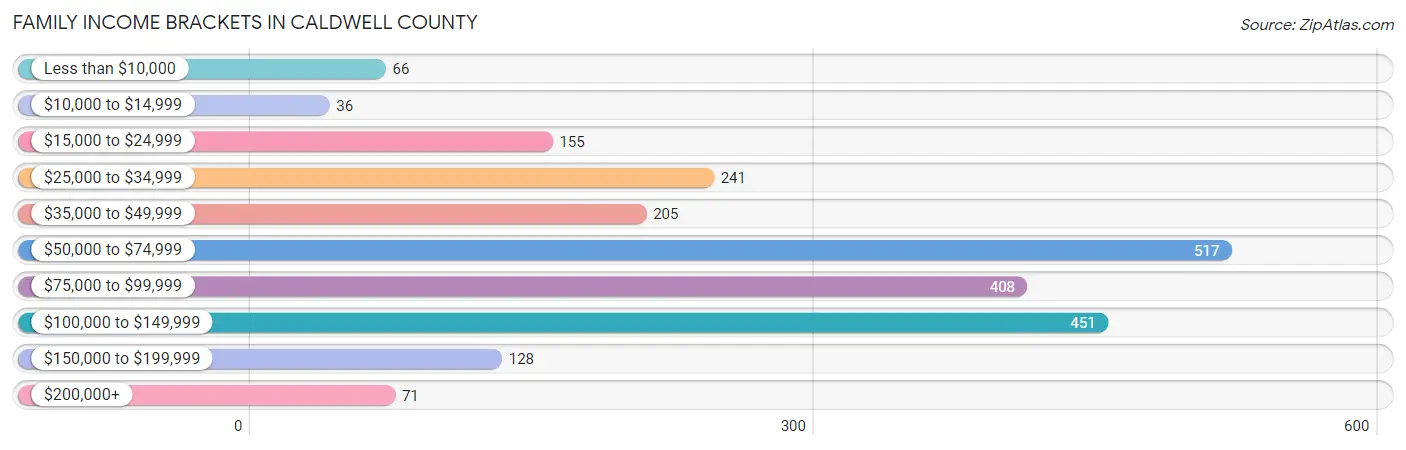
Family Income Brackets in Caldwell County
According to the Caldwell County family income data, there are 517 families falling into the $50,000 to $74,999 income range, which is the most common income bracket and makes up 22.7% of all families. Conversely, the $10,000 to $14,999 income bracket is the least frequent group with only 36 families (1.6%) belonging to this category.
| Income Bracket | # Families | % Families |
| Less than $10,000 | 66 | 2.9% |
| $10,000 to $14,999 | 36 | 1.6% |
| $15,000 to $24,999 | 155 | 6.8% |
| $25,000 to $34,999 | 241 | 10.6% |
| $35,000 to $49,999 | 205 | 9.0% |
| $50,000 to $74,999 | 517 | 22.7% |
| $75,000 to $99,999 | 408 | 17.9% |
| $100,000 to $149,999 | 451 | 19.8% |
| $150,000 to $199,999 | 128 | 5.6% |
| $200,000+ | 71 | 3.1% |
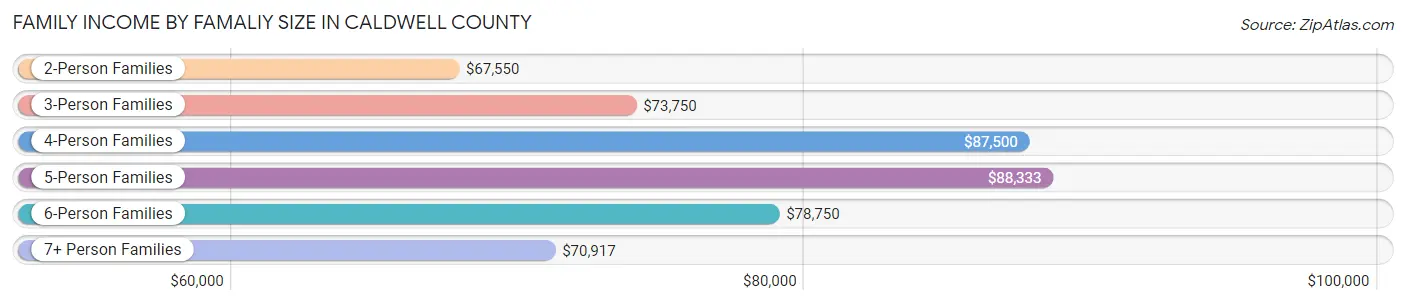
Family Income by Famaliy Size in Caldwell County
5-person families (126 | 5.5%) account for the highest median family income in Caldwell County with $88,333 per family, while 2-person families (1,210 | 53.1%) have the highest median income of $33,775 per family member.
| Income Bracket | # Families | Median Income |
| 2-Person Families | 1,210 (53.1%) | $67,550 |
| 3-Person Families | 493 (21.6%) | $73,750 |
| 4-Person Families | 350 (15.4%) | $87,500 |
| 5-Person Families | 126 (5.5%) | $88,333 |
| 6-Person Families | 58 (2.5%) | $78,750 |
| 7+ Person Families | 41 (1.8%) | $70,917 |
| Total | 2,278 (100.0%) | $71,362 |
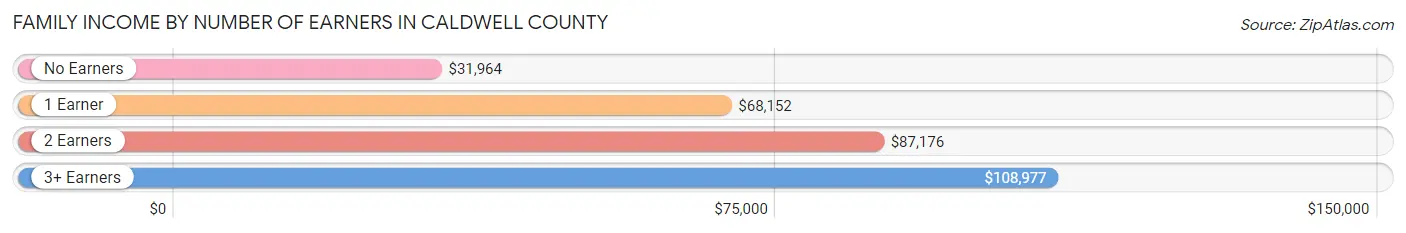
Family Income by Number of Earners in Caldwell County
The median family income in Caldwell County is $71,362, with families comprising 3+ earners (171) having the highest median family income of $108,977, while families with no earners (434) have the lowest median family income of $31,964, accounting for 7.5% and 19.1% of families, respectively.
| Number of Earners | # Families | Median Income |
| No Earners | 434 (19.1%) | $31,964 |
| 1 Earner | 780 (34.2%) | $68,152 |
| 2 Earners | 893 (39.2%) | $87,176 |
| 3+ Earners | 171 (7.5%) | $108,977 |
| Total | 2,278 (100.0%) | $71,362 |
Household Income in Caldwell County
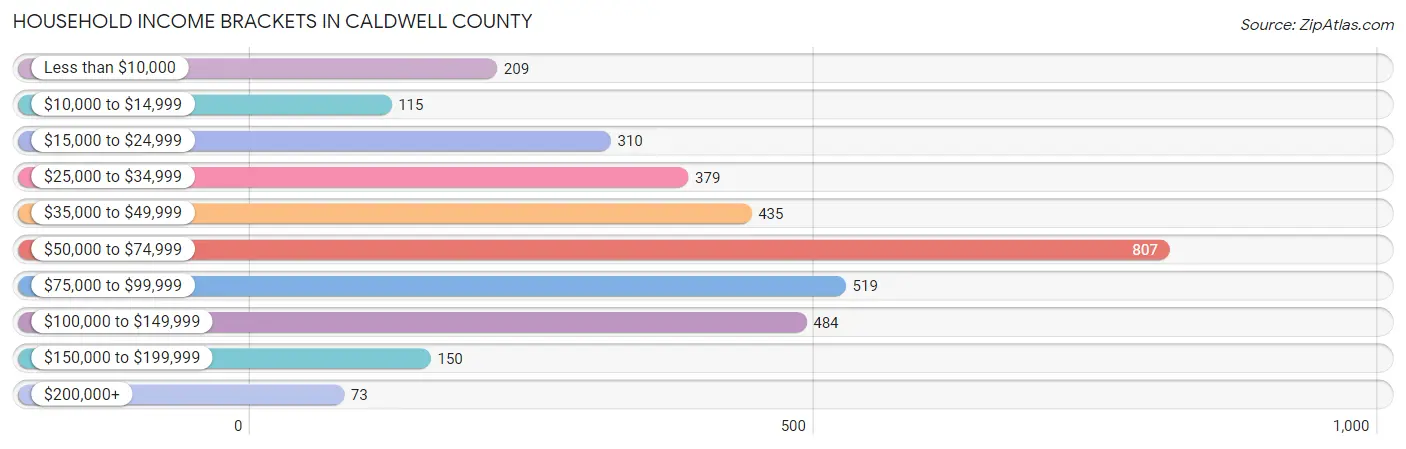
Household Income Brackets in Caldwell County
With 807 households falling in the category, the $50,000 to $74,999 income range is the most frequent in Caldwell County, accounting for 23.2% of all households. In contrast, only 73 households (2.1%) fall into the $200,000+ income bracket, making it the least populous group.
| Income Bracket | # Households | % Households |
| Less than $10,000 | 209 | 6.0% |
| $10,000 to $14,999 | 115 | 3.3% |
| $15,000 to $24,999 | 310 | 8.9% |
| $25,000 to $34,999 | 379 | 10.9% |
| $35,000 to $49,999 | 435 | 12.5% |
| $50,000 to $74,999 | 807 | 23.2% |
| $75,000 to $99,999 | 519 | 14.9% |
| $100,000 to $149,999 | 484 | 13.9% |
| $150,000 to $199,999 | 150 | 4.3% |
| $200,000+ | 73 | 2.1% |
Household Income by Householder Age in Caldwell County
The median household income in Caldwell County is $58,269, with the highest median household income of $70,361 found in the 25 to 44 years age bracket for the primary householder. A total of 883 households (25.4%) fall into this category. Meanwhile, the 15 to 24 years age bracket for the primary householder has the lowest median household income of $40,357, with 152 households (4.4%) in this group.
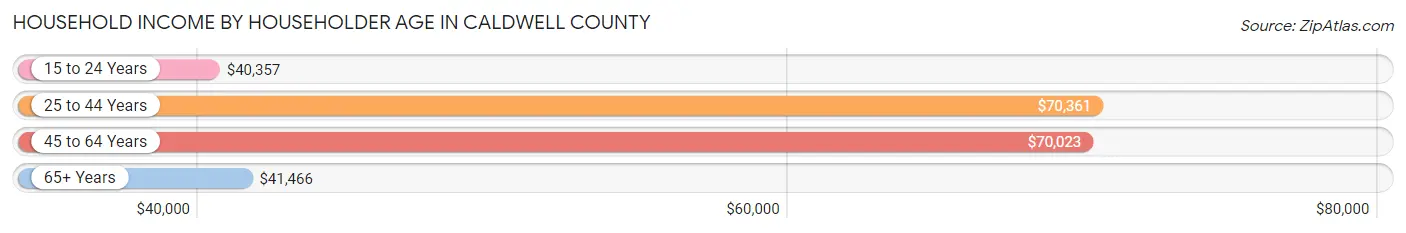
| Income Bracket | # Households | Median Income |
| 15 to 24 Years | 152 (4.4%) | $40,357 |
| 25 to 44 Years | 883 (25.4%) | $70,361 |
| 45 to 64 Years | 1,341 (38.5%) | $70,023 |
| 65+ Years | 1,104 (31.7%) | $41,466 |
| Total | 3,480 (100.0%) | $58,269 |
Poverty in Caldwell County
Income Below Poverty by Sex and Age in Caldwell County
With 15.1% poverty level for males and 17.1% for females among the residents of Caldwell County, 12 to 14 year old males and 15 year old females are the most vulnerable to poverty, with 90 males (40.4%) and 28 females (50.0%) in their respective age groups living below the poverty level.
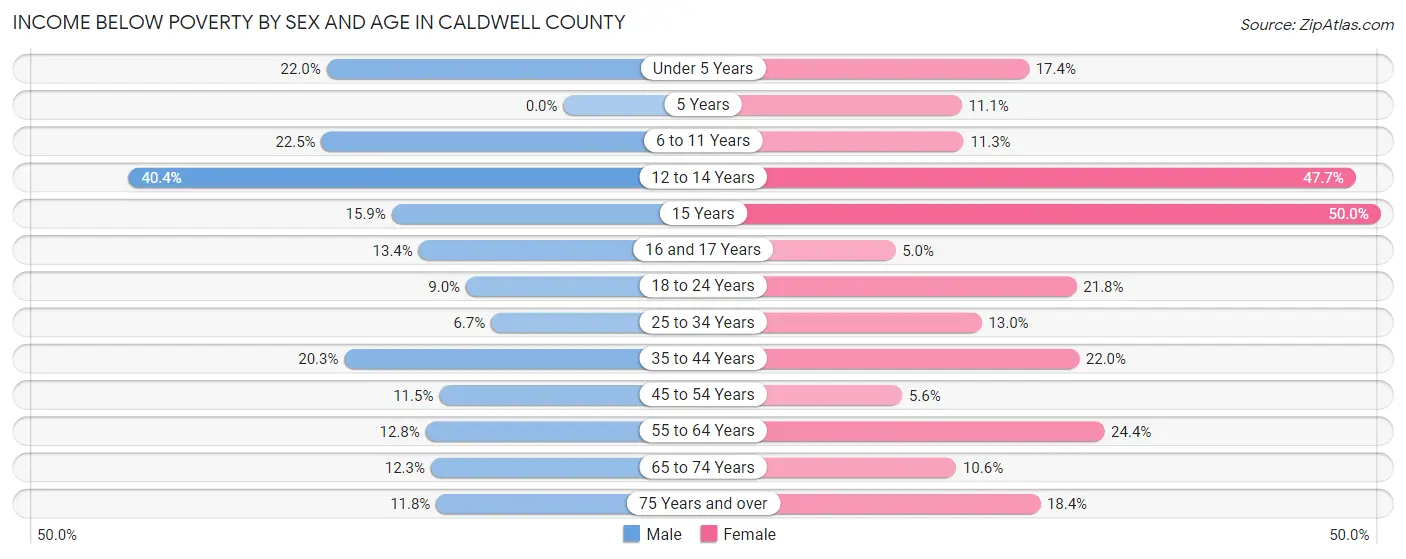
| Age Bracket | Male | Female |
| Under 5 Years | 58 (22.0%) | 38 (17.3%) |
| 5 Years | 0 (0.0%) | 5 (11.1%) |
| 6 to 11 Years | 86 (22.5%) | 36 (11.3%) |
| 12 to 14 Years | 90 (40.4%) | 72 (47.7%) |
| 15 Years | 11 (15.9%) | 28 (50.0%) |
| 16 and 17 Years | 18 (13.4%) | 7 (5.0%) |
| 18 to 24 Years | 32 (9.0%) | 69 (21.8%) |
| 25 to 34 Years | 31 (6.7%) | 56 (13.0%) |
| 35 to 44 Years | 98 (20.3%) | 108 (22.0%) |
| 45 to 54 Years | 62 (11.5%) | 32 (5.6%) |
| 55 to 64 Years | 83 (12.8%) | 150 (24.3%) |
| 65 to 74 Years | 62 (12.3%) | 51 (10.6%) |
| 75 Years and over | 38 (11.8%) | 71 (18.4%) |
| Total | 669 (15.1%) | 723 (17.1%) |
Income Above Poverty by Sex and Age in Caldwell County
According to the poverty statistics in Caldwell County, males aged 5 years and females aged 16 and 17 years are the age groups that are most secure financially, with 100.0% of males and 95.0% of females in these age groups living above the poverty line.
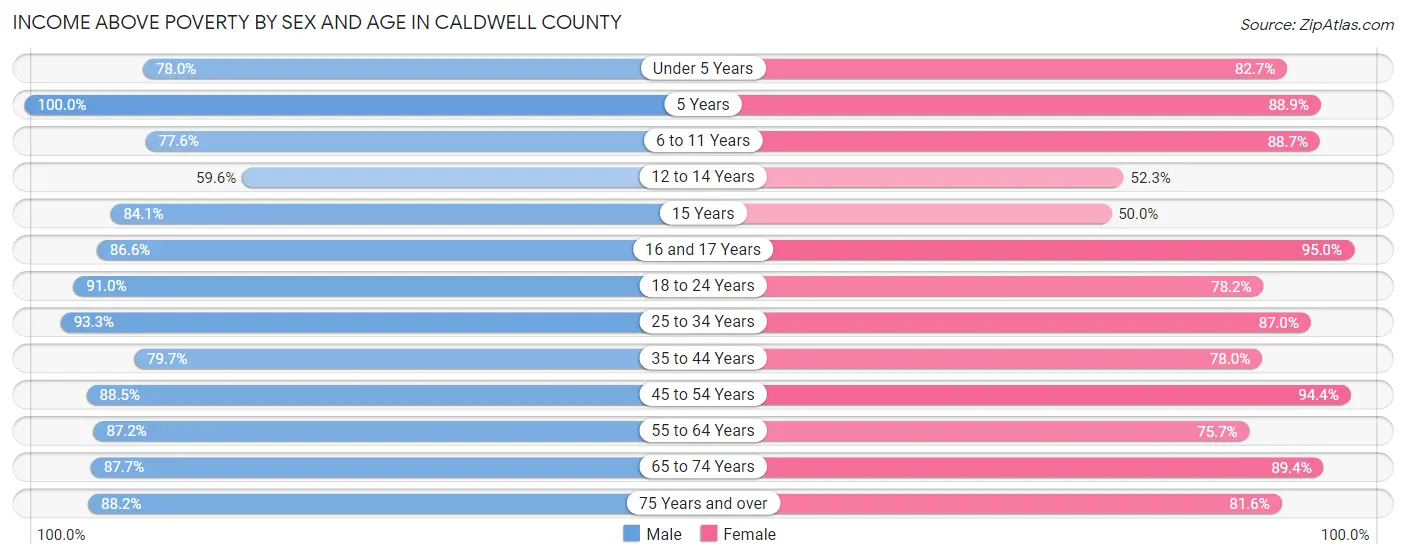
| Age Bracket | Male | Female |
| Under 5 Years | 206 (78.0%) | 181 (82.7%) |
| 5 Years | 38 (100.0%) | 40 (88.9%) |
| 6 to 11 Years | 297 (77.5%) | 283 (88.7%) |
| 12 to 14 Years | 133 (59.6%) | 79 (52.3%) |
| 15 Years | 58 (84.1%) | 28 (50.0%) |
| 16 and 17 Years | 116 (86.6%) | 134 (95.0%) |
| 18 to 24 Years | 322 (91.0%) | 248 (78.2%) |
| 25 to 34 Years | 431 (93.3%) | 376 (87.0%) |
| 35 to 44 Years | 384 (79.7%) | 383 (78.0%) |
| 45 to 54 Years | 476 (88.5%) | 540 (94.4%) |
| 55 to 64 Years | 566 (87.2%) | 466 (75.6%) |
| 65 to 74 Years | 442 (87.7%) | 430 (89.4%) |
| 75 Years and over | 284 (88.2%) | 315 (81.6%) |
| Total | 3,753 (84.9%) | 3,503 (82.9%) |
Income Below Poverty Among Married-Couple Families in Caldwell County
The poverty statistics for married-couple families in Caldwell County show that 6.7% or 123 of the total 1,831 families live below the poverty line. Families with 5 or more children have the highest poverty rate of 52.0%, comprising of 13 families. On the other hand, families with 1 or 2 children have the lowest poverty rate of 5.3%, which includes 26 families.
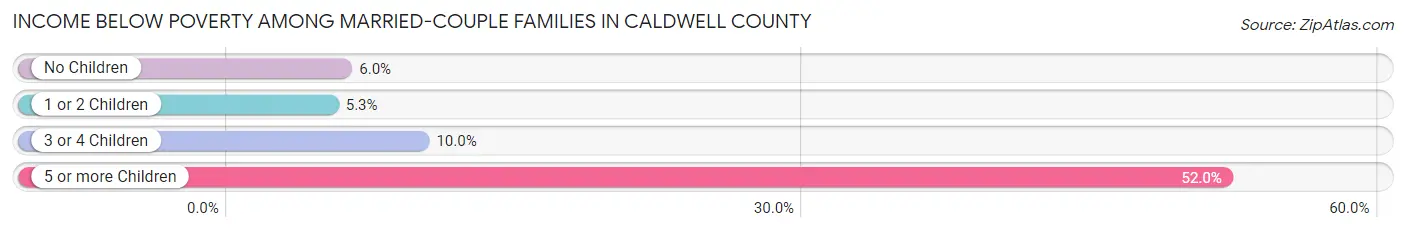
| Children | Above Poverty | Below Poverty |
| No Children | 1,102 (94.0%) | 70 (6.0%) |
| 1 or 2 Children | 468 (94.7%) | 26 (5.3%) |
| 3 or 4 Children | 126 (90.0%) | 14 (10.0%) |
| 5 or more Children | 12 (48.0%) | 13 (52.0%) |
| Total | 1,708 (93.3%) | 123 (6.7%) |
Income Below Poverty Among Single-Parent Households in Caldwell County
According to the poverty data in Caldwell County, 21.0% or 43 single-father households and 27.7% or 67 single-mother households are living below the poverty line. Among single-father households, those with 3 or 4 children have the highest poverty rate, with 26 households (89.7%) experiencing poverty. Likewise, among single-mother households, those with 5 or more children have the highest poverty rate, with 1 households (100.0%) falling below the poverty line.
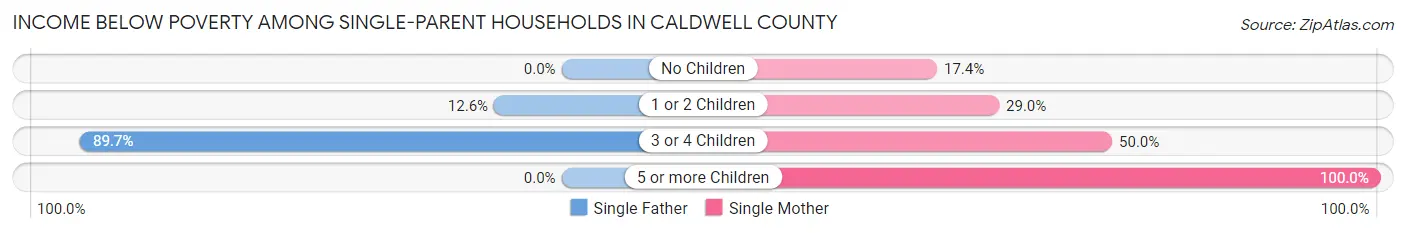
| Children | Single Father | Single Mother |
| No Children | 0 (0.0%) | 12 (17.4%) |
| 1 or 2 Children | 17 (12.6%) | 44 (28.9%) |
| 3 or 4 Children | 26 (89.7%) | 10 (50.0%) |
| 5 or more Children | 0 (0.0%) | 1 (100.0%) |
| Total | 43 (21.0%) | 67 (27.7%) |
Income Below Poverty Among Married-Couple vs Single-Parent Households in Caldwell County
The poverty data for Caldwell County shows that 123 of the married-couple family households (6.7%) and 110 of the single-parent households (24.6%) are living below the poverty level. Within the married-couple family households, those with 5 or more children have the highest poverty rate, with 13 households (52.0%) falling below the poverty line. Among the single-parent households, those with 5 or more children have the highest poverty rate, with 1 household (100.0%) living below poverty.
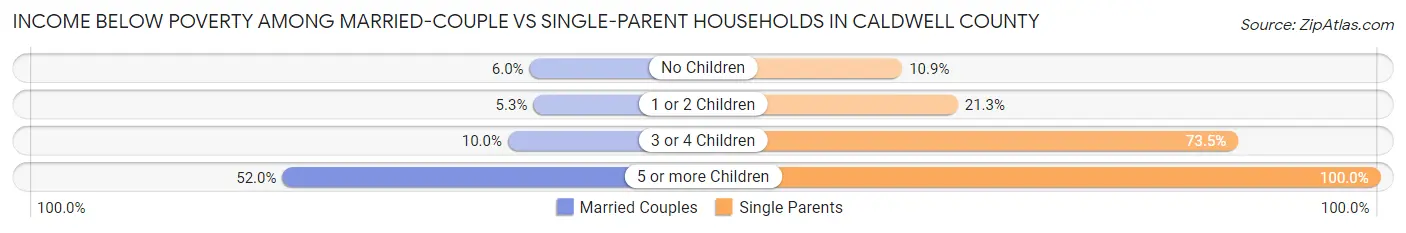
| Children | Married-Couple Families | Single-Parent Households |
| No Children | 70 (6.0%) | 12 (10.9%) |
| 1 or 2 Children | 26 (5.3%) | 61 (21.2%) |
| 3 or 4 Children | 14 (10.0%) | 36 (73.5%) |
| 5 or more Children | 13 (52.0%) | 1 (100.0%) |
| Total | 123 (6.7%) | 110 (24.6%) |
Race in Caldwell County
The most populous races in Caldwell County are White / Caucasian (8,298 | 93.5%), Two or more Races (371 | 4.2%), and Hispanic or Latino (244 | 2.8%).
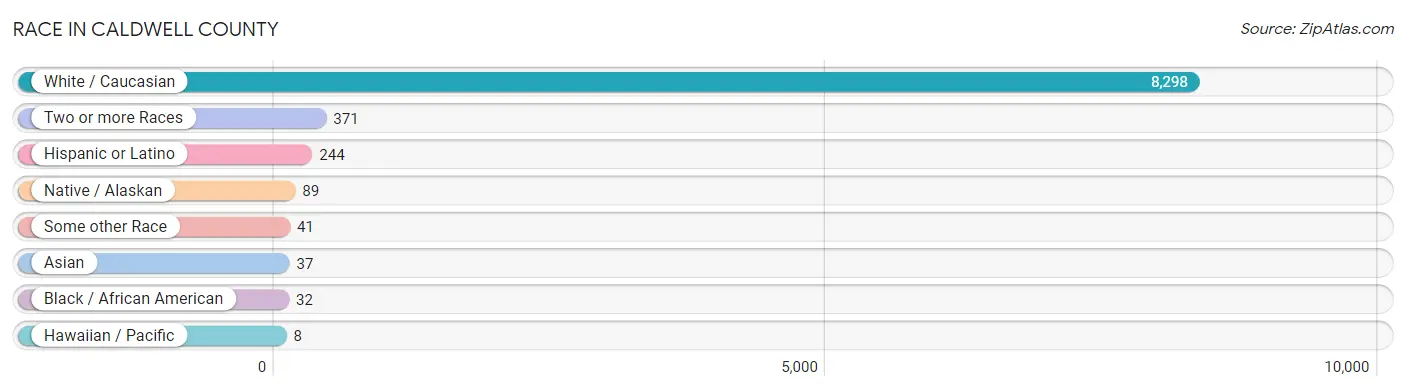
| Race | # Population | % Population |
| Asian | 37 | 0.4% |
| Black / African American | 32 | 0.4% |
| Hawaiian / Pacific | 8 | 0.1% |
| Hispanic or Latino | 244 | 2.8% |
| Native / Alaskan | 89 | 1.0% |
| White / Caucasian | 8,298 | 93.5% |
| Two or more Races | 371 | 4.2% |
| Some other Race | 41 | 0.5% |
| Total | 8,876 | 100.0% |
Ancestry in Caldwell County
The most populous ancestries reported in Caldwell County are American (1,453 | 16.4%), German (1,326 | 14.9%), English (1,033 | 11.6%), Irish (726 | 8.2%), and Scottish (281 | 3.2%), together accounting for 54.3% of all Caldwell County residents.
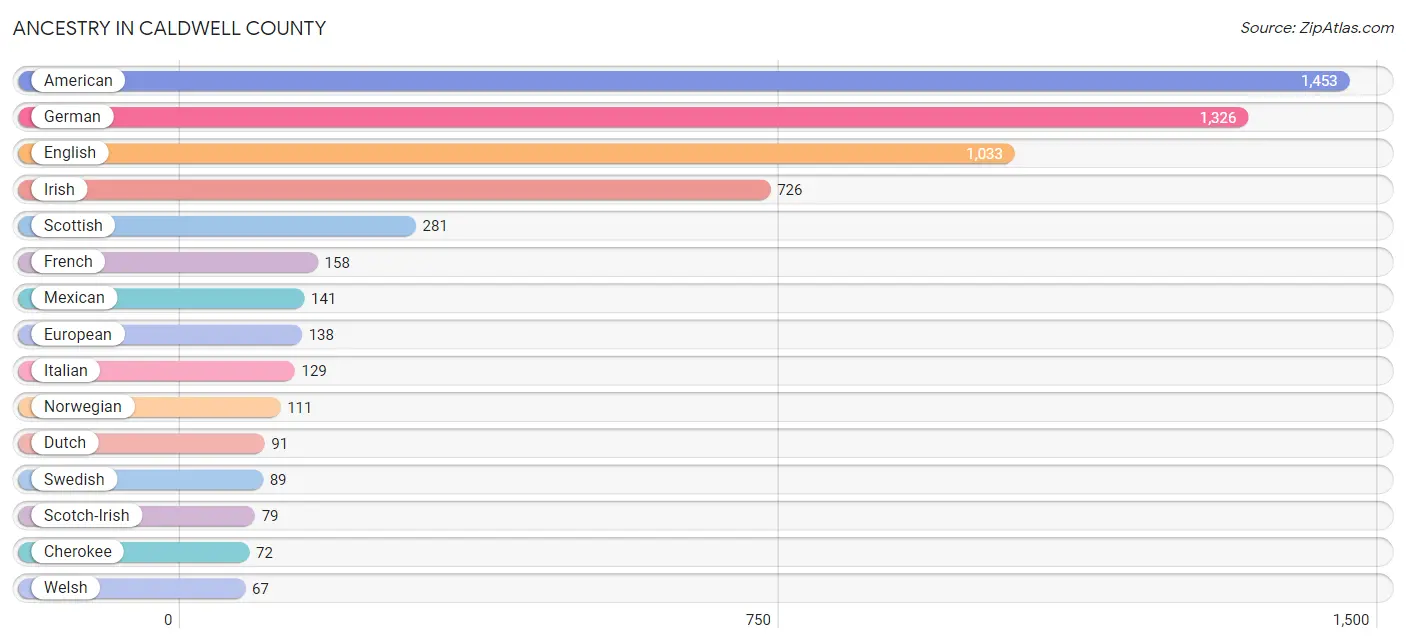
| Ancestry | # Population | % Population |
| American | 1,453 | 16.4% |
| Apache | 2 | 0.0% |
| Arab | 1 | 0.0% |
| Bhutanese | 5 | 0.1% |
| Blackfeet | 13 | 0.2% |
| British | 43 | 0.5% |
| Cajun | 2 | 0.0% |
| Canadian | 8 | 0.1% |
| Central American | 37 | 0.4% |
| Cherokee | 72 | 0.8% |
| Chippewa | 7 | 0.1% |
| Croatian | 43 | 0.5% |
| Czech | 11 | 0.1% |
| Czechoslovakian | 7 | 0.1% |
| Danish | 9 | 0.1% |
| Dutch | 91 | 1.0% |
| English | 1,033 | 11.6% |
| European | 138 | 1.5% |
| French | 158 | 1.8% |
| German | 1,326 | 14.9% |
| Greek | 2 | 0.0% |
| Guatemalan | 32 | 0.4% |
| Haitian | 5 | 0.1% |
| Honduran | 5 | 0.1% |
| Hopi | 4 | 0.1% |
| Hungarian | 2 | 0.0% |
| Indian (Asian) | 7 | 0.1% |
| Inupiat | 1 | 0.0% |
| Iranian | 3 | 0.0% |
| Irish | 726 | 8.2% |
| Italian | 129 | 1.5% |
| Korean | 37 | 0.4% |
| Mexican | 141 | 1.6% |
| Native Hawaiian | 5 | 0.1% |
| Northern European | 1 | 0.0% |
| Norwegian | 111 | 1.3% |
| Pakistani | 10 | 0.1% |
| Pennsylvania German | 28 | 0.3% |
| Polish | 46 | 0.5% |
| Portuguese | 3 | 0.0% |
| Puerto Rican | 55 | 0.6% |
| Russian | 20 | 0.2% |
| Scandinavian | 19 | 0.2% |
| Scotch-Irish | 79 | 0.9% |
| Scottish | 281 | 3.2% |
| Sioux | 9 | 0.1% |
| Spaniard | 11 | 0.1% |
| Sri Lankan | 1 | 0.0% |
| Swedish | 89 | 1.0% |
| Swiss | 46 | 0.5% |
| Syrian | 1 | 0.0% |
| Ukrainian | 7 | 0.1% |
| Ute | 4 | 0.1% |
| Welsh | 67 | 0.7% | View All 54 Rows |
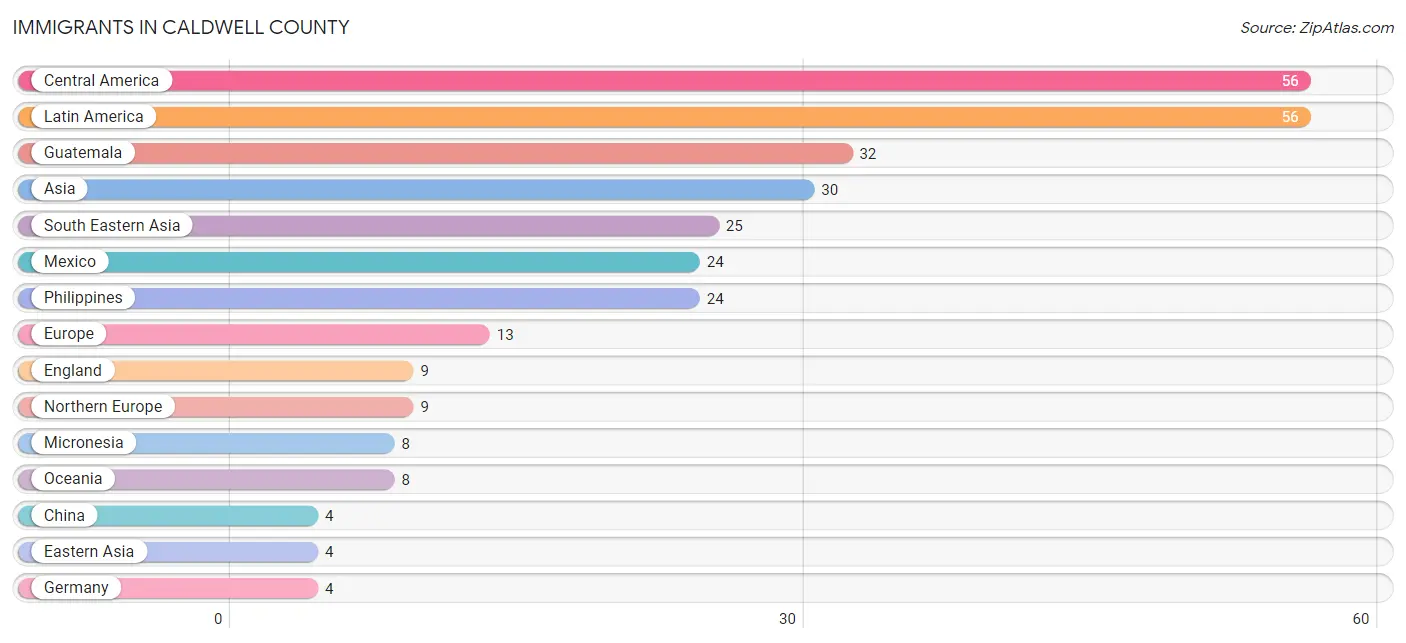
Immigrants in Caldwell County
The most numerous immigrant groups reported in Caldwell County came from Central America (56 | 0.6%), Latin America (56 | 0.6%), Guatemala (32 | 0.4%), Asia (30 | 0.3%), and South Eastern Asia (25 | 0.3%), together accounting for 2.2% of all Caldwell County residents.
| Immigration Origin | # Population | % Population |
| Asia | 30 | 0.3% |
| Canada | 2 | 0.0% |
| Central America | 56 | 0.6% |
| China | 4 | 0.1% |
| Eastern Asia | 4 | 0.1% |
| England | 9 | 0.1% |
| Europe | 13 | 0.2% |
| Germany | 4 | 0.1% |
| Guatemala | 32 | 0.4% |
| Iran | 1 | 0.0% |
| Latin America | 56 | 0.6% |
| Mexico | 24 | 0.3% |
| Micronesia | 8 | 0.1% |
| Northern Europe | 9 | 0.1% |
| Oceania | 8 | 0.1% |
| Philippines | 24 | 0.3% |
| South Central Asia | 1 | 0.0% |
| South Eastern Asia | 25 | 0.3% |
| Vietnam | 1 | 0.0% |
| Western Europe | 4 | 0.1% | View All 20 Rows |
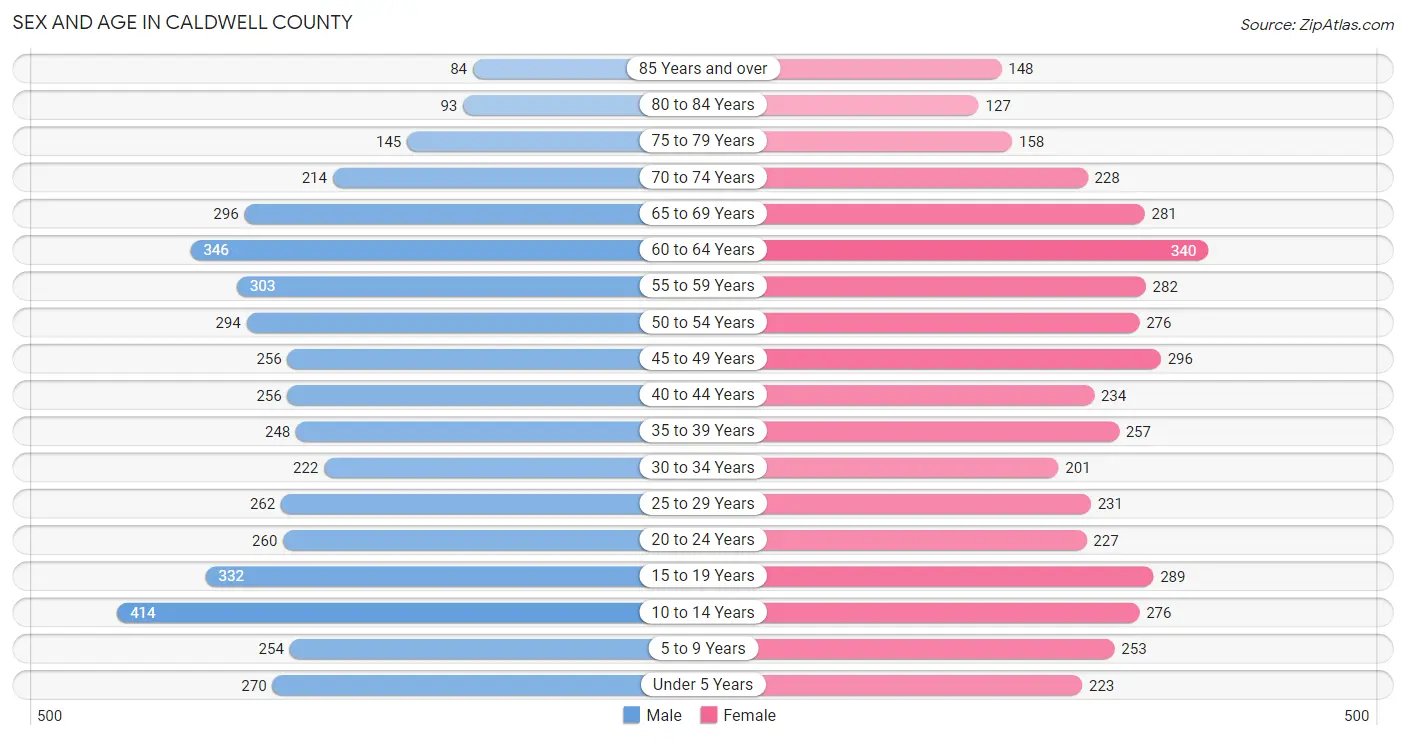
Sex and Age in Caldwell County
Sex and Age in Caldwell County
The most populous age groups in Caldwell County are 10 to 14 Years (414 | 9.1%) for men and 60 to 64 Years (340 | 7.9%) for women.
| Age Bracket | Male | Female |
| Under 5 Years | 270 (5.9%) | 223 (5.1%) |
| 5 to 9 Years | 254 (5.6%) | 253 (5.9%) |
| 10 to 14 Years | 414 (9.1%) | 276 (6.4%) |
| 15 to 19 Years | 332 (7.3%) | 289 (6.7%) |
| 20 to 24 Years | 260 (5.7%) | 227 (5.2%) |
| 25 to 29 Years | 262 (5.8%) | 231 (5.3%) |
| 30 to 34 Years | 222 (4.9%) | 201 (4.6%) |
| 35 to 39 Years | 248 (5.4%) | 257 (5.9%) |
| 40 to 44 Years | 256 (5.6%) | 234 (5.4%) |
| 45 to 49 Years | 256 (5.6%) | 296 (6.8%) |
| 50 to 54 Years | 294 (6.5%) | 276 (6.4%) |
| 55 to 59 Years | 303 (6.7%) | 282 (6.5%) |
| 60 to 64 Years | 346 (7.6%) | 340 (7.9%) |
| 65 to 69 Years | 296 (6.5%) | 281 (6.5%) |
| 70 to 74 Years | 214 (4.7%) | 228 (5.3%) |
| 75 to 79 Years | 145 (3.2%) | 158 (3.6%) |
| 80 to 84 Years | 93 (2.0%) | 127 (2.9%) |
| 85 Years and over | 84 (1.8%) | 148 (3.4%) |
| Total | 4,549 (100.0%) | 4,327 (100.0%) |
Families and Households in Caldwell County
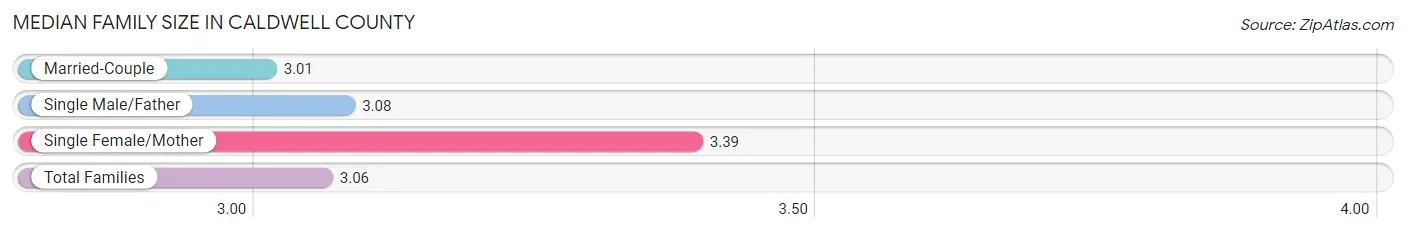
Median Family Size in Caldwell County
The median family size in Caldwell County is 3.06 persons per family, with single female/mother families (242 | 10.6%) accounting for the largest median family size of 3.39 persons per family. On the other hand, married-couple families (1,831 | 80.4%) represent the smallest median family size with 3.01 persons per family.
| Family Type | # Families | Family Size |
| Married-Couple | 1,831 (80.4%) | 3.01 |
| Single Male/Father | 205 (9.0%) | 3.08 |
| Single Female/Mother | 242 (10.6%) | 3.39 |
| Total Families | 2,278 (100.0%) | 3.06 |
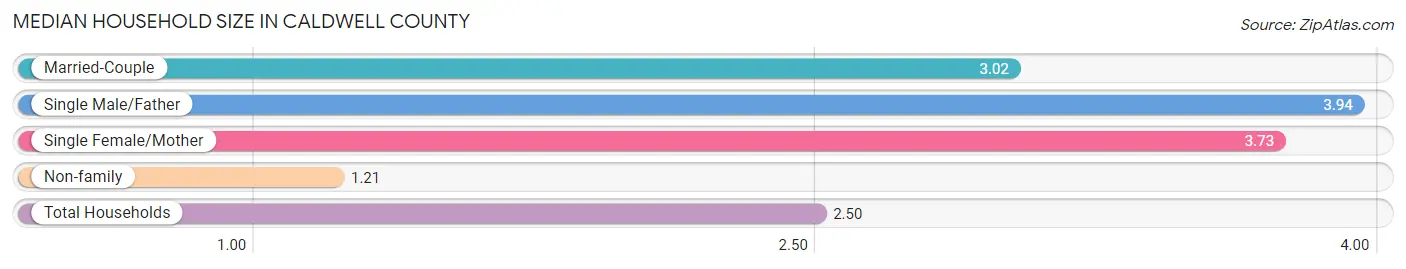
Median Household Size in Caldwell County
The median household size in Caldwell County is 2.50 persons per household, with single male/father households (205 | 5.9%) accounting for the largest median household size of 3.94 persons per household. non-family households (1,202 | 34.5%) represent the smallest median household size with 1.21 persons per household.
| Household Type | # Households | Household Size |
| Married-Couple | 1,831 (52.6%) | 3.02 |
| Single Male/Father | 205 (5.9%) | 3.94 |
| Single Female/Mother | 242 (7.0%) | 3.73 |
| Non-family | 1,202 (34.5%) | 1.21 |
| Total Households | 3,480 (100.0%) | 2.50 |
Household Size by Marriage Status in Caldwell County
Out of a total of 3,480 households in Caldwell County, 2,278 (65.5%) are family households, while 1,202 (34.5%) are nonfamily households. The most numerous type of family households are 2-person households, comprising 1,113, and the most common type of nonfamily households are 1-person households, comprising 1,067.
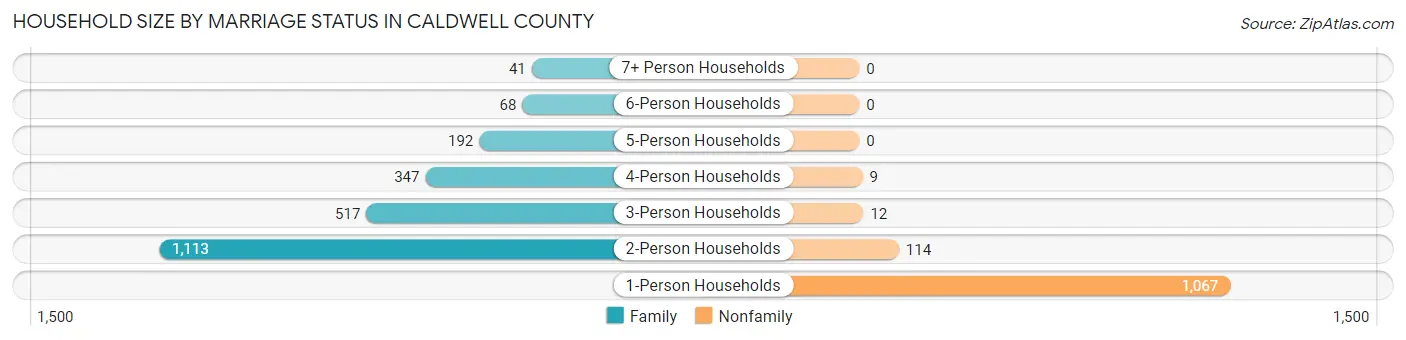
| Household Size | Family Households | Nonfamily Households |
| 1-Person Households | - | 1,067 (30.7%) |
| 2-Person Households | 1,113 (32.0%) | 114 (3.3%) |
| 3-Person Households | 517 (14.9%) | 12 (0.3%) |
| 4-Person Households | 347 (10.0%) | 9 (0.3%) |
| 5-Person Households | 192 (5.5%) | 0 (0.0%) |
| 6-Person Households | 68 (1.9%) | 0 (0.0%) |
| 7+ Person Households | 41 (1.2%) | 0 (0.0%) |
| Total | 2,278 (65.5%) | 1,202 (34.5%) |
Female Fertility in Caldwell County
Fertility by Age in Caldwell County
Average fertility rate in Caldwell County is 72.0 births per 1,000 women. Women in the age bracket of 20 to 34 years have the highest fertility rate with 135.0 births per 1,000 women. Women in the age bracket of 20 to 34 years acount for 70.1% of all women with births.
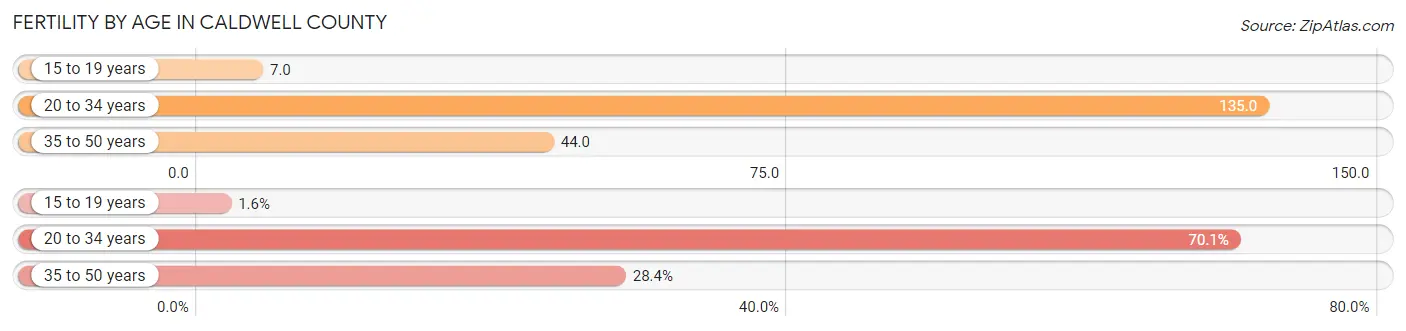
| Age Bracket | Women with Births | Births / 1,000 Women |
| 15 to 19 years | 2 (1.6%) | 7.0 |
| 20 to 34 years | 89 (70.1%) | 135.0 |
| 35 to 50 years | 36 (28.3%) | 44.0 |
| Total | 127 (100.0%) | 72.0 |
Fertility by Age by Marriage Status in Caldwell County
81.1% of women with births (127) in Caldwell County are married. The highest percentage of unmarried women with births falls into 15 to 19 years age bracket with 100.0% of them unmarried at the time of birth, while the lowest percentage of unmarried women with births belong to 35 to 50 years age bracket with 0.0% of them unmarried.
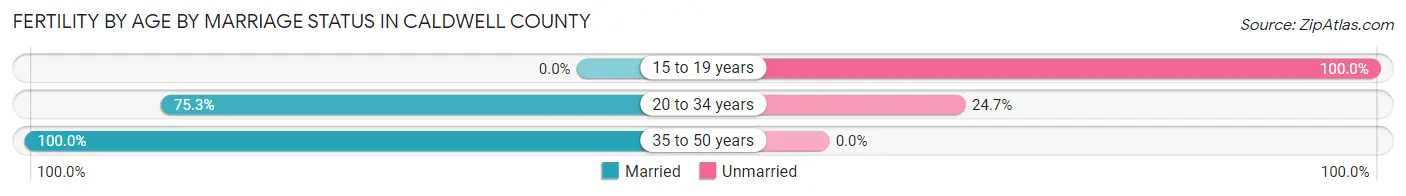
| Age Bracket | Married | Unmarried |
| 15 to 19 years | 0 (0.0%) | 2 (100.0%) |
| 20 to 34 years | 67 (75.3%) | 22 (24.7%) |
| 35 to 50 years | 36 (100.0%) | 0 (0.0%) |
| Total | 103 (81.1%) | 24 (18.9%) |
Fertility by Education in Caldwell County
Average fertility rate in Caldwell County is 72.0 births per 1,000 women. Women with the education attainment of bachelor's degree have the highest fertility rate of 190.0 births per 1,000 women, while women with the education attainment of less than high school have the lowest fertility at 11.0 births per 1,000 women. Women with the education attainment of college or associate's degree represent 49.6% of all women with births.
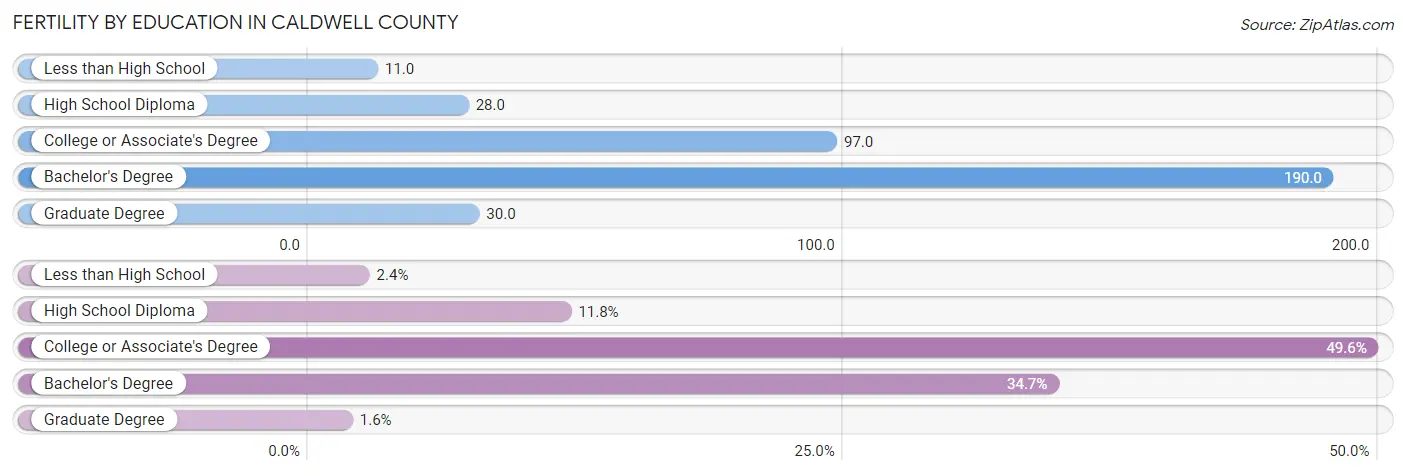
| Educational Attainment | Women with Births | Births / 1,000 Women |
| Less than High School | 3 (2.4%) | 11.0 |
| High School Diploma | 15 (11.8%) | 28.0 |
| College or Associate's Degree | 63 (49.6%) | 97.0 |
| Bachelor's Degree | 44 (34.6%) | 190.0 |
| Graduate Degree | 2 (1.6%) | 30.0 |
| Total | 127 (100.0%) | 72.0 |
Fertility by Education by Marriage Status in Caldwell County
18.9% of women with births in Caldwell County are unmarried. Women with the educational attainment of graduate degree are most likely to be married with 100.0% of them married at childbirth, while women with the educational attainment of less than high school are least likely to be married with 100.0% of them unmarried at childbirth.
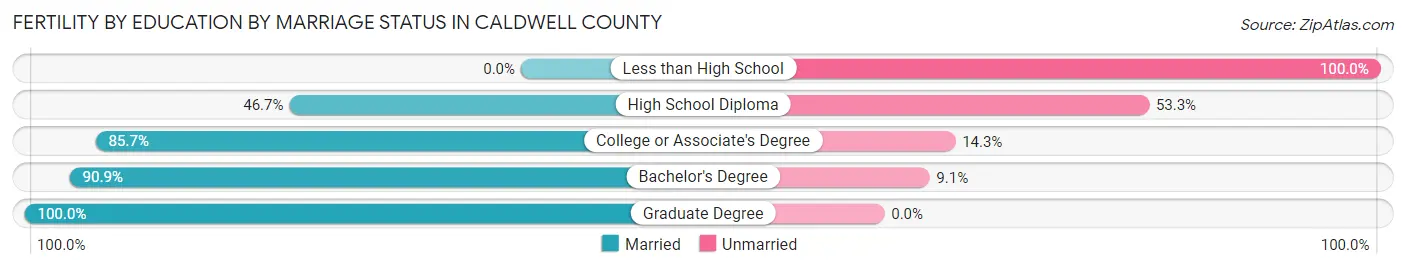
| Educational Attainment | Married | Unmarried |
| Less than High School | 0 (0.0%) | 3 (100.0%) |
| High School Diploma | 7 (46.7%) | 8 (53.3%) |
| College or Associate's Degree | 54 (85.7%) | 9 (14.3%) |
| Bachelor's Degree | 40 (90.9%) | 4 (9.1%) |
| Graduate Degree | 2 (100.0%) | 0 (0.0%) |
| Total | 103 (81.1%) | 24 (18.9%) |
Employment Characteristics in Caldwell County
Employment by Class of Employer in Caldwell County
Among the 3,747 employed individuals in Caldwell County, private company employees (2,384 | 63.6%), local government employees (399 | 10.6%), and self-employed (not incorporated) (326 | 8.7%) make up the most common classes of employment.
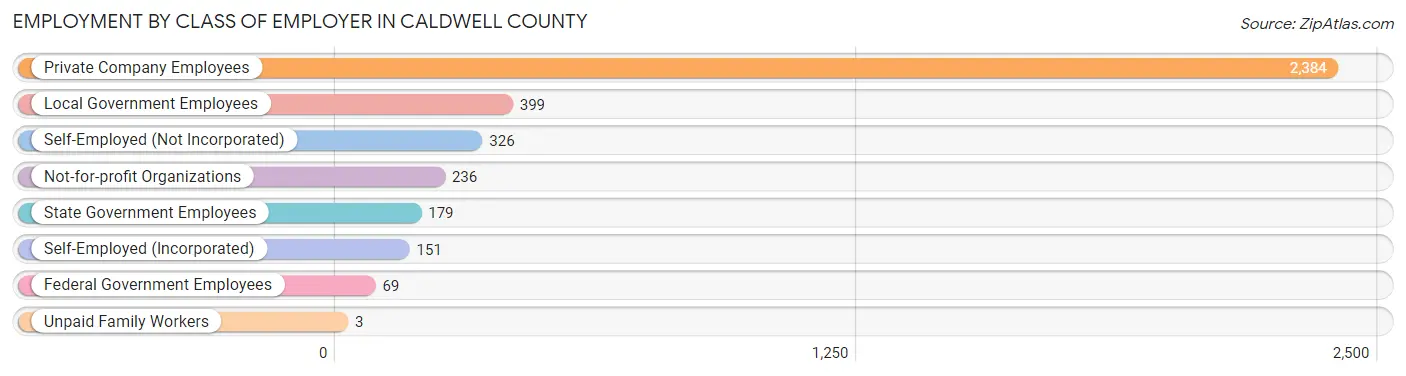
| Employer Class | # Employees | % Employees |
| Private Company Employees | 2,384 | 63.6% |
| Self-Employed (Incorporated) | 151 | 4.0% |
| Self-Employed (Not Incorporated) | 326 | 8.7% |
| Not-for-profit Organizations | 236 | 6.3% |
| Local Government Employees | 399 | 10.6% |
| State Government Employees | 179 | 4.8% |
| Federal Government Employees | 69 | 1.8% |
| Unpaid Family Workers | 3 | 0.1% |
| Total | 3,747 | 100.0% |
Employment Status by Age in Caldwell County
According to the labor force statistics for Caldwell County, out of the total population over 16 years of age (7,061), 56.2% or 3,968 individuals are in the labor force, with 4.8% or 190 of them unemployed. The age group with the highest labor force participation rate is 25 to 29 years, with 84.4% or 416 individuals in the labor force. Within the labor force, the 20 to 24 years age range has the highest percentage of unemployed individuals, with 20.1% or 68 of them being unemployed.
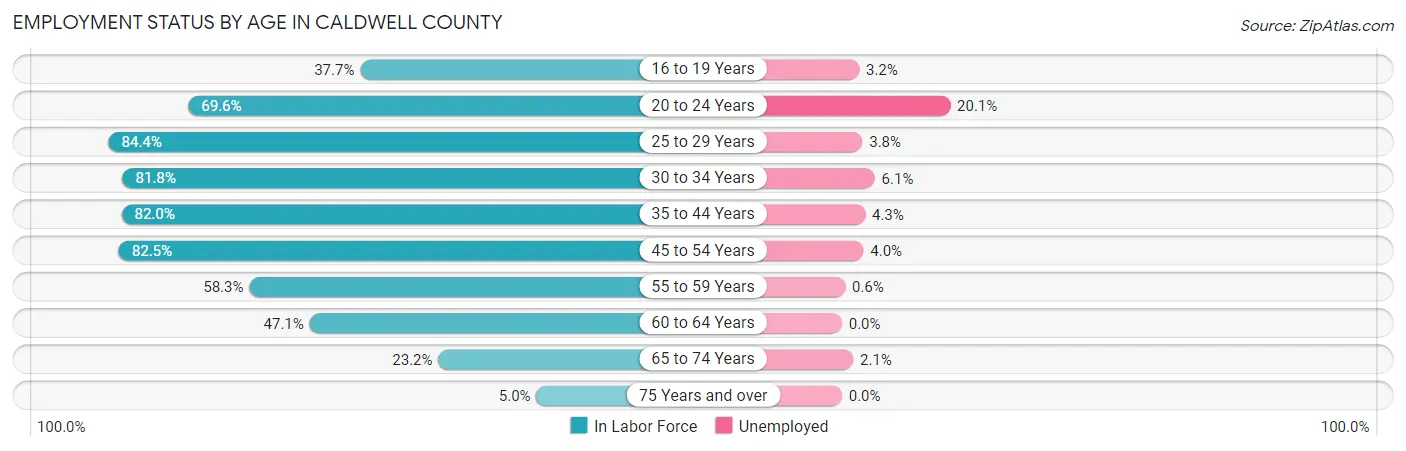
| Age Bracket | In Labor Force | Unemployed |
| 16 to 19 Years | 187 (37.7%) | 6 (3.2%) |
| 20 to 24 Years | 339 (69.6%) | 68 (20.1%) |
| 25 to 29 Years | 416 (84.4%) | 16 (3.8%) |
| 30 to 34 Years | 346 (81.8%) | 21 (6.1%) |
| 35 to 44 Years | 816 (82.0%) | 35 (4.3%) |
| 45 to 54 Years | 926 (82.5%) | 37 (4.0%) |
| 55 to 59 Years | 341 (58.3%) | 2 (0.6%) |
| 60 to 64 Years | 323 (47.1%) | 0 (0.0%) |
| 65 to 74 Years | 236 (23.2%) | 5 (2.1%) |
| 75 Years and over | 38 (5.0%) | 0 (0.0%) |
| Total | 3,968 (56.2%) | 190 (4.8%) |
Employment Status by Educational Attainment in Caldwell County
According to labor force statistics for Caldwell County, 73.6% of individuals (3,168) out of the total population between 25 and 64 years of age (4,304) are in the labor force, with 3.5% or 111 of them being unemployed. The group with the highest labor force participation rate are those with the educational attainment of bachelor's degree or higher, with 85.7% or 636 individuals in the labor force. Within the labor force, individuals with high school diploma education have the highest percentage of unemployment, with 5.0% or 66 of them being unemployed.
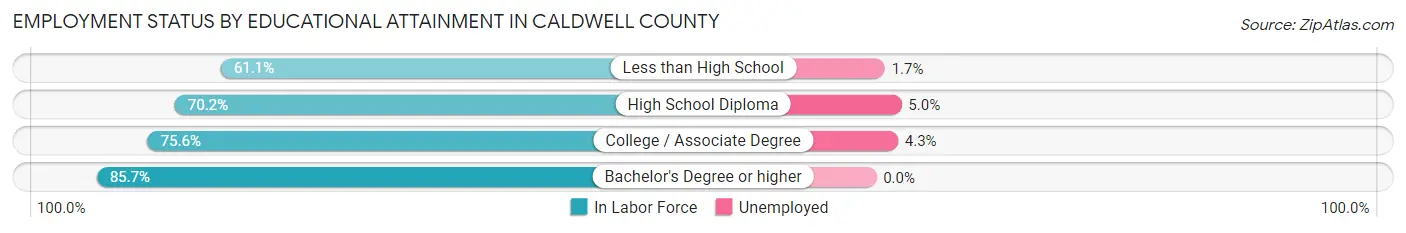
| Educational Attainment | In Labor Force | Unemployed |
| Less than High School | 242 (61.1%) | 7 (1.7%) |
| High School Diploma | 1,330 (70.2%) | 95 (5.0%) |
| College / Associate Degree | 962 (75.6%) | 55 (4.3%) |
| Bachelor's Degree or higher | 636 (85.7%) | 0 (0.0%) |
| Total | 3,168 (73.6%) | 151 (3.5%) |
Employment Occupations by Sex in Caldwell County
Management, Business, Science and Arts Occupations
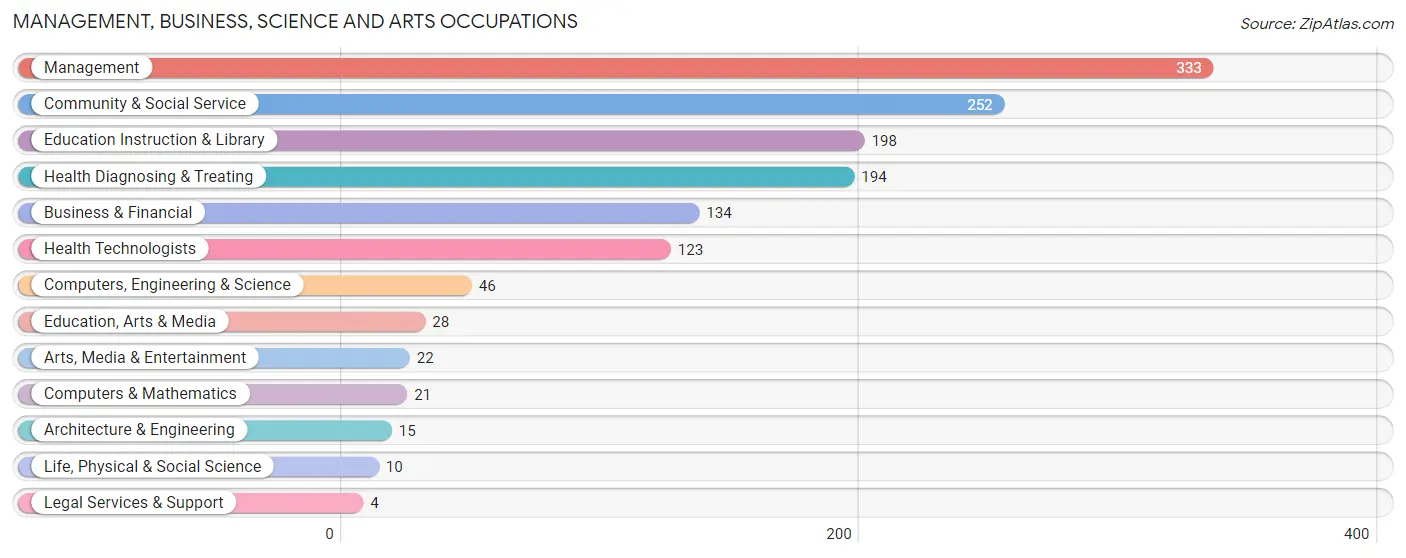
The most common Management, Business, Science and Arts occupations in Caldwell County are Management (333 | 8.8%), Community & Social Service (252 | 6.7%), Education Instruction & Library (198 | 5.2%), Health Diagnosing & Treating (194 | 5.1%), and Business & Financial (134 | 3.5%).
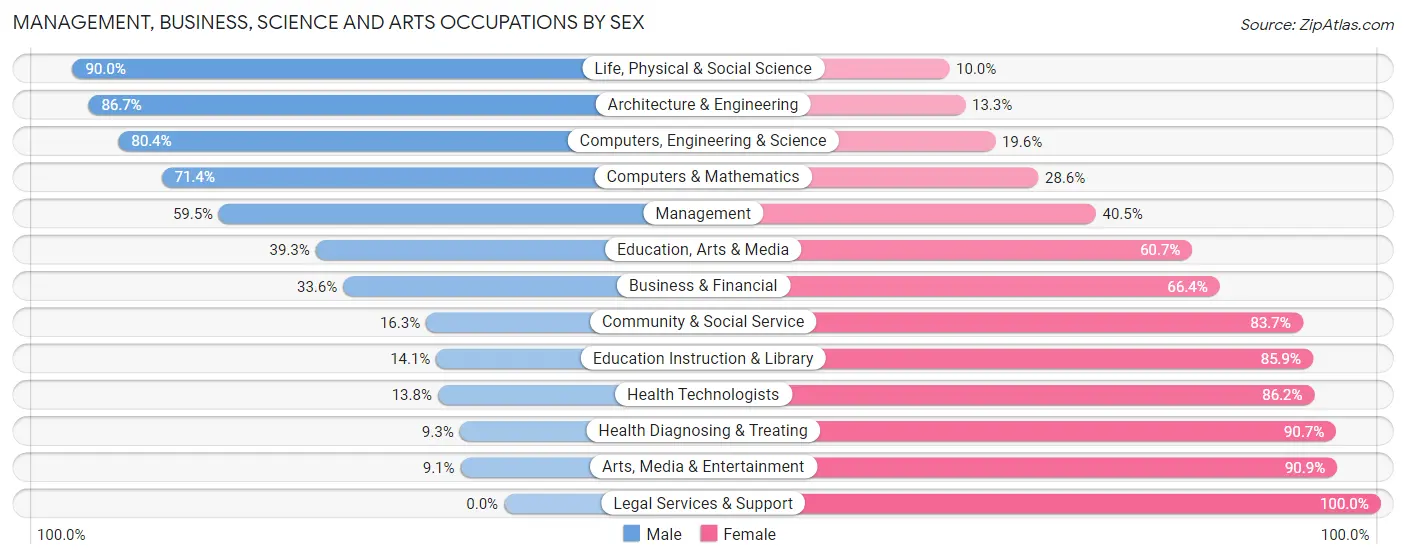
Management, Business, Science and Arts Occupations by Sex
Within the Management, Business, Science and Arts occupations in Caldwell County, the most male-oriented occupations are Life, Physical & Social Science (90.0%), Architecture & Engineering (86.7%), and Computers, Engineering & Science (80.4%), while the most female-oriented occupations are Legal Services & Support (100.0%), Arts, Media & Entertainment (90.9%), and Health Diagnosing & Treating (90.7%).
| Occupation | Male | Female |
| Management | 198 (59.5%) | 135 (40.5%) |
| Business & Financial | 45 (33.6%) | 89 (66.4%) |
| Computers, Engineering & Science | 37 (80.4%) | 9 (19.6%) |
| Computers & Mathematics | 15 (71.4%) | 6 (28.6%) |
| Architecture & Engineering | 13 (86.7%) | 2 (13.3%) |
| Life, Physical & Social Science | 9 (90.0%) | 1 (10.0%) |
| Community & Social Service | 41 (16.3%) | 211 (83.7%) |
| Education, Arts & Media | 11 (39.3%) | 17 (60.7%) |
| Legal Services & Support | 0 (0.0%) | 4 (100.0%) |
| Education Instruction & Library | 28 (14.1%) | 170 (85.9%) |
| Arts, Media & Entertainment | 2 (9.1%) | 20 (90.9%) |
| Health Diagnosing & Treating | 18 (9.3%) | 176 (90.7%) |
| Health Technologists | 17 (13.8%) | 106 (86.2%) |
| Total (Category) | 339 (35.3%) | 620 (64.6%) |
| Total (Overall) | 2,060 (54.5%) | 1,718 (45.5%) |
Services Occupations
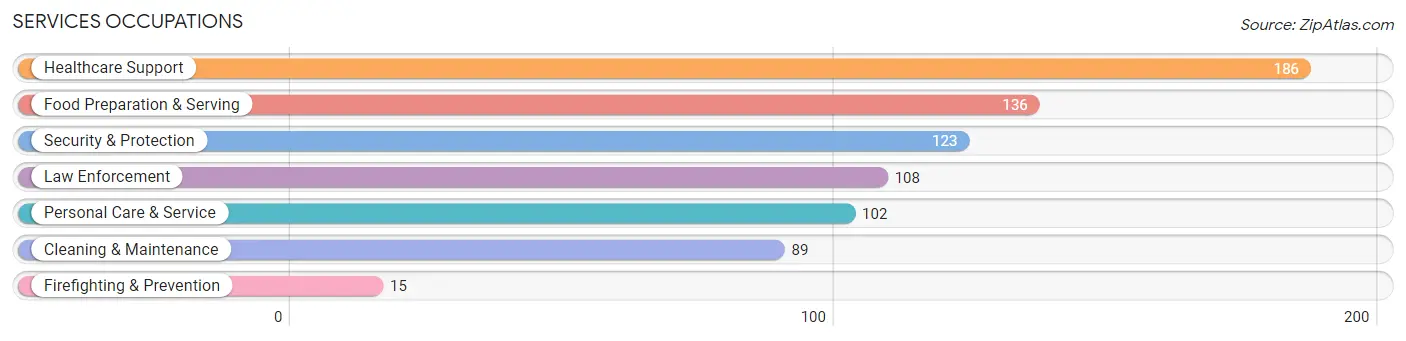
The most common Services occupations in Caldwell County are Healthcare Support (186 | 4.9%), Food Preparation & Serving (136 | 3.6%), Security & Protection (123 | 3.3%), Law Enforcement (108 | 2.9%), and Personal Care & Service (102 | 2.7%).
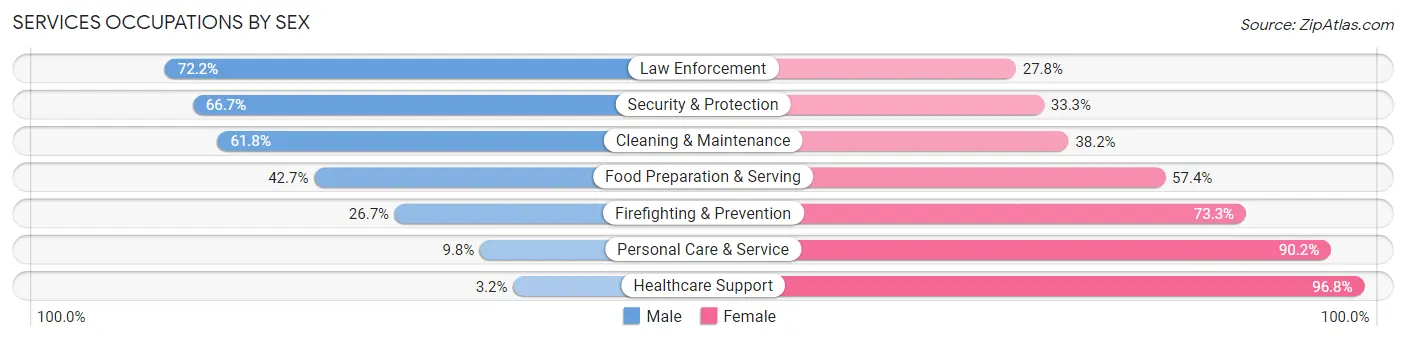
Services Occupations by Sex
Within the Services occupations in Caldwell County, the most male-oriented occupations are Law Enforcement (72.2%), Security & Protection (66.7%), and Cleaning & Maintenance (61.8%), while the most female-oriented occupations are Healthcare Support (96.8%), Personal Care & Service (90.2%), and Firefighting & Prevention (73.3%).
| Occupation | Male | Female |
| Healthcare Support | 6 (3.2%) | 180 (96.8%) |
| Security & Protection | 82 (66.7%) | 41 (33.3%) |
| Firefighting & Prevention | 4 (26.7%) | 11 (73.3%) |
| Law Enforcement | 78 (72.2%) | 30 (27.8%) |
| Food Preparation & Serving | 58 (42.6%) | 78 (57.4%) |
| Cleaning & Maintenance | 55 (61.8%) | 34 (38.2%) |
| Personal Care & Service | 10 (9.8%) | 92 (90.2%) |
| Total (Category) | 211 (33.2%) | 425 (66.8%) |
| Total (Overall) | 2,060 (54.5%) | 1,718 (45.5%) |
Sales and Office Occupations
The most common Sales and Office occupations in Caldwell County are Sales & Related (429 | 11.4%), and Office & Administration (353 | 9.3%).
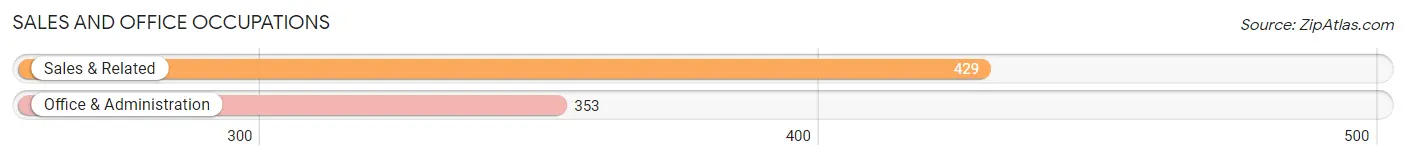
Sales and Office Occupations by Sex

| Occupation | Male | Female |
| Sales & Related | 236 (55.0%) | 193 (45.0%) |
| Office & Administration | 53 (15.0%) | 300 (85.0%) |
| Total (Category) | 289 (37.0%) | 493 (63.0%) |
| Total (Overall) | 2,060 (54.5%) | 1,718 (45.5%) |
Natural Resources, Construction and Maintenance Occupations
The most common Natural Resources, Construction and Maintenance occupations in Caldwell County are Construction & Extraction (296 | 7.8%), Installation, Maintenance & Repair (187 | 5.0%), and Farming, Fishing & Forestry (44 | 1.2%).
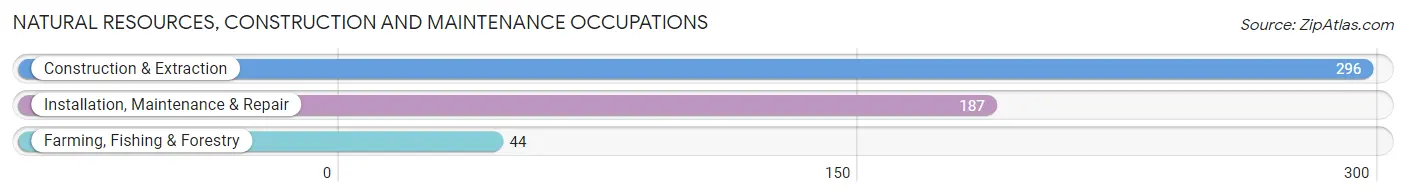
Natural Resources, Construction and Maintenance Occupations by Sex
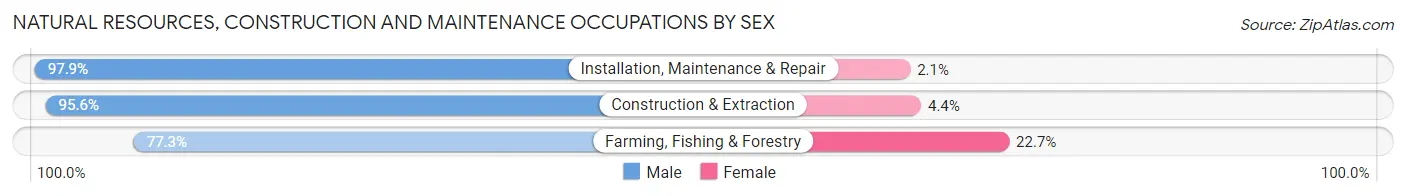
| Occupation | Male | Female |
| Farming, Fishing & Forestry | 34 (77.3%) | 10 (22.7%) |
| Construction & Extraction | 283 (95.6%) | 13 (4.4%) |
| Installation, Maintenance & Repair | 183 (97.9%) | 4 (2.1%) |
| Total (Category) | 500 (94.9%) | 27 (5.1%) |
| Total (Overall) | 2,060 (54.5%) | 1,718 (45.5%) |
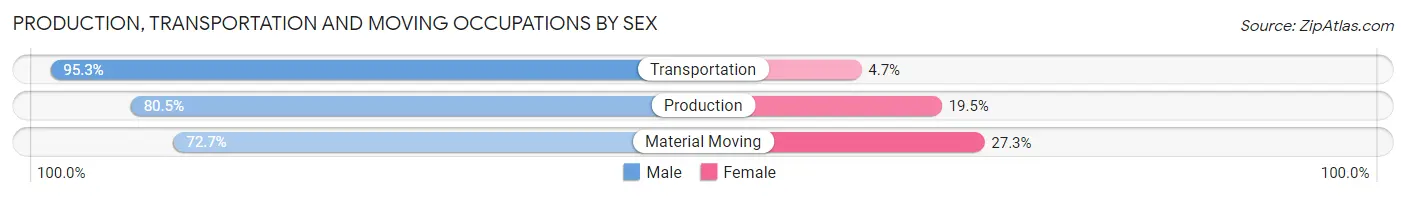
Production, Transportation and Moving Occupations
The most common Production, Transportation and Moving occupations in Caldwell County are Production (426 | 11.3%), Transportation (232 | 6.1%), and Material Moving (216 | 5.7%).
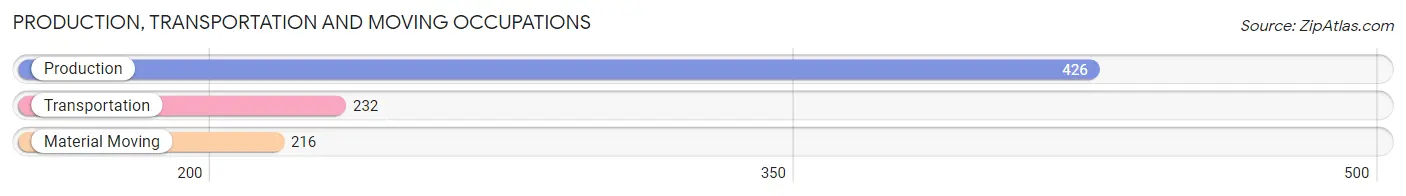
Production, Transportation and Moving Occupations by Sex
| Occupation | Male | Female |
| Production | 343 (80.5%) | 83 (19.5%) |
| Transportation | 221 (95.3%) | 11 (4.7%) |
| Material Moving | 157 (72.7%) | 59 (27.3%) |
| Total (Category) | 721 (82.5%) | 153 (17.5%) |
| Total (Overall) | 2,060 (54.5%) | 1,718 (45.5%) |
Employment Industries by Sex in Caldwell County
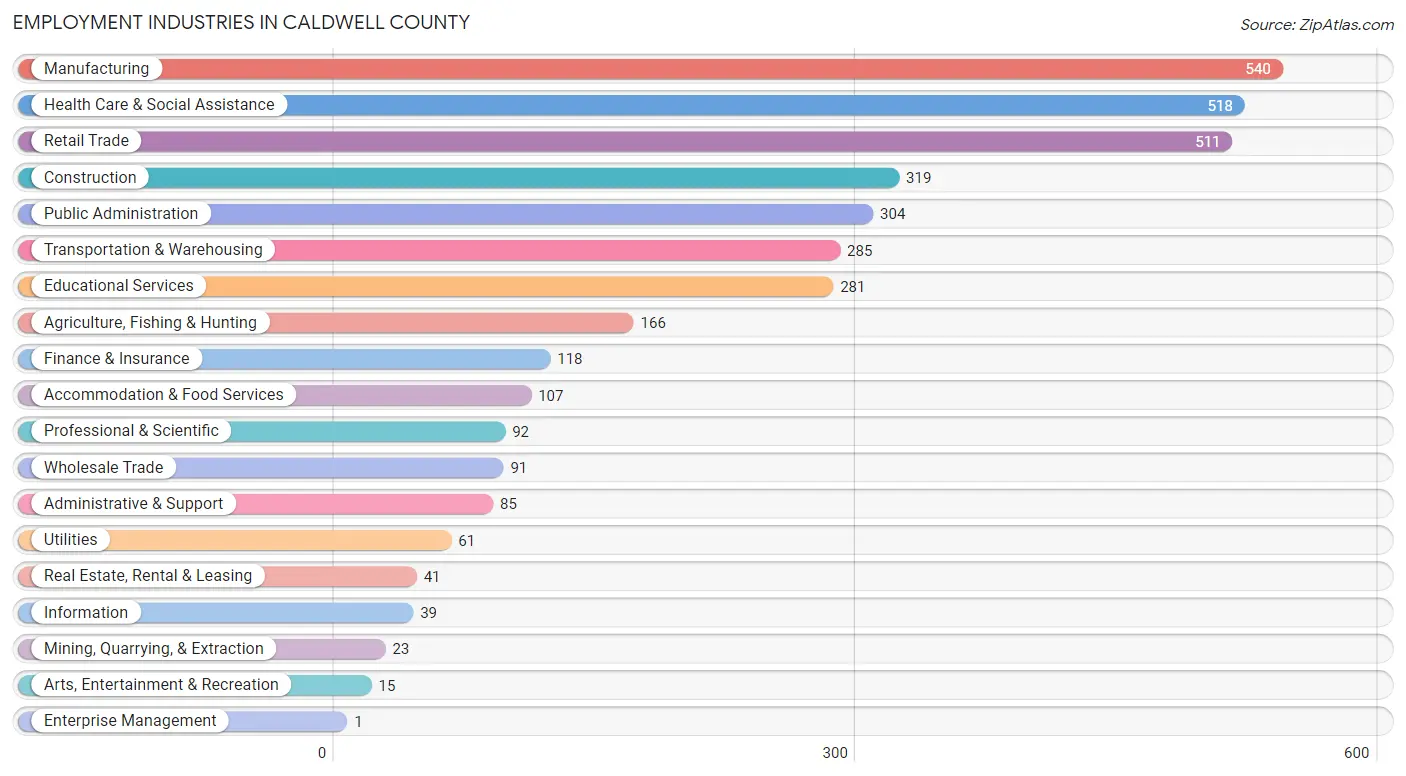
Employment Industries in Caldwell County
The major employment industries in Caldwell County include Manufacturing (540 | 14.3%), Health Care & Social Assistance (518 | 13.7%), Retail Trade (511 | 13.5%), Construction (319 | 8.4%), and Public Administration (304 | 8.1%).
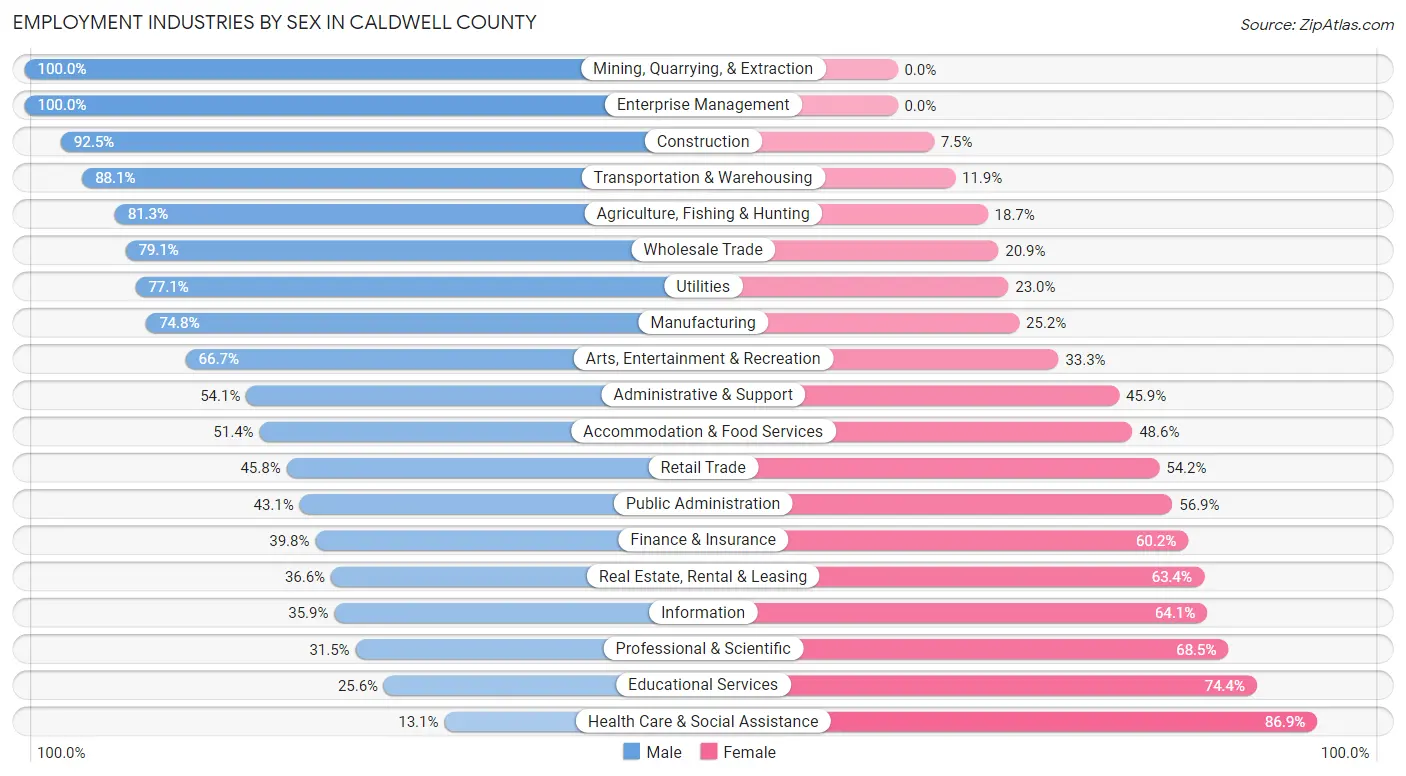
Employment Industries by Sex in Caldwell County
The Caldwell County industries that see more men than women are Mining, Quarrying, & Extraction (100.0%), Enterprise Management (100.0%), and Construction (92.5%), whereas the industries that tend to have a higher number of women are Health Care & Social Assistance (86.9%), Educational Services (74.4%), and Professional & Scientific (68.5%).
| Industry | Male | Female |
| Agriculture, Fishing & Hunting | 135 (81.3%) | 31 (18.7%) |
| Mining, Quarrying, & Extraction | 23 (100.0%) | 0 (0.0%) |
| Construction | 295 (92.5%) | 24 (7.5%) |
| Manufacturing | 404 (74.8%) | 136 (25.2%) |
| Wholesale Trade | 72 (79.1%) | 19 (20.9%) |
| Retail Trade | 234 (45.8%) | 277 (54.2%) |
| Transportation & Warehousing | 251 (88.1%) | 34 (11.9%) |
| Utilities | 47 (77.0%) | 14 (23.0%) |
| Information | 14 (35.9%) | 25 (64.1%) |
| Finance & Insurance | 47 (39.8%) | 71 (60.2%) |
| Real Estate, Rental & Leasing | 15 (36.6%) | 26 (63.4%) |
| Professional & Scientific | 29 (31.5%) | 63 (68.5%) |
| Enterprise Management | 1 (100.0%) | 0 (0.0%) |
| Administrative & Support | 46 (54.1%) | 39 (45.9%) |
| Educational Services | 72 (25.6%) | 209 (74.4%) |
| Health Care & Social Assistance | 68 (13.1%) | 450 (86.9%) |
| Arts, Entertainment & Recreation | 10 (66.7%) | 5 (33.3%) |
| Accommodation & Food Services | 55 (51.4%) | 52 (48.6%) |
| Public Administration | 131 (43.1%) | 173 (56.9%) |
| Total | 2,060 (54.5%) | 1,718 (45.5%) |
Education in Caldwell County
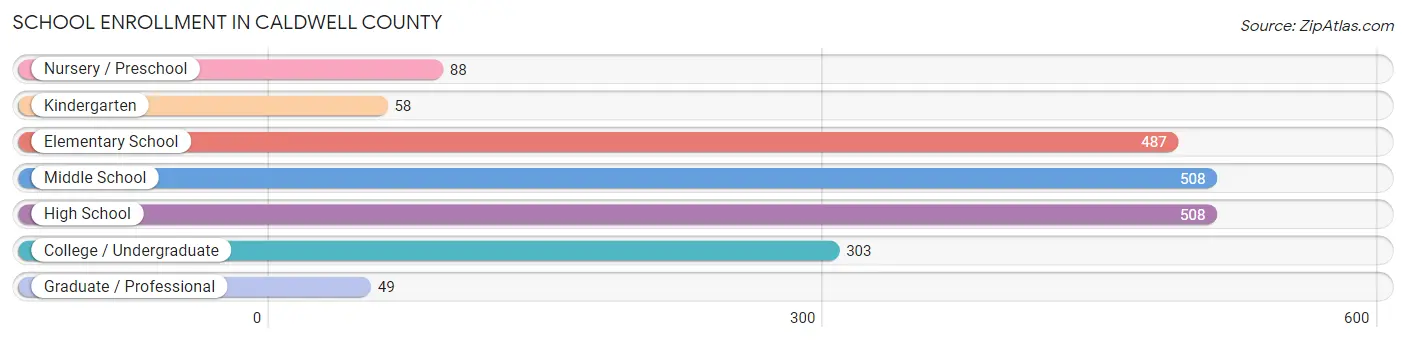
School Enrollment in Caldwell County
The most common levels of schooling among the 2,001 students in Caldwell County are middle school (508 | 25.4%), high school (508 | 25.4%), and elementary school (487 | 24.3%).
| School Level | # Students | % Students |
| Nursery / Preschool | 88 | 4.4% |
| Kindergarten | 58 | 2.9% |
| Elementary School | 487 | 24.3% |
| Middle School | 508 | 25.4% |
| High School | 508 | 25.4% |
| College / Undergraduate | 303 | 15.1% |
| Graduate / Professional | 49 | 2.5% |
| Total | 2,001 | 100.0% |
School Enrollment by Age by Funding Source in Caldwell County
Out of a total of 2,001 students who are enrolled in schools in Caldwell County, 190 (9.5%) attend a private institution, while the remaining 1,811 (90.5%) are enrolled in public schools. The age group of 25 to 34 year olds has the highest likelihood of being enrolled in private schools, with 44 (49.4% in the age bracket) enrolled. Conversely, the age group of 5 to 9 year old has the lowest likelihood of being enrolled in a private school, with 466 (96.9% in the age bracket) attending a public institution.
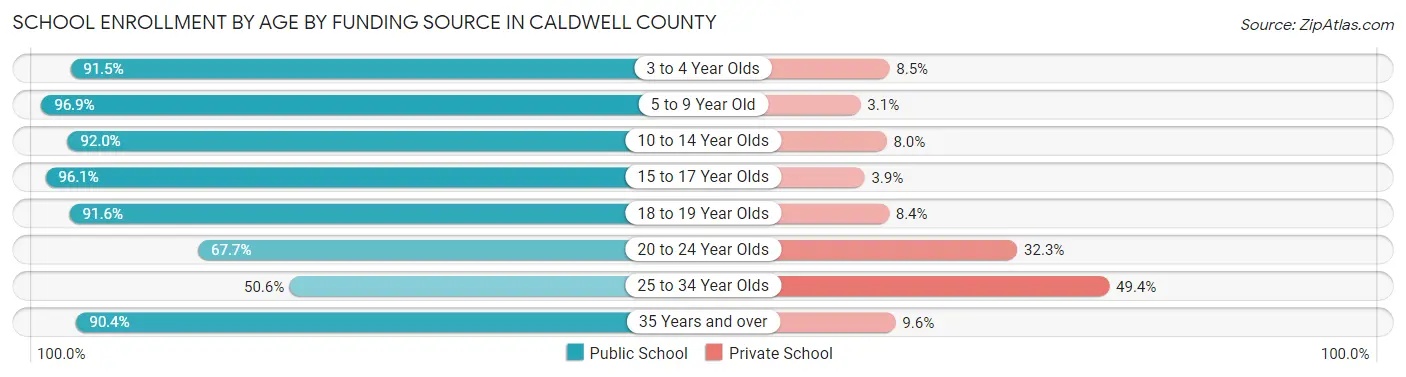
| Age Bracket | Public School | Private School |
| 3 to 4 Year Olds | 43 (91.5%) | 4 (8.5%) |
| 5 to 9 Year Old | 466 (96.9%) | 15 (3.1%) |
| 10 to 14 Year Olds | 611 (92.0%) | 53 (8.0%) |
| 15 to 17 Year Olds | 373 (96.1%) | 15 (3.9%) |
| 18 to 19 Year Olds | 109 (91.6%) | 10 (8.4%) |
| 20 to 24 Year Olds | 88 (67.7%) | 42 (32.3%) |
| 25 to 34 Year Olds | 45 (50.6%) | 44 (49.4%) |
| 35 Years and over | 75 (90.4%) | 8 (9.6%) |
| Total | 1,811 (90.5%) | 190 (9.5%) |
Educational Attainment by Field of Study in Caldwell County
Education (313 | 29.1%), science & technology (141 | 13.1%), business (103 | 9.6%), bio, nature & agricultural (99 | 9.2%), and arts & humanities (82 | 7.6%) are the most common fields of study among 1,075 individuals in Caldwell County who have obtained a bachelor's degree or higher.
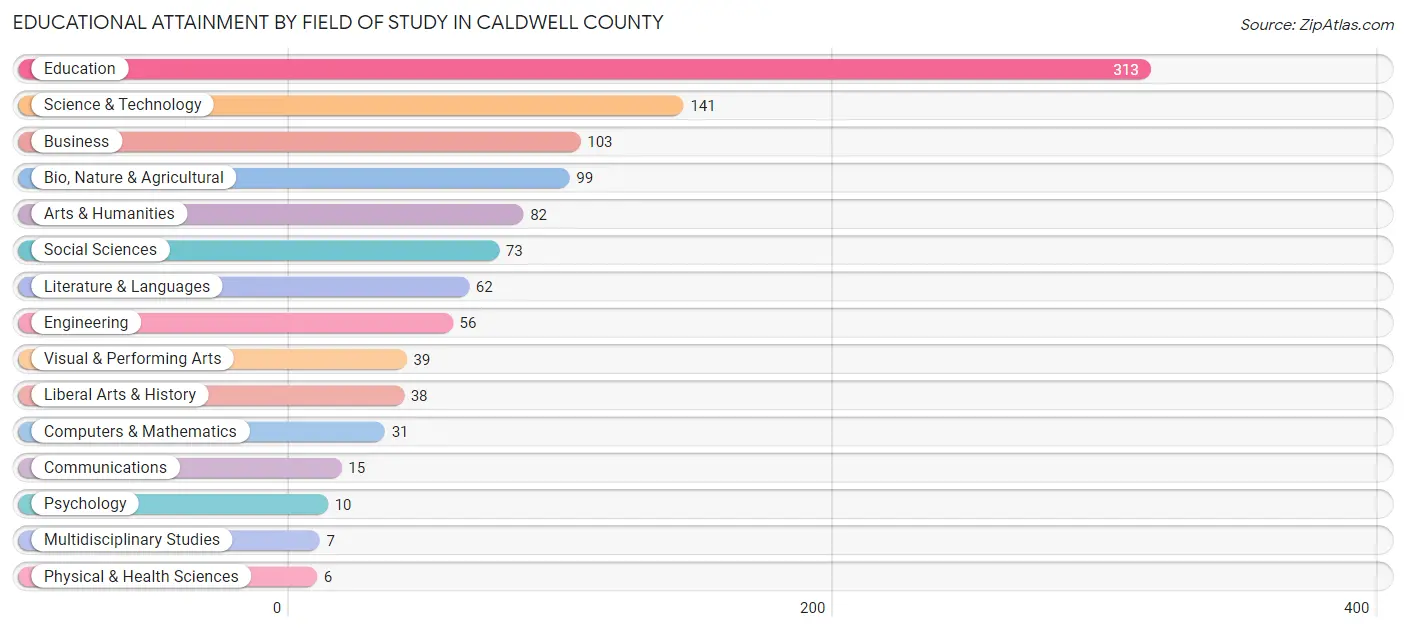
| Field of Study | # Graduates | % Graduates |
| Computers & Mathematics | 31 | 2.9% |
| Bio, Nature & Agricultural | 99 | 9.2% |
| Physical & Health Sciences | 6 | 0.6% |
| Psychology | 10 | 0.9% |
| Social Sciences | 73 | 6.8% |
| Engineering | 56 | 5.2% |
| Multidisciplinary Studies | 7 | 0.6% |
| Science & Technology | 141 | 13.1% |
| Business | 103 | 9.6% |
| Education | 313 | 29.1% |
| Literature & Languages | 62 | 5.8% |
| Liberal Arts & History | 38 | 3.5% |
| Visual & Performing Arts | 39 | 3.6% |
| Communications | 15 | 1.4% |
| Arts & Humanities | 82 | 7.6% |
| Total | 1,075 | 100.0% |
Transportation & Commute in Caldwell County
Vehicle Availability by Sex in Caldwell County
The most prevalent vehicle ownership categories in Caldwell County are males with 2 vehicles (762, accounting for 37.2%) and females with 2 vehicles (600, making up 44.8%).
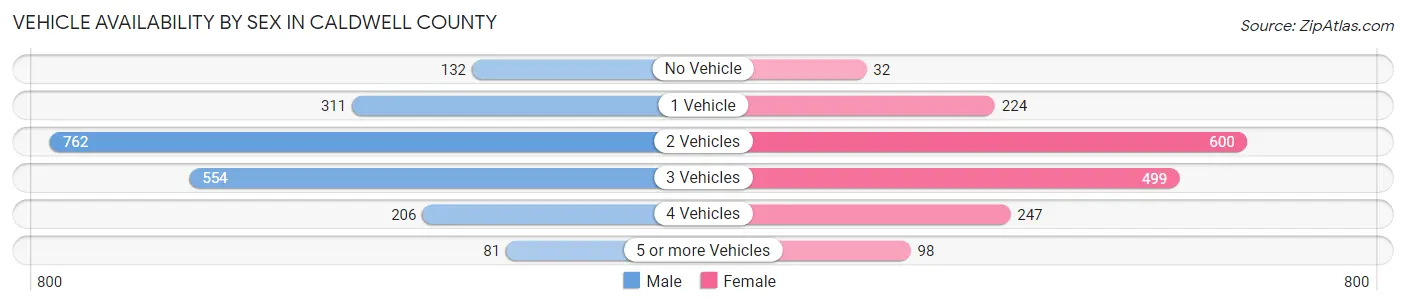
| Vehicles Available | Male | Female |
| No Vehicle | 132 (6.5%) | 32 (1.9%) |
| 1 Vehicle | 311 (15.2%) | 224 (13.2%) |
| 2 Vehicles | 762 (37.2%) | 600 (35.3%) |
| 3 Vehicles | 554 (27.1%) | 499 (29.3%) |
| 4 Vehicles | 206 (10.1%) | 247 (14.5%) |
| 5 or more Vehicles | 81 (4.0%) | 98 (5.8%) |
| Total | 2,046 (100.0%) | 1,700 (100.0%) |
Commute Time in Caldwell County
The most frequently occuring commute durations in Caldwell County are 60 to 89 minutes (528 commuters, 15.3%), 30 to 34 minutes (472 commuters, 13.7%), and 45 to 59 minutes (422 commuters, 12.2%).
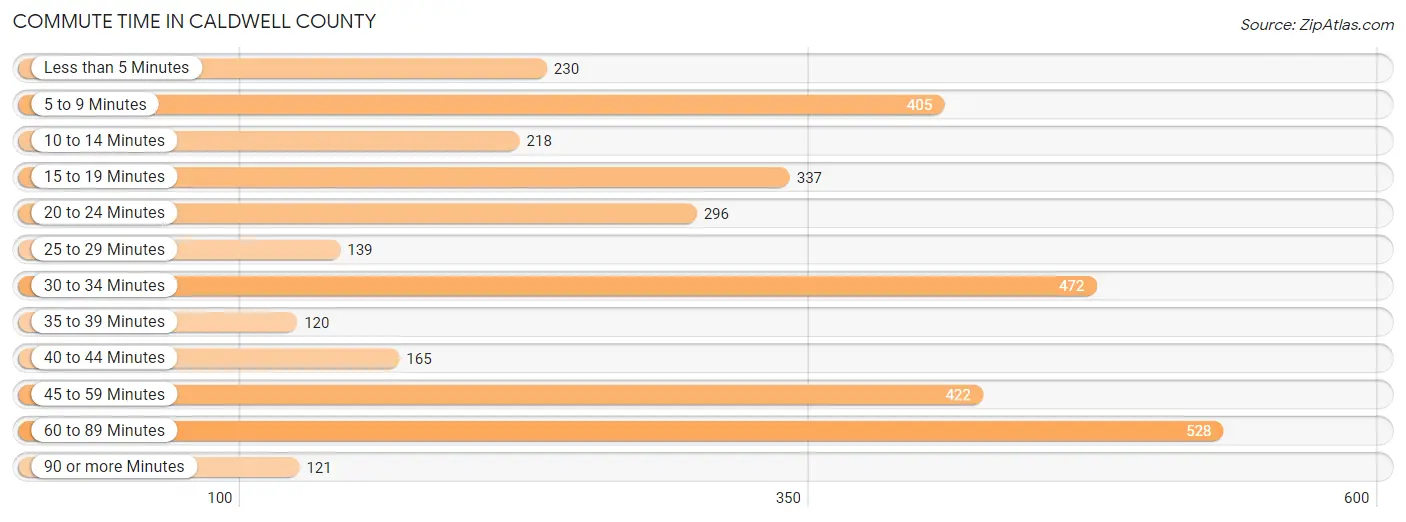
| Commute Time | # Commuters | % Commuters |
| Less than 5 Minutes | 230 | 6.7% |
| 5 to 9 Minutes | 405 | 11.7% |
| 10 to 14 Minutes | 218 | 6.3% |
| 15 to 19 Minutes | 337 | 9.8% |
| 20 to 24 Minutes | 296 | 8.6% |
| 25 to 29 Minutes | 139 | 4.0% |
| 30 to 34 Minutes | 472 | 13.7% |
| 35 to 39 Minutes | 120 | 3.5% |
| 40 to 44 Minutes | 165 | 4.8% |
| 45 to 59 Minutes | 422 | 12.2% |
| 60 to 89 Minutes | 528 | 15.3% |
| 90 or more Minutes | 121 | 3.5% |
Commute Time by Sex in Caldwell County
The most common commute times in Caldwell County are 60 to 89 minutes (462 commuters, 24.6%) for males and 30 to 34 minutes (256 commuters, 16.2%) for females.
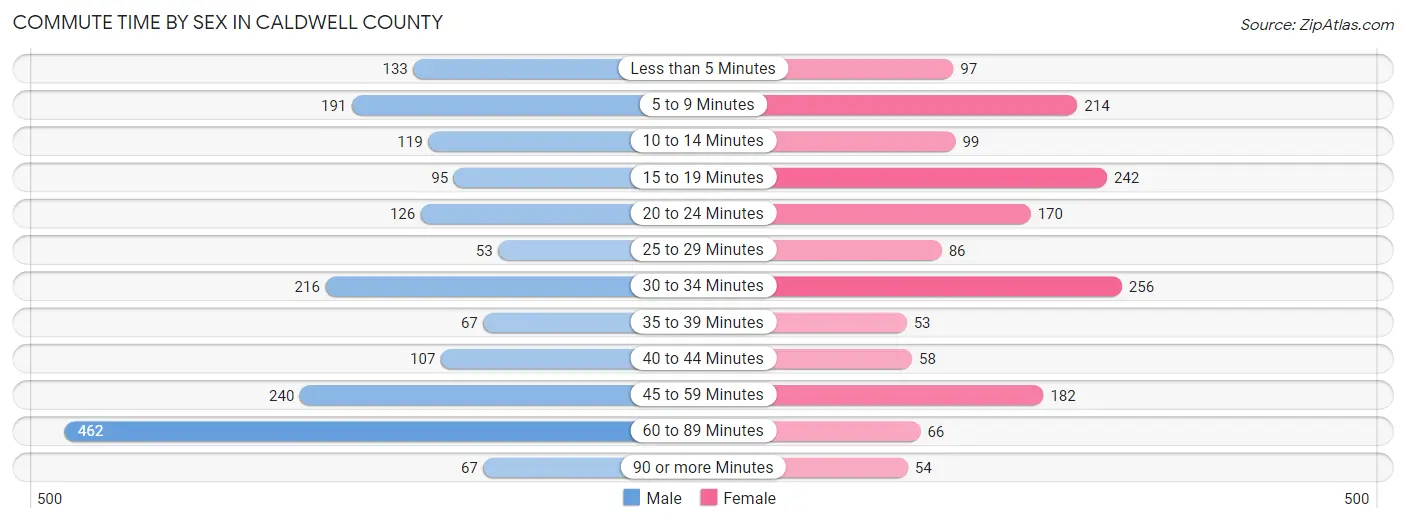
| Commute Time | Male | Female |
| Less than 5 Minutes | 133 (7.1%) | 97 (6.1%) |
| 5 to 9 Minutes | 191 (10.2%) | 214 (13.6%) |
| 10 to 14 Minutes | 119 (6.3%) | 99 (6.3%) |
| 15 to 19 Minutes | 95 (5.1%) | 242 (15.3%) |
| 20 to 24 Minutes | 126 (6.7%) | 170 (10.8%) |
| 25 to 29 Minutes | 53 (2.8%) | 86 (5.4%) |
| 30 to 34 Minutes | 216 (11.5%) | 256 (16.2%) |
| 35 to 39 Minutes | 67 (3.6%) | 53 (3.4%) |
| 40 to 44 Minutes | 107 (5.7%) | 58 (3.7%) |
| 45 to 59 Minutes | 240 (12.8%) | 182 (11.5%) |
| 60 to 89 Minutes | 462 (24.6%) | 66 (4.2%) |
| 90 or more Minutes | 67 (3.6%) | 54 (3.4%) |
Time of Departure to Work by Sex in Caldwell County
The most frequent times of departure to work in Caldwell County are 7:00 AM to 7:29 AM (274, 14.6%) for males and 7:30 AM to 7:59 AM (302, 19.2%) for females.
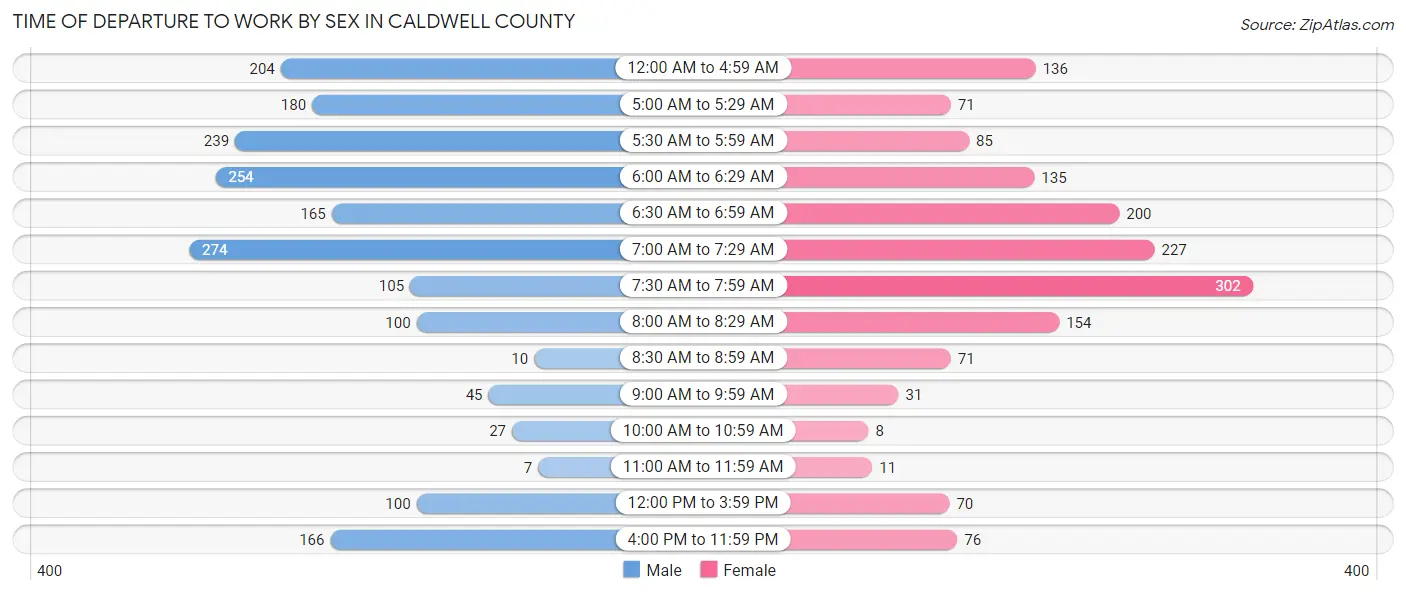
| Time of Departure | Male | Female |
| 12:00 AM to 4:59 AM | 204 (10.9%) | 136 (8.6%) |
| 5:00 AM to 5:29 AM | 180 (9.6%) | 71 (4.5%) |
| 5:30 AM to 5:59 AM | 239 (12.7%) | 85 (5.4%) |
| 6:00 AM to 6:29 AM | 254 (13.5%) | 135 (8.6%) |
| 6:30 AM to 6:59 AM | 165 (8.8%) | 200 (12.7%) |
| 7:00 AM to 7:29 AM | 274 (14.6%) | 227 (14.4%) |
| 7:30 AM to 7:59 AM | 105 (5.6%) | 302 (19.2%) |
| 8:00 AM to 8:29 AM | 100 (5.3%) | 154 (9.8%) |
| 8:30 AM to 8:59 AM | 10 (0.5%) | 71 (4.5%) |
| 9:00 AM to 9:59 AM | 45 (2.4%) | 31 (2.0%) |
| 10:00 AM to 10:59 AM | 27 (1.4%) | 8 (0.5%) |
| 11:00 AM to 11:59 AM | 7 (0.4%) | 11 (0.7%) |
| 12:00 PM to 3:59 PM | 100 (5.3%) | 70 (4.4%) |
| 4:00 PM to 11:59 PM | 166 (8.8%) | 76 (4.8%) |
| Total | 1,876 (100.0%) | 1,577 (100.0%) |
Housing Occupancy in Caldwell County
Occupancy by Ownership in Caldwell County
Of the total 3,480 dwellings in Caldwell County, owner-occupied units account for 2,784 (80.0%), while renter-occupied units make up 696 (20.0%).
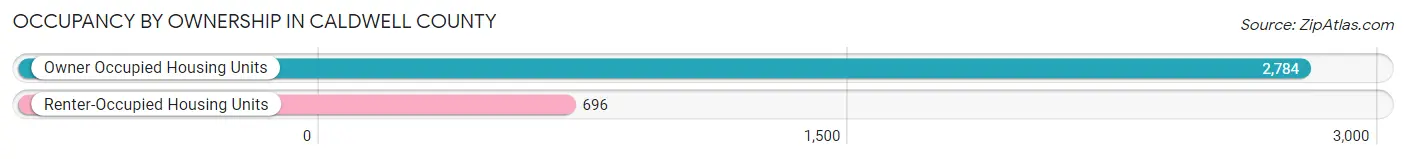
| Occupancy | # Housing Units | % Housing Units |
| Owner Occupied Housing Units | 2,784 | 80.0% |
| Renter-Occupied Housing Units | 696 | 20.0% |
| Total Occupied Housing Units | 3,480 | 100.0% |
Occupancy by Household Size in Caldwell County
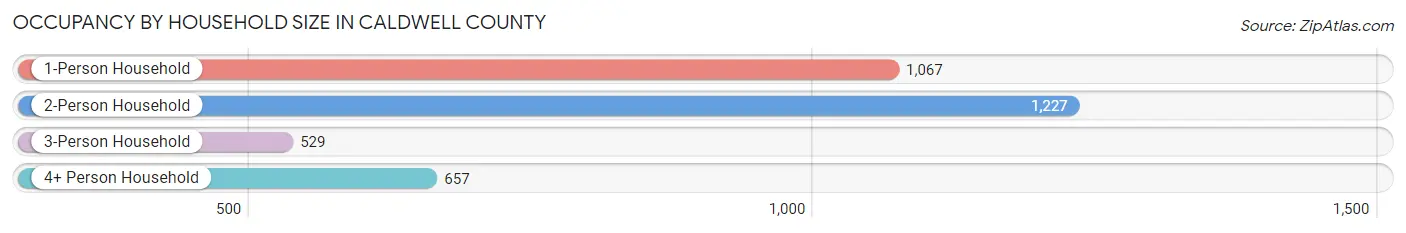
| Household Size | # Housing Units | % Housing Units |
| 1-Person Household | 1,067 | 30.7% |
| 2-Person Household | 1,227 | 35.3% |
| 3-Person Household | 529 | 15.2% |
| 4+ Person Household | 657 | 18.9% |
| Total Housing Units | 3,480 | 100.0% |
Occupancy by Ownership by Household Size in Caldwell County
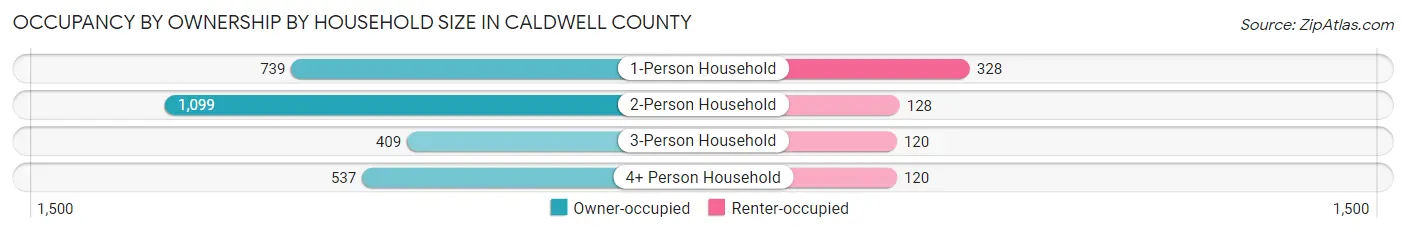
| Household Size | Owner-occupied | Renter-occupied |
| 1-Person Household | 739 (69.3%) | 328 (30.7%) |
| 2-Person Household | 1,099 (89.6%) | 128 (10.4%) |
| 3-Person Household | 409 (77.3%) | 120 (22.7%) |
| 4+ Person Household | 537 (81.7%) | 120 (18.3%) |
| Total Housing Units | 2,784 (80.0%) | 696 (20.0%) |
Occupancy by Educational Attainment in Caldwell County
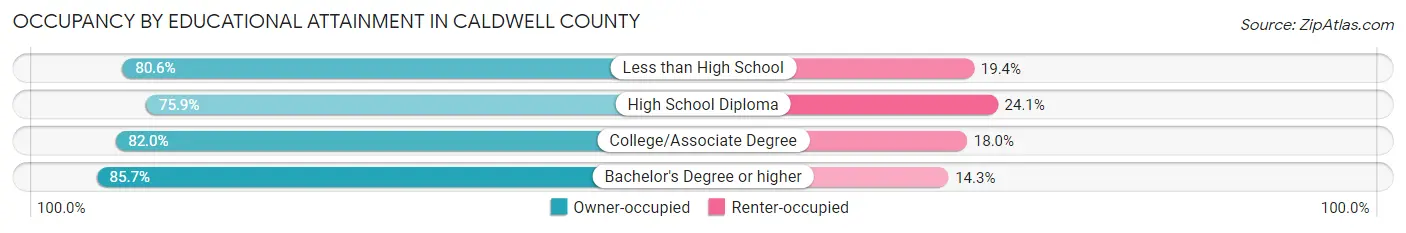
| Household Size | Owner-occupied | Renter-occupied |
| Less than High School | 254 (80.6%) | 61 (19.4%) |
| High School Diploma | 1,119 (75.9%) | 355 (24.1%) |
| College/Associate Degree | 853 (82.0%) | 187 (18.0%) |
| Bachelor's Degree or higher | 558 (85.7%) | 93 (14.3%) |
Occupancy by Age of Householder in Caldwell County
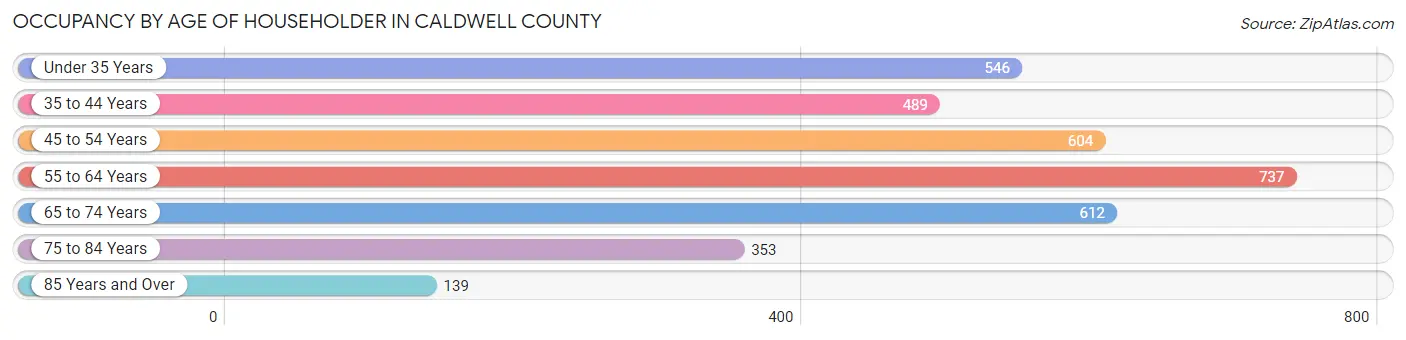
| Age Bracket | # Households | % Households |
| Under 35 Years | 546 | 15.7% |
| 35 to 44 Years | 489 | 14.1% |
| 45 to 54 Years | 604 | 17.4% |
| 55 to 64 Years | 737 | 21.2% |
| 65 to 74 Years | 612 | 17.6% |
| 75 to 84 Years | 353 | 10.1% |
| 85 Years and Over | 139 | 4.0% |
| Total | 3,480 | 100.0% |
Housing Finances in Caldwell County
Median Income by Occupancy in Caldwell County
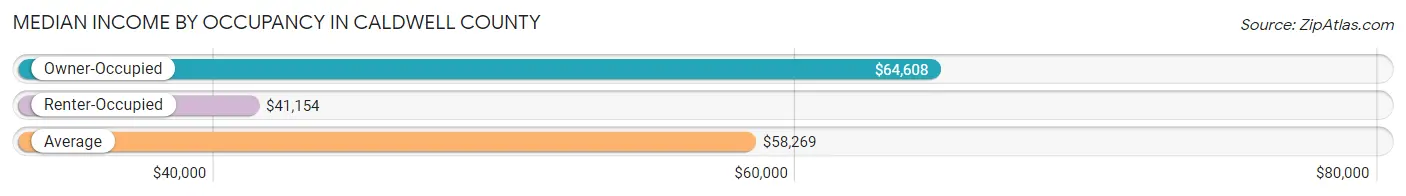
| Occupancy Type | # Households | Median Income |
| Owner-Occupied | 2,784 (80.0%) | $64,608 |
| Renter-Occupied | 696 (20.0%) | $41,154 |
| Average | 3,480 (100.0%) | $58,269 |
Occupancy by Householder Income Bracket in Caldwell County
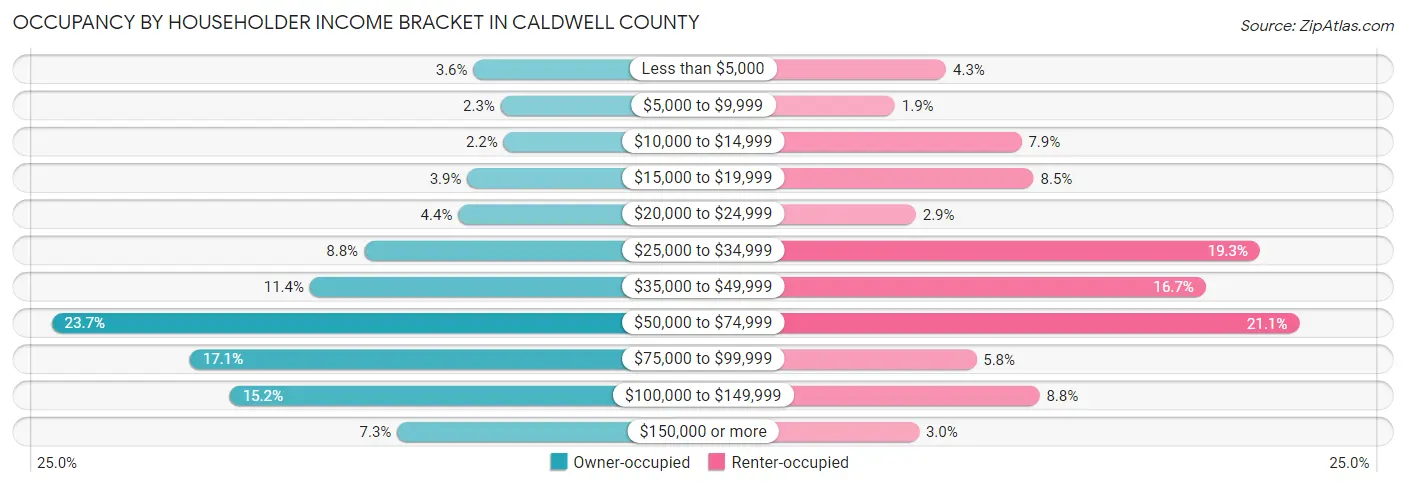
| Income Bracket | Owner-occupied | Renter-occupied |
| Less than $5,000 | 101 (3.6%) | 30 (4.3%) |
| $5,000 to $9,999 | 65 (2.3%) | 13 (1.9%) |
| $10,000 to $14,999 | 61 (2.2%) | 55 (7.9%) |
| $15,000 to $19,999 | 109 (3.9%) | 59 (8.5%) |
| $20,000 to $24,999 | 121 (4.3%) | 20 (2.9%) |
| $25,000 to $34,999 | 246 (8.8%) | 134 (19.3%) |
| $35,000 to $49,999 | 318 (11.4%) | 116 (16.7%) |
| $50,000 to $74,999 | 660 (23.7%) | 147 (21.1%) |
| $75,000 to $99,999 | 477 (17.1%) | 40 (5.8%) |
| $100,000 to $149,999 | 424 (15.2%) | 61 (8.8%) |
| $150,000 or more | 202 (7.3%) | 21 (3.0%) |
| Total | 2,784 (100.0%) | 696 (100.0%) |
Monthly Housing Cost Tiers in Caldwell County
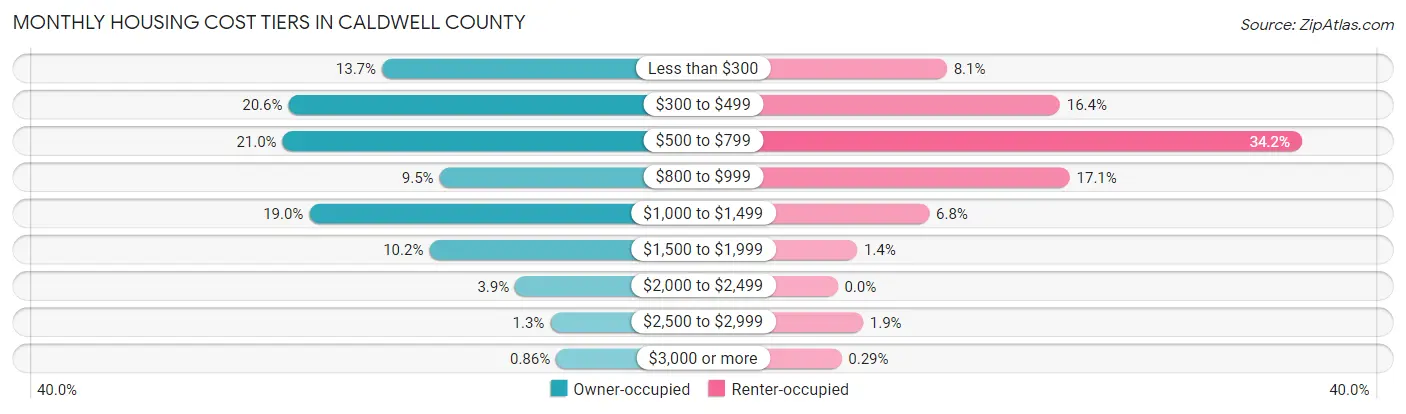
| Monthly Cost | Owner-occupied | Renter-occupied |
| Less than $300 | 381 (13.7%) | 56 (8.1%) |
| $300 to $499 | 573 (20.6%) | 114 (16.4%) |
| $500 to $799 | 585 (21.0%) | 238 (34.2%) |
| $800 to $999 | 263 (9.5%) | 119 (17.1%) |
| $1,000 to $1,499 | 530 (19.0%) | 47 (6.8%) |
| $1,500 to $1,999 | 284 (10.2%) | 10 (1.4%) |
| $2,000 to $2,499 | 108 (3.9%) | 0 (0.0%) |
| $2,500 to $2,999 | 36 (1.3%) | 13 (1.9%) |
| $3,000 or more | 24 (0.9%) | 2 (0.3%) |
| Total | 2,784 (100.0%) | 696 (100.0%) |
Physical Housing Characteristics in Caldwell County
Housing Structures in Caldwell County
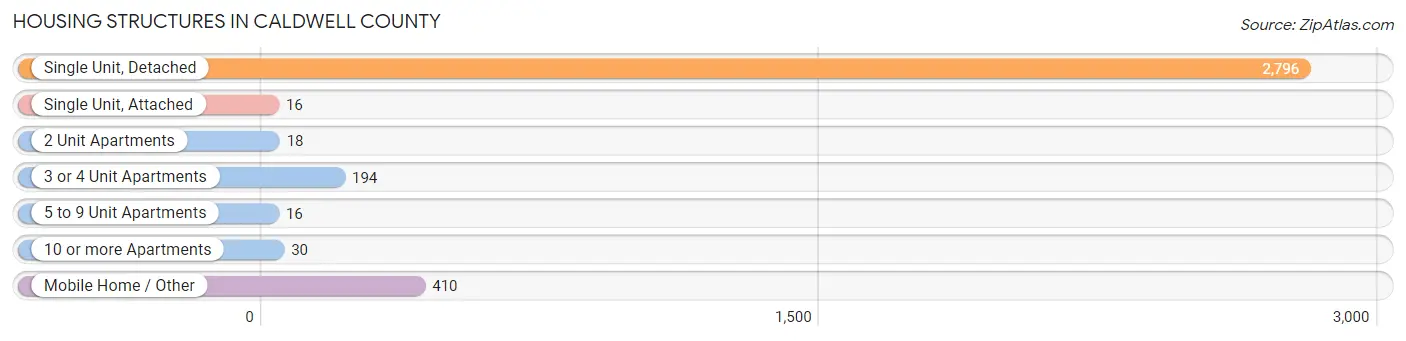
| Structure Type | # Housing Units | % Housing Units |
| Single Unit, Detached | 2,796 | 80.3% |
| Single Unit, Attached | 16 | 0.5% |
| 2 Unit Apartments | 18 | 0.5% |
| 3 or 4 Unit Apartments | 194 | 5.6% |
| 5 to 9 Unit Apartments | 16 | 0.5% |
| 10 or more Apartments | 30 | 0.9% |
| Mobile Home / Other | 410 | 11.8% |
| Total | 3,480 | 100.0% |
Housing Structures by Occupancy in Caldwell County
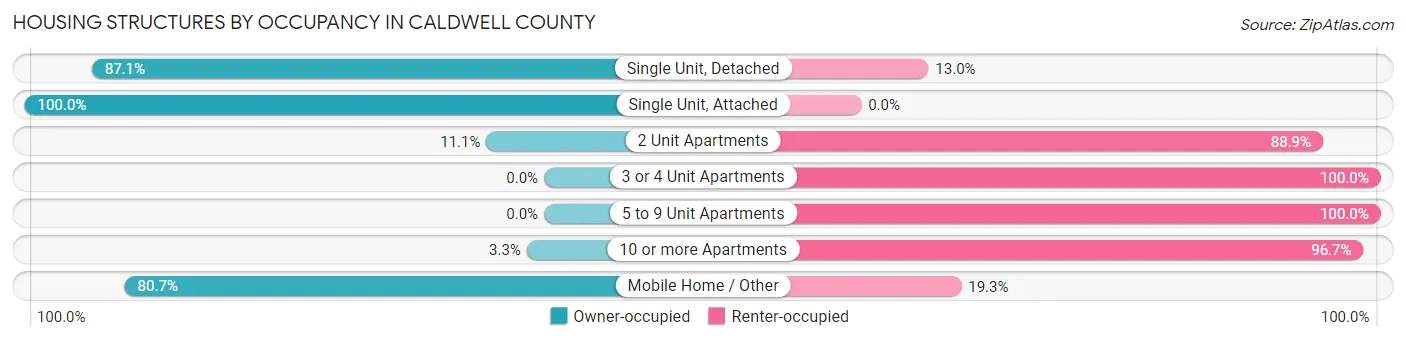
| Structure Type | Owner-occupied | Renter-occupied |
| Single Unit, Detached | 2,434 (87.1%) | 362 (13.0%) |
| Single Unit, Attached | 16 (100.0%) | 0 (0.0%) |
| 2 Unit Apartments | 2 (11.1%) | 16 (88.9%) |
| 3 or 4 Unit Apartments | 0 (0.0%) | 194 (100.0%) |
| 5 to 9 Unit Apartments | 0 (0.0%) | 16 (100.0%) |
| 10 or more Apartments | 1 (3.3%) | 29 (96.7%) |
| Mobile Home / Other | 331 (80.7%) | 79 (19.3%) |
| Total | 2,784 (80.0%) | 696 (20.0%) |
Housing Structures by Number of Rooms in Caldwell County
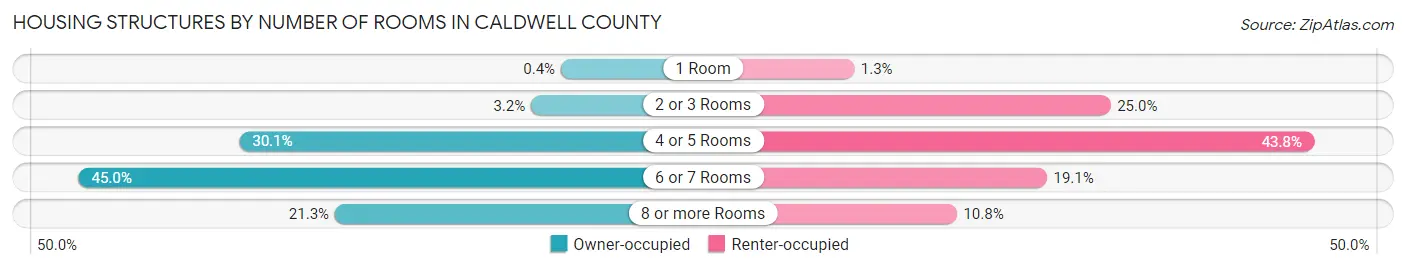
| Number of Rooms | Owner-occupied | Renter-occupied |
| 1 Room | 11 (0.4%) | 9 (1.3%) |
| 2 or 3 Rooms | 88 (3.2%) | 174 (25.0%) |
| 4 or 5 Rooms | 839 (30.1%) | 305 (43.8%) |
| 6 or 7 Rooms | 1,253 (45.0%) | 133 (19.1%) |
| 8 or more Rooms | 593 (21.3%) | 75 (10.8%) |
| Total | 2,784 (100.0%) | 696 (100.0%) |
Housing Structure by Heating Type in Caldwell County
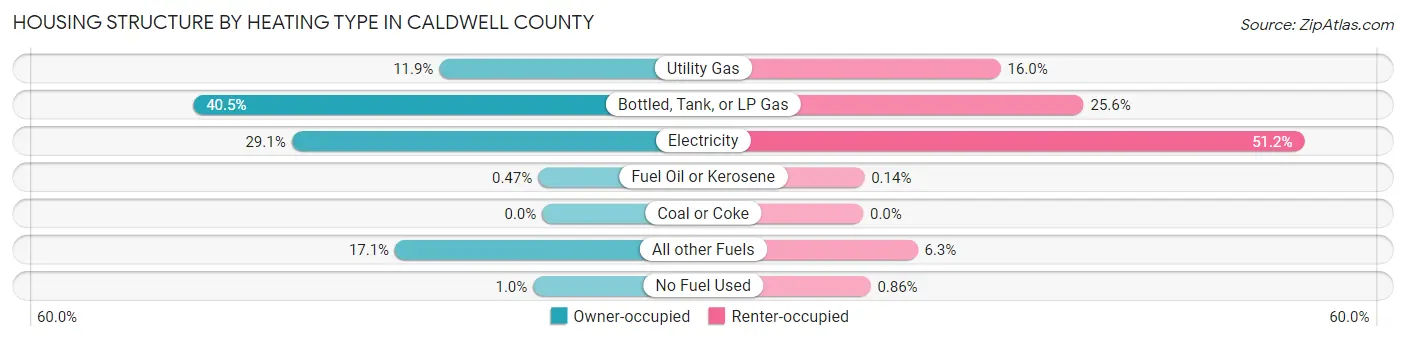
| Heating Type | Owner-occupied | Renter-occupied |
| Utility Gas | 332 (11.9%) | 111 (16.0%) |
| Bottled, Tank, or LP Gas | 1,126 (40.5%) | 178 (25.6%) |
| Electricity | 809 (29.1%) | 356 (51.1%) |
| Fuel Oil or Kerosene | 13 (0.5%) | 1 (0.1%) |
| Coal or Coke | 0 (0.0%) | 0 (0.0%) |
| All other Fuels | 475 (17.1%) | 44 (6.3%) |
| No Fuel Used | 29 (1.0%) | 6 (0.9%) |
| Total | 2,784 (100.0%) | 696 (100.0%) |
Household Vehicle Usage in Caldwell County
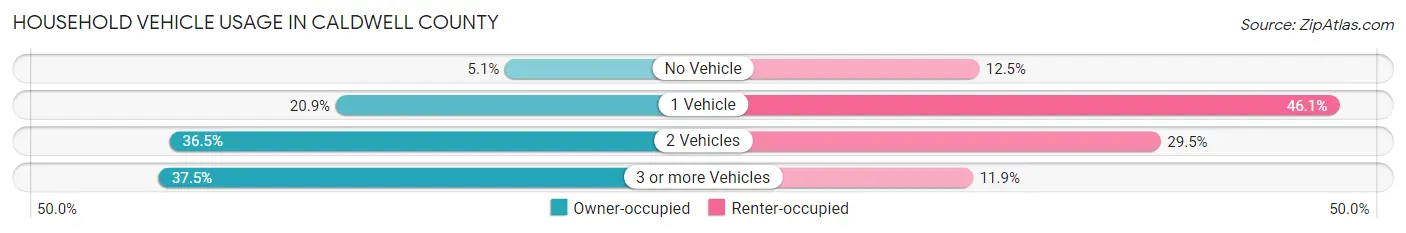
| Vehicles per Household | Owner-occupied | Renter-occupied |
| No Vehicle | 143 (5.1%) | 87 (12.5%) |
| 1 Vehicle | 583 (20.9%) | 321 (46.1%) |
| 2 Vehicles | 1,015 (36.5%) | 205 (29.4%) |
| 3 or more Vehicles | 1,043 (37.5%) | 83 (11.9%) |
| Total | 2,784 (100.0%) | 696 (100.0%) |
Real Estate & Mortgages in Caldwell County
Real Estate and Mortgage Overview in Caldwell County
| Characteristic | Without Mortgage | With Mortgage |
| Housing Units | 1,511 | 1,273 |
| Median Property Value | $118,400 | $158,800 |
| Median Household Income | $53,274 | $112 |
| Monthly Housing Costs | $426 | $24 |
| Real Estate Taxes | $914 | $5 |
Property Value by Mortgage Status in Caldwell County
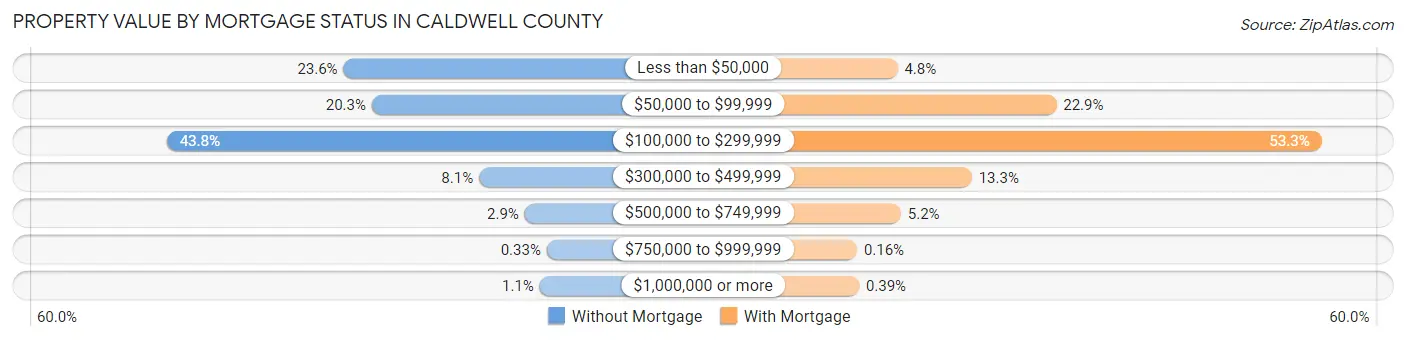
| Property Value | Without Mortgage | With Mortgage |
| Less than $50,000 | 356 (23.6%) | 61 (4.8%) |
| $50,000 to $99,999 | 307 (20.3%) | 292 (22.9%) |
| $100,000 to $299,999 | 661 (43.8%) | 678 (53.3%) |
| $300,000 to $499,999 | 122 (8.1%) | 169 (13.3%) |
| $500,000 to $749,999 | 43 (2.9%) | 66 (5.2%) |
| $750,000 to $999,999 | 5 (0.3%) | 2 (0.2%) |
| $1,000,000 or more | 17 (1.1%) | 5 (0.4%) |
| Total | 1,511 (100.0%) | 1,273 (100.0%) |
Household Income by Mortgage Status in Caldwell County
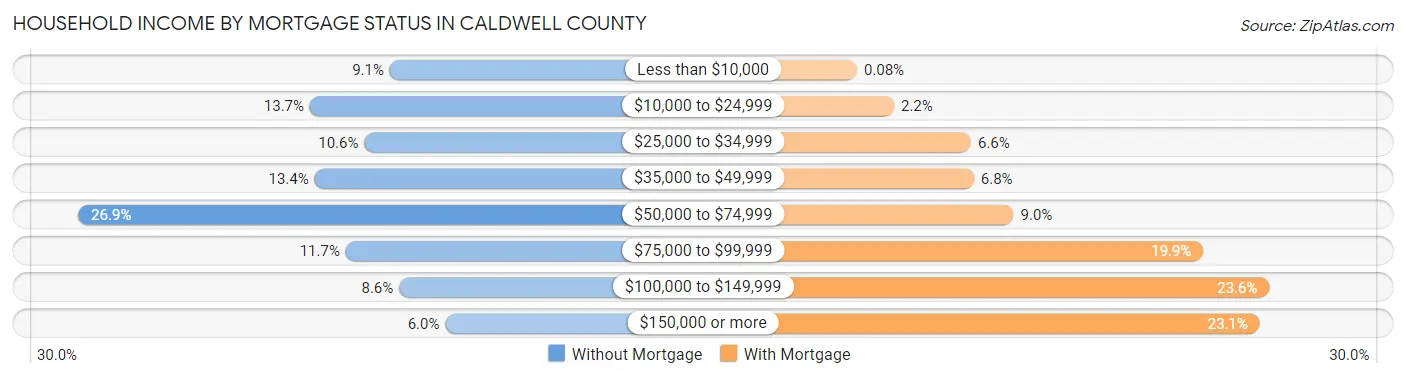
| Household Income | Without Mortgage | With Mortgage |
| Less than $10,000 | 138 (9.1%) | 1 (0.1%) |
| $10,000 to $24,999 | 207 (13.7%) | 28 (2.2%) |
| $25,000 to $34,999 | 160 (10.6%) | 84 (6.6%) |
| $35,000 to $49,999 | 203 (13.4%) | 86 (6.8%) |
| $50,000 to $74,999 | 407 (26.9%) | 115 (9.0%) |
| $75,000 to $99,999 | 176 (11.7%) | 253 (19.9%) |
| $100,000 to $149,999 | 130 (8.6%) | 301 (23.6%) |
| $150,000 or more | 90 (6.0%) | 294 (23.1%) |
| Total | 1,511 (100.0%) | 1,273 (100.0%) |
Property Value to Household Income Ratio in Caldwell County
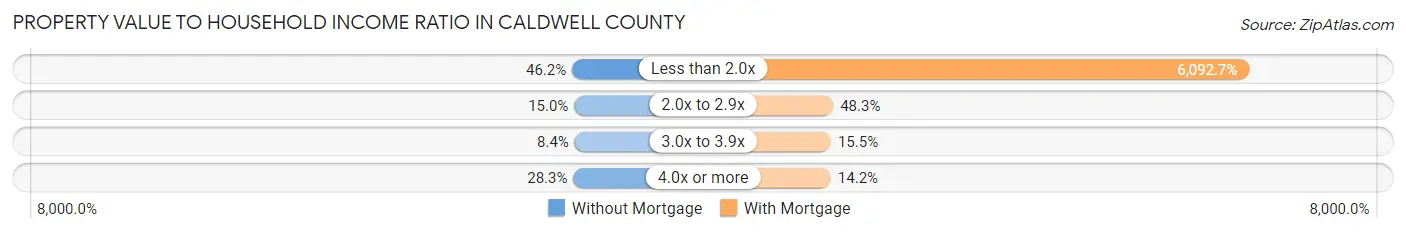
| Value-to-Income Ratio | Without Mortgage | With Mortgage |
| Less than 2.0x | 698 (46.2%) | 77,560 (6,092.7%) |
| 2.0x to 2.9x | 226 (15.0%) | 615 (48.3%) |
| 3.0x to 3.9x | 127 (8.4%) | 197 (15.5%) |
| 4.0x or more | 428 (28.3%) | 181 (14.2%) |
| Total | 1,511 (100.0%) | 1,273 (100.0%) |
Real Estate Taxes by Mortgage Status in Caldwell County
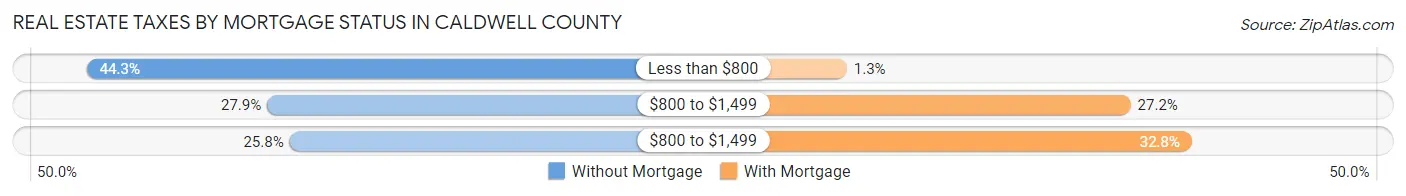
| Property Taxes | Without Mortgage | With Mortgage |
| Less than $800 | 670 (44.3%) | 16 (1.3%) |
| $800 to $1,499 | 421 (27.9%) | 346 (27.2%) |
| $800 to $1,499 | 390 (25.8%) | 417 (32.8%) |
| Total | 1,511 (100.0%) | 1,273 (100.0%) |
Health & Disability in Caldwell County
Health Insurance Coverage by Age in Caldwell County
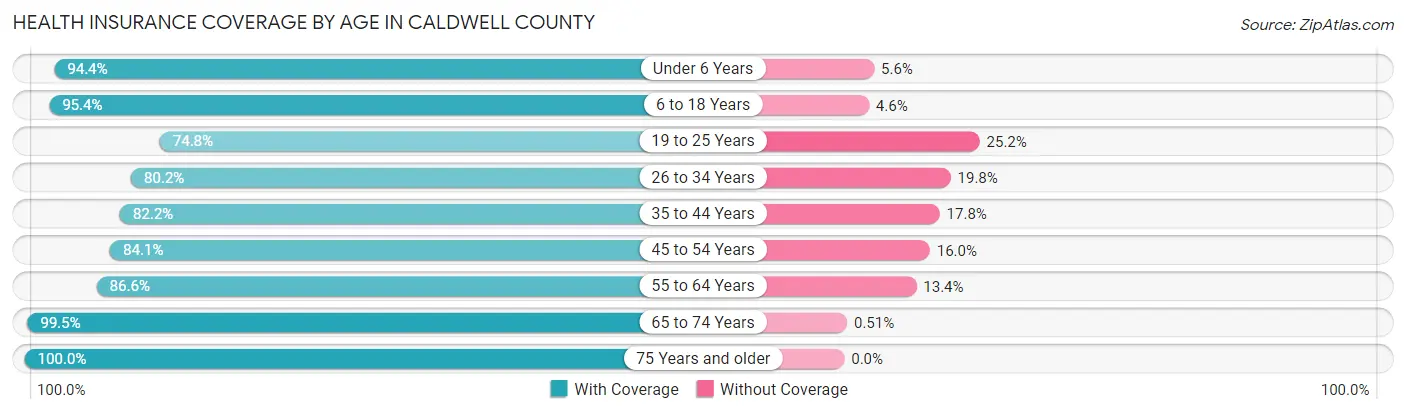
| Age Bracket | With Coverage | Without Coverage |
| Under 6 Years | 544 (94.4%) | 32 (5.6%) |
| 6 to 18 Years | 1,560 (95.4%) | 75 (4.6%) |
| 19 to 25 Years | 483 (74.8%) | 163 (25.2%) |
| 26 to 34 Years | 647 (80.2%) | 160 (19.8%) |
| 35 to 44 Years | 800 (82.2%) | 173 (17.8%) |
| 45 to 54 Years | 933 (84.1%) | 177 (16.0%) |
| 55 to 64 Years | 1,095 (86.6%) | 170 (13.4%) |
| 65 to 74 Years | 980 (99.5%) | 5 (0.5%) |
| 75 Years and older | 708 (100.0%) | 0 (0.0%) |
| Total | 7,750 (89.0%) | 955 (11.0%) |
Health Insurance Coverage by Citizenship Status in Caldwell County
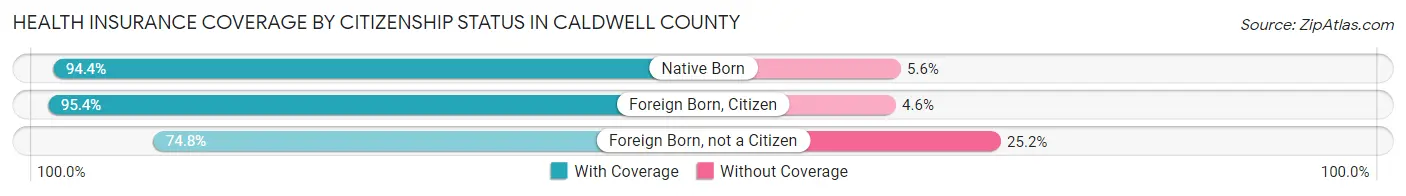
| Citizenship Status | With Coverage | Without Coverage |
| Native Born | 544 (94.4%) | 32 (5.6%) |
| Foreign Born, Citizen | 1,560 (95.4%) | 75 (4.6%) |
| Foreign Born, not a Citizen | 483 (74.8%) | 163 (25.2%) |
Health Insurance Coverage by Household Income in Caldwell County
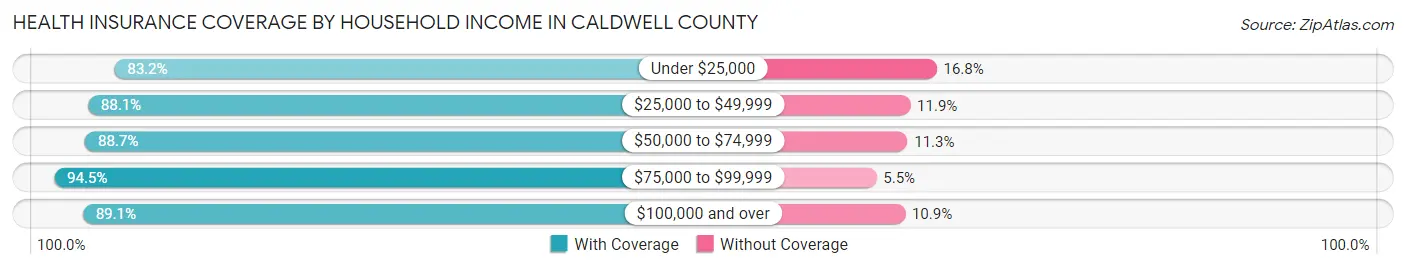
| Household Income | With Coverage | Without Coverage |
| Under $25,000 | 856 (83.2%) | 173 (16.8%) |
| $25,000 to $49,999 | 1,671 (88.1%) | 225 (11.9%) |
| $50,000 to $74,999 | 1,736 (88.7%) | 222 (11.3%) |
| $75,000 to $99,999 | 1,418 (94.5%) | 83 (5.5%) |
| $100,000 and over | 2,060 (89.1%) | 252 (10.9%) |
Public vs Private Health Insurance Coverage by Age in Caldwell County
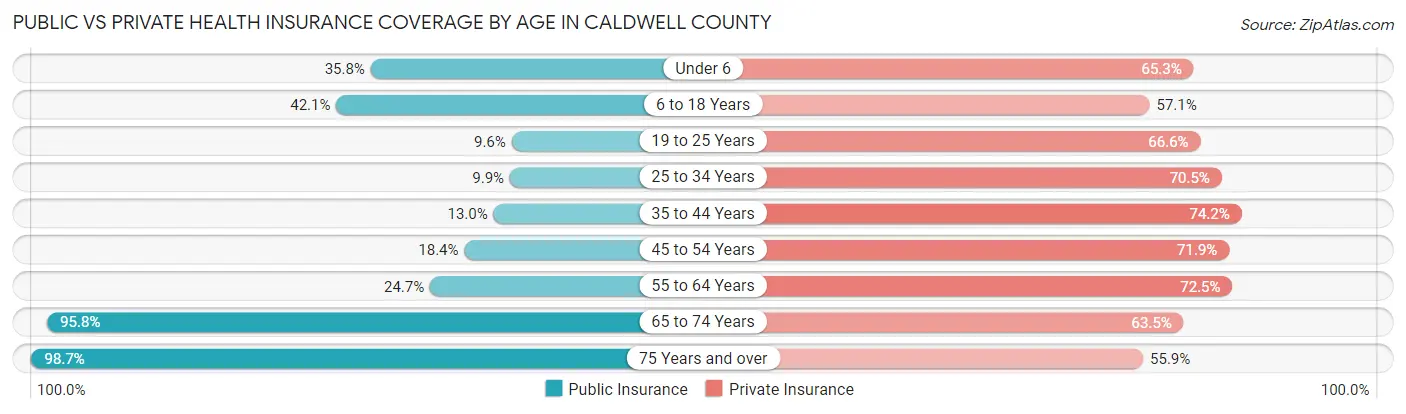
| Age Bracket | Public Insurance | Private Insurance |
| Under 6 | 206 (35.8%) | 376 (65.3%) |
| 6 to 18 Years | 689 (42.1%) | 934 (57.1%) |
| 19 to 25 Years | 62 (9.6%) | 430 (66.6%) |
| 25 to 34 Years | 80 (9.9%) | 569 (70.5%) |
| 35 to 44 Years | 126 (13.0%) | 722 (74.2%) |
| 45 to 54 Years | 204 (18.4%) | 798 (71.9%) |
| 55 to 64 Years | 313 (24.7%) | 917 (72.5%) |
| 65 to 74 Years | 944 (95.8%) | 625 (63.4%) |
| 75 Years and over | 699 (98.7%) | 396 (55.9%) |
| Total | 3,323 (38.2%) | 5,767 (66.2%) |
Disability Status by Sex by Age in Caldwell County
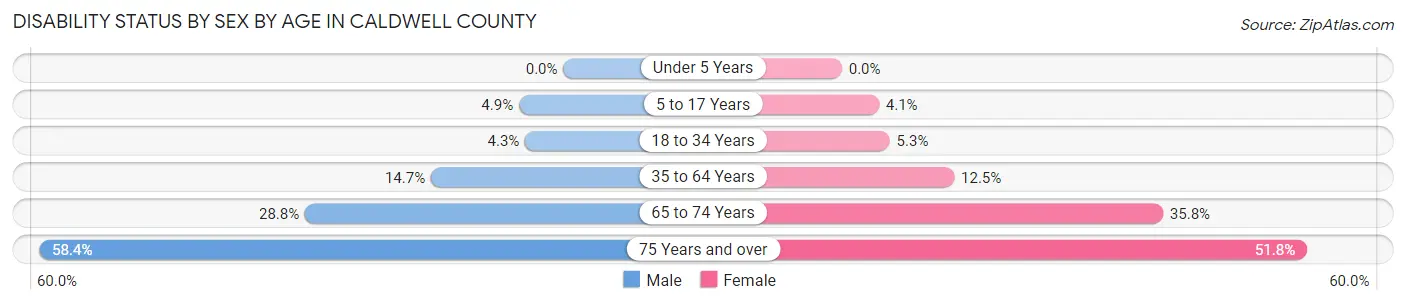
| Age Bracket | Male | Female |
| Under 5 Years | 0 (0.0%) | 0 (0.0%) |
| 5 to 17 Years | 43 (4.9%) | 30 (4.1%) |
| 18 to 34 Years | 35 (4.3%) | 40 (5.3%) |
| 35 to 64 Years | 246 (14.7%) | 210 (12.5%) |
| 65 to 74 Years | 145 (28.8%) | 172 (35.8%) |
| 75 Years and over | 188 (58.4%) | 200 (51.8%) |
Disability Class by Sex by Age in Caldwell County
Disability Class: Hearing Difficulty
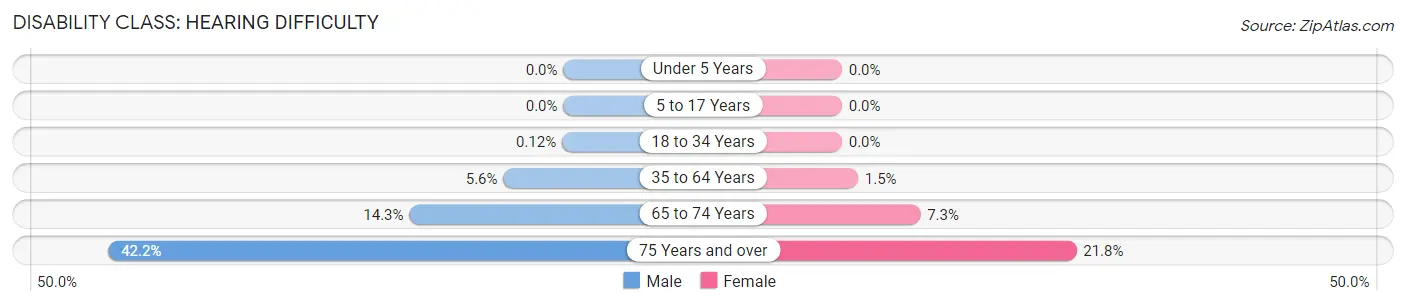
| Age Bracket | Male | Female |
| Under 5 Years | 0 (0.0%) | 0 (0.0%) |
| 5 to 17 Years | 0 (0.0%) | 0 (0.0%) |
| 18 to 34 Years | 1 (0.1%) | 0 (0.0%) |
| 35 to 64 Years | 93 (5.6%) | 25 (1.5%) |
| 65 to 74 Years | 72 (14.3%) | 35 (7.3%) |
| 75 Years and over | 136 (42.2%) | 84 (21.8%) |
Disability Class: Vision Difficulty
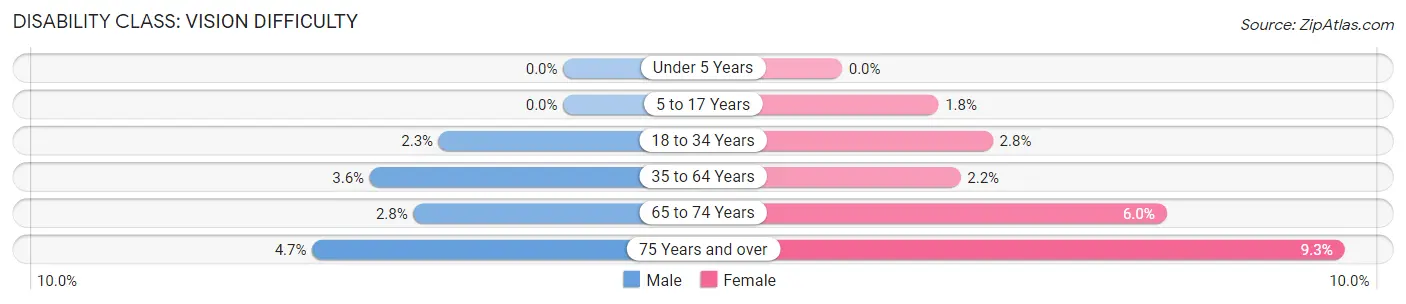
| Age Bracket | Male | Female |
| Under 5 Years | 0 (0.0%) | 0 (0.0%) |
| 5 to 17 Years | 0 (0.0%) | 13 (1.8%) |
| 18 to 34 Years | 19 (2.3%) | 21 (2.8%) |
| 35 to 64 Years | 60 (3.6%) | 37 (2.2%) |
| 65 to 74 Years | 14 (2.8%) | 29 (6.0%) |
| 75 Years and over | 15 (4.7%) | 36 (9.3%) |
Disability Class: Cognitive Difficulty
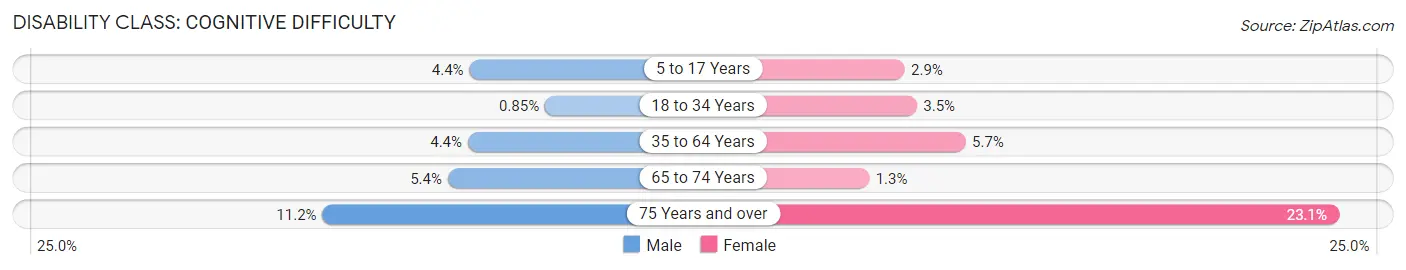
| Age Bracket | Male | Female |
| 5 to 17 Years | 38 (4.4%) | 21 (2.9%) |
| 18 to 34 Years | 7 (0.9%) | 26 (3.5%) |
| 35 to 64 Years | 74 (4.4%) | 96 (5.7%) |
| 65 to 74 Years | 27 (5.4%) | 6 (1.3%) |
| 75 Years and over | 36 (11.2%) | 89 (23.1%) |
Disability Class: Ambulatory Difficulty
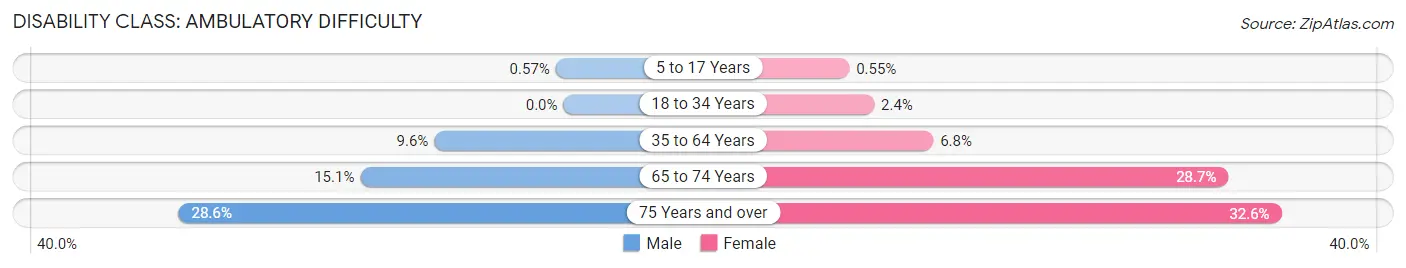
| Age Bracket | Male | Female |
| 5 to 17 Years | 5 (0.6%) | 4 (0.5%) |
| 18 to 34 Years | 0 (0.0%) | 18 (2.4%) |
| 35 to 64 Years | 160 (9.6%) | 114 (6.8%) |
| 65 to 74 Years | 76 (15.1%) | 138 (28.7%) |
| 75 Years and over | 92 (28.6%) | 126 (32.6%) |
Disability Class: Self-Care Difficulty
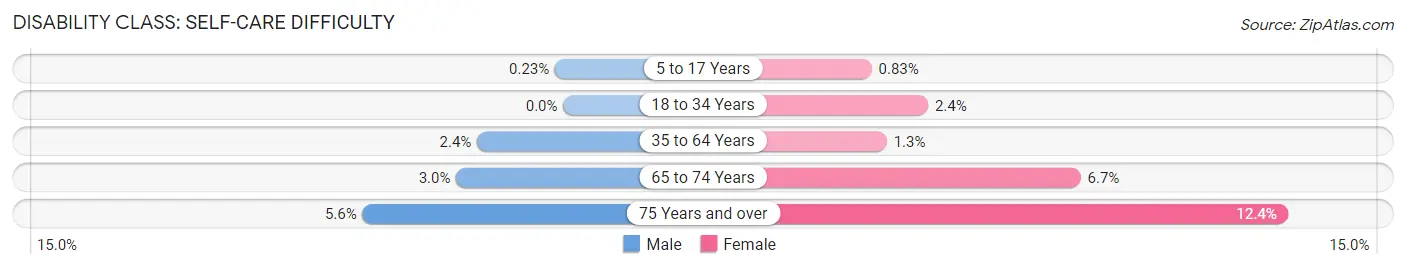
| Age Bracket | Male | Female |
| 5 to 17 Years | 2 (0.2%) | 6 (0.8%) |
| 18 to 34 Years | 0 (0.0%) | 18 (2.4%) |
| 35 to 64 Years | 40 (2.4%) | 21 (1.3%) |
| 65 to 74 Years | 15 (3.0%) | 32 (6.7%) |
| 75 Years and over | 18 (5.6%) | 48 (12.4%) |
Technology Access in Caldwell County
Computing Device Access in Caldwell County
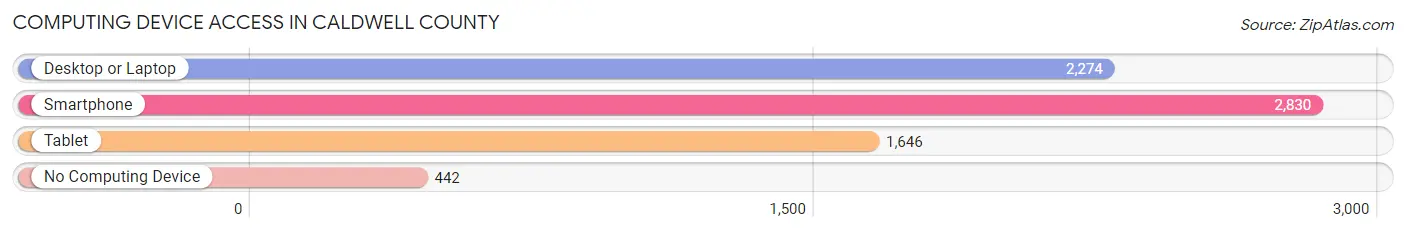
| Device Type | # Households | % Households |
| Desktop or Laptop | 2,274 | 65.3% |
| Smartphone | 2,830 | 81.3% |
| Tablet | 1,646 | 47.3% |
| No Computing Device | 442 | 12.7% |
| Total | 3,480 | 100.0% |
Internet Access in Caldwell County
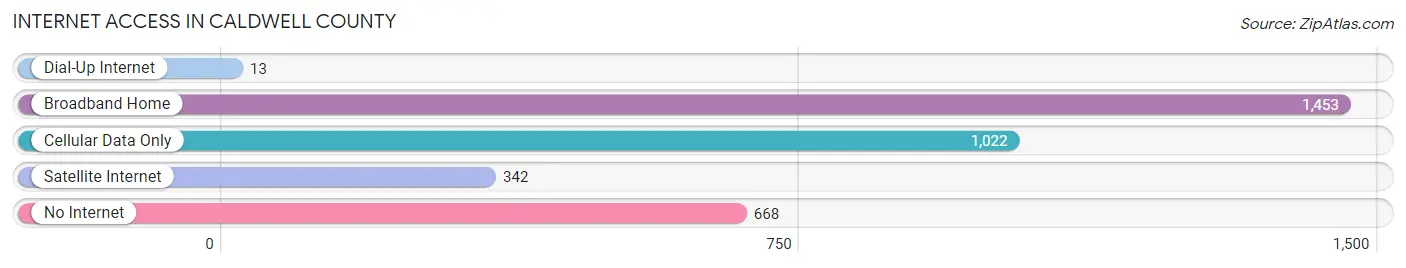
| Internet Type | # Households | % Households |
| Dial-Up Internet | 13 | 0.4% |
| Broadband Home | 1,453 | 41.7% |
| Cellular Data Only | 1,022 | 29.4% |
| Satellite Internet | 342 | 9.8% |
| No Internet | 668 | 19.2% |
| Total | 3,480 | 100.0% |
Caldwell County Summary
Caldwell County is located in northwest Missouri, and is part of the Kansas City metropolitan area. The county was established in 1836 and named after Senator Joseph Caldwell of North Carolina. As of the 2010 census, the population was 9,424, making it the second least populous county in Missouri.
Geography
Caldwell County is located in the northwest corner of Missouri, and is bordered by DeKalb County to the north, Clinton County to the east, Ray County to the south, and Andrew County to the west. The county has a total area of 441 square miles, of which 439 square miles is land and 2.2 square miles is water. The county is mostly rural, with the majority of the land being used for agriculture. The county is also home to several small towns, including Hamilton, Kingston, and Polo.
The county is located in the Osage Plains region of Missouri, and is characterized by rolling hills and open prairies. The county is drained by the Grand River, which flows through the county from north to south.
Demographics
As of the 2010 census, there were 9,424 people, 3,717 households, and 2,619 families residing in the county. The population density was 21.4 people per square mile. The racial makeup of the county was 97.3% White, 0.4% African American, 0.3% Native American, 0.2% Asian, 0.1% Pacific Islander, 0.4% from other races, and 1.3% from two or more races. Hispanic or Latino of any race were 1.3% of the population.
The median income for a household in the county was $41,945, and the median income for a family was $50,945. The per capita income for the county was $20,845. About 10.2% of families and 13.2% of the population were below the poverty line, including 17.2% of those under age 18 and 8.2% of those age 65 or over.
Economy
Caldwell County is primarily an agricultural county, with the majority of the land being used for farming and ranching. The county is home to several large farms, including the Caldwell County Farm, which is one of the largest in the state. The county is also home to several small businesses, including a few restaurants, convenience stores, and gas stations.
The county is also home to several manufacturing companies, including a plastics plant, a metal fabrication plant, and a paper mill. The county is also home to several small businesses, including a few restaurants, convenience stores, and gas stations.
History
Caldwell County was established in 1836 and named after Senator Joseph Caldwell of North Carolina. The county was originally part of Ray County, but was split off in 1836. The county was primarily an agricultural county, and the majority of the population was made up of farmers and ranchers.
In the late 19th century, the county saw an influx of immigrants, primarily from Germany and Ireland. These immigrants helped to shape the county's culture and economy, and many of their descendants still live in the county today.
In the early 20th century, the county saw an influx of African Americans, primarily from the South. These African Americans helped to shape the county's culture and economy, and many of their descendants still live in the county today.
In the late 20th century, the county saw an influx of Hispanic immigrants, primarily from Mexico. These immigrants helped to shape the county's culture and economy, and many of their descendants still live in the county today.
Today, Caldwell County is a rural county with a population of just over 9,000. The county is still primarily agricultural, but has seen an increase in small businesses and manufacturing in recent years. The county is also home to several small towns, including Hamilton, Kingston, and Polo.
Common Questions
What is Per Capita Income in Caldwell County?
Per Capita income in Caldwell County is $29,673.
What is the Median Family Income in Caldwell County?
Median Family Income in Caldwell County is $71,362.
What is the Median Household income in Caldwell County?
Median Household Income in Caldwell County is $58,269.
What is Income or Wage Gap in Caldwell County?
Income or Wage Gap in Caldwell County is 24.2%.
Women in Caldwell County earn 75.8 cents for every dollar earned by a man.
What is Family Income Deficit in Caldwell County?
Family Income Deficit in Caldwell County is $7,604.
Families that are below poverty line in Caldwell County earn $7,604 less on average than the poverty threshold level.
What is Inequality or Gini Index in Caldwell County?
Inequality or Gini Index in Caldwell County is 0.43.
What is the Total Population of Caldwell County?
Total Population of Caldwell County is 8,876.
What is the Total Male Population of Caldwell County?
Total Male Population of Caldwell County is 4,549.
What is the Total Female Population of Caldwell County?
Total Female Population of Caldwell County is 4,327.
What is the Ratio of Males per 100 Females in Caldwell County?
There are 105.13 Males per 100 Females in Caldwell County.
What is the Ratio of Females per 100 Males in Caldwell County?
There are 95.12 Females per 100 Males in Caldwell County.
What is the Median Population Age in Caldwell County?
Median Population Age in Caldwell County is 42.7 Years.
What is the Average Family Size in Caldwell County
Average Family Size in Caldwell County is 3.1 People.
What is the Average Household Size in Caldwell County
Average Household Size in Caldwell County is 2.5 People.
How Large is the Labor Force in Caldwell County?
There are 3,968 People in the Labor Forcein in Caldwell County.
What is the Percentage of People in the Labor Force in Caldwell County?
56.2% of People are in the Labor Force in Caldwell County.
What is the Unemployment Rate in Caldwell County?
Unemployment Rate in Caldwell County is 4.8%.