Buchanan County, MO Map & Demographics
Buchanan County Map
Buchanan County Overview
$31,886
PER CAPITA INCOME
$72,627
AVG FAMILY INCOME
$58,303
AVG HOUSEHOLD INCOME
25.6%
WAGE / INCOME GAP [ % ]
74.4¢/ $1
WAGE / INCOME GAP [ $ ]
$11,672
FAMILY INCOME DEFICIT
0.47
INEQUALITY / GINI INDEX
84,544
TOTAL POPULATION
42,811
MALE POPULATION
41,733
FEMALE POPULATION
102.58
MALES / 100 FEMALES
97.48
FEMALES / 100 MALES
38.6
MEDIAN AGE
3.1
AVG FAMILY SIZE
2.4
AVG HOUSEHOLD SIZE
40,947
LABOR FORCE [ PEOPLE ]
60.3%
PERCENT IN LABOR FORCE
4.8%
UNEMPLOYMENT RATE
Buchanan County Area Codes
Income in Buchanan County
Income Overview in Buchanan County
Per Capita Income in Buchanan County is $31,886, while median incomes of families and households are $72,627 and $58,303 respectively.
| Characteristic | Number | Measure |
| Per Capita Income | 84,544 | $31,886 |
| Median Family Income | 19,836 | $72,627 |
| Mean Family Income | 19,836 | $93,812 |
| Median Household Income | 33,363 | $58,303 |
| Mean Household Income | 33,363 | $78,291 |
| Income Deficit | 19,836 | $11,672 |
| Wage / Income Gap (%) | 84,544 | 25.59% |
| Wage / Income Gap ($) | 84,544 | 74.41¢ per $1 |
| Gini / Inequality Index | 84,544 | 0.47 |
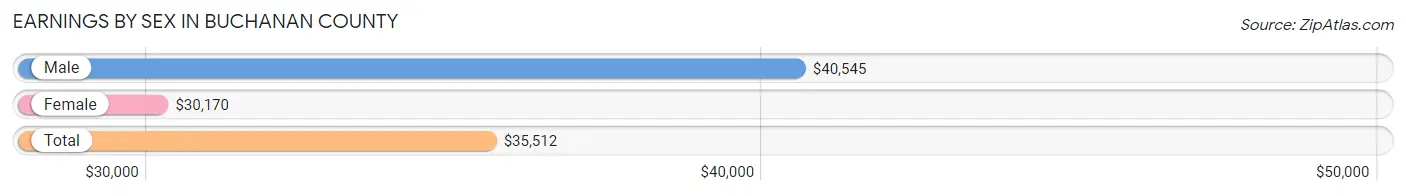
Earnings by Sex in Buchanan County
Average Earnings in Buchanan County are $35,512, $40,545 for men and $30,170 for women, a difference of 25.6%.
| Sex | Number | Average Earnings |
| Male | 23,784 (54.0%) | $40,545 |
| Female | 20,283 (46.0%) | $30,170 |
| Total | 44,067 (100.0%) | $35,512 |
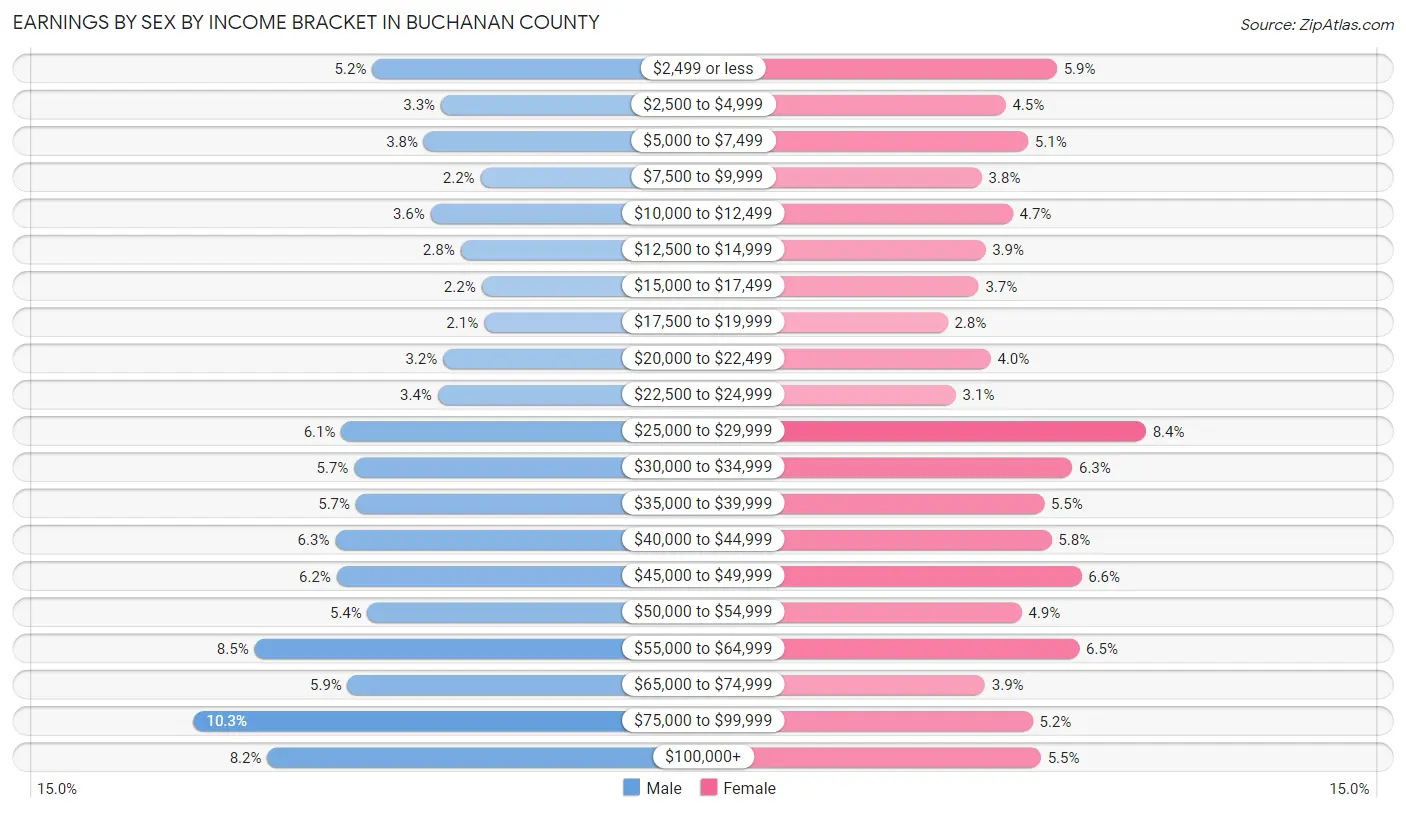
Earnings by Sex by Income Bracket in Buchanan County
The most common earnings brackets in Buchanan County are $75,000 to $99,999 for men (2,438 | 10.2%) and $25,000 to $29,999 for women (1,704 | 8.4%).
| Income | Male | Female |
| $2,499 or less | 1,244 (5.2%) | 1,196 (5.9%) |
| $2,500 to $4,999 | 786 (3.3%) | 904 (4.5%) |
| $5,000 to $7,499 | 899 (3.8%) | 1,032 (5.1%) |
| $7,500 to $9,999 | 521 (2.2%) | 769 (3.8%) |
| $10,000 to $12,499 | 855 (3.6%) | 946 (4.7%) |
| $12,500 to $14,999 | 653 (2.8%) | 788 (3.9%) |
| $15,000 to $17,499 | 513 (2.2%) | 750 (3.7%) |
| $17,500 to $19,999 | 496 (2.1%) | 573 (2.8%) |
| $20,000 to $22,499 | 771 (3.2%) | 819 (4.0%) |
| $22,500 to $24,999 | 806 (3.4%) | 621 (3.1%) |
| $25,000 to $29,999 | 1,452 (6.1%) | 1,704 (8.4%) |
| $30,000 to $34,999 | 1,366 (5.7%) | 1,284 (6.3%) |
| $35,000 to $39,999 | 1,354 (5.7%) | 1,123 (5.5%) |
| $40,000 to $44,999 | 1,491 (6.3%) | 1,166 (5.8%) |
| $45,000 to $49,999 | 1,481 (6.2%) | 1,336 (6.6%) |
| $50,000 to $54,999 | 1,274 (5.4%) | 996 (4.9%) |
| $55,000 to $64,999 | 2,032 (8.5%) | 1,325 (6.5%) |
| $65,000 to $74,999 | 1,407 (5.9%) | 787 (3.9%) |
| $75,000 to $99,999 | 2,438 (10.2%) | 1,059 (5.2%) |
| $100,000+ | 1,945 (8.2%) | 1,105 (5.4%) |
| Total | 23,784 (100.0%) | 20,283 (100.0%) |
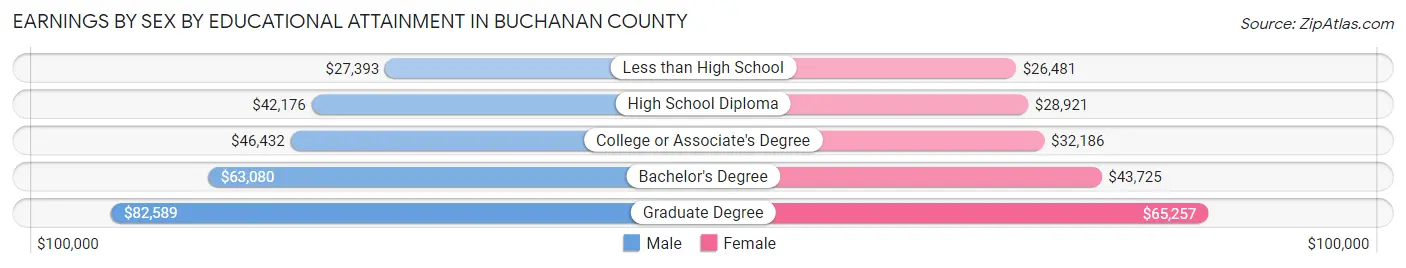
Earnings by Sex by Educational Attainment in Buchanan County
Average earnings in Buchanan County are $45,855 for men and $35,751 for women, a difference of 22.0%. Men with an educational attainment of graduate degree enjoy the highest average annual earnings of $82,589, while those with less than high school education earn the least with $27,393. Women with an educational attainment of graduate degree earn the most with the average annual earnings of $65,257, while those with less than high school education have the smallest earnings of $26,481.
| Educational Attainment | Male Income | Female Income |
| Less than High School | $27,393 | $26,481 |
| High School Diploma | $42,176 | $28,921 |
| College or Associate's Degree | $46,432 | $32,186 |
| Bachelor's Degree | $63,080 | $43,725 |
| Graduate Degree | $82,589 | $65,257 |
| Total | $45,855 | $35,751 |
Family Income in Buchanan County
Family Income Brackets in Buchanan County
According to the Buchanan County family income data, there are 3,809 families falling into the $50,000 to $74,999 income range, which is the most common income bracket and makes up 19.2% of all families. Conversely, the $10,000 to $14,999 income bracket is the least frequent group with only 555 families (2.8%) belonging to this category.
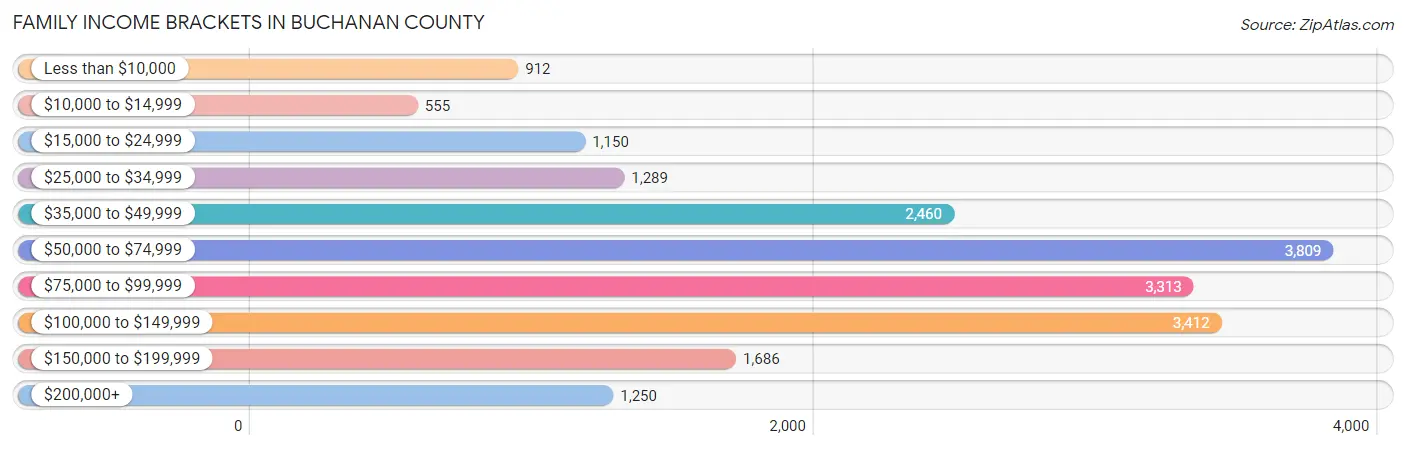
| Income Bracket | # Families | % Families |
| Less than $10,000 | 912 | 4.6% |
| $10,000 to $14,999 | 555 | 2.8% |
| $15,000 to $24,999 | 1,150 | 5.8% |
| $25,000 to $34,999 | 1,289 | 6.5% |
| $35,000 to $49,999 | 2,460 | 12.4% |
| $50,000 to $74,999 | 3,809 | 19.2% |
| $75,000 to $99,999 | 3,313 | 16.7% |
| $100,000 to $149,999 | 3,412 | 17.2% |
| $150,000 to $199,999 | 1,686 | 8.5% |
| $200,000+ | 1,250 | 6.3% |
Family Income by Famaliy Size in Buchanan County
7+ person families (353 | 1.8%) account for the highest median family income in Buchanan County with $118,545 per family, while 2-person families (9,932 | 50.1%) have the highest median income of $32,743 per family member.
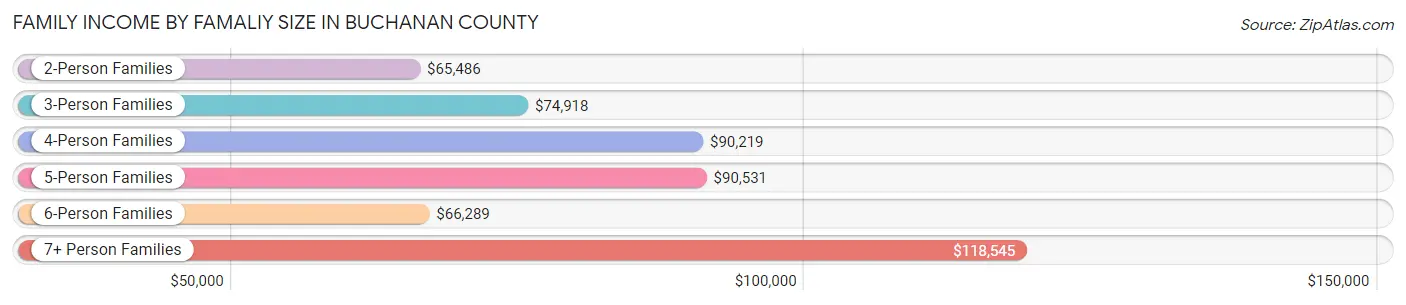
| Income Bracket | # Families | Median Income |
| 2-Person Families | 9,932 (50.1%) | $65,486 |
| 3-Person Families | 4,380 (22.1%) | $74,918 |
| 4-Person Families | 3,305 (16.7%) | $90,219 |
| 5-Person Families | 1,333 (6.7%) | $90,531 |
| 6-Person Families | 533 (2.7%) | $66,289 |
| 7+ Person Families | 353 (1.8%) | $118,545 |
| Total | 19,836 (100.0%) | $72,627 |
Family Income by Number of Earners in Buchanan County
The median family income in Buchanan County is $72,627, with families comprising 3+ earners (2,183) having the highest median family income of $132,116, while families with no earners (3,080) have the lowest median family income of $43,989, accounting for 11.0% and 15.5% of families, respectively.
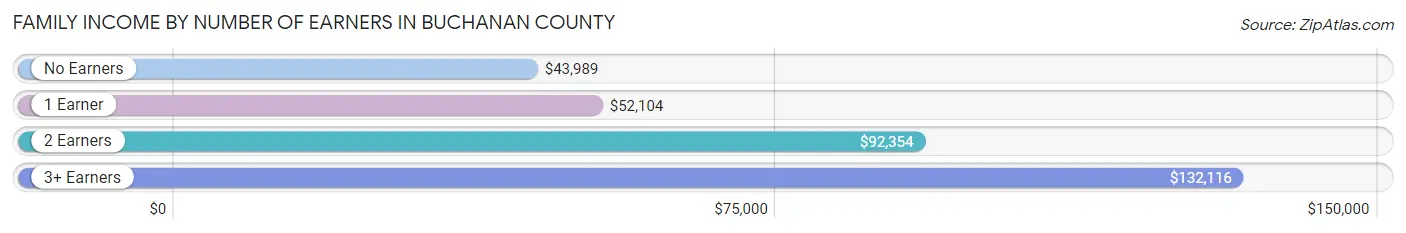
| Number of Earners | # Families | Median Income |
| No Earners | 3,080 (15.5%) | $43,989 |
| 1 Earner | 7,169 (36.1%) | $52,104 |
| 2 Earners | 7,404 (37.3%) | $92,354 |
| 3+ Earners | 2,183 (11.0%) | $132,116 |
| Total | 19,836 (100.0%) | $72,627 |
Household Income in Buchanan County
Household Income Brackets in Buchanan County
With 5,772 households falling in the category, the $50,000 to $74,999 income range is the most frequent in Buchanan County, accounting for 17.3% of all households. In contrast, only 1,635 households (4.9%) fall into the $200,000+ income bracket, making it the least populous group.
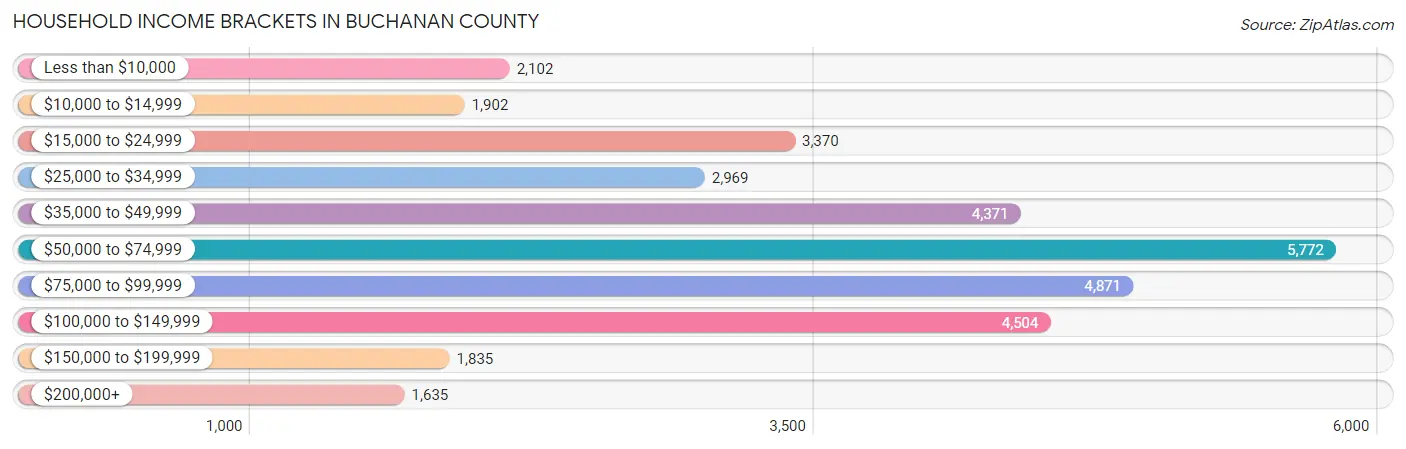
| Income Bracket | # Households | % Households |
| Less than $10,000 | 2,102 | 6.3% |
| $10,000 to $14,999 | 1,902 | 5.7% |
| $15,000 to $24,999 | 3,370 | 10.1% |
| $25,000 to $34,999 | 2,969 | 8.9% |
| $35,000 to $49,999 | 4,371 | 13.1% |
| $50,000 to $74,999 | 5,772 | 17.3% |
| $75,000 to $99,999 | 4,871 | 14.6% |
| $100,000 to $149,999 | 4,504 | 13.5% |
| $150,000 to $199,999 | 1,835 | 5.5% |
| $200,000+ | 1,635 | 4.9% |
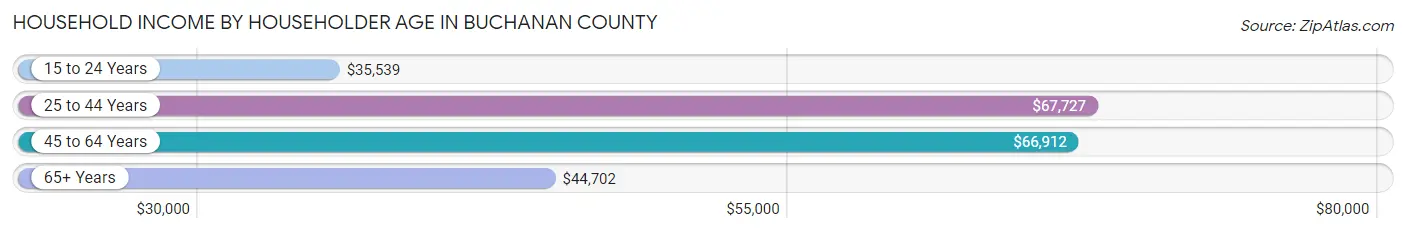
Household Income by Householder Age in Buchanan County
The median household income in Buchanan County is $58,303, with the highest median household income of $67,727 found in the 25 to 44 years age bracket for the primary householder. A total of 10,271 households (30.8%) fall into this category. Meanwhile, the 15 to 24 years age bracket for the primary householder has the lowest median household income of $35,539, with 1,945 households (5.8%) in this group.
| Income Bracket | # Households | Median Income |
| 15 to 24 Years | 1,945 (5.8%) | $35,539 |
| 25 to 44 Years | 10,271 (30.8%) | $67,727 |
| 45 to 64 Years | 12,036 (36.1%) | $66,912 |
| 65+ Years | 9,111 (27.3%) | $44,702 |
| Total | 33,363 (100.0%) | $58,303 |
Poverty in Buchanan County
Income Below Poverty by Sex and Age in Buchanan County
With 14.7% poverty level for males and 18.4% for females among the residents of Buchanan County, 15 year old males and under 5 year old females are the most vulnerable to poverty, with 108 males (30.2%) and 700 females (29.0%) in their respective age groups living below the poverty level.
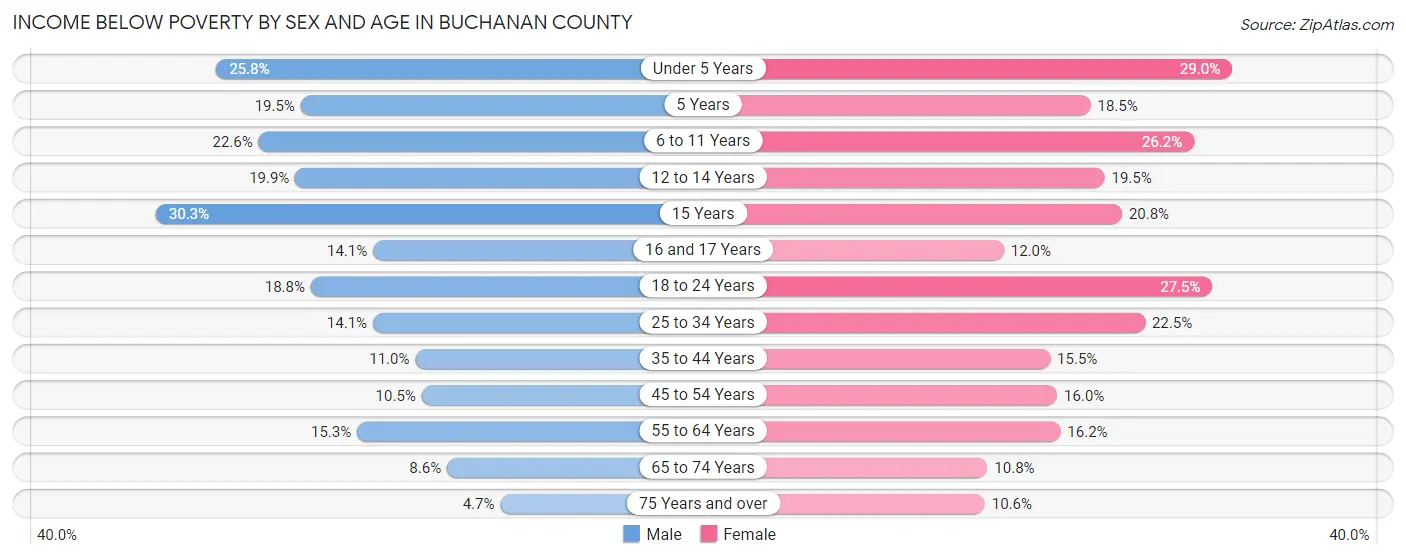
| Age Bracket | Male | Female |
| Under 5 Years | 683 (25.8%) | 700 (29.0%) |
| 5 Years | 78 (19.5%) | 82 (18.5%) |
| 6 to 11 Years | 736 (22.6%) | 754 (26.2%) |
| 12 to 14 Years | 325 (19.9%) | 344 (19.5%) |
| 15 Years | 108 (30.2%) | 83 (20.8%) |
| 16 and 17 Years | 168 (14.1%) | 140 (12.0%) |
| 18 to 24 Years | 708 (18.8%) | 940 (27.5%) |
| 25 to 34 Years | 727 (14.1%) | 1,181 (22.5%) |
| 35 to 44 Years | 584 (11.0%) | 761 (15.5%) |
| 45 to 54 Years | 516 (10.5%) | 788 (16.0%) |
| 55 to 64 Years | 847 (15.3%) | 901 (16.2%) |
| 65 to 74 Years | 331 (8.6%) | 467 (10.8%) |
| 75 Years and over | 101 (4.7%) | 345 (10.6%) |
| Total | 5,912 (14.7%) | 7,486 (18.4%) |
Income Above Poverty by Sex and Age in Buchanan County
According to the poverty statistics in Buchanan County, males aged 75 years and over and females aged 75 years and over are the age groups that are most secure financially, with 95.3% of males and 89.4% of females in these age groups living above the poverty line.
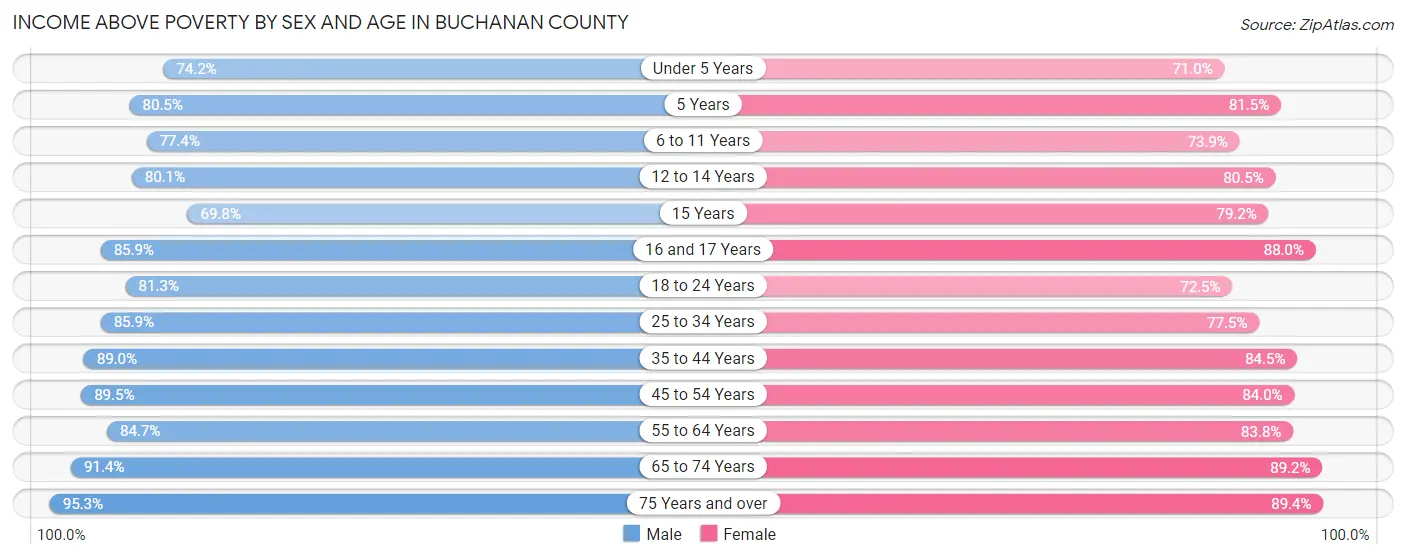
| Age Bracket | Male | Female |
| Under 5 Years | 1,967 (74.2%) | 1,716 (71.0%) |
| 5 Years | 322 (80.5%) | 362 (81.5%) |
| 6 to 11 Years | 2,516 (77.4%) | 2,129 (73.9%) |
| 12 to 14 Years | 1,307 (80.1%) | 1,419 (80.5%) |
| 15 Years | 249 (69.8%) | 316 (79.2%) |
| 16 and 17 Years | 1,021 (85.9%) | 1,024 (88.0%) |
| 18 to 24 Years | 3,069 (81.2%) | 2,477 (72.5%) |
| 25 to 34 Years | 4,416 (85.9%) | 4,066 (77.5%) |
| 35 to 44 Years | 4,731 (89.0%) | 4,159 (84.5%) |
| 45 to 54 Years | 4,389 (89.5%) | 4,139 (84.0%) |
| 55 to 64 Years | 4,681 (84.7%) | 4,649 (83.8%) |
| 65 to 74 Years | 3,500 (91.4%) | 3,853 (89.2%) |
| 75 Years and over | 2,055 (95.3%) | 2,904 (89.4%) |
| Total | 34,223 (85.3%) | 33,213 (81.6%) |
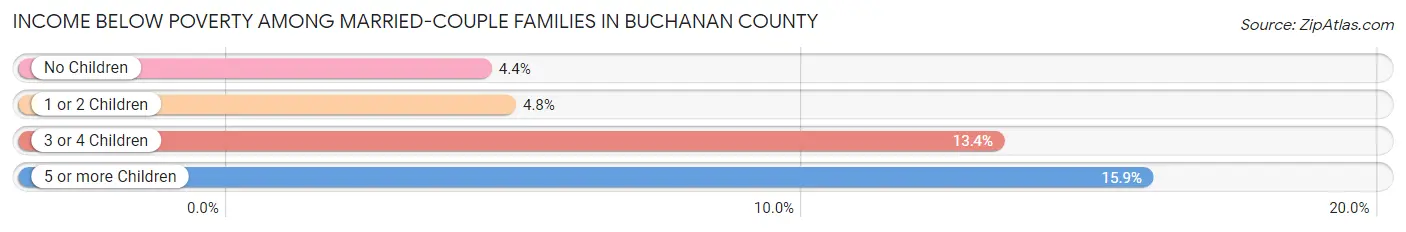
Income Below Poverty Among Married-Couple Families in Buchanan County
The poverty statistics for married-couple families in Buchanan County show that 5.4% or 747 of the total 13,838 families live below the poverty line. Families with 5 or more children have the highest poverty rate of 15.9%, comprising of 22 families. On the other hand, families with no children have the lowest poverty rate of 4.4%, which includes 379 families.
| Children | Above Poverty | Below Poverty |
| No Children | 8,188 (95.6%) | 379 (4.4%) |
| 1 or 2 Children | 3,794 (95.2%) | 193 (4.8%) |
| 3 or 4 Children | 993 (86.7%) | 153 (13.4%) |
| 5 or more Children | 116 (84.1%) | 22 (15.9%) |
| Total | 13,091 (94.6%) | 747 (5.4%) |
Income Below Poverty Among Single-Parent Households in Buchanan County
According to the poverty data in Buchanan County, 11.9% or 199 single-father households and 30.7% or 1,327 single-mother households are living below the poverty line. Among single-father households, those with 5 or more children have the highest poverty rate, with 73 households (100.0%) experiencing poverty. Likewise, among single-mother households, those with 5 or more children have the highest poverty rate, with 44 households (83.0%) falling below the poverty line.
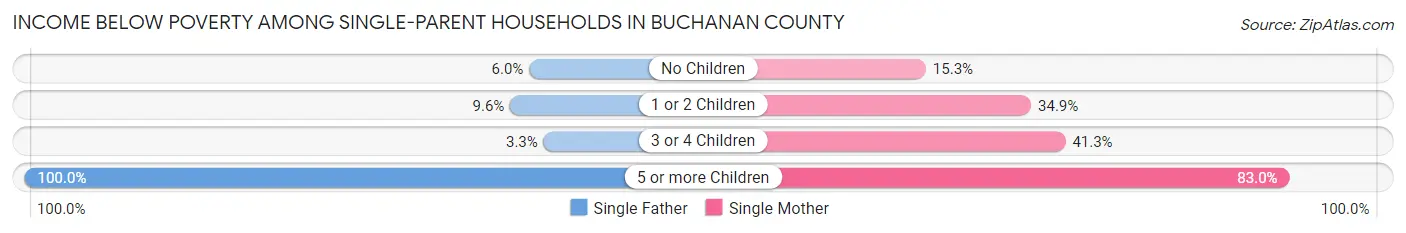
| Children | Single Father | Single Mother |
| No Children | 39 (6.0%) | 190 (15.3%) |
| 1 or 2 Children | 85 (9.6%) | 872 (34.9%) |
| 3 or 4 Children | 2 (3.3%) | 221 (41.3%) |
| 5 or more Children | 73 (100.0%) | 44 (83.0%) |
| Total | 199 (11.9%) | 1,327 (30.7%) |
Income Below Poverty Among Married-Couple vs Single-Parent Households in Buchanan County
The poverty data for Buchanan County shows that 747 of the married-couple family households (5.4%) and 1,526 of the single-parent households (25.4%) are living below the poverty level. Within the married-couple family households, those with 5 or more children have the highest poverty rate, with 22 households (15.9%) falling below the poverty line. Among the single-parent households, those with 5 or more children have the highest poverty rate, with 117 household (92.9%) living below poverty.
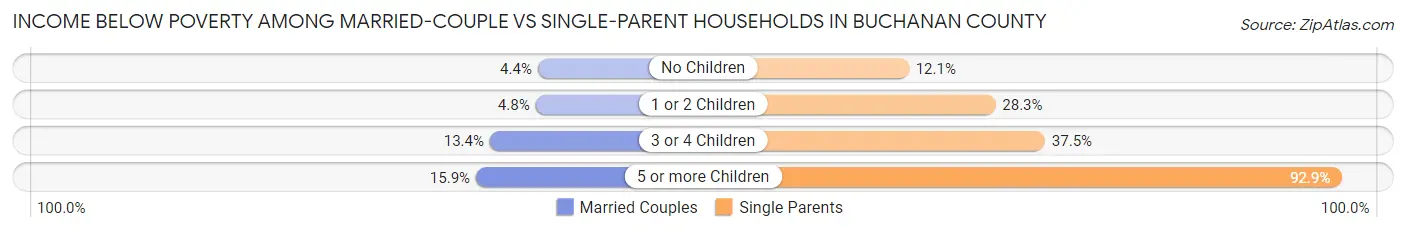
| Children | Married-Couple Families | Single-Parent Households |
| No Children | 379 (4.4%) | 229 (12.1%) |
| 1 or 2 Children | 193 (4.8%) | 957 (28.2%) |
| 3 or 4 Children | 153 (13.4%) | 223 (37.5%) |
| 5 or more Children | 22 (15.9%) | 117 (92.9%) |
| Total | 747 (5.4%) | 1,526 (25.4%) |
Race in Buchanan County
The most populous races in Buchanan County are White / Caucasian (70,318 | 83.2%), Hispanic or Latino (5,900 | 7.0%), and Two or more Races (5,266 | 6.2%).
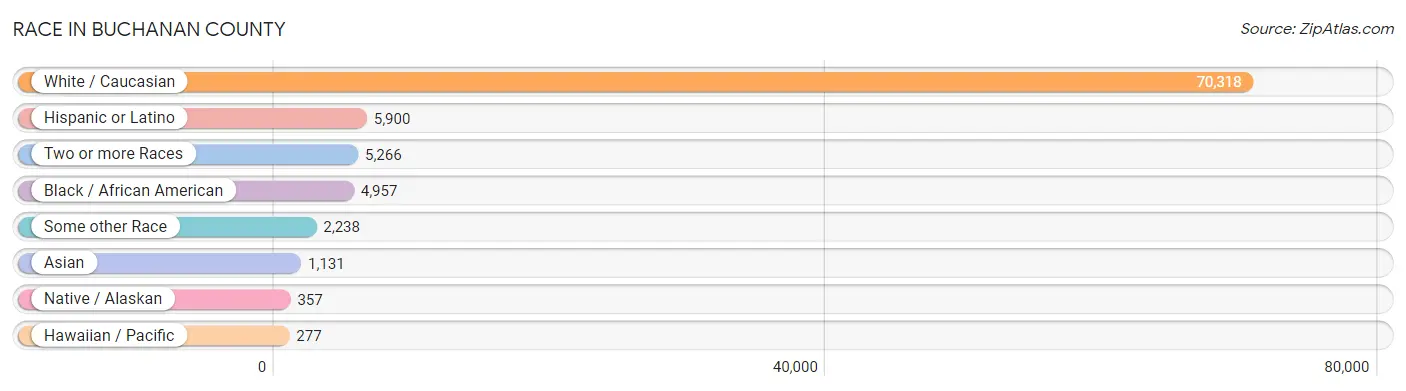
| Race | # Population | % Population |
| Asian | 1,131 | 1.3% |
| Black / African American | 4,957 | 5.9% |
| Hawaiian / Pacific | 277 | 0.3% |
| Hispanic or Latino | 5,900 | 7.0% |
| Native / Alaskan | 357 | 0.4% |
| White / Caucasian | 70,318 | 83.2% |
| Two or more Races | 5,266 | 6.2% |
| Some other Race | 2,238 | 2.6% |
| Total | 84,544 | 100.0% |
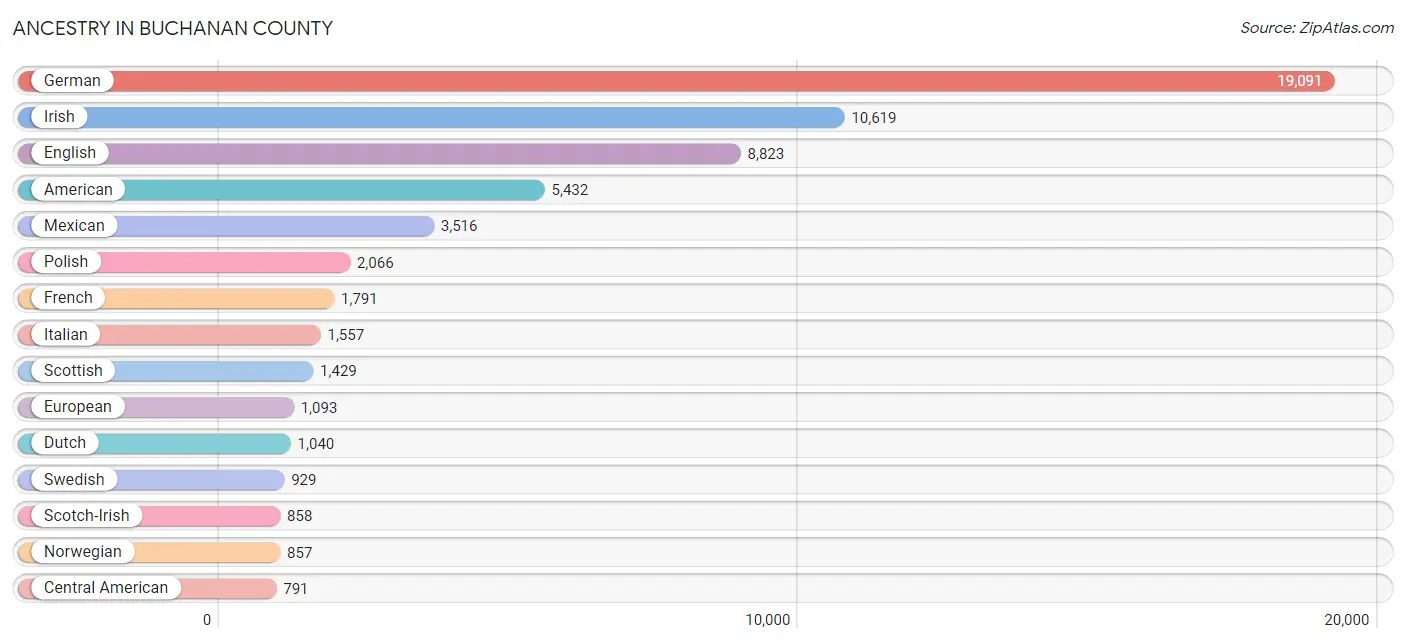
Ancestry in Buchanan County
The most populous ancestries reported in Buchanan County are German (19,091 | 22.6%), Irish (10,619 | 12.6%), English (8,823 | 10.4%), American (5,432 | 6.4%), and Mexican (3,516 | 4.2%), together accounting for 56.2% of all Buchanan County residents.
| Ancestry | # Population | % Population |
| African | 194 | 0.2% |
| Alaska Native | 10 | 0.0% |
| Alsatian | 7 | 0.0% |
| American | 5,432 | 6.4% |
| Apache | 29 | 0.0% |
| Arab | 89 | 0.1% |
| Armenian | 11 | 0.0% |
| Australian | 14 | 0.0% |
| Austrian | 86 | 0.1% |
| Belgian | 64 | 0.1% |
| Bhutanese | 313 | 0.4% |
| Blackfeet | 156 | 0.2% |
| Brazilian | 48 | 0.1% |
| British | 317 | 0.4% |
| Burmese | 86 | 0.1% |
| Cajun | 9 | 0.0% |
| Canadian | 20 | 0.0% |
| Celtic | 11 | 0.0% |
| Central American | 791 | 0.9% |
| Central American Indian | 15 | 0.0% |
| Cherokee | 345 | 0.4% |
| Cheyenne | 1 | 0.0% |
| Chickasaw | 31 | 0.0% |
| Choctaw | 11 | 0.0% |
| Croatian | 152 | 0.2% |
| Crow | 124 | 0.2% |
| Cuban | 432 | 0.5% |
| Czech | 191 | 0.2% |
| Czechoslovakian | 52 | 0.1% |
| Danish | 194 | 0.2% |
| Dutch | 1,040 | 1.2% |
| Eastern European | 53 | 0.1% |
| English | 8,823 | 10.4% |
| Ethiopian | 223 | 0.3% |
| European | 1,093 | 1.3% |
| French | 1,791 | 2.1% |
| French American Indian | 14 | 0.0% |
| French Canadian | 159 | 0.2% |
| German | 19,091 | 22.6% |
| Ghanaian | 11 | 0.0% |
| Greek | 71 | 0.1% |
| Guamanian / Chamorro | 69 | 0.1% |
| Guatemalan | 138 | 0.2% |
| Haitian | 108 | 0.1% |
| Honduran | 11 | 0.0% |
| Hungarian | 55 | 0.1% |
| Indian (Asian) | 390 | 0.5% |
| Indonesian | 113 | 0.1% |
| Irish | 10,619 | 12.6% |
| Italian | 1,557 | 1.8% |
| Jamaican | 78 | 0.1% |
| Japanese | 9 | 0.0% |
| Korean | 250 | 0.3% |
| Lebanese | 24 | 0.0% |
| Lithuanian | 62 | 0.1% |
| Macedonian | 7 | 0.0% |
| Mexican | 3,516 | 4.2% |
| Mexican American Indian | 52 | 0.1% |
| Moroccan | 46 | 0.1% |
| Native Hawaiian | 324 | 0.4% |
| Navajo | 71 | 0.1% |
| Nicaraguan | 6 | 0.0% |
| Nigerian | 5 | 0.0% |
| Northern European | 64 | 0.1% |
| Norwegian | 857 | 1.0% |
| Paiute | 110 | 0.1% |
| Pakistani | 47 | 0.1% |
| Panamanian | 44 | 0.1% |
| Pima | 6 | 0.0% |
| Polish | 2,066 | 2.4% |
| Portuguese | 42 | 0.1% |
| Potawatomi | 49 | 0.1% |
| Pueblo | 8 | 0.0% |
| Puerto Rican | 520 | 0.6% |
| Romanian | 49 | 0.1% |
| Russian | 200 | 0.2% |
| Salvadoran | 592 | 0.7% |
| Samoan | 10 | 0.0% |
| Scandinavian | 236 | 0.3% |
| Scotch-Irish | 858 | 1.0% |
| Scottish | 1,429 | 1.7% |
| Sioux | 24 | 0.0% |
| Slavic | 32 | 0.0% |
| South African | 13 | 0.0% |
| South American | 18 | 0.0% |
| Spaniard | 69 | 0.1% |
| Spanish | 44 | 0.1% |
| Sri Lankan | 264 | 0.3% |
| Subsaharan African | 494 | 0.6% |
| Sudanese | 25 | 0.0% |
| Swedish | 929 | 1.1% |
| Swiss | 428 | 0.5% |
| Syrian | 14 | 0.0% |
| Thai | 247 | 0.3% |
| Ukrainian | 165 | 0.2% |
| Venezuelan | 18 | 0.0% |
| Vietnamese | 46 | 0.1% |
| Welsh | 376 | 0.4% |
| West Indian | 14 | 0.0% |
| Yugoslavian | 67 | 0.1% | View All 100 Rows |
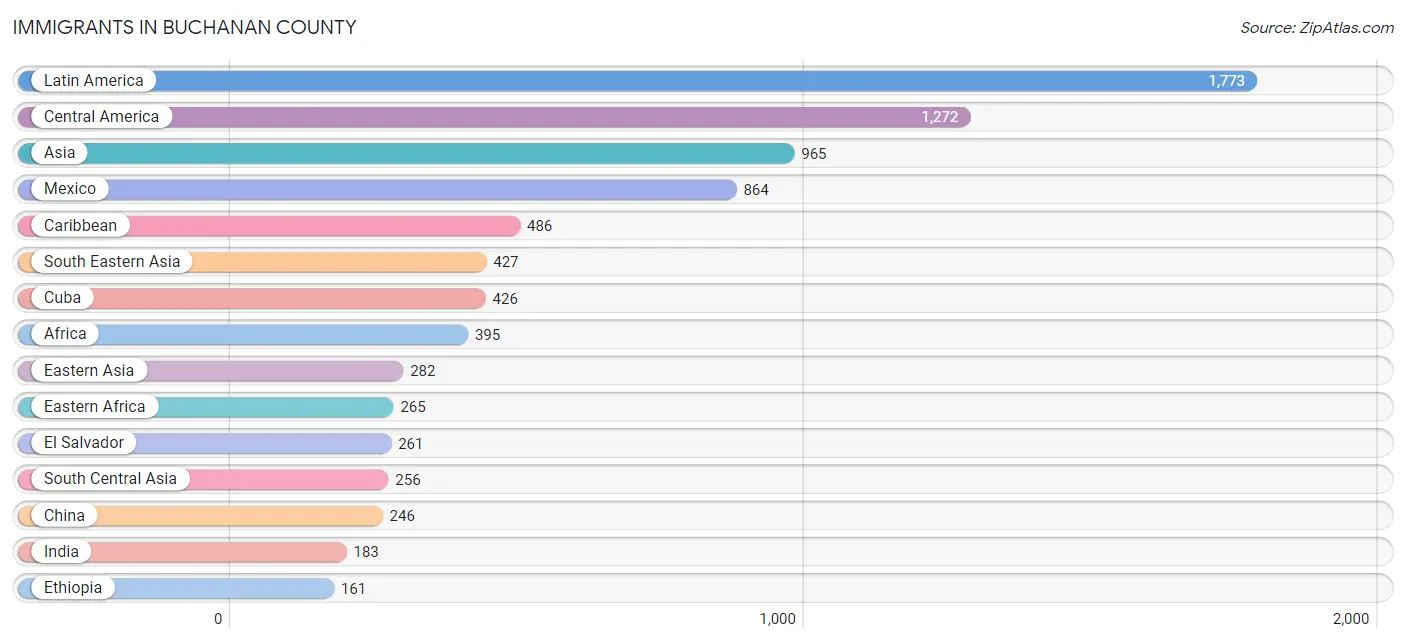
Immigrants in Buchanan County
The most numerous immigrant groups reported in Buchanan County came from Latin America (1,773 | 2.1%), Central America (1,272 | 1.5%), Asia (965 | 1.1%), Mexico (864 | 1.0%), and Caribbean (486 | 0.6%), together accounting for 6.3% of all Buchanan County residents.
| Immigration Origin | # Population | % Population |
| Africa | 395 | 0.5% |
| Asia | 965 | 1.1% |
| Bangladesh | 46 | 0.1% |
| Bosnia and Herzegovina | 14 | 0.0% |
| Canada | 10 | 0.0% |
| Caribbean | 486 | 0.6% |
| Central America | 1,272 | 1.5% |
| China | 246 | 0.3% |
| Colombia | 15 | 0.0% |
| Congo | 23 | 0.0% |
| Cuba | 426 | 0.5% |
| Eastern Africa | 265 | 0.3% |
| Eastern Asia | 282 | 0.3% |
| Eastern Europe | 27 | 0.0% |
| El Salvador | 261 | 0.3% |
| Eritrea | 62 | 0.1% |
| Ethiopia | 161 | 0.2% |
| Europe | 74 | 0.1% |
| France | 9 | 0.0% |
| Germany | 32 | 0.0% |
| Ghana | 11 | 0.0% |
| Guatemala | 140 | 0.2% |
| Haiti | 46 | 0.1% |
| Honduras | 3 | 0.0% |
| Hong Kong | 78 | 0.1% |
| India | 183 | 0.2% |
| Japan | 22 | 0.0% |
| Kenya | 6 | 0.0% |
| Korea | 14 | 0.0% |
| Latin America | 1,773 | 2.1% |
| Malaysia | 59 | 0.1% |
| Mexico | 864 | 1.0% |
| Micronesia | 14 | 0.0% |
| Middle Africa | 23 | 0.0% |
| Morocco | 19 | 0.0% |
| Netherlands | 3 | 0.0% |
| Nigeria | 5 | 0.0% |
| North Macedonia | 4 | 0.0% |
| Northern Africa | 78 | 0.1% |
| Oceania | 20 | 0.0% |
| Philippines | 135 | 0.2% |
| Russia | 9 | 0.0% |
| South Africa | 13 | 0.0% |
| South America | 15 | 0.0% |
| South Central Asia | 256 | 0.3% |
| South Eastern Asia | 427 | 0.5% |
| Southern Europe | 3 | 0.0% |
| Spain | 3 | 0.0% |
| Sri Lanka | 12 | 0.0% |
| Sudan | 25 | 0.0% |
| Trinidad and Tobago | 14 | 0.0% |
| Vietnam | 148 | 0.2% |
| Western Africa | 16 | 0.0% |
| Western Europe | 44 | 0.1% | View All 54 Rows |
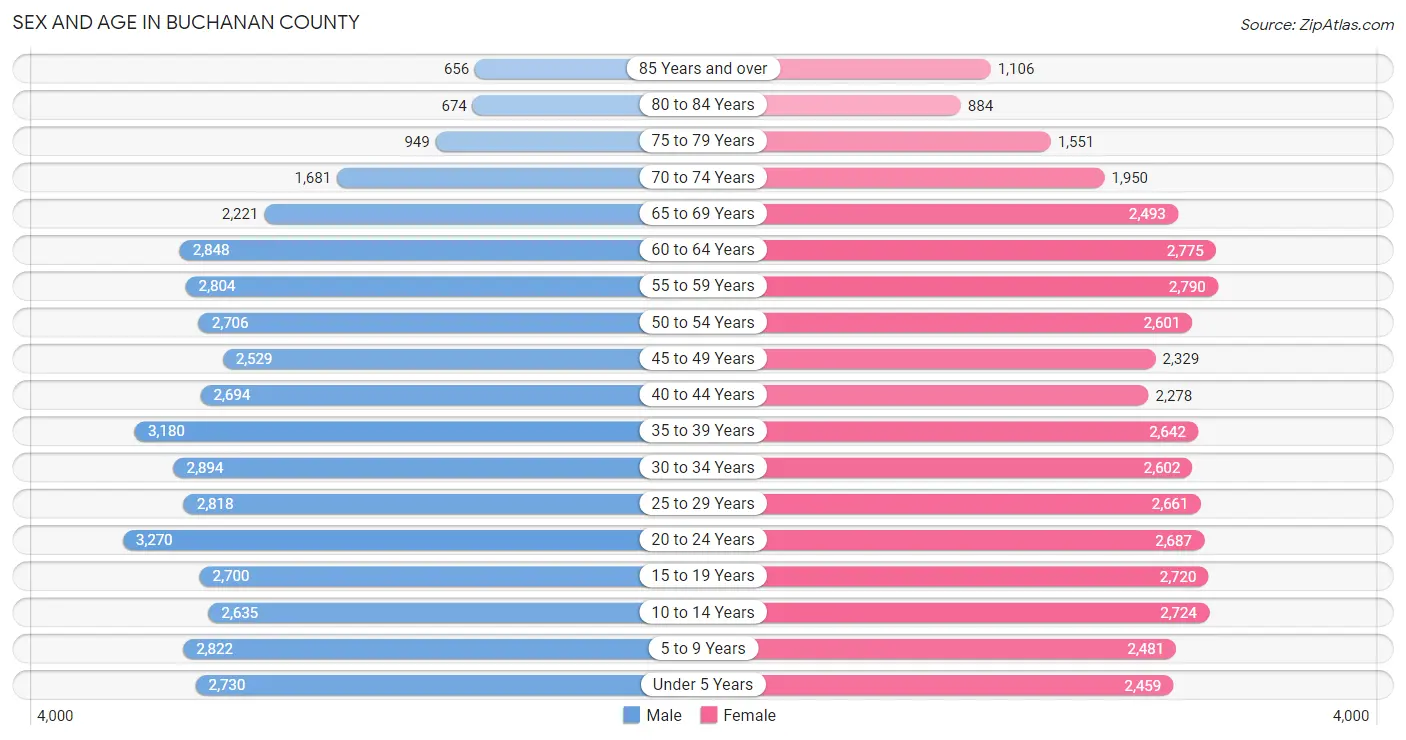
Sex and Age in Buchanan County
Sex and Age in Buchanan County
The most populous age groups in Buchanan County are 20 to 24 Years (3,270 | 7.6%) for men and 55 to 59 Years (2,790 | 6.7%) for women.
| Age Bracket | Male | Female |
| Under 5 Years | 2,730 (6.4%) | 2,459 (5.9%) |
| 5 to 9 Years | 2,822 (6.6%) | 2,481 (5.9%) |
| 10 to 14 Years | 2,635 (6.1%) | 2,724 (6.5%) |
| 15 to 19 Years | 2,700 (6.3%) | 2,720 (6.5%) |
| 20 to 24 Years | 3,270 (7.6%) | 2,687 (6.4%) |
| 25 to 29 Years | 2,818 (6.6%) | 2,661 (6.4%) |
| 30 to 34 Years | 2,894 (6.8%) | 2,602 (6.2%) |
| 35 to 39 Years | 3,180 (7.4%) | 2,642 (6.3%) |
| 40 to 44 Years | 2,694 (6.3%) | 2,278 (5.5%) |
| 45 to 49 Years | 2,529 (5.9%) | 2,329 (5.6%) |
| 50 to 54 Years | 2,706 (6.3%) | 2,601 (6.2%) |
| 55 to 59 Years | 2,804 (6.6%) | 2,790 (6.7%) |
| 60 to 64 Years | 2,848 (6.7%) | 2,775 (6.7%) |
| 65 to 69 Years | 2,221 (5.2%) | 2,493 (6.0%) |
| 70 to 74 Years | 1,681 (3.9%) | 1,950 (4.7%) |
| 75 to 79 Years | 949 (2.2%) | 1,551 (3.7%) |
| 80 to 84 Years | 674 (1.6%) | 884 (2.1%) |
| 85 Years and over | 656 (1.5%) | 1,106 (2.6%) |
| Total | 42,811 (100.0%) | 41,733 (100.0%) |
Families and Households in Buchanan County
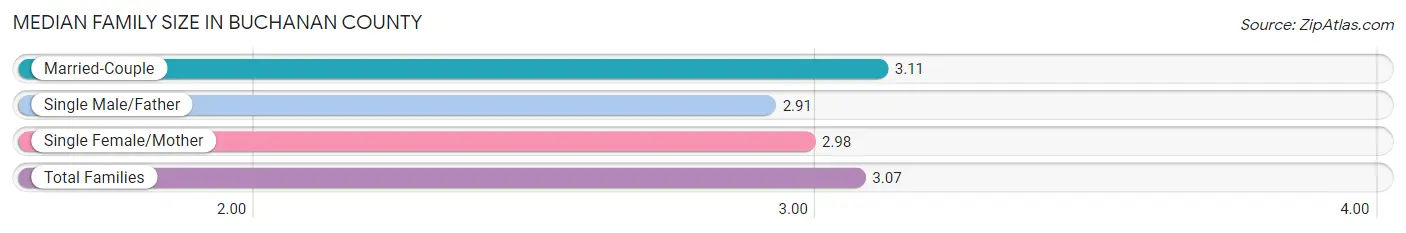
Median Family Size in Buchanan County
The median family size in Buchanan County is 3.07 persons per family, with married-couple families (13,838 | 69.8%) accounting for the largest median family size of 3.11 persons per family. On the other hand, single male/father families (1,672 | 8.4%) represent the smallest median family size with 2.91 persons per family.
| Family Type | # Families | Family Size |
| Married-Couple | 13,838 (69.8%) | 3.11 |
| Single Male/Father | 1,672 (8.4%) | 2.91 |
| Single Female/Mother | 4,326 (21.8%) | 2.98 |
| Total Families | 19,836 (100.0%) | 3.07 |
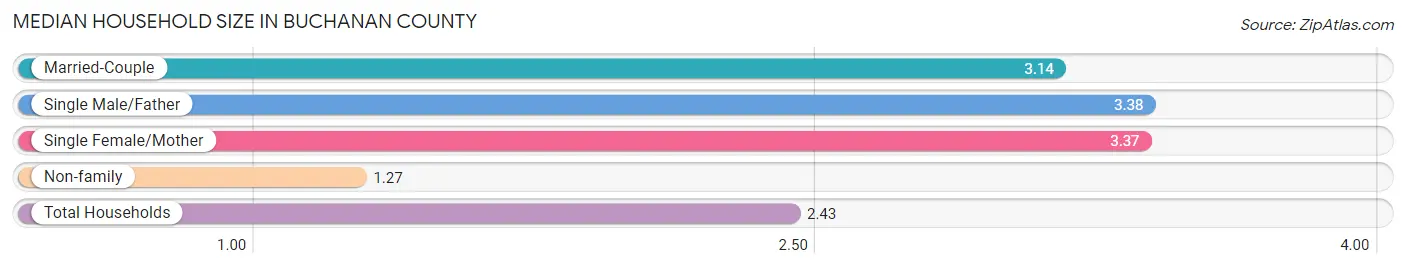
Median Household Size in Buchanan County
The median household size in Buchanan County is 2.43 persons per household, with single male/father households (1,672 | 5.0%) accounting for the largest median household size of 3.38 persons per household. non-family households (13,527 | 40.5%) represent the smallest median household size with 1.27 persons per household.
| Household Type | # Households | Household Size |
| Married-Couple | 13,838 (41.5%) | 3.14 |
| Single Male/Father | 1,672 (5.0%) | 3.38 |
| Single Female/Mother | 4,326 (13.0%) | 3.37 |
| Non-family | 13,527 (40.5%) | 1.27 |
| Total Households | 33,363 (100.0%) | 2.43 |
Household Size by Marriage Status in Buchanan County
Out of a total of 33,363 households in Buchanan County, 19,836 (59.5%) are family households, while 13,527 (40.5%) are nonfamily households. The most numerous type of family households are 2-person households, comprising 8,993, and the most common type of nonfamily households are 1-person households, comprising 10,797.
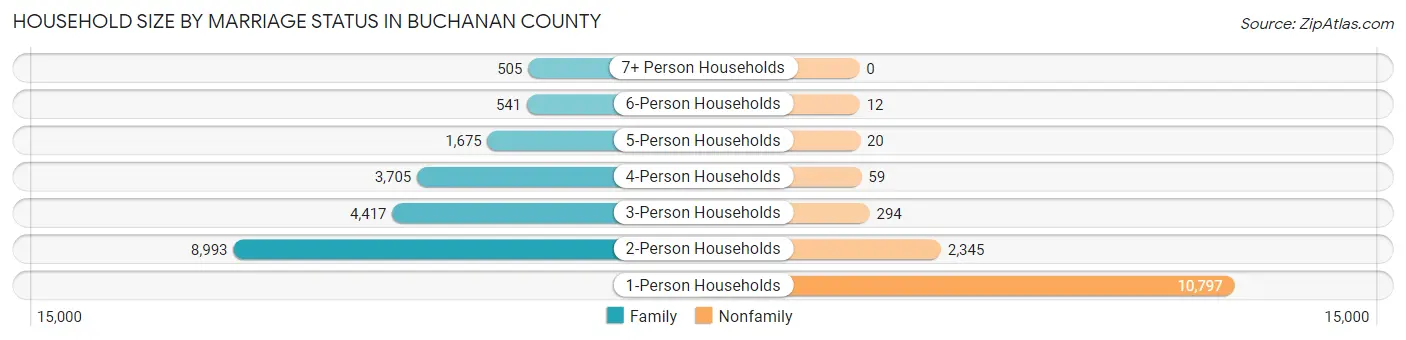
| Household Size | Family Households | Nonfamily Households |
| 1-Person Households | - | 10,797 (32.4%) |
| 2-Person Households | 8,993 (27.0%) | 2,345 (7.0%) |
| 3-Person Households | 4,417 (13.2%) | 294 (0.9%) |
| 4-Person Households | 3,705 (11.1%) | 59 (0.2%) |
| 5-Person Households | 1,675 (5.0%) | 20 (0.1%) |
| 6-Person Households | 541 (1.6%) | 12 (0.0%) |
| 7+ Person Households | 505 (1.5%) | 0 (0.0%) |
| Total | 19,836 (59.5%) | 13,527 (40.5%) |
Female Fertility in Buchanan County
Fertility by Age in Buchanan County
Average fertility rate in Buchanan County is 62.0 births per 1,000 women. Women in the age bracket of 20 to 34 years have the highest fertility rate with 128.0 births per 1,000 women. Women in the age bracket of 20 to 34 years acount for 89.2% of all women with births.
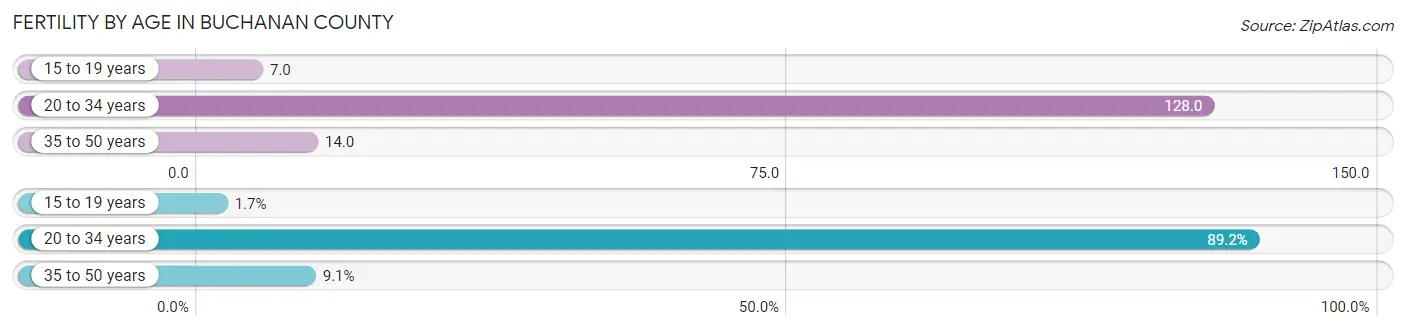
| Age Bracket | Women with Births | Births / 1,000 Women |
| 15 to 19 years | 19 (1.7%) | 7.0 |
| 20 to 34 years | 1,015 (89.2%) | 128.0 |
| 35 to 50 years | 104 (9.1%) | 14.0 |
| Total | 1,138 (100.0%) | 62.0 |
Fertility by Age by Marriage Status in Buchanan County
44.5% of women with births (1,138) in Buchanan County are married. The highest percentage of unmarried women with births falls into 15 to 19 years age bracket with 100.0% of them unmarried at the time of birth, while the lowest percentage of unmarried women with births belong to 35 to 50 years age bracket with 32.7% of them unmarried.
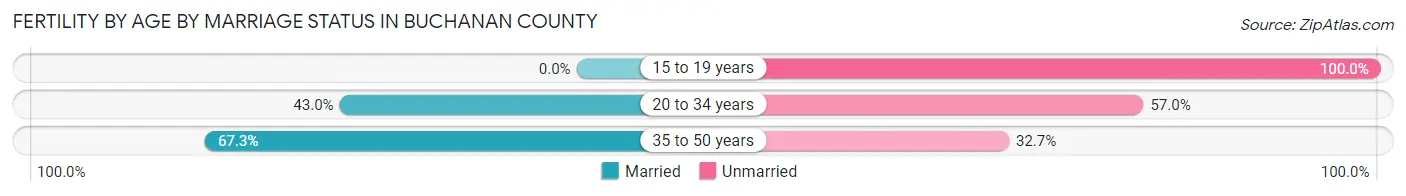
| Age Bracket | Married | Unmarried |
| 15 to 19 years | 0 (0.0%) | 19 (100.0%) |
| 20 to 34 years | 436 (43.0%) | 579 (57.0%) |
| 35 to 50 years | 70 (67.3%) | 34 (32.7%) |
| Total | 506 (44.5%) | 632 (55.5%) |
Fertility by Education in Buchanan County
Average fertility rate in Buchanan County is 62.0 births per 1,000 women. Women with the education attainment of college or associate's degree have the highest fertility rate of 83.0 births per 1,000 women, while women with the education attainment of graduate degree have the lowest fertility at 28.0 births per 1,000 women. Women with the education attainment of college or associate's degree represent 48.1% of all women with births.
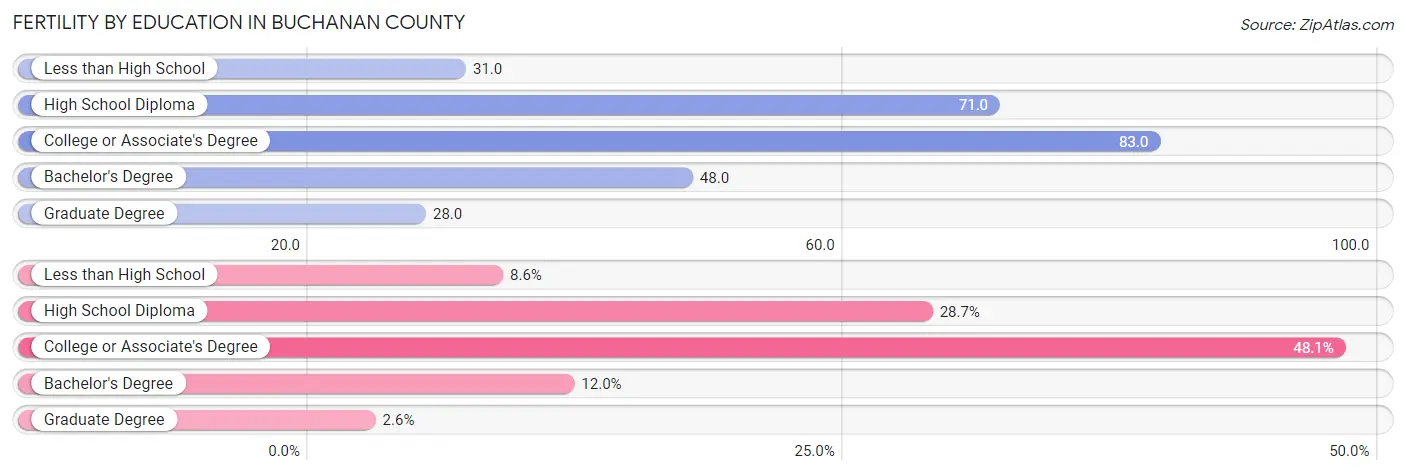
| Educational Attainment | Women with Births | Births / 1,000 Women |
| Less than High School | 98 (8.6%) | 31.0 |
| High School Diploma | 327 (28.7%) | 71.0 |
| College or Associate's Degree | 547 (48.1%) | 83.0 |
| Bachelor's Degree | 136 (11.9%) | 48.0 |
| Graduate Degree | 30 (2.6%) | 28.0 |
| Total | 1,138 (100.0%) | 62.0 |
Fertility by Education by Marriage Status in Buchanan County
55.5% of women with births in Buchanan County are unmarried. Women with the educational attainment of bachelor's degree are most likely to be married with 81.6% of them married at childbirth, while women with the educational attainment of less than high school are least likely to be married with 71.4% of them unmarried at childbirth.
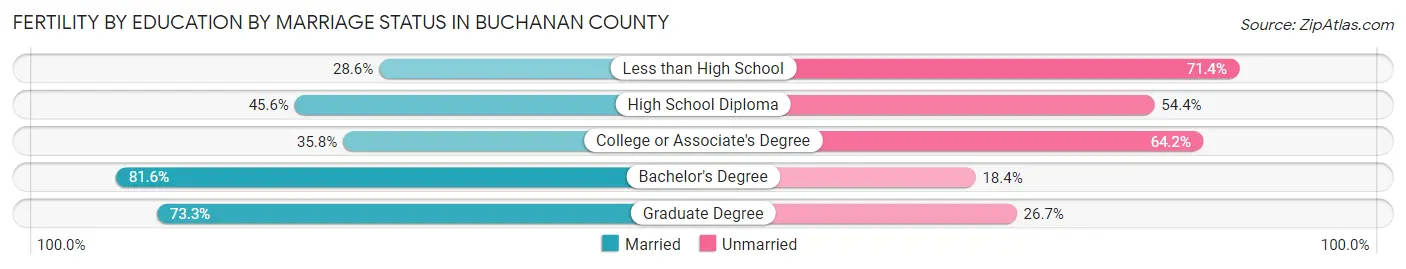
| Educational Attainment | Married | Unmarried |
| Less than High School | 28 (28.6%) | 70 (71.4%) |
| High School Diploma | 149 (45.6%) | 178 (54.4%) |
| College or Associate's Degree | 196 (35.8%) | 351 (64.2%) |
| Bachelor's Degree | 111 (81.6%) | 25 (18.4%) |
| Graduate Degree | 22 (73.3%) | 8 (26.7%) |
| Total | 506 (44.5%) | 632 (55.5%) |
Employment Characteristics in Buchanan County
Employment by Class of Employer in Buchanan County
Among the 38,201 employed individuals in Buchanan County, private company employees (27,137 | 71.0%), not-for-profit organizations (3,467 | 9.1%), and local government employees (2,259 | 5.9%) make up the most common classes of employment.
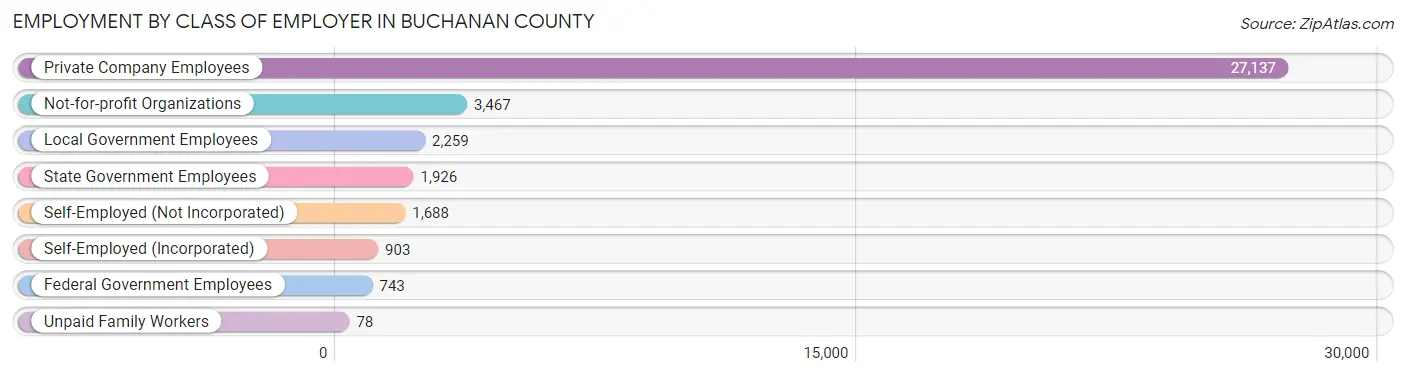
| Employer Class | # Employees | % Employees |
| Private Company Employees | 27,137 | 71.0% |
| Self-Employed (Incorporated) | 903 | 2.4% |
| Self-Employed (Not Incorporated) | 1,688 | 4.4% |
| Not-for-profit Organizations | 3,467 | 9.1% |
| Local Government Employees | 2,259 | 5.9% |
| State Government Employees | 1,926 | 5.0% |
| Federal Government Employees | 743 | 1.9% |
| Unpaid Family Workers | 78 | 0.2% |
| Total | 38,201 | 100.0% |
Employment Status by Age in Buchanan County
According to the labor force statistics for Buchanan County, out of the total population over 16 years of age (67,906), 60.3% or 40,947 individuals are in the labor force, with 4.8% or 1,965 of them unemployed. The age group with the highest labor force participation rate is 30 to 34 years, with 79.4% or 4,364 individuals in the labor force. Within the labor force, the 16 to 19 years age range has the highest percentage of unemployed individuals, with 12.4% or 249 of them being unemployed.
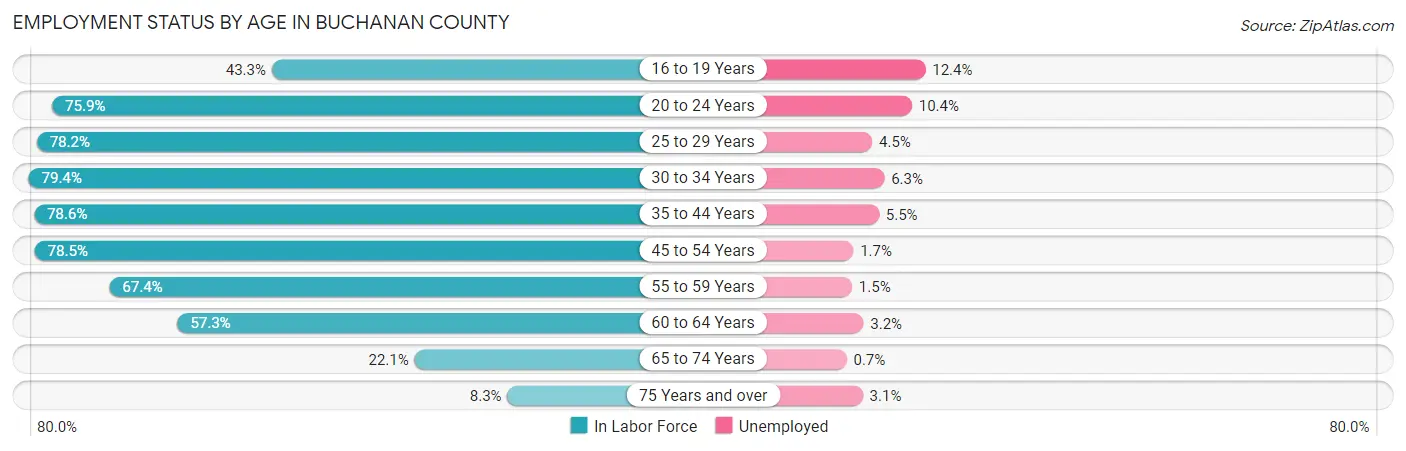
| Age Bracket | In Labor Force | Unemployed |
| 16 to 19 Years | 2,006 (43.3%) | 249 (12.4%) |
| 20 to 24 Years | 4,521 (75.9%) | 470 (10.4%) |
| 25 to 29 Years | 4,285 (78.2%) | 193 (4.5%) |
| 30 to 34 Years | 4,364 (79.4%) | 275 (6.3%) |
| 35 to 44 Years | 8,484 (78.6%) | 467 (5.5%) |
| 45 to 54 Years | 7,980 (78.5%) | 136 (1.7%) |
| 55 to 59 Years | 3,770 (67.4%) | 57 (1.5%) |
| 60 to 64 Years | 3,222 (57.3%) | 103 (3.2%) |
| 65 to 74 Years | 1,844 (22.1%) | 13 (0.7%) |
| 75 Years and over | 483 (8.3%) | 15 (3.1%) |
| Total | 40,947 (60.3%) | 1,965 (4.8%) |
Employment Status by Educational Attainment in Buchanan County
According to labor force statistics for Buchanan County, 74.4% of individuals (32,104) out of the total population between 25 and 64 years of age (43,151) are in the labor force, with 3.8% or 1,220 of them being unemployed. The group with the highest labor force participation rate are those with the educational attainment of bachelor's degree or higher, with 88.1% or 8,995 individuals in the labor force. Within the labor force, individuals with less than high school education have the highest percentage of unemployment, with 6.0% or 137 of them being unemployed.
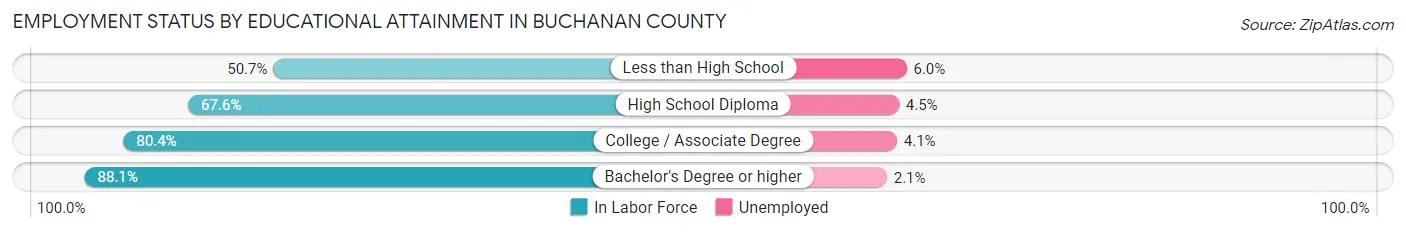
| Educational Attainment | In Labor Force | Unemployed |
| Less than High School | 2,279 (50.7%) | 270 (6.0%) |
| High School Diploma | 10,814 (67.6%) | 720 (4.5%) |
| College / Associate Degree | 10,009 (80.4%) | 510 (4.1%) |
| Bachelor's Degree or higher | 8,995 (88.1%) | 214 (2.1%) |
| Total | 32,104 (74.4%) | 1,640 (3.8%) |
Employment Occupations by Sex in Buchanan County
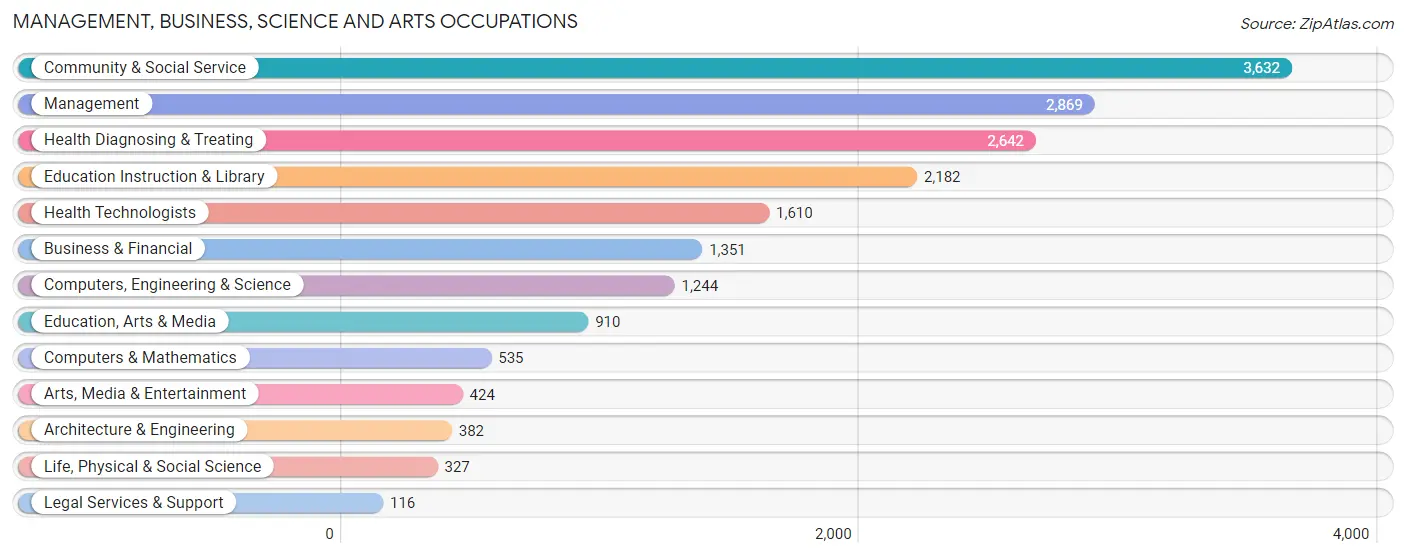
Management, Business, Science and Arts Occupations
The most common Management, Business, Science and Arts occupations in Buchanan County are Community & Social Service (3,632 | 9.4%), Management (2,869 | 7.4%), Health Diagnosing & Treating (2,642 | 6.8%), Education Instruction & Library (2,182 | 5.6%), and Health Technologists (1,610 | 4.2%).
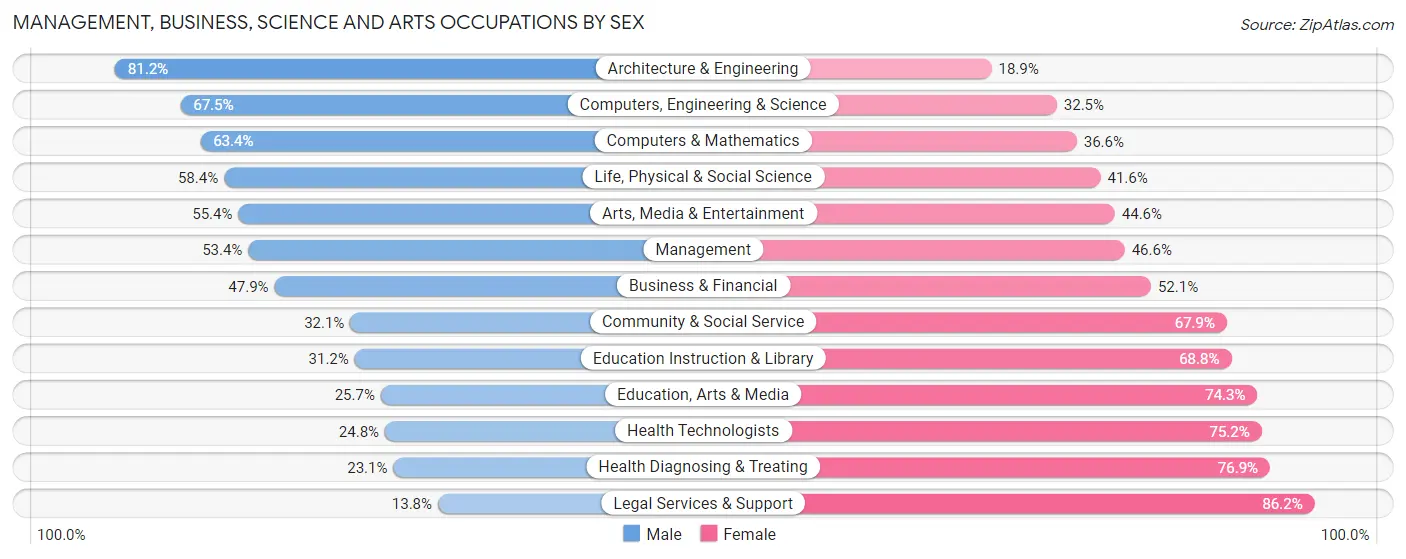
Management, Business, Science and Arts Occupations by Sex
Within the Management, Business, Science and Arts occupations in Buchanan County, the most male-oriented occupations are Architecture & Engineering (81.1%), Computers, Engineering & Science (67.5%), and Computers & Mathematics (63.4%), while the most female-oriented occupations are Legal Services & Support (86.2%), Health Diagnosing & Treating (76.9%), and Health Technologists (75.2%).
| Occupation | Male | Female |
| Management | 1,531 (53.4%) | 1,338 (46.6%) |
| Business & Financial | 647 (47.9%) | 704 (52.1%) |
| Computers, Engineering & Science | 840 (67.5%) | 404 (32.5%) |
| Computers & Mathematics | 339 (63.4%) | 196 (36.6%) |
| Architecture & Engineering | 310 (81.1%) | 72 (18.9%) |
| Life, Physical & Social Science | 191 (58.4%) | 136 (41.6%) |
| Community & Social Service | 1,165 (32.1%) | 2,467 (67.9%) |
| Education, Arts & Media | 234 (25.7%) | 676 (74.3%) |
| Legal Services & Support | 16 (13.8%) | 100 (86.2%) |
| Education Instruction & Library | 680 (31.2%) | 1,502 (68.8%) |
| Arts, Media & Entertainment | 235 (55.4%) | 189 (44.6%) |
| Health Diagnosing & Treating | 610 (23.1%) | 2,032 (76.9%) |
| Health Technologists | 400 (24.8%) | 1,210 (75.2%) |
| Total (Category) | 4,793 (40.8%) | 6,945 (59.2%) |
| Total (Overall) | 20,801 (53.7%) | 17,921 (46.3%) |
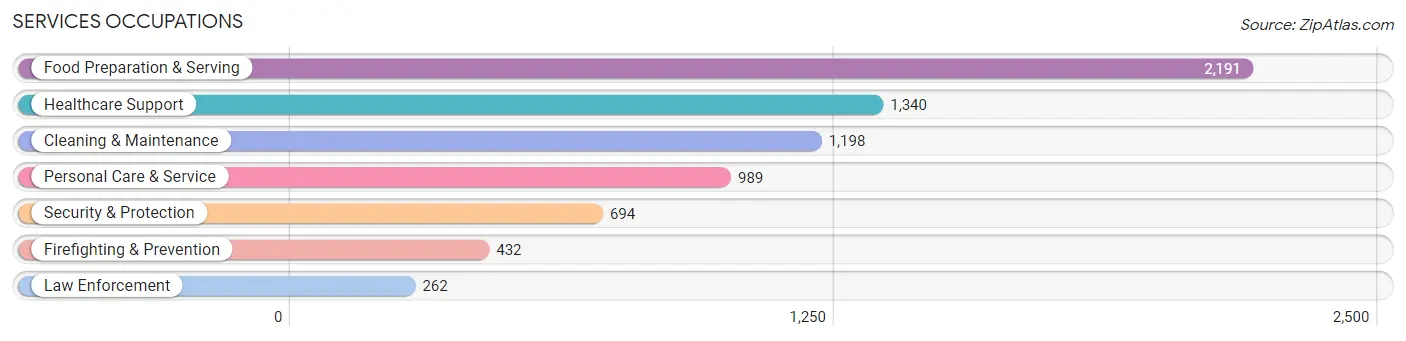
Services Occupations
The most common Services occupations in Buchanan County are Food Preparation & Serving (2,191 | 5.7%), Healthcare Support (1,340 | 3.5%), Cleaning & Maintenance (1,198 | 3.1%), Personal Care & Service (989 | 2.5%), and Security & Protection (694 | 1.8%).
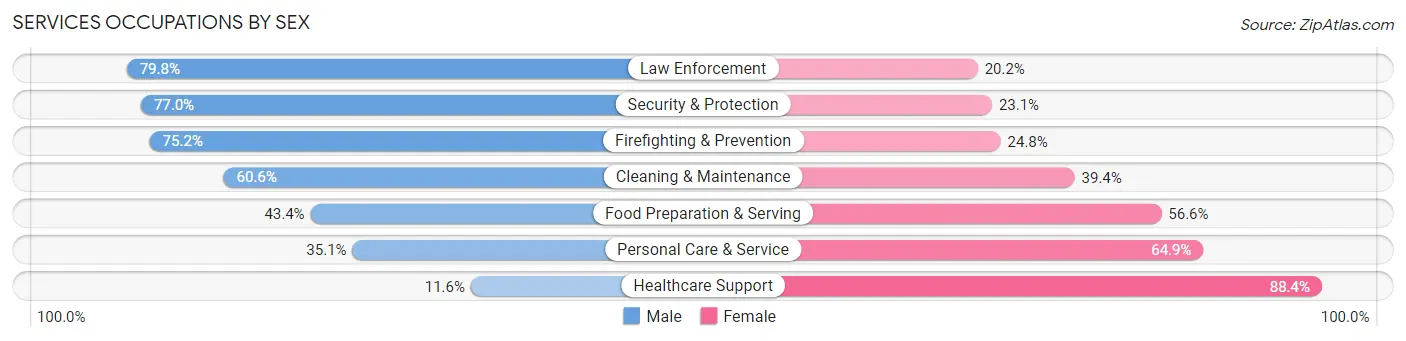
Services Occupations by Sex
Within the Services occupations in Buchanan County, the most male-oriented occupations are Law Enforcement (79.8%), Security & Protection (76.9%), and Firefighting & Prevention (75.2%), while the most female-oriented occupations are Healthcare Support (88.4%), Personal Care & Service (64.9%), and Food Preparation & Serving (56.6%).
| Occupation | Male | Female |
| Healthcare Support | 156 (11.6%) | 1,184 (88.4%) |
| Security & Protection | 534 (76.9%) | 160 (23.1%) |
| Firefighting & Prevention | 325 (75.2%) | 107 (24.8%) |
| Law Enforcement | 209 (79.8%) | 53 (20.2%) |
| Food Preparation & Serving | 951 (43.4%) | 1,240 (56.6%) |
| Cleaning & Maintenance | 726 (60.6%) | 472 (39.4%) |
| Personal Care & Service | 347 (35.1%) | 642 (64.9%) |
| Total (Category) | 2,714 (42.3%) | 3,698 (57.7%) |
| Total (Overall) | 20,801 (53.7%) | 17,921 (46.3%) |
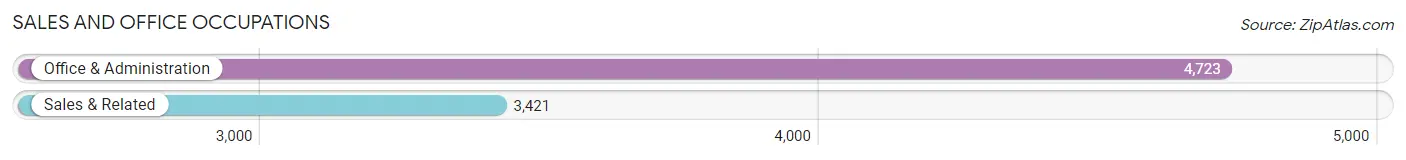
Sales and Office Occupations
The most common Sales and Office occupations in Buchanan County are Office & Administration (4,723 | 12.2%), and Sales & Related (3,421 | 8.8%).
Sales and Office Occupations by Sex
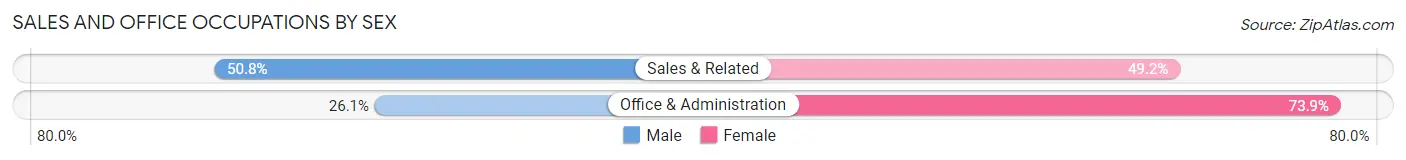
| Occupation | Male | Female |
| Sales & Related | 1,739 (50.8%) | 1,682 (49.2%) |
| Office & Administration | 1,233 (26.1%) | 3,490 (73.9%) |
| Total (Category) | 2,972 (36.5%) | 5,172 (63.5%) |
| Total (Overall) | 20,801 (53.7%) | 17,921 (46.3%) |
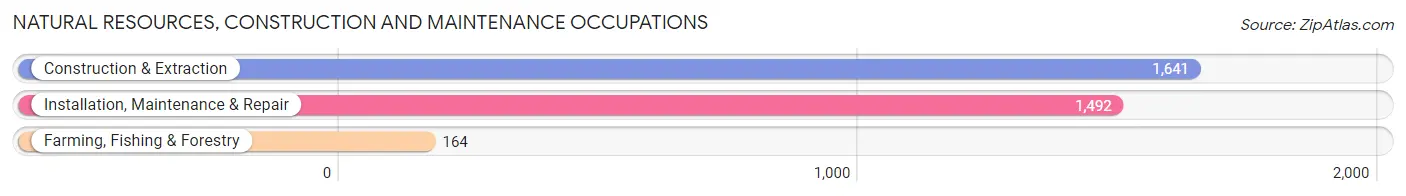
Natural Resources, Construction and Maintenance Occupations
The most common Natural Resources, Construction and Maintenance occupations in Buchanan County are Construction & Extraction (1,641 | 4.2%), Installation, Maintenance & Repair (1,492 | 3.8%), and Farming, Fishing & Forestry (164 | 0.4%).
Natural Resources, Construction and Maintenance Occupations by Sex
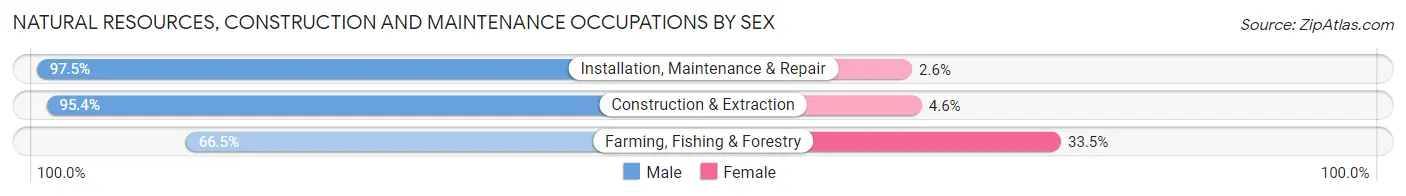
| Occupation | Male | Female |
| Farming, Fishing & Forestry | 109 (66.5%) | 55 (33.5%) |
| Construction & Extraction | 1,566 (95.4%) | 75 (4.6%) |
| Installation, Maintenance & Repair | 1,454 (97.5%) | 38 (2.5%) |
| Total (Category) | 3,129 (94.9%) | 168 (5.1%) |
| Total (Overall) | 20,801 (53.7%) | 17,921 (46.3%) |
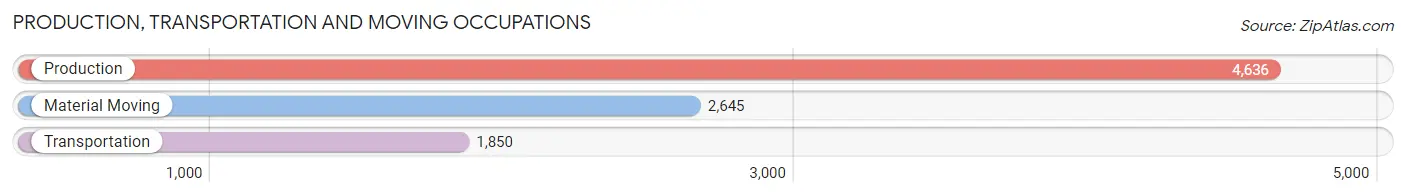
Production, Transportation and Moving Occupations
The most common Production, Transportation and Moving occupations in Buchanan County are Production (4,636 | 12.0%), Material Moving (2,645 | 6.8%), and Transportation (1,850 | 4.8%).
Production, Transportation and Moving Occupations by Sex
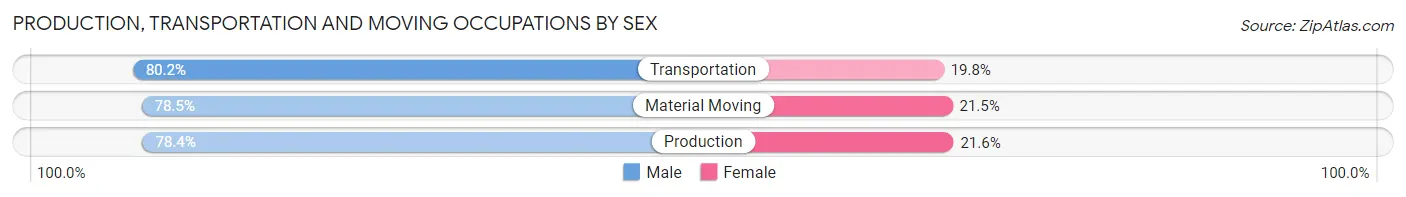
| Occupation | Male | Female |
| Production | 3,633 (78.4%) | 1,003 (21.6%) |
| Transportation | 1,483 (80.2%) | 367 (19.8%) |
| Material Moving | 2,077 (78.5%) | 568 (21.5%) |
| Total (Category) | 7,193 (78.8%) | 1,938 (21.2%) |
| Total (Overall) | 20,801 (53.7%) | 17,921 (46.3%) |
Employment Industries by Sex in Buchanan County
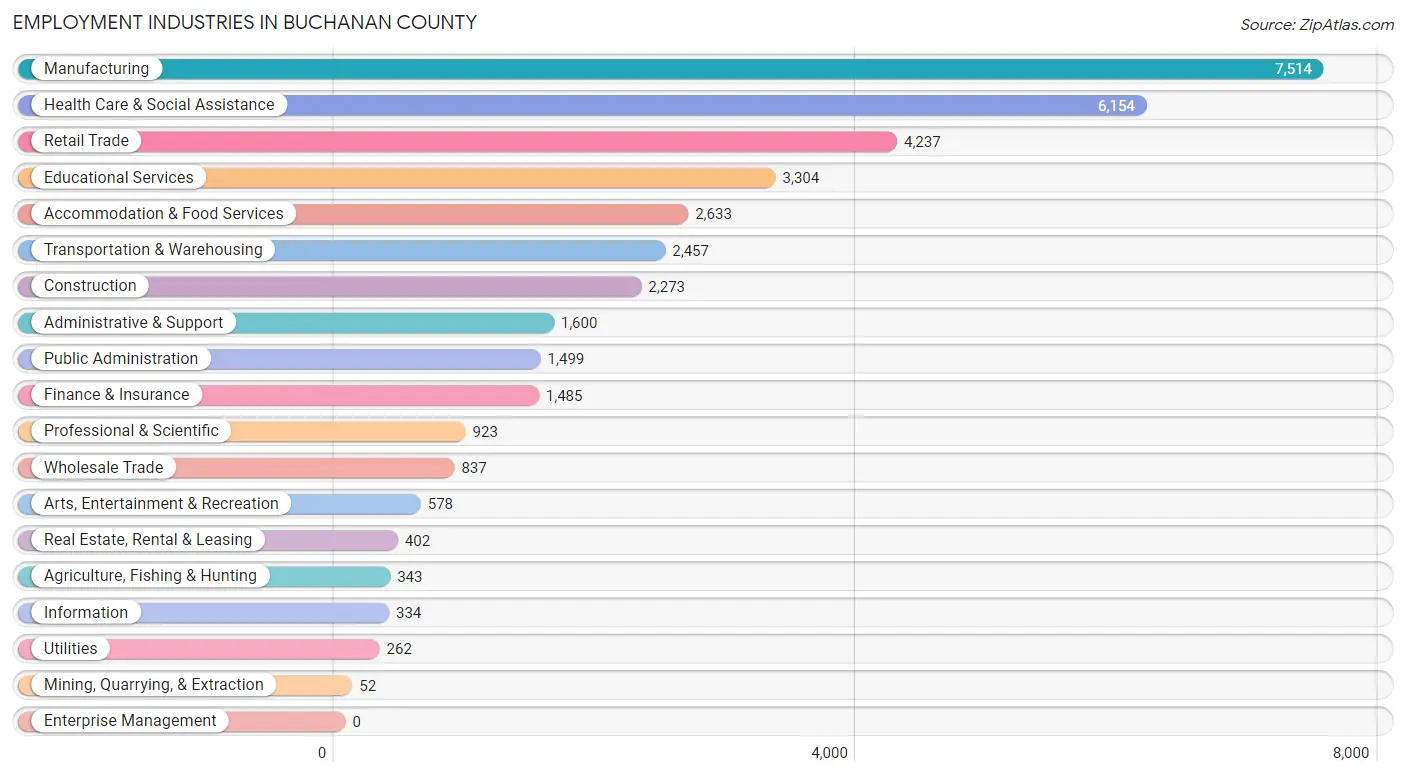
Employment Industries in Buchanan County
The major employment industries in Buchanan County include Manufacturing (7,514 | 19.4%), Health Care & Social Assistance (6,154 | 15.9%), Retail Trade (4,237 | 10.9%), Educational Services (3,304 | 8.5%), and Accommodation & Food Services (2,633 | 6.8%).
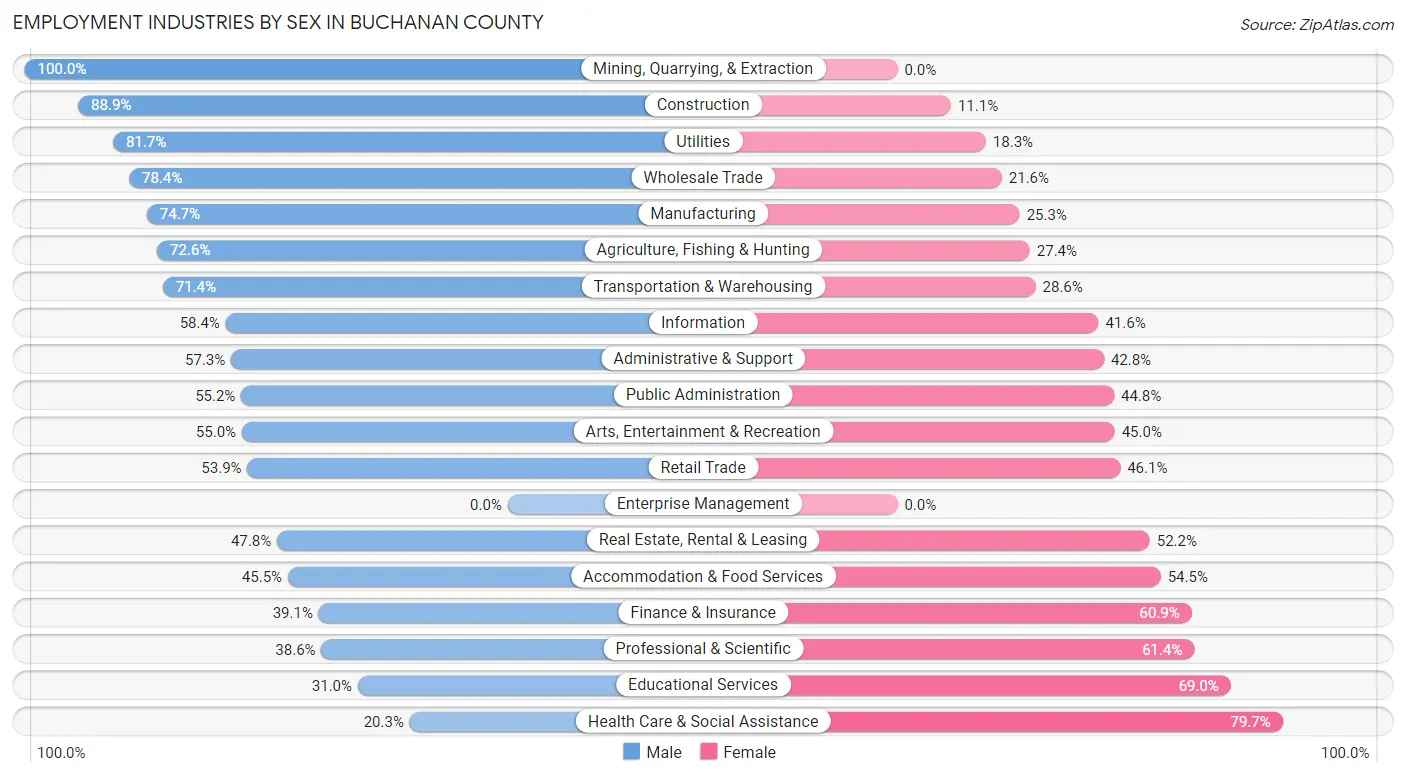
Employment Industries by Sex in Buchanan County
The Buchanan County industries that see more men than women are Mining, Quarrying, & Extraction (100.0%), Construction (88.9%), and Utilities (81.7%), whereas the industries that tend to have a higher number of women are Health Care & Social Assistance (79.7%), Educational Services (69.0%), and Professional & Scientific (61.4%).
| Industry | Male | Female |
| Agriculture, Fishing & Hunting | 249 (72.6%) | 94 (27.4%) |
| Mining, Quarrying, & Extraction | 52 (100.0%) | 0 (0.0%) |
| Construction | 2,021 (88.9%) | 252 (11.1%) |
| Manufacturing | 5,612 (74.7%) | 1,902 (25.3%) |
| Wholesale Trade | 656 (78.4%) | 181 (21.6%) |
| Retail Trade | 2,283 (53.9%) | 1,954 (46.1%) |
| Transportation & Warehousing | 1,754 (71.4%) | 703 (28.6%) |
| Utilities | 214 (81.7%) | 48 (18.3%) |
| Information | 195 (58.4%) | 139 (41.6%) |
| Finance & Insurance | 581 (39.1%) | 904 (60.9%) |
| Real Estate, Rental & Leasing | 192 (47.8%) | 210 (52.2%) |
| Professional & Scientific | 356 (38.6%) | 567 (61.4%) |
| Enterprise Management | 0 (0.0%) | 0 (0.0%) |
| Administrative & Support | 916 (57.3%) | 684 (42.7%) |
| Educational Services | 1,025 (31.0%) | 2,279 (69.0%) |
| Health Care & Social Assistance | 1,248 (20.3%) | 4,906 (79.7%) |
| Arts, Entertainment & Recreation | 318 (55.0%) | 260 (45.0%) |
| Accommodation & Food Services | 1,198 (45.5%) | 1,435 (54.5%) |
| Public Administration | 827 (55.2%) | 672 (44.8%) |
| Total | 20,801 (53.7%) | 17,921 (46.3%) |
Education in Buchanan County
School Enrollment in Buchanan County
The most common levels of schooling among the 19,039 students in Buchanan County are middle school (4,443 | 23.3%), high school (4,063 | 21.3%), and elementary school (4,036 | 21.2%).
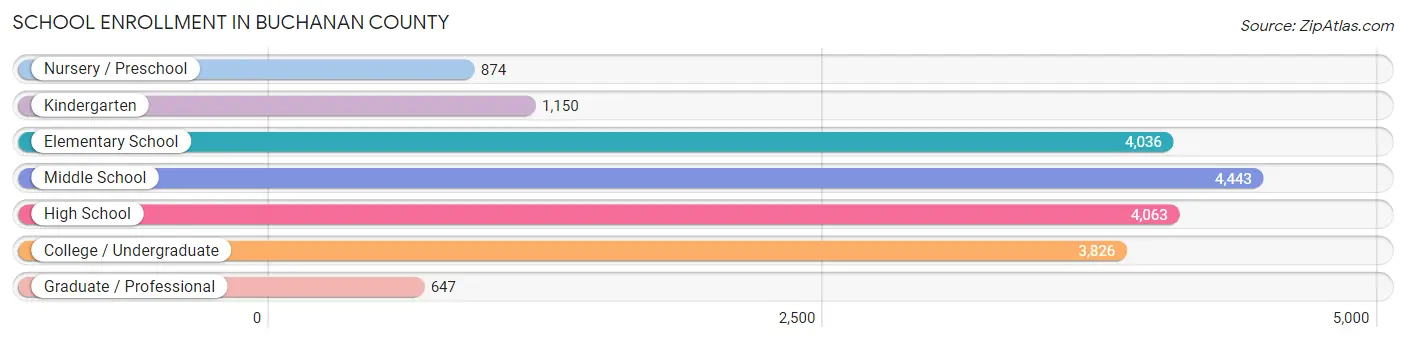
| School Level | # Students | % Students |
| Nursery / Preschool | 874 | 4.6% |
| Kindergarten | 1,150 | 6.0% |
| Elementary School | 4,036 | 21.2% |
| Middle School | 4,443 | 23.3% |
| High School | 4,063 | 21.3% |
| College / Undergraduate | 3,826 | 20.1% |
| Graduate / Professional | 647 | 3.4% |
| Total | 19,039 | 100.0% |
School Enrollment by Age by Funding Source in Buchanan County
Out of a total of 19,039 students who are enrolled in schools in Buchanan County, 2,361 (12.4%) attend a private institution, while the remaining 16,678 (87.6%) are enrolled in public schools. The age group of 3 to 4 year olds has the highest likelihood of being enrolled in private schools, with 344 (44.3% in the age bracket) enrolled. Conversely, the age group of 18 to 19 year olds has the lowest likelihood of being enrolled in a private school, with 1,141 (95.6% in the age bracket) attending a public institution.
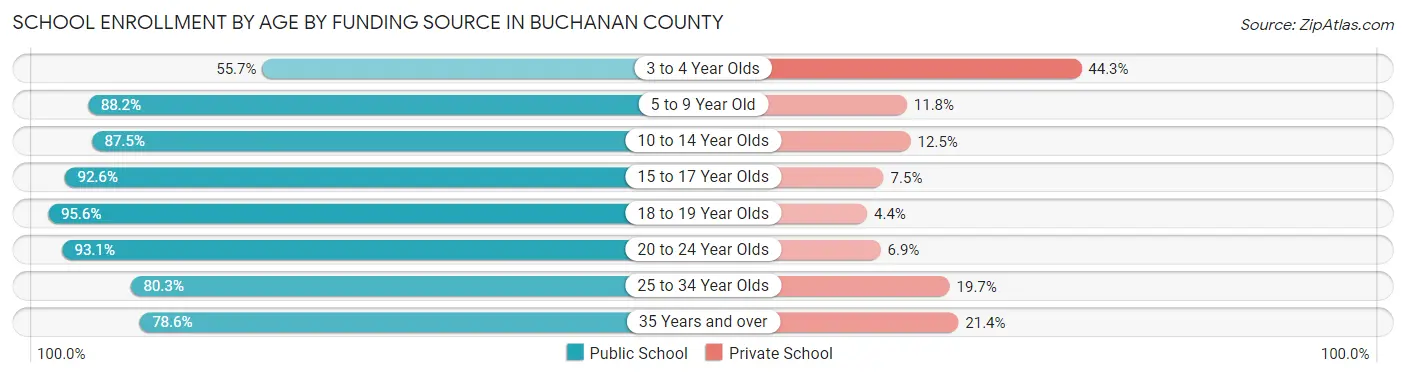
| Age Bracket | Public School | Private School |
| 3 to 4 Year Olds | 433 (55.7%) | 344 (44.3%) |
| 5 to 9 Year Old | 4,227 (88.2%) | 564 (11.8%) |
| 10 to 14 Year Olds | 4,564 (87.5%) | 651 (12.5%) |
| 15 to 17 Year Olds | 2,721 (92.5%) | 219 (7.4%) |
| 18 to 19 Year Olds | 1,141 (95.6%) | 52 (4.4%) |
| 20 to 24 Year Olds | 2,207 (93.1%) | 163 (6.9%) |
| 25 to 34 Year Olds | 712 (80.3%) | 175 (19.7%) |
| 35 Years and over | 681 (78.6%) | 185 (21.4%) |
| Total | 16,678 (87.6%) | 2,361 (12.4%) |
Educational Attainment by Field of Study in Buchanan County
Business (2,822 | 19.2%), education (2,525 | 17.2%), science & technology (1,866 | 12.7%), arts & humanities (1,399 | 9.5%), and bio, nature & agricultural (913 | 6.2%) are the most common fields of study among 14,671 individuals in Buchanan County who have obtained a bachelor's degree or higher.
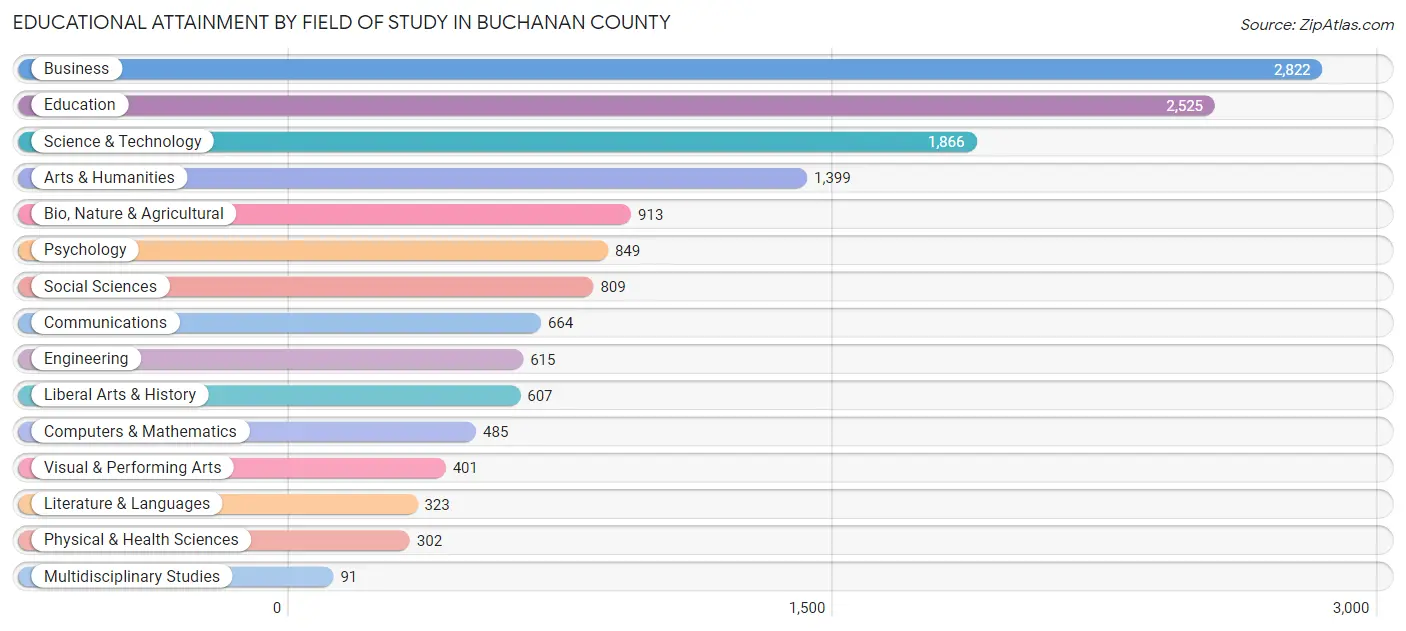
| Field of Study | # Graduates | % Graduates |
| Computers & Mathematics | 485 | 3.3% |
| Bio, Nature & Agricultural | 913 | 6.2% |
| Physical & Health Sciences | 302 | 2.1% |
| Psychology | 849 | 5.8% |
| Social Sciences | 809 | 5.5% |
| Engineering | 615 | 4.2% |
| Multidisciplinary Studies | 91 | 0.6% |
| Science & Technology | 1,866 | 12.7% |
| Business | 2,822 | 19.2% |
| Education | 2,525 | 17.2% |
| Literature & Languages | 323 | 2.2% |
| Liberal Arts & History | 607 | 4.1% |
| Visual & Performing Arts | 401 | 2.7% |
| Communications | 664 | 4.5% |
| Arts & Humanities | 1,399 | 9.5% |
| Total | 14,671 | 100.0% |
Transportation & Commute in Buchanan County
Vehicle Availability by Sex in Buchanan County
The most prevalent vehicle ownership categories in Buchanan County are males with 2 vehicles (8,487, accounting for 41.7%) and females with 2 vehicles (6,316, making up 48.7%).
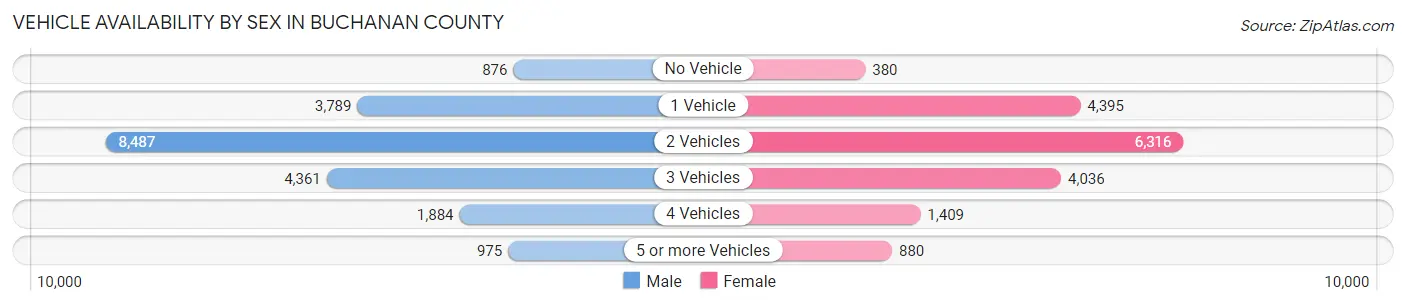
| Vehicles Available | Male | Female |
| No Vehicle | 876 (4.3%) | 380 (2.2%) |
| 1 Vehicle | 3,789 (18.6%) | 4,395 (25.2%) |
| 2 Vehicles | 8,487 (41.7%) | 6,316 (36.3%) |
| 3 Vehicles | 4,361 (21.4%) | 4,036 (23.2%) |
| 4 Vehicles | 1,884 (9.2%) | 1,409 (8.1%) |
| 5 or more Vehicles | 975 (4.8%) | 880 (5.1%) |
| Total | 20,372 (100.0%) | 17,416 (100.0%) |
Commute Time in Buchanan County
The most frequently occuring commute durations in Buchanan County are 10 to 14 minutes (10,053 commuters, 27.9%), 15 to 19 minutes (7,703 commuters, 21.4%), and 5 to 9 minutes (7,701 commuters, 21.3%).
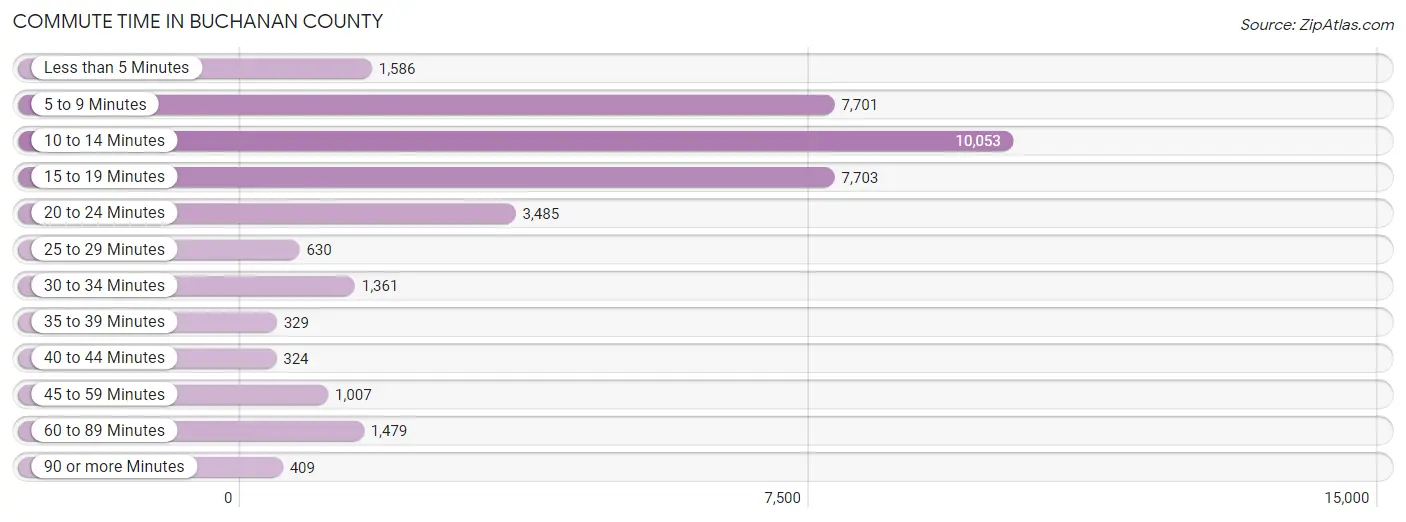
| Commute Time | # Commuters | % Commuters |
| Less than 5 Minutes | 1,586 | 4.4% |
| 5 to 9 Minutes | 7,701 | 21.3% |
| 10 to 14 Minutes | 10,053 | 27.9% |
| 15 to 19 Minutes | 7,703 | 21.4% |
| 20 to 24 Minutes | 3,485 | 9.7% |
| 25 to 29 Minutes | 630 | 1.8% |
| 30 to 34 Minutes | 1,361 | 3.8% |
| 35 to 39 Minutes | 329 | 0.9% |
| 40 to 44 Minutes | 324 | 0.9% |
| 45 to 59 Minutes | 1,007 | 2.8% |
| 60 to 89 Minutes | 1,479 | 4.1% |
| 90 or more Minutes | 409 | 1.1% |
Commute Time by Sex in Buchanan County
The most common commute times in Buchanan County are 10 to 14 minutes (5,228 commuters, 26.8%) for males and 10 to 14 minutes (4,825 commuters, 29.2%) for females.
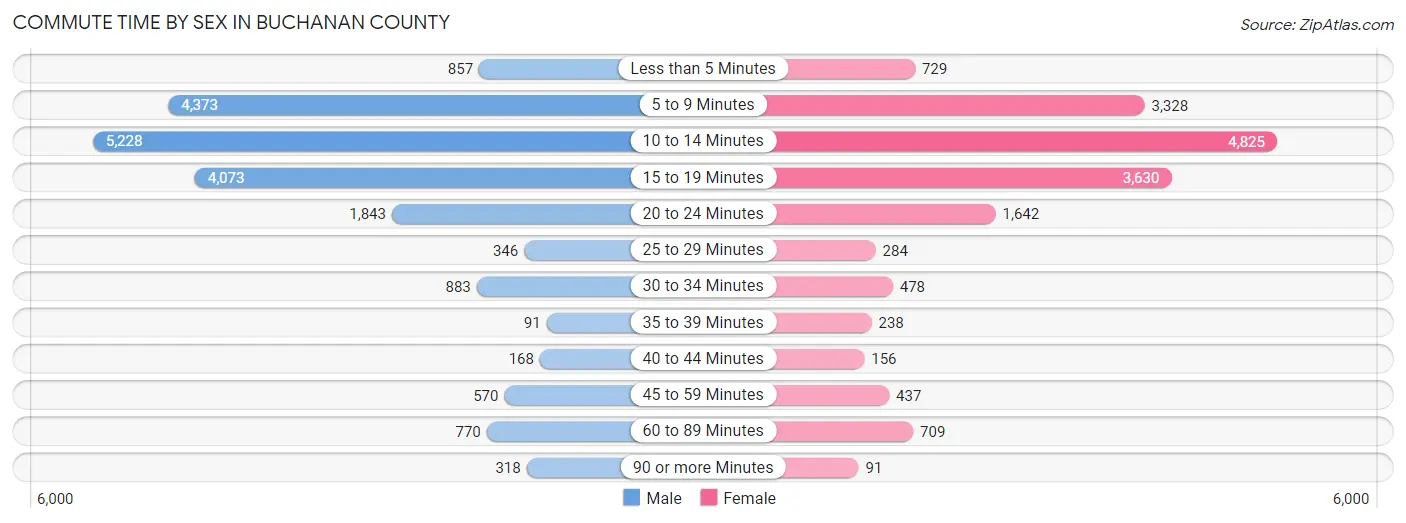
| Commute Time | Male | Female |
| Less than 5 Minutes | 857 (4.4%) | 729 (4.4%) |
| 5 to 9 Minutes | 4,373 (22.4%) | 3,328 (20.1%) |
| 10 to 14 Minutes | 5,228 (26.8%) | 4,825 (29.2%) |
| 15 to 19 Minutes | 4,073 (20.9%) | 3,630 (21.9%) |
| 20 to 24 Minutes | 1,843 (9.4%) | 1,642 (9.9%) |
| 25 to 29 Minutes | 346 (1.8%) | 284 (1.7%) |
| 30 to 34 Minutes | 883 (4.5%) | 478 (2.9%) |
| 35 to 39 Minutes | 91 (0.5%) | 238 (1.4%) |
| 40 to 44 Minutes | 168 (0.9%) | 156 (0.9%) |
| 45 to 59 Minutes | 570 (2.9%) | 437 (2.6%) |
| 60 to 89 Minutes | 770 (3.9%) | 709 (4.3%) |
| 90 or more Minutes | 318 (1.6%) | 91 (0.5%) |
Time of Departure to Work by Sex in Buchanan County
The most frequent times of departure to work in Buchanan County are 4:00 PM to 11:59 PM (2,513, 12.9%) for males and 7:30 AM to 7:59 AM (2,894, 17.5%) for females.

| Time of Departure | Male | Female |
| 12:00 AM to 4:59 AM | 1,407 (7.2%) | 695 (4.2%) |
| 5:00 AM to 5:29 AM | 817 (4.2%) | 528 (3.2%) |
| 5:30 AM to 5:59 AM | 1,120 (5.7%) | 674 (4.1%) |
| 6:00 AM to 6:29 AM | 2,037 (10.4%) | 1,426 (8.6%) |
| 6:30 AM to 6:59 AM | 1,863 (9.5%) | 1,519 (9.2%) |
| 7:00 AM to 7:29 AM | 2,388 (12.2%) | 2,198 (13.3%) |
| 7:30 AM to 7:59 AM | 1,962 (10.1%) | 2,894 (17.5%) |
| 8:00 AM to 8:29 AM | 1,626 (8.3%) | 2,087 (12.6%) |
| 8:30 AM to 8:59 AM | 471 (2.4%) | 612 (3.7%) |
| 9:00 AM to 9:59 AM | 982 (5.0%) | 823 (5.0%) |
| 10:00 AM to 10:59 AM | 428 (2.2%) | 390 (2.4%) |
| 11:00 AM to 11:59 AM | 206 (1.1%) | 179 (1.1%) |
| 12:00 PM to 3:59 PM | 1,700 (8.7%) | 1,281 (7.7%) |
| 4:00 PM to 11:59 PM | 2,513 (12.9%) | 1,241 (7.5%) |
| Total | 19,520 (100.0%) | 16,547 (100.0%) |
Housing Occupancy in Buchanan County
Occupancy by Ownership in Buchanan County
Of the total 33,363 dwellings in Buchanan County, owner-occupied units account for 21,148 (63.4%), while renter-occupied units make up 12,215 (36.6%).
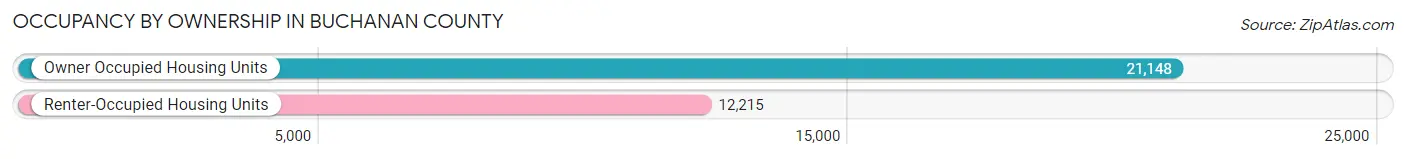
| Occupancy | # Housing Units | % Housing Units |
| Owner Occupied Housing Units | 21,148 | 63.4% |
| Renter-Occupied Housing Units | 12,215 | 36.6% |
| Total Occupied Housing Units | 33,363 | 100.0% |
Occupancy by Household Size in Buchanan County
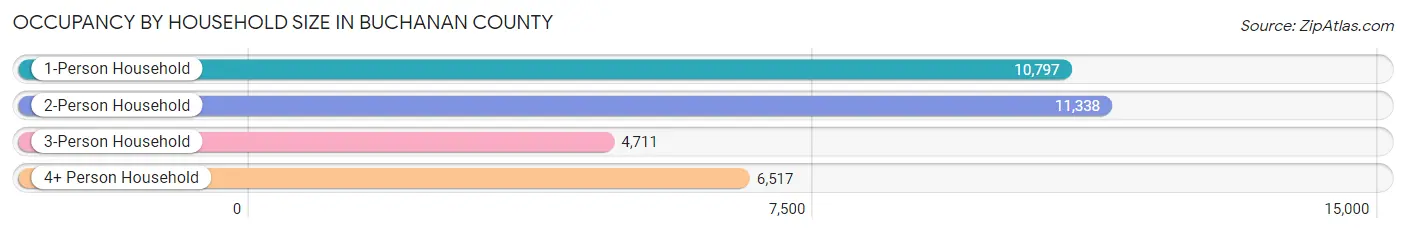
| Household Size | # Housing Units | % Housing Units |
| 1-Person Household | 10,797 | 32.4% |
| 2-Person Household | 11,338 | 34.0% |
| 3-Person Household | 4,711 | 14.1% |
| 4+ Person Household | 6,517 | 19.5% |
| Total Housing Units | 33,363 | 100.0% |
Occupancy by Ownership by Household Size in Buchanan County
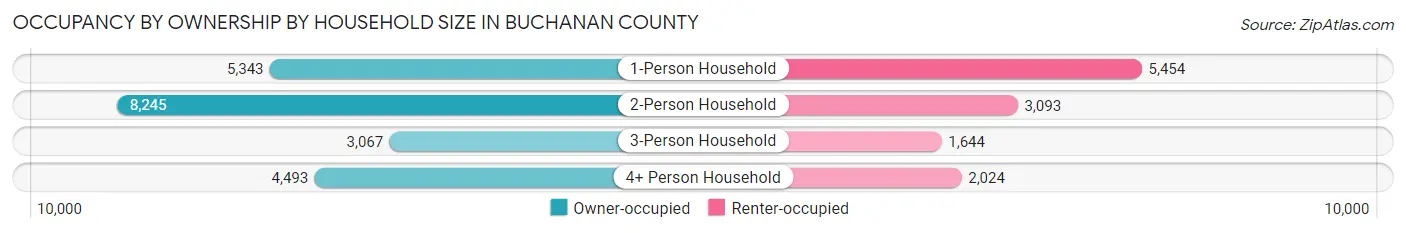
| Household Size | Owner-occupied | Renter-occupied |
| 1-Person Household | 5,343 (49.5%) | 5,454 (50.5%) |
| 2-Person Household | 8,245 (72.7%) | 3,093 (27.3%) |
| 3-Person Household | 3,067 (65.1%) | 1,644 (34.9%) |
| 4+ Person Household | 4,493 (68.9%) | 2,024 (31.1%) |
| Total Housing Units | 21,148 (63.4%) | 12,215 (36.6%) |
Occupancy by Educational Attainment in Buchanan County
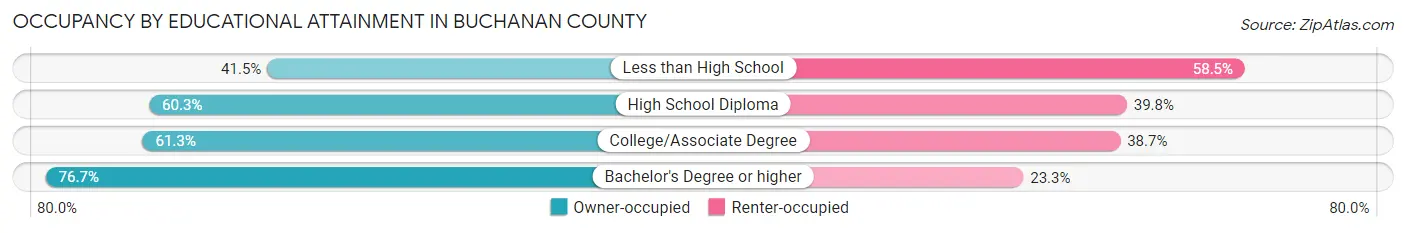
| Household Size | Owner-occupied | Renter-occupied |
| Less than High School | 1,040 (41.5%) | 1,464 (58.5%) |
| High School Diploma | 6,972 (60.3%) | 4,600 (39.8%) |
| College/Associate Degree | 6,576 (61.3%) | 4,154 (38.7%) |
| Bachelor's Degree or higher | 6,560 (76.7%) | 1,997 (23.3%) |
Occupancy by Age of Householder in Buchanan County
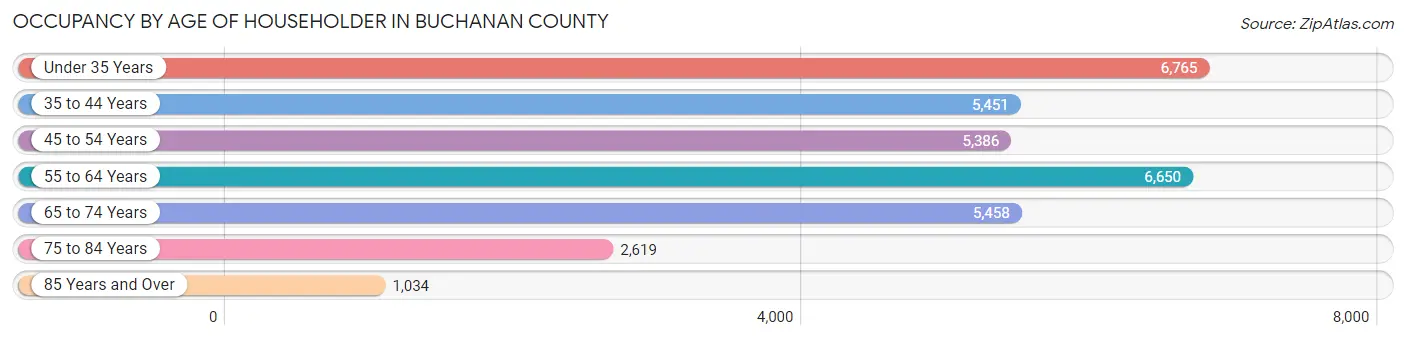
| Age Bracket | # Households | % Households |
| Under 35 Years | 6,765 | 20.3% |
| 35 to 44 Years | 5,451 | 16.3% |
| 45 to 54 Years | 5,386 | 16.1% |
| 55 to 64 Years | 6,650 | 19.9% |
| 65 to 74 Years | 5,458 | 16.4% |
| 75 to 84 Years | 2,619 | 7.9% |
| 85 Years and Over | 1,034 | 3.1% |
| Total | 33,363 | 100.0% |
Housing Finances in Buchanan County
Median Income by Occupancy in Buchanan County
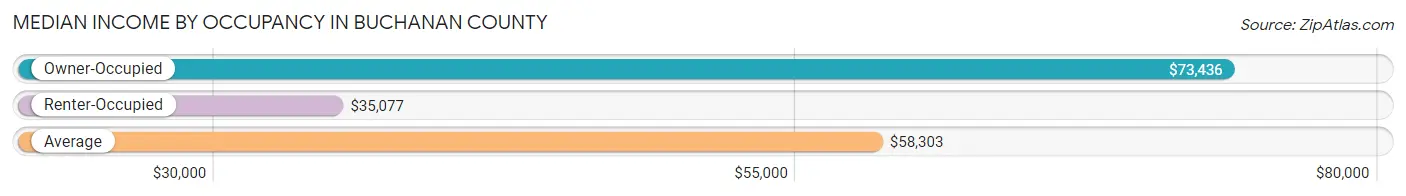
| Occupancy Type | # Households | Median Income |
| Owner-Occupied | 21,148 (63.4%) | $73,436 |
| Renter-Occupied | 12,215 (36.6%) | $35,077 |
| Average | 33,363 (100.0%) | $58,303 |
Occupancy by Householder Income Bracket in Buchanan County
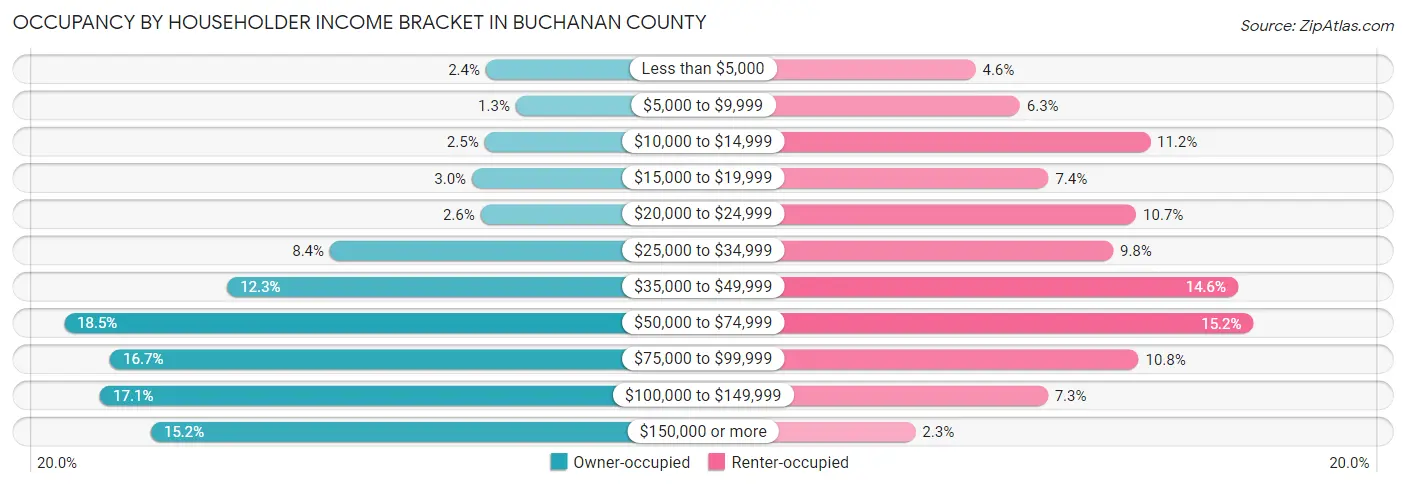
| Income Bracket | Owner-occupied | Renter-occupied |
| Less than $5,000 | 513 (2.4%) | 558 (4.6%) |
| $5,000 to $9,999 | 273 (1.3%) | 765 (6.3%) |
| $10,000 to $14,999 | 525 (2.5%) | 1,371 (11.2%) |
| $15,000 to $19,999 | 626 (3.0%) | 898 (7.3%) |
| $20,000 to $24,999 | 556 (2.6%) | 1,306 (10.7%) |
| $25,000 to $34,999 | 1,770 (8.4%) | 1,198 (9.8%) |
| $35,000 to $49,999 | 2,598 (12.3%) | 1,778 (14.6%) |
| $50,000 to $74,999 | 3,912 (18.5%) | 1,851 (15.1%) |
| $75,000 to $99,999 | 3,541 (16.7%) | 1,317 (10.8%) |
| $100,000 to $149,999 | 3,621 (17.1%) | 894 (7.3%) |
| $150,000 or more | 3,213 (15.2%) | 279 (2.3%) |
| Total | 21,148 (100.0%) | 12,215 (100.0%) |
Monthly Housing Cost Tiers in Buchanan County
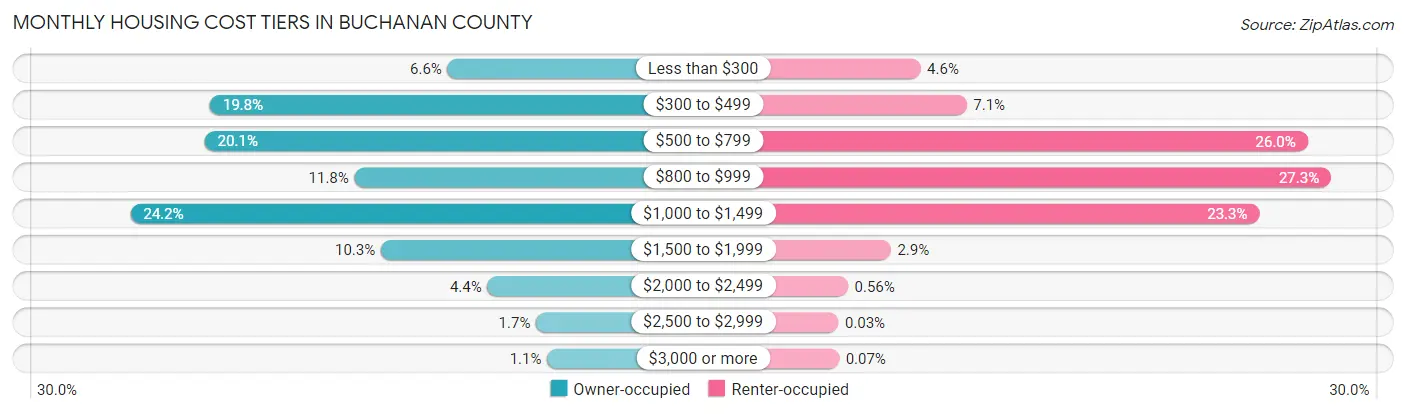
| Monthly Cost | Owner-occupied | Renter-occupied |
| Less than $300 | 1,402 (6.6%) | 558 (4.6%) |
| $300 to $499 | 4,182 (19.8%) | 870 (7.1%) |
| $500 to $799 | 4,243 (20.1%) | 3,172 (26.0%) |
| $800 to $999 | 2,490 (11.8%) | 3,330 (27.3%) |
| $1,000 to $1,499 | 5,109 (24.2%) | 2,846 (23.3%) |
| $1,500 to $1,999 | 2,180 (10.3%) | 358 (2.9%) |
| $2,000 to $2,499 | 936 (4.4%) | 69 (0.6%) |
| $2,500 to $2,999 | 368 (1.7%) | 4 (0.0%) |
| $3,000 or more | 238 (1.1%) | 8 (0.1%) |
| Total | 21,148 (100.0%) | 12,215 (100.0%) |
Physical Housing Characteristics in Buchanan County
Housing Structures in Buchanan County
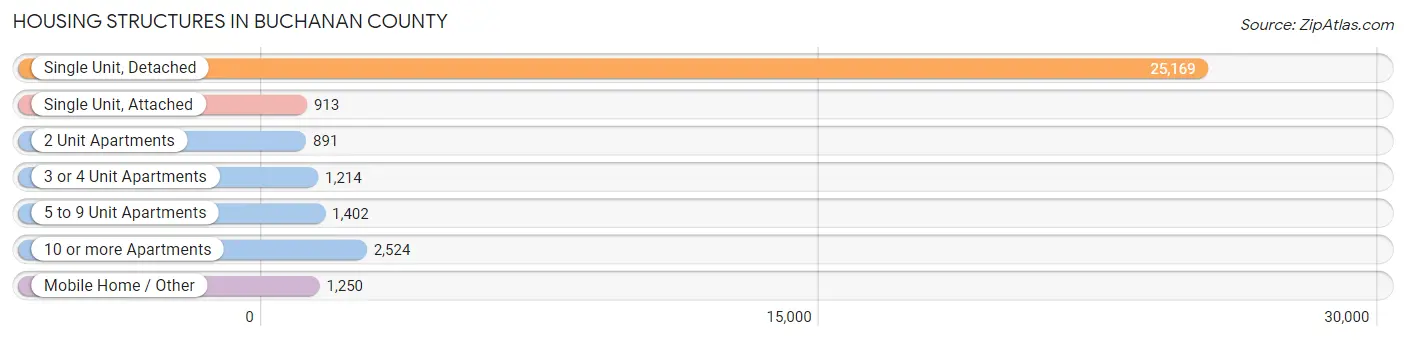
| Structure Type | # Housing Units | % Housing Units |
| Single Unit, Detached | 25,169 | 75.4% |
| Single Unit, Attached | 913 | 2.7% |
| 2 Unit Apartments | 891 | 2.7% |
| 3 or 4 Unit Apartments | 1,214 | 3.6% |
| 5 to 9 Unit Apartments | 1,402 | 4.2% |
| 10 or more Apartments | 2,524 | 7.6% |
| Mobile Home / Other | 1,250 | 3.7% |
| Total | 33,363 | 100.0% |
Housing Structures by Occupancy in Buchanan County
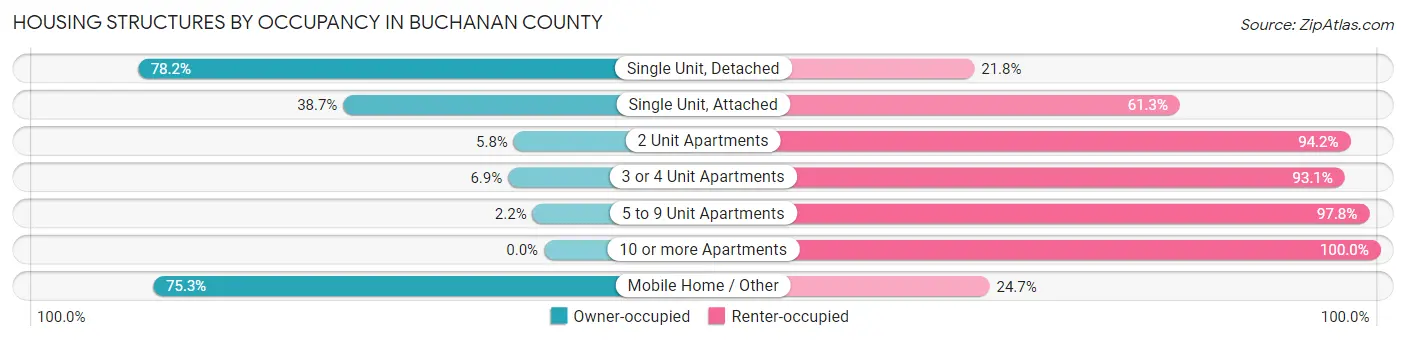
| Structure Type | Owner-occupied | Renter-occupied |
| Single Unit, Detached | 19,687 (78.2%) | 5,482 (21.8%) |
| Single Unit, Attached | 353 (38.7%) | 560 (61.3%) |
| 2 Unit Apartments | 52 (5.8%) | 839 (94.2%) |
| 3 or 4 Unit Apartments | 84 (6.9%) | 1,130 (93.1%) |
| 5 to 9 Unit Apartments | 31 (2.2%) | 1,371 (97.8%) |
| 10 or more Apartments | 0 (0.0%) | 2,524 (100.0%) |
| Mobile Home / Other | 941 (75.3%) | 309 (24.7%) |
| Total | 21,148 (63.4%) | 12,215 (36.6%) |
Housing Structures by Number of Rooms in Buchanan County
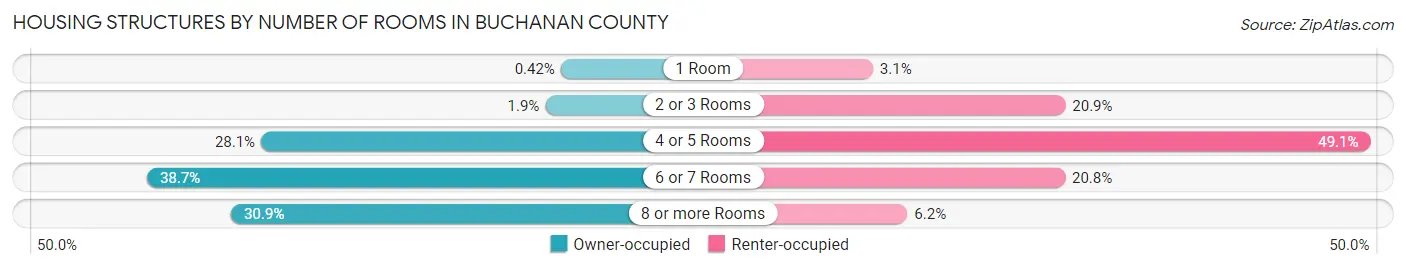
| Number of Rooms | Owner-occupied | Renter-occupied |
| 1 Room | 89 (0.4%) | 372 (3.0%) |
| 2 or 3 Rooms | 392 (1.8%) | 2,547 (20.8%) |
| 4 or 5 Rooms | 5,951 (28.1%) | 5,991 (49.0%) |
| 6 or 7 Rooms | 8,180 (38.7%) | 2,543 (20.8%) |
| 8 or more Rooms | 6,536 (30.9%) | 762 (6.2%) |
| Total | 21,148 (100.0%) | 12,215 (100.0%) |
Housing Structure by Heating Type in Buchanan County
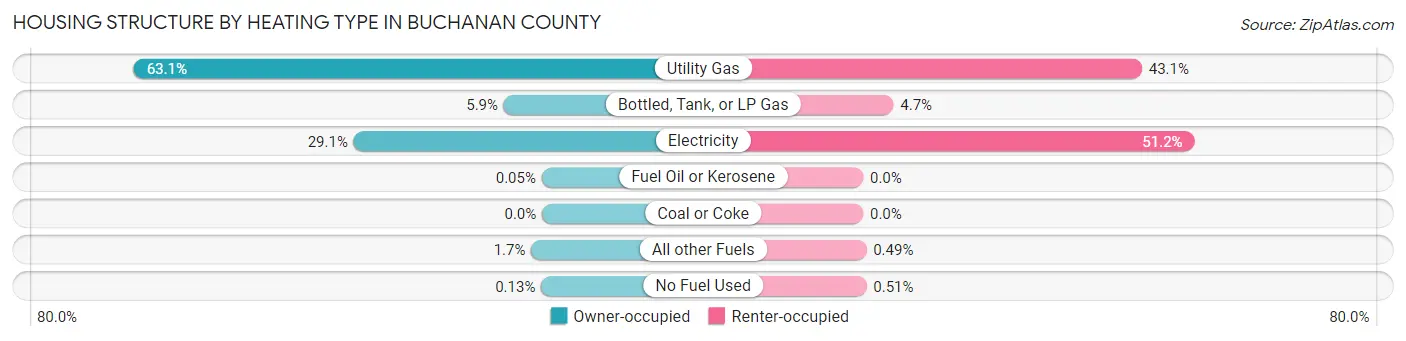
| Heating Type | Owner-occupied | Renter-occupied |
| Utility Gas | 13,349 (63.1%) | 5,264 (43.1%) |
| Bottled, Tank, or LP Gas | 1,249 (5.9%) | 572 (4.7%) |
| Electricity | 6,158 (29.1%) | 6,257 (51.2%) |
| Fuel Oil or Kerosene | 11 (0.1%) | 0 (0.0%) |
| Coal or Coke | 0 (0.0%) | 0 (0.0%) |
| All other Fuels | 353 (1.7%) | 60 (0.5%) |
| No Fuel Used | 28 (0.1%) | 62 (0.5%) |
| Total | 21,148 (100.0%) | 12,215 (100.0%) |
Household Vehicle Usage in Buchanan County
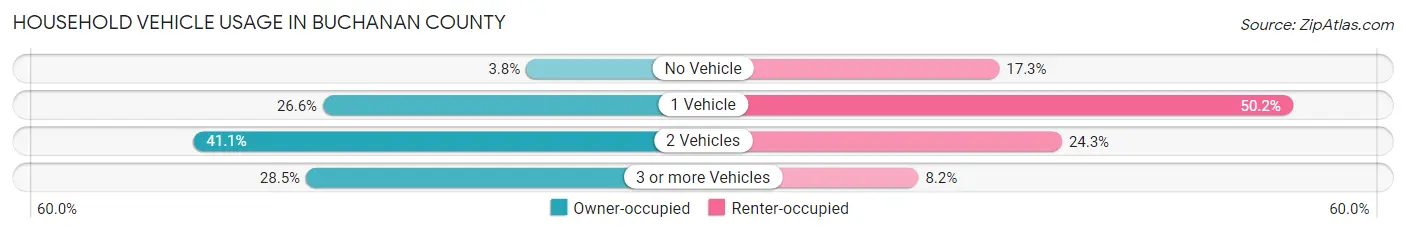
| Vehicles per Household | Owner-occupied | Renter-occupied |
| No Vehicle | 811 (3.8%) | 2,113 (17.3%) |
| 1 Vehicle | 5,622 (26.6%) | 6,126 (50.1%) |
| 2 Vehicles | 8,690 (41.1%) | 2,969 (24.3%) |
| 3 or more Vehicles | 6,025 (28.5%) | 1,007 (8.2%) |
| Total | 21,148 (100.0%) | 12,215 (100.0%) |
Real Estate & Mortgages in Buchanan County
Real Estate and Mortgage Overview in Buchanan County
| Characteristic | Without Mortgage | With Mortgage |
| Housing Units | 9,237 | 11,911 |
| Median Property Value | $139,300 | $155,700 |
| Median Household Income | $53,363 | $2,282 |
| Monthly Housing Costs | $463 | $238 |
| Real Estate Taxes | $1,128 | $87 |
Property Value by Mortgage Status in Buchanan County
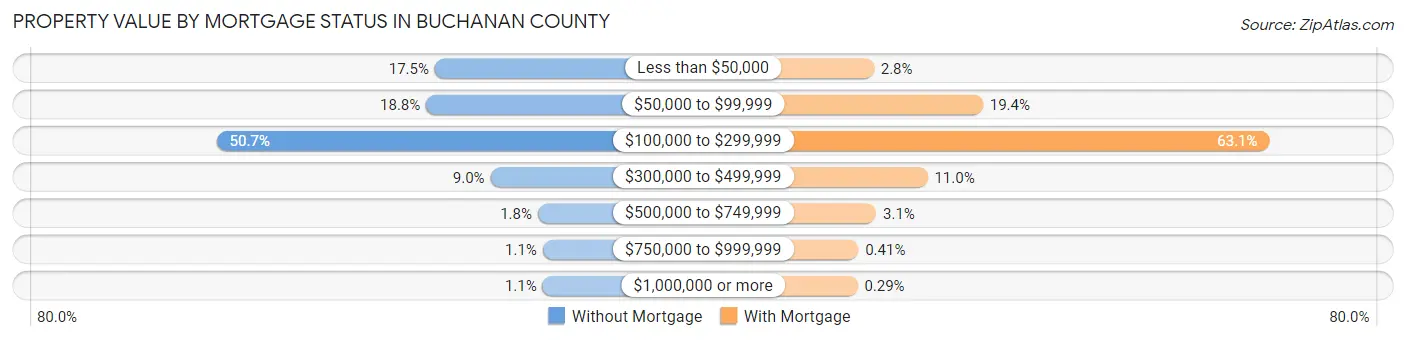
| Property Value | Without Mortgage | With Mortgage |
| Less than $50,000 | 1,616 (17.5%) | 331 (2.8%) |
| $50,000 to $99,999 | 1,738 (18.8%) | 2,309 (19.4%) |
| $100,000 to $299,999 | 4,687 (50.7%) | 7,510 (63.0%) |
| $300,000 to $499,999 | 833 (9.0%) | 1,305 (11.0%) |
| $500,000 to $749,999 | 166 (1.8%) | 373 (3.1%) |
| $750,000 to $999,999 | 97 (1.1%) | 49 (0.4%) |
| $1,000,000 or more | 100 (1.1%) | 34 (0.3%) |
| Total | 9,237 (100.0%) | 11,911 (100.0%) |
Household Income by Mortgage Status in Buchanan County
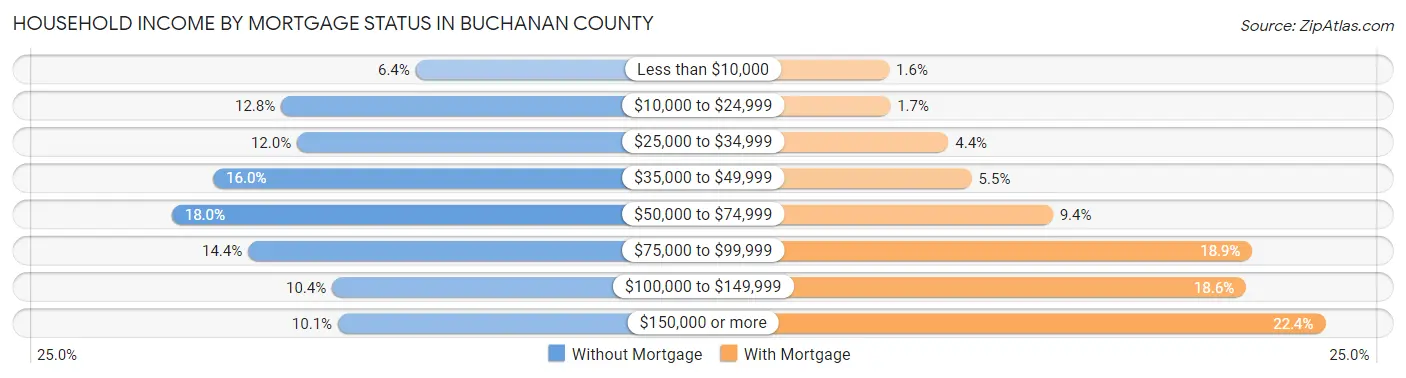
| Household Income | Without Mortgage | With Mortgage |
| Less than $10,000 | 589 (6.4%) | 190 (1.6%) |
| $10,000 to $24,999 | 1,181 (12.8%) | 197 (1.7%) |
| $25,000 to $34,999 | 1,111 (12.0%) | 526 (4.4%) |
| $35,000 to $49,999 | 1,480 (16.0%) | 659 (5.5%) |
| $50,000 to $74,999 | 1,662 (18.0%) | 1,118 (9.4%) |
| $75,000 to $99,999 | 1,326 (14.4%) | 2,250 (18.9%) |
| $100,000 to $149,999 | 957 (10.4%) | 2,215 (18.6%) |
| $150,000 or more | 931 (10.1%) | 2,664 (22.4%) |
| Total | 9,237 (100.0%) | 11,911 (100.0%) |
Property Value to Household Income Ratio in Buchanan County
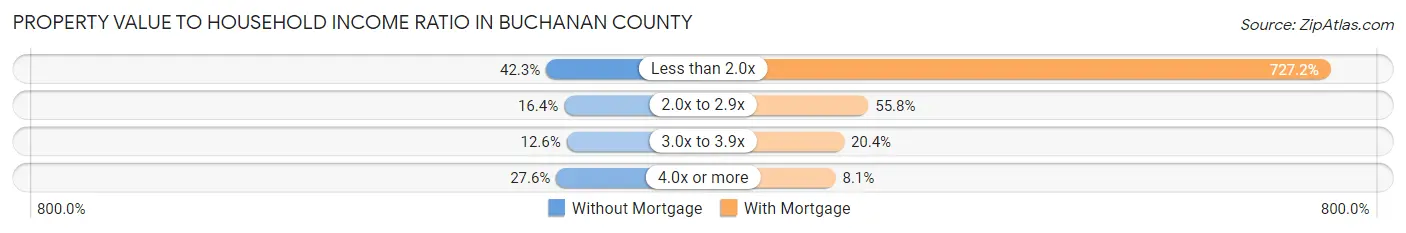
| Value-to-Income Ratio | Without Mortgage | With Mortgage |
| Less than 2.0x | 3,911 (42.3%) | 86,620 (727.2%) |
| 2.0x to 2.9x | 1,510 (16.4%) | 6,642 (55.8%) |
| 3.0x to 3.9x | 1,160 (12.6%) | 2,429 (20.4%) |
| 4.0x or more | 2,553 (27.6%) | 970 (8.1%) |
| Total | 9,237 (100.0%) | 11,911 (100.0%) |
Real Estate Taxes by Mortgage Status in Buchanan County
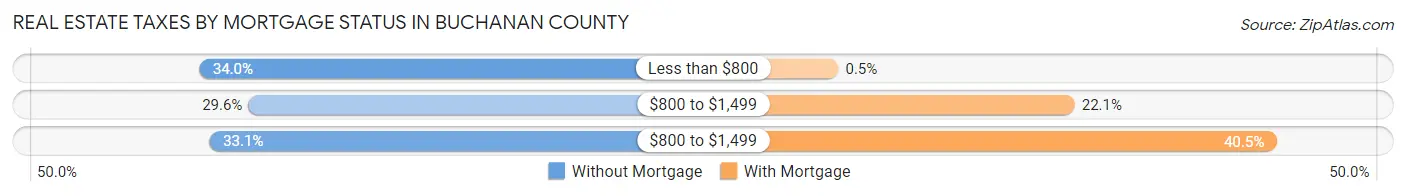
| Property Taxes | Without Mortgage | With Mortgage |
| Less than $800 | 3,141 (34.0%) | 59 (0.5%) |
| $800 to $1,499 | 2,732 (29.6%) | 2,630 (22.1%) |
| $800 to $1,499 | 3,053 (33.1%) | 4,820 (40.5%) |
| Total | 9,237 (100.0%) | 11,911 (100.0%) |
Health & Disability in Buchanan County
Health Insurance Coverage by Age in Buchanan County
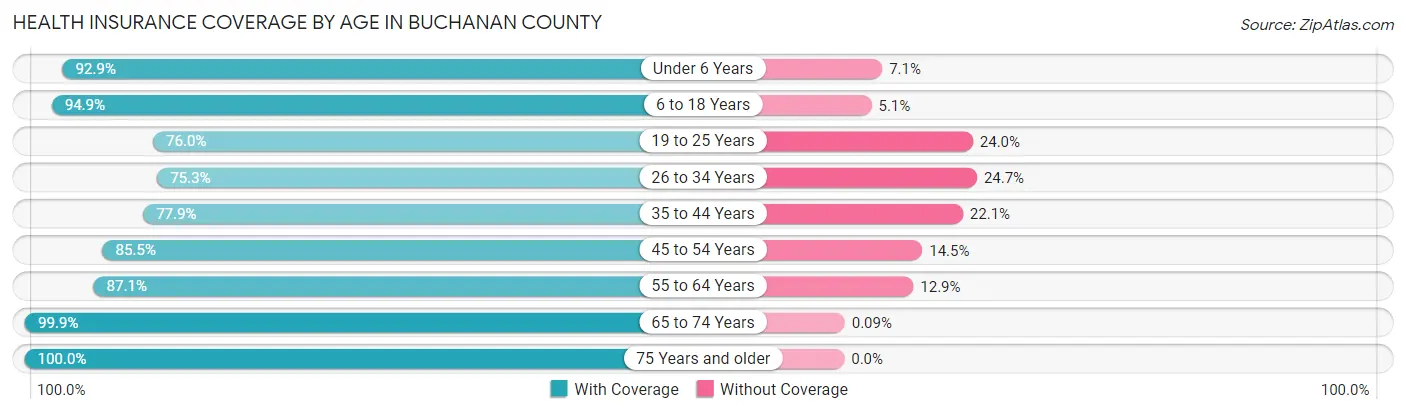
| Age Bracket | With Coverage | Without Coverage |
| Under 6 Years | 5,625 (92.9%) | 428 (7.1%) |
| 6 to 18 Years | 13,193 (94.9%) | 706 (5.1%) |
| 19 to 25 Years | 6,058 (76.0%) | 1,910 (24.0%) |
| 26 to 34 Years | 7,001 (75.3%) | 2,301 (24.7%) |
| 35 to 44 Years | 7,938 (77.9%) | 2,255 (22.1%) |
| 45 to 54 Years | 8,388 (85.5%) | 1,427 (14.5%) |
| 55 to 64 Years | 9,633 (87.1%) | 1,424 (12.9%) |
| 65 to 74 Years | 8,144 (99.9%) | 7 (0.1%) |
| 75 Years and older | 5,405 (100.0%) | 0 (0.0%) |
| Total | 71,385 (87.2%) | 10,458 (12.8%) |
Health Insurance Coverage by Citizenship Status in Buchanan County
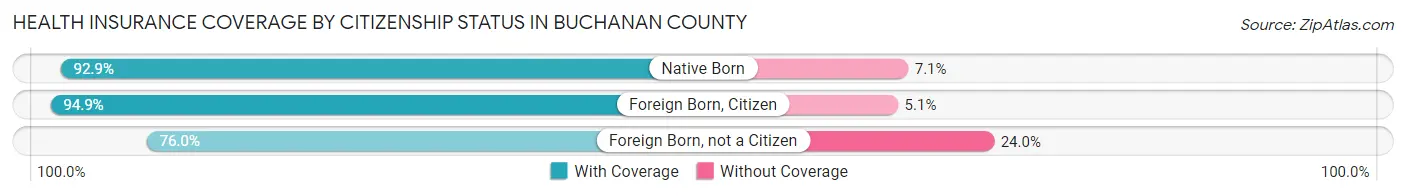
| Citizenship Status | With Coverage | Without Coverage |
| Native Born | 5,625 (92.9%) | 428 (7.1%) |
| Foreign Born, Citizen | 13,193 (94.9%) | 706 (5.1%) |
| Foreign Born, not a Citizen | 6,058 (76.0%) | 1,910 (24.0%) |
Health Insurance Coverage by Household Income in Buchanan County
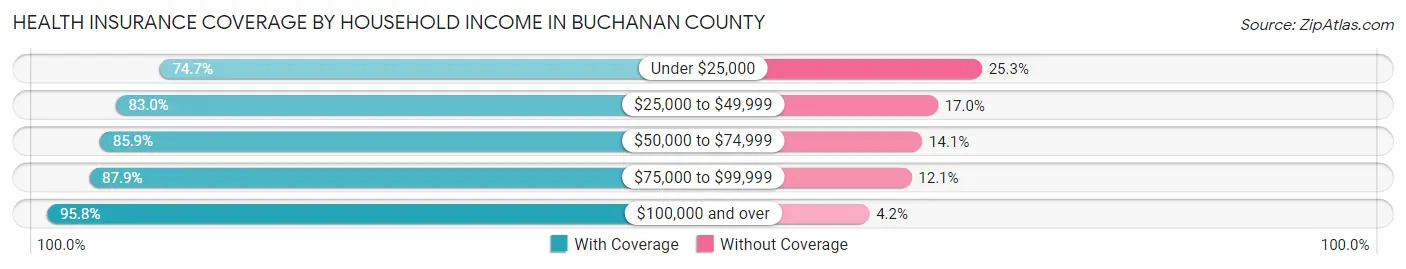
| Household Income | With Coverage | Without Coverage |
| Under $25,000 | 9,144 (74.7%) | 3,093 (25.3%) |
| $25,000 to $49,999 | 13,003 (83.0%) | 2,669 (17.0%) |
| $50,000 to $74,999 | 11,690 (85.9%) | 1,920 (14.1%) |
| $75,000 to $99,999 | 11,744 (87.9%) | 1,616 (12.1%) |
| $100,000 and over | 24,685 (95.8%) | 1,083 (4.2%) |
Public vs Private Health Insurance Coverage by Age in Buchanan County
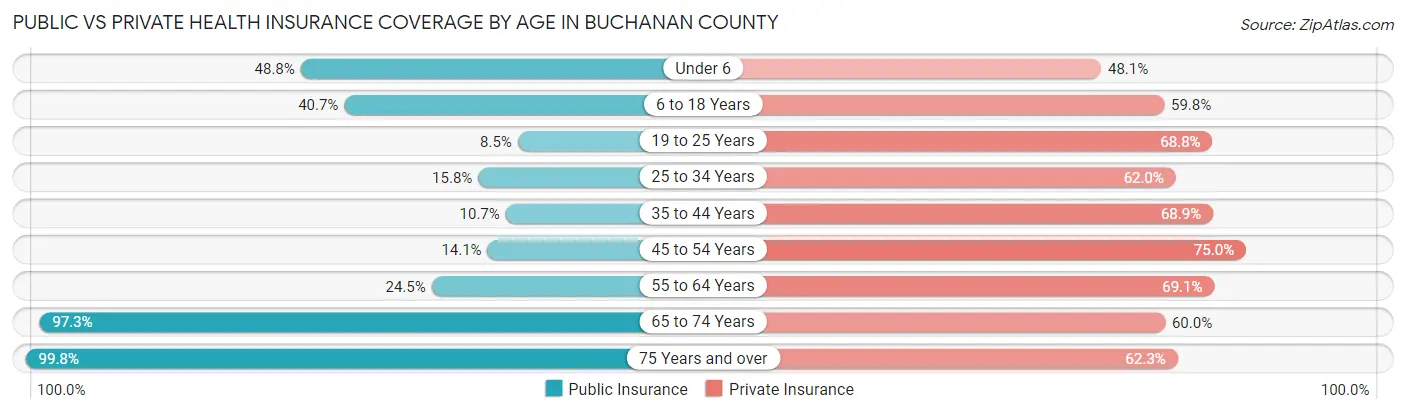
| Age Bracket | Public Insurance | Private Insurance |
| Under 6 | 2,952 (48.8%) | 2,913 (48.1%) |
| 6 to 18 Years | 5,654 (40.7%) | 8,315 (59.8%) |
| 19 to 25 Years | 675 (8.5%) | 5,481 (68.8%) |
| 25 to 34 Years | 1,471 (15.8%) | 5,764 (62.0%) |
| 35 to 44 Years | 1,093 (10.7%) | 7,022 (68.9%) |
| 45 to 54 Years | 1,383 (14.1%) | 7,363 (75.0%) |
| 55 to 64 Years | 2,704 (24.5%) | 7,644 (69.1%) |
| 65 to 74 Years | 7,928 (97.3%) | 4,890 (60.0%) |
| 75 Years and over | 5,395 (99.8%) | 3,369 (62.3%) |
| Total | 29,255 (35.7%) | 52,761 (64.5%) |
Disability Status by Sex by Age in Buchanan County
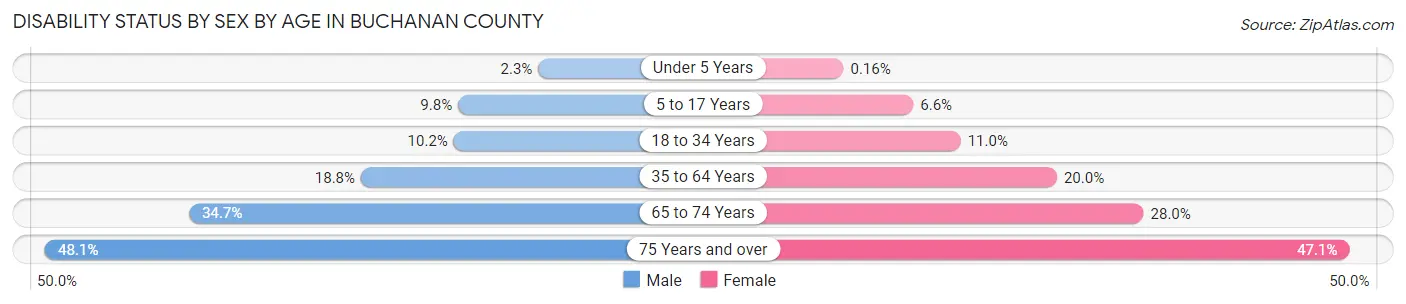
| Age Bracket | Male | Female |
| Under 5 Years | 64 (2.3%) | 4 (0.2%) |
| 5 to 17 Years | 683 (9.8%) | 450 (6.6%) |
| 18 to 34 Years | 938 (10.2%) | 1,000 (11.0%) |
| 35 to 64 Years | 2,944 (18.8%) | 3,075 (20.0%) |
| 65 to 74 Years | 1,331 (34.7%) | 1,210 (28.0%) |
| 75 Years and over | 1,037 (48.1%) | 1,530 (47.1%) |
Disability Class by Sex by Age in Buchanan County
Disability Class: Hearing Difficulty
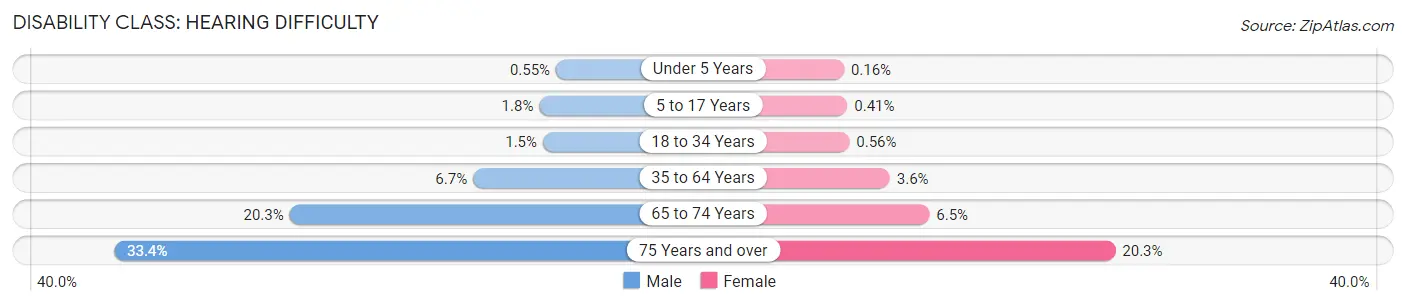
| Age Bracket | Male | Female |
| Under 5 Years | 15 (0.5%) | 4 (0.2%) |
| 5 to 17 Years | 125 (1.8%) | 28 (0.4%) |
| 18 to 34 Years | 140 (1.5%) | 51 (0.6%) |
| 35 to 64 Years | 1,051 (6.7%) | 550 (3.6%) |
| 65 to 74 Years | 779 (20.3%) | 281 (6.5%) |
| 75 Years and over | 719 (33.4%) | 660 (20.3%) |
Disability Class: Vision Difficulty
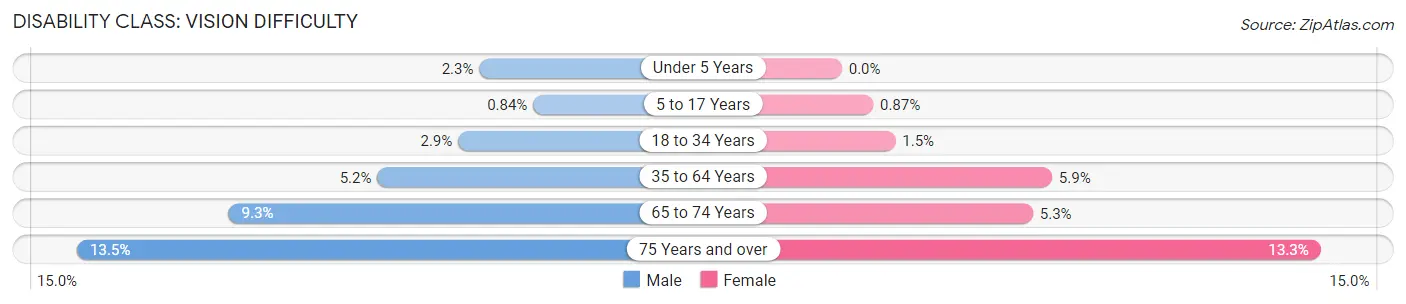
| Age Bracket | Male | Female |
| Under 5 Years | 64 (2.3%) | 0 (0.0%) |
| 5 to 17 Years | 59 (0.8%) | 59 (0.9%) |
| 18 to 34 Years | 270 (2.9%) | 135 (1.5%) |
| 35 to 64 Years | 811 (5.2%) | 900 (5.9%) |
| 65 to 74 Years | 357 (9.3%) | 230 (5.3%) |
| 75 Years and over | 292 (13.5%) | 433 (13.3%) |
Disability Class: Cognitive Difficulty
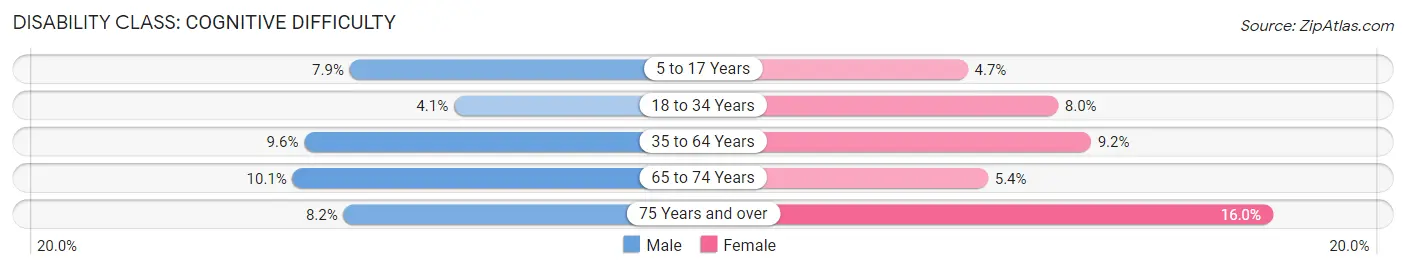
| Age Bracket | Male | Female |
| 5 to 17 Years | 554 (7.9%) | 316 (4.7%) |
| 18 to 34 Years | 374 (4.1%) | 726 (8.0%) |
| 35 to 64 Years | 1,507 (9.6%) | 1,422 (9.2%) |
| 65 to 74 Years | 385 (10.1%) | 234 (5.4%) |
| 75 Years and over | 176 (8.2%) | 520 (16.0%) |
Disability Class: Ambulatory Difficulty
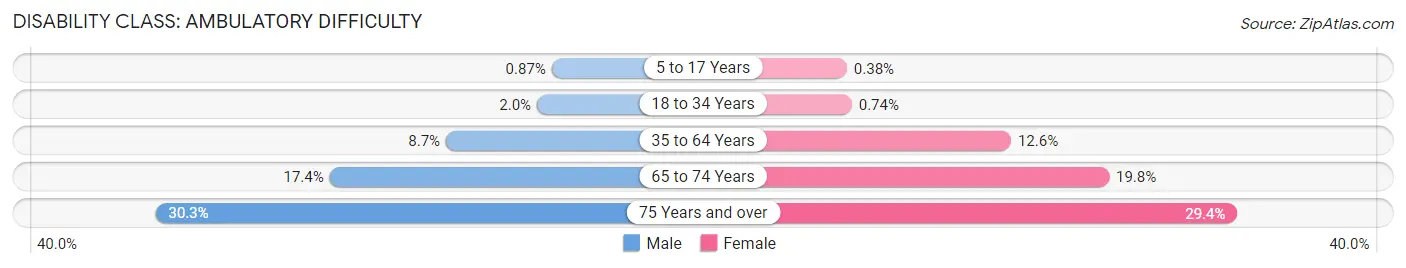
| Age Bracket | Male | Female |
| 5 to 17 Years | 61 (0.9%) | 26 (0.4%) |
| 18 to 34 Years | 181 (2.0%) | 67 (0.7%) |
| 35 to 64 Years | 1,367 (8.7%) | 1,934 (12.6%) |
| 65 to 74 Years | 665 (17.4%) | 857 (19.8%) |
| 75 Years and over | 653 (30.3%) | 954 (29.4%) |
Disability Class: Self-Care Difficulty
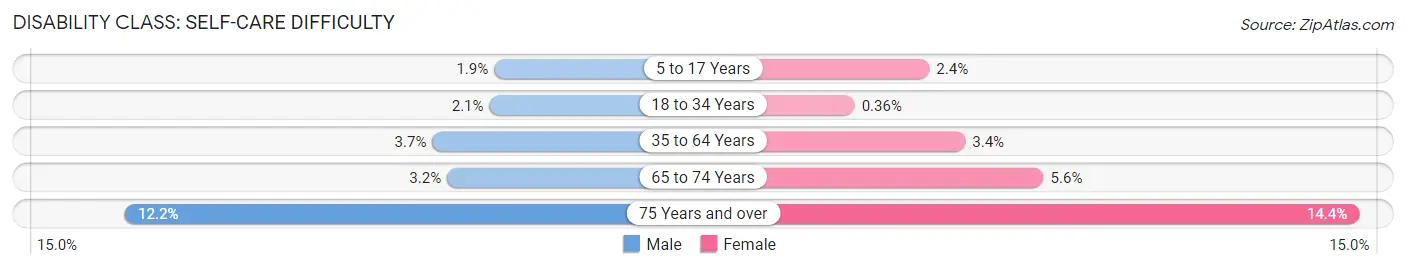
| Age Bracket | Male | Female |
| 5 to 17 Years | 135 (1.9%) | 165 (2.4%) |
| 18 to 34 Years | 190 (2.1%) | 33 (0.4%) |
| 35 to 64 Years | 572 (3.6%) | 529 (3.4%) |
| 65 to 74 Years | 124 (3.2%) | 243 (5.6%) |
| 75 Years and over | 263 (12.2%) | 468 (14.4%) |
Technology Access in Buchanan County
Computing Device Access in Buchanan County
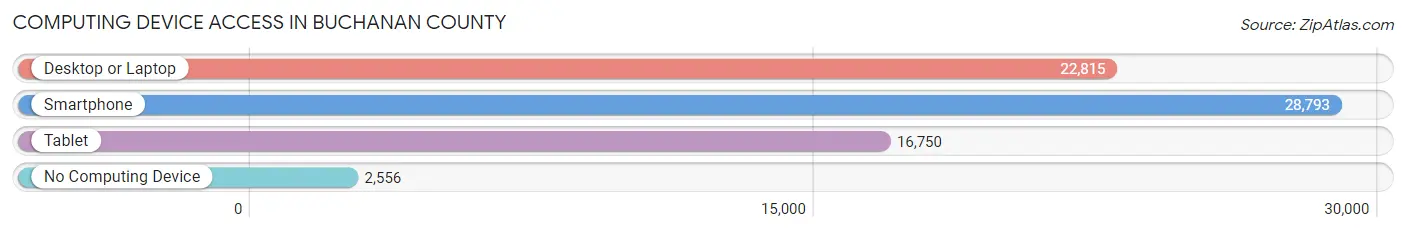
| Device Type | # Households | % Households |
| Desktop or Laptop | 22,815 | 68.4% |
| Smartphone | 28,793 | 86.3% |
| Tablet | 16,750 | 50.2% |
| No Computing Device | 2,556 | 7.7% |
| Total | 33,363 | 100.0% |
Internet Access in Buchanan County
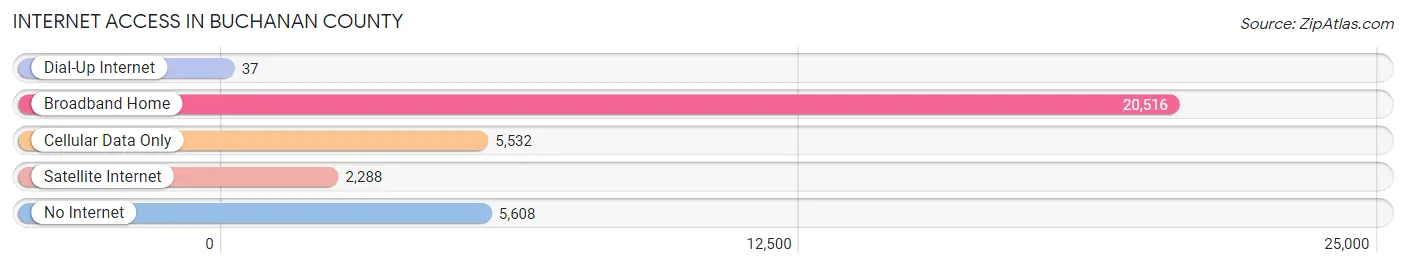
| Internet Type | # Households | % Households |
| Dial-Up Internet | 37 | 0.1% |
| Broadband Home | 20,516 | 61.5% |
| Cellular Data Only | 5,532 | 16.6% |
| Satellite Internet | 2,288 | 6.9% |
| No Internet | 5,608 | 16.8% |
| Total | 33,363 | 100.0% |
Buchanan County Summary
Buchanan County, Missouri is located in the northwest corner of the state and is part of the St. Joseph Metropolitan Statistical Area. It is bordered by Andrew County to the north, DeKalb County to the east, Clinton County to the south, and Platte County to the west. The county seat is St. Joseph, which is also the largest city in the county. As of the 2010 census, the population of Buchanan County was 89,201, making it the fourth most populous county in Missouri.
Geography
Buchanan County covers an area of 545 square miles, making it the fourth largest county in Missouri. The county is located in the northwest corner of the state and is part of the St. Joseph Metropolitan Statistical Area. It is bordered by Andrew County to the north, DeKalb County to the east, Clinton County to the south, and Platte County to the west. The county is mostly flat, with some rolling hills in the northern and western parts. The Missouri River forms the western border of the county, and the Platte River forms the northern border. The county is home to several parks, including the St. Joseph City Park, the Moila Country Club, and the Moila Shriners Park.
History
Buchanan County was established in 1838 and named after James Buchanan, the 15th President of the United States. The county was originally part of the Platte Purchase, which was a large tract of land purchased by the United States from the Native American tribes in the area. The county was initially populated by settlers from the east, but by the late 19th century, the population had grown to include many German and Irish immigrants. The county was an important center for the Union during the Civil War, and St. Joseph was a major stop on the Pony Express.
Economy
Buchanan County has a diverse economy, with a mix of manufacturing, agriculture, and services. The county is home to several large employers, including Mosaic Life Care, a regional health care provider, and Triumph Foods, a pork processing plant. The county is also home to several smaller businesses, including a number of wineries and craft breweries. Agriculture is an important part of the economy, with corn, soybeans, and hay being the main crops.
Demographics
As of the 2010 census, the population of Buchanan County was 89,201, making it the fourth most populous county in Missouri. The population is fairly evenly split between men and women, with 49.3% male and 50.7% female. The median age is 36.7 years, and the median household income is $45,945. The racial makeup of the county is 87.3% White, 8.2% African American, 1.2% Asian, 0.7% Native American, and 2.6% from other races.
Buchanan County is a diverse and vibrant community, with a mix of cultures and backgrounds. The county is home to a variety of attractions, including the Pony Express Museum, the St. Joseph Museum, and the Glore Psychiatric Museum. The county is also home to several parks and outdoor recreation areas, making it a great place to live and visit.
Common Questions
What is Per Capita Income in Buchanan County?
Per Capita income in Buchanan County is $31,886.
What is the Median Family Income in Buchanan County?
Median Family Income in Buchanan County is $72,627.
What is the Median Household income in Buchanan County?
Median Household Income in Buchanan County is $58,303.
What is Income or Wage Gap in Buchanan County?
Income or Wage Gap in Buchanan County is 25.6%.
Women in Buchanan County earn 74.4 cents for every dollar earned by a man.
What is Family Income Deficit in Buchanan County?
Family Income Deficit in Buchanan County is $11,672.
Families that are below poverty line in Buchanan County earn $11,672 less on average than the poverty threshold level.
What is Inequality or Gini Index in Buchanan County?
Inequality or Gini Index in Buchanan County is 0.47.
What is the Total Population of Buchanan County?
Total Population of Buchanan County is 84,544.
What is the Total Male Population of Buchanan County?
Total Male Population of Buchanan County is 42,811.
What is the Total Female Population of Buchanan County?
Total Female Population of Buchanan County is 41,733.
What is the Ratio of Males per 100 Females in Buchanan County?
There are 102.58 Males per 100 Females in Buchanan County.
What is the Ratio of Females per 100 Males in Buchanan County?
There are 97.48 Females per 100 Males in Buchanan County.
What is the Median Population Age in Buchanan County?
Median Population Age in Buchanan County is 38.6 Years.
What is the Average Family Size in Buchanan County
Average Family Size in Buchanan County is 3.1 People.
What is the Average Household Size in Buchanan County
Average Household Size in Buchanan County is 2.4 People.
How Large is the Labor Force in Buchanan County?
There are 40,947 People in the Labor Forcein in Buchanan County.
What is the Percentage of People in the Labor Force in Buchanan County?
60.3% of People are in the Labor Force in Buchanan County.
What is the Unemployment Rate in Buchanan County?
Unemployment Rate in Buchanan County is 4.8%.