Bates County, MO Map & Demographics
Bates County Overview
$27,333
PER CAPITA INCOME
$73,576
AVG FAMILY INCOME
$54,122
AVG HOUSEHOLD INCOME
36.2%
WAGE / INCOME GAP [ % ]
63.8¢/ $1
WAGE / INCOME GAP [ $ ]
$11,243
FAMILY INCOME DEFICIT
0.43
INEQUALITY / GINI INDEX
16,101
TOTAL POPULATION
8,064
MALE POPULATION
8,037
FEMALE POPULATION
100.34
MALES / 100 FEMALES
99.67
FEMALES / 100 MALES
40.7
MEDIAN AGE
3.2
AVG FAMILY SIZE
2.7
AVG HOUSEHOLD SIZE
7,583
LABOR FORCE [ PEOPLE ]
59.1%
PERCENT IN LABOR FORCE
7.5%
UNEMPLOYMENT RATE
Income in Bates County
Income Overview in Bates County
Per Capita Income in Bates County is $27,333, while median incomes of families and households are $73,576 and $54,122 respectively.
| Characteristic | Number | Measure |
| Per Capita Income | 16,101 | $27,333 |
| Median Family Income | 3,974 | $73,576 |
| Mean Family Income | 3,974 | $84,615 |
| Median Household Income | 5,929 | $54,122 |
| Mean Household Income | 5,929 | $69,511 |
| Income Deficit | 3,974 | $11,243 |
| Wage / Income Gap (%) | 16,101 | 36.18% |
| Wage / Income Gap ($) | 16,101 | 63.82¢ per $1 |
| Gini / Inequality Index | 16,101 | 0.43 |
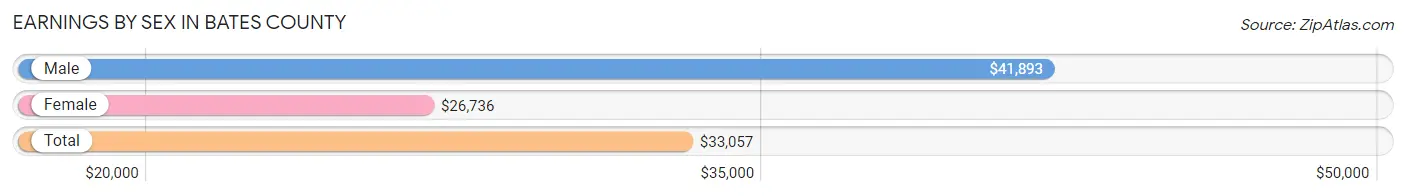
Earnings by Sex in Bates County
Average Earnings in Bates County are $33,057, $41,893 for men and $26,736 for women, a difference of 36.2%.
| Sex | Number | Average Earnings |
| Male | 4,199 (54.1%) | $41,893 |
| Female | 3,559 (45.9%) | $26,736 |
| Total | 7,758 (100.0%) | $33,057 |
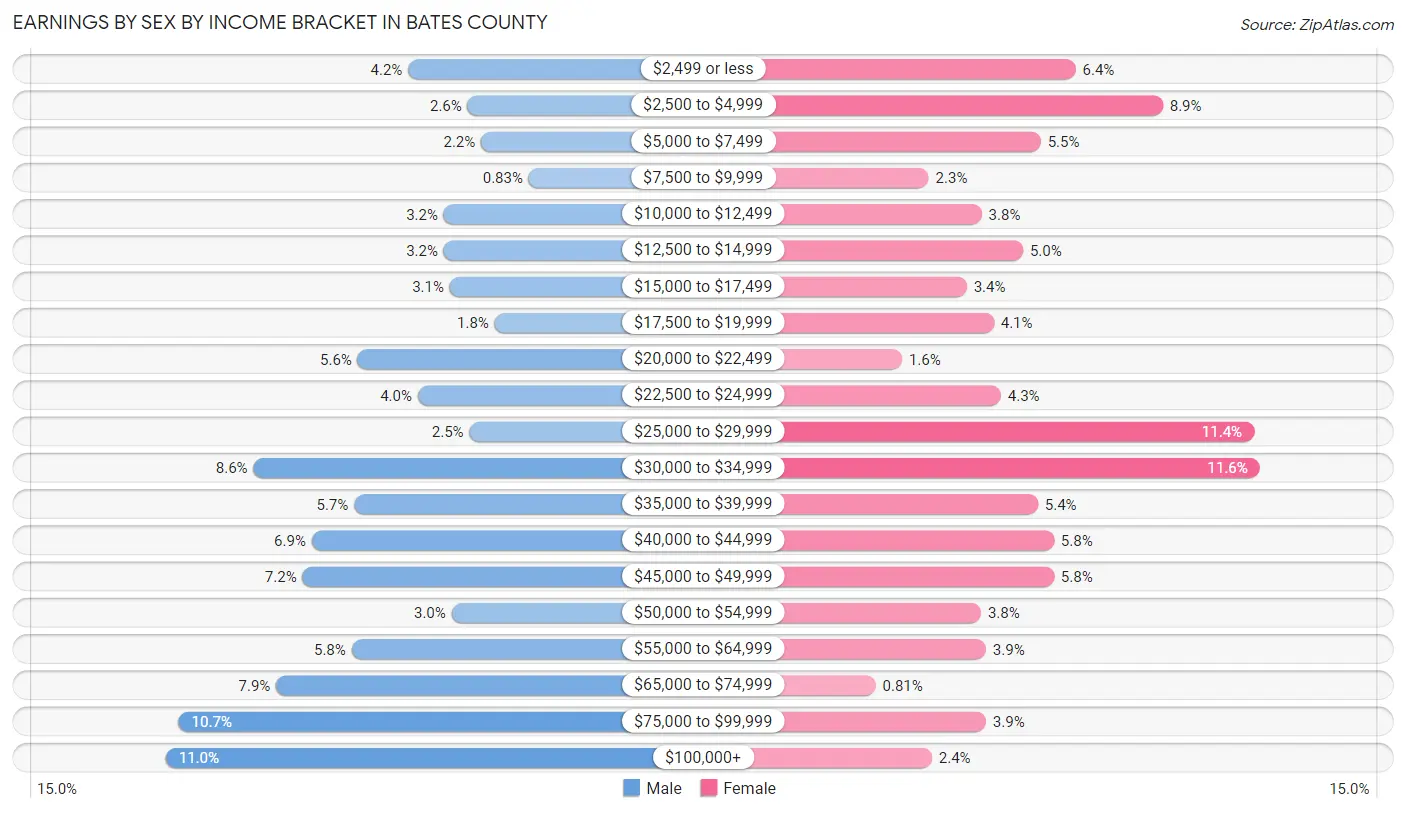
Earnings by Sex by Income Bracket in Bates County
The most common earnings brackets in Bates County are $100,000+ for men (463 | 11.0%) and $30,000 to $34,999 for women (413 | 11.6%).
| Income | Male | Female |
| $2,499 or less | 177 (4.2%) | 229 (6.4%) |
| $2,500 to $4,999 | 107 (2.5%) | 316 (8.9%) |
| $5,000 to $7,499 | 91 (2.2%) | 194 (5.4%) |
| $7,500 to $9,999 | 35 (0.8%) | 82 (2.3%) |
| $10,000 to $12,499 | 135 (3.2%) | 135 (3.8%) |
| $12,500 to $14,999 | 135 (3.2%) | 176 (5.0%) |
| $15,000 to $17,499 | 128 (3.0%) | 120 (3.4%) |
| $17,500 to $19,999 | 75 (1.8%) | 147 (4.1%) |
| $20,000 to $22,499 | 237 (5.6%) | 55 (1.5%) |
| $22,500 to $24,999 | 166 (4.0%) | 154 (4.3%) |
| $25,000 to $29,999 | 105 (2.5%) | 407 (11.4%) |
| $30,000 to $34,999 | 360 (8.6%) | 413 (11.6%) |
| $35,000 to $39,999 | 241 (5.7%) | 191 (5.4%) |
| $40,000 to $44,999 | 291 (6.9%) | 207 (5.8%) |
| $45,000 to $49,999 | 302 (7.2%) | 207 (5.8%) |
| $50,000 to $54,999 | 126 (3.0%) | 134 (3.8%) |
| $55,000 to $64,999 | 244 (5.8%) | 139 (3.9%) |
| $65,000 to $74,999 | 333 (7.9%) | 29 (0.8%) |
| $75,000 to $99,999 | 448 (10.7%) | 139 (3.9%) |
| $100,000+ | 463 (11.0%) | 85 (2.4%) |
| Total | 4,199 (100.0%) | 3,559 (100.0%) |
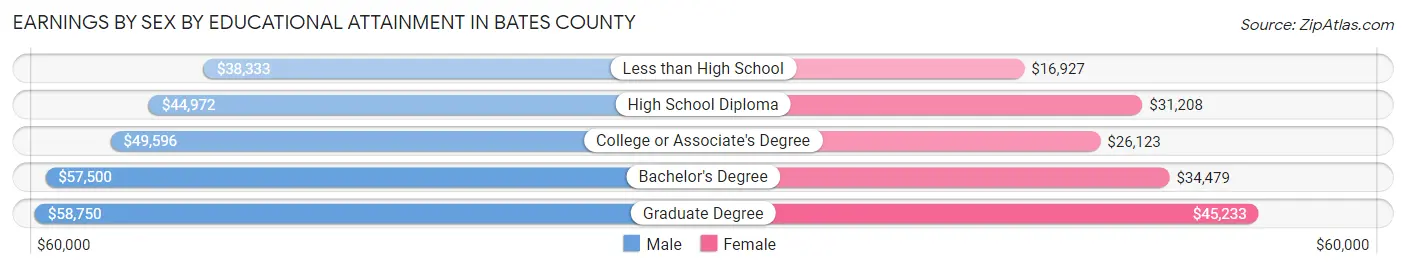
Earnings by Sex by Educational Attainment in Bates County
Average earnings in Bates County are $46,615 for men and $29,855 for women, a difference of 35.9%. Men with an educational attainment of graduate degree enjoy the highest average annual earnings of $58,750, while those with less than high school education earn the least with $38,333. Women with an educational attainment of graduate degree earn the most with the average annual earnings of $45,233, while those with less than high school education have the smallest earnings of $16,927.
| Educational Attainment | Male Income | Female Income |
| Less than High School | $38,333 | $16,927 |
| High School Diploma | $44,972 | $31,208 |
| College or Associate's Degree | $49,596 | $26,123 |
| Bachelor's Degree | $57,500 | $34,479 |
| Graduate Degree | $58,750 | $45,233 |
| Total | $46,615 | $29,855 |
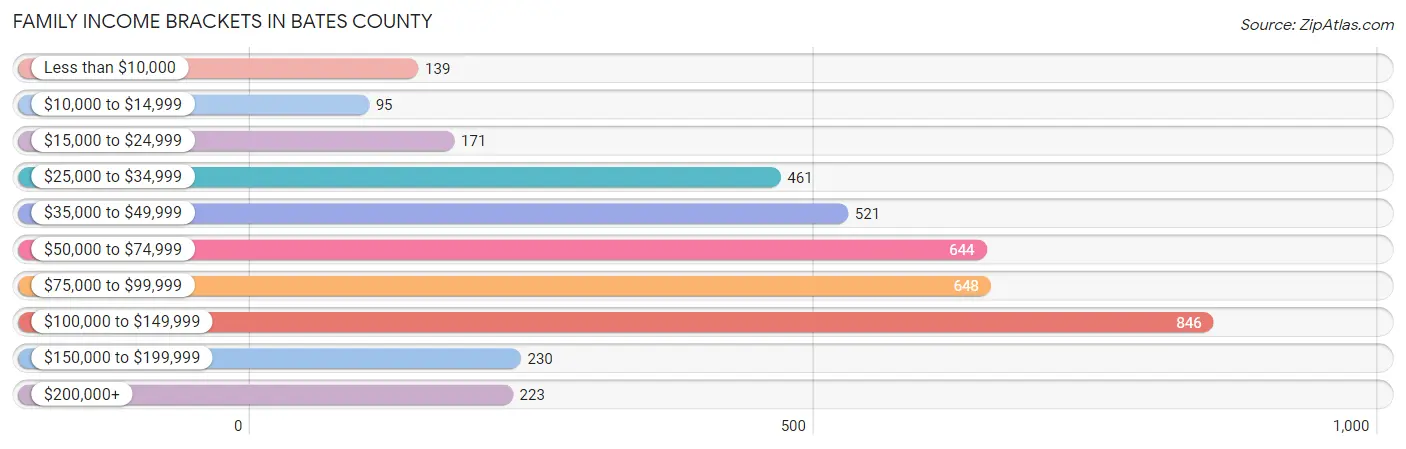
Family Income in Bates County
Family Income Brackets in Bates County
According to the Bates County family income data, there are 846 families falling into the $100,000 to $149,999 income range, which is the most common income bracket and makes up 21.3% of all families. Conversely, the $10,000 to $14,999 income bracket is the least frequent group with only 95 families (2.4%) belonging to this category.
| Income Bracket | # Families | % Families |
| Less than $10,000 | 139 | 3.5% |
| $10,000 to $14,999 | 95 | 2.4% |
| $15,000 to $24,999 | 171 | 4.3% |
| $25,000 to $34,999 | 461 | 11.6% |
| $35,000 to $49,999 | 521 | 13.1% |
| $50,000 to $74,999 | 644 | 16.2% |
| $75,000 to $99,999 | 648 | 16.3% |
| $100,000 to $149,999 | 846 | 21.3% |
| $150,000 to $199,999 | 230 | 5.8% |
| $200,000+ | 223 | 5.6% |
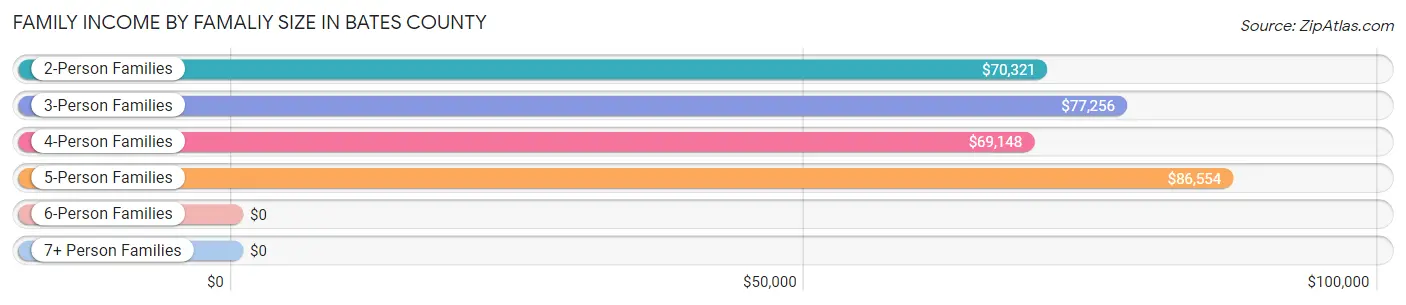
Family Income by Famaliy Size in Bates County
5-person families (360 | 9.1%) account for the highest median family income in Bates County with $86,554 per family, while 2-person families (2,149 | 54.1%) have the highest median income of $35,160 per family member.
| Income Bracket | # Families | Median Income |
| 2-Person Families | 2,149 (54.1%) | $70,321 |
| 3-Person Families | 672 (16.9%) | $77,256 |
| 4-Person Families | 537 (13.5%) | $69,148 |
| 5-Person Families | 360 (9.1%) | $86,554 |
| 6-Person Families | 161 (4.1%) | $0 |
| 7+ Person Families | 95 (2.4%) | $0 |
| Total | 3,974 (100.0%) | $73,576 |
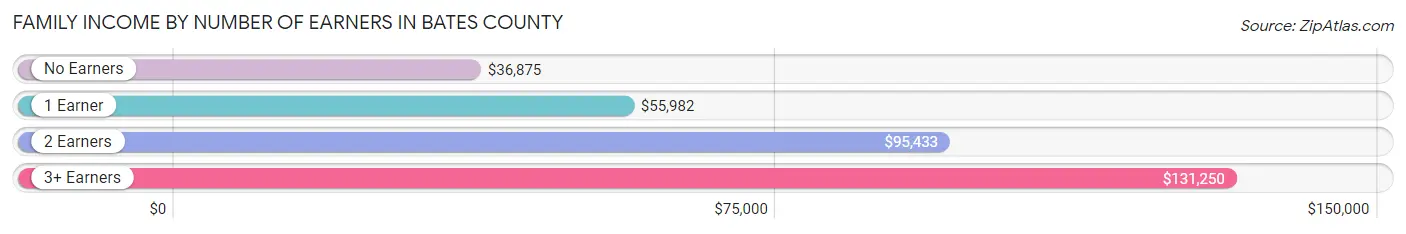
Family Income by Number of Earners in Bates County
The median family income in Bates County is $73,576, with families comprising 3+ earners (399) having the highest median family income of $131,250, while families with no earners (736) have the lowest median family income of $36,875, accounting for 10.0% and 18.5% of families, respectively.
| Number of Earners | # Families | Median Income |
| No Earners | 736 (18.5%) | $36,875 |
| 1 Earner | 1,356 (34.1%) | $55,982 |
| 2 Earners | 1,483 (37.3%) | $95,433 |
| 3+ Earners | 399 (10.0%) | $131,250 |
| Total | 3,974 (100.0%) | $73,576 |
Household Income in Bates County
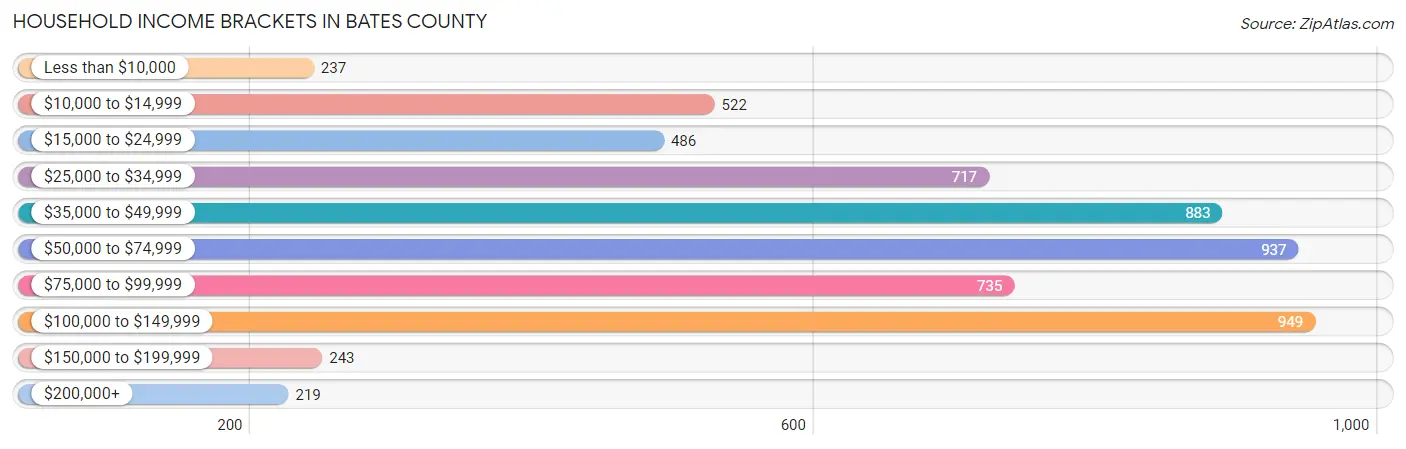
Household Income Brackets in Bates County
With 949 households falling in the category, the $100,000 to $149,999 income range is the most frequent in Bates County, accounting for 16.0% of all households. In contrast, only 219 households (3.7%) fall into the $200,000+ income bracket, making it the least populous group.
| Income Bracket | # Households | % Households |
| Less than $10,000 | 237 | 4.0% |
| $10,000 to $14,999 | 522 | 8.8% |
| $15,000 to $24,999 | 486 | 8.2% |
| $25,000 to $34,999 | 717 | 12.1% |
| $35,000 to $49,999 | 883 | 14.9% |
| $50,000 to $74,999 | 937 | 15.8% |
| $75,000 to $99,999 | 735 | 12.4% |
| $100,000 to $149,999 | 949 | 16.0% |
| $150,000 to $199,999 | 243 | 4.1% |
| $200,000+ | 219 | 3.7% |
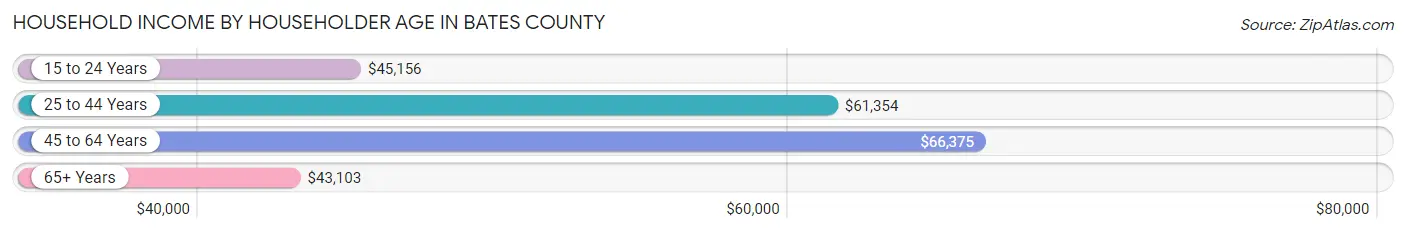
Household Income by Householder Age in Bates County
The median household income in Bates County is $54,122, with the highest median household income of $66,375 found in the 45 to 64 years age bracket for the primary householder. A total of 2,325 households (39.2%) fall into this category. Meanwhile, the 65+ years age bracket for the primary householder has the lowest median household income of $43,103, with 1,832 households (30.9%) in this group.
| Income Bracket | # Households | Median Income |
| 15 to 24 Years | 151 (2.5%) | $45,156 |
| 25 to 44 Years | 1,621 (27.3%) | $61,354 |
| 45 to 64 Years | 2,325 (39.2%) | $66,375 |
| 65+ Years | 1,832 (30.9%) | $43,103 |
| Total | 5,929 (100.0%) | $54,122 |
Poverty in Bates County
Income Below Poverty by Sex and Age in Bates County
With 16.4% poverty level for males and 21.8% for females among the residents of Bates County, 15 year old males and under 5 year old females are the most vulnerable to poverty, with 52 males (52.5%) and 194 females (38.4%) in their respective age groups living below the poverty level.
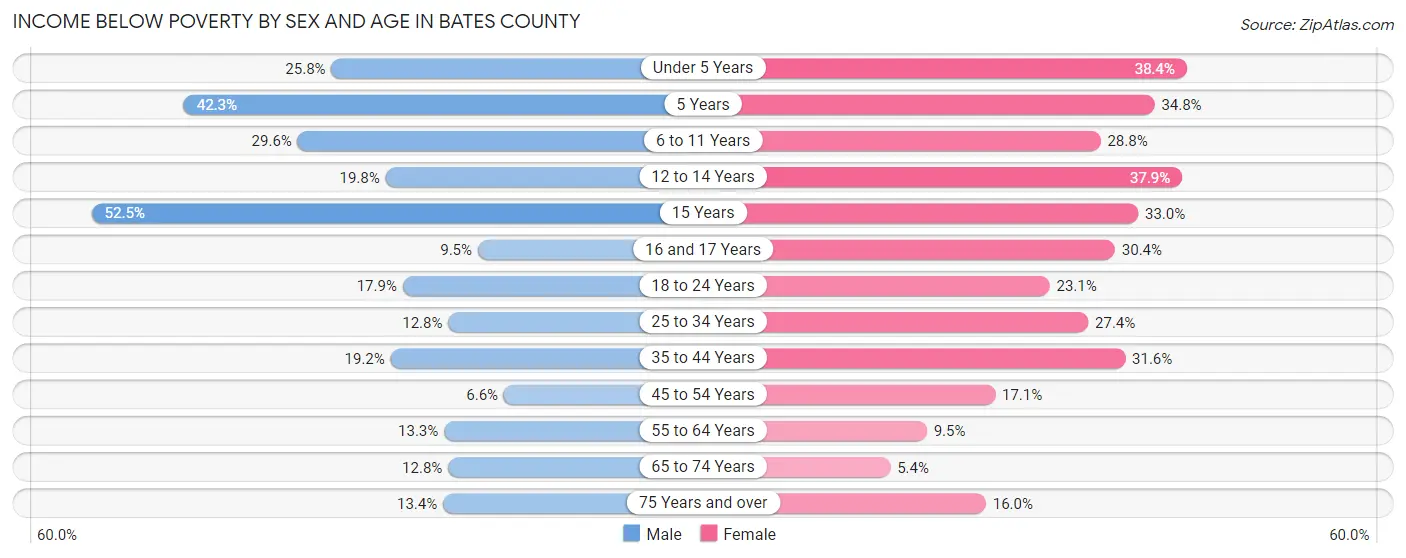
| Age Bracket | Male | Female |
| Under 5 Years | 125 (25.8%) | 194 (38.4%) |
| 5 Years | 41 (42.3%) | 39 (34.8%) |
| 6 to 11 Years | 182 (29.6%) | 138 (28.8%) |
| 12 to 14 Years | 58 (19.8%) | 141 (37.9%) |
| 15 Years | 52 (52.5%) | 32 (33.0%) |
| 16 and 17 Years | 28 (9.5%) | 66 (30.4%) |
| 18 to 24 Years | 117 (17.9%) | 131 (23.1%) |
| 25 to 34 Years | 123 (12.8%) | 240 (27.4%) |
| 35 to 44 Years | 163 (19.2%) | 294 (31.6%) |
| 45 to 54 Years | 63 (6.6%) | 157 (17.1%) |
| 55 to 64 Years | 162 (13.3%) | 111 (9.5%) |
| 65 to 74 Years | 106 (12.8%) | 46 (5.4%) |
| 75 Years and over | 65 (13.4%) | 119 (16.0%) |
| Total | 1,285 (16.4%) | 1,708 (21.8%) |
Income Above Poverty by Sex and Age in Bates County
According to the poverty statistics in Bates County, males aged 45 to 54 years and females aged 65 to 74 years are the age groups that are most secure financially, with 93.4% of males and 94.6% of females in these age groups living above the poverty line.
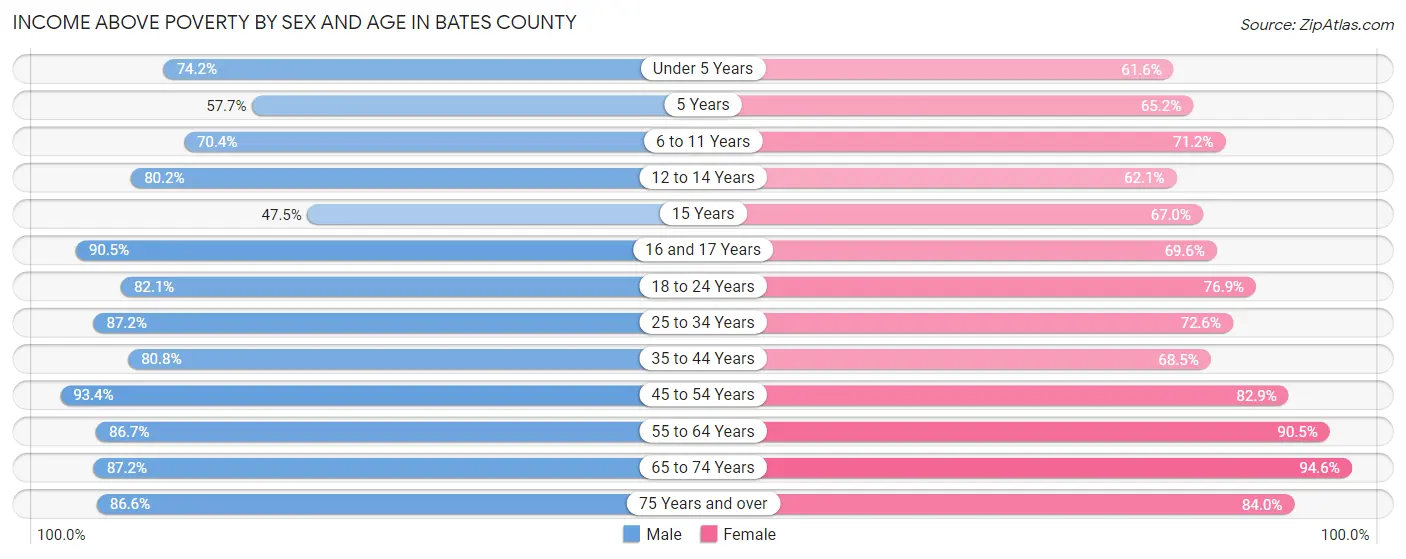
| Age Bracket | Male | Female |
| Under 5 Years | 359 (74.2%) | 311 (61.6%) |
| 5 Years | 56 (57.7%) | 73 (65.2%) |
| 6 to 11 Years | 433 (70.4%) | 341 (71.2%) |
| 12 to 14 Years | 235 (80.2%) | 231 (62.1%) |
| 15 Years | 47 (47.5%) | 65 (67.0%) |
| 16 and 17 Years | 266 (90.5%) | 151 (69.6%) |
| 18 to 24 Years | 537 (82.1%) | 435 (76.9%) |
| 25 to 34 Years | 837 (87.2%) | 635 (72.6%) |
| 35 to 44 Years | 684 (80.8%) | 638 (68.4%) |
| 45 to 54 Years | 889 (93.4%) | 763 (82.9%) |
| 55 to 64 Years | 1,058 (86.7%) | 1,062 (90.5%) |
| 65 to 74 Years | 720 (87.2%) | 808 (94.6%) |
| 75 Years and over | 420 (86.6%) | 623 (84.0%) |
| Total | 6,541 (83.6%) | 6,136 (78.2%) |
Income Below Poverty Among Married-Couple Families in Bates County
The poverty statistics for married-couple families in Bates County show that 5.7% or 175 of the total 3,065 families live below the poverty line. Families with 3 or 4 children have the highest poverty rate of 29.8%, comprising of 104 families. On the other hand, families with no children have the lowest poverty rate of 1.6%, which includes 31 families.
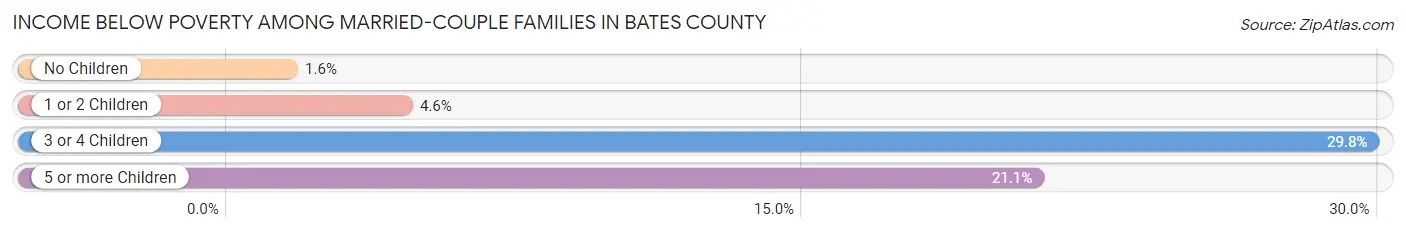
| Children | Above Poverty | Below Poverty |
| No Children | 1,947 (98.4%) | 31 (1.6%) |
| 1 or 2 Children | 668 (95.4%) | 32 (4.6%) |
| 3 or 4 Children | 245 (70.2%) | 104 (29.8%) |
| 5 or more Children | 30 (78.9%) | 8 (21.0%) |
| Total | 2,890 (94.3%) | 175 (5.7%) |
Income Below Poverty Among Single-Parent Households in Bates County
According to the poverty data in Bates County, 19.5% or 64 single-father households and 46.9% or 272 single-mother households are living below the poverty line. Among single-father households, those with 5 or more children have the highest poverty rate, with 2 households (100.0%) experiencing poverty. Likewise, among single-mother households, those with 5 or more children have the highest poverty rate, with 43 households (100.0%) falling below the poverty line.
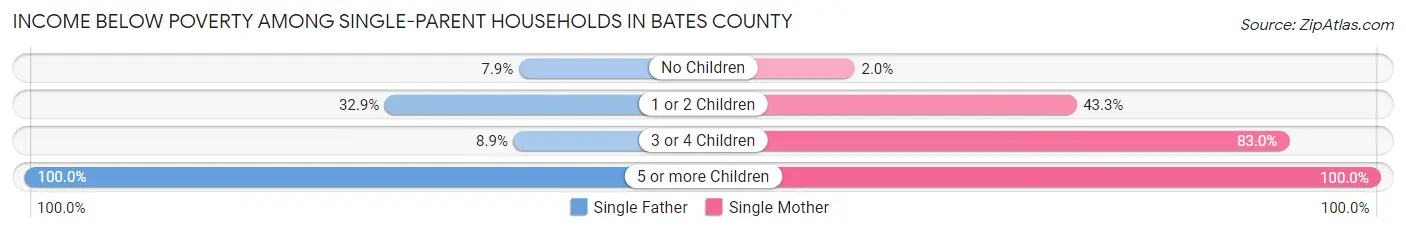
| Children | Single Father | Single Mother |
| No Children | 11 (7.9%) | 2 (2.0%) |
| 1 or 2 Children | 47 (32.9%) | 149 (43.3%) |
| 3 or 4 Children | 4 (8.9%) | 78 (83.0%) |
| 5 or more Children | 2 (100.0%) | 43 (100.0%) |
| Total | 64 (19.5%) | 272 (46.9%) |
Income Below Poverty Among Married-Couple vs Single-Parent Households in Bates County
The poverty data for Bates County shows that 175 of the married-couple family households (5.7%) and 336 of the single-parent households (37.0%) are living below the poverty level. Within the married-couple family households, those with 3 or 4 children have the highest poverty rate, with 104 households (29.8%) falling below the poverty line. Among the single-parent households, those with 5 or more children have the highest poverty rate, with 45 household (100.0%) living below poverty.
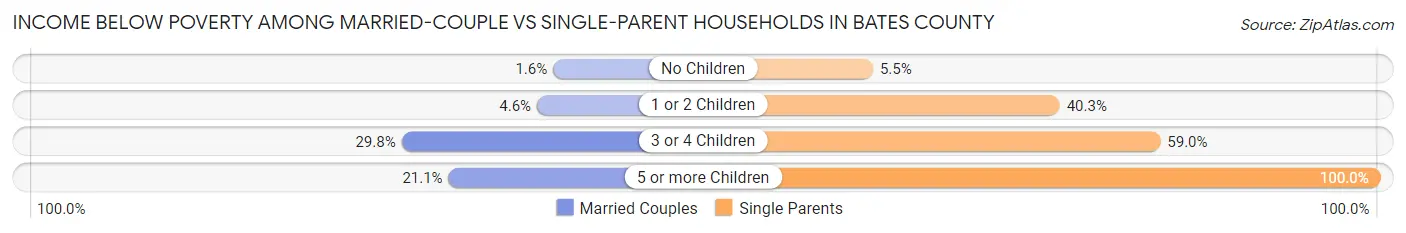
| Children | Married-Couple Families | Single-Parent Households |
| No Children | 31 (1.6%) | 13 (5.5%) |
| 1 or 2 Children | 32 (4.6%) | 196 (40.3%) |
| 3 or 4 Children | 104 (29.8%) | 82 (59.0%) |
| 5 or more Children | 8 (21.0%) | 45 (100.0%) |
| Total | 175 (5.7%) | 336 (37.0%) |
Race in Bates County
The most populous races in Bates County are White / Caucasian (14,970 | 93.0%), Two or more Races (440 | 2.7%), and Hispanic or Latino (434 | 2.7%).
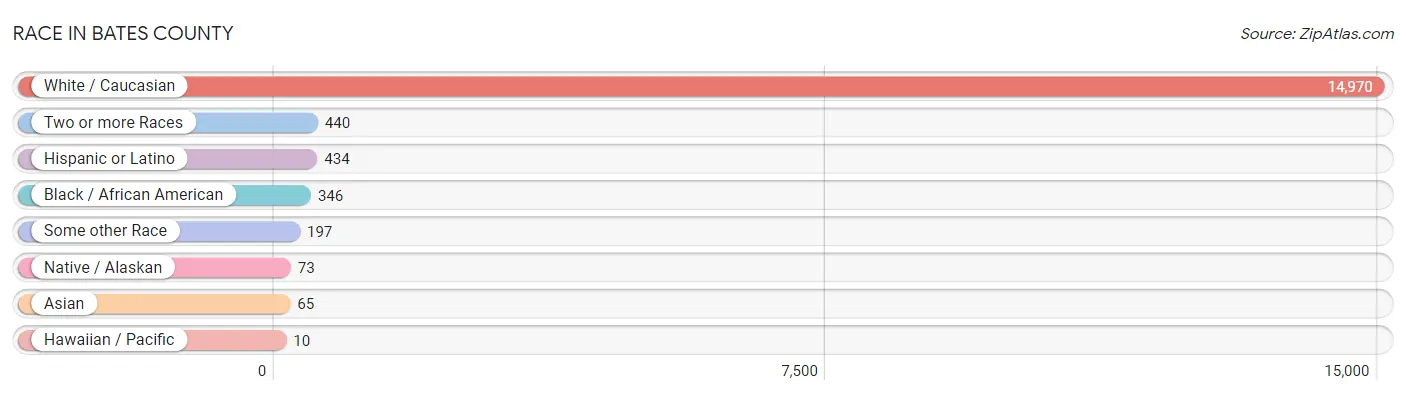
| Race | # Population | % Population |
| Asian | 65 | 0.4% |
| Black / African American | 346 | 2.1% |
| Hawaiian / Pacific | 10 | 0.1% |
| Hispanic or Latino | 434 | 2.7% |
| Native / Alaskan | 73 | 0.4% |
| White / Caucasian | 14,970 | 93.0% |
| Two or more Races | 440 | 2.7% |
| Some other Race | 197 | 1.2% |
| Total | 16,101 | 100.0% |
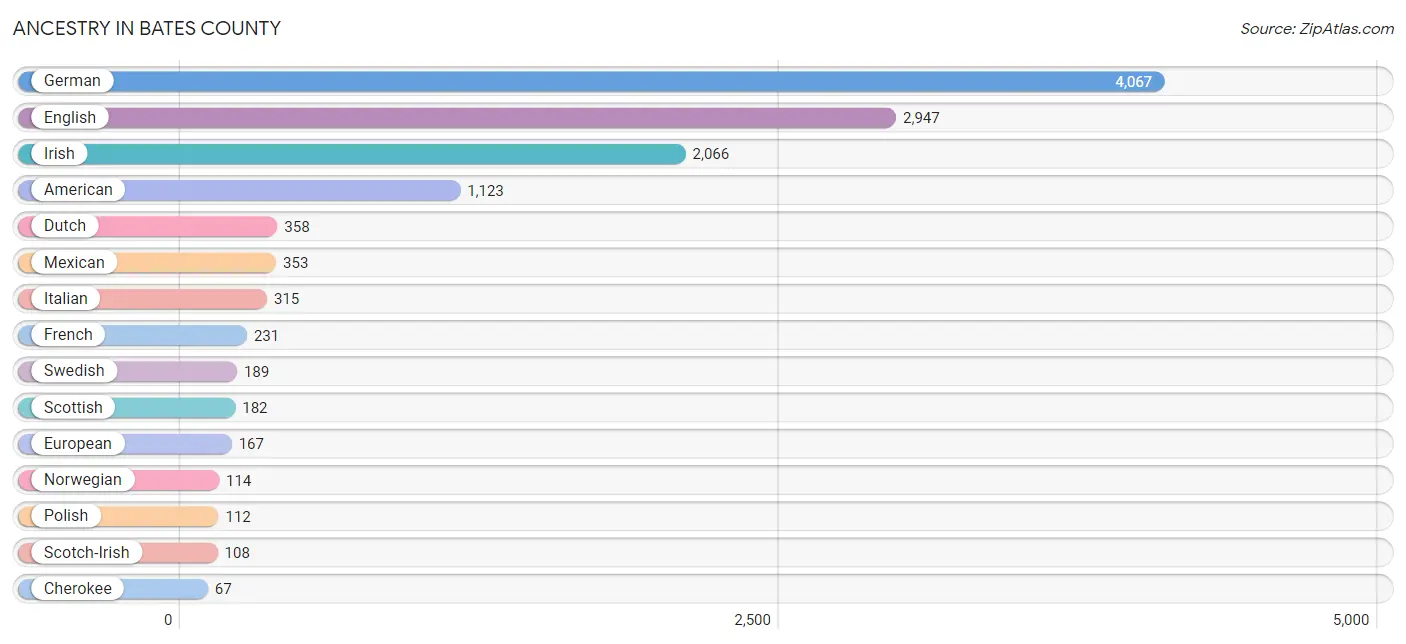
Ancestry in Bates County
The most populous ancestries reported in Bates County are German (4,067 | 25.3%), English (2,947 | 18.3%), Irish (2,066 | 12.8%), American (1,123 | 7.0%), and Dutch (358 | 2.2%), together accounting for 65.6% of all Bates County residents.
| Ancestry | # Population | % Population |
| African | 4 | 0.0% |
| American | 1,123 | 7.0% |
| Arab | 4 | 0.0% |
| Arapaho | 4 | 0.0% |
| Australian | 2 | 0.0% |
| Austrian | 10 | 0.1% |
| Belgian | 5 | 0.0% |
| Bhutanese | 4 | 0.0% |
| Blackfeet | 25 | 0.2% |
| British | 42 | 0.3% |
| Burmese | 7 | 0.0% |
| Canadian | 10 | 0.1% |
| Central American | 9 | 0.1% |
| Cherokee | 67 | 0.4% |
| Colombian | 11 | 0.1% |
| Comanche | 5 | 0.0% |
| Croatian | 3 | 0.0% |
| Czech | 45 | 0.3% |
| Danish | 49 | 0.3% |
| Dutch | 358 | 2.2% |
| Eastern European | 9 | 0.1% |
| English | 2,947 | 18.3% |
| Estonian | 30 | 0.2% |
| European | 167 | 1.0% |
| Filipino | 11 | 0.1% |
| Finnish | 4 | 0.0% |
| French | 231 | 1.4% |
| French Canadian | 9 | 0.1% |
| German | 4,067 | 25.3% |
| Greek | 21 | 0.1% |
| Honduran | 9 | 0.1% |
| Hungarian | 1 | 0.0% |
| Indian (Asian) | 5 | 0.0% |
| Irish | 2,066 | 12.8% |
| Italian | 315 | 2.0% |
| Korean | 57 | 0.4% |
| Lebanese | 4 | 0.0% |
| Liberian | 2 | 0.0% |
| Mexican | 353 | 2.2% |
| Navajo | 1 | 0.0% |
| Northern European | 27 | 0.2% |
| Norwegian | 114 | 0.7% |
| Pennsylvania German | 6 | 0.0% |
| Peruvian | 3 | 0.0% |
| Polish | 112 | 0.7% |
| Puerto Rican | 8 | 0.1% |
| Russian | 4 | 0.0% |
| Scandinavian | 67 | 0.4% |
| Scotch-Irish | 108 | 0.7% |
| Scottish | 182 | 1.1% |
| Sioux | 30 | 0.2% |
| South American | 17 | 0.1% |
| Spaniard | 4 | 0.0% |
| Spanish | 37 | 0.2% |
| Subsaharan African | 6 | 0.0% |
| Swedish | 189 | 1.2% |
| Swiss | 59 | 0.4% |
| Ukrainian | 30 | 0.2% |
| Uruguayan | 3 | 0.0% |
| Welsh | 57 | 0.4% | View All 60 Rows |
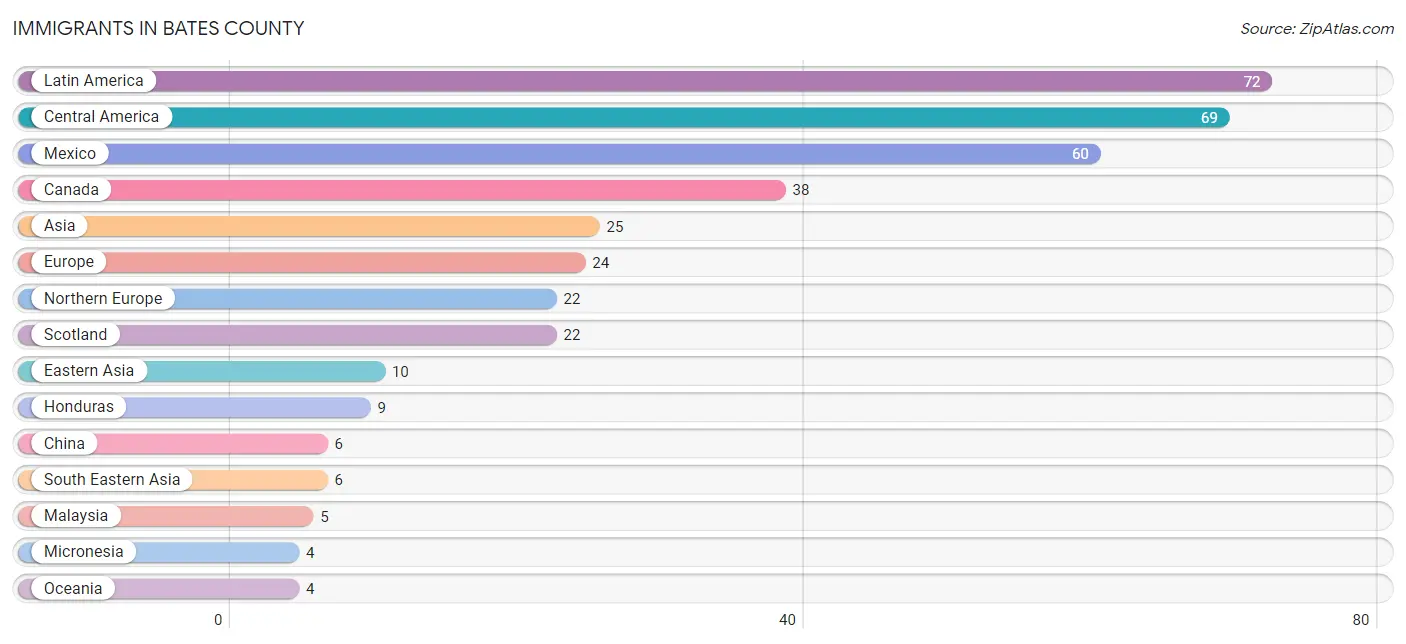
Immigrants in Bates County
The most numerous immigrant groups reported in Bates County came from Latin America (72 | 0.4%), Central America (69 | 0.4%), Mexico (60 | 0.4%), Canada (38 | 0.2%), and Asia (25 | 0.2%), together accounting for 1.6% of all Bates County residents.
| Immigration Origin | # Population | % Population |
| Asia | 25 | 0.2% |
| Canada | 38 | 0.2% |
| Central America | 69 | 0.4% |
| China | 6 | 0.0% |
| Eastern Asia | 10 | 0.1% |
| Europe | 24 | 0.2% |
| Germany | 2 | 0.0% |
| Honduras | 9 | 0.1% |
| Japan | 1 | 0.0% |
| Korea | 3 | 0.0% |
| Latin America | 72 | 0.4% |
| Malaysia | 5 | 0.0% |
| Mexico | 60 | 0.4% |
| Micronesia | 4 | 0.0% |
| Northern Europe | 22 | 0.1% |
| Oceania | 4 | 0.0% |
| Peru | 3 | 0.0% |
| Philippines | 1 | 0.0% |
| Scotland | 22 | 0.1% |
| South America | 3 | 0.0% |
| South Eastern Asia | 6 | 0.0% |
| Taiwan | 4 | 0.0% |
| Western Europe | 2 | 0.0% | View All 23 Rows |
Sex and Age in Bates County
Sex and Age in Bates County
The most populous age groups in Bates County are 55 to 59 Years (643 | 8.0%) for men and 60 to 64 Years (648 | 8.1%) for women.
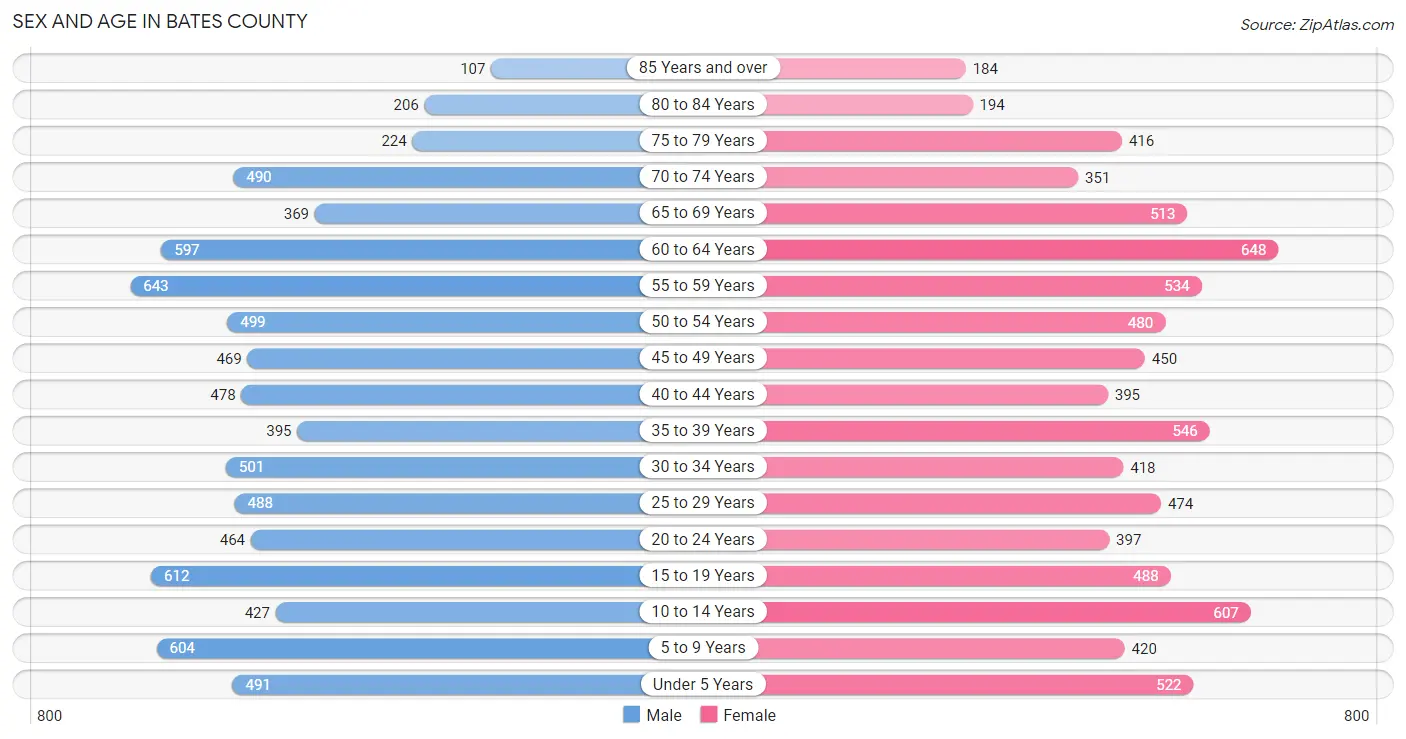
| Age Bracket | Male | Female |
| Under 5 Years | 491 (6.1%) | 522 (6.5%) |
| 5 to 9 Years | 604 (7.5%) | 420 (5.2%) |
| 10 to 14 Years | 427 (5.3%) | 607 (7.5%) |
| 15 to 19 Years | 612 (7.6%) | 488 (6.1%) |
| 20 to 24 Years | 464 (5.8%) | 397 (4.9%) |
| 25 to 29 Years | 488 (6.0%) | 474 (5.9%) |
| 30 to 34 Years | 501 (6.2%) | 418 (5.2%) |
| 35 to 39 Years | 395 (4.9%) | 546 (6.8%) |
| 40 to 44 Years | 478 (5.9%) | 395 (4.9%) |
| 45 to 49 Years | 469 (5.8%) | 450 (5.6%) |
| 50 to 54 Years | 499 (6.2%) | 480 (6.0%) |
| 55 to 59 Years | 643 (8.0%) | 534 (6.6%) |
| 60 to 64 Years | 597 (7.4%) | 648 (8.1%) |
| 65 to 69 Years | 369 (4.6%) | 513 (6.4%) |
| 70 to 74 Years | 490 (6.1%) | 351 (4.4%) |
| 75 to 79 Years | 224 (2.8%) | 416 (5.2%) |
| 80 to 84 Years | 206 (2.5%) | 194 (2.4%) |
| 85 Years and over | 107 (1.3%) | 184 (2.3%) |
| Total | 8,064 (100.0%) | 8,037 (100.0%) |
Families and Households in Bates County
Median Family Size in Bates County
The median family size in Bates County is 3.25 persons per family, with single female/mother families (580 | 14.6%) accounting for the largest median family size of 3.44 persons per family. On the other hand, married-couple families (3,065 | 77.1%) represent the smallest median family size with 3.21 persons per family.
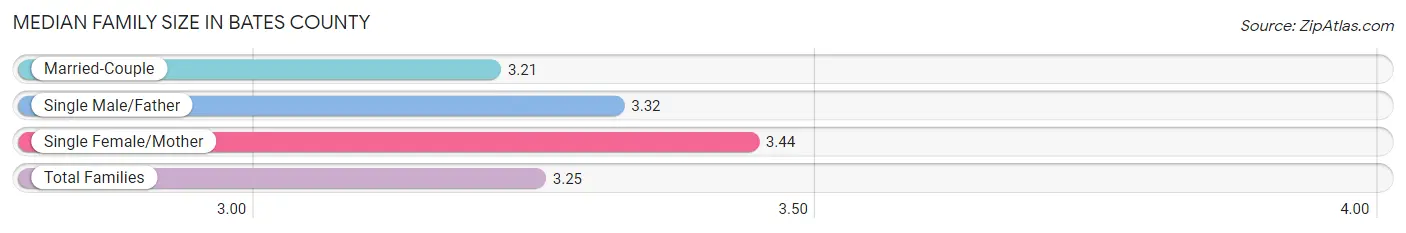
| Family Type | # Families | Family Size |
| Married-Couple | 3,065 (77.1%) | 3.21 |
| Single Male/Father | 329 (8.3%) | 3.32 |
| Single Female/Mother | 580 (14.6%) | 3.44 |
| Total Families | 3,974 (100.0%) | 3.25 |
Median Household Size in Bates County
The median household size in Bates County is 2.66 persons per household, with single female/mother households (580 | 9.8%) accounting for the largest median household size of 3.97 persons per household. non-family households (1,955 | 33.0%) represent the smallest median household size with 1.19 persons per household.
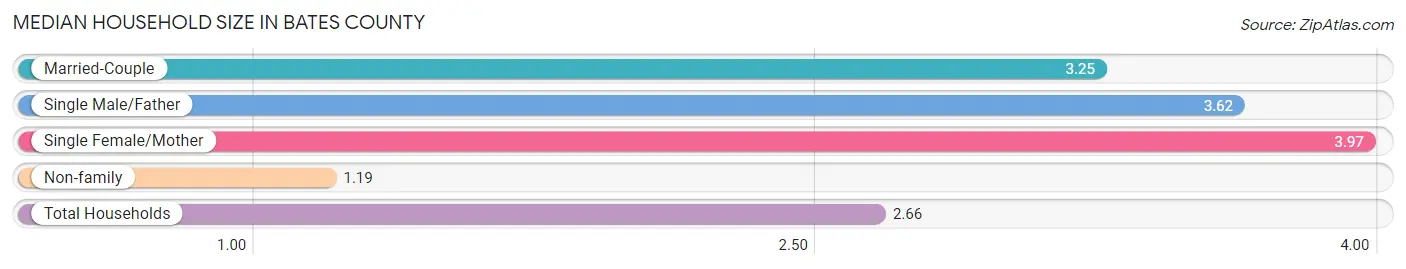
| Household Type | # Households | Household Size |
| Married-Couple | 3,065 (51.7%) | 3.25 |
| Single Male/Father | 329 (5.6%) | 3.62 |
| Single Female/Mother | 580 (9.8%) | 3.97 |
| Non-family | 1,955 (33.0%) | 1.19 |
| Total Households | 5,929 (100.0%) | 2.66 |
Household Size by Marriage Status in Bates County
Out of a total of 5,929 households in Bates County, 3,974 (67.0%) are family households, while 1,955 (33.0%) are nonfamily households. The most numerous type of family households are 2-person households, comprising 2,022, and the most common type of nonfamily households are 1-person households, comprising 1,608.
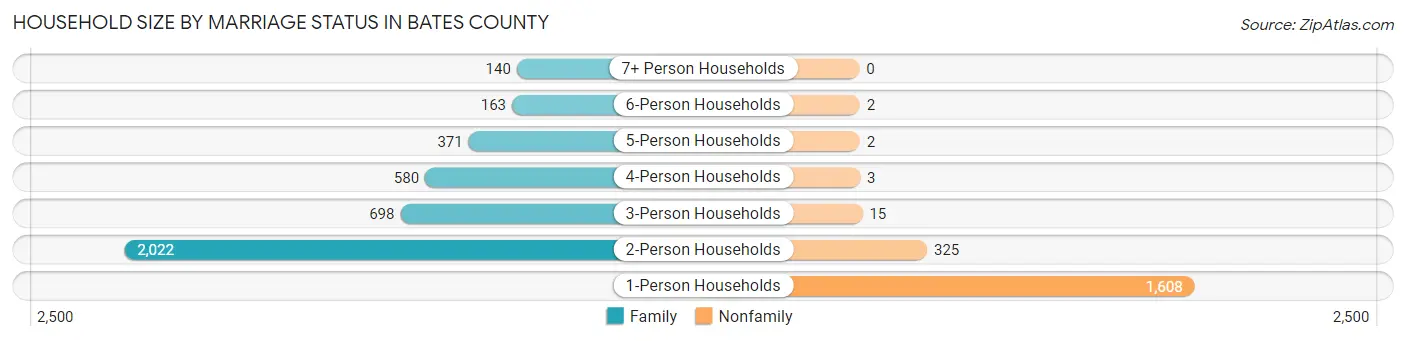
| Household Size | Family Households | Nonfamily Households |
| 1-Person Households | - | 1,608 (27.1%) |
| 2-Person Households | 2,022 (34.1%) | 325 (5.5%) |
| 3-Person Households | 698 (11.8%) | 15 (0.3%) |
| 4-Person Households | 580 (9.8%) | 3 (0.1%) |
| 5-Person Households | 371 (6.3%) | 2 (0.0%) |
| 6-Person Households | 163 (2.8%) | 2 (0.0%) |
| 7+ Person Households | 140 (2.4%) | 0 (0.0%) |
| Total | 3,974 (67.0%) | 1,955 (33.0%) |
Female Fertility in Bates County
Fertility by Age in Bates County
Average fertility rate in Bates County is 66.0 births per 1,000 women. Women in the age bracket of 20 to 34 years have the highest fertility rate with 100.0 births per 1,000 women. Women in the age bracket of 20 to 34 years acount for 59.2% of all women with births.
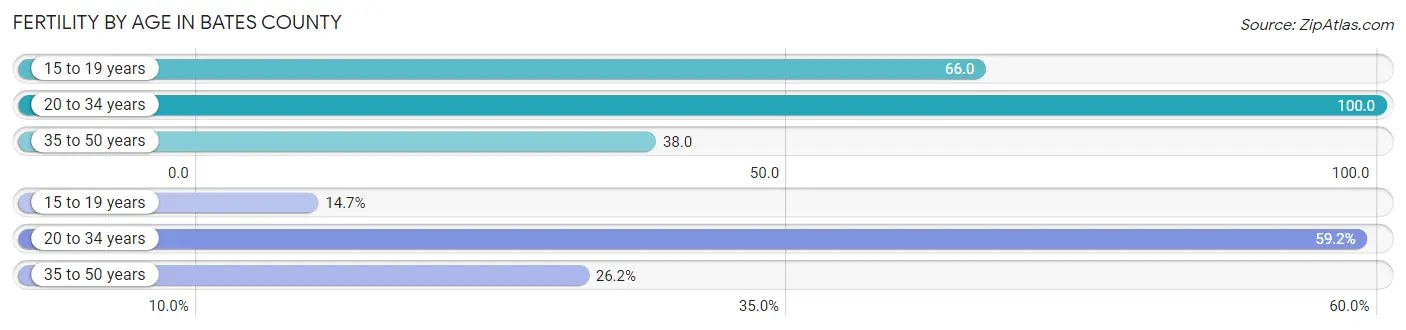
| Age Bracket | Women with Births | Births / 1,000 Women |
| 15 to 19 years | 32 (14.7%) | 66.0 |
| 20 to 34 years | 129 (59.2%) | 100.0 |
| 35 to 50 years | 57 (26.2%) | 38.0 |
| Total | 218 (100.0%) | 66.0 |
Fertility by Age by Marriage Status in Bates County
50.5% of women with births (218) in Bates County are married. The highest percentage of unmarried women with births falls into 15 to 19 years age bracket with 100.0% of them unmarried at the time of birth, while the lowest percentage of unmarried women with births belong to 20 to 34 years age bracket with 21.7% of them unmarried.
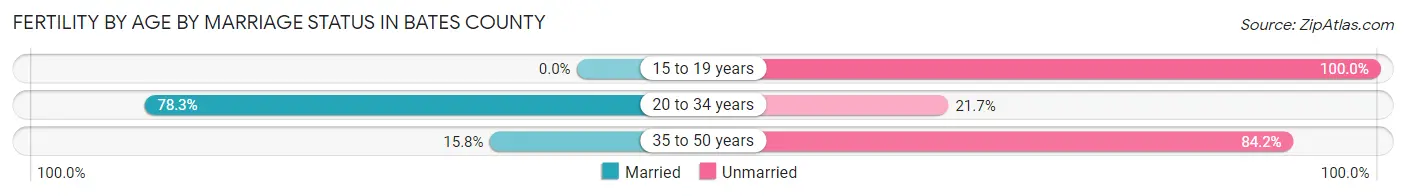
| Age Bracket | Married | Unmarried |
| 15 to 19 years | 0 (0.0%) | 32 (100.0%) |
| 20 to 34 years | 101 (78.3%) | 28 (21.7%) |
| 35 to 50 years | 9 (15.8%) | 48 (84.2%) |
| Total | 110 (50.5%) | 108 (49.5%) |
Fertility by Education in Bates County
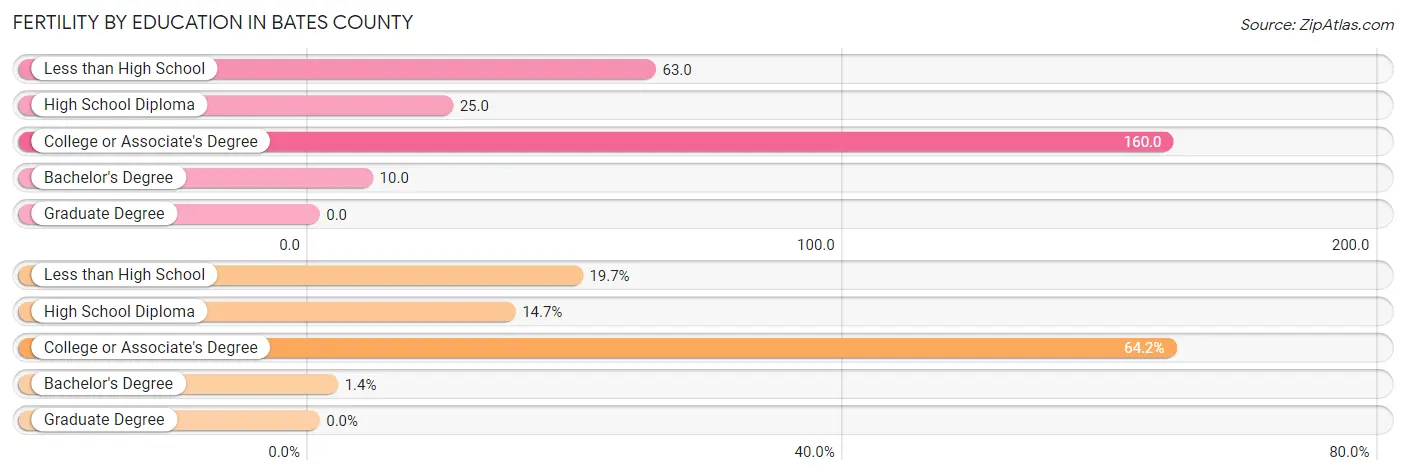
| Educational Attainment | Women with Births | Births / 1,000 Women |
| Less than High School | 43 (19.7%) | 63.0 |
| High School Diploma | 32 (14.7%) | 25.0 |
| College or Associate's Degree | 140 (64.2%) | 160.0 |
| Bachelor's Degree | 3 (1.4%) | 10.0 |
| Graduate Degree | 0 (0.0%) | 0.0 |
| Total | 218 (100.0%) | 66.0 |
Fertility by Education by Marriage Status in Bates County
49.5% of women with births in Bates County are unmarried. Women with the educational attainment of bachelor's degree are most likely to be married with 100.0% of them married at childbirth, while women with the educational attainment of less than high school are least likely to be married with 74.4% of them unmarried at childbirth.
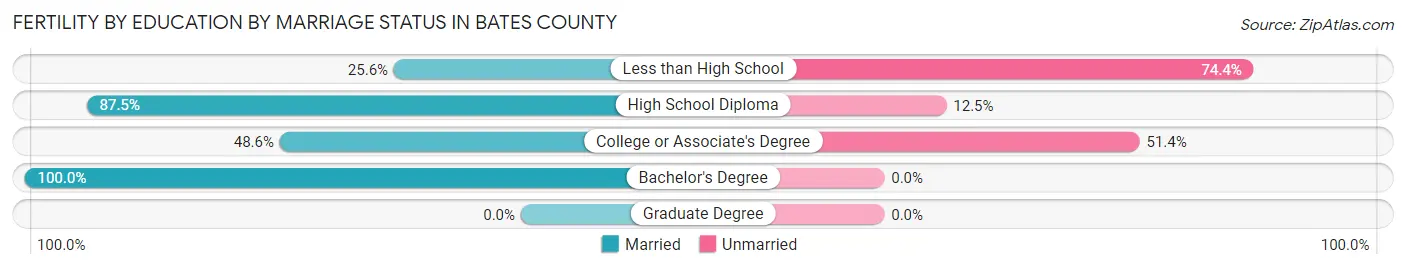
| Educational Attainment | Married | Unmarried |
| Less than High School | 11 (25.6%) | 32 (74.4%) |
| High School Diploma | 28 (87.5%) | 4 (12.5%) |
| College or Associate's Degree | 68 (48.6%) | 72 (51.4%) |
| Bachelor's Degree | 3 (100.0%) | 0 (0.0%) |
| Graduate Degree | 0 (0.0%) | 0 (0.0%) |
| Total | 110 (50.5%) | 108 (49.5%) |
Employment Characteristics in Bates County
Employment by Class of Employer in Bates County
Among the 6,860 employed individuals in Bates County, private company employees (4,775 | 69.6%), self-employed (not incorporated) (654 | 9.5%), and local government employees (431 | 6.3%) make up the most common classes of employment.
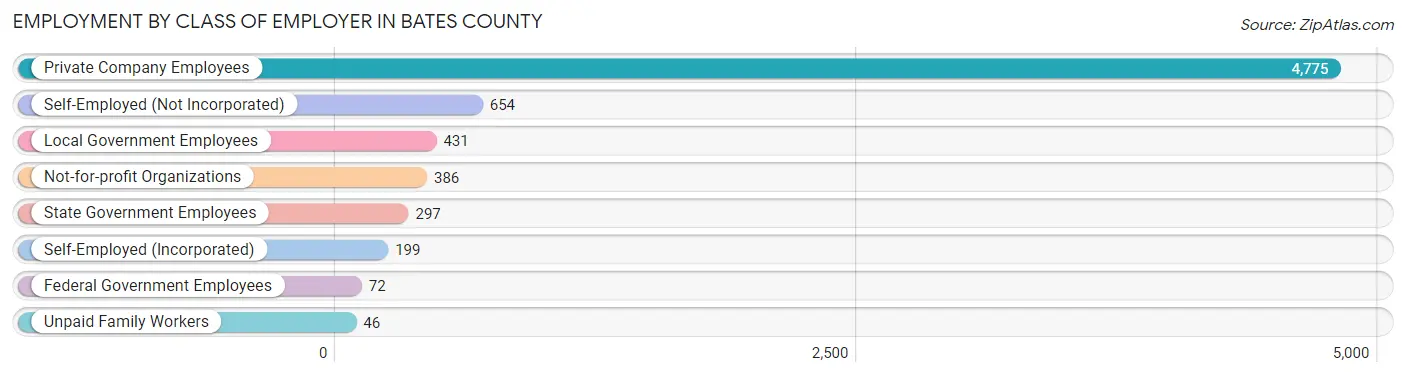
| Employer Class | # Employees | % Employees |
| Private Company Employees | 4,775 | 69.6% |
| Self-Employed (Incorporated) | 199 | 2.9% |
| Self-Employed (Not Incorporated) | 654 | 9.5% |
| Not-for-profit Organizations | 386 | 5.6% |
| Local Government Employees | 431 | 6.3% |
| State Government Employees | 297 | 4.3% |
| Federal Government Employees | 72 | 1.1% |
| Unpaid Family Workers | 46 | 0.7% |
| Total | 6,860 | 100.0% |
Employment Status by Age in Bates County
According to the labor force statistics for Bates County, out of the total population over 16 years of age (12,830), 59.1% or 7,583 individuals are in the labor force, with 7.5% or 569 of them unemployed. The age group with the highest labor force participation rate is 25 to 29 years, with 84.9% or 817 individuals in the labor force. Within the labor force, the 16 to 19 years age range has the highest percentage of unemployed individuals, with 14.5% or 61 of them being unemployed.
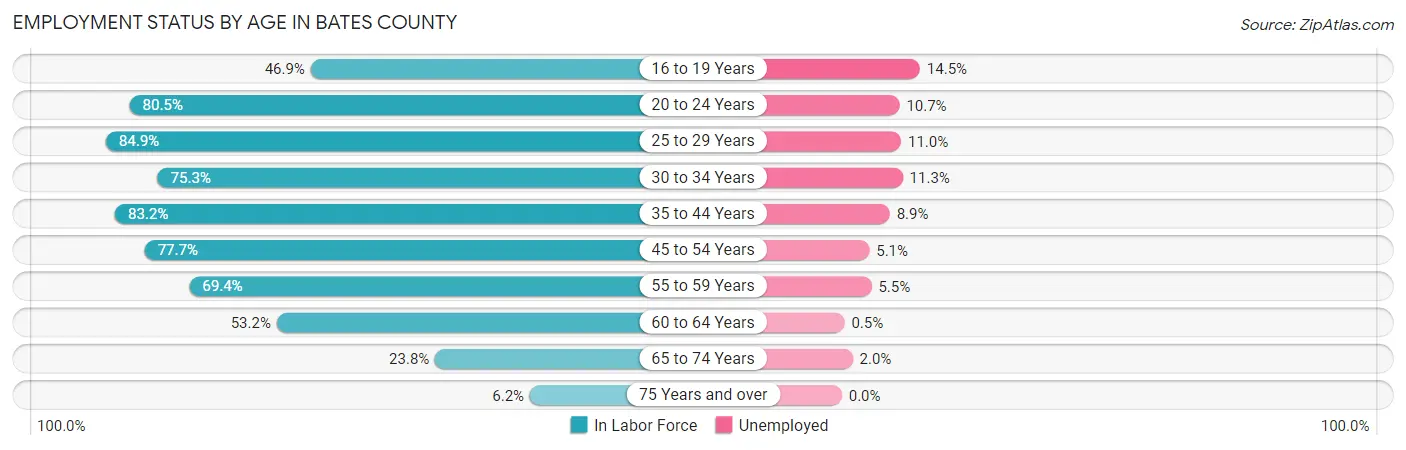
| Age Bracket | In Labor Force | Unemployed |
| 16 to 19 Years | 422 (46.9%) | 61 (14.5%) |
| 20 to 24 Years | 693 (80.5%) | 74 (10.7%) |
| 25 to 29 Years | 817 (84.9%) | 90 (11.0%) |
| 30 to 34 Years | 692 (75.3%) | 78 (11.3%) |
| 35 to 44 Years | 1,509 (83.2%) | 134 (8.9%) |
| 45 to 54 Years | 1,475 (77.7%) | 75 (5.1%) |
| 55 to 59 Years | 817 (69.4%) | 45 (5.5%) |
| 60 to 64 Years | 662 (53.2%) | 3 (0.5%) |
| 65 to 74 Years | 410 (23.8%) | 8 (2.0%) |
| 75 Years and over | 83 (6.2%) | 0 (0.0%) |
| Total | 7,583 (59.1%) | 569 (7.5%) |
Employment Status by Educational Attainment in Bates County
According to labor force statistics for Bates County, 74.5% of individuals (5,971) out of the total population between 25 and 64 years of age (8,015) are in the labor force, with 7.1% or 424 of them being unemployed. The group with the highest labor force participation rate are those with the educational attainment of bachelor's degree or higher, with 83.5% or 903 individuals in the labor force. Within the labor force, individuals with high school diploma education have the highest percentage of unemployment, with 11.2% or 322 of them being unemployed.
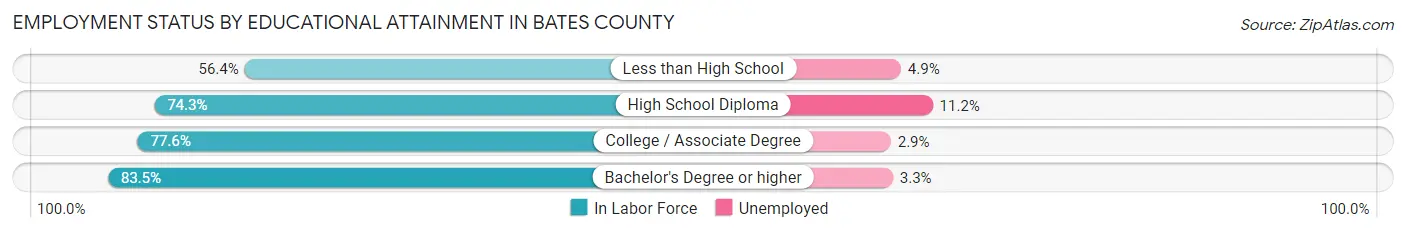
| Educational Attainment | In Labor Force | Unemployed |
| Less than High School | 488 (56.4%) | 42 (4.9%) |
| High School Diploma | 2,875 (74.3%) | 433 (11.2%) |
| College / Associate Degree | 1,706 (77.6%) | 64 (2.9%) |
| Bachelor's Degree or higher | 903 (83.5%) | 36 (3.3%) |
| Total | 5,971 (74.5%) | 569 (7.1%) |
Employment Occupations by Sex in Bates County
Management, Business, Science and Arts Occupations
The most common Management, Business, Science and Arts occupations in Bates County are Management (643 | 9.2%), Community & Social Service (539 | 7.7%), Education Instruction & Library (375 | 5.3%), Health Diagnosing & Treating (291 | 4.2%), and Business & Financial (145 | 2.1%).
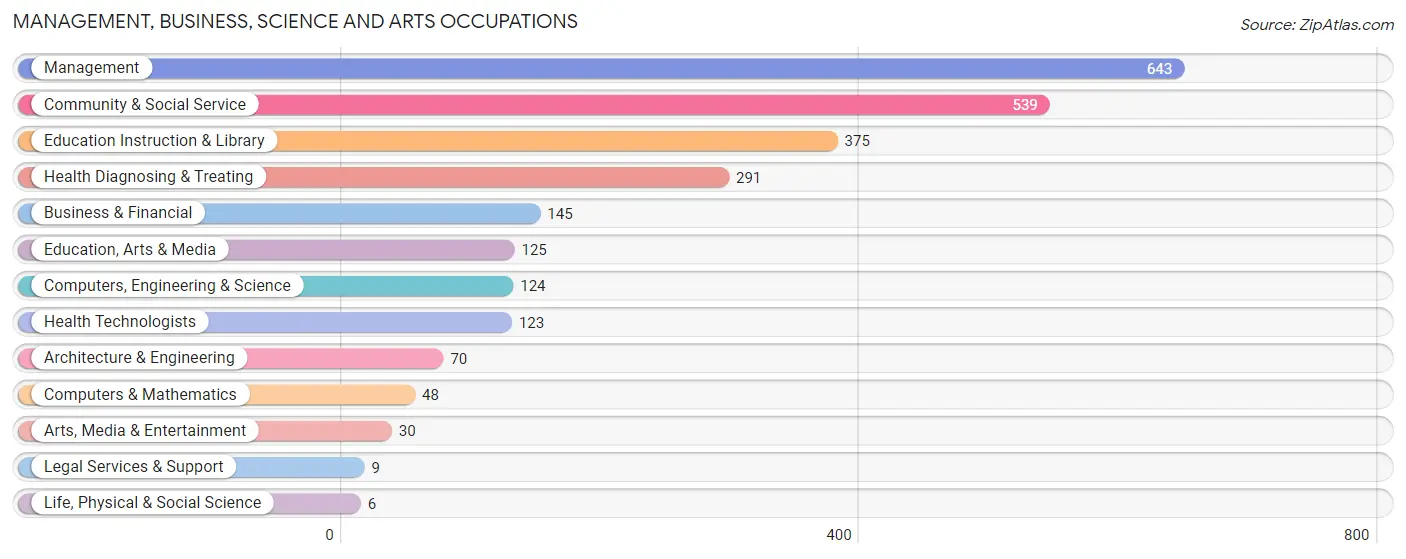
Management, Business, Science and Arts Occupations by Sex
Within the Management, Business, Science and Arts occupations in Bates County, the most male-oriented occupations are Architecture & Engineering (98.6%), Life, Physical & Social Science (83.3%), and Computers, Engineering & Science (78.2%), while the most female-oriented occupations are Legal Services & Support (100.0%), Health Technologists (91.1%), and Health Diagnosing & Treating (88.7%).
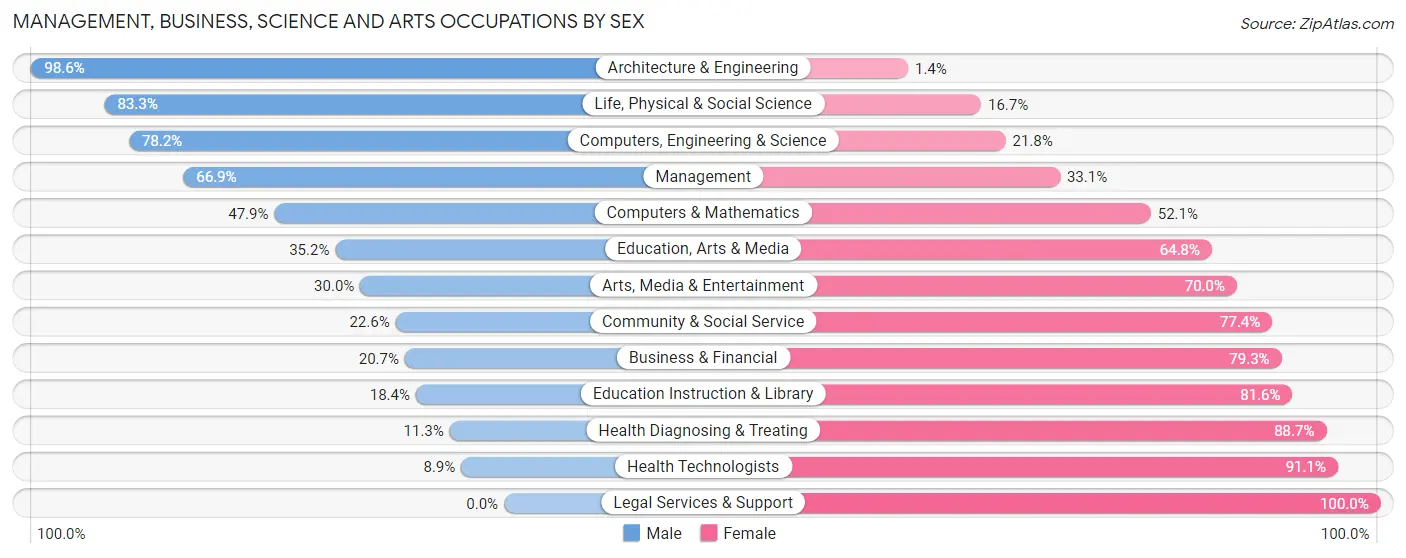
| Occupation | Male | Female |
| Management | 430 (66.9%) | 213 (33.1%) |
| Business & Financial | 30 (20.7%) | 115 (79.3%) |
| Computers, Engineering & Science | 97 (78.2%) | 27 (21.8%) |
| Computers & Mathematics | 23 (47.9%) | 25 (52.1%) |
| Architecture & Engineering | 69 (98.6%) | 1 (1.4%) |
| Life, Physical & Social Science | 5 (83.3%) | 1 (16.7%) |
| Community & Social Service | 122 (22.6%) | 417 (77.4%) |
| Education, Arts & Media | 44 (35.2%) | 81 (64.8%) |
| Legal Services & Support | 0 (0.0%) | 9 (100.0%) |
| Education Instruction & Library | 69 (18.4%) | 306 (81.6%) |
| Arts, Media & Entertainment | 9 (30.0%) | 21 (70.0%) |
| Health Diagnosing & Treating | 33 (11.3%) | 258 (88.7%) |
| Health Technologists | 11 (8.9%) | 112 (91.1%) |
| Total (Category) | 712 (40.9%) | 1,030 (59.1%) |
| Total (Overall) | 3,794 (54.1%) | 3,215 (45.9%) |
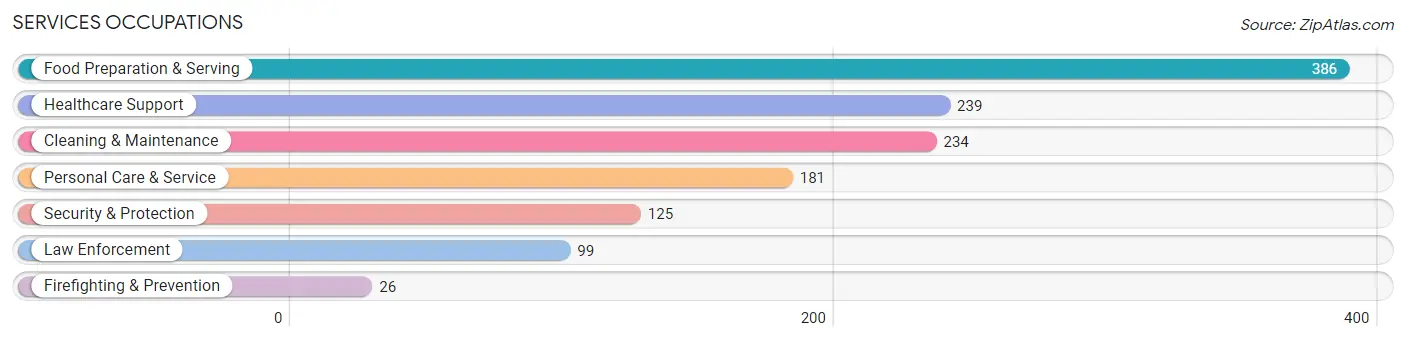
Services Occupations
The most common Services occupations in Bates County are Food Preparation & Serving (386 | 5.5%), Healthcare Support (239 | 3.4%), Cleaning & Maintenance (234 | 3.3%), Personal Care & Service (181 | 2.6%), and Security & Protection (125 | 1.8%).
Services Occupations by Sex
Within the Services occupations in Bates County, the most male-oriented occupations are Firefighting & Prevention (100.0%), Cleaning & Maintenance (74.4%), and Security & Protection (66.4%), while the most female-oriented occupations are Healthcare Support (94.1%), Personal Care & Service (85.1%), and Food Preparation & Serving (69.7%).
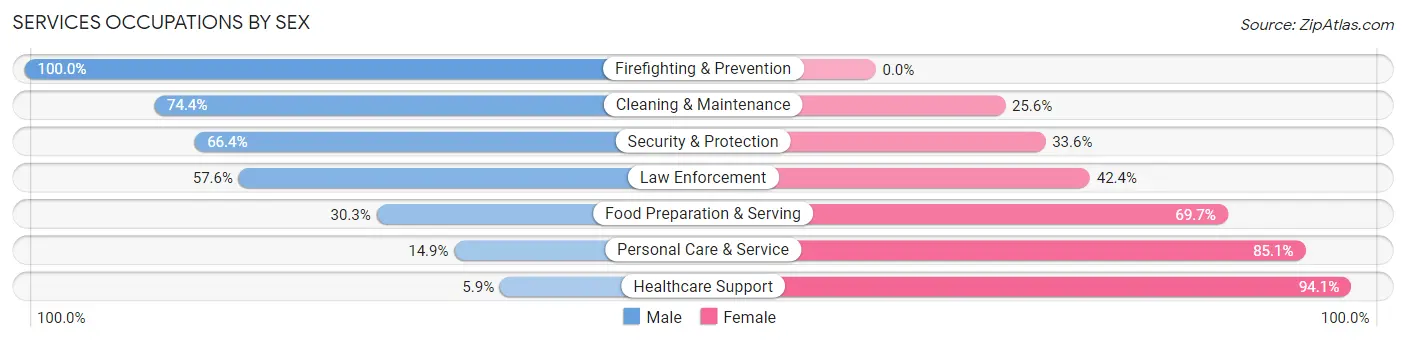
| Occupation | Male | Female |
| Healthcare Support | 14 (5.9%) | 225 (94.1%) |
| Security & Protection | 83 (66.4%) | 42 (33.6%) |
| Firefighting & Prevention | 26 (100.0%) | 0 (0.0%) |
| Law Enforcement | 57 (57.6%) | 42 (42.4%) |
| Food Preparation & Serving | 117 (30.3%) | 269 (69.7%) |
| Cleaning & Maintenance | 174 (74.4%) | 60 (25.6%) |
| Personal Care & Service | 27 (14.9%) | 154 (85.1%) |
| Total (Category) | 415 (35.6%) | 750 (64.4%) |
| Total (Overall) | 3,794 (54.1%) | 3,215 (45.9%) |
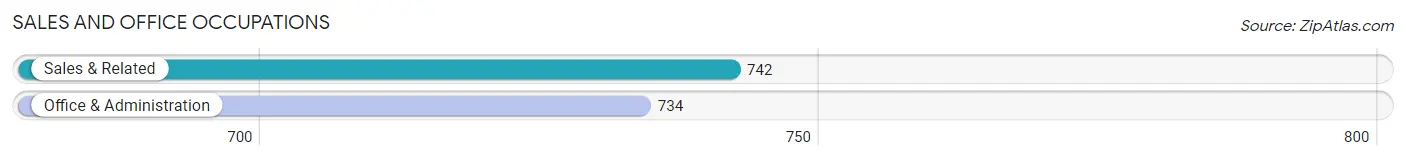
Sales and Office Occupations
The most common Sales and Office occupations in Bates County are Sales & Related (742 | 10.6%), and Office & Administration (734 | 10.5%).
Sales and Office Occupations by Sex
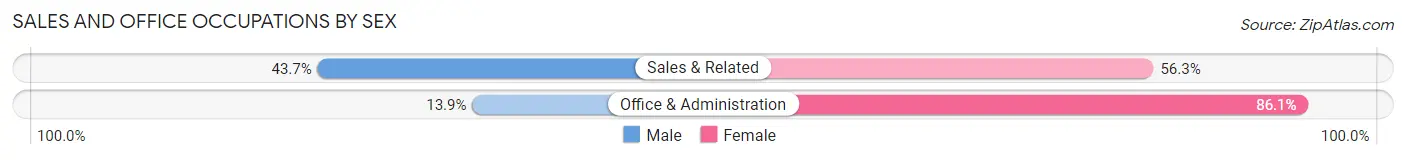
| Occupation | Male | Female |
| Sales & Related | 324 (43.7%) | 418 (56.3%) |
| Office & Administration | 102 (13.9%) | 632 (86.1%) |
| Total (Category) | 426 (28.9%) | 1,050 (71.1%) |
| Total (Overall) | 3,794 (54.1%) | 3,215 (45.9%) |
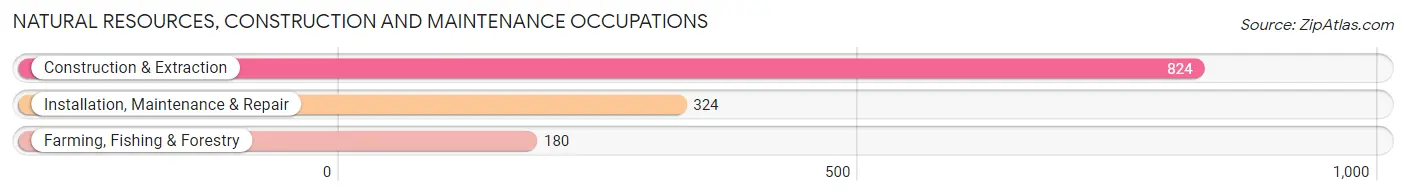
Natural Resources, Construction and Maintenance Occupations
The most common Natural Resources, Construction and Maintenance occupations in Bates County are Construction & Extraction (824 | 11.8%), Installation, Maintenance & Repair (324 | 4.6%), and Farming, Fishing & Forestry (180 | 2.6%).
Natural Resources, Construction and Maintenance Occupations by Sex
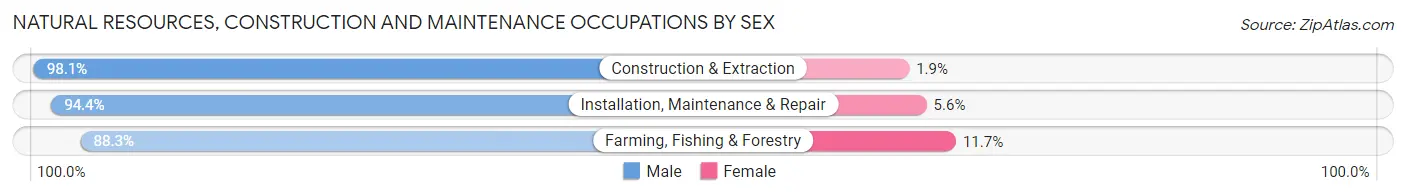
| Occupation | Male | Female |
| Farming, Fishing & Forestry | 159 (88.3%) | 21 (11.7%) |
| Construction & Extraction | 808 (98.1%) | 16 (1.9%) |
| Installation, Maintenance & Repair | 306 (94.4%) | 18 (5.6%) |
| Total (Category) | 1,273 (95.9%) | 55 (4.1%) |
| Total (Overall) | 3,794 (54.1%) | 3,215 (45.9%) |
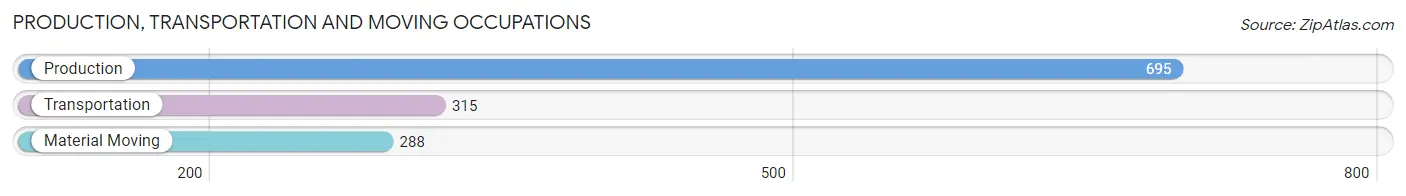
Production, Transportation and Moving Occupations
The most common Production, Transportation and Moving occupations in Bates County are Production (695 | 9.9%), Transportation (315 | 4.5%), and Material Moving (288 | 4.1%).
Production, Transportation and Moving Occupations by Sex
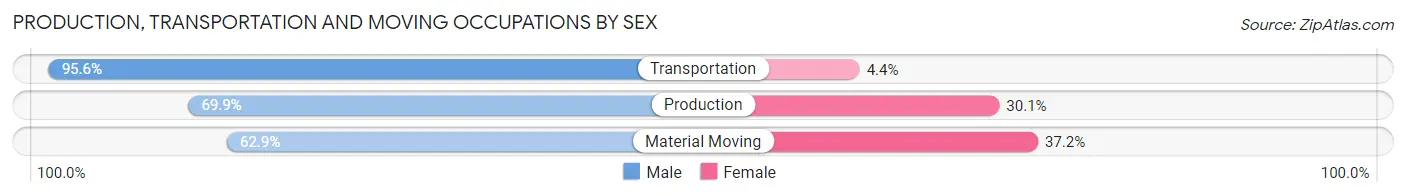
| Occupation | Male | Female |
| Production | 486 (69.9%) | 209 (30.1%) |
| Transportation | 301 (95.6%) | 14 (4.4%) |
| Material Moving | 181 (62.8%) | 107 (37.1%) |
| Total (Category) | 968 (74.6%) | 330 (25.4%) |
| Total (Overall) | 3,794 (54.1%) | 3,215 (45.9%) |
Employment Industries by Sex in Bates County
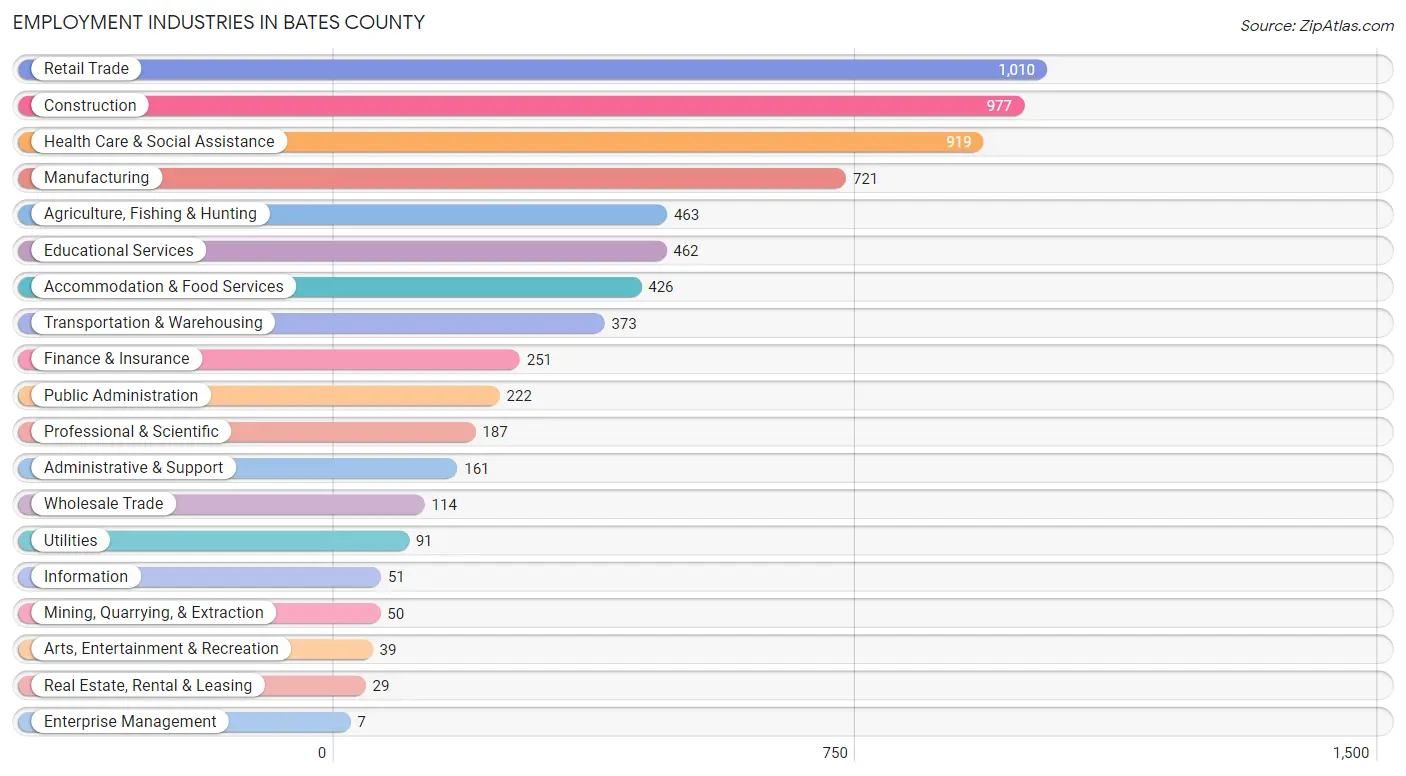
Employment Industries in Bates County
The major employment industries in Bates County include Retail Trade (1,010 | 14.4%), Construction (977 | 13.9%), Health Care & Social Assistance (919 | 13.1%), Manufacturing (721 | 10.3%), and Agriculture, Fishing & Hunting (463 | 6.6%).
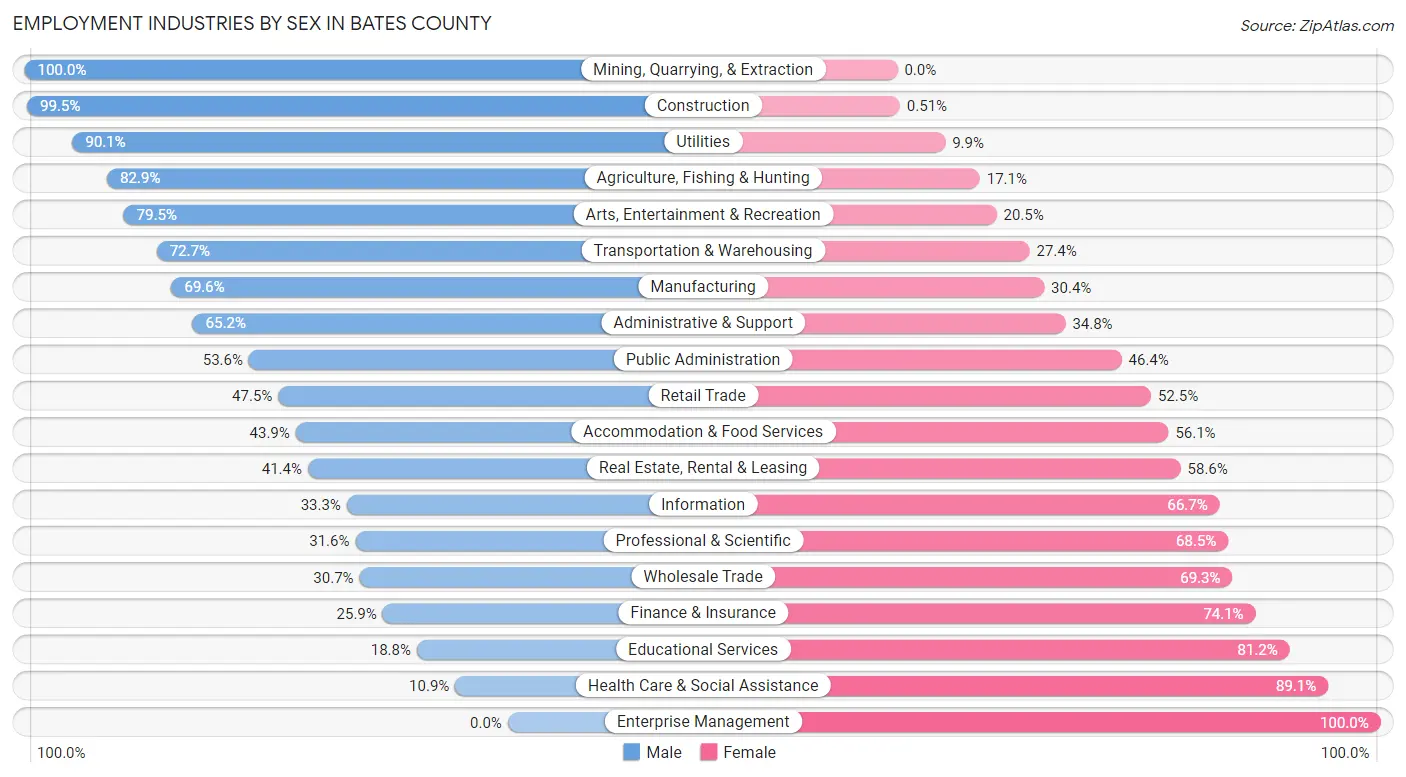
Employment Industries by Sex in Bates County
The Bates County industries that see more men than women are Mining, Quarrying, & Extraction (100.0%), Construction (99.5%), and Utilities (90.1%), whereas the industries that tend to have a higher number of women are Enterprise Management (100.0%), Health Care & Social Assistance (89.1%), and Educational Services (81.2%).
| Industry | Male | Female |
| Agriculture, Fishing & Hunting | 384 (82.9%) | 79 (17.1%) |
| Mining, Quarrying, & Extraction | 50 (100.0%) | 0 (0.0%) |
| Construction | 972 (99.5%) | 5 (0.5%) |
| Manufacturing | 502 (69.6%) | 219 (30.4%) |
| Wholesale Trade | 35 (30.7%) | 79 (69.3%) |
| Retail Trade | 480 (47.5%) | 530 (52.5%) |
| Transportation & Warehousing | 271 (72.7%) | 102 (27.4%) |
| Utilities | 82 (90.1%) | 9 (9.9%) |
| Information | 17 (33.3%) | 34 (66.7%) |
| Finance & Insurance | 65 (25.9%) | 186 (74.1%) |
| Real Estate, Rental & Leasing | 12 (41.4%) | 17 (58.6%) |
| Professional & Scientific | 59 (31.6%) | 128 (68.4%) |
| Enterprise Management | 0 (0.0%) | 7 (100.0%) |
| Administrative & Support | 105 (65.2%) | 56 (34.8%) |
| Educational Services | 87 (18.8%) | 375 (81.2%) |
| Health Care & Social Assistance | 100 (10.9%) | 819 (89.1%) |
| Arts, Entertainment & Recreation | 31 (79.5%) | 8 (20.5%) |
| Accommodation & Food Services | 187 (43.9%) | 239 (56.1%) |
| Public Administration | 119 (53.6%) | 103 (46.4%) |
| Total | 3,794 (54.1%) | 3,215 (45.9%) |
Education in Bates County
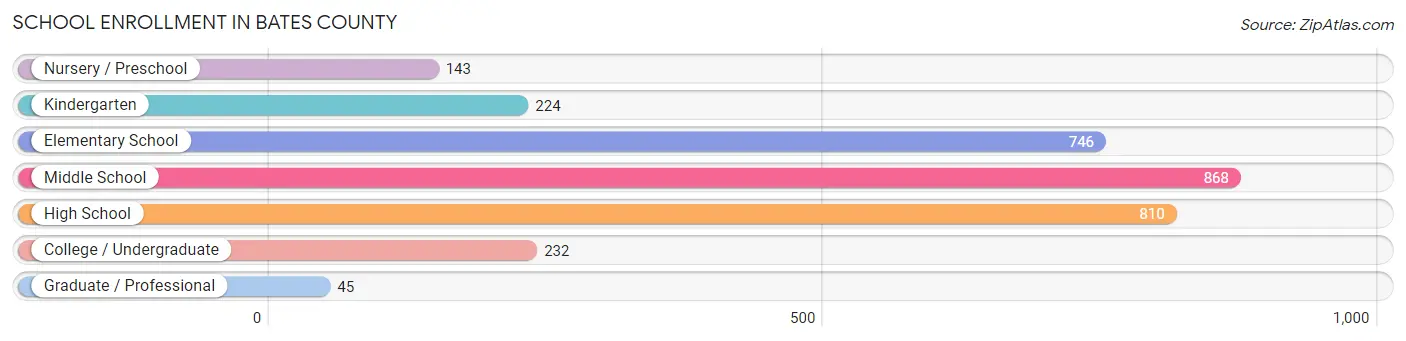
School Enrollment in Bates County
The most common levels of schooling among the 3,068 students in Bates County are middle school (868 | 28.3%), high school (810 | 26.4%), and elementary school (746 | 24.3%).
| School Level | # Students | % Students |
| Nursery / Preschool | 143 | 4.7% |
| Kindergarten | 224 | 7.3% |
| Elementary School | 746 | 24.3% |
| Middle School | 868 | 28.3% |
| High School | 810 | 26.4% |
| College / Undergraduate | 232 | 7.6% |
| Graduate / Professional | 45 | 1.5% |
| Total | 3,068 | 100.0% |
School Enrollment by Age by Funding Source in Bates County
Out of a total of 3,068 students who are enrolled in schools in Bates County, 384 (12.5%) attend a private institution, while the remaining 2,684 (87.5%) are enrolled in public schools. The age group of 20 to 24 year olds has the highest likelihood of being enrolled in private schools, with 60 (73.2% in the age bracket) enrolled. Conversely, the age group of 3 to 4 year olds has the lowest likelihood of being enrolled in a private school, with 52 (100.0% in the age bracket) attending a public institution.
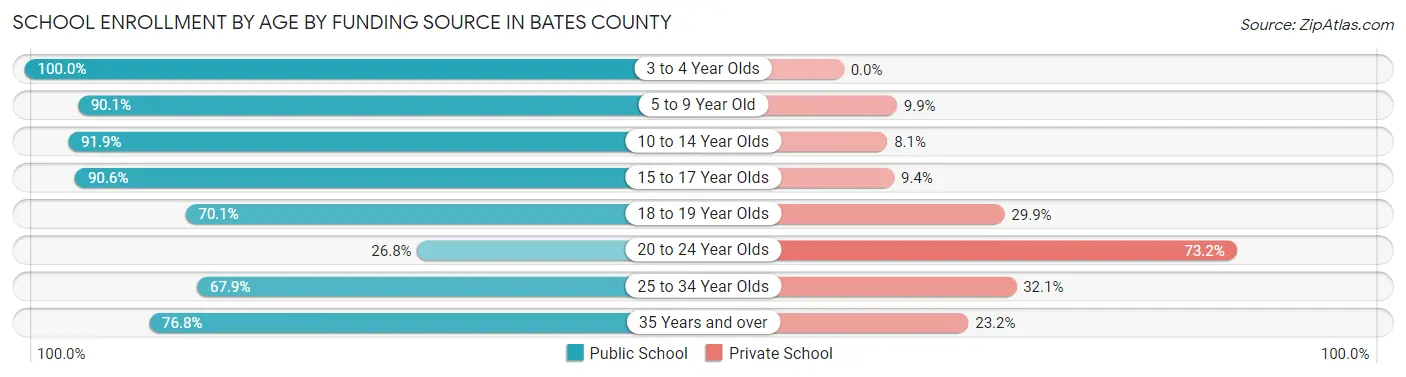
| Age Bracket | Public School | Private School |
| 3 to 4 Year Olds | 52 (100.0%) | 0 (0.0%) |
| 5 to 9 Year Old | 883 (90.1%) | 97 (9.9%) |
| 10 to 14 Year Olds | 884 (91.9%) | 78 (8.1%) |
| 15 to 17 Year Olds | 637 (90.6%) | 66 (9.4%) |
| 18 to 19 Year Olds | 124 (70.1%) | 53 (29.9%) |
| 20 to 24 Year Olds | 22 (26.8%) | 60 (73.2%) |
| 25 to 34 Year Olds | 38 (67.9%) | 18 (32.1%) |
| 35 Years and over | 43 (76.8%) | 13 (23.2%) |
| Total | 2,684 (87.5%) | 384 (12.5%) |
Educational Attainment by Field of Study in Bates County
Education (528 | 31.1%), business (244 | 14.4%), bio, nature & agricultural (217 | 12.8%), science & technology (162 | 9.6%), and arts & humanities (131 | 7.7%) are the most common fields of study among 1,696 individuals in Bates County who have obtained a bachelor's degree or higher.
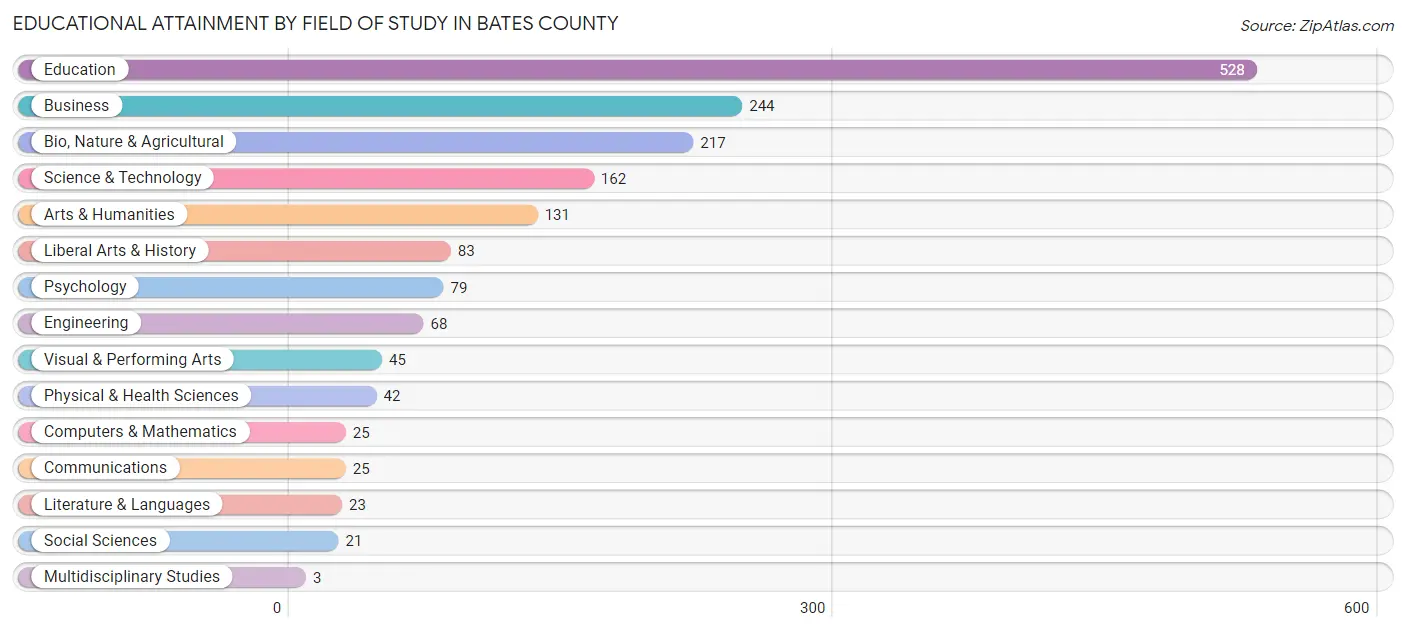
| Field of Study | # Graduates | % Graduates |
| Computers & Mathematics | 25 | 1.5% |
| Bio, Nature & Agricultural | 217 | 12.8% |
| Physical & Health Sciences | 42 | 2.5% |
| Psychology | 79 | 4.7% |
| Social Sciences | 21 | 1.2% |
| Engineering | 68 | 4.0% |
| Multidisciplinary Studies | 3 | 0.2% |
| Science & Technology | 162 | 9.6% |
| Business | 244 | 14.4% |
| Education | 528 | 31.1% |
| Literature & Languages | 23 | 1.4% |
| Liberal Arts & History | 83 | 4.9% |
| Visual & Performing Arts | 45 | 2.6% |
| Communications | 25 | 1.5% |
| Arts & Humanities | 131 | 7.7% |
| Total | 1,696 | 100.0% |
Transportation & Commute in Bates County
Vehicle Availability by Sex in Bates County
The most prevalent vehicle ownership categories in Bates County are males with 3 vehicles (1,181, accounting for 31.4%) and females with 3 vehicles (972, making up 38.1%).
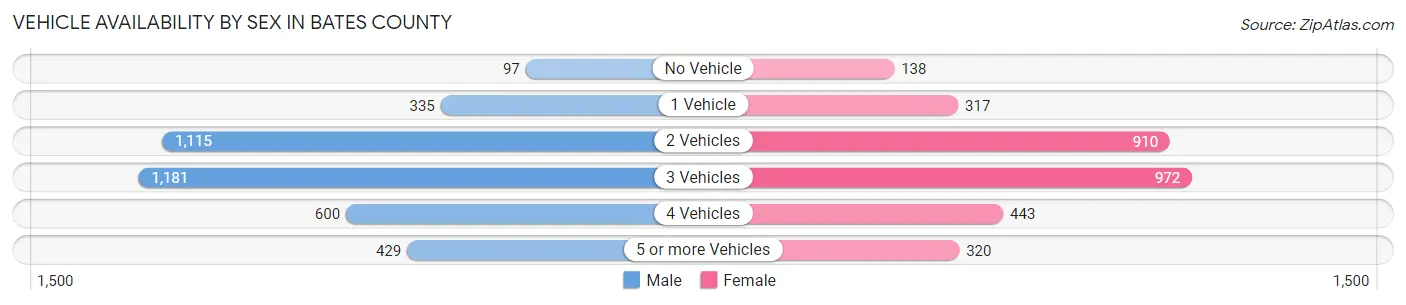
| Vehicles Available | Male | Female |
| No Vehicle | 97 (2.6%) | 138 (4.4%) |
| 1 Vehicle | 335 (8.9%) | 317 (10.2%) |
| 2 Vehicles | 1,115 (29.7%) | 910 (29.3%) |
| 3 Vehicles | 1,181 (31.4%) | 972 (31.4%) |
| 4 Vehicles | 600 (16.0%) | 443 (14.3%) |
| 5 or more Vehicles | 429 (11.4%) | 320 (10.3%) |
| Total | 3,757 (100.0%) | 3,100 (100.0%) |
Commute Time in Bates County
The most frequently occuring commute durations in Bates County are 60 to 89 minutes (1,147 commuters, 18.5%), 5 to 9 minutes (695 commuters, 11.2%), and 30 to 34 minutes (683 commuters, 11.0%).
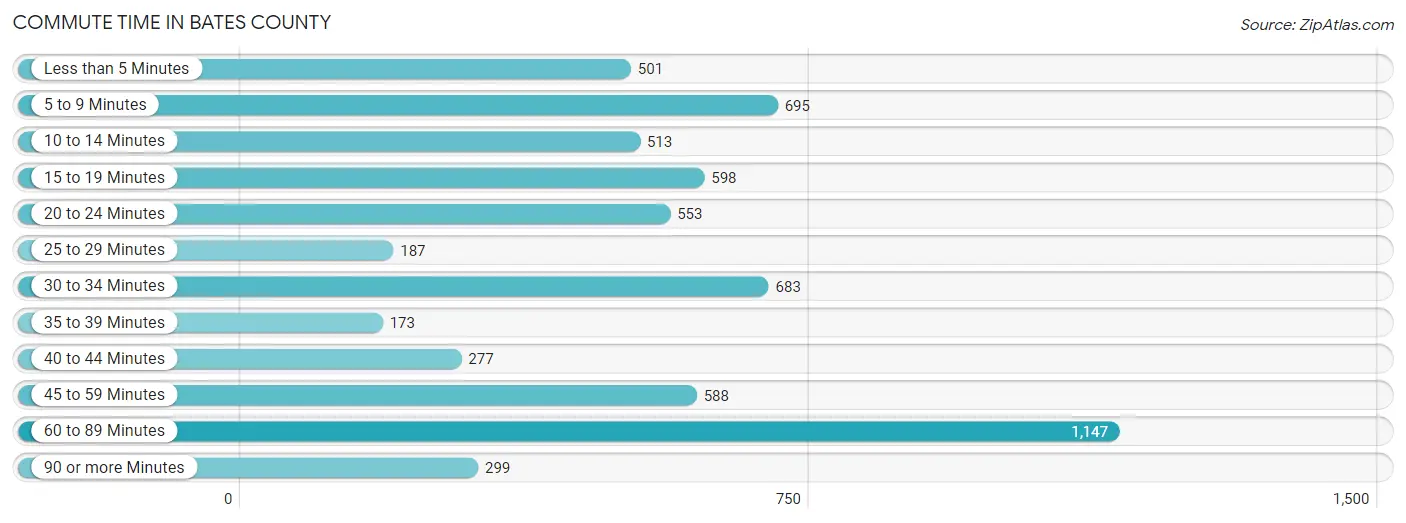
| Commute Time | # Commuters | % Commuters |
| Less than 5 Minutes | 501 | 8.1% |
| 5 to 9 Minutes | 695 | 11.2% |
| 10 to 14 Minutes | 513 | 8.3% |
| 15 to 19 Minutes | 598 | 9.6% |
| 20 to 24 Minutes | 553 | 8.9% |
| 25 to 29 Minutes | 187 | 3.0% |
| 30 to 34 Minutes | 683 | 11.0% |
| 35 to 39 Minutes | 173 | 2.8% |
| 40 to 44 Minutes | 277 | 4.5% |
| 45 to 59 Minutes | 588 | 9.5% |
| 60 to 89 Minutes | 1,147 | 18.5% |
| 90 or more Minutes | 299 | 4.8% |
Commute Time by Sex in Bates County
The most common commute times in Bates County are 60 to 89 minutes (916 commuters, 26.3%) for males and 15 to 19 minutes (392 commuters, 14.4%) for females.
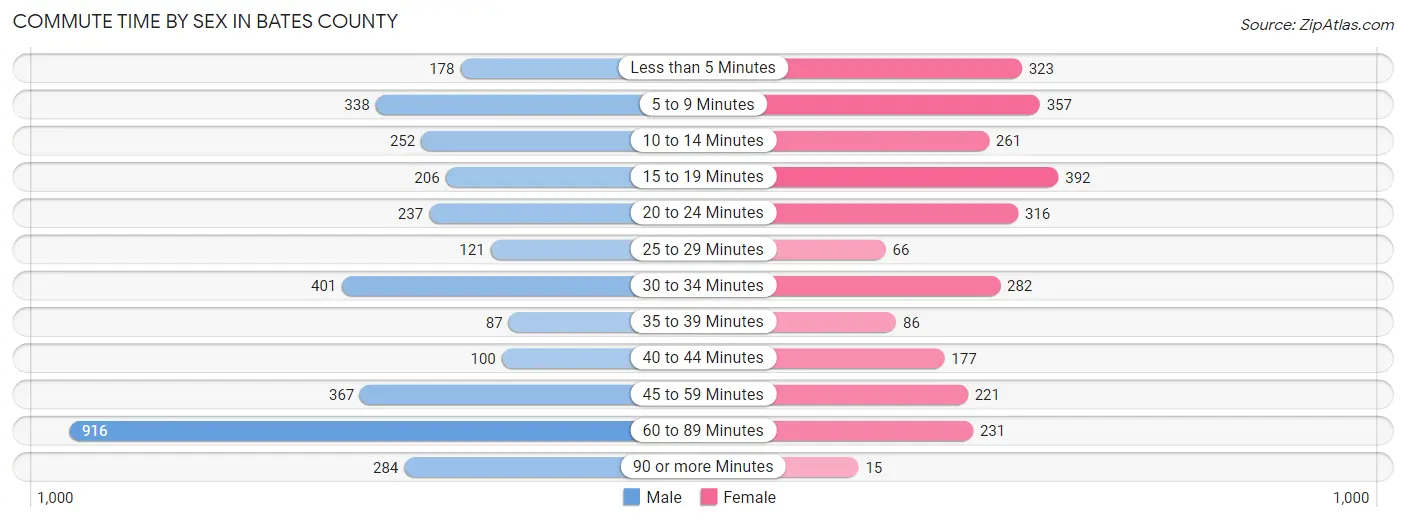
| Commute Time | Male | Female |
| Less than 5 Minutes | 178 (5.1%) | 323 (11.8%) |
| 5 to 9 Minutes | 338 (9.7%) | 357 (13.1%) |
| 10 to 14 Minutes | 252 (7.2%) | 261 (9.6%) |
| 15 to 19 Minutes | 206 (5.9%) | 392 (14.4%) |
| 20 to 24 Minutes | 237 (6.8%) | 316 (11.6%) |
| 25 to 29 Minutes | 121 (3.5%) | 66 (2.4%) |
| 30 to 34 Minutes | 401 (11.5%) | 282 (10.3%) |
| 35 to 39 Minutes | 87 (2.5%) | 86 (3.2%) |
| 40 to 44 Minutes | 100 (2.9%) | 177 (6.5%) |
| 45 to 59 Minutes | 367 (10.5%) | 221 (8.1%) |
| 60 to 89 Minutes | 916 (26.3%) | 231 (8.5%) |
| 90 or more Minutes | 284 (8.1%) | 15 (0.5%) |
Time of Departure to Work by Sex in Bates County
The most frequent times of departure to work in Bates County are 6:00 AM to 6:29 AM (642, 18.4%) for males and 7:00 AM to 7:29 AM (507, 18.6%) for females.
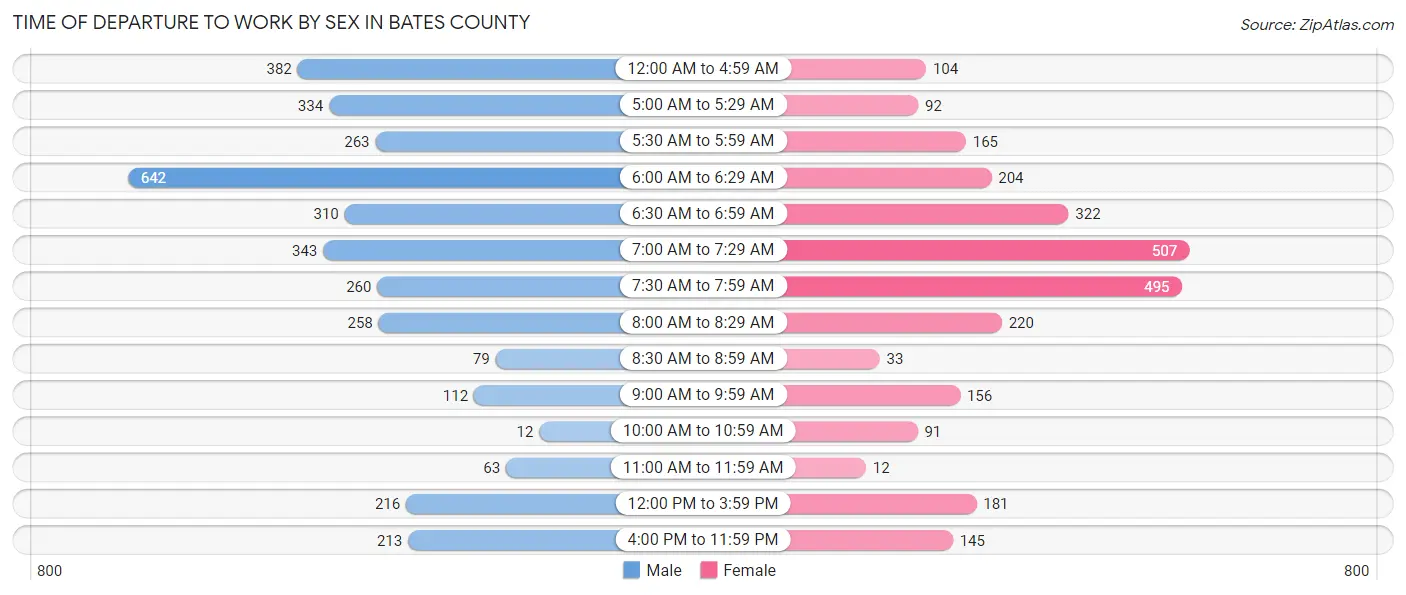
| Time of Departure | Male | Female |
| 12:00 AM to 4:59 AM | 382 (11.0%) | 104 (3.8%) |
| 5:00 AM to 5:29 AM | 334 (9.6%) | 92 (3.4%) |
| 5:30 AM to 5:59 AM | 263 (7.5%) | 165 (6.0%) |
| 6:00 AM to 6:29 AM | 642 (18.4%) | 204 (7.5%) |
| 6:30 AM to 6:59 AM | 310 (8.9%) | 322 (11.8%) |
| 7:00 AM to 7:29 AM | 343 (9.8%) | 507 (18.6%) |
| 7:30 AM to 7:59 AM | 260 (7.5%) | 495 (18.1%) |
| 8:00 AM to 8:29 AM | 258 (7.4%) | 220 (8.1%) |
| 8:30 AM to 8:59 AM | 79 (2.3%) | 33 (1.2%) |
| 9:00 AM to 9:59 AM | 112 (3.2%) | 156 (5.7%) |
| 10:00 AM to 10:59 AM | 12 (0.3%) | 91 (3.3%) |
| 11:00 AM to 11:59 AM | 63 (1.8%) | 12 (0.4%) |
| 12:00 PM to 3:59 PM | 216 (6.2%) | 181 (6.6%) |
| 4:00 PM to 11:59 PM | 213 (6.1%) | 145 (5.3%) |
| Total | 3,487 (100.0%) | 2,727 (100.0%) |
Housing Occupancy in Bates County
Occupancy by Ownership in Bates County
Of the total 5,929 dwellings in Bates County, owner-occupied units account for 4,335 (73.1%), while renter-occupied units make up 1,594 (26.9%).
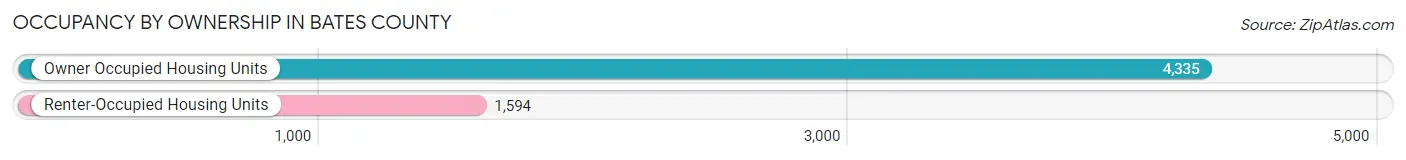
| Occupancy | # Housing Units | % Housing Units |
| Owner Occupied Housing Units | 4,335 | 73.1% |
| Renter-Occupied Housing Units | 1,594 | 26.9% |
| Total Occupied Housing Units | 5,929 | 100.0% |
Occupancy by Household Size in Bates County
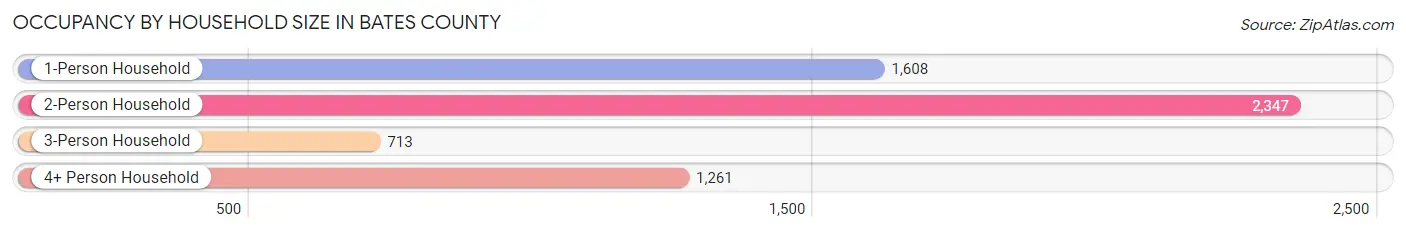
| Household Size | # Housing Units | % Housing Units |
| 1-Person Household | 1,608 | 27.1% |
| 2-Person Household | 2,347 | 39.6% |
| 3-Person Household | 713 | 12.0% |
| 4+ Person Household | 1,261 | 21.3% |
| Total Housing Units | 5,929 | 100.0% |
Occupancy by Ownership by Household Size in Bates County
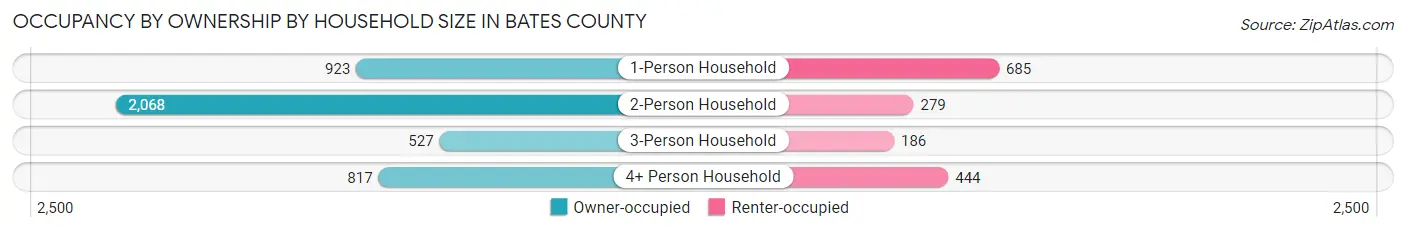
| Household Size | Owner-occupied | Renter-occupied |
| 1-Person Household | 923 (57.4%) | 685 (42.6%) |
| 2-Person Household | 2,068 (88.1%) | 279 (11.9%) |
| 3-Person Household | 527 (73.9%) | 186 (26.1%) |
| 4+ Person Household | 817 (64.8%) | 444 (35.2%) |
| Total Housing Units | 4,335 (73.1%) | 1,594 (26.9%) |
Occupancy by Educational Attainment in Bates County
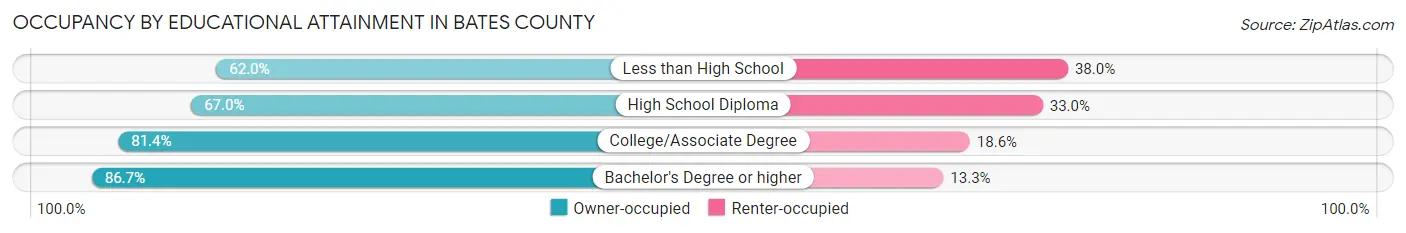
| Household Size | Owner-occupied | Renter-occupied |
| Less than High School | 391 (62.0%) | 240 (38.0%) |
| High School Diploma | 1,921 (67.0%) | 948 (33.0%) |
| College/Associate Degree | 1,275 (81.4%) | 291 (18.6%) |
| Bachelor's Degree or higher | 748 (86.7%) | 115 (13.3%) |
Occupancy by Age of Householder in Bates County
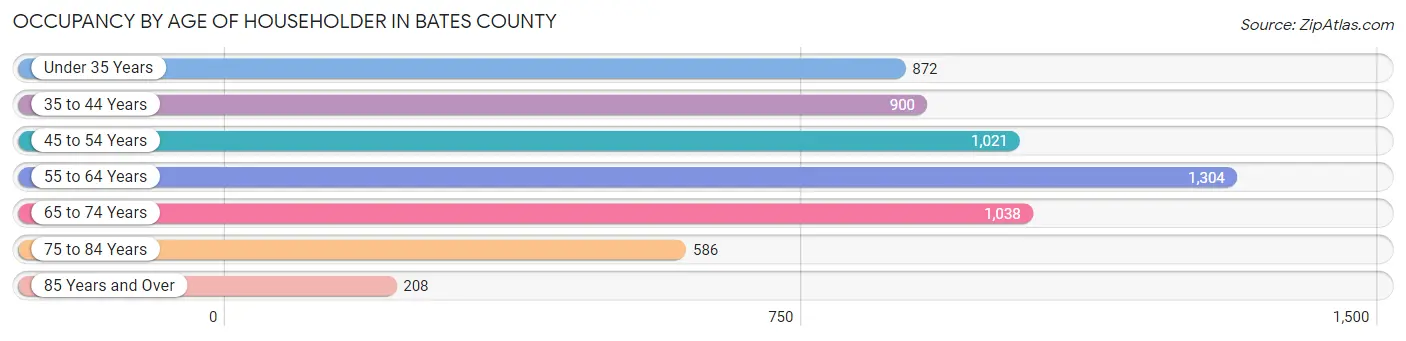
| Age Bracket | # Households | % Households |
| Under 35 Years | 872 | 14.7% |
| 35 to 44 Years | 900 | 15.2% |
| 45 to 54 Years | 1,021 | 17.2% |
| 55 to 64 Years | 1,304 | 22.0% |
| 65 to 74 Years | 1,038 | 17.5% |
| 75 to 84 Years | 586 | 9.9% |
| 85 Years and Over | 208 | 3.5% |
| Total | 5,929 | 100.0% |
Housing Finances in Bates County
Median Income by Occupancy in Bates County
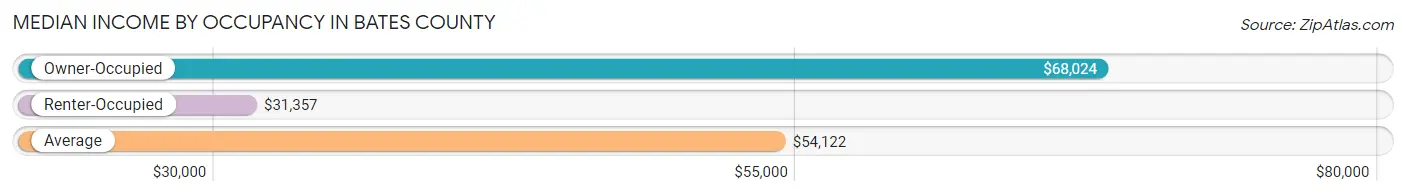
| Occupancy Type | # Households | Median Income |
| Owner-Occupied | 4,335 (73.1%) | $68,024 |
| Renter-Occupied | 1,594 (26.9%) | $31,357 |
| Average | 5,929 (100.0%) | $54,122 |
Occupancy by Householder Income Bracket in Bates County
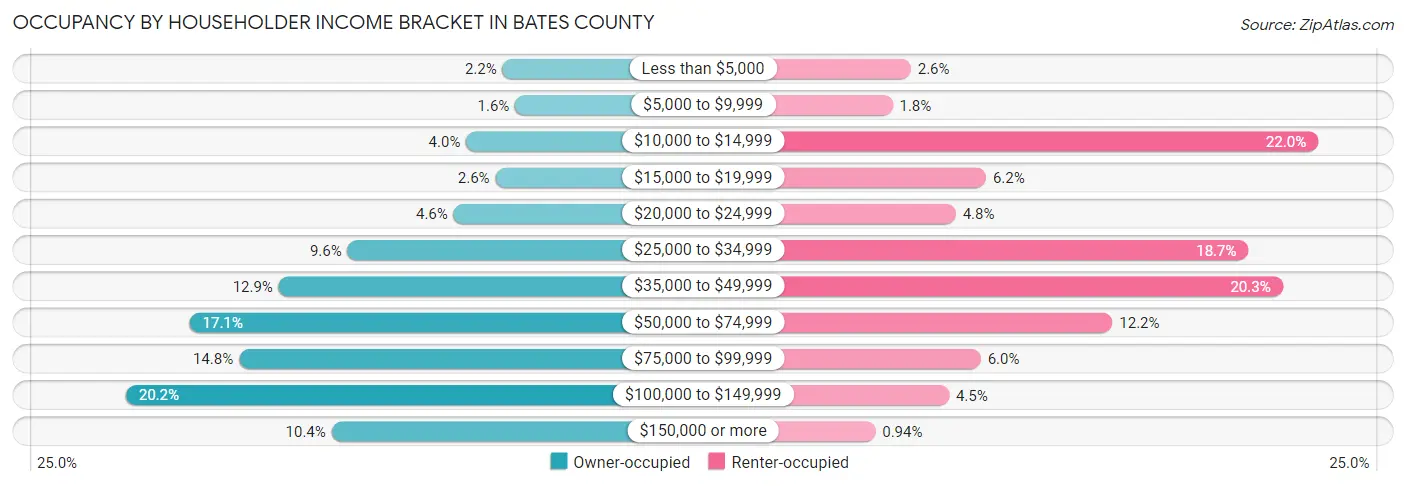
| Income Bracket | Owner-occupied | Renter-occupied |
| Less than $5,000 | 97 (2.2%) | 42 (2.6%) |
| $5,000 to $9,999 | 71 (1.6%) | 28 (1.8%) |
| $10,000 to $14,999 | 172 (4.0%) | 351 (22.0%) |
| $15,000 to $19,999 | 112 (2.6%) | 99 (6.2%) |
| $20,000 to $24,999 | 198 (4.6%) | 76 (4.8%) |
| $25,000 to $34,999 | 417 (9.6%) | 298 (18.7%) |
| $35,000 to $49,999 | 559 (12.9%) | 324 (20.3%) |
| $50,000 to $74,999 | 743 (17.1%) | 195 (12.2%) |
| $75,000 to $99,999 | 641 (14.8%) | 95 (6.0%) |
| $100,000 to $149,999 | 875 (20.2%) | 71 (4.4%) |
| $150,000 or more | 450 (10.4%) | 15 (0.9%) |
| Total | 4,335 (100.0%) | 1,594 (100.0%) |
Monthly Housing Cost Tiers in Bates County
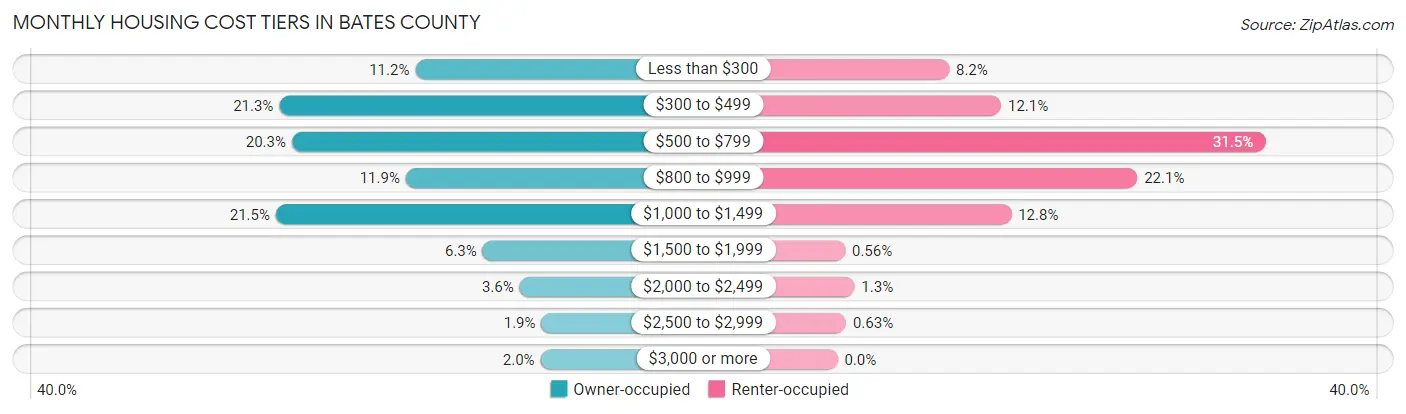
| Monthly Cost | Owner-occupied | Renter-occupied |
| Less than $300 | 487 (11.2%) | 131 (8.2%) |
| $300 to $499 | 921 (21.2%) | 192 (12.0%) |
| $500 to $799 | 881 (20.3%) | 502 (31.5%) |
| $800 to $999 | 517 (11.9%) | 352 (22.1%) |
| $1,000 to $1,499 | 932 (21.5%) | 204 (12.8%) |
| $1,500 to $1,999 | 272 (6.3%) | 9 (0.6%) |
| $2,000 to $2,499 | 154 (3.5%) | 20 (1.3%) |
| $2,500 to $2,999 | 84 (1.9%) | 10 (0.6%) |
| $3,000 or more | 87 (2.0%) | 0 (0.0%) |
| Total | 4,335 (100.0%) | 1,594 (100.0%) |
Physical Housing Characteristics in Bates County
Housing Structures in Bates County
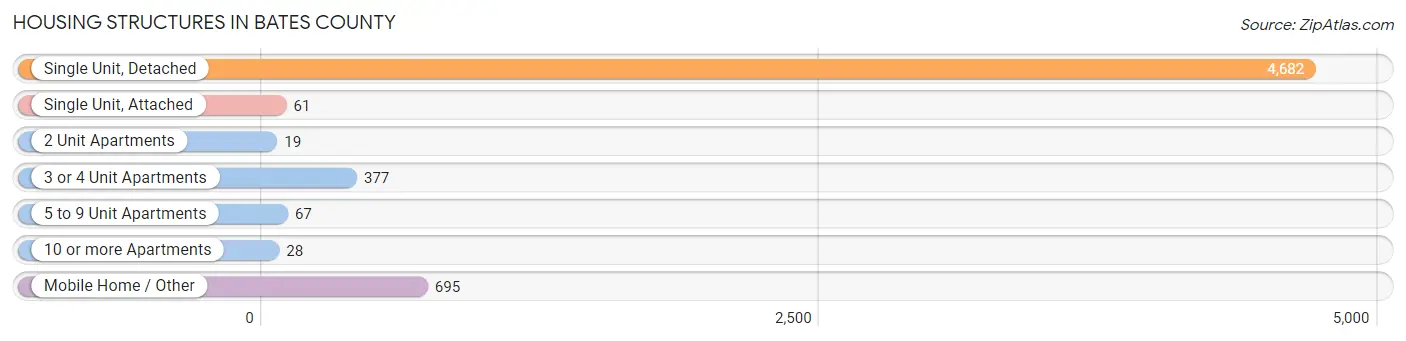
| Structure Type | # Housing Units | % Housing Units |
| Single Unit, Detached | 4,682 | 79.0% |
| Single Unit, Attached | 61 | 1.0% |
| 2 Unit Apartments | 19 | 0.3% |
| 3 or 4 Unit Apartments | 377 | 6.4% |
| 5 to 9 Unit Apartments | 67 | 1.1% |
| 10 or more Apartments | 28 | 0.5% |
| Mobile Home / Other | 695 | 11.7% |
| Total | 5,929 | 100.0% |
Housing Structures by Occupancy in Bates County
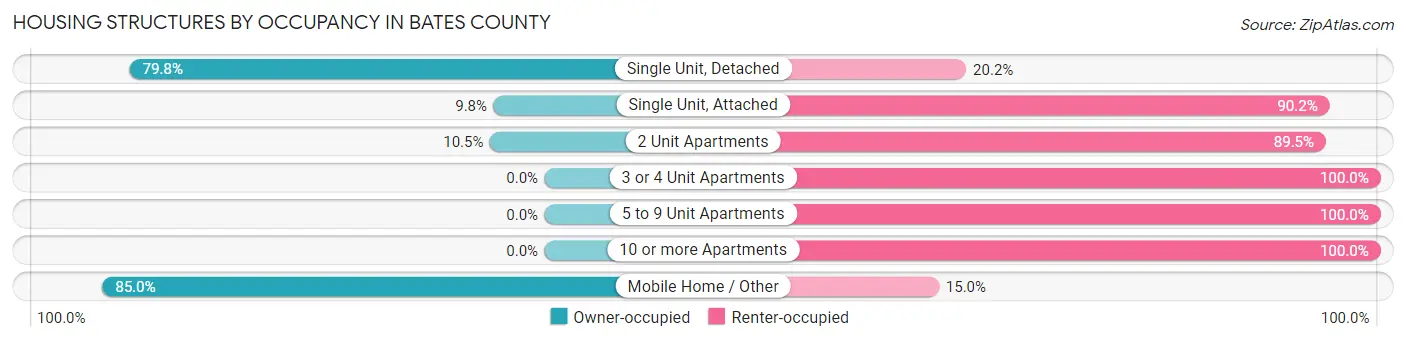
| Structure Type | Owner-occupied | Renter-occupied |
| Single Unit, Detached | 3,736 (79.8%) | 946 (20.2%) |
| Single Unit, Attached | 6 (9.8%) | 55 (90.2%) |
| 2 Unit Apartments | 2 (10.5%) | 17 (89.5%) |
| 3 or 4 Unit Apartments | 0 (0.0%) | 377 (100.0%) |
| 5 to 9 Unit Apartments | 0 (0.0%) | 67 (100.0%) |
| 10 or more Apartments | 0 (0.0%) | 28 (100.0%) |
| Mobile Home / Other | 591 (85.0%) | 104 (15.0%) |
| Total | 4,335 (73.1%) | 1,594 (26.9%) |
Housing Structures by Number of Rooms in Bates County
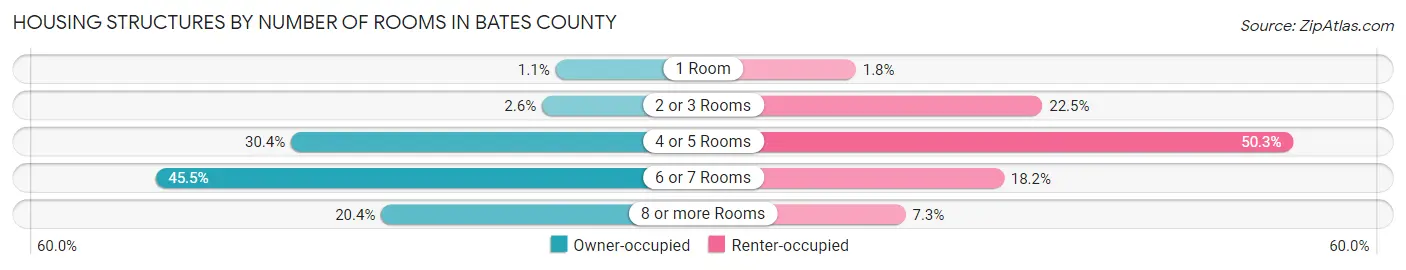
| Number of Rooms | Owner-occupied | Renter-occupied |
| 1 Room | 47 (1.1%) | 28 (1.8%) |
| 2 or 3 Rooms | 112 (2.6%) | 358 (22.5%) |
| 4 or 5 Rooms | 1,319 (30.4%) | 802 (50.3%) |
| 6 or 7 Rooms | 1,972 (45.5%) | 290 (18.2%) |
| 8 or more Rooms | 885 (20.4%) | 116 (7.3%) |
| Total | 4,335 (100.0%) | 1,594 (100.0%) |
Housing Structure by Heating Type in Bates County
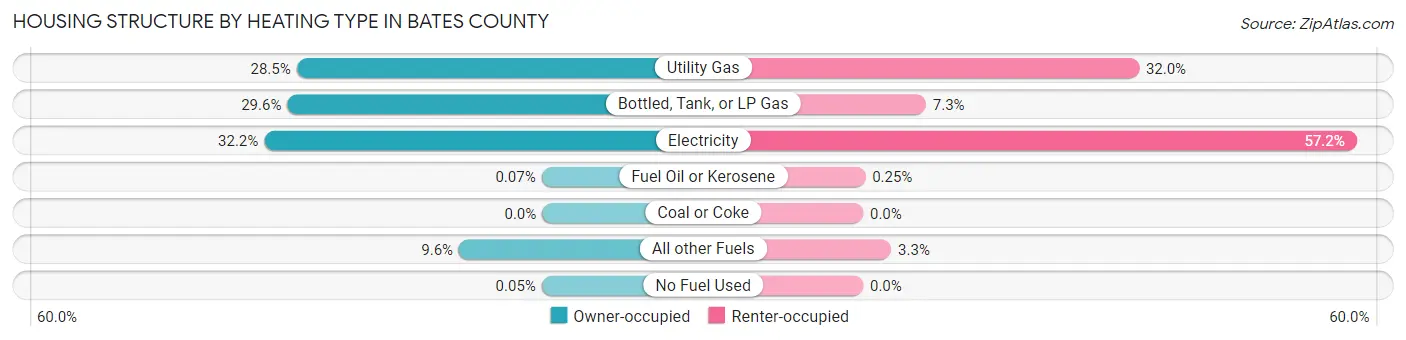
| Heating Type | Owner-occupied | Renter-occupied |
| Utility Gas | 1,234 (28.5%) | 510 (32.0%) |
| Bottled, Tank, or LP Gas | 1,281 (29.5%) | 116 (7.3%) |
| Electricity | 1,397 (32.2%) | 912 (57.2%) |
| Fuel Oil or Kerosene | 3 (0.1%) | 4 (0.3%) |
| Coal or Coke | 0 (0.0%) | 0 (0.0%) |
| All other Fuels | 418 (9.6%) | 52 (3.3%) |
| No Fuel Used | 2 (0.1%) | 0 (0.0%) |
| Total | 4,335 (100.0%) | 1,594 (100.0%) |
Household Vehicle Usage in Bates County
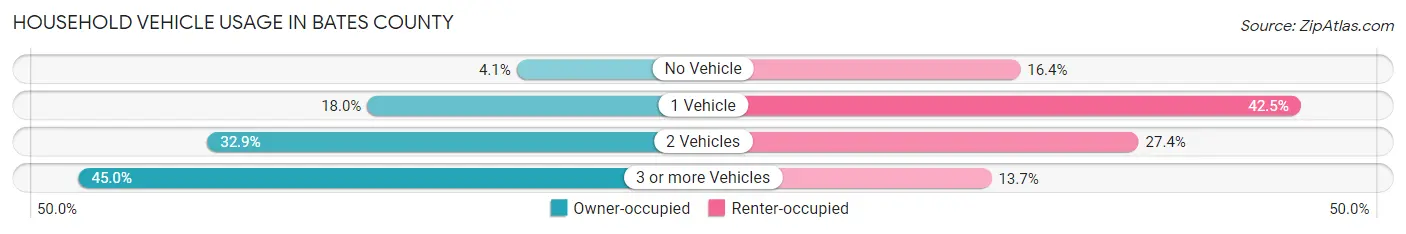
| Vehicles per Household | Owner-occupied | Renter-occupied |
| No Vehicle | 177 (4.1%) | 261 (16.4%) |
| 1 Vehicle | 781 (18.0%) | 678 (42.5%) |
| 2 Vehicles | 1,428 (32.9%) | 437 (27.4%) |
| 3 or more Vehicles | 1,949 (45.0%) | 218 (13.7%) |
| Total | 4,335 (100.0%) | 1,594 (100.0%) |
Real Estate & Mortgages in Bates County
Real Estate and Mortgage Overview in Bates County
| Characteristic | Without Mortgage | With Mortgage |
| Housing Units | 2,154 | 2,181 |
| Median Property Value | $123,800 | $161,600 |
| Median Household Income | $55,571 | $312 |
| Monthly Housing Costs | $452 | $87 |
| Real Estate Taxes | $811 | $33 |
Property Value by Mortgage Status in Bates County
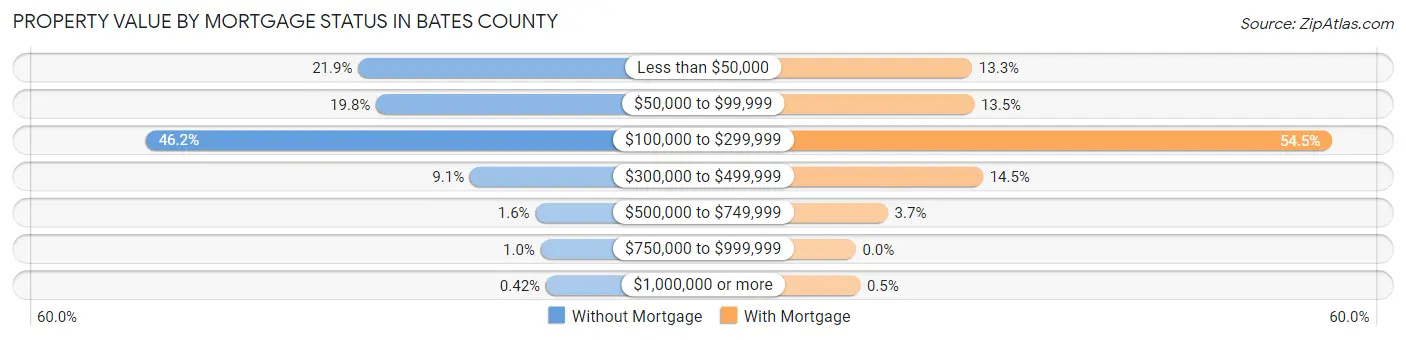
| Property Value | Without Mortgage | With Mortgage |
| Less than $50,000 | 471 (21.9%) | 290 (13.3%) |
| $50,000 to $99,999 | 427 (19.8%) | 295 (13.5%) |
| $100,000 to $299,999 | 994 (46.2%) | 1,188 (54.5%) |
| $300,000 to $499,999 | 196 (9.1%) | 317 (14.5%) |
| $500,000 to $749,999 | 35 (1.6%) | 80 (3.7%) |
| $750,000 to $999,999 | 22 (1.0%) | 0 (0.0%) |
| $1,000,000 or more | 9 (0.4%) | 11 (0.5%) |
| Total | 2,154 (100.0%) | 2,181 (100.0%) |
Household Income by Mortgage Status in Bates County
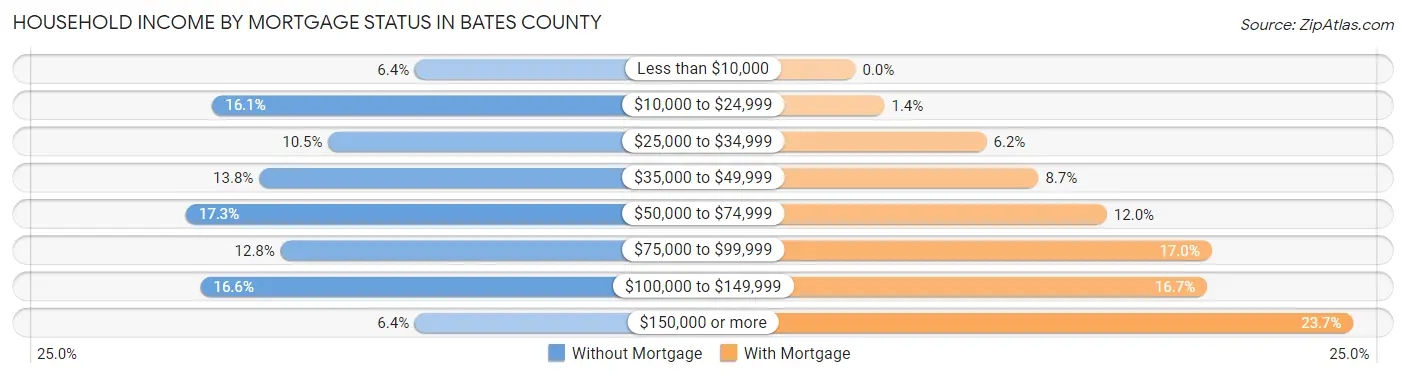
| Household Income | Without Mortgage | With Mortgage |
| Less than $10,000 | 138 (6.4%) | 0 (0.0%) |
| $10,000 to $24,999 | 346 (16.1%) | 30 (1.4%) |
| $25,000 to $34,999 | 227 (10.5%) | 136 (6.2%) |
| $35,000 to $49,999 | 298 (13.8%) | 190 (8.7%) |
| $50,000 to $74,999 | 373 (17.3%) | 261 (12.0%) |
| $75,000 to $99,999 | 276 (12.8%) | 370 (17.0%) |
| $100,000 to $149,999 | 358 (16.6%) | 365 (16.7%) |
| $150,000 or more | 138 (6.4%) | 517 (23.7%) |
| Total | 2,154 (100.0%) | 2,181 (100.0%) |
Property Value to Household Income Ratio in Bates County
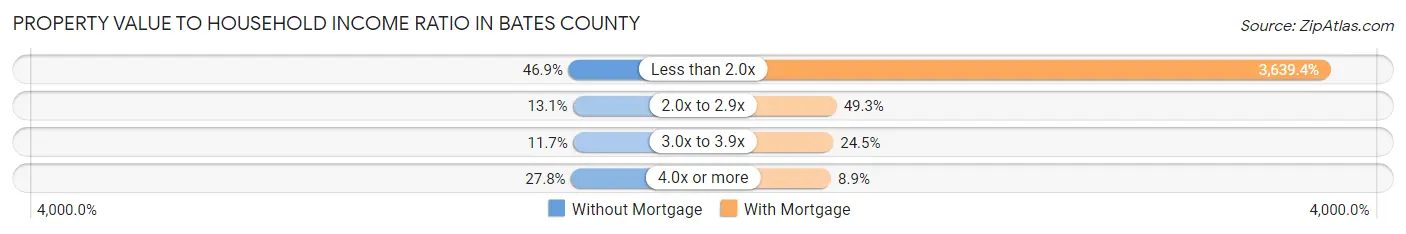
| Value-to-Income Ratio | Without Mortgage | With Mortgage |
| Less than 2.0x | 1,010 (46.9%) | 79,375 (3,639.4%) |
| 2.0x to 2.9x | 281 (13.1%) | 1,075 (49.3%) |
| 3.0x to 3.9x | 251 (11.7%) | 535 (24.5%) |
| 4.0x or more | 598 (27.8%) | 194 (8.9%) |
| Total | 2,154 (100.0%) | 2,181 (100.0%) |
Real Estate Taxes by Mortgage Status in Bates County
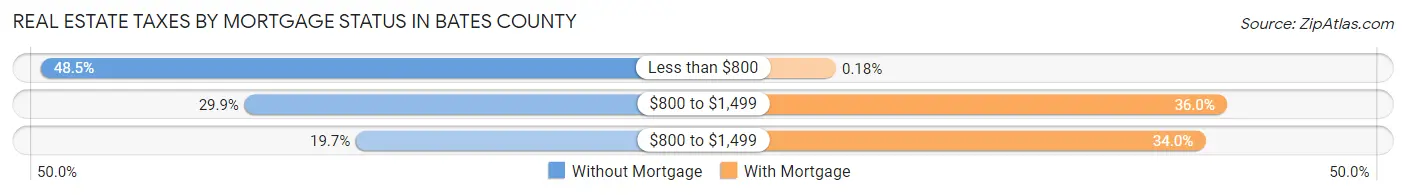
| Property Taxes | Without Mortgage | With Mortgage |
| Less than $800 | 1,045 (48.5%) | 4 (0.2%) |
| $800 to $1,499 | 644 (29.9%) | 784 (35.9%) |
| $800 to $1,499 | 425 (19.7%) | 741 (34.0%) |
| Total | 2,154 (100.0%) | 2,181 (100.0%) |
Health & Disability in Bates County
Health Insurance Coverage by Age in Bates County
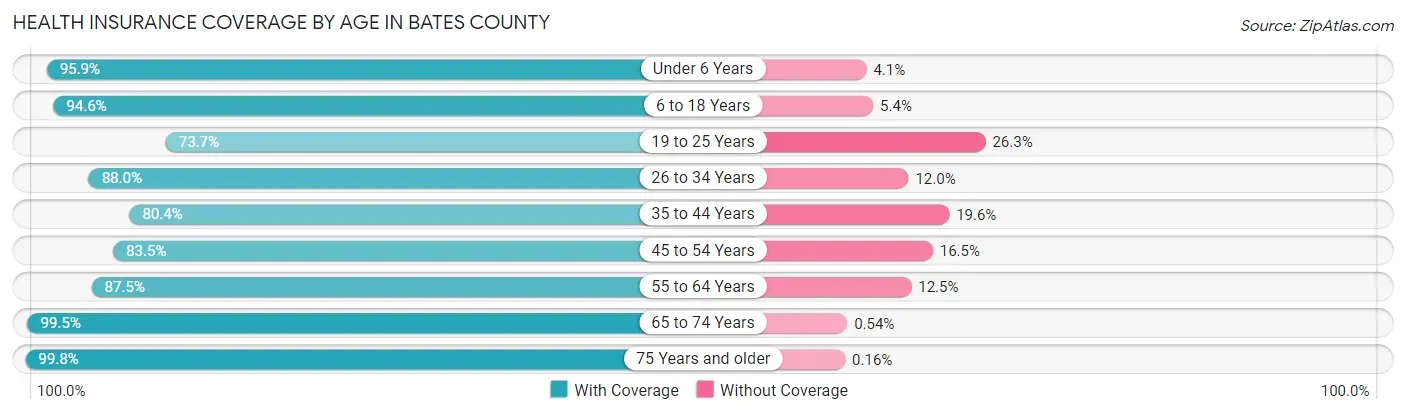
| Age Bracket | With Coverage | Without Coverage |
| Under 6 Years | 1,183 (95.9%) | 51 (4.1%) |
| 6 to 18 Years | 2,637 (94.6%) | 150 (5.4%) |
| 19 to 25 Years | 845 (73.7%) | 302 (26.3%) |
| 26 to 34 Years | 1,463 (88.0%) | 199 (12.0%) |
| 35 to 44 Years | 1,431 (80.4%) | 348 (19.6%) |
| 45 to 54 Years | 1,563 (83.5%) | 309 (16.5%) |
| 55 to 64 Years | 2,094 (87.5%) | 299 (12.5%) |
| 65 to 74 Years | 1,671 (99.5%) | 9 (0.5%) |
| 75 Years and older | 1,225 (99.8%) | 2 (0.2%) |
| Total | 14,112 (89.4%) | 1,669 (10.6%) |
Health Insurance Coverage by Citizenship Status in Bates County
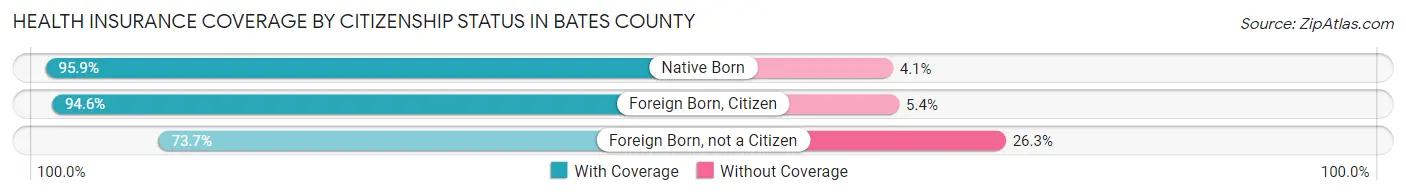
| Citizenship Status | With Coverage | Without Coverage |
| Native Born | 1,183 (95.9%) | 51 (4.1%) |
| Foreign Born, Citizen | 2,637 (94.6%) | 150 (5.4%) |
| Foreign Born, not a Citizen | 845 (73.7%) | 302 (26.3%) |
Health Insurance Coverage by Household Income in Bates County
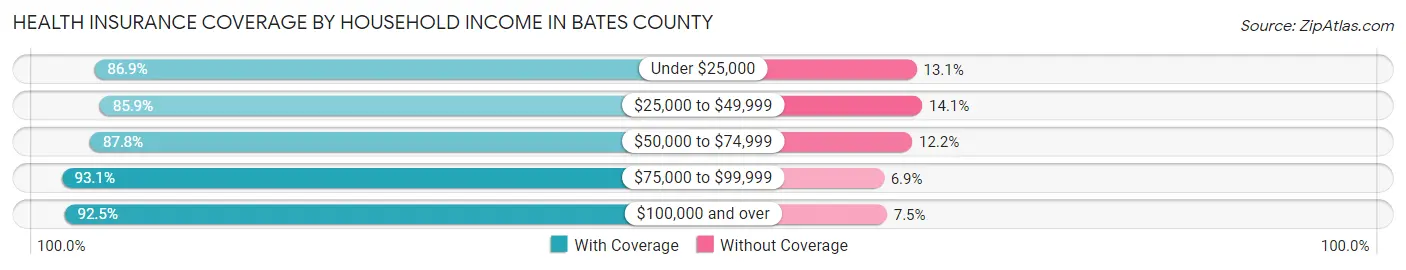
| Household Income | With Coverage | Without Coverage |
| Under $25,000 | 1,718 (86.9%) | 258 (13.1%) |
| $25,000 to $49,999 | 3,493 (85.9%) | 574 (14.1%) |
| $50,000 to $74,999 | 2,196 (87.8%) | 306 (12.2%) |
| $75,000 to $99,999 | 2,382 (93.1%) | 177 (6.9%) |
| $100,000 and over | 4,309 (92.5%) | 349 (7.5%) |
Public vs Private Health Insurance Coverage by Age in Bates County
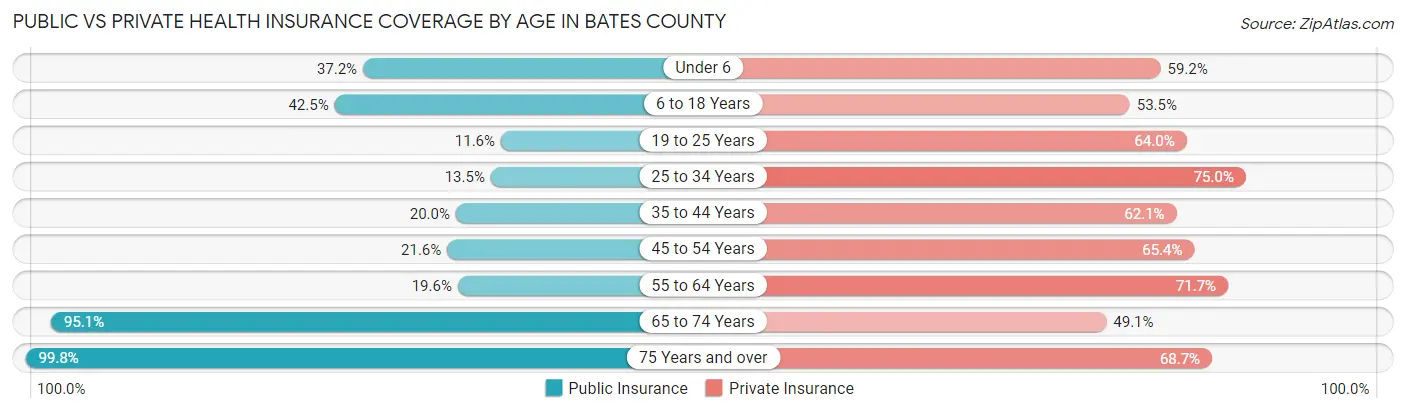
| Age Bracket | Public Insurance | Private Insurance |
| Under 6 | 459 (37.2%) | 730 (59.2%) |
| 6 to 18 Years | 1,184 (42.5%) | 1,490 (53.5%) |
| 19 to 25 Years | 133 (11.6%) | 734 (64.0%) |
| 25 to 34 Years | 224 (13.5%) | 1,246 (75.0%) |
| 35 to 44 Years | 355 (20.0%) | 1,105 (62.1%) |
| 45 to 54 Years | 404 (21.6%) | 1,225 (65.4%) |
| 55 to 64 Years | 469 (19.6%) | 1,715 (71.7%) |
| 65 to 74 Years | 1,598 (95.1%) | 825 (49.1%) |
| 75 Years and over | 1,225 (99.8%) | 843 (68.7%) |
| Total | 6,051 (38.3%) | 9,913 (62.8%) |
Disability Status by Sex by Age in Bates County
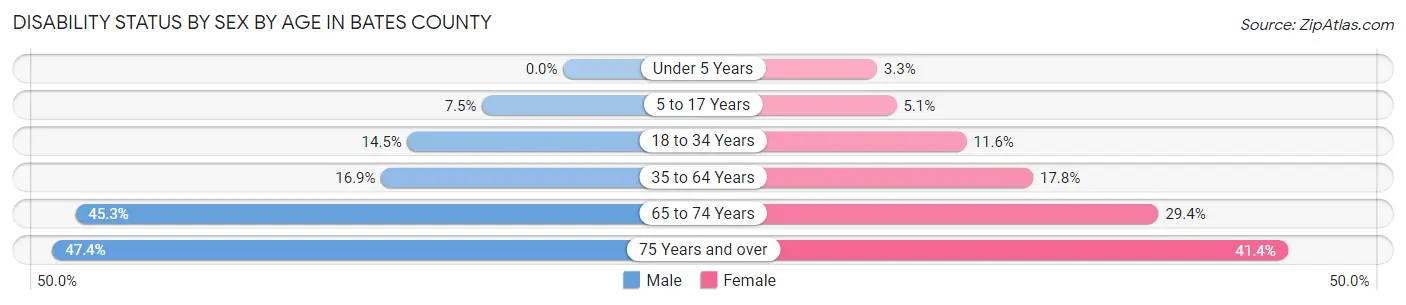
| Age Bracket | Male | Female |
| Under 5 Years | 0 (0.0%) | 17 (3.3%) |
| 5 to 17 Years | 107 (7.5%) | 68 (5.1%) |
| 18 to 34 Years | 233 (14.4%) | 167 (11.6%) |
| 35 to 64 Years | 510 (16.9%) | 537 (17.7%) |
| 65 to 74 Years | 374 (45.3%) | 251 (29.4%) |
| 75 Years and over | 230 (47.4%) | 307 (41.4%) |
Disability Class by Sex by Age in Bates County
Disability Class: Hearing Difficulty
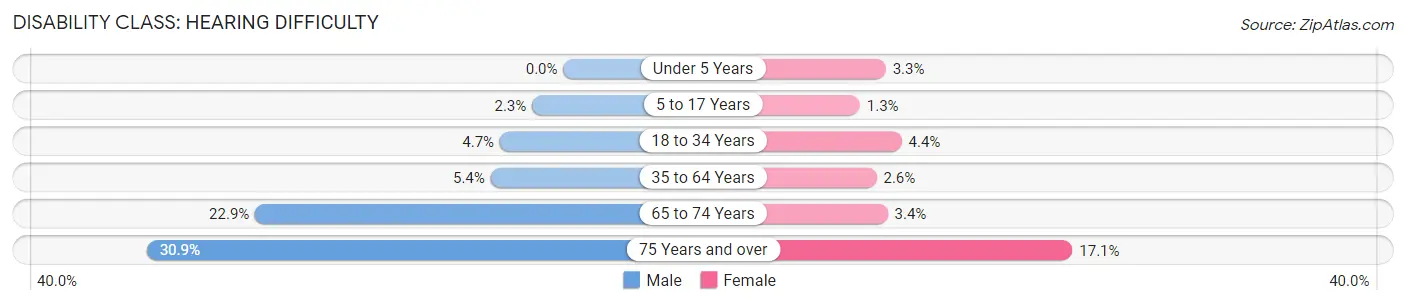
| Age Bracket | Male | Female |
| Under 5 Years | 0 (0.0%) | 17 (3.3%) |
| 5 to 17 Years | 33 (2.3%) | 18 (1.3%) |
| 18 to 34 Years | 76 (4.7%) | 64 (4.4%) |
| 35 to 64 Years | 163 (5.4%) | 78 (2.6%) |
| 65 to 74 Years | 189 (22.9%) | 29 (3.4%) |
| 75 Years and over | 150 (30.9%) | 127 (17.1%) |
Disability Class: Vision Difficulty
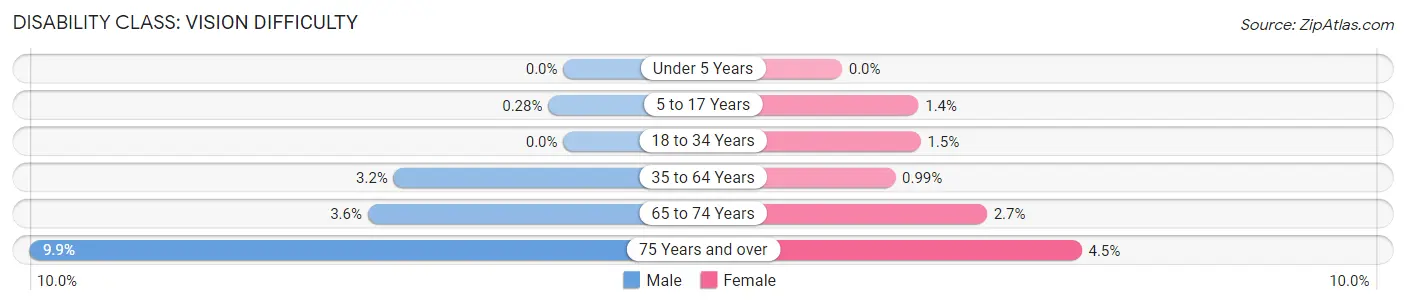
| Age Bracket | Male | Female |
| Under 5 Years | 0 (0.0%) | 0 (0.0%) |
| 5 to 17 Years | 4 (0.3%) | 19 (1.4%) |
| 18 to 34 Years | 0 (0.0%) | 21 (1.5%) |
| 35 to 64 Years | 95 (3.2%) | 30 (1.0%) |
| 65 to 74 Years | 30 (3.6%) | 23 (2.7%) |
| 75 Years and over | 48 (9.9%) | 33 (4.4%) |
Disability Class: Cognitive Difficulty
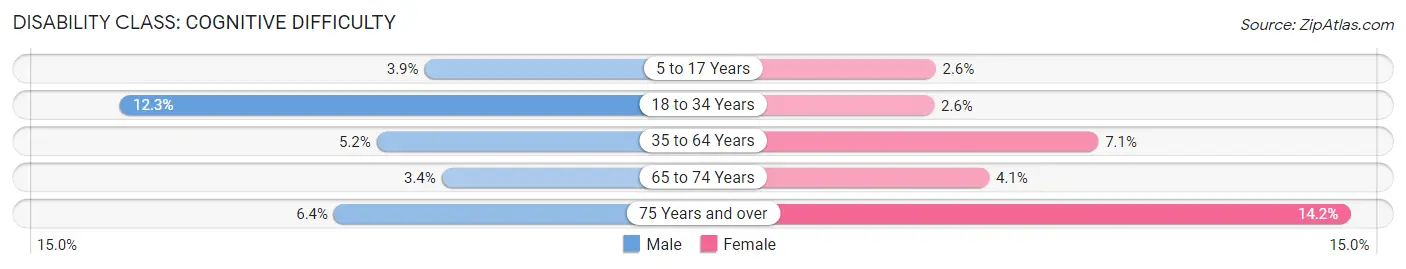
| Age Bracket | Male | Female |
| 5 to 17 Years | 55 (3.9%) | 35 (2.6%) |
| 18 to 34 Years | 199 (12.3%) | 37 (2.6%) |
| 35 to 64 Years | 157 (5.2%) | 216 (7.1%) |
| 65 to 74 Years | 28 (3.4%) | 35 (4.1%) |
| 75 Years and over | 31 (6.4%) | 105 (14.1%) |
Disability Class: Ambulatory Difficulty
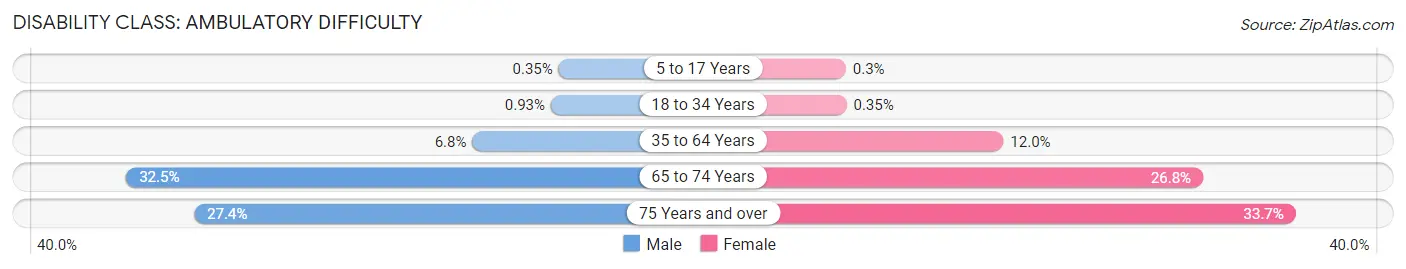
| Age Bracket | Male | Female |
| 5 to 17 Years | 5 (0.4%) | 4 (0.3%) |
| 18 to 34 Years | 15 (0.9%) | 5 (0.4%) |
| 35 to 64 Years | 204 (6.8%) | 363 (12.0%) |
| 65 to 74 Years | 268 (32.5%) | 229 (26.8%) |
| 75 Years and over | 133 (27.4%) | 250 (33.7%) |
Disability Class: Self-Care Difficulty
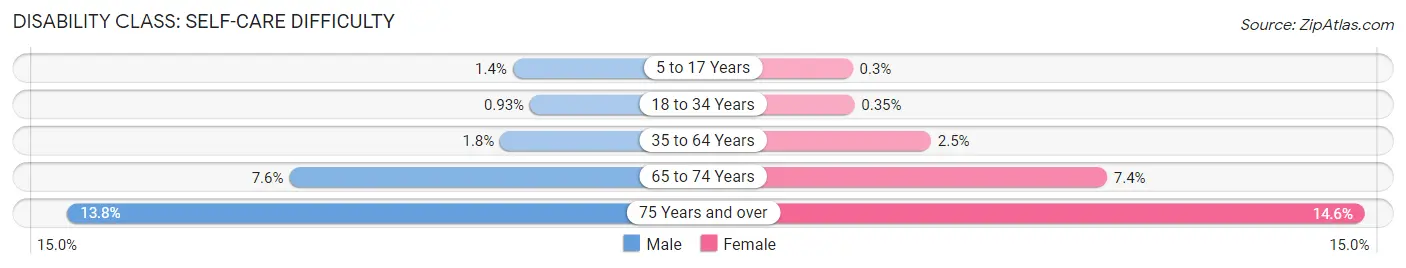
| Age Bracket | Male | Female |
| 5 to 17 Years | 20 (1.4%) | 4 (0.3%) |
| 18 to 34 Years | 15 (0.9%) | 5 (0.4%) |
| 35 to 64 Years | 53 (1.8%) | 75 (2.5%) |
| 65 to 74 Years | 63 (7.6%) | 63 (7.4%) |
| 75 Years and over | 67 (13.8%) | 108 (14.6%) |
Technology Access in Bates County
Computing Device Access in Bates County
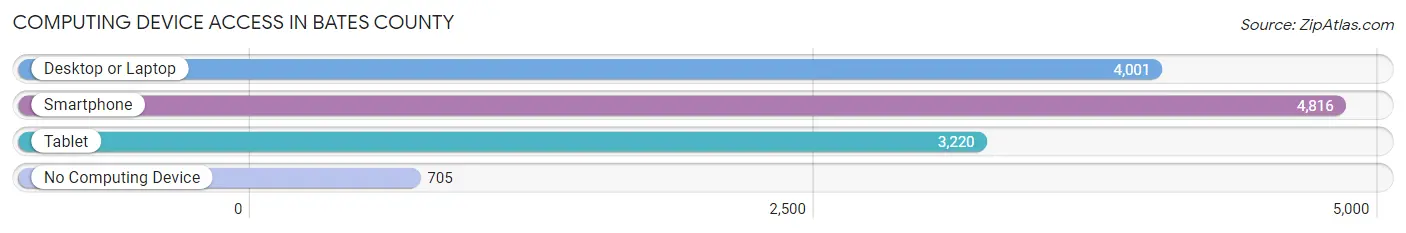
| Device Type | # Households | % Households |
| Desktop or Laptop | 4,001 | 67.5% |
| Smartphone | 4,816 | 81.2% |
| Tablet | 3,220 | 54.3% |
| No Computing Device | 705 | 11.9% |
| Total | 5,929 | 100.0% |
Internet Access in Bates County
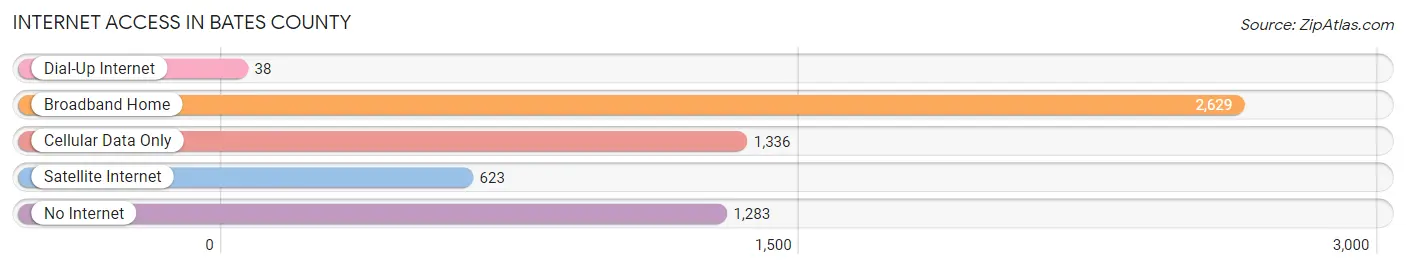
| Internet Type | # Households | % Households |
| Dial-Up Internet | 38 | 0.6% |
| Broadband Home | 2,629 | 44.3% |
| Cellular Data Only | 1,336 | 22.5% |
| Satellite Internet | 623 | 10.5% |
| No Internet | 1,283 | 21.6% |
| Total | 5,929 | 100.0% |
Bates County Summary
Bates County, Missouri is located in the western part of the state, and is part of the Kansas City metropolitan area. The county was established in 1841 and named after Frederick Bates, the second governor of Missouri. The county seat is Butler, and the population was estimated to be 17,049 in 2019.
Geography
Bates County is located in the western part of Missouri, and is bordered by Cass County to the north, Henry County to the east, St. Clair County to the south, and Vernon County to the west. The county covers an area of 576 square miles, and is mostly rural, with rolling hills and wooded areas. The major rivers in the county are the Marais des Cygnes and the Osage. The highest point in the county is located in the northwest corner, at an elevation of 1,068 feet.
The climate of Bates County is humid continental, with hot, humid summers and cold, dry winters. The average annual temperature is around 54°F, and the average annual precipitation is around 39 inches.
Economy
The economy of Bates County is largely based on agriculture. The major crops grown in the county are corn, soybeans, wheat, hay, and sorghum. Livestock production is also important, with cattle, hogs, and poultry being the main animals raised.
The county also has a number of manufacturing and service industries. The major employers in the county include the Bates County Memorial Hospital, the Butler R-V School District, and the Bates County Courthouse.
Demographics
As of the 2010 census, the population of Bates County was 17,049, with a population density of 29.6 people per square mile. The racial makeup of the county was 95.3% White, 1.3% African American, 0.5% Native American, 0.3% Asian, 0.1% Pacific Islander, 0.7% from other races, and 1.8% from two or more races. Hispanic or Latino of any race were 2.2% of the population.
The median income for a household in the county was $41,945, and the median income for a family was $50,945. The per capita income for the county was $20,945. About 11.2% of the population was below the poverty line.
Conclusion
Bates County, Missouri is a rural county located in the western part of the state. The county is largely agricultural, with corn, soybeans, wheat, hay, and sorghum being the major crops grown. The county also has a number of manufacturing and service industries. The population of the county was estimated to be 17,049 in 2019, with a median household income of $41,945.
Common Questions
What is Per Capita Income in Bates County?
Per Capita income in Bates County is $27,333.
What is the Median Family Income in Bates County?
Median Family Income in Bates County is $73,576.
What is the Median Household income in Bates County?
Median Household Income in Bates County is $54,122.
What is Income or Wage Gap in Bates County?
Income or Wage Gap in Bates County is 36.2%.
Women in Bates County earn 63.8 cents for every dollar earned by a man.
What is Family Income Deficit in Bates County?
Family Income Deficit in Bates County is $11,243.
Families that are below poverty line in Bates County earn $11,243 less on average than the poverty threshold level.
What is Inequality or Gini Index in Bates County?
Inequality or Gini Index in Bates County is 0.43.
What is the Total Population of Bates County?
Total Population of Bates County is 16,101.
What is the Total Male Population of Bates County?
Total Male Population of Bates County is 8,064.
What is the Total Female Population of Bates County?
Total Female Population of Bates County is 8,037.
What is the Ratio of Males per 100 Females in Bates County?
There are 100.34 Males per 100 Females in Bates County.
What is the Ratio of Females per 100 Males in Bates County?
There are 99.67 Females per 100 Males in Bates County.
What is the Median Population Age in Bates County?
Median Population Age in Bates County is 40.7 Years.
What is the Average Family Size in Bates County
Average Family Size in Bates County is 3.2 People.
What is the Average Household Size in Bates County
Average Household Size in Bates County is 2.7 People.
How Large is the Labor Force in Bates County?
There are 7,583 People in the Labor Forcein in Bates County.
What is the Percentage of People in the Labor Force in Bates County?
59.1% of People are in the Labor Force in Bates County.
What is the Unemployment Rate in Bates County?
Unemployment Rate in Bates County is 7.5%.