Barry County, MO Map & Demographics
Barry County Map
Barry County Overview
$30,932
PER CAPITA INCOME
$67,373
AVG FAMILY INCOME
$55,592
AVG HOUSEHOLD INCOME
22.2%
WAGE / INCOME GAP [ % ]
77.8¢/ $1
WAGE / INCOME GAP [ $ ]
$10,093
FAMILY INCOME DEFICIT
0.47
INEQUALITY / GINI INDEX
34,701
TOTAL POPULATION
17,540
MALE POPULATION
17,161
FEMALE POPULATION
102.21
MALES / 100 FEMALES
97.84
FEMALES / 100 MALES
43.2
MEDIAN AGE
3.0
AVG FAMILY SIZE
2.6
AVG HOUSEHOLD SIZE
15,510
LABOR FORCE [ PEOPLE ]
55.9%
PERCENT IN LABOR FORCE
3.6%
UNEMPLOYMENT RATE
Barry County Area Codes
Income in Barry County
Income Overview in Barry County
Per Capita Income in Barry County is $30,932, while median incomes of families and households are $67,373 and $55,592 respectively.
| Characteristic | Number | Measure |
| Per Capita Income | 34,701 | $30,932 |
| Median Family Income | 9,387 | $67,373 |
| Mean Family Income | 9,387 | $91,299 |
| Median Household Income | 13,415 | $55,592 |
| Mean Household Income | 13,415 | $78,014 |
| Income Deficit | 9,387 | $10,093 |
| Wage / Income Gap (%) | 34,701 | 22.16% |
| Wage / Income Gap ($) | 34,701 | 77.84¢ per $1 |
| Gini / Inequality Index | 34,701 | 0.47 |
Earnings by Sex in Barry County
Average Earnings in Barry County are $34,156, $39,475 for men and $30,726 for women, a difference of 22.2%.
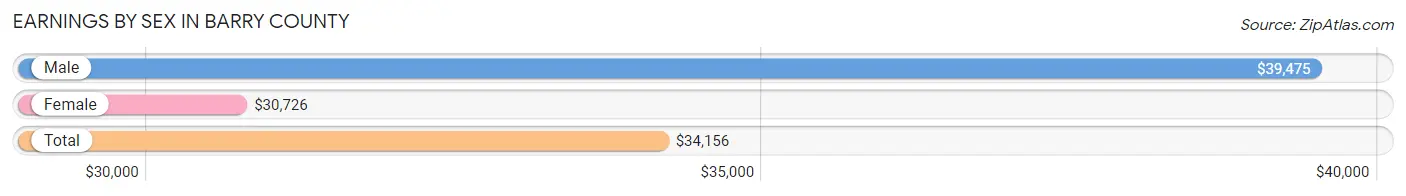
| Sex | Number | Average Earnings |
| Male | 9,109 (56.3%) | $39,475 |
| Female | 7,060 (43.7%) | $30,726 |
| Total | 16,169 (100.0%) | $34,156 |
Earnings by Sex by Income Bracket in Barry County
The most common earnings brackets in Barry County are $100,000+ for men (933 | 10.2%) and $30,000 to $34,999 for women (1,025 | 14.5%).
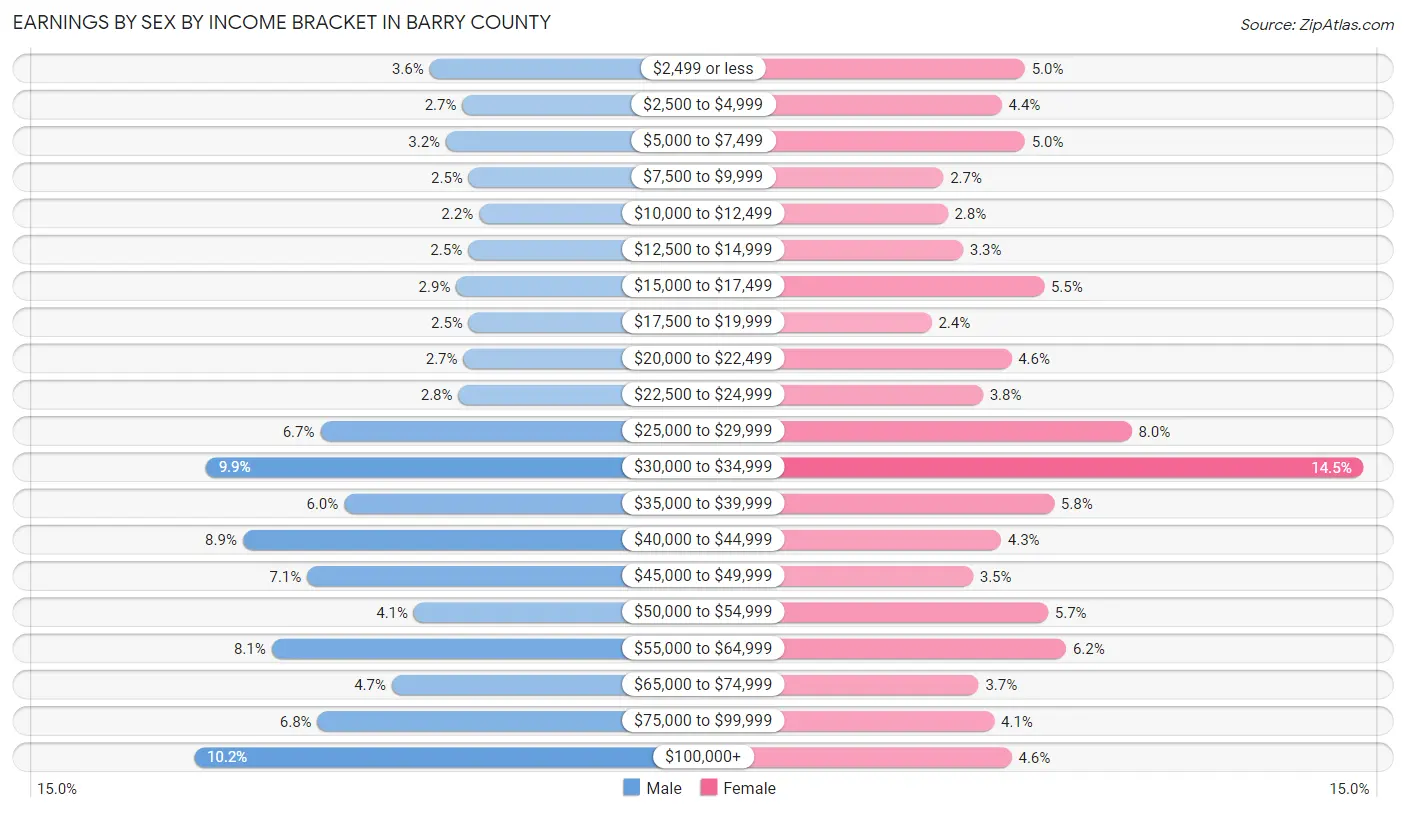
| Income | Male | Female |
| $2,499 or less | 330 (3.6%) | 353 (5.0%) |
| $2,500 to $4,999 | 246 (2.7%) | 307 (4.3%) |
| $5,000 to $7,499 | 288 (3.2%) | 353 (5.0%) |
| $7,500 to $9,999 | 230 (2.5%) | 191 (2.7%) |
| $10,000 to $12,499 | 203 (2.2%) | 200 (2.8%) |
| $12,500 to $14,999 | 231 (2.5%) | 230 (3.3%) |
| $15,000 to $17,499 | 261 (2.9%) | 391 (5.5%) |
| $17,500 to $19,999 | 230 (2.5%) | 168 (2.4%) |
| $20,000 to $22,499 | 243 (2.7%) | 326 (4.6%) |
| $22,500 to $24,999 | 256 (2.8%) | 270 (3.8%) |
| $25,000 to $29,999 | 609 (6.7%) | 565 (8.0%) |
| $30,000 to $34,999 | 903 (9.9%) | 1,025 (14.5%) |
| $35,000 to $39,999 | 548 (6.0%) | 411 (5.8%) |
| $40,000 to $44,999 | 808 (8.9%) | 306 (4.3%) |
| $45,000 to $49,999 | 643 (7.1%) | 250 (3.5%) |
| $50,000 to $54,999 | 370 (4.1%) | 399 (5.7%) |
| $55,000 to $64,999 | 734 (8.1%) | 435 (6.2%) |
| $65,000 to $74,999 | 426 (4.7%) | 261 (3.7%) |
| $75,000 to $99,999 | 617 (6.8%) | 292 (4.1%) |
| $100,000+ | 933 (10.2%) | 327 (4.6%) |
| Total | 9,109 (100.0%) | 7,060 (100.0%) |
Earnings by Sex by Educational Attainment in Barry County
Average earnings in Barry County are $42,148 for men and $31,980 for women, a difference of 24.1%. Men with an educational attainment of bachelor's degree enjoy the highest average annual earnings of $84,961, while those with less than high school education earn the least with $32,000. Women with an educational attainment of bachelor's degree earn the most with the average annual earnings of $54,750, while those with less than high school education have the smallest earnings of $29,643.
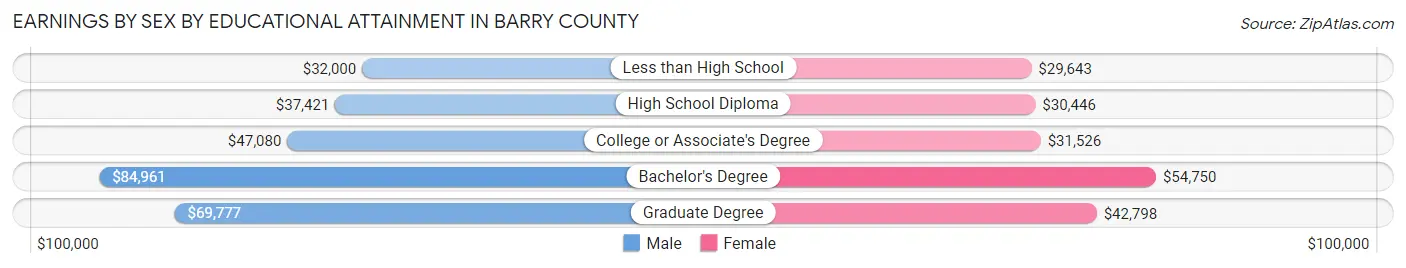
| Educational Attainment | Male Income | Female Income |
| Less than High School | $32,000 | $29,643 |
| High School Diploma | $37,421 | $30,446 |
| College or Associate's Degree | $47,080 | $31,526 |
| Bachelor's Degree | $84,961 | $54,750 |
| Graduate Degree | $69,777 | $42,798 |
| Total | $42,148 | $31,980 |
Family Income in Barry County
Family Income Brackets in Barry County
According to the Barry County family income data, there are 1,877 families falling into the $50,000 to $74,999 income range, which is the most common income bracket and makes up 20.0% of all families. Conversely, the less than $10,000 income bracket is the least frequent group with only 188 families (2.0%) belonging to this category.
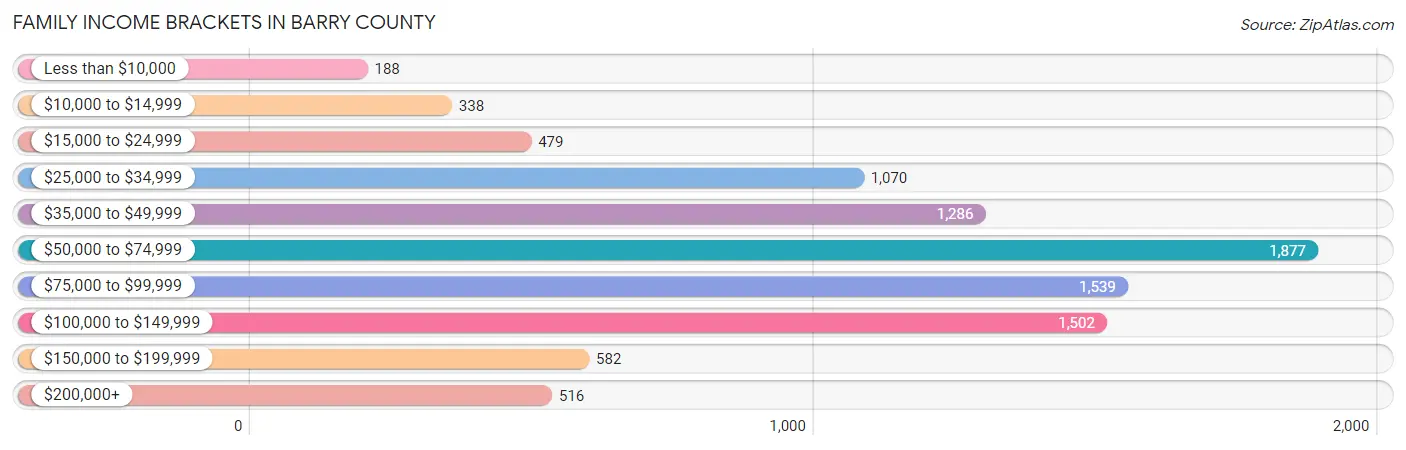
| Income Bracket | # Families | % Families |
| Less than $10,000 | 188 | 2.0% |
| $10,000 to $14,999 | 338 | 3.6% |
| $15,000 to $24,999 | 479 | 5.1% |
| $25,000 to $34,999 | 1,070 | 11.4% |
| $35,000 to $49,999 | 1,286 | 13.7% |
| $50,000 to $74,999 | 1,877 | 20.0% |
| $75,000 to $99,999 | 1,539 | 16.4% |
| $100,000 to $149,999 | 1,502 | 16.0% |
| $150,000 to $199,999 | 582 | 6.2% |
| $200,000+ | 516 | 5.5% |
Family Income by Famaliy Size in Barry County
5-person families (776 | 8.3%) account for the highest median family income in Barry County with $84,643 per family, while 2-person families (5,159 | 55.0%) have the highest median income of $33,919 per family member.
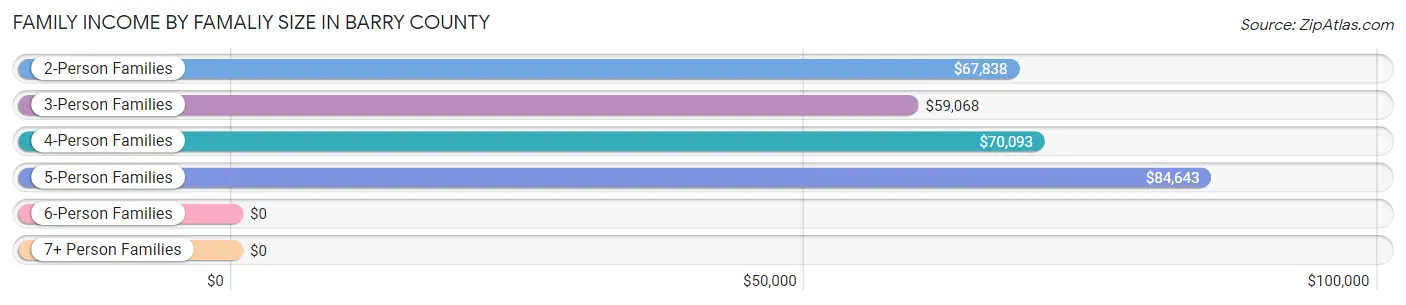
| Income Bracket | # Families | Median Income |
| 2-Person Families | 5,159 (55.0%) | $67,838 |
| 3-Person Families | 1,315 (14.0%) | $59,068 |
| 4-Person Families | 1,552 (16.5%) | $70,093 |
| 5-Person Families | 776 (8.3%) | $84,643 |
| 6-Person Families | 404 (4.3%) | $0 |
| 7+ Person Families | 181 (1.9%) | $0 |
| Total | 9,387 (100.0%) | $67,373 |
Family Income by Number of Earners in Barry County
The median family income in Barry County is $67,373, with families comprising 3+ earners (836) having the highest median family income of $120,652, while families with no earners (1,874) have the lowest median family income of $43,085, accounting for 8.9% and 20.0% of families, respectively.
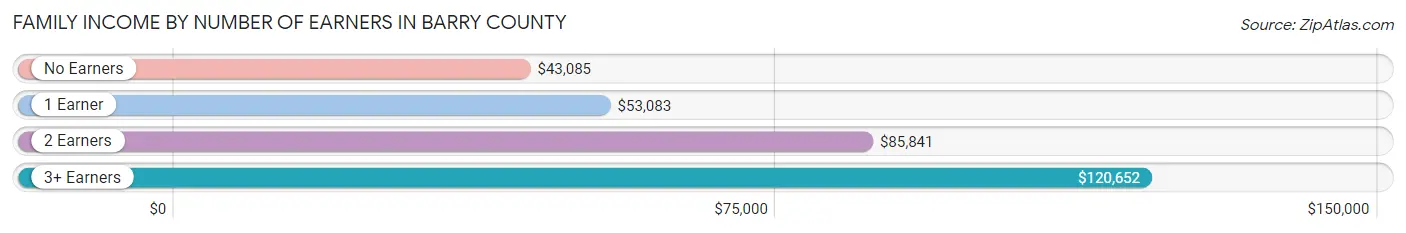
| Number of Earners | # Families | Median Income |
| No Earners | 1,874 (20.0%) | $43,085 |
| 1 Earner | 3,385 (36.1%) | $53,083 |
| 2 Earners | 3,292 (35.1%) | $85,841 |
| 3+ Earners | 836 (8.9%) | $120,652 |
| Total | 9,387 (100.0%) | $67,373 |
Household Income in Barry County
Household Income Brackets in Barry County
With 2,374 households falling in the category, the $50,000 to $74,999 income range is the most frequent in Barry County, accounting for 17.7% of all households. In contrast, only 470 households (3.5%) fall into the less than $10,000 income bracket, making it the least populous group.
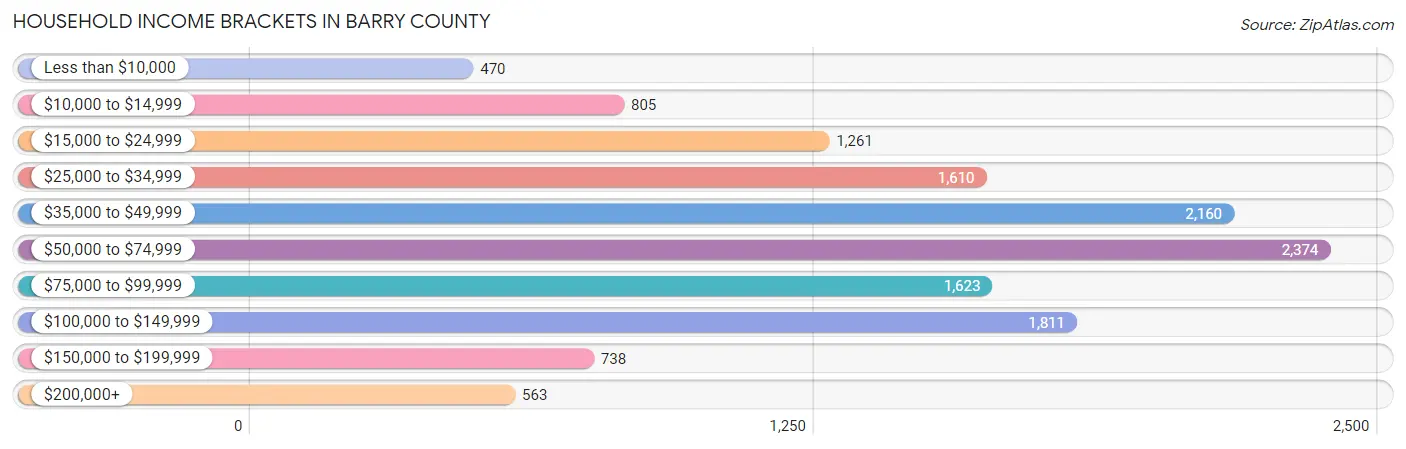
| Income Bracket | # Households | % Households |
| Less than $10,000 | 470 | 3.5% |
| $10,000 to $14,999 | 805 | 6.0% |
| $15,000 to $24,999 | 1,261 | 9.4% |
| $25,000 to $34,999 | 1,610 | 12.0% |
| $35,000 to $49,999 | 2,160 | 16.1% |
| $50,000 to $74,999 | 2,374 | 17.7% |
| $75,000 to $99,999 | 1,623 | 12.1% |
| $100,000 to $149,999 | 1,811 | 13.5% |
| $150,000 to $199,999 | 738 | 5.5% |
| $200,000+ | 563 | 4.2% |
Household Income by Householder Age in Barry County
The median household income in Barry County is $55,592, with the highest median household income of $68,296 found in the 45 to 64 years age bracket for the primary householder. A total of 4,900 households (36.5%) fall into this category. Meanwhile, the 65+ years age bracket for the primary householder has the lowest median household income of $41,392, with 4,628 households (34.5%) in this group.
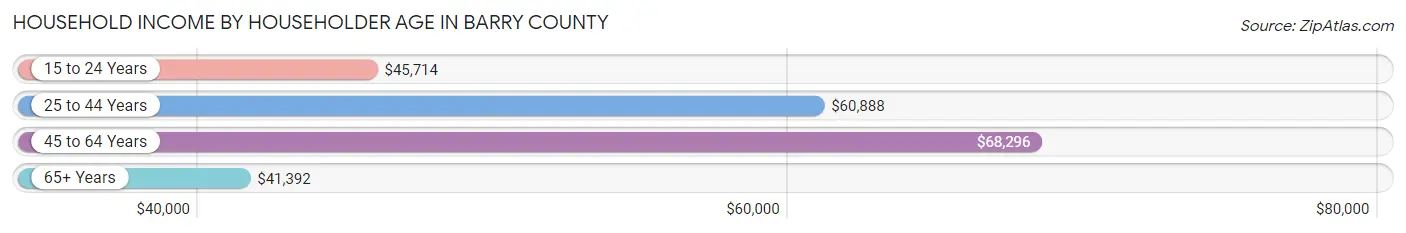
| Income Bracket | # Households | Median Income |
| 15 to 24 Years | 396 (2.9%) | $45,714 |
| 25 to 44 Years | 3,491 (26.0%) | $60,888 |
| 45 to 64 Years | 4,900 (36.5%) | $68,296 |
| 65+ Years | 4,628 (34.5%) | $41,392 |
| Total | 13,415 (100.0%) | $55,592 |
Poverty in Barry County
Income Below Poverty by Sex and Age in Barry County
With 17.8% poverty level for males and 19.2% for females among the residents of Barry County, 6 to 11 year old males and 6 to 11 year old females are the most vulnerable to poverty, with 524 males (38.6%) and 456 females (37.0%) in their respective age groups living below the poverty level.
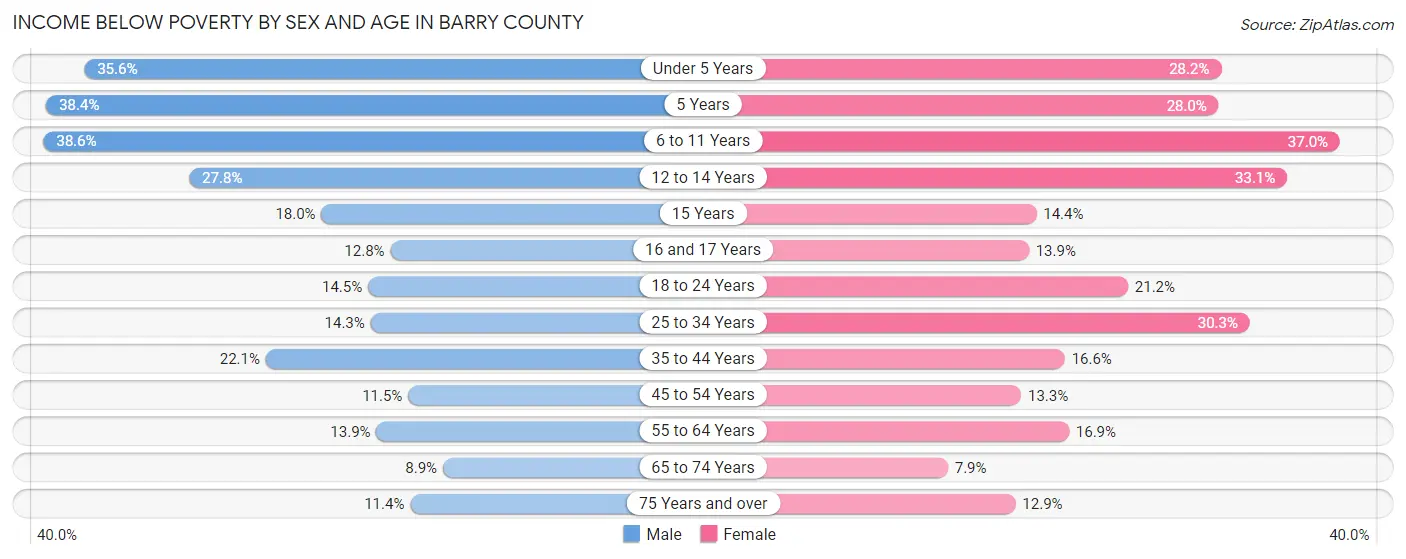
| Age Bracket | Male | Female |
| Under 5 Years | 350 (35.6%) | 271 (28.2%) |
| 5 Years | 63 (38.4%) | 68 (28.0%) |
| 6 to 11 Years | 524 (38.6%) | 456 (37.0%) |
| 12 to 14 Years | 207 (27.8%) | 164 (33.1%) |
| 15 Years | 51 (18.0%) | 41 (14.4%) |
| 16 and 17 Years | 61 (12.8%) | 49 (13.9%) |
| 18 to 24 Years | 193 (14.5%) | 247 (21.2%) |
| 25 to 34 Years | 297 (14.3%) | 547 (30.3%) |
| 35 to 44 Years | 406 (22.1%) | 330 (16.6%) |
| 45 to 54 Years | 227 (11.5%) | 272 (13.3%) |
| 55 to 64 Years | 351 (13.9%) | 416 (16.9%) |
| 65 to 74 Years | 199 (8.9%) | 175 (7.9%) |
| 75 Years and over | 154 (11.4%) | 211 (12.9%) |
| Total | 3,083 (17.8%) | 3,247 (19.2%) |
Income Above Poverty by Sex and Age in Barry County
According to the poverty statistics in Barry County, males aged 65 to 74 years and females aged 65 to 74 years are the age groups that are most secure financially, with 91.1% of males and 92.1% of females in these age groups living above the poverty line.
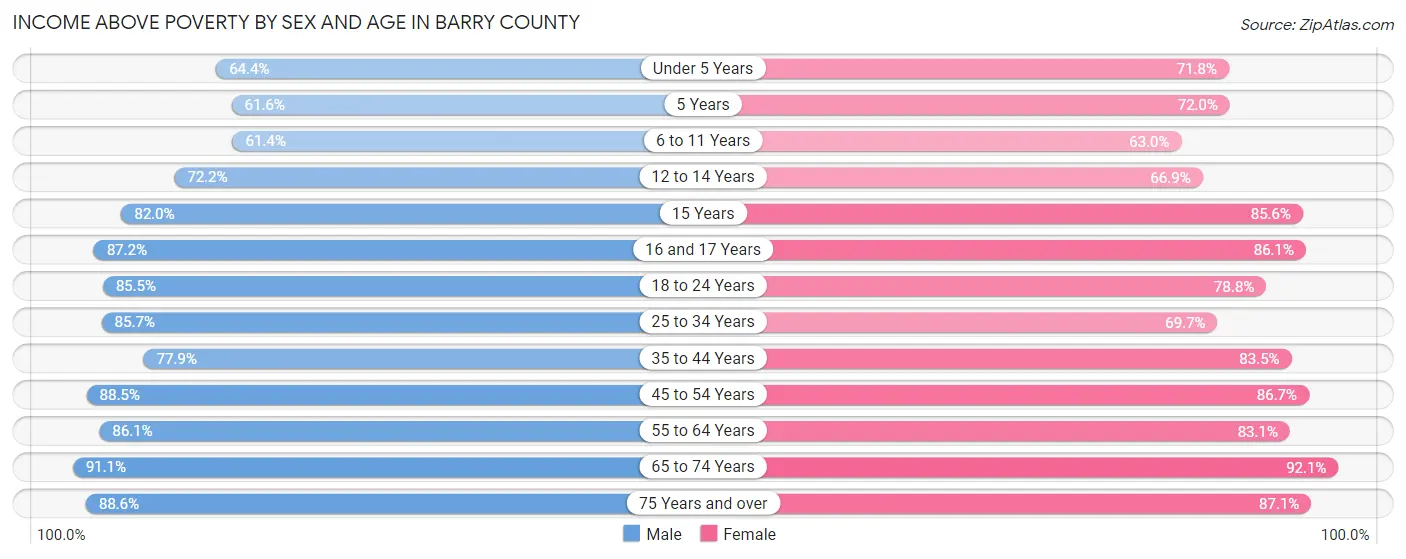
| Age Bracket | Male | Female |
| Under 5 Years | 634 (64.4%) | 691 (71.8%) |
| 5 Years | 101 (61.6%) | 175 (72.0%) |
| 6 to 11 Years | 833 (61.4%) | 777 (63.0%) |
| 12 to 14 Years | 538 (72.2%) | 332 (66.9%) |
| 15 Years | 233 (82.0%) | 243 (85.6%) |
| 16 and 17 Years | 414 (87.2%) | 304 (86.1%) |
| 18 to 24 Years | 1,138 (85.5%) | 916 (78.8%) |
| 25 to 34 Years | 1,779 (85.7%) | 1,259 (69.7%) |
| 35 to 44 Years | 1,432 (77.9%) | 1,664 (83.5%) |
| 45 to 54 Years | 1,744 (88.5%) | 1,771 (86.7%) |
| 55 to 64 Years | 2,178 (86.1%) | 2,052 (83.1%) |
| 65 to 74 Years | 2,027 (91.1%) | 2,048 (92.1%) |
| 75 Years and over | 1,201 (88.6%) | 1,426 (87.1%) |
| Total | 14,252 (82.2%) | 13,658 (80.8%) |
Income Below Poverty Among Married-Couple Families in Barry County
The poverty statistics for married-couple families in Barry County show that 8.9% or 679 of the total 7,607 families live below the poverty line. Families with 5 or more children have the highest poverty rate of 37.2%, comprising of 19 families. On the other hand, families with no children have the lowest poverty rate of 6.2%, which includes 307 families.
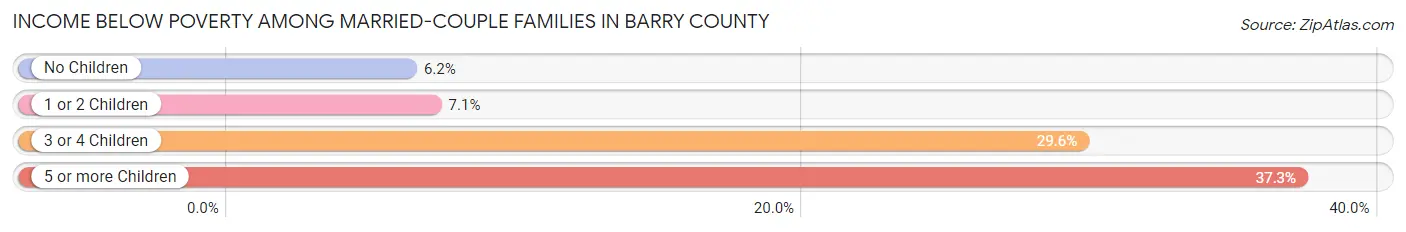
| Children | Above Poverty | Below Poverty |
| No Children | 4,620 (93.8%) | 307 (6.2%) |
| 1 or 2 Children | 1,756 (92.9%) | 134 (7.1%) |
| 3 or 4 Children | 520 (70.4%) | 219 (29.6%) |
| 5 or more Children | 32 (62.7%) | 19 (37.2%) |
| Total | 6,928 (91.1%) | 679 (8.9%) |
Income Below Poverty Among Single-Parent Households in Barry County
According to the poverty data in Barry County, 27.0% or 179 single-father households and 31.5% or 352 single-mother households are living below the poverty line. Among single-father households, those with 3 or 4 children have the highest poverty rate, with 118 households (83.7%) experiencing poverty. Likewise, among single-mother households, those with 5 or more children have the highest poverty rate, with 32 households (100.0%) falling below the poverty line.
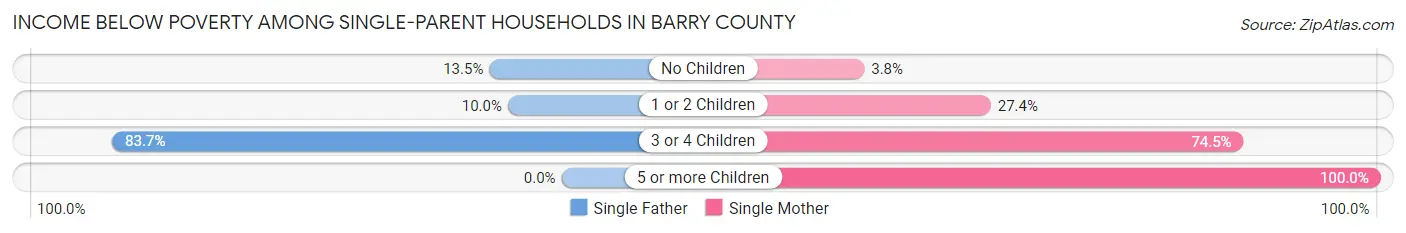
| Children | Single Father | Single Mother |
| No Children | 35 (13.5%) | 14 (3.8%) |
| 1 or 2 Children | 26 (10.0%) | 134 (27.4%) |
| 3 or 4 Children | 118 (83.7%) | 172 (74.5%) |
| 5 or more Children | 0 (0.0%) | 32 (100.0%) |
| Total | 179 (27.0%) | 352 (31.5%) |
Income Below Poverty Among Married-Couple vs Single-Parent Households in Barry County
The poverty data for Barry County shows that 679 of the married-couple family households (8.9%) and 531 of the single-parent households (29.8%) are living below the poverty level. Within the married-couple family households, those with 5 or more children have the highest poverty rate, with 19 households (37.2%) falling below the poverty line. Among the single-parent households, those with 5 or more children have the highest poverty rate, with 32 household (94.1%) living below poverty.
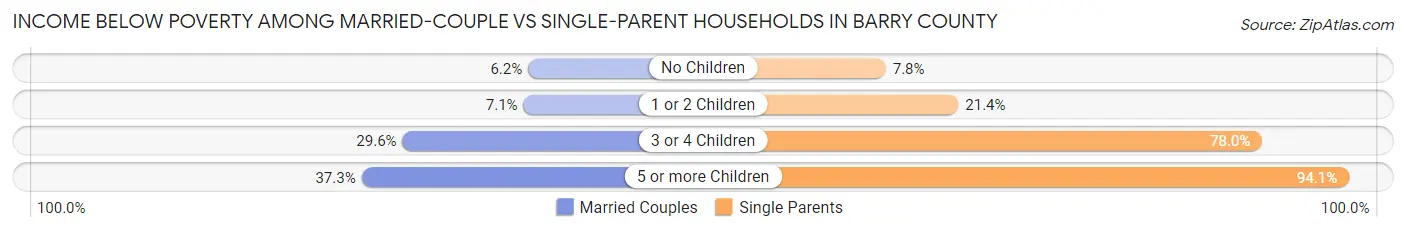
| Children | Married-Couple Families | Single-Parent Households |
| No Children | 307 (6.2%) | 49 (7.8%) |
| 1 or 2 Children | 134 (7.1%) | 160 (21.4%) |
| 3 or 4 Children | 219 (29.6%) | 290 (78.0%) |
| 5 or more Children | 19 (37.2%) | 32 (94.1%) |
| Total | 679 (8.9%) | 531 (29.8%) |
Race in Barry County
The most populous races in Barry County are White / Caucasian (29,044 | 83.7%), Two or more Races (3,654 | 10.5%), and Hispanic or Latino (3,419 | 9.9%).
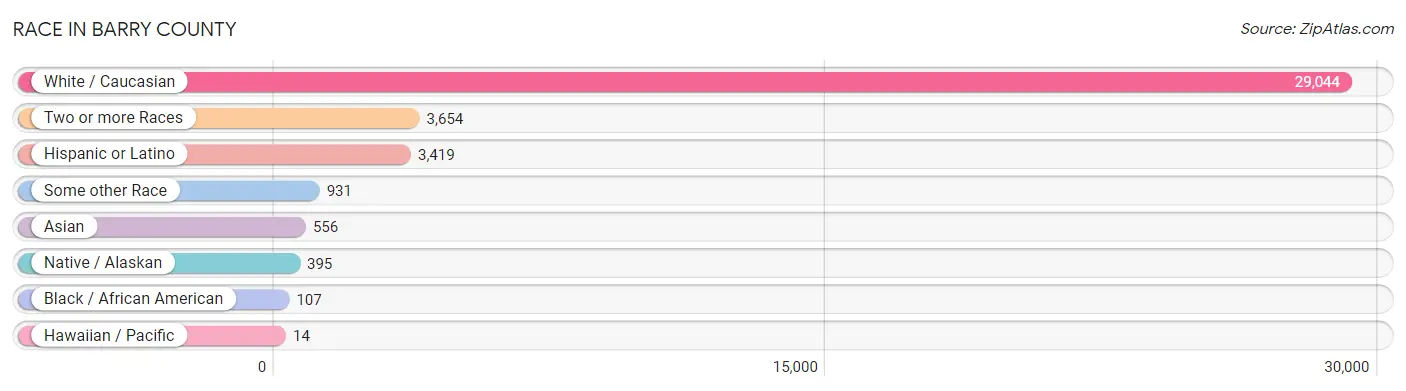
| Race | # Population | % Population |
| Asian | 556 | 1.6% |
| Black / African American | 107 | 0.3% |
| Hawaiian / Pacific | 14 | 0.0% |
| Hispanic or Latino | 3,419 | 9.9% |
| Native / Alaskan | 395 | 1.1% |
| White / Caucasian | 29,044 | 83.7% |
| Two or more Races | 3,654 | 10.5% |
| Some other Race | 931 | 2.7% |
| Total | 34,701 | 100.0% |
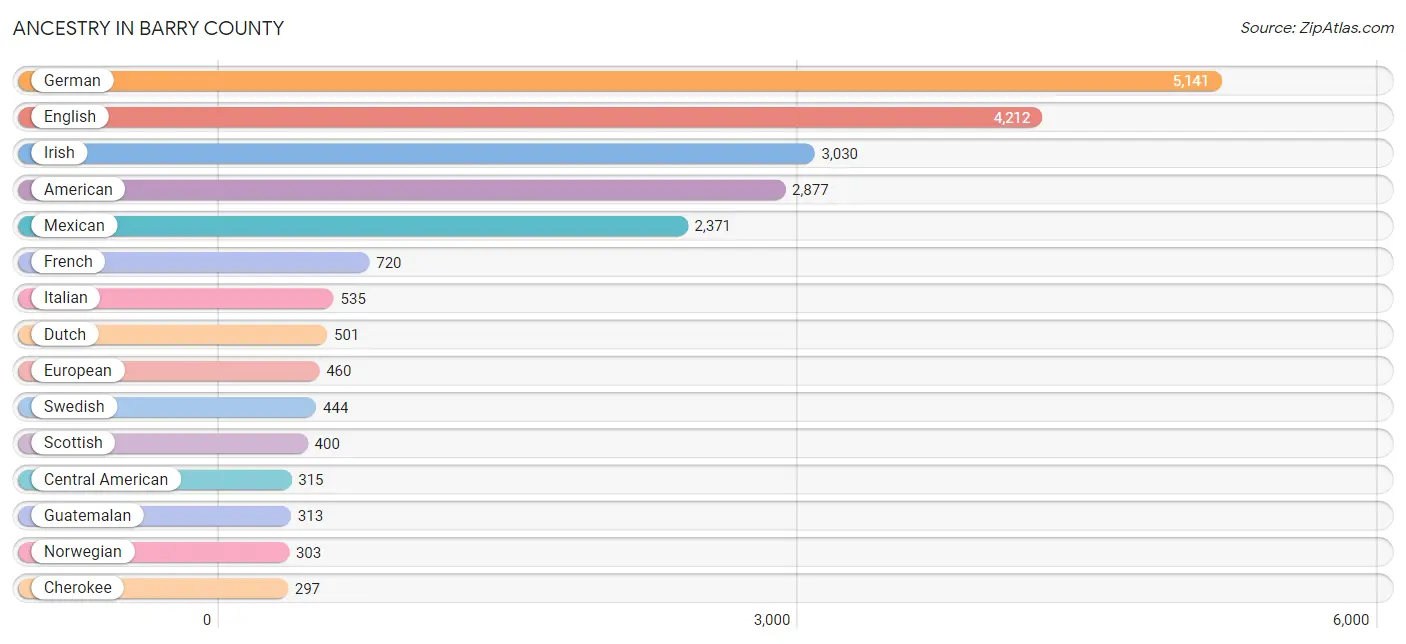
Ancestry in Barry County
The most populous ancestries reported in Barry County are German (5,141 | 14.8%), English (4,212 | 12.1%), Irish (3,030 | 8.7%), American (2,877 | 8.3%), and Mexican (2,371 | 6.8%), together accounting for 50.8% of all Barry County residents.
| Ancestry | # Population | % Population |
| American | 2,877 | 8.3% |
| Arab | 10 | 0.0% |
| Armenian | 40 | 0.1% |
| Austrian | 42 | 0.1% |
| Bangladeshi | 228 | 0.7% |
| Belgian | 11 | 0.0% |
| Bhutanese | 29 | 0.1% |
| Blackfeet | 11 | 0.0% |
| British | 129 | 0.4% |
| Bulgarian | 5 | 0.0% |
| Burmese | 182 | 0.5% |
| Central American | 315 | 0.9% |
| Central American Indian | 103 | 0.3% |
| Cherokee | 297 | 0.9% |
| Cheyenne | 2 | 0.0% |
| Chickasaw | 1 | 0.0% |
| Chippewa | 1 | 0.0% |
| Choctaw | 48 | 0.1% |
| Creek | 31 | 0.1% |
| Czech | 95 | 0.3% |
| Czechoslovakian | 4 | 0.0% |
| Danish | 134 | 0.4% |
| Delaware | 4 | 0.0% |
| Dutch | 501 | 1.4% |
| Dutch West Indian | 7 | 0.0% |
| Eastern European | 89 | 0.3% |
| English | 4,212 | 12.1% |
| European | 460 | 1.3% |
| Finnish | 3 | 0.0% |
| French | 720 | 2.1% |
| French American Indian | 1 | 0.0% |
| French Canadian | 41 | 0.1% |
| German | 5,141 | 14.8% |
| Greek | 22 | 0.1% |
| Guamanian / Chamorro | 28 | 0.1% |
| Guatemalan | 313 | 0.9% |
| Indian (Asian) | 3 | 0.0% |
| Indonesian | 156 | 0.4% |
| Irish | 3,030 | 8.7% |
| Italian | 535 | 1.5% |
| Jamaican | 7 | 0.0% |
| Korean | 52 | 0.2% |
| Lebanese | 6 | 0.0% |
| Mexican | 2,371 | 6.8% |
| Mexican American Indian | 121 | 0.4% |
| Native Hawaiian | 14 | 0.0% |
| Navajo | 4 | 0.0% |
| Northern European | 66 | 0.2% |
| Norwegian | 303 | 0.9% |
| Osage | 21 | 0.1% |
| Ottawa | 15 | 0.0% |
| Paiute | 7 | 0.0% |
| Pennsylvania German | 1 | 0.0% |
| Polish | 244 | 0.7% |
| Portuguese | 2 | 0.0% |
| Potawatomi | 5 | 0.0% |
| Puerto Rican | 207 | 0.6% |
| Romanian | 22 | 0.1% |
| Russian | 36 | 0.1% |
| Salvadoran | 2 | 0.0% |
| Samoan | 14 | 0.0% |
| Scandinavian | 71 | 0.2% |
| Scotch-Irish | 273 | 0.8% |
| Scottish | 400 | 1.1% |
| Serbian | 13 | 0.0% |
| Sioux | 5 | 0.0% |
| Slavic | 8 | 0.0% |
| Somali | 14 | 0.0% |
| South American | 201 | 0.6% |
| Spaniard | 13 | 0.0% |
| Spanish | 24 | 0.1% |
| Sri Lankan | 182 | 0.5% |
| Subsaharan African | 14 | 0.0% |
| Swedish | 444 | 1.3% |
| Swiss | 162 | 0.5% |
| Thai | 50 | 0.1% |
| Venezuelan | 201 | 0.6% |
| Welsh | 154 | 0.4% | View All 78 Rows |
Immigrants in Barry County
The most numerous immigrant groups reported in Barry County came from Latin America (1,013 | 2.9%), Central America (888 | 2.6%), Mexico (662 | 1.9%), Asia (372 | 1.1%), and South Eastern Asia (310 | 0.9%), together accounting for 9.3% of all Barry County residents.
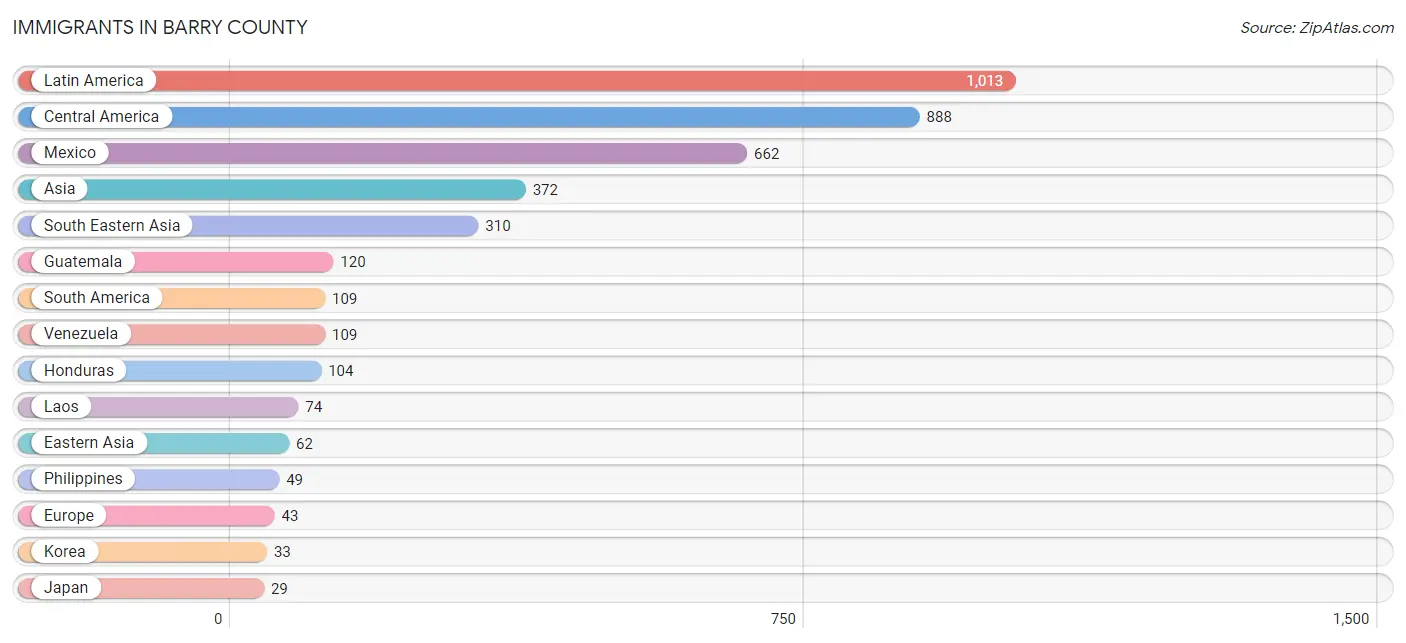
| Immigration Origin | # Population | % Population |
| Africa | 16 | 0.1% |
| Asia | 372 | 1.1% |
| Canada | 1 | 0.0% |
| Caribbean | 16 | 0.1% |
| Central America | 888 | 2.6% |
| Eastern Asia | 62 | 0.2% |
| Eastern Europe | 22 | 0.1% |
| El Salvador | 2 | 0.0% |
| England | 7 | 0.0% |
| Europe | 43 | 0.1% |
| Germany | 10 | 0.0% |
| Guatemala | 120 | 0.4% |
| Honduras | 104 | 0.3% |
| Italy | 2 | 0.0% |
| Jamaica | 7 | 0.0% |
| Japan | 29 | 0.1% |
| Korea | 33 | 0.1% |
| Laos | 74 | 0.2% |
| Latin America | 1,013 | 2.9% |
| Mexico | 662 | 1.9% |
| Morocco | 16 | 0.1% |
| Netherlands | 2 | 0.0% |
| Northern Africa | 16 | 0.1% |
| Northern Europe | 7 | 0.0% |
| Philippines | 49 | 0.1% |
| Serbia | 14 | 0.0% |
| South America | 109 | 0.3% |
| South Eastern Asia | 310 | 0.9% |
| Southern Europe | 2 | 0.0% |
| Thailand | 29 | 0.1% |
| Trinidad and Tobago | 9 | 0.0% |
| Venezuela | 109 | 0.3% |
| Western Europe | 12 | 0.0% | View All 33 Rows |
Sex and Age in Barry County
Sex and Age in Barry County
The most populous age groups in Barry County are 10 to 14 Years (1,290 | 7.3%) for men and 60 to 64 Years (1,289 | 7.5%) for women.
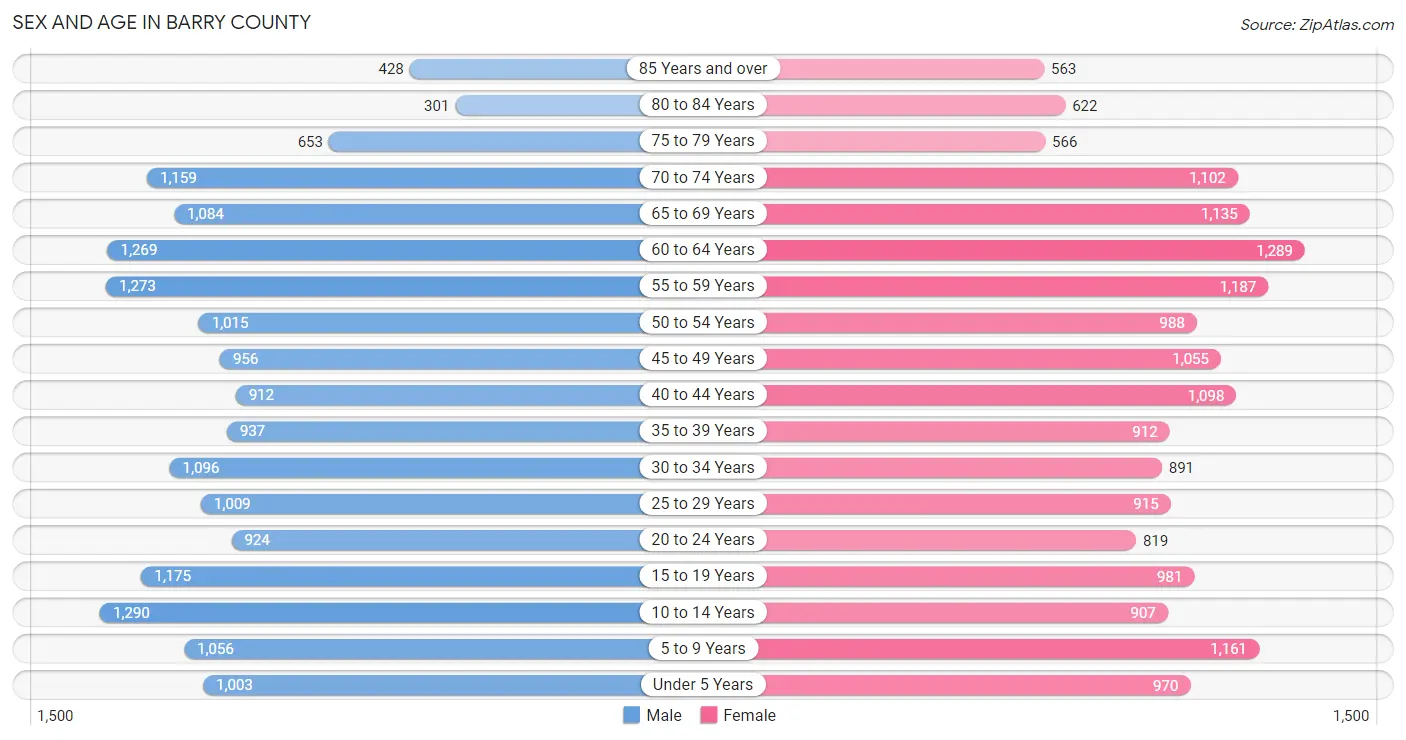
| Age Bracket | Male | Female |
| Under 5 Years | 1,003 (5.7%) | 970 (5.7%) |
| 5 to 9 Years | 1,056 (6.0%) | 1,161 (6.8%) |
| 10 to 14 Years | 1,290 (7.3%) | 907 (5.3%) |
| 15 to 19 Years | 1,175 (6.7%) | 981 (5.7%) |
| 20 to 24 Years | 924 (5.3%) | 819 (4.8%) |
| 25 to 29 Years | 1,009 (5.8%) | 915 (5.3%) |
| 30 to 34 Years | 1,096 (6.2%) | 891 (5.2%) |
| 35 to 39 Years | 937 (5.3%) | 912 (5.3%) |
| 40 to 44 Years | 912 (5.2%) | 1,098 (6.4%) |
| 45 to 49 Years | 956 (5.4%) | 1,055 (6.1%) |
| 50 to 54 Years | 1,015 (5.8%) | 988 (5.8%) |
| 55 to 59 Years | 1,273 (7.3%) | 1,187 (6.9%) |
| 60 to 64 Years | 1,269 (7.2%) | 1,289 (7.5%) |
| 65 to 69 Years | 1,084 (6.2%) | 1,135 (6.6%) |
| 70 to 74 Years | 1,159 (6.6%) | 1,102 (6.4%) |
| 75 to 79 Years | 653 (3.7%) | 566 (3.3%) |
| 80 to 84 Years | 301 (1.7%) | 622 (3.6%) |
| 85 Years and over | 428 (2.4%) | 563 (3.3%) |
| Total | 17,540 (100.0%) | 17,161 (100.0%) |
Families and Households in Barry County
Median Family Size in Barry County
The median family size in Barry County is 3.04 persons per family, with single female/mother families (1,117 | 11.9%) accounting for the largest median family size of 3.3 persons per family. On the other hand, married-couple families (7,607 | 81.0%) represent the smallest median family size with 3.00 persons per family.
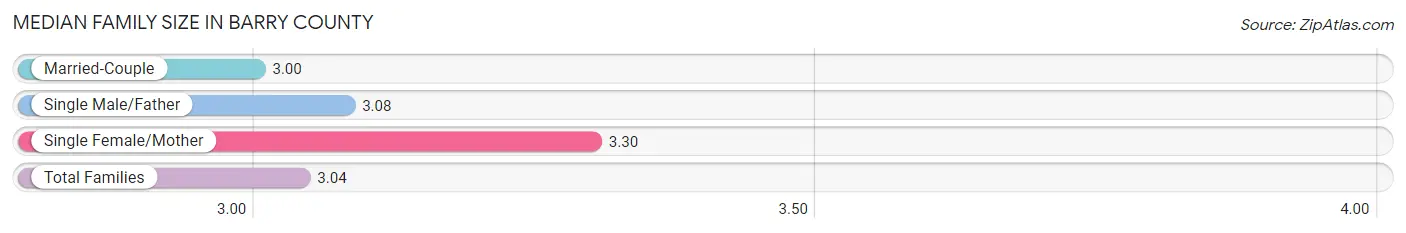
| Family Type | # Families | Family Size |
| Married-Couple | 7,607 (81.0%) | 3.00 |
| Single Male/Father | 663 (7.1%) | 3.08 |
| Single Female/Mother | 1,117 (11.9%) | 3.30 |
| Total Families | 9,387 (100.0%) | 3.04 |
Median Household Size in Barry County
The median household size in Barry County is 2.57 persons per household, with single female/mother households (1,117 | 8.3%) accounting for the largest median household size of 3.85 persons per household. non-family households (4,028 | 30.0%) represent the smallest median household size with 1.18 persons per household.
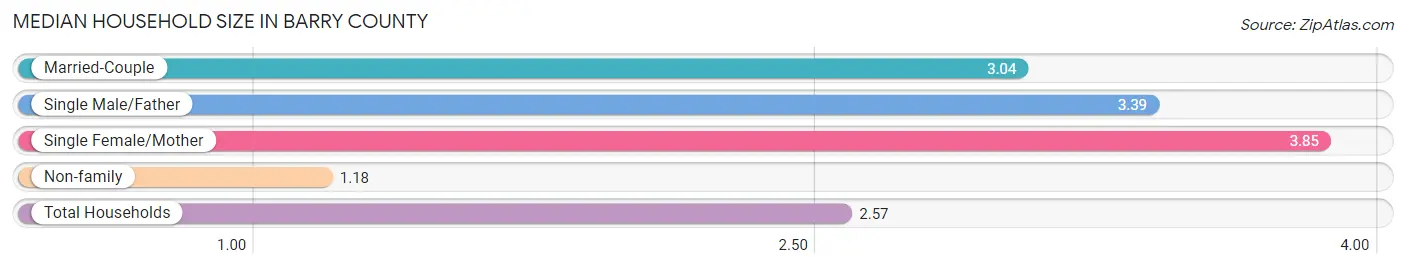
| Household Type | # Households | Household Size |
| Married-Couple | 7,607 (56.7%) | 3.04 |
| Single Male/Father | 663 (4.9%) | 3.39 |
| Single Female/Mother | 1,117 (8.3%) | 3.85 |
| Non-family | 4,028 (30.0%) | 1.18 |
| Total Households | 13,415 (100.0%) | 2.57 |
Household Size by Marriage Status in Barry County
Out of a total of 13,415 households in Barry County, 9,387 (70.0%) are family households, while 4,028 (30.0%) are nonfamily households. The most numerous type of family households are 2-person households, comprising 4,795, and the most common type of nonfamily households are 1-person households, comprising 3,484.
| Household Size | Family Households | Nonfamily Households |
| 1-Person Households | - | 3,484 (26.0%) |
| 2-Person Households | 4,795 (35.7%) | 495 (3.7%) |
| 3-Person Households | 1,492 (11.1%) | 5 (0.0%) |
| 4-Person Households | 1,527 (11.4%) | 44 (0.3%) |
| 5-Person Households | 921 (6.9%) | 0 (0.0%) |
| 6-Person Households | 368 (2.7%) | 0 (0.0%) |
| 7+ Person Households | 284 (2.1%) | 0 (0.0%) |
| Total | 9,387 (70.0%) | 4,028 (30.0%) |
Female Fertility in Barry County
Fertility by Age in Barry County
Average fertility rate in Barry County is 40.0 births per 1,000 women. Women in the age bracket of 20 to 34 years have the highest fertility rate with 90.0 births per 1,000 women. Women in the age bracket of 20 to 34 years acount for 87.8% of all women with births.
| Age Bracket | Women with Births | Births / 1,000 Women |
| 15 to 19 years | 5 (1.8%) | 5.0 |
| 20 to 34 years | 237 (87.8%) | 90.0 |
| 35 to 50 years | 28 (10.4%) | 9.0 |
| Total | 270 (100.0%) | 40.0 |
Fertility by Age by Marriage Status in Barry County
67.8% of women with births (270) in Barry County are married. The highest percentage of unmarried women with births falls into 15 to 19 years age bracket with 100.0% of them unmarried at the time of birth, while the lowest percentage of unmarried women with births belong to 35 to 50 years age bracket with 17.9% of them unmarried.
| Age Bracket | Married | Unmarried |
| 15 to 19 years | 0 (0.0%) | 5 (100.0%) |
| 20 to 34 years | 160 (67.5%) | 77 (32.5%) |
| 35 to 50 years | 23 (82.1%) | 5 (17.9%) |
| Total | 183 (67.8%) | 87 (32.2%) |
Fertility by Education in Barry County
Average fertility rate in Barry County is 40.0 births per 1,000 women. Women with the education attainment of less than high school have the highest fertility rate of 62.0 births per 1,000 women, while women with the education attainment of bachelor's degree have the lowest fertility at 9.0 births per 1,000 women. Women with the education attainment of high school diploma represent 37.4% of all women with births.
| Educational Attainment | Women with Births | Births / 1,000 Women |
| Less than High School | 79 (29.3%) | 62.0 |
| High School Diploma | 101 (37.4%) | 42.0 |
| College or Associate's Degree | 75 (27.8%) | 35.0 |
| Bachelor's Degree | 5 (1.8%) | 9.0 |
| Graduate Degree | 10 (3.7%) | 26.0 |
| Total | 270 (100.0%) | 40.0 |
Fertility by Education by Marriage Status in Barry County
32.2% of women with births in Barry County are unmarried. Women with the educational attainment of graduate degree are most likely to be married with 100.0% of them married at childbirth, while women with the educational attainment of bachelor's degree are least likely to be married with 100.0% of them unmarried at childbirth.
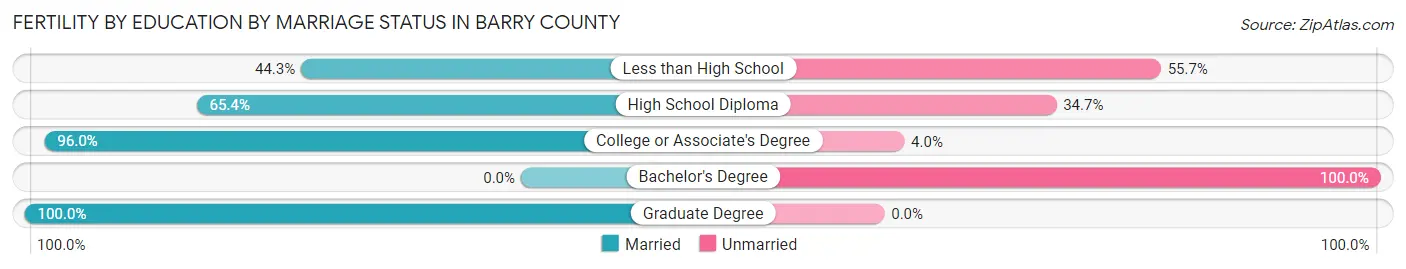
| Educational Attainment | Married | Unmarried |
| Less than High School | 35 (44.3%) | 44 (55.7%) |
| High School Diploma | 66 (65.3%) | 35 (34.6%) |
| College or Associate's Degree | 72 (96.0%) | 3 (4.0%) |
| Bachelor's Degree | 0 (0.0%) | 5 (100.0%) |
| Graduate Degree | 10 (100.0%) | 0 (0.0%) |
| Total | 183 (67.8%) | 87 (32.2%) |
Employment Characteristics in Barry County
Employment by Class of Employer in Barry County
Among the 14,783 employed individuals in Barry County, private company employees (10,650 | 72.0%), self-employed (not incorporated) (1,456 | 9.9%), and local government employees (1,034 | 7.0%) make up the most common classes of employment.
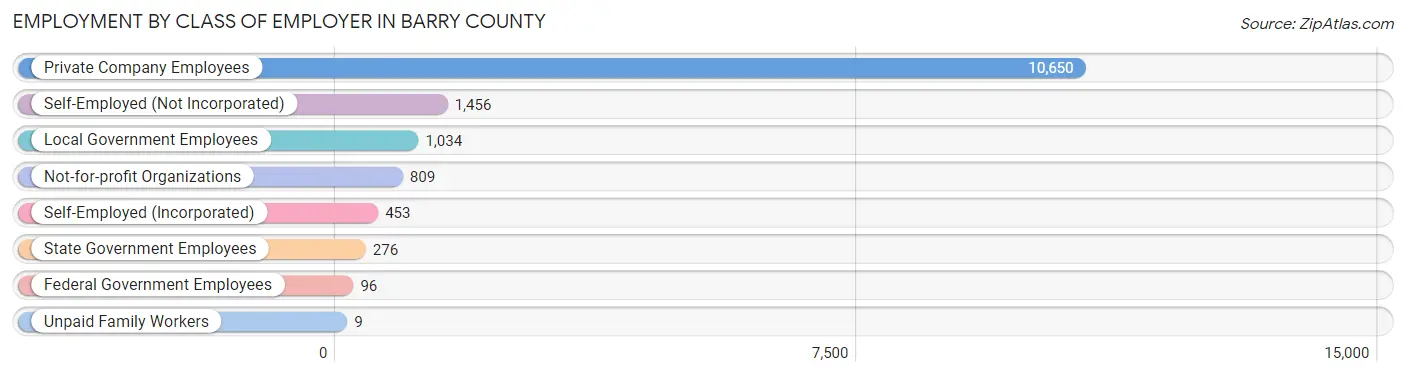
| Employer Class | # Employees | % Employees |
| Private Company Employees | 10,650 | 72.0% |
| Self-Employed (Incorporated) | 453 | 3.1% |
| Self-Employed (Not Incorporated) | 1,456 | 9.9% |
| Not-for-profit Organizations | 809 | 5.5% |
| Local Government Employees | 1,034 | 7.0% |
| State Government Employees | 276 | 1.9% |
| Federal Government Employees | 96 | 0.6% |
| Unpaid Family Workers | 9 | 0.1% |
| Total | 14,783 | 100.0% |
Employment Status by Age in Barry County
According to the labor force statistics for Barry County, out of the total population over 16 years of age (27,746), 55.9% or 15,510 individuals are in the labor force, with 3.6% or 558 of them unemployed. The age group with the highest labor force participation rate is 30 to 34 years, with 83.5% or 1,659 individuals in the labor force. Within the labor force, the 16 to 19 years age range has the highest percentage of unemployed individuals, with 15.9% or 107 of them being unemployed.
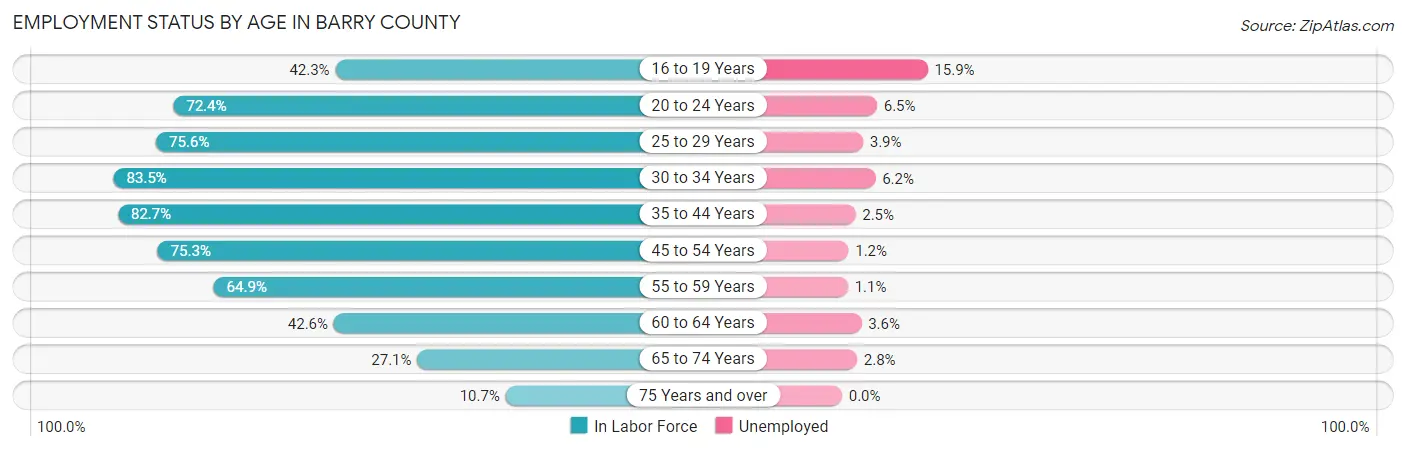
| Age Bracket | In Labor Force | Unemployed |
| 16 to 19 Years | 672 (42.3%) | 107 (15.9%) |
| 20 to 24 Years | 1,262 (72.4%) | 82 (6.5%) |
| 25 to 29 Years | 1,455 (75.6%) | 57 (3.9%) |
| 30 to 34 Years | 1,659 (83.5%) | 103 (6.2%) |
| 35 to 44 Years | 3,191 (82.7%) | 80 (2.5%) |
| 45 to 54 Years | 3,023 (75.3%) | 36 (1.2%) |
| 55 to 59 Years | 1,597 (64.9%) | 18 (1.1%) |
| 60 to 64 Years | 1,090 (42.6%) | 39 (3.6%) |
| 65 to 74 Years | 1,214 (27.1%) | 34 (2.8%) |
| 75 Years and over | 335 (10.7%) | 0 (0.0%) |
| Total | 15,510 (55.9%) | 558 (3.6%) |
Employment Status by Educational Attainment in Barry County
According to labor force statistics for Barry County, 71.5% of individuals (12,013) out of the total population between 25 and 64 years of age (16,802) are in the labor force, with 2.8% or 336 of them being unemployed. The group with the highest labor force participation rate are those with the educational attainment of high school diploma, with 75.3% or 4,919 individuals in the labor force. Within the labor force, individuals with less than high school education have the highest percentage of unemployment, with 5.2% or 90 of them being unemployed.
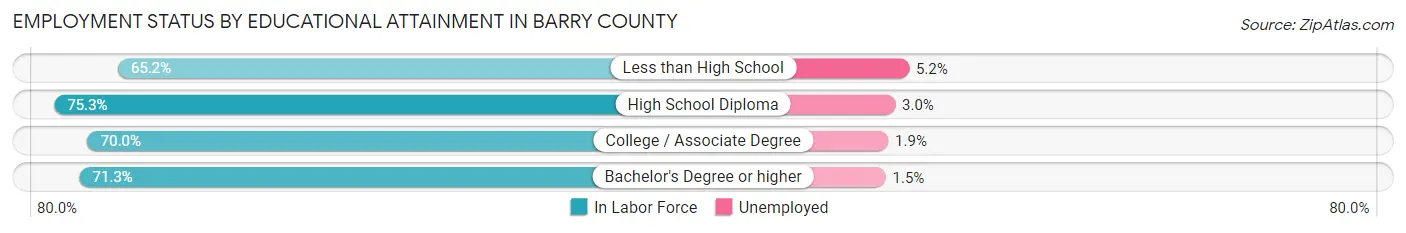
| Educational Attainment | In Labor Force | Unemployed |
| Less than High School | 1,734 (65.2%) | 138 (5.2%) |
| High School Diploma | 4,919 (75.3%) | 196 (3.0%) |
| College / Associate Degree | 3,446 (70.0%) | 94 (1.9%) |
| Bachelor's Degree or higher | 1,917 (71.3%) | 40 (1.5%) |
| Total | 12,013 (71.5%) | 470 (2.8%) |
Employment Occupations by Sex in Barry County
Management, Business, Science and Arts Occupations
The most common Management, Business, Science and Arts occupations in Barry County are Management (1,486 | 10.0%), Community & Social Service (892 | 6.0%), Health Diagnosing & Treating (618 | 4.1%), Computers, Engineering & Science (536 | 3.6%), and Education Instruction & Library (479 | 3.2%).
Management, Business, Science and Arts Occupations by Sex
Within the Management, Business, Science and Arts occupations in Barry County, the most male-oriented occupations are Architecture & Engineering (94.0%), Computers & Mathematics (82.2%), and Computers, Engineering & Science (79.7%), while the most female-oriented occupations are Legal Services & Support (91.8%), Health Diagnosing & Treating (87.5%), and Health Technologists (86.1%).
| Occupation | Male | Female |
| Management | 1,014 (68.2%) | 472 (31.8%) |
| Business & Financial | 75 (18.8%) | 323 (81.2%) |
| Computers, Engineering & Science | 427 (79.7%) | 109 (20.3%) |
| Computers & Mathematics | 222 (82.2%) | 48 (17.8%) |
| Architecture & Engineering | 171 (94.0%) | 11 (6.0%) |
| Life, Physical & Social Science | 34 (40.5%) | 50 (59.5%) |
| Community & Social Service | 223 (25.0%) | 669 (75.0%) |
| Education, Arts & Media | 90 (56.6%) | 69 (43.4%) |
| Legal Services & Support | 9 (8.2%) | 101 (91.8%) |
| Education Instruction & Library | 82 (17.1%) | 397 (82.9%) |
| Arts, Media & Entertainment | 42 (29.2%) | 102 (70.8%) |
| Health Diagnosing & Treating | 77 (12.5%) | 541 (87.5%) |
| Health Technologists | 51 (13.9%) | 317 (86.1%) |
| Total (Category) | 1,816 (46.2%) | 2,114 (53.8%) |
| Total (Overall) | 8,458 (56.7%) | 6,472 (43.3%) |
Services Occupations
The most common Services occupations in Barry County are Food Preparation & Serving (863 | 5.8%), Cleaning & Maintenance (642 | 4.3%), Personal Care & Service (348 | 2.3%), Healthcare Support (341 | 2.3%), and Security & Protection (228 | 1.5%).
Services Occupations by Sex
Within the Services occupations in Barry County, the most male-oriented occupations are Law Enforcement (72.1%), Cleaning & Maintenance (59.2%), and Security & Protection (58.3%), while the most female-oriented occupations are Healthcare Support (94.1%), Personal Care & Service (71.3%), and Food Preparation & Serving (61.3%).
| Occupation | Male | Female |
| Healthcare Support | 20 (5.9%) | 321 (94.1%) |
| Security & Protection | 133 (58.3%) | 95 (41.7%) |
| Firefighting & Prevention | 84 (52.5%) | 76 (47.5%) |
| Law Enforcement | 49 (72.1%) | 19 (27.9%) |
| Food Preparation & Serving | 334 (38.7%) | 529 (61.3%) |
| Cleaning & Maintenance | 380 (59.2%) | 262 (40.8%) |
| Personal Care & Service | 100 (28.7%) | 248 (71.3%) |
| Total (Category) | 967 (39.9%) | 1,455 (60.1%) |
| Total (Overall) | 8,458 (56.7%) | 6,472 (43.3%) |
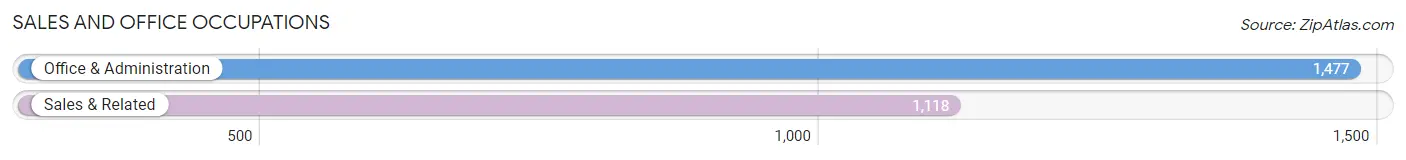
Sales and Office Occupations
The most common Sales and Office occupations in Barry County are Office & Administration (1,477 | 9.9%), and Sales & Related (1,118 | 7.5%).
Sales and Office Occupations by Sex
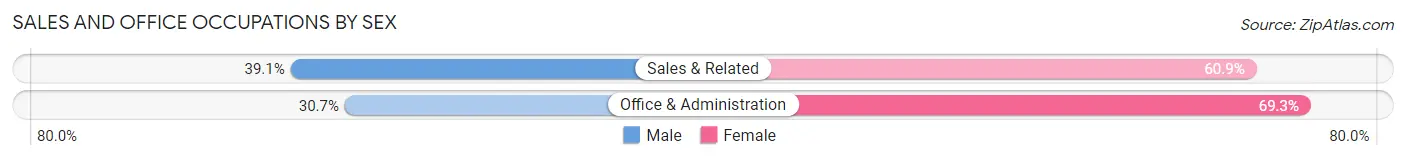
| Occupation | Male | Female |
| Sales & Related | 437 (39.1%) | 681 (60.9%) |
| Office & Administration | 454 (30.7%) | 1,023 (69.3%) |
| Total (Category) | 891 (34.3%) | 1,704 (65.7%) |
| Total (Overall) | 8,458 (56.7%) | 6,472 (43.3%) |
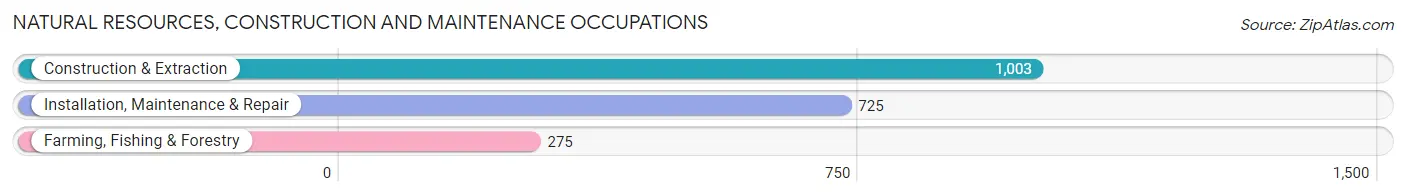
Natural Resources, Construction and Maintenance Occupations
The most common Natural Resources, Construction and Maintenance occupations in Barry County are Construction & Extraction (1,003 | 6.7%), Installation, Maintenance & Repair (725 | 4.9%), and Farming, Fishing & Forestry (275 | 1.8%).
Natural Resources, Construction and Maintenance Occupations by Sex
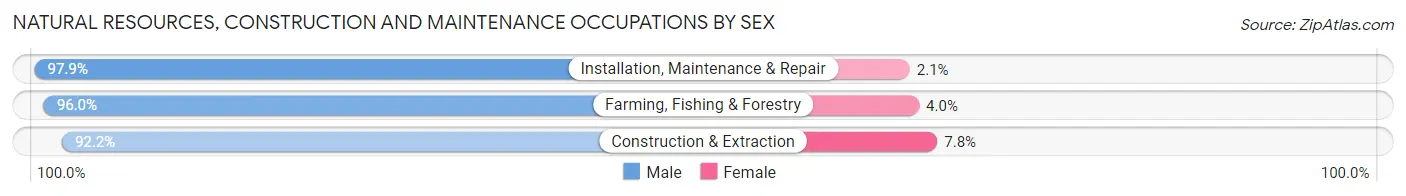
| Occupation | Male | Female |
| Farming, Fishing & Forestry | 264 (96.0%) | 11 (4.0%) |
| Construction & Extraction | 925 (92.2%) | 78 (7.8%) |
| Installation, Maintenance & Repair | 710 (97.9%) | 15 (2.1%) |
| Total (Category) | 1,899 (94.8%) | 104 (5.2%) |
| Total (Overall) | 8,458 (56.7%) | 6,472 (43.3%) |
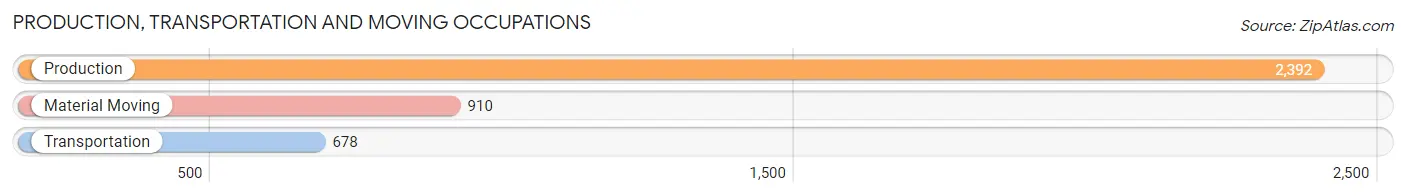
Production, Transportation and Moving Occupations
The most common Production, Transportation and Moving occupations in Barry County are Production (2,392 | 16.0%), Material Moving (910 | 6.1%), and Transportation (678 | 4.5%).
Production, Transportation and Moving Occupations by Sex
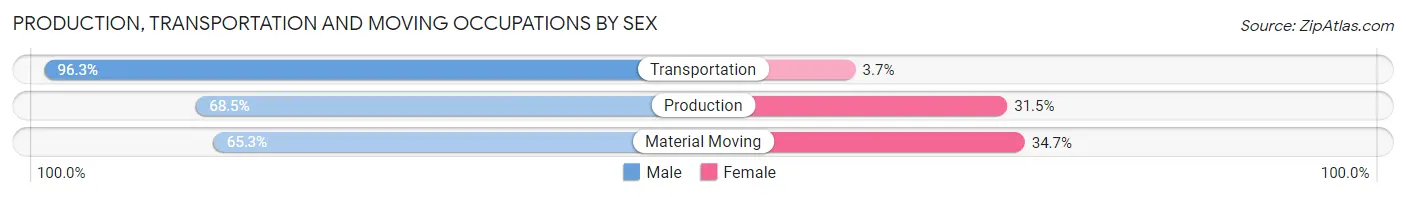
| Occupation | Male | Female |
| Production | 1,638 (68.5%) | 754 (31.5%) |
| Transportation | 653 (96.3%) | 25 (3.7%) |
| Material Moving | 594 (65.3%) | 316 (34.7%) |
| Total (Category) | 2,885 (72.5%) | 1,095 (27.5%) |
| Total (Overall) | 8,458 (56.7%) | 6,472 (43.3%) |
Employment Industries by Sex in Barry County
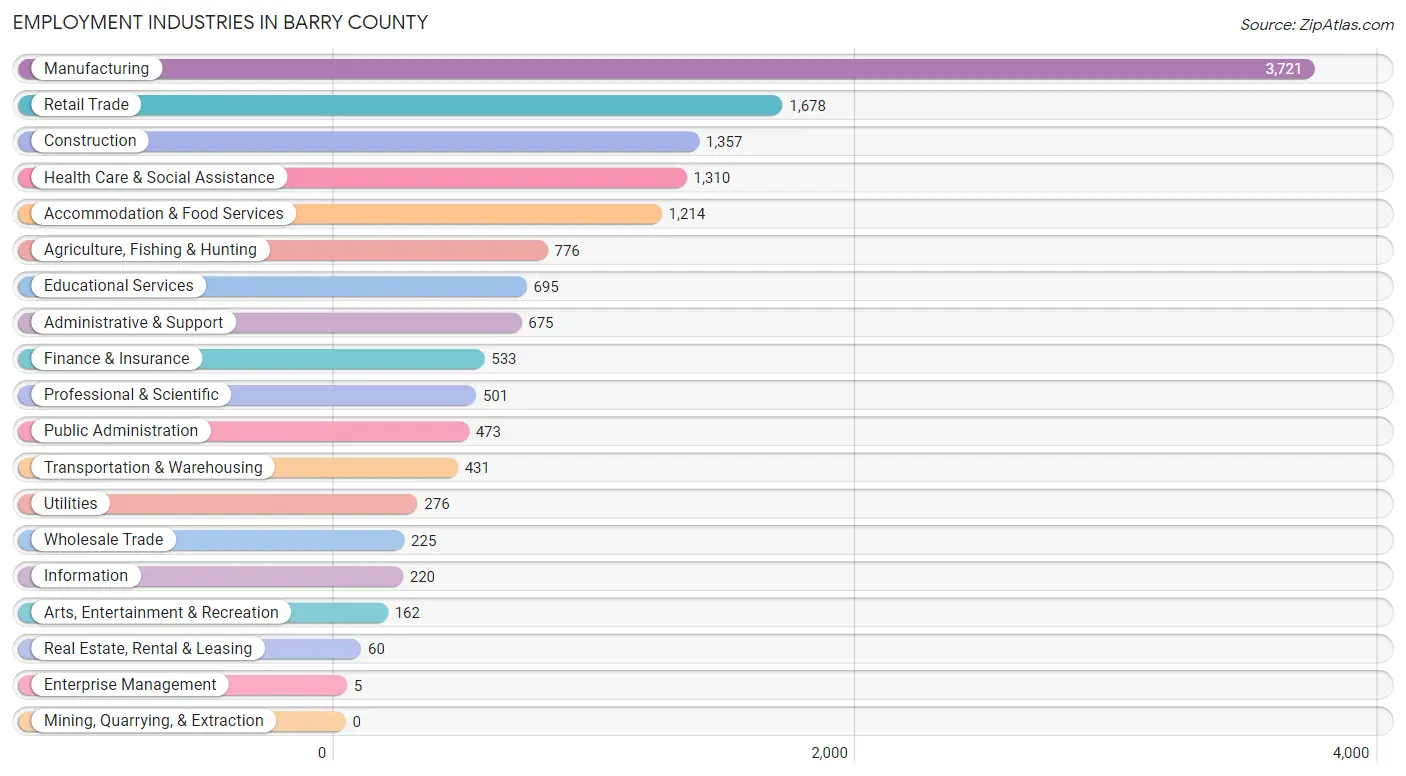
Employment Industries in Barry County
The major employment industries in Barry County include Manufacturing (3,721 | 24.9%), Retail Trade (1,678 | 11.2%), Construction (1,357 | 9.1%), Health Care & Social Assistance (1,310 | 8.8%), and Accommodation & Food Services (1,214 | 8.1%).
Employment Industries by Sex in Barry County
The Barry County industries that see more men than women are Construction (92.6%), Transportation & Warehousing (90.0%), and Agriculture, Fishing & Hunting (87.1%), whereas the industries that tend to have a higher number of women are Enterprise Management (100.0%), Health Care & Social Assistance (88.7%), and Real Estate, Rental & Leasing (83.3%).
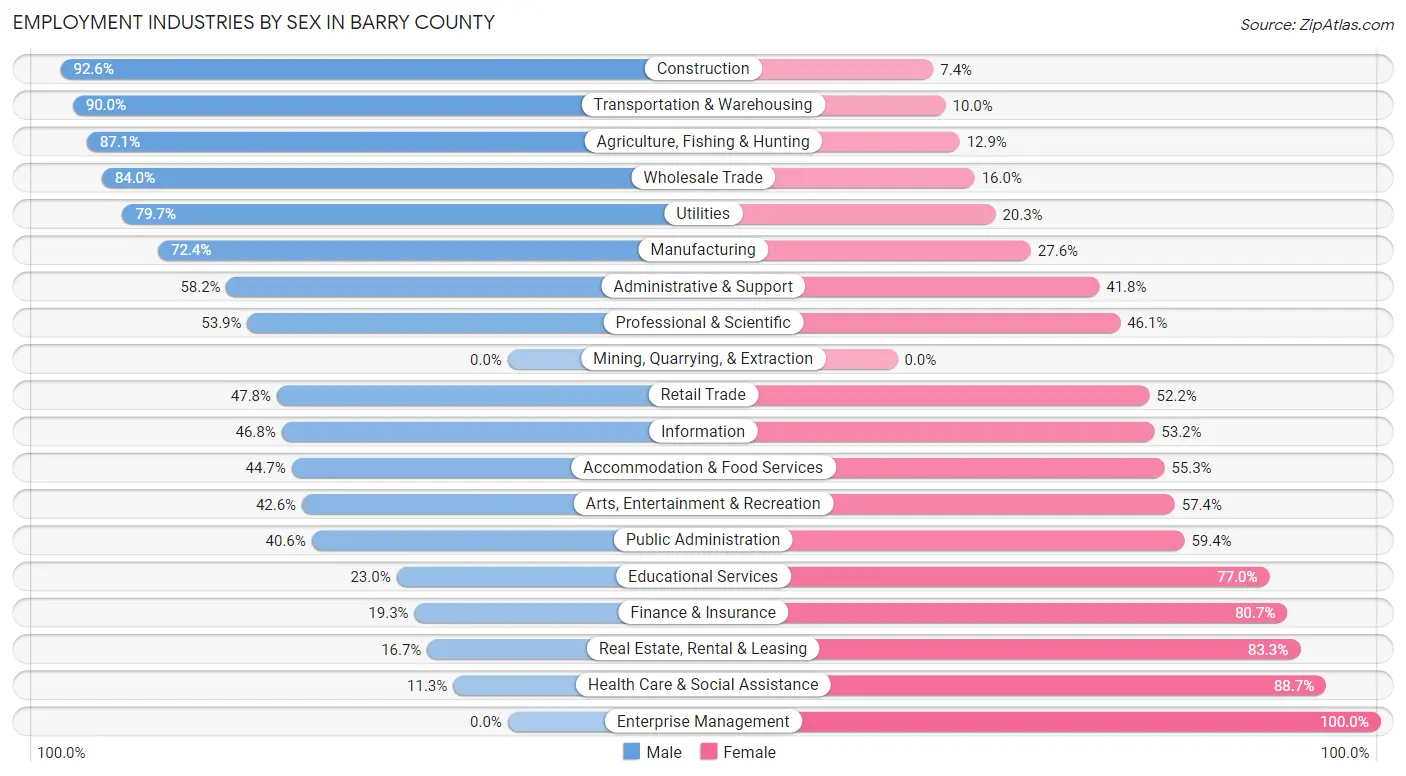
| Industry | Male | Female |
| Agriculture, Fishing & Hunting | 676 (87.1%) | 100 (12.9%) |
| Mining, Quarrying, & Extraction | 0 (0.0%) | 0 (0.0%) |
| Construction | 1,256 (92.6%) | 101 (7.4%) |
| Manufacturing | 2,693 (72.4%) | 1,028 (27.6%) |
| Wholesale Trade | 189 (84.0%) | 36 (16.0%) |
| Retail Trade | 802 (47.8%) | 876 (52.2%) |
| Transportation & Warehousing | 388 (90.0%) | 43 (10.0%) |
| Utilities | 220 (79.7%) | 56 (20.3%) |
| Information | 103 (46.8%) | 117 (53.2%) |
| Finance & Insurance | 103 (19.3%) | 430 (80.7%) |
| Real Estate, Rental & Leasing | 10 (16.7%) | 50 (83.3%) |
| Professional & Scientific | 270 (53.9%) | 231 (46.1%) |
| Enterprise Management | 0 (0.0%) | 5 (100.0%) |
| Administrative & Support | 393 (58.2%) | 282 (41.8%) |
| Educational Services | 160 (23.0%) | 535 (77.0%) |
| Health Care & Social Assistance | 148 (11.3%) | 1,162 (88.7%) |
| Arts, Entertainment & Recreation | 69 (42.6%) | 93 (57.4%) |
| Accommodation & Food Services | 543 (44.7%) | 671 (55.3%) |
| Public Administration | 192 (40.6%) | 281 (59.4%) |
| Total | 8,458 (56.7%) | 6,472 (43.3%) |
Education in Barry County
School Enrollment in Barry County
The most common levels of schooling among the 7,318 students in Barry County are high school (1,731 | 23.6%), middle school (1,699 | 23.2%), and elementary school (1,653 | 22.6%).
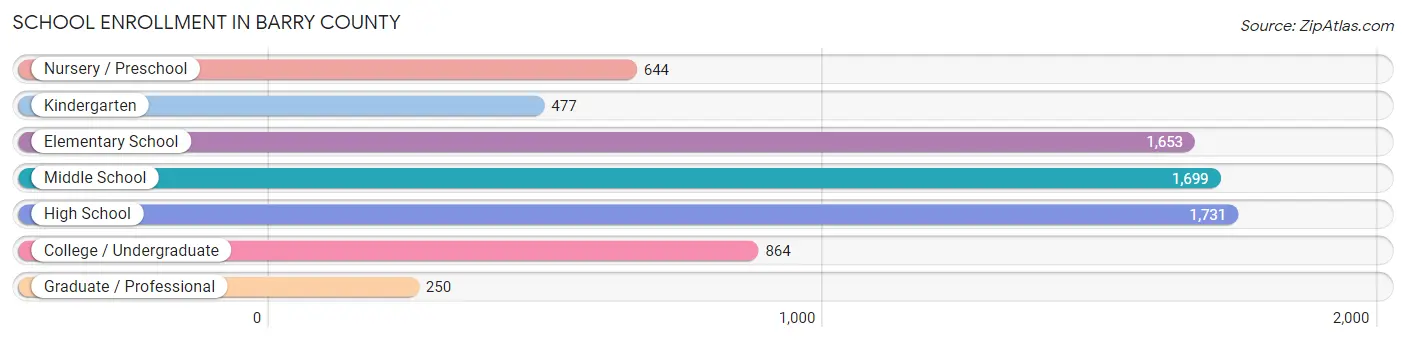
| School Level | # Students | % Students |
| Nursery / Preschool | 644 | 8.8% |
| Kindergarten | 477 | 6.5% |
| Elementary School | 1,653 | 22.6% |
| Middle School | 1,699 | 23.2% |
| High School | 1,731 | 23.6% |
| College / Undergraduate | 864 | 11.8% |
| Graduate / Professional | 250 | 3.4% |
| Total | 7,318 | 100.0% |
School Enrollment by Age by Funding Source in Barry County
Out of a total of 7,318 students who are enrolled in schools in Barry County, 842 (11.5%) attend a private institution, while the remaining 6,476 (88.5%) are enrolled in public schools. The age group of 35 years and over has the highest likelihood of being enrolled in private schools, with 105 (37.1% in the age bracket) enrolled. Conversely, the age group of 15 to 17 year olds has the lowest likelihood of being enrolled in a private school, with 1,313 (99.0% in the age bracket) attending a public institution.
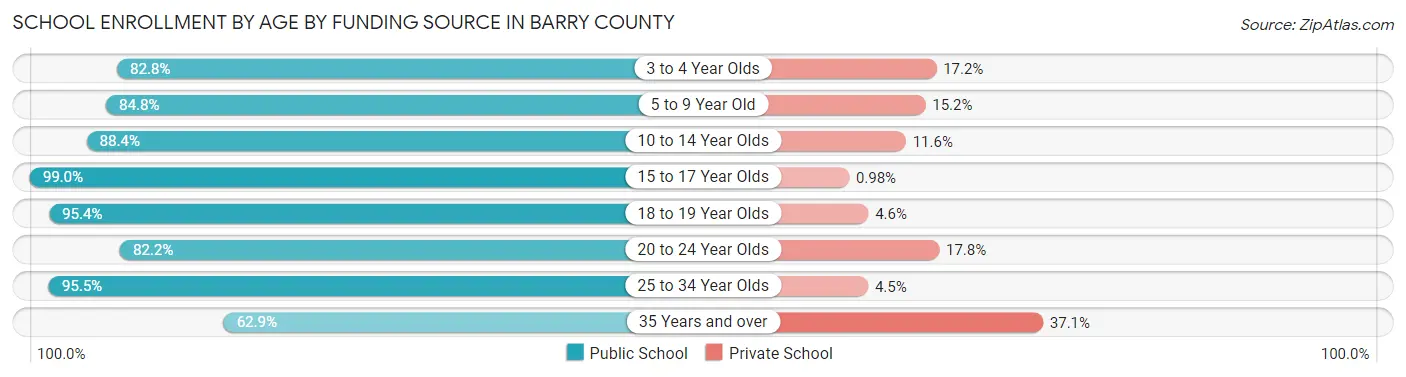
| Age Bracket | Public School | Private School |
| 3 to 4 Year Olds | 413 (82.8%) | 86 (17.2%) |
| 5 to 9 Year Old | 1,730 (84.8%) | 310 (15.2%) |
| 10 to 14 Year Olds | 1,852 (88.4%) | 242 (11.6%) |
| 15 to 17 Year Olds | 1,313 (99.0%) | 13 (1.0%) |
| 18 to 19 Year Olds | 500 (95.4%) | 24 (4.6%) |
| 20 to 24 Year Olds | 236 (82.2%) | 51 (17.8%) |
| 25 to 34 Year Olds | 253 (95.5%) | 12 (4.5%) |
| 35 Years and over | 178 (62.9%) | 105 (37.1%) |
| Total | 6,476 (88.5%) | 842 (11.5%) |
Educational Attainment by Field of Study in Barry County
Business (1,007 | 26.6%), education (590 | 15.6%), science & technology (367 | 9.7%), engineering (324 | 8.6%), and bio, nature & agricultural (316 | 8.4%) are the most common fields of study among 3,780 individuals in Barry County who have obtained a bachelor's degree or higher.
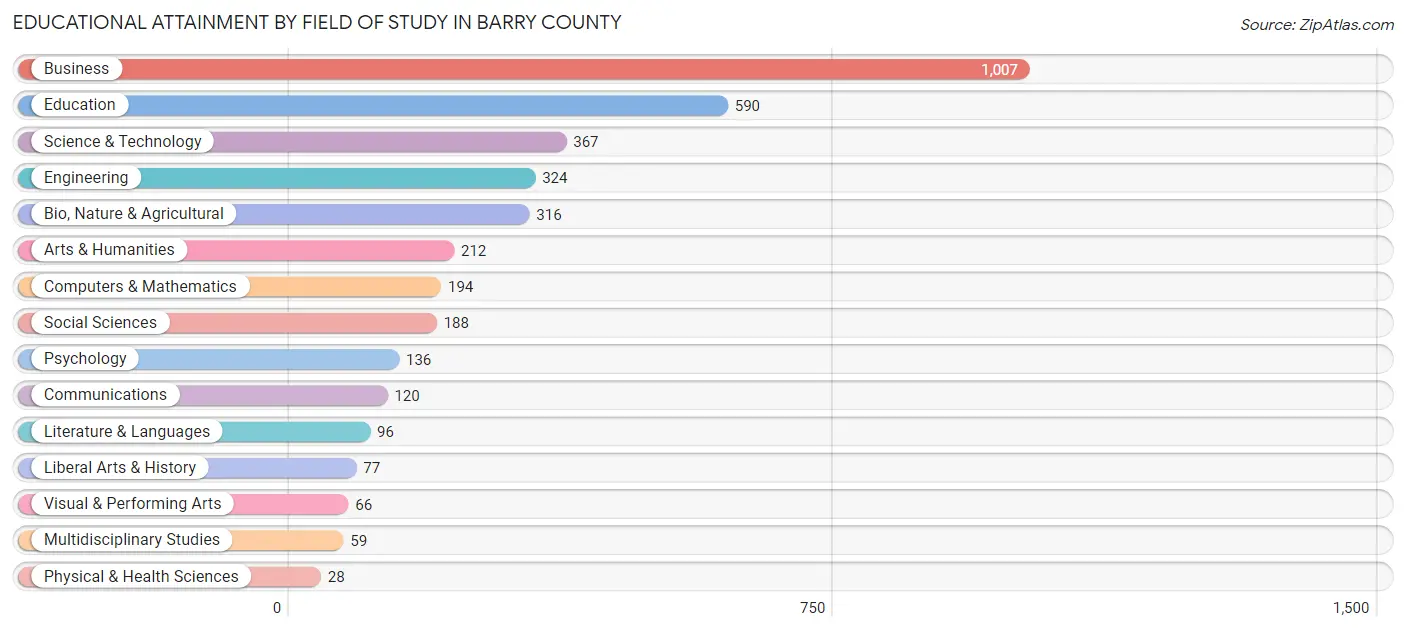
| Field of Study | # Graduates | % Graduates |
| Computers & Mathematics | 194 | 5.1% |
| Bio, Nature & Agricultural | 316 | 8.4% |
| Physical & Health Sciences | 28 | 0.7% |
| Psychology | 136 | 3.6% |
| Social Sciences | 188 | 5.0% |
| Engineering | 324 | 8.6% |
| Multidisciplinary Studies | 59 | 1.6% |
| Science & Technology | 367 | 9.7% |
| Business | 1,007 | 26.6% |
| Education | 590 | 15.6% |
| Literature & Languages | 96 | 2.5% |
| Liberal Arts & History | 77 | 2.0% |
| Visual & Performing Arts | 66 | 1.8% |
| Communications | 120 | 3.2% |
| Arts & Humanities | 212 | 5.6% |
| Total | 3,780 | 100.0% |
Transportation & Commute in Barry County
Vehicle Availability by Sex in Barry County
The most prevalent vehicle ownership categories in Barry County are males with 2 vehicles (2,819, accounting for 33.5%) and females with 2 vehicles (2,407, making up 44.2%).
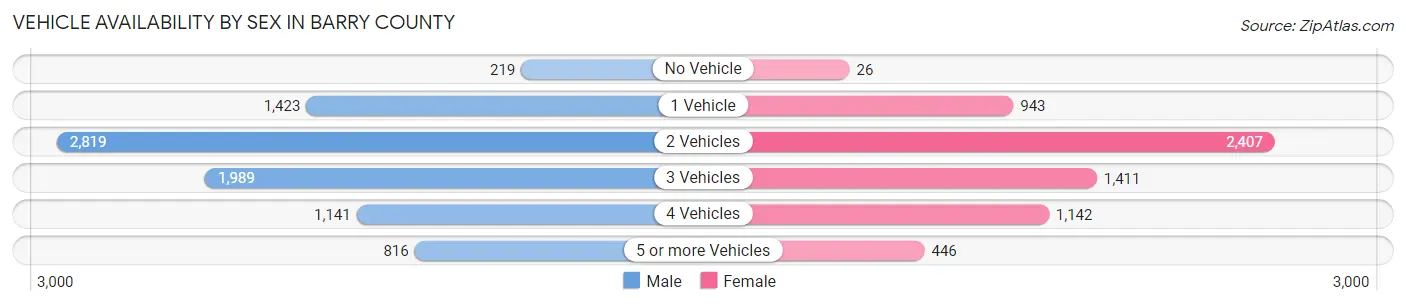
| Vehicles Available | Male | Female |
| No Vehicle | 219 (2.6%) | 26 (0.4%) |
| 1 Vehicle | 1,423 (16.9%) | 943 (14.8%) |
| 2 Vehicles | 2,819 (33.5%) | 2,407 (37.8%) |
| 3 Vehicles | 1,989 (23.7%) | 1,411 (22.1%) |
| 4 Vehicles | 1,141 (13.6%) | 1,142 (17.9%) |
| 5 or more Vehicles | 816 (9.7%) | 446 (7.0%) |
| Total | 8,407 (100.0%) | 6,375 (100.0%) |
Commute Time in Barry County
The most frequently occuring commute durations in Barry County are 5 to 9 minutes (2,693 commuters, 19.7%), 10 to 14 minutes (2,023 commuters, 14.8%), and 20 to 24 minutes (1,652 commuters, 12.1%).
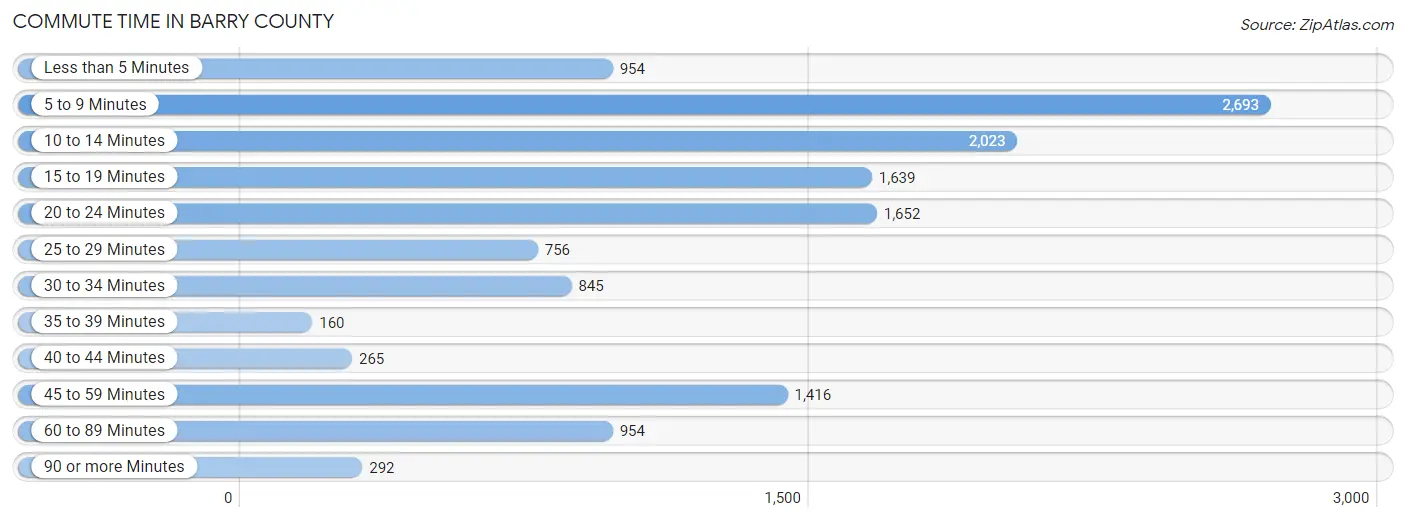
| Commute Time | # Commuters | % Commuters |
| Less than 5 Minutes | 954 | 7.0% |
| 5 to 9 Minutes | 2,693 | 19.7% |
| 10 to 14 Minutes | 2,023 | 14.8% |
| 15 to 19 Minutes | 1,639 | 12.0% |
| 20 to 24 Minutes | 1,652 | 12.1% |
| 25 to 29 Minutes | 756 | 5.5% |
| 30 to 34 Minutes | 845 | 6.2% |
| 35 to 39 Minutes | 160 | 1.2% |
| 40 to 44 Minutes | 265 | 1.9% |
| 45 to 59 Minutes | 1,416 | 10.4% |
| 60 to 89 Minutes | 954 | 7.0% |
| 90 or more Minutes | 292 | 2.1% |
Commute Time by Sex in Barry County
The most common commute times in Barry County are 5 to 9 minutes (1,363 commuters, 17.6%) for males and 5 to 9 minutes (1,330 commuters, 22.5%) for females.
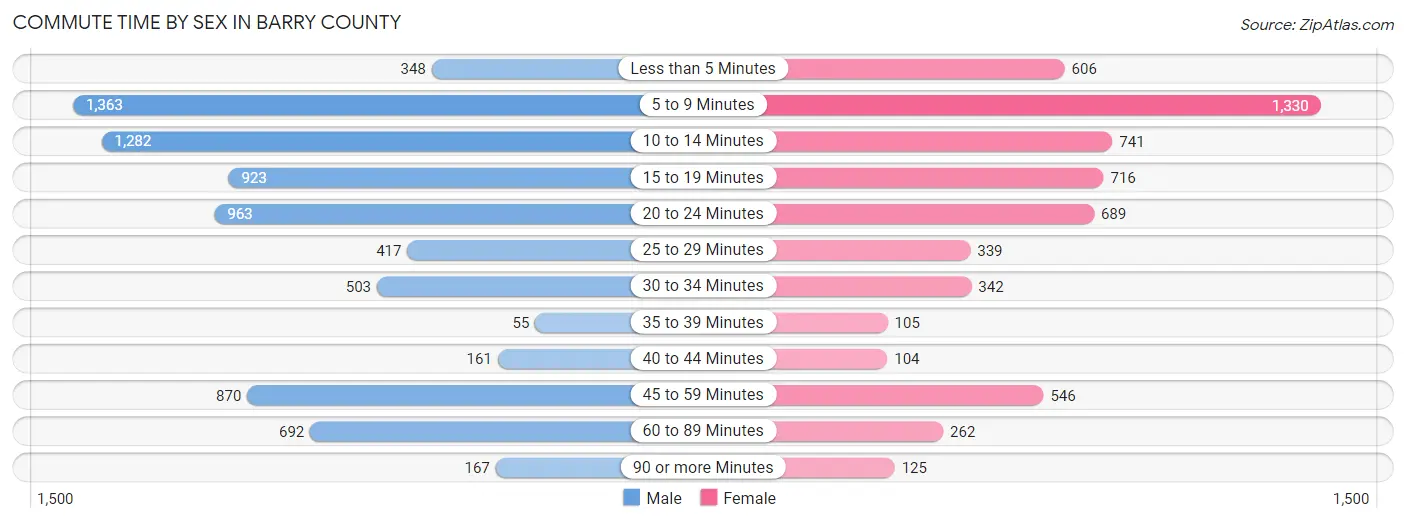
| Commute Time | Male | Female |
| Less than 5 Minutes | 348 (4.5%) | 606 (10.3%) |
| 5 to 9 Minutes | 1,363 (17.6%) | 1,330 (22.5%) |
| 10 to 14 Minutes | 1,282 (16.6%) | 741 (12.6%) |
| 15 to 19 Minutes | 923 (11.9%) | 716 (12.1%) |
| 20 to 24 Minutes | 963 (12.4%) | 689 (11.7%) |
| 25 to 29 Minutes | 417 (5.4%) | 339 (5.7%) |
| 30 to 34 Minutes | 503 (6.5%) | 342 (5.8%) |
| 35 to 39 Minutes | 55 (0.7%) | 105 (1.8%) |
| 40 to 44 Minutes | 161 (2.1%) | 104 (1.8%) |
| 45 to 59 Minutes | 870 (11.2%) | 546 (9.2%) |
| 60 to 89 Minutes | 692 (8.9%) | 262 (4.4%) |
| 90 or more Minutes | 167 (2.2%) | 125 (2.1%) |
Time of Departure to Work by Sex in Barry County
The most frequent times of departure to work in Barry County are 6:30 AM to 6:59 AM (1,087, 14.0%) for males and 7:30 AM to 7:59 AM (922, 15.6%) for females.
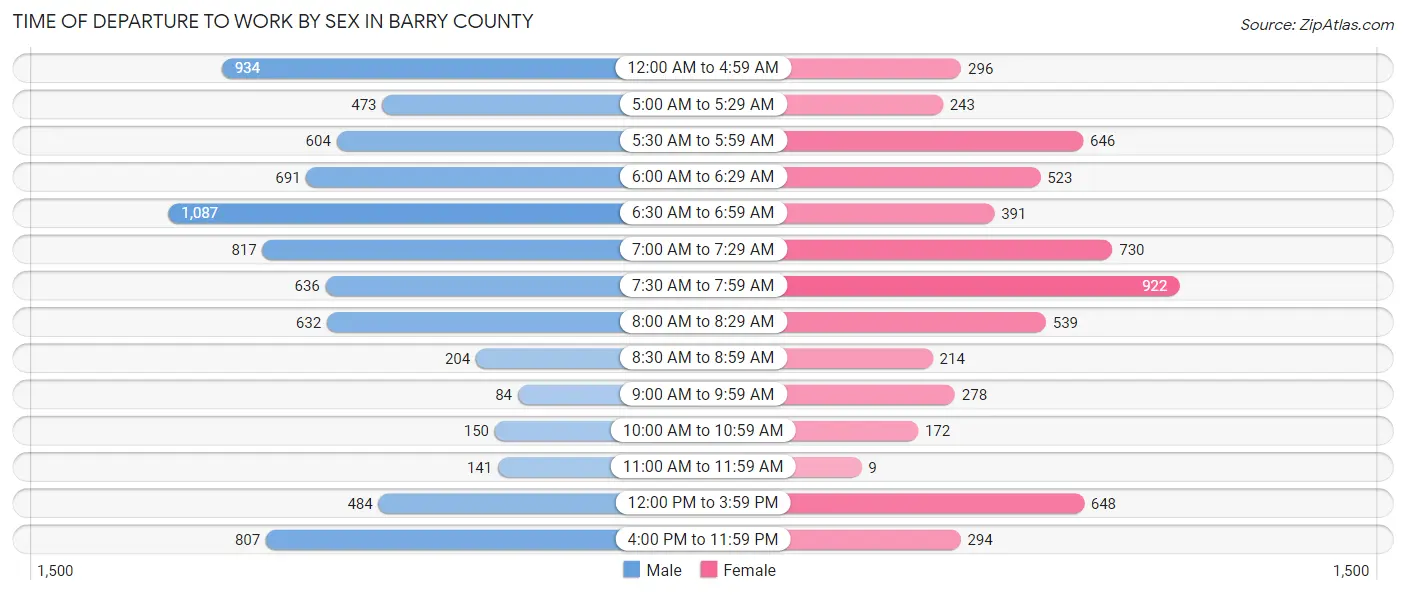
| Time of Departure | Male | Female |
| 12:00 AM to 4:59 AM | 934 (12.1%) | 296 (5.0%) |
| 5:00 AM to 5:29 AM | 473 (6.1%) | 243 (4.1%) |
| 5:30 AM to 5:59 AM | 604 (7.8%) | 646 (10.9%) |
| 6:00 AM to 6:29 AM | 691 (8.9%) | 523 (8.9%) |
| 6:30 AM to 6:59 AM | 1,087 (14.0%) | 391 (6.6%) |
| 7:00 AM to 7:29 AM | 817 (10.5%) | 730 (12.4%) |
| 7:30 AM to 7:59 AM | 636 (8.2%) | 922 (15.6%) |
| 8:00 AM to 8:29 AM | 632 (8.2%) | 539 (9.1%) |
| 8:30 AM to 8:59 AM | 204 (2.6%) | 214 (3.6%) |
| 9:00 AM to 9:59 AM | 84 (1.1%) | 278 (4.7%) |
| 10:00 AM to 10:59 AM | 150 (1.9%) | 172 (2.9%) |
| 11:00 AM to 11:59 AM | 141 (1.8%) | 9 (0.2%) |
| 12:00 PM to 3:59 PM | 484 (6.2%) | 648 (11.0%) |
| 4:00 PM to 11:59 PM | 807 (10.4%) | 294 (5.0%) |
| Total | 7,744 (100.0%) | 5,905 (100.0%) |
Housing Occupancy in Barry County
Occupancy by Ownership in Barry County
Of the total 13,415 dwellings in Barry County, owner-occupied units account for 9,820 (73.2%), while renter-occupied units make up 3,595 (26.8%).
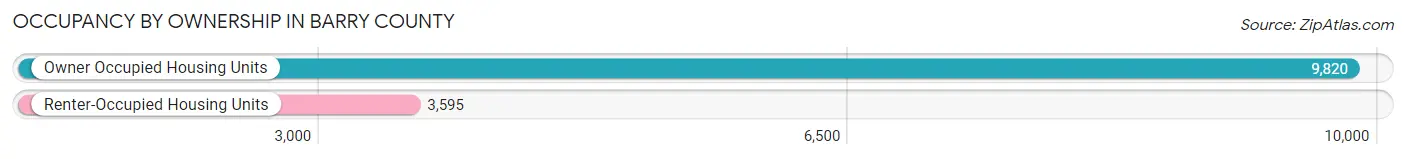
| Occupancy | # Housing Units | % Housing Units |
| Owner Occupied Housing Units | 9,820 | 73.2% |
| Renter-Occupied Housing Units | 3,595 | 26.8% |
| Total Occupied Housing Units | 13,415 | 100.0% |
Occupancy by Household Size in Barry County
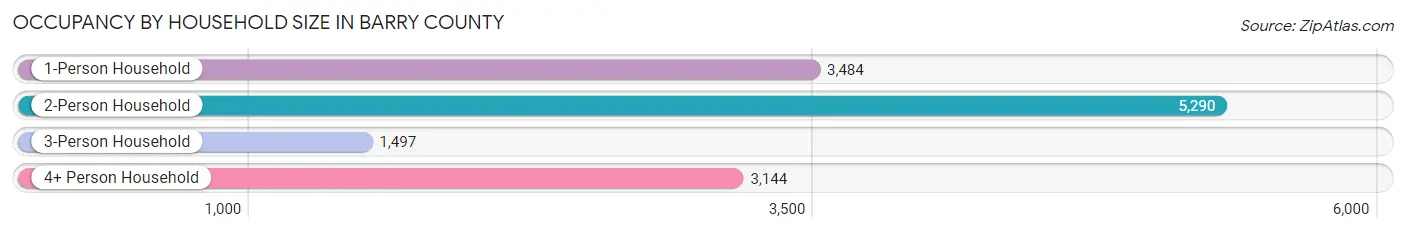
| Household Size | # Housing Units | % Housing Units |
| 1-Person Household | 3,484 | 26.0% |
| 2-Person Household | 5,290 | 39.4% |
| 3-Person Household | 1,497 | 11.2% |
| 4+ Person Household | 3,144 | 23.4% |
| Total Housing Units | 13,415 | 100.0% |
Occupancy by Ownership by Household Size in Barry County
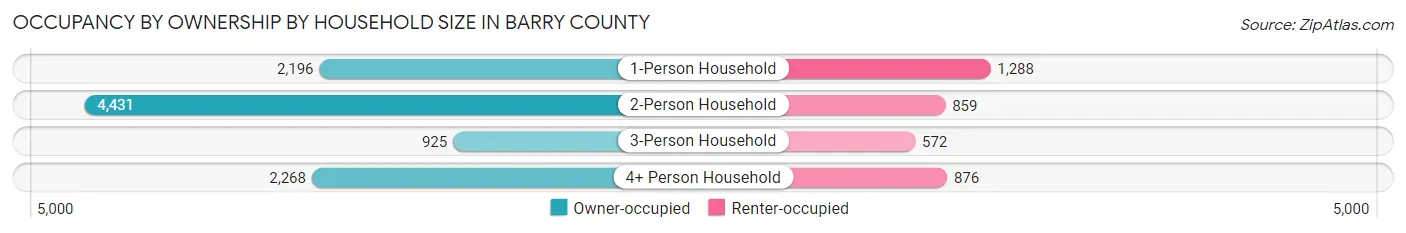
| Household Size | Owner-occupied | Renter-occupied |
| 1-Person Household | 2,196 (63.0%) | 1,288 (37.0%) |
| 2-Person Household | 4,431 (83.8%) | 859 (16.2%) |
| 3-Person Household | 925 (61.8%) | 572 (38.2%) |
| 4+ Person Household | 2,268 (72.1%) | 876 (27.9%) |
| Total Housing Units | 9,820 (73.2%) | 3,595 (26.8%) |
Occupancy by Educational Attainment in Barry County
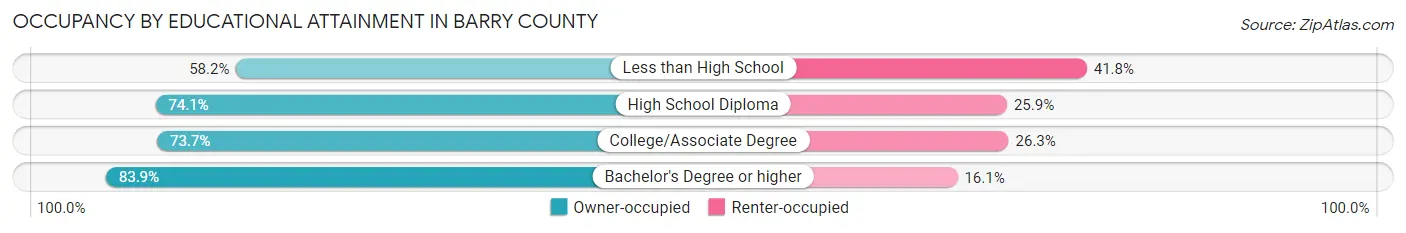
| Household Size | Owner-occupied | Renter-occupied |
| Less than High School | 1,099 (58.2%) | 788 (41.8%) |
| High School Diploma | 4,019 (74.1%) | 1,408 (25.9%) |
| College/Associate Degree | 3,021 (73.7%) | 1,076 (26.3%) |
| Bachelor's Degree or higher | 1,681 (83.9%) | 323 (16.1%) |
Occupancy by Age of Householder in Barry County
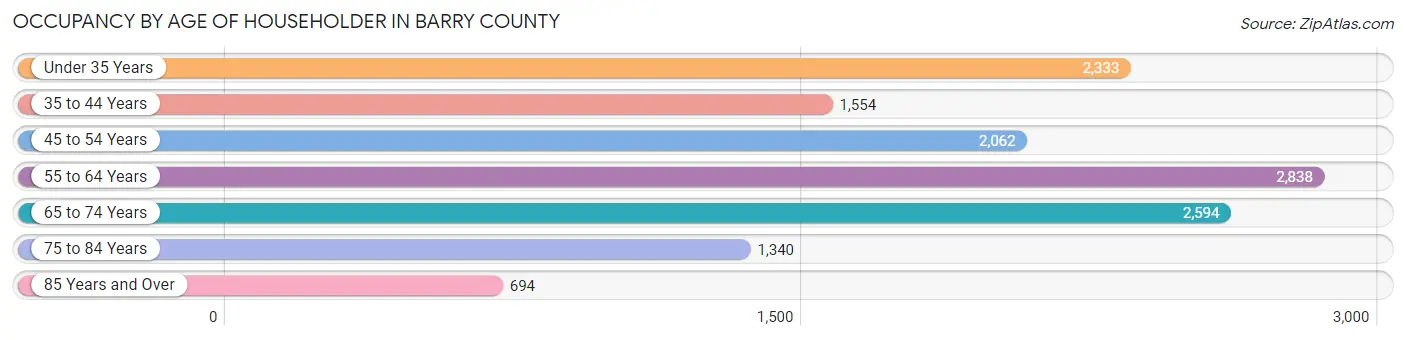
| Age Bracket | # Households | % Households |
| Under 35 Years | 2,333 | 17.4% |
| 35 to 44 Years | 1,554 | 11.6% |
| 45 to 54 Years | 2,062 | 15.4% |
| 55 to 64 Years | 2,838 | 21.2% |
| 65 to 74 Years | 2,594 | 19.3% |
| 75 to 84 Years | 1,340 | 10.0% |
| 85 Years and Over | 694 | 5.2% |
| Total | 13,415 | 100.0% |
Housing Finances in Barry County
Median Income by Occupancy in Barry County
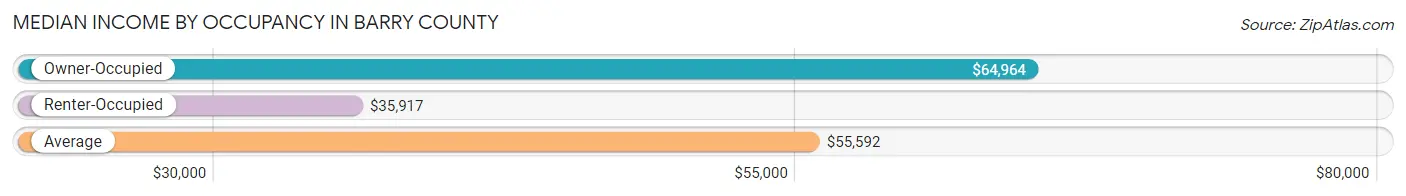
| Occupancy Type | # Households | Median Income |
| Owner-Occupied | 9,820 (73.2%) | $64,964 |
| Renter-Occupied | 3,595 (26.8%) | $35,917 |
| Average | 13,415 (100.0%) | $55,592 |
Occupancy by Householder Income Bracket in Barry County
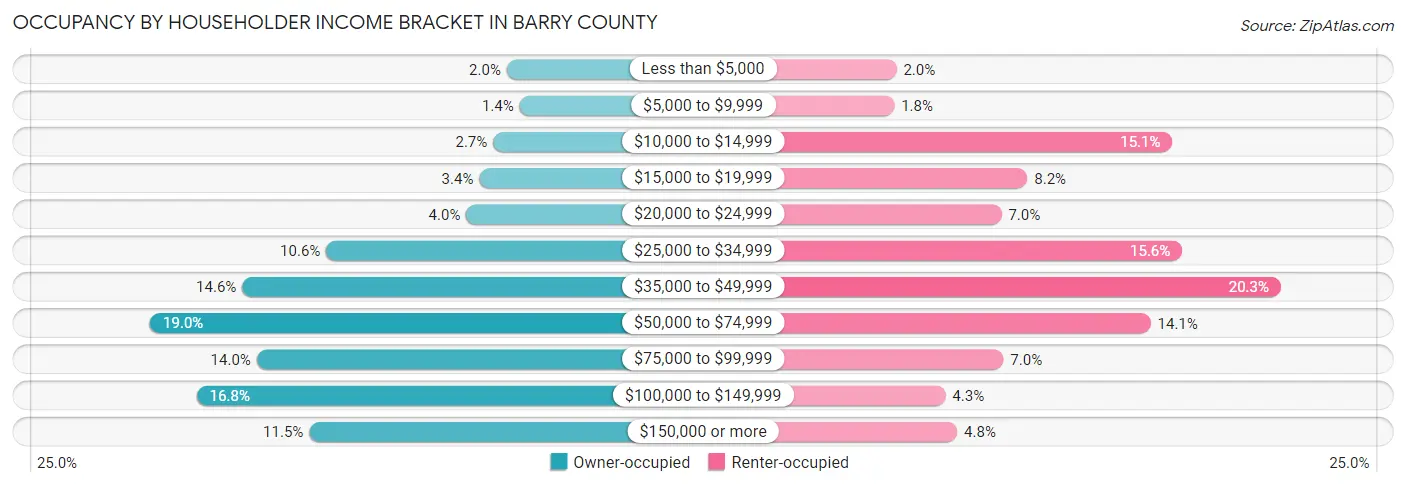
| Income Bracket | Owner-occupied | Renter-occupied |
| Less than $5,000 | 200 (2.0%) | 70 (1.9%) |
| $5,000 to $9,999 | 140 (1.4%) | 66 (1.8%) |
| $10,000 to $14,999 | 264 (2.7%) | 542 (15.1%) |
| $15,000 to $19,999 | 329 (3.4%) | 294 (8.2%) |
| $20,000 to $24,999 | 390 (4.0%) | 250 (7.0%) |
| $25,000 to $34,999 | 1,045 (10.6%) | 559 (15.5%) |
| $35,000 to $49,999 | 1,438 (14.6%) | 728 (20.3%) |
| $50,000 to $74,999 | 1,869 (19.0%) | 505 (14.1%) |
| $75,000 to $99,999 | 1,370 (14.0%) | 253 (7.0%) |
| $100,000 to $149,999 | 1,651 (16.8%) | 154 (4.3%) |
| $150,000 or more | 1,124 (11.5%) | 174 (4.8%) |
| Total | 9,820 (100.0%) | 3,595 (100.0%) |
Monthly Housing Cost Tiers in Barry County
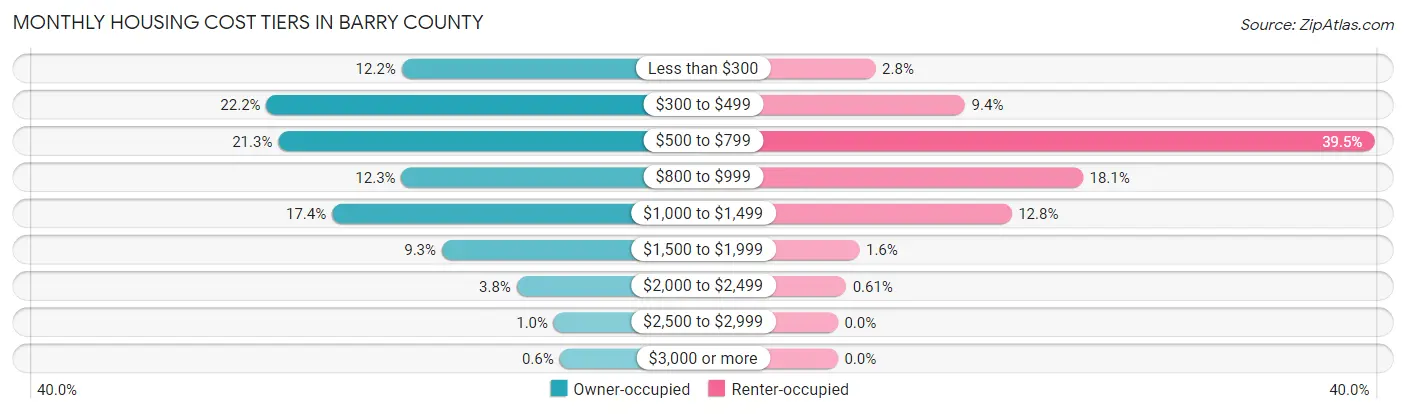
| Monthly Cost | Owner-occupied | Renter-occupied |
| Less than $300 | 1,201 (12.2%) | 100 (2.8%) |
| $300 to $499 | 2,179 (22.2%) | 337 (9.4%) |
| $500 to $799 | 2,094 (21.3%) | 1,421 (39.5%) |
| $800 to $999 | 1,203 (12.2%) | 649 (18.0%) |
| $1,000 to $1,499 | 1,705 (17.4%) | 460 (12.8%) |
| $1,500 to $1,999 | 910 (9.3%) | 57 (1.6%) |
| $2,000 to $2,499 | 369 (3.8%) | 22 (0.6%) |
| $2,500 to $2,999 | 100 (1.0%) | 0 (0.0%) |
| $3,000 or more | 59 (0.6%) | 0 (0.0%) |
| Total | 9,820 (100.0%) | 3,595 (100.0%) |
Physical Housing Characteristics in Barry County
Housing Structures in Barry County
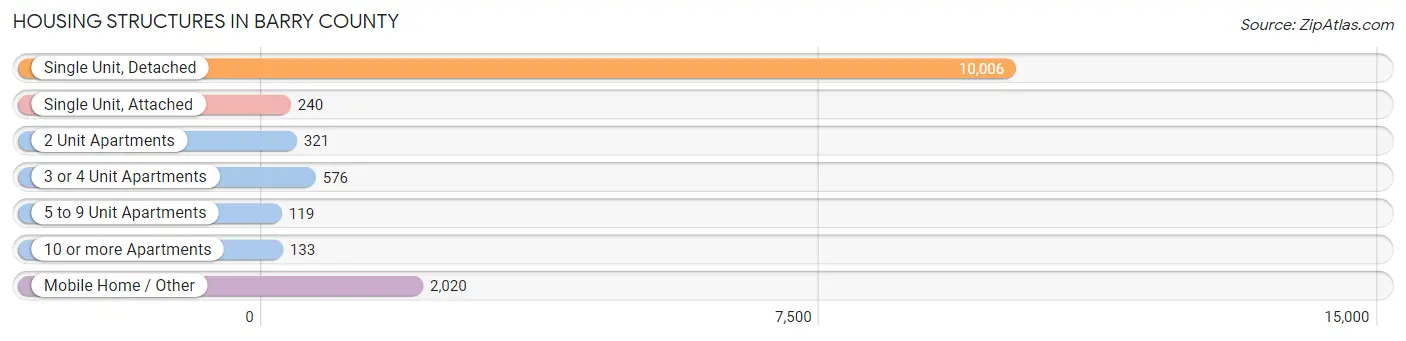
| Structure Type | # Housing Units | % Housing Units |
| Single Unit, Detached | 10,006 | 74.6% |
| Single Unit, Attached | 240 | 1.8% |
| 2 Unit Apartments | 321 | 2.4% |
| 3 or 4 Unit Apartments | 576 | 4.3% |
| 5 to 9 Unit Apartments | 119 | 0.9% |
| 10 or more Apartments | 133 | 1.0% |
| Mobile Home / Other | 2,020 | 15.1% |
| Total | 13,415 | 100.0% |
Housing Structures by Occupancy in Barry County
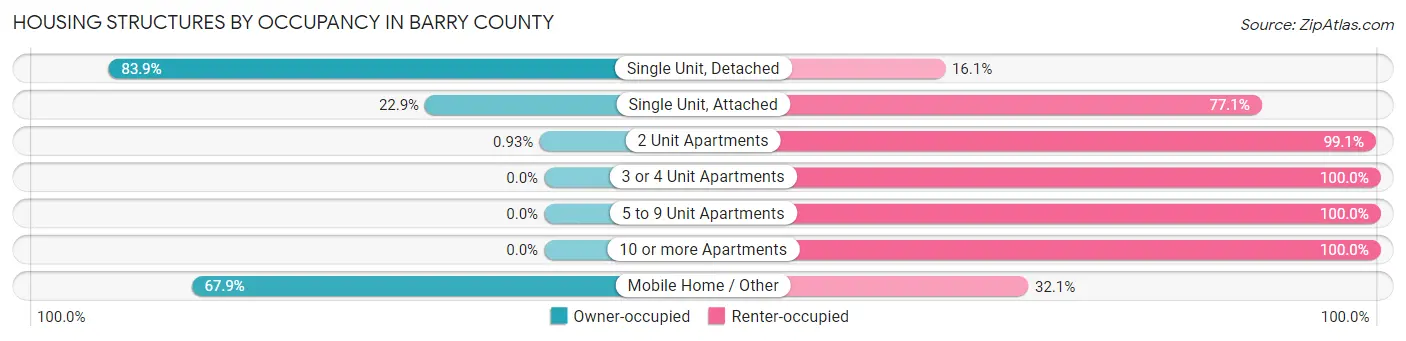
| Structure Type | Owner-occupied | Renter-occupied |
| Single Unit, Detached | 8,391 (83.9%) | 1,615 (16.1%) |
| Single Unit, Attached | 55 (22.9%) | 185 (77.1%) |
| 2 Unit Apartments | 3 (0.9%) | 318 (99.1%) |
| 3 or 4 Unit Apartments | 0 (0.0%) | 576 (100.0%) |
| 5 to 9 Unit Apartments | 0 (0.0%) | 119 (100.0%) |
| 10 or more Apartments | 0 (0.0%) | 133 (100.0%) |
| Mobile Home / Other | 1,371 (67.9%) | 649 (32.1%) |
| Total | 9,820 (73.2%) | 3,595 (26.8%) |
Housing Structures by Number of Rooms in Barry County
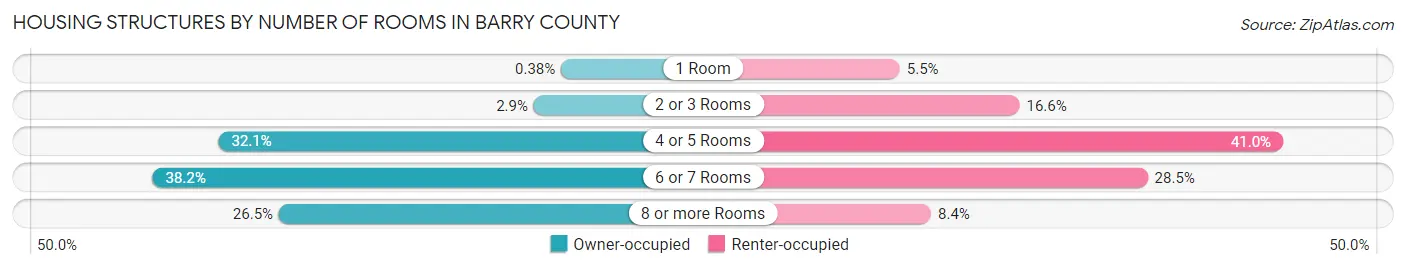
| Number of Rooms | Owner-occupied | Renter-occupied |
| 1 Room | 37 (0.4%) | 199 (5.5%) |
| 2 or 3 Rooms | 286 (2.9%) | 597 (16.6%) |
| 4 or 5 Rooms | 3,149 (32.1%) | 1,473 (41.0%) |
| 6 or 7 Rooms | 3,748 (38.2%) | 1,023 (28.5%) |
| 8 or more Rooms | 2,600 (26.5%) | 303 (8.4%) |
| Total | 9,820 (100.0%) | 3,595 (100.0%) |
Housing Structure by Heating Type in Barry County
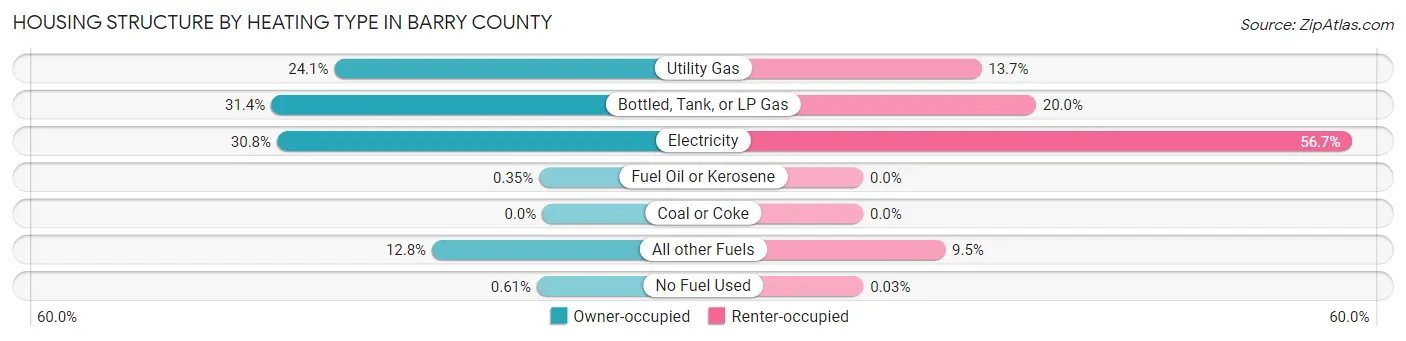
| Heating Type | Owner-occupied | Renter-occupied |
| Utility Gas | 2,366 (24.1%) | 493 (13.7%) |
| Bottled, Tank, or LP Gas | 3,086 (31.4%) | 720 (20.0%) |
| Electricity | 3,020 (30.7%) | 2,039 (56.7%) |
| Fuel Oil or Kerosene | 34 (0.4%) | 0 (0.0%) |
| Coal or Coke | 0 (0.0%) | 0 (0.0%) |
| All other Fuels | 1,254 (12.8%) | 342 (9.5%) |
| No Fuel Used | 60 (0.6%) | 1 (0.0%) |
| Total | 9,820 (100.0%) | 3,595 (100.0%) |
Household Vehicle Usage in Barry County
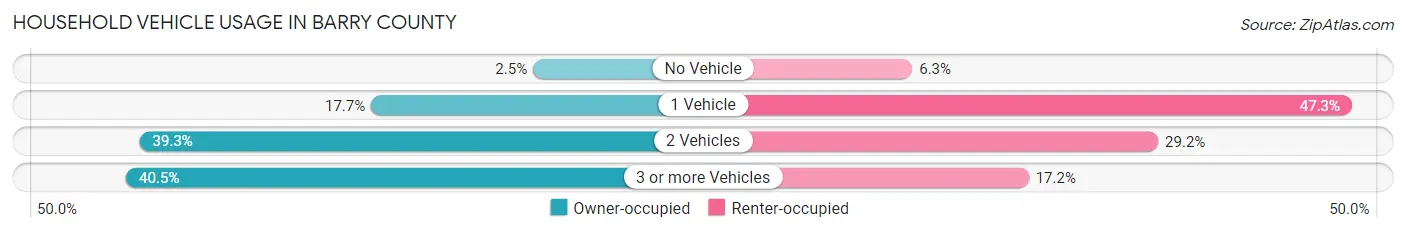
| Vehicles per Household | Owner-occupied | Renter-occupied |
| No Vehicle | 249 (2.5%) | 226 (6.3%) |
| 1 Vehicle | 1,734 (17.7%) | 1,701 (47.3%) |
| 2 Vehicles | 3,857 (39.3%) | 1,051 (29.2%) |
| 3 or more Vehicles | 3,980 (40.5%) | 617 (17.2%) |
| Total | 9,820 (100.0%) | 3,595 (100.0%) |
Real Estate & Mortgages in Barry County
Real Estate and Mortgage Overview in Barry County
| Characteristic | Without Mortgage | With Mortgage |
| Housing Units | 5,035 | 4,785 |
| Median Property Value | $153,300 | $165,300 |
| Median Household Income | $51,460 | $572 |
| Monthly Housing Costs | $411 | $59 |
| Real Estate Taxes | $918 | $141 |
Property Value by Mortgage Status in Barry County
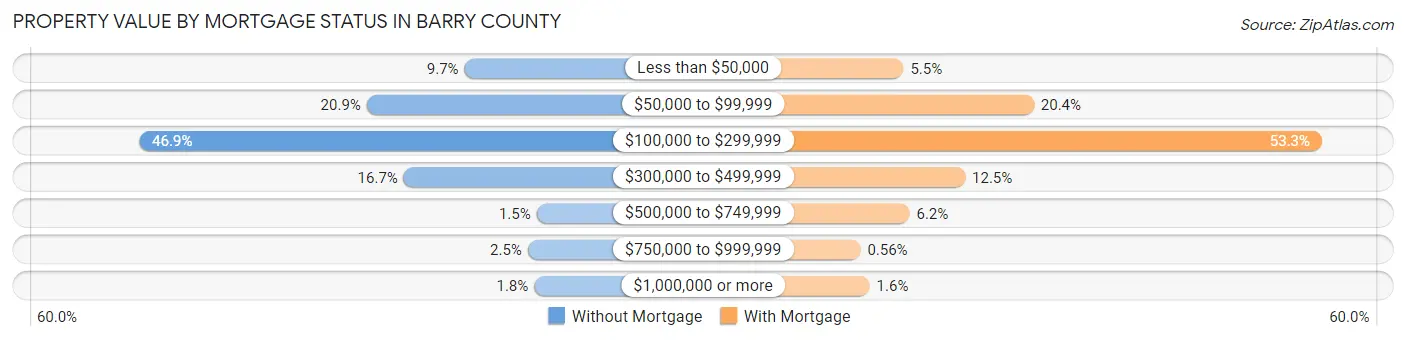
| Property Value | Without Mortgage | With Mortgage |
| Less than $50,000 | 490 (9.7%) | 262 (5.5%) |
| $50,000 to $99,999 | 1,053 (20.9%) | 975 (20.4%) |
| $100,000 to $299,999 | 2,362 (46.9%) | 2,550 (53.3%) |
| $300,000 to $499,999 | 840 (16.7%) | 599 (12.5%) |
| $500,000 to $749,999 | 75 (1.5%) | 295 (6.2%) |
| $750,000 to $999,999 | 126 (2.5%) | 27 (0.6%) |
| $1,000,000 or more | 89 (1.8%) | 77 (1.6%) |
| Total | 5,035 (100.0%) | 4,785 (100.0%) |
Household Income by Mortgage Status in Barry County
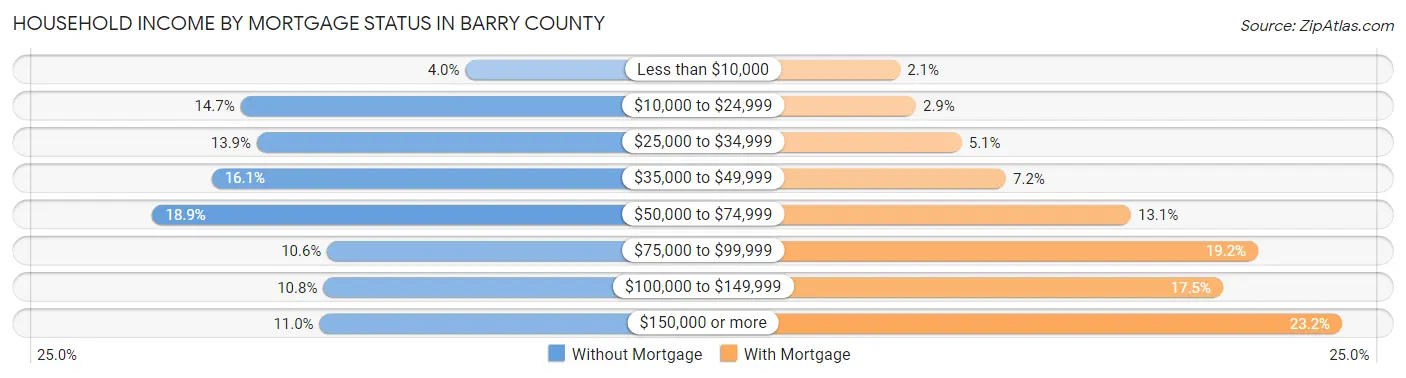
| Household Income | Without Mortgage | With Mortgage |
| Less than $10,000 | 202 (4.0%) | 102 (2.1%) |
| $10,000 to $24,999 | 741 (14.7%) | 138 (2.9%) |
| $25,000 to $34,999 | 702 (13.9%) | 242 (5.1%) |
| $35,000 to $49,999 | 810 (16.1%) | 343 (7.2%) |
| $50,000 to $74,999 | 952 (18.9%) | 628 (13.1%) |
| $75,000 to $99,999 | 533 (10.6%) | 917 (19.2%) |
| $100,000 to $149,999 | 543 (10.8%) | 837 (17.5%) |
| $150,000 or more | 552 (11.0%) | 1,108 (23.2%) |
| Total | 5,035 (100.0%) | 4,785 (100.0%) |
Property Value to Household Income Ratio in Barry County
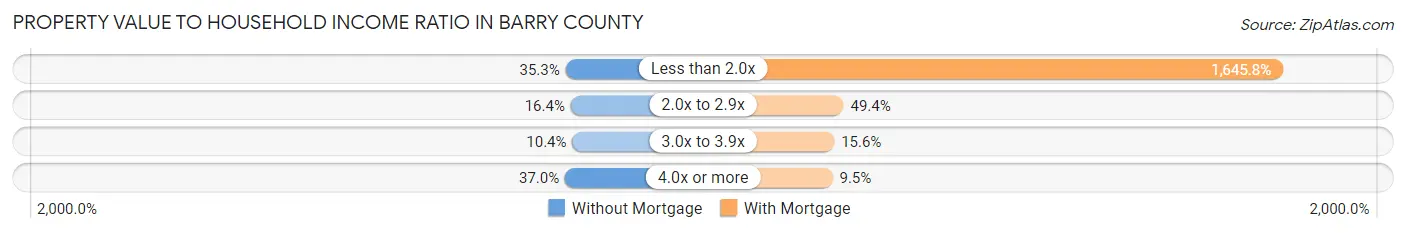
| Value-to-Income Ratio | Without Mortgage | With Mortgage |
| Less than 2.0x | 1,776 (35.3%) | 78,750 (1,645.8%) |
| 2.0x to 2.9x | 824 (16.4%) | 2,365 (49.4%) |
| 3.0x to 3.9x | 523 (10.4%) | 744 (15.5%) |
| 4.0x or more | 1,864 (37.0%) | 453 (9.5%) |
| Total | 5,035 (100.0%) | 4,785 (100.0%) |
Real Estate Taxes by Mortgage Status in Barry County
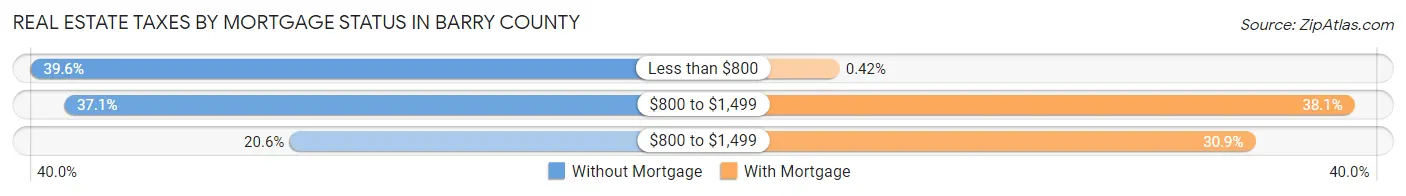
| Property Taxes | Without Mortgage | With Mortgage |
| Less than $800 | 1,992 (39.6%) | 20 (0.4%) |
| $800 to $1,499 | 1,869 (37.1%) | 1,823 (38.1%) |
| $800 to $1,499 | 1,037 (20.6%) | 1,476 (30.8%) |
| Total | 5,035 (100.0%) | 4,785 (100.0%) |
Health & Disability in Barry County
Health Insurance Coverage by Age in Barry County
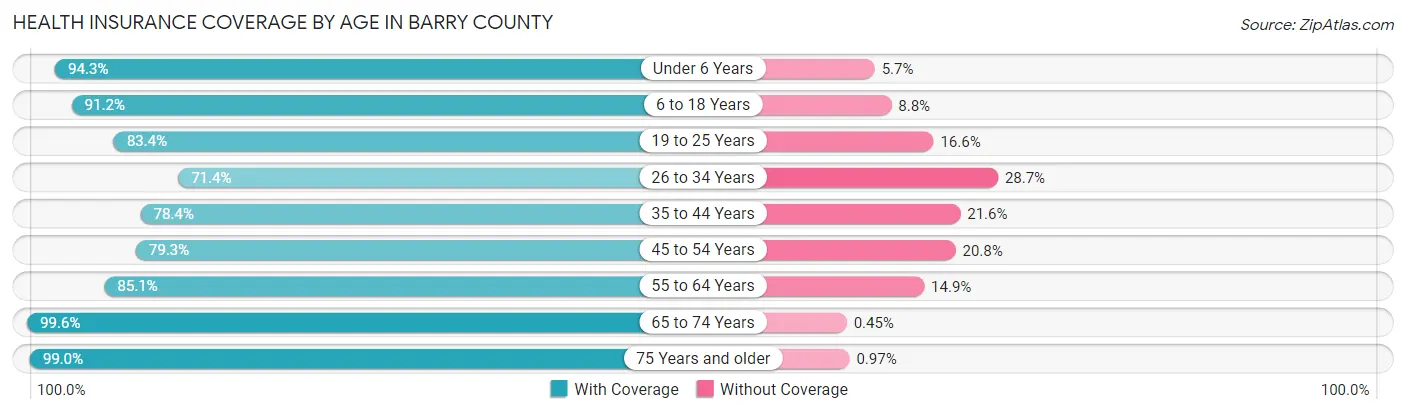
| Age Bracket | With Coverage | Without Coverage |
| Under 6 Years | 2,323 (94.3%) | 140 (5.7%) |
| 6 to 18 Years | 5,248 (91.2%) | 505 (8.8%) |
| 19 to 25 Years | 2,030 (83.4%) | 405 (16.6%) |
| 26 to 34 Years | 2,490 (71.4%) | 1,000 (28.6%) |
| 35 to 44 Years | 3,003 (78.4%) | 829 (21.6%) |
| 45 to 54 Years | 3,181 (79.2%) | 833 (20.7%) |
| 55 to 64 Years | 4,253 (85.1%) | 744 (14.9%) |
| 65 to 74 Years | 4,429 (99.6%) | 20 (0.4%) |
| 75 Years and older | 2,963 (99.0%) | 29 (1.0%) |
| Total | 29,920 (86.9%) | 4,505 (13.1%) |
Health Insurance Coverage by Citizenship Status in Barry County
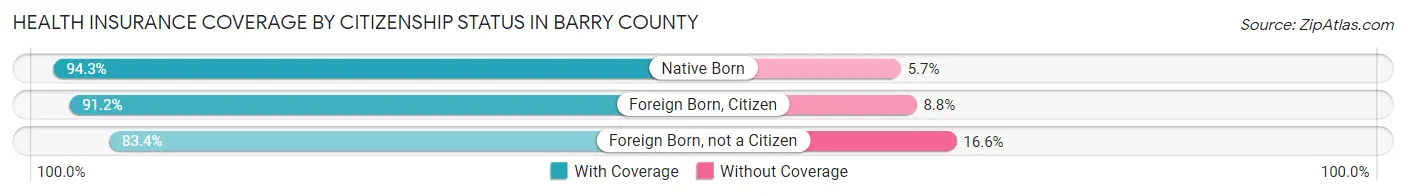
| Citizenship Status | With Coverage | Without Coverage |
| Native Born | 2,323 (94.3%) | 140 (5.7%) |
| Foreign Born, Citizen | 5,248 (91.2%) | 505 (8.8%) |
| Foreign Born, not a Citizen | 2,030 (83.4%) | 405 (16.6%) |
Health Insurance Coverage by Household Income in Barry County
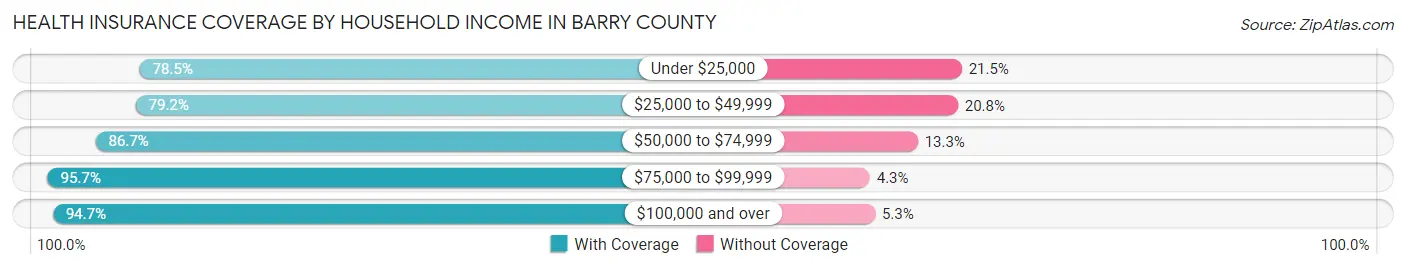
| Household Income | With Coverage | Without Coverage |
| Under $25,000 | 3,762 (78.5%) | 1,032 (21.5%) |
| $25,000 to $49,999 | 7,310 (79.2%) | 1,920 (20.8%) |
| $50,000 to $74,999 | 5,636 (86.7%) | 863 (13.3%) |
| $75,000 to $99,999 | 4,302 (95.7%) | 194 (4.3%) |
| $100,000 and over | 8,901 (94.7%) | 496 (5.3%) |
Public vs Private Health Insurance Coverage by Age in Barry County
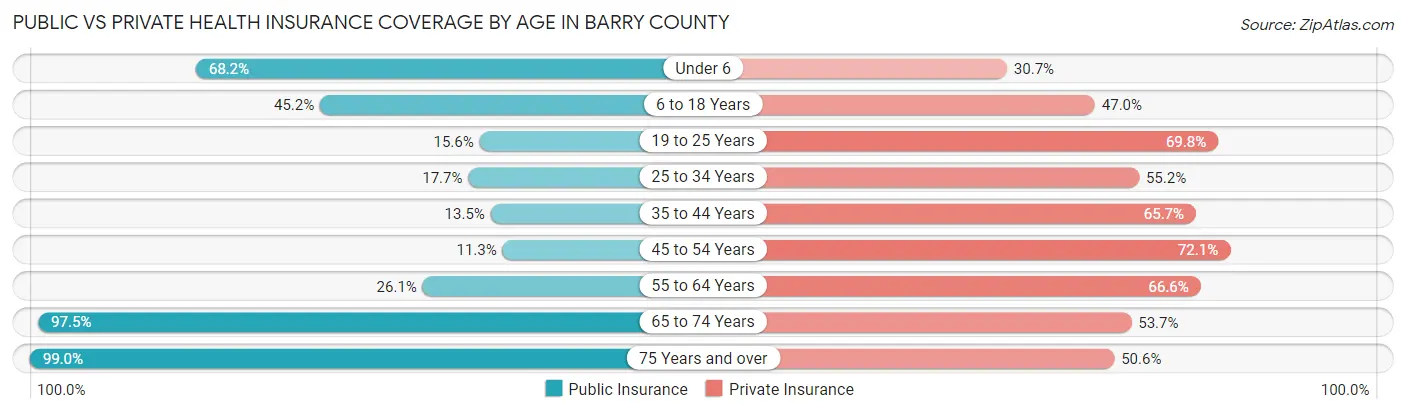
| Age Bracket | Public Insurance | Private Insurance |
| Under 6 | 1,680 (68.2%) | 755 (30.6%) |
| 6 to 18 Years | 2,598 (45.2%) | 2,702 (47.0%) |
| 19 to 25 Years | 379 (15.6%) | 1,700 (69.8%) |
| 25 to 34 Years | 616 (17.6%) | 1,925 (55.2%) |
| 35 to 44 Years | 517 (13.5%) | 2,518 (65.7%) |
| 45 to 54 Years | 453 (11.3%) | 2,892 (72.1%) |
| 55 to 64 Years | 1,305 (26.1%) | 3,328 (66.6%) |
| 65 to 74 Years | 4,337 (97.5%) | 2,391 (53.7%) |
| 75 Years and over | 2,963 (99.0%) | 1,513 (50.6%) |
| Total | 14,848 (43.1%) | 19,724 (57.3%) |
Disability Status by Sex by Age in Barry County
| Age Bracket | Male | Female |
| Under 5 Years | 13 (1.3%) | 0 (0.0%) |
| 5 to 17 Years | 337 (10.8%) | 107 (4.0%) |
| 18 to 34 Years | 263 (7.8%) | 127 (4.3%) |
| 35 to 64 Years | 962 (15.2%) | 1,123 (17.3%) |
| 65 to 74 Years | 706 (31.7%) | 554 (24.9%) |
| 75 Years and over | 634 (46.8%) | 721 (44.0%) |
Disability Class by Sex by Age in Barry County
Disability Class: Hearing Difficulty
| Age Bracket | Male | Female |
| Under 5 Years | 13 (1.3%) | 0 (0.0%) |
| 5 to 17 Years | 2 (0.1%) | 2 (0.1%) |
| 18 to 34 Years | 0 (0.0%) | 15 (0.5%) |
| 35 to 64 Years | 289 (4.6%) | 112 (1.7%) |
| 65 to 74 Years | 369 (16.6%) | 221 (9.9%) |
| 75 Years and over | 363 (26.8%) | 301 (18.4%) |
Disability Class: Vision Difficulty
| Age Bracket | Male | Female |
| Under 5 Years | 0 (0.0%) | 0 (0.0%) |
| 5 to 17 Years | 74 (2.4%) | 0 (0.0%) |
| 18 to 34 Years | 46 (1.4%) | 20 (0.7%) |
| 35 to 64 Years | 235 (3.7%) | 178 (2.7%) |
| 65 to 74 Years | 102 (4.6%) | 51 (2.3%) |
| 75 Years and over | 183 (13.5%) | 101 (6.2%) |
Disability Class: Cognitive Difficulty
| Age Bracket | Male | Female |
| 5 to 17 Years | 290 (9.3%) | 105 (3.9%) |
| 18 to 34 Years | 236 (7.0%) | 120 (4.0%) |
| 35 to 64 Years | 299 (4.7%) | 301 (4.6%) |
| 65 to 74 Years | 145 (6.5%) | 82 (3.7%) |
| 75 Years and over | 236 (17.4%) | 169 (10.3%) |
Disability Class: Ambulatory Difficulty
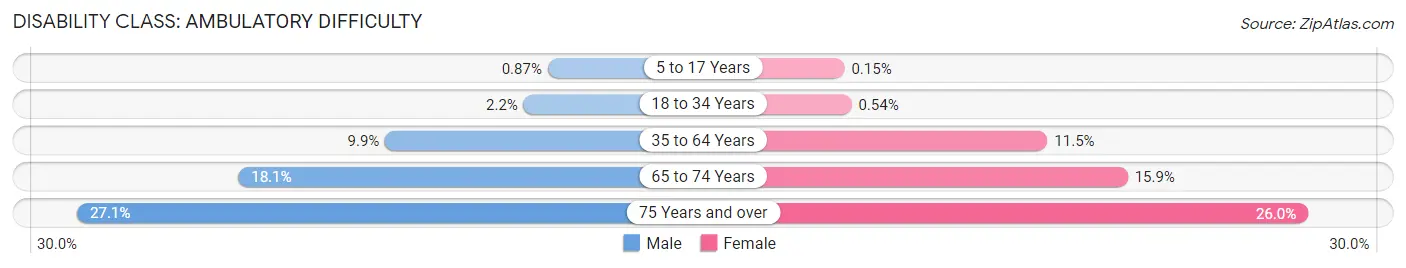
| Age Bracket | Male | Female |
| 5 to 17 Years | 27 (0.9%) | 4 (0.2%) |
| 18 to 34 Years | 75 (2.2%) | 16 (0.5%) |
| 35 to 64 Years | 629 (9.9%) | 745 (11.5%) |
| 65 to 74 Years | 403 (18.1%) | 354 (15.9%) |
| 75 Years and over | 367 (27.1%) | 425 (26.0%) |
Disability Class: Self-Care Difficulty
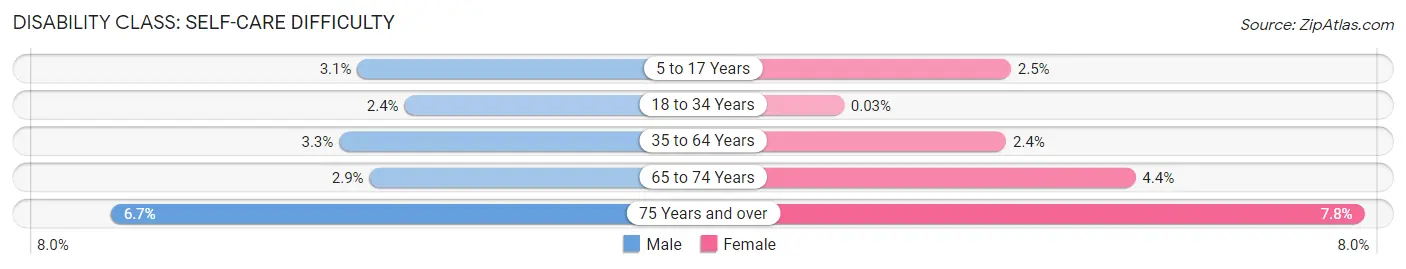
| Age Bracket | Male | Female |
| 5 to 17 Years | 95 (3.1%) | 68 (2.5%) |
| 18 to 34 Years | 80 (2.4%) | 1 (0.0%) |
| 35 to 64 Years | 211 (3.3%) | 159 (2.4%) |
| 65 to 74 Years | 64 (2.9%) | 97 (4.4%) |
| 75 Years and over | 91 (6.7%) | 127 (7.8%) |
Technology Access in Barry County
Computing Device Access in Barry County
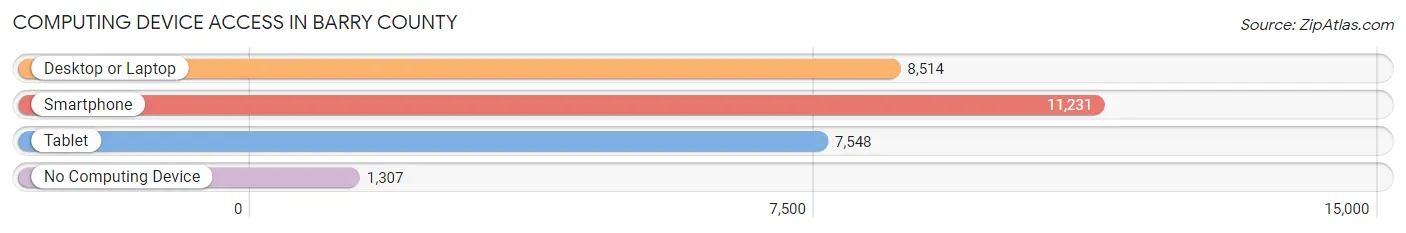
| Device Type | # Households | % Households |
| Desktop or Laptop | 8,514 | 63.5% |
| Smartphone | 11,231 | 83.7% |
| Tablet | 7,548 | 56.3% |
| No Computing Device | 1,307 | 9.7% |
| Total | 13,415 | 100.0% |
Internet Access in Barry County
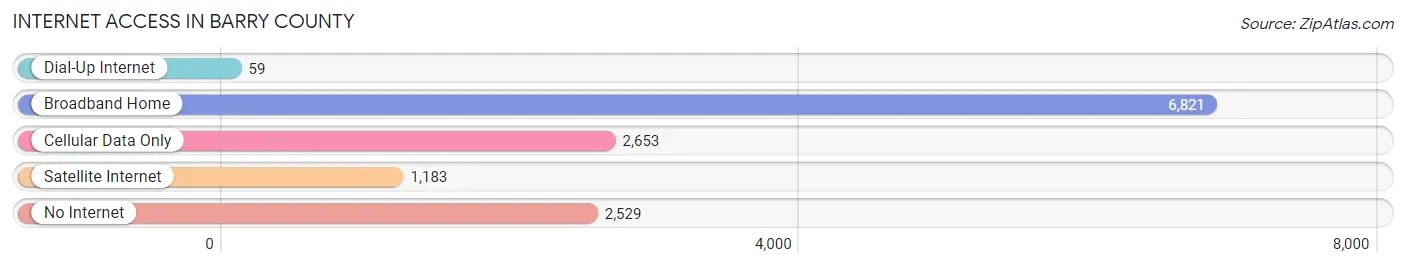
| Internet Type | # Households | % Households |
| Dial-Up Internet | 59 | 0.4% |
| Broadband Home | 6,821 | 50.8% |
| Cellular Data Only | 2,653 | 19.8% |
| Satellite Internet | 1,183 | 8.8% |
| No Internet | 2,529 | 18.9% |
| Total | 13,415 | 100.0% |
Barry County Summary
Barry County is located in the southwestern corner of Missouri, and is part of the Ozark Plateau. It is bordered by Lawrence County to the north, Stone County to the east, McDonald County to the south, and Newton County to the west. The county seat is Cassville, and the largest city is Monett. As of the 2010 census, the population was 35,597.
Geography
Barry County covers an area of 745 square miles, making it the fourth largest county in Missouri. The terrain is mostly rolling hills, with some flat areas in the north and south. The highest point in the county is located in the northwest corner, at an elevation of 1,400 feet. The county is drained by the James, White, and Roaring Rivers, as well as several smaller creeks.
The climate of Barry County is humid subtropical, with hot, humid summers and mild winters. The average annual temperature is around 57 degrees Fahrenheit, and the average annual precipitation is around 40 inches.
Economy
The economy of Barry County is largely based on agriculture. The county is home to a variety of crops, including corn, soybeans, wheat, hay, and cotton. Livestock production is also important, with cattle, hogs, and poultry being the main animals raised.
Manufacturing is also an important part of the economy. The county is home to several factories, including a Tyson Foods plant in Monett, a Nestle Purina plant in Cassville, and a Kraft Foods plant in Purdy.
Demographics
As of the 2010 census, the population of Barry County was 35,597. The racial makeup of the county was 95.3% White, 1.2% African American, 0.5% Native American, 0.4% Asian, 0.1% Pacific Islander, 1.2% from other races, and 1.3% from two or more races. Hispanic or Latino of any race were 3.2% of the population.
The median household income in Barry County was $37,945, and the median family income was $45,945. The per capita income was $19,945. About 13.2% of the population was below the poverty line.
Education
Barry County is served by the Cassville R-IV School District, which includes Cassville High School, Cassville Middle School, and Cassville Elementary School. The Monett R-I School District serves the city of Monett, and includes Monett High School, Monett Middle School, and Monett Elementary School. There are also several private schools in the county.
The county is also home to Crowder College, a two-year community college located in Cassville. The college offers a variety of associate's degrees and certificate programs.
Conclusion
Barry County is a rural county located in the southwestern corner of Missouri. It is home to a variety of crops and livestock, as well as several factories. The population is mostly white, with a small percentage of African Americans, Native Americans, Asians, and Pacific Islanders. The county is served by several school districts, as well as a two-year community college.
Common Questions
What is Per Capita Income in Barry County?
Per Capita income in Barry County is $30,932.
What is the Median Family Income in Barry County?
Median Family Income in Barry County is $67,373.
What is the Median Household income in Barry County?
Median Household Income in Barry County is $55,592.
What is Income or Wage Gap in Barry County?
Income or Wage Gap in Barry County is 22.2%.
Women in Barry County earn 77.8 cents for every dollar earned by a man.
What is Family Income Deficit in Barry County?
Family Income Deficit in Barry County is $10,093.
Families that are below poverty line in Barry County earn $10,093 less on average than the poverty threshold level.
What is Inequality or Gini Index in Barry County?
Inequality or Gini Index in Barry County is 0.47.
What is the Total Population of Barry County?
Total Population of Barry County is 34,701.
What is the Total Male Population of Barry County?
Total Male Population of Barry County is 17,540.
What is the Total Female Population of Barry County?
Total Female Population of Barry County is 17,161.
What is the Ratio of Males per 100 Females in Barry County?
There are 102.21 Males per 100 Females in Barry County.
What is the Ratio of Females per 100 Males in Barry County?
There are 97.84 Females per 100 Males in Barry County.
What is the Median Population Age in Barry County?
Median Population Age in Barry County is 43.2 Years.
What is the Average Family Size in Barry County
Average Family Size in Barry County is 3.0 People.
What is the Average Household Size in Barry County
Average Household Size in Barry County is 2.6 People.
How Large is the Labor Force in Barry County?
There are 15,510 People in the Labor Forcein in Barry County.
What is the Percentage of People in the Labor Force in Barry County?
55.9% of People are in the Labor Force in Barry County.
What is the Unemployment Rate in Barry County?
Unemployment Rate in Barry County is 3.6%.