Atchison County, MO Map & Demographics
Atchison County Map
Atchison County Overview
$32,549
PER CAPITA INCOME
$66,893
AVG FAMILY INCOME
$58,521
AVG HOUSEHOLD INCOME
40.4%
WAGE / INCOME GAP [ % ]
59.6¢/ $1
WAGE / INCOME GAP [ $ ]
$9,553
FAMILY INCOME DEFICIT
0.42
INEQUALITY / GINI INDEX
5,270
TOTAL POPULATION
2,666
MALE POPULATION
2,604
FEMALE POPULATION
102.38
MALES / 100 FEMALES
97.67
FEMALES / 100 MALES
48.1
MEDIAN AGE
2.8
AVG FAMILY SIZE
2.2
AVG HOUSEHOLD SIZE
2,612
LABOR FORCE [ PEOPLE ]
60.9%
PERCENT IN LABOR FORCE
2.6%
UNEMPLOYMENT RATE
Atchison County Area Codes
Income in Atchison County
Income Overview in Atchison County
Per Capita Income in Atchison County is $32,549, while median incomes of families and households are $66,893 and $58,521 respectively.
| Characteristic | Number | Measure |
| Per Capita Income | 5,270 | $32,549 |
| Median Family Income | 1,483 | $66,893 |
| Mean Family Income | 1,483 | $83,722 |
| Median Household Income | 2,351 | $58,521 |
| Mean Household Income | 2,351 | $72,058 |
| Income Deficit | 1,483 | $9,553 |
| Wage / Income Gap (%) | 5,270 | 40.39% |
| Wage / Income Gap ($) | 5,270 | 59.61¢ per $1 |
| Gini / Inequality Index | 5,270 | 0.42 |
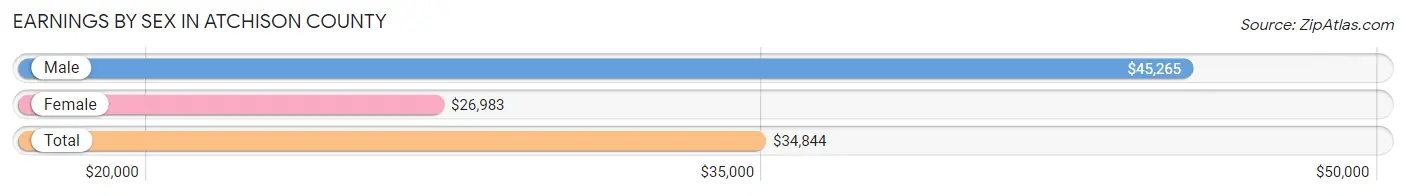
Earnings by Sex in Atchison County
Average Earnings in Atchison County are $34,844, $45,265 for men and $26,983 for women, a difference of 40.4%.
| Sex | Number | Average Earnings |
| Male | 1,547 (56.1%) | $45,265 |
| Female | 1,208 (43.9%) | $26,983 |
| Total | 2,755 (100.0%) | $34,844 |
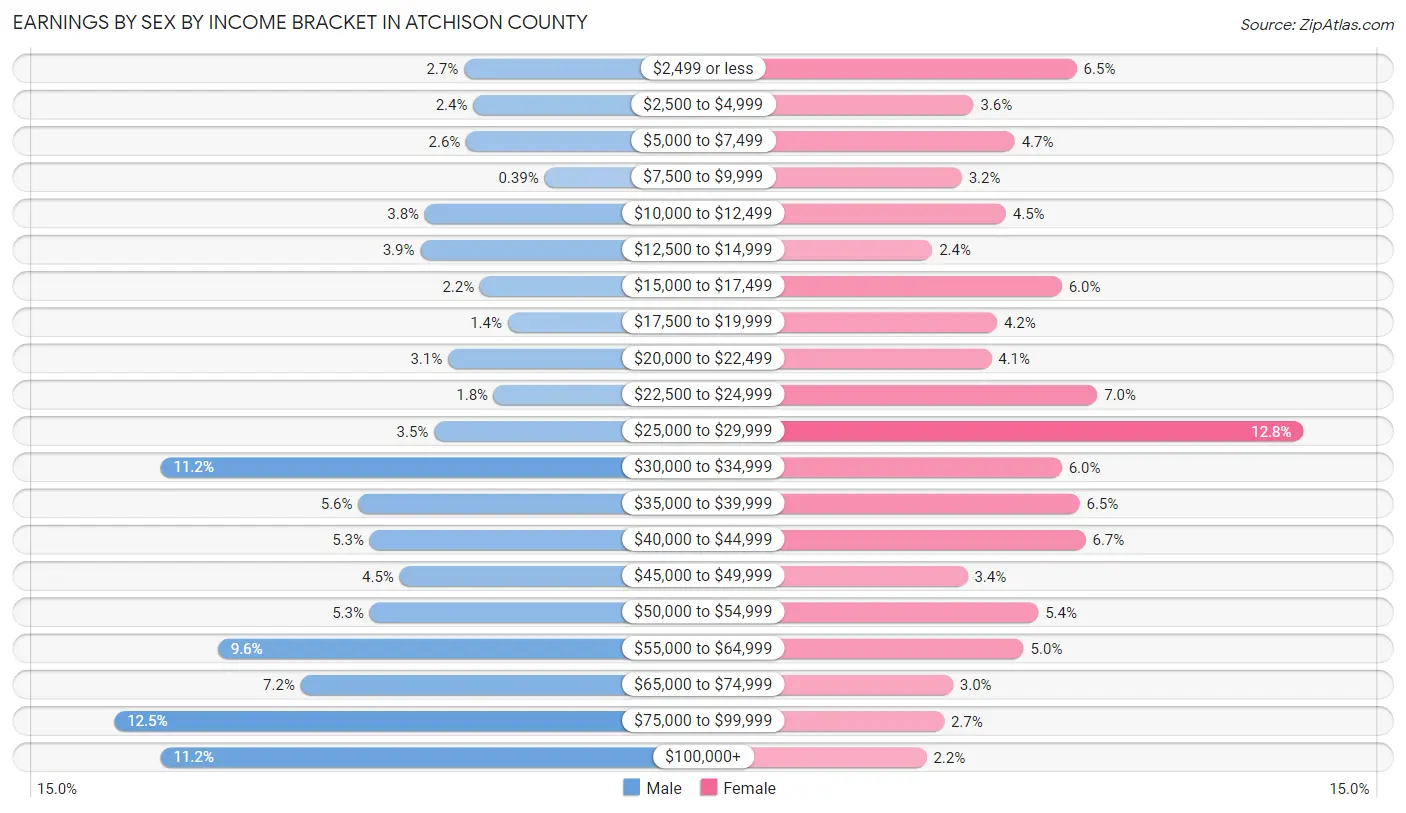
Earnings by Sex by Income Bracket in Atchison County
The most common earnings brackets in Atchison County are $75,000 to $99,999 for men (193 | 12.5%) and $25,000 to $29,999 for women (155 | 12.8%).
| Income | Male | Female |
| $2,499 or less | 41 (2.6%) | 78 (6.5%) |
| $2,500 to $4,999 | 37 (2.4%) | 43 (3.6%) |
| $5,000 to $7,499 | 40 (2.6%) | 57 (4.7%) |
| $7,500 to $9,999 | 6 (0.4%) | 39 (3.2%) |
| $10,000 to $12,499 | 58 (3.7%) | 54 (4.5%) |
| $12,500 to $14,999 | 60 (3.9%) | 29 (2.4%) |
| $15,000 to $17,499 | 34 (2.2%) | 73 (6.0%) |
| $17,500 to $19,999 | 22 (1.4%) | 51 (4.2%) |
| $20,000 to $22,499 | 48 (3.1%) | 49 (4.1%) |
| $22,500 to $24,999 | 28 (1.8%) | 85 (7.0%) |
| $25,000 to $29,999 | 54 (3.5%) | 155 (12.8%) |
| $30,000 to $34,999 | 173 (11.2%) | 73 (6.0%) |
| $35,000 to $39,999 | 87 (5.6%) | 79 (6.5%) |
| $40,000 to $44,999 | 82 (5.3%) | 81 (6.7%) |
| $45,000 to $49,999 | 69 (4.5%) | 41 (3.4%) |
| $50,000 to $54,999 | 82 (5.3%) | 65 (5.4%) |
| $55,000 to $64,999 | 148 (9.6%) | 60 (5.0%) |
| $65,000 to $74,999 | 112 (7.2%) | 36 (3.0%) |
| $75,000 to $99,999 | 193 (12.5%) | 33 (2.7%) |
| $100,000+ | 173 (11.2%) | 27 (2.2%) |
| Total | 1,547 (100.0%) | 1,208 (100.0%) |
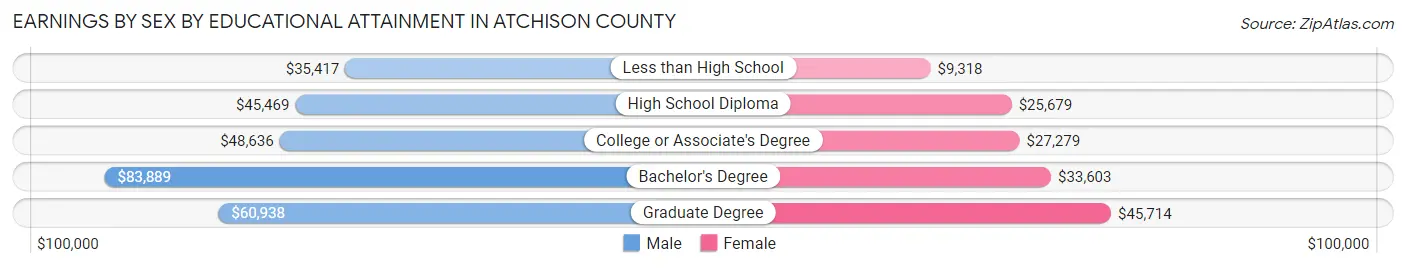
Earnings by Sex by Educational Attainment in Atchison County
Average earnings in Atchison County are $51,141 for men and $27,741 for women, a difference of 45.8%. Men with an educational attainment of bachelor's degree enjoy the highest average annual earnings of $83,889, while those with less than high school education earn the least with $35,417. Women with an educational attainment of graduate degree earn the most with the average annual earnings of $45,714, while those with less than high school education have the smallest earnings of $9,318.
| Educational Attainment | Male Income | Female Income |
| Less than High School | $35,417 | $9,318 |
| High School Diploma | $45,469 | $25,679 |
| College or Associate's Degree | $48,636 | $27,279 |
| Bachelor's Degree | $83,889 | $33,603 |
| Graduate Degree | $60,938 | $45,714 |
| Total | $51,141 | $27,741 |
Family Income in Atchison County
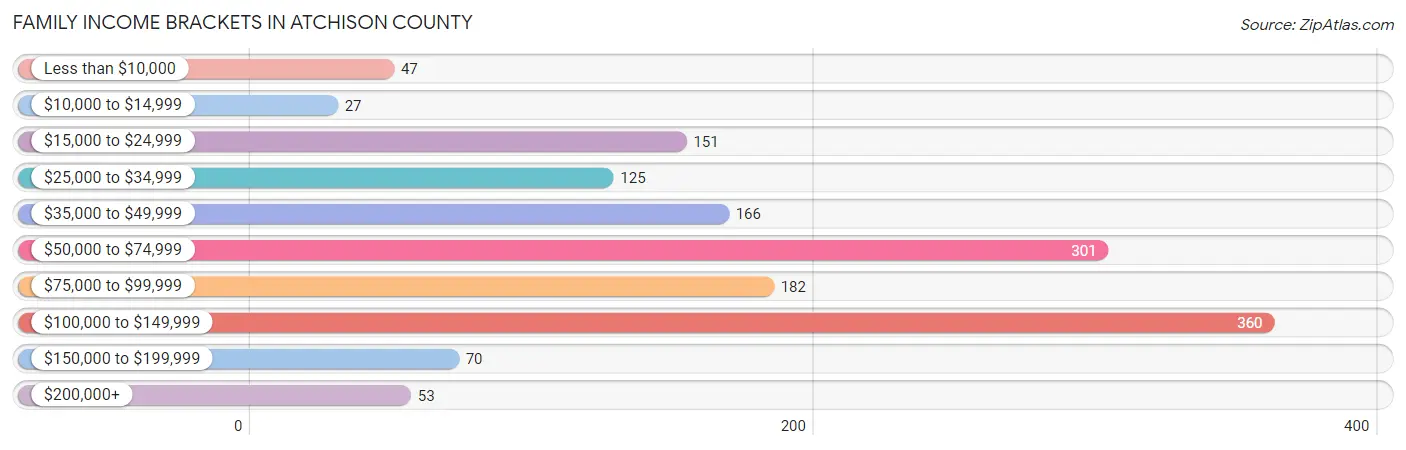
Family Income Brackets in Atchison County
According to the Atchison County family income data, there are 360 families falling into the $100,000 to $149,999 income range, which is the most common income bracket and makes up 24.3% of all families. Conversely, the $10,000 to $14,999 income bracket is the least frequent group with only 27 families (1.8%) belonging to this category.
| Income Bracket | # Families | % Families |
| Less than $10,000 | 47 | 3.2% |
| $10,000 to $14,999 | 27 | 1.8% |
| $15,000 to $24,999 | 151 | 10.2% |
| $25,000 to $34,999 | 125 | 8.4% |
| $35,000 to $49,999 | 166 | 11.2% |
| $50,000 to $74,999 | 301 | 20.3% |
| $75,000 to $99,999 | 182 | 12.3% |
| $100,000 to $149,999 | 360 | 24.3% |
| $150,000 to $199,999 | 70 | 4.7% |
| $200,000+ | 53 | 3.6% |
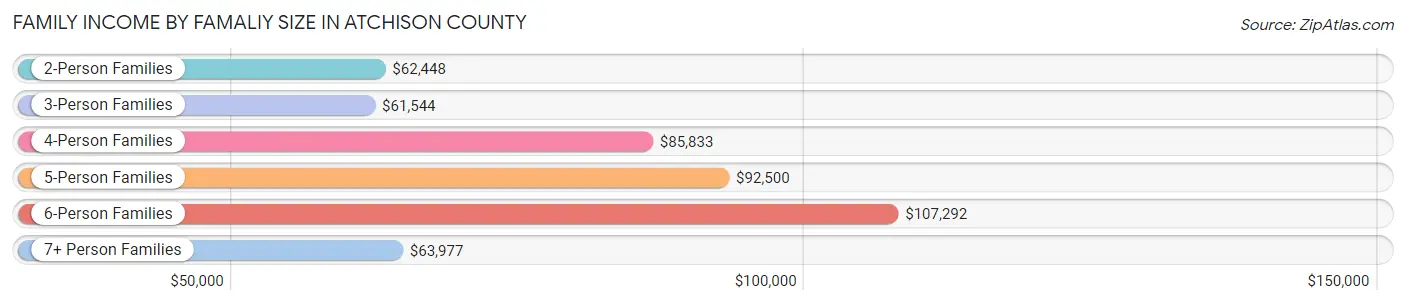
Family Income by Famaliy Size in Atchison County
6-person families (19 | 1.3%) account for the highest median family income in Atchison County with $107,292 per family, while 2-person families (927 | 62.5%) have the highest median income of $31,224 per family member.
| Income Bracket | # Families | Median Income |
| 2-Person Families | 927 (62.5%) | $62,448 |
| 3-Person Families | 239 (16.1%) | $61,544 |
| 4-Person Families | 188 (12.7%) | $85,833 |
| 5-Person Families | 82 (5.5%) | $92,500 |
| 6-Person Families | 19 (1.3%) | $107,292 |
| 7+ Person Families | 28 (1.9%) | $63,977 |
| Total | 1,483 (100.0%) | $66,893 |
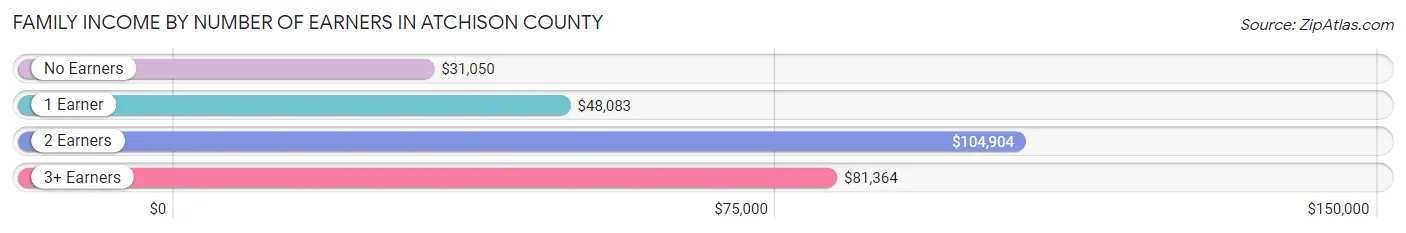
Family Income by Number of Earners in Atchison County
The median family income in Atchison County is $66,893, with families comprising 2 earners (691) having the highest median family income of $104,904, while families with no earners (251) have the lowest median family income of $31,050, accounting for 46.6% and 16.9% of families, respectively.
| Number of Earners | # Families | Median Income |
| No Earners | 251 (16.9%) | $31,050 |
| 1 Earner | 469 (31.6%) | $48,083 |
| 2 Earners | 691 (46.6%) | $104,904 |
| 3+ Earners | 72 (4.9%) | $81,364 |
| Total | 1,483 (100.0%) | $66,893 |
Household Income in Atchison County
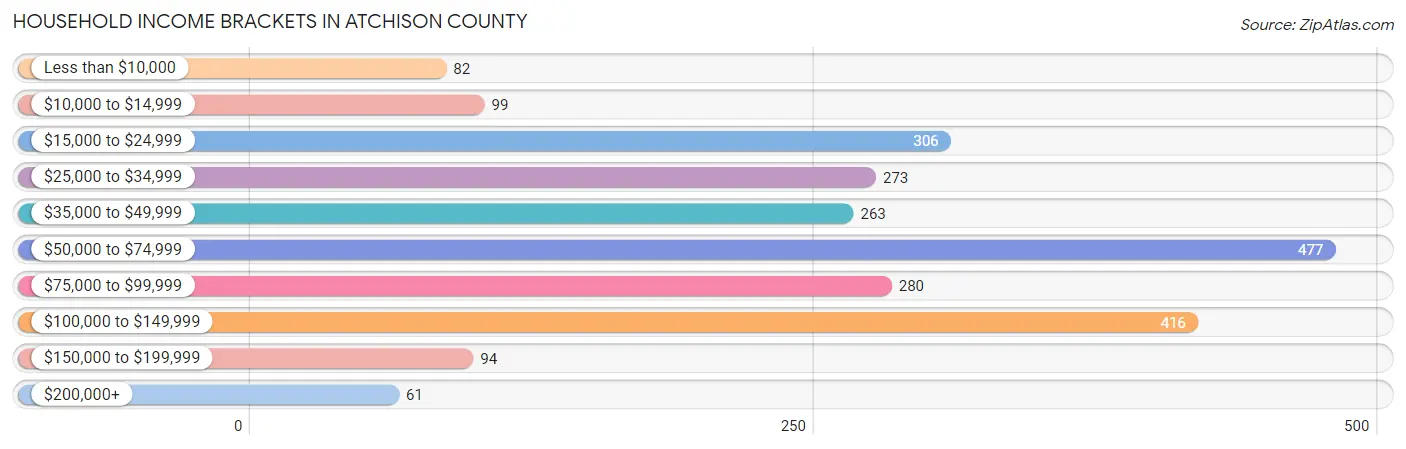
Household Income Brackets in Atchison County
With 477 households falling in the category, the $50,000 to $74,999 income range is the most frequent in Atchison County, accounting for 20.3% of all households. In contrast, only 61 households (2.6%) fall into the $200,000+ income bracket, making it the least populous group.
| Income Bracket | # Households | % Households |
| Less than $10,000 | 82 | 3.5% |
| $10,000 to $14,999 | 99 | 4.2% |
| $15,000 to $24,999 | 306 | 13.0% |
| $25,000 to $34,999 | 273 | 11.6% |
| $35,000 to $49,999 | 263 | 11.2% |
| $50,000 to $74,999 | 477 | 20.3% |
| $75,000 to $99,999 | 280 | 11.9% |
| $100,000 to $149,999 | 416 | 17.7% |
| $150,000 to $199,999 | 94 | 4.0% |
| $200,000+ | 61 | 2.6% |
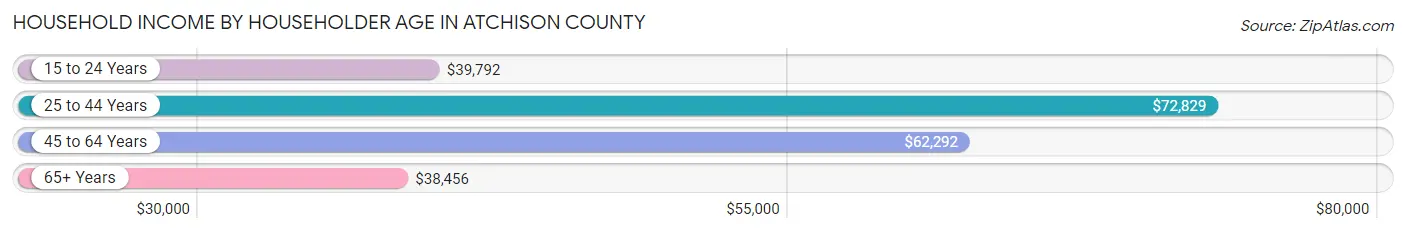
Household Income by Householder Age in Atchison County
The median household income in Atchison County is $58,521, with the highest median household income of $72,829 found in the 25 to 44 years age bracket for the primary householder. A total of 617 households (26.2%) fall into this category. Meanwhile, the 65+ years age bracket for the primary householder has the lowest median household income of $38,456, with 823 households (35.0%) in this group.
| Income Bracket | # Households | Median Income |
| 15 to 24 Years | 87 (3.7%) | $39,792 |
| 25 to 44 Years | 617 (26.2%) | $72,829 |
| 45 to 64 Years | 824 (35.0%) | $62,292 |
| 65+ Years | 823 (35.0%) | $38,456 |
| Total | 2,351 (100.0%) | $58,521 |
Poverty in Atchison County
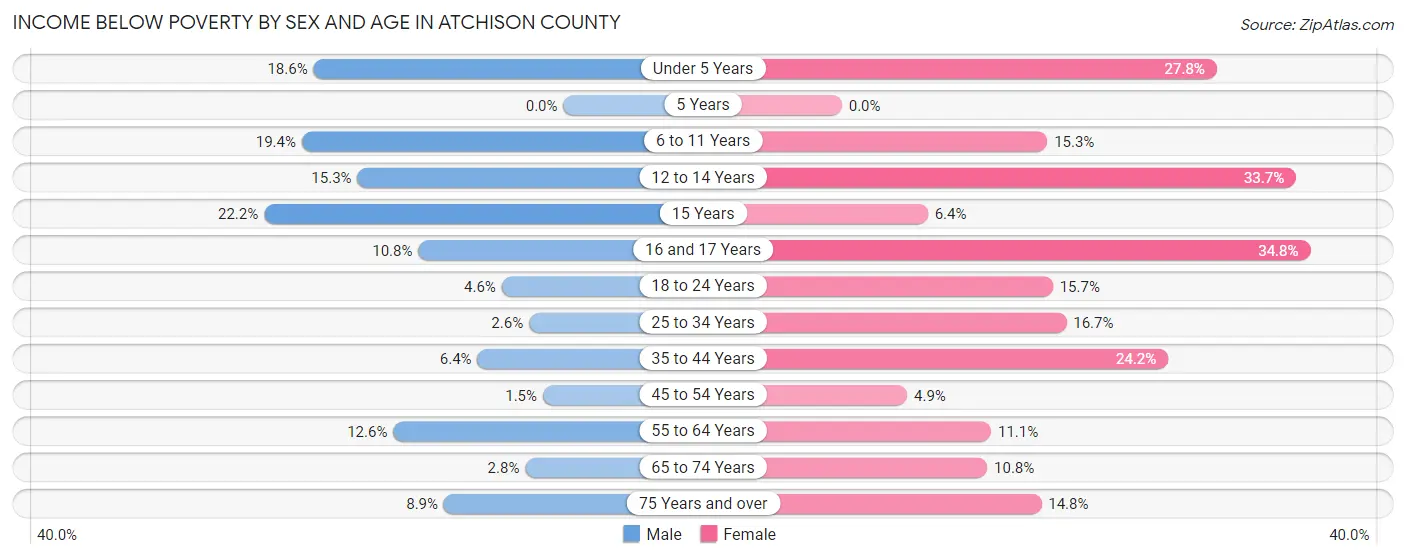
Income Below Poverty by Sex and Age in Atchison County
With 8.3% poverty level for males and 15.0% for females among the residents of Atchison County, 15 year old males and 16 and 17 year old females are the most vulnerable to poverty, with 8 males (22.2%) and 16 females (34.8%) in their respective age groups living below the poverty level.
| Age Bracket | Male | Female |
| Under 5 Years | 23 (18.5%) | 32 (27.8%) |
| 5 Years | 0 (0.0%) | 0 (0.0%) |
| 6 to 11 Years | 47 (19.4%) | 27 (15.2%) |
| 12 to 14 Years | 13 (15.3%) | 29 (33.7%) |
| 15 Years | 8 (22.2%) | 3 (6.4%) |
| 16 and 17 Years | 7 (10.8%) | 16 (34.8%) |
| 18 to 24 Years | 7 (4.6%) | 26 (15.7%) |
| 25 to 34 Years | 7 (2.5%) | 45 (16.7%) |
| 35 to 44 Years | 19 (6.4%) | 62 (24.2%) |
| 45 to 54 Years | 5 (1.5%) | 15 (4.9%) |
| 55 to 64 Years | 50 (12.6%) | 42 (11.1%) |
| 65 to 74 Years | 10 (2.8%) | 37 (10.8%) |
| 75 Years and over | 22 (8.9%) | 48 (14.8%) |
| Total | 218 (8.3%) | 382 (15.0%) |
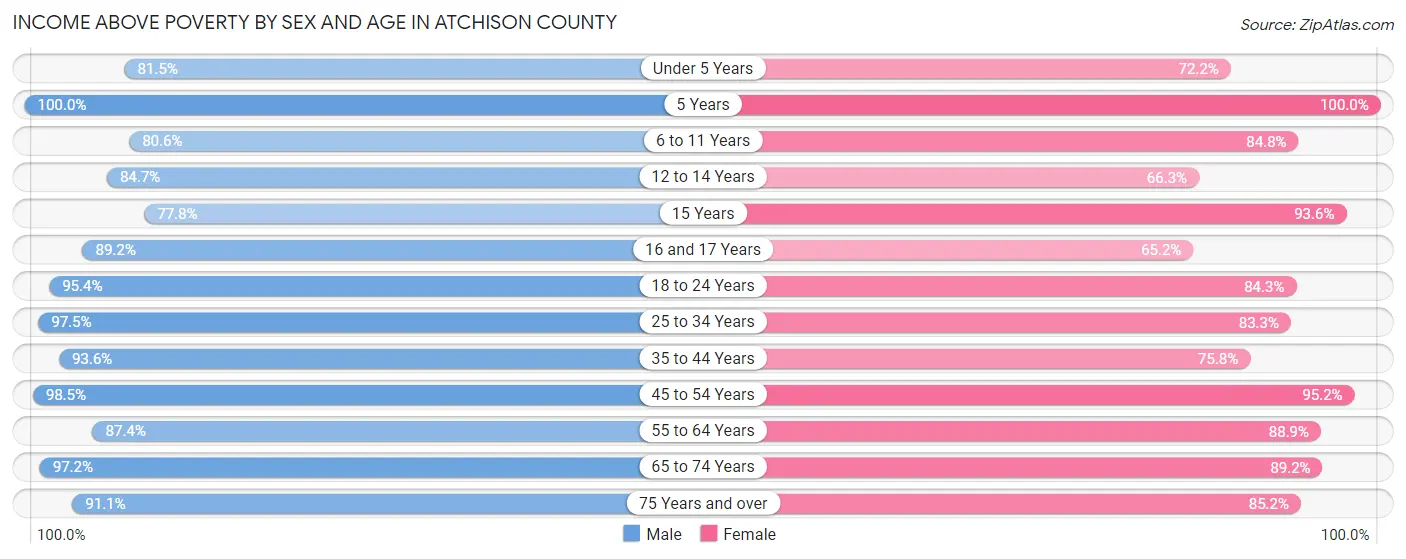
Income Above Poverty by Sex and Age in Atchison County
According to the poverty statistics in Atchison County, males aged 5 years and females aged 5 years are the age groups that are most secure financially, with 100.0% of males and 100.0% of females in these age groups living above the poverty line.
| Age Bracket | Male | Female |
| Under 5 Years | 101 (81.5%) | 83 (72.2%) |
| 5 Years | 30 (100.0%) | 21 (100.0%) |
| 6 to 11 Years | 195 (80.6%) | 150 (84.8%) |
| 12 to 14 Years | 72 (84.7%) | 57 (66.3%) |
| 15 Years | 28 (77.8%) | 44 (93.6%) |
| 16 and 17 Years | 58 (89.2%) | 30 (65.2%) |
| 18 to 24 Years | 146 (95.4%) | 140 (84.3%) |
| 25 to 34 Years | 267 (97.5%) | 225 (83.3%) |
| 35 to 44 Years | 279 (93.6%) | 194 (75.8%) |
| 45 to 54 Years | 325 (98.5%) | 294 (95.2%) |
| 55 to 64 Years | 346 (87.4%) | 337 (88.9%) |
| 65 to 74 Years | 343 (97.2%) | 306 (89.2%) |
| 75 Years and over | 226 (91.1%) | 276 (85.2%) |
| Total | 2,416 (91.7%) | 2,157 (85.0%) |
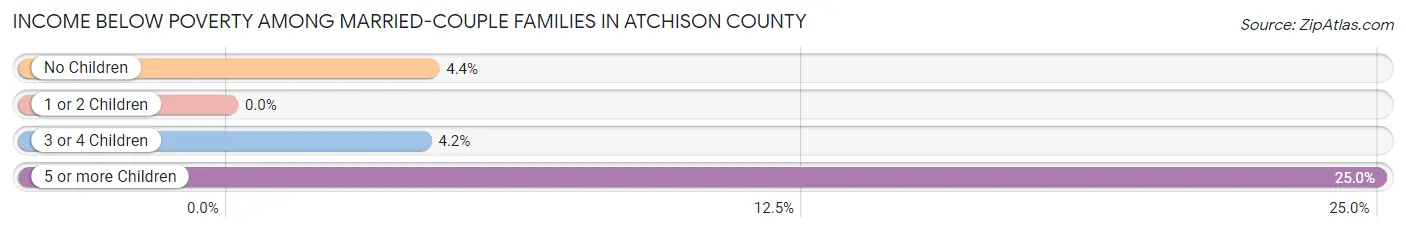
Income Below Poverty Among Married-Couple Families in Atchison County
The poverty statistics for married-couple families in Atchison County show that 3.4% or 39 of the total 1,138 families live below the poverty line. Families with 5 or more children have the highest poverty rate of 25.0%, comprising of 1 families. On the other hand, families with 1 or 2 children have the lowest poverty rate of 0.0%, which includes 0 families.
| Children | Above Poverty | Below Poverty |
| No Children | 743 (95.6%) | 34 (4.4%) |
| 1 or 2 Children | 262 (100.0%) | 0 (0.0%) |
| 3 or 4 Children | 91 (95.8%) | 4 (4.2%) |
| 5 or more Children | 3 (75.0%) | 1 (25.0%) |
| Total | 1,099 (96.6%) | 39 (3.4%) |
Income Below Poverty Among Single-Parent Households in Atchison County
According to the poverty data in Atchison County, 14.5% or 17 single-father households and 40.4% or 92 single-mother households are living below the poverty line. Among single-father households, those with 3 or 4 children have the highest poverty rate, with 6 households (35.3%) experiencing poverty. Likewise, among single-mother households, those with 3 or 4 children have the highest poverty rate, with 17 households (100.0%) falling below the poverty line.
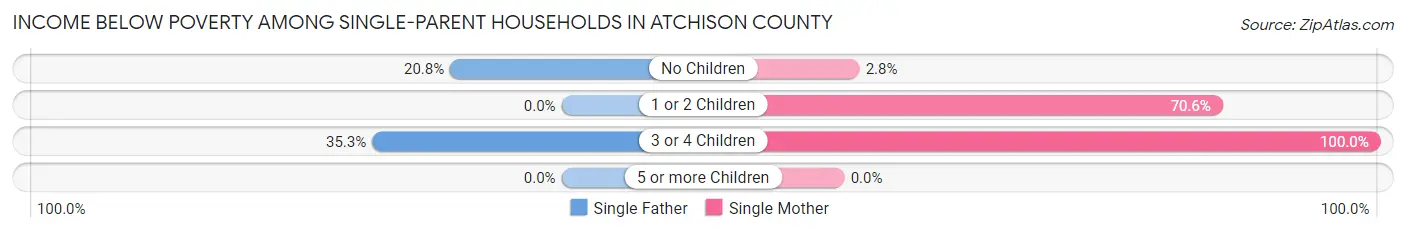
| Children | Single Father | Single Mother |
| No Children | 11 (20.7%) | 3 (2.8%) |
| 1 or 2 Children | 0 (0.0%) | 72 (70.6%) |
| 3 or 4 Children | 6 (35.3%) | 17 (100.0%) |
| 5 or more Children | 0 (0.0%) | 0 (0.0%) |
| Total | 17 (14.5%) | 92 (40.4%) |
Income Below Poverty Among Married-Couple vs Single-Parent Households in Atchison County
The poverty data for Atchison County shows that 39 of the married-couple family households (3.4%) and 109 of the single-parent households (31.6%) are living below the poverty level. Within the married-couple family households, those with 5 or more children have the highest poverty rate, with 1 households (25.0%) falling below the poverty line. Among the single-parent households, those with 3 or 4 children have the highest poverty rate, with 23 household (67.6%) living below poverty.
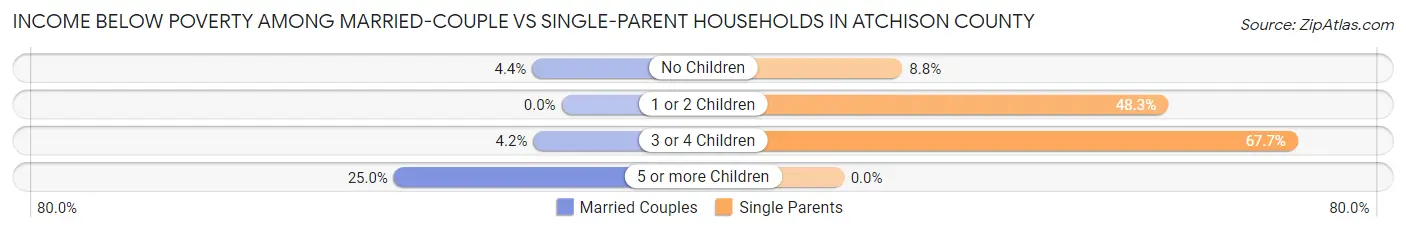
| Children | Married-Couple Families | Single-Parent Households |
| No Children | 34 (4.4%) | 14 (8.7%) |
| 1 or 2 Children | 0 (0.0%) | 72 (48.3%) |
| 3 or 4 Children | 4 (4.2%) | 23 (67.6%) |
| 5 or more Children | 1 (25.0%) | 0 (0.0%) |
| Total | 39 (3.4%) | 109 (31.6%) |
Race in Atchison County
The most populous races in Atchison County are White / Caucasian (5,003 | 94.9%), Two or more Races (181 | 3.4%), and Hispanic or Latino (85 | 1.6%).
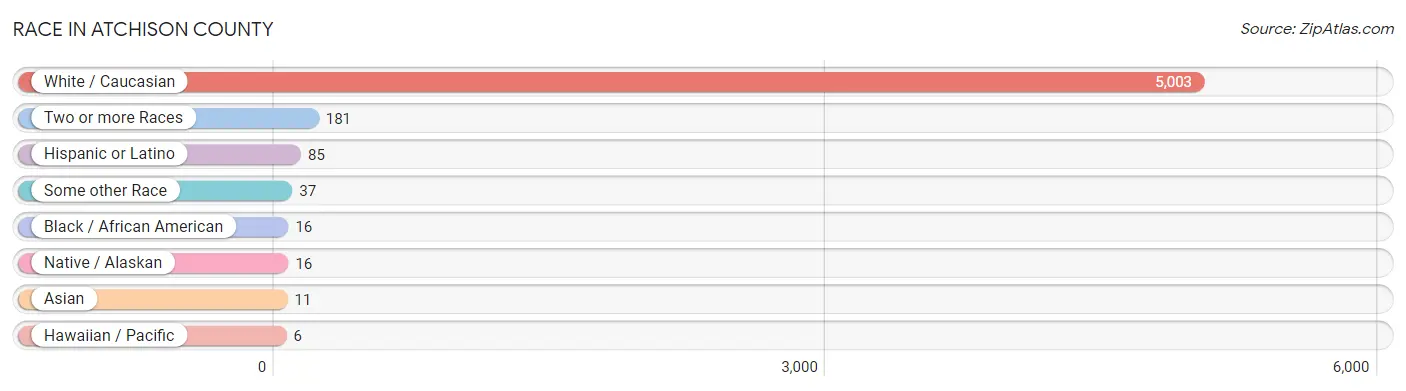
| Race | # Population | % Population |
| Asian | 11 | 0.2% |
| Black / African American | 16 | 0.3% |
| Hawaiian / Pacific | 6 | 0.1% |
| Hispanic or Latino | 85 | 1.6% |
| Native / Alaskan | 16 | 0.3% |
| White / Caucasian | 5,003 | 94.9% |
| Two or more Races | 181 | 3.4% |
| Some other Race | 37 | 0.7% |
| Total | 5,270 | 100.0% |
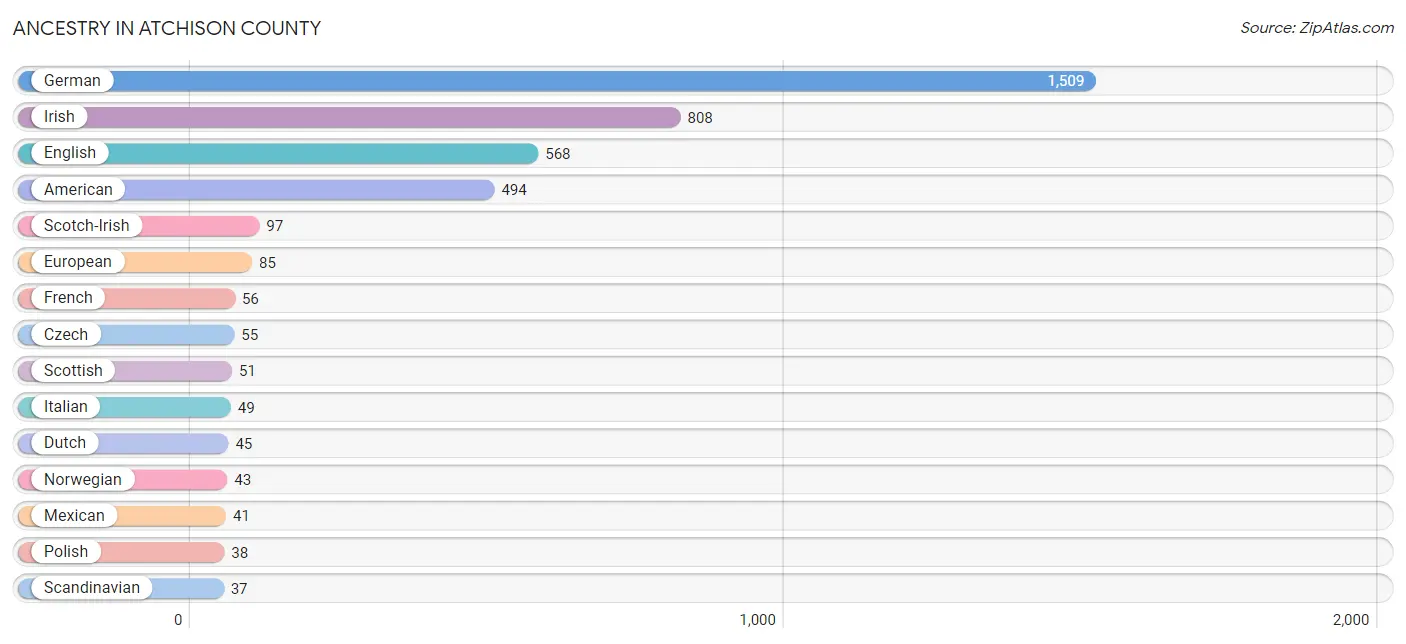
Ancestry in Atchison County
The most populous ancestries reported in Atchison County are German (1,509 | 28.6%), Irish (808 | 15.3%), English (568 | 10.8%), American (494 | 9.4%), and Scotch-Irish (97 | 1.8%), together accounting for 65.9% of all Atchison County residents.
| Ancestry | # Population | % Population |
| American | 494 | 9.4% |
| Bhutanese | 4 | 0.1% |
| Blackfeet | 8 | 0.2% |
| British | 15 | 0.3% |
| Central American | 1 | 0.0% |
| Central American Indian | 2 | 0.0% |
| Cherokee | 7 | 0.1% |
| Cheyenne | 3 | 0.1% |
| Crow | 4 | 0.1% |
| Czech | 55 | 1.0% |
| Danish | 12 | 0.2% |
| Dutch | 45 | 0.9% |
| Eastern European | 7 | 0.1% |
| English | 568 | 10.8% |
| European | 85 | 1.6% |
| French | 56 | 1.1% |
| German | 1,509 | 28.6% |
| Greek | 7 | 0.1% |
| Guatemalan | 1 | 0.0% |
| Irish | 808 | 15.3% |
| Iroquois | 3 | 0.1% |
| Italian | 49 | 0.9% |
| Korean | 5 | 0.1% |
| Mexican | 41 | 0.8% |
| Native Hawaiian | 17 | 0.3% |
| Northern European | 21 | 0.4% |
| Norwegian | 43 | 0.8% |
| Pennsylvania German | 2 | 0.0% |
| Polish | 38 | 0.7% |
| Puerto Rican | 8 | 0.2% |
| Romanian | 1 | 0.0% |
| Russian | 31 | 0.6% |
| Scandinavian | 37 | 0.7% |
| Scotch-Irish | 97 | 1.8% |
| Scottish | 51 | 1.0% |
| Sioux | 17 | 0.3% |
| Slavic | 1 | 0.0% |
| Slovak | 1 | 0.0% |
| Spanish | 14 | 0.3% |
| Sri Lankan | 6 | 0.1% |
| Swedish | 17 | 0.3% |
| Swiss | 12 | 0.2% |
| Welsh | 25 | 0.5% | View All 43 Rows |
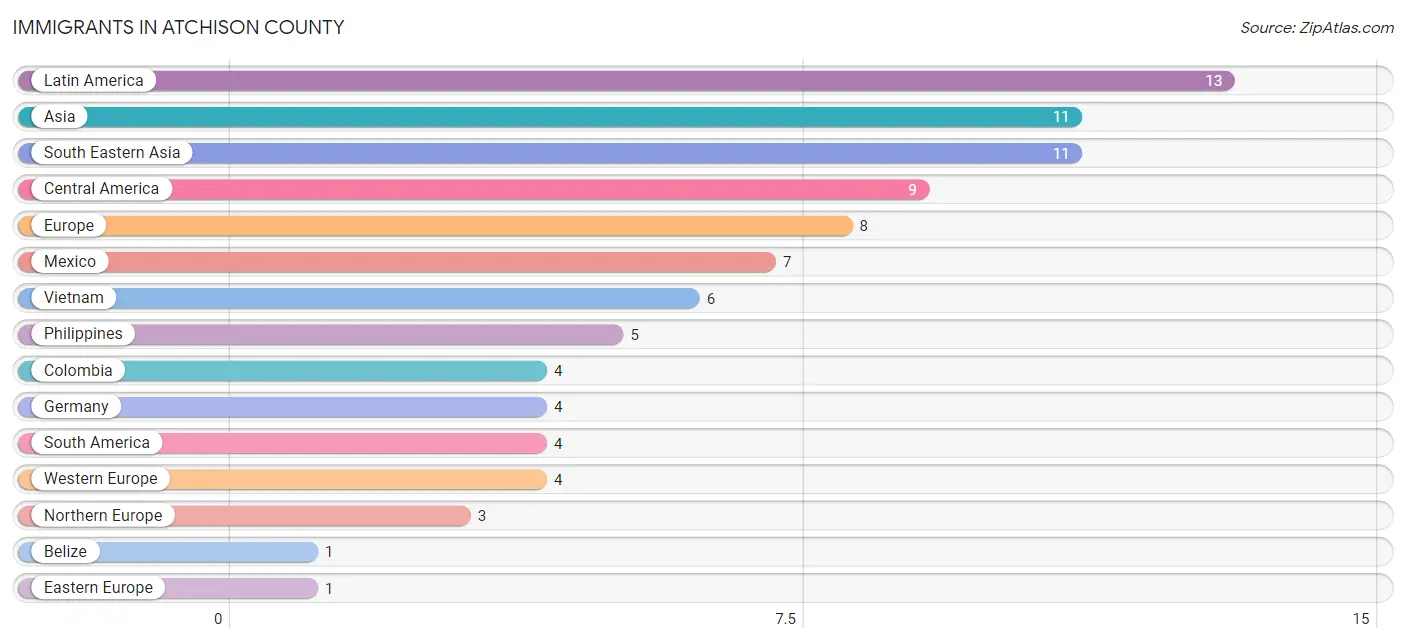
Immigrants in Atchison County
The most numerous immigrant groups reported in Atchison County came from Latin America (13 | 0.3%), Asia (11 | 0.2%), South Eastern Asia (11 | 0.2%), Central America (9 | 0.2%), and Europe (8 | 0.2%), together accounting for 1.0% of all Atchison County residents.
| Immigration Origin | # Population | % Population |
| Asia | 11 | 0.2% |
| Belize | 1 | 0.0% |
| Central America | 9 | 0.2% |
| Colombia | 4 | 0.1% |
| Eastern Europe | 1 | 0.0% |
| Europe | 8 | 0.2% |
| Germany | 4 | 0.1% |
| Guatemala | 1 | 0.0% |
| Latin America | 13 | 0.3% |
| Mexico | 7 | 0.1% |
| Northern Europe | 3 | 0.1% |
| Philippines | 5 | 0.1% |
| Romania | 1 | 0.0% |
| South America | 4 | 0.1% |
| South Eastern Asia | 11 | 0.2% |
| Vietnam | 6 | 0.1% |
| Western Europe | 4 | 0.1% | View All 17 Rows |
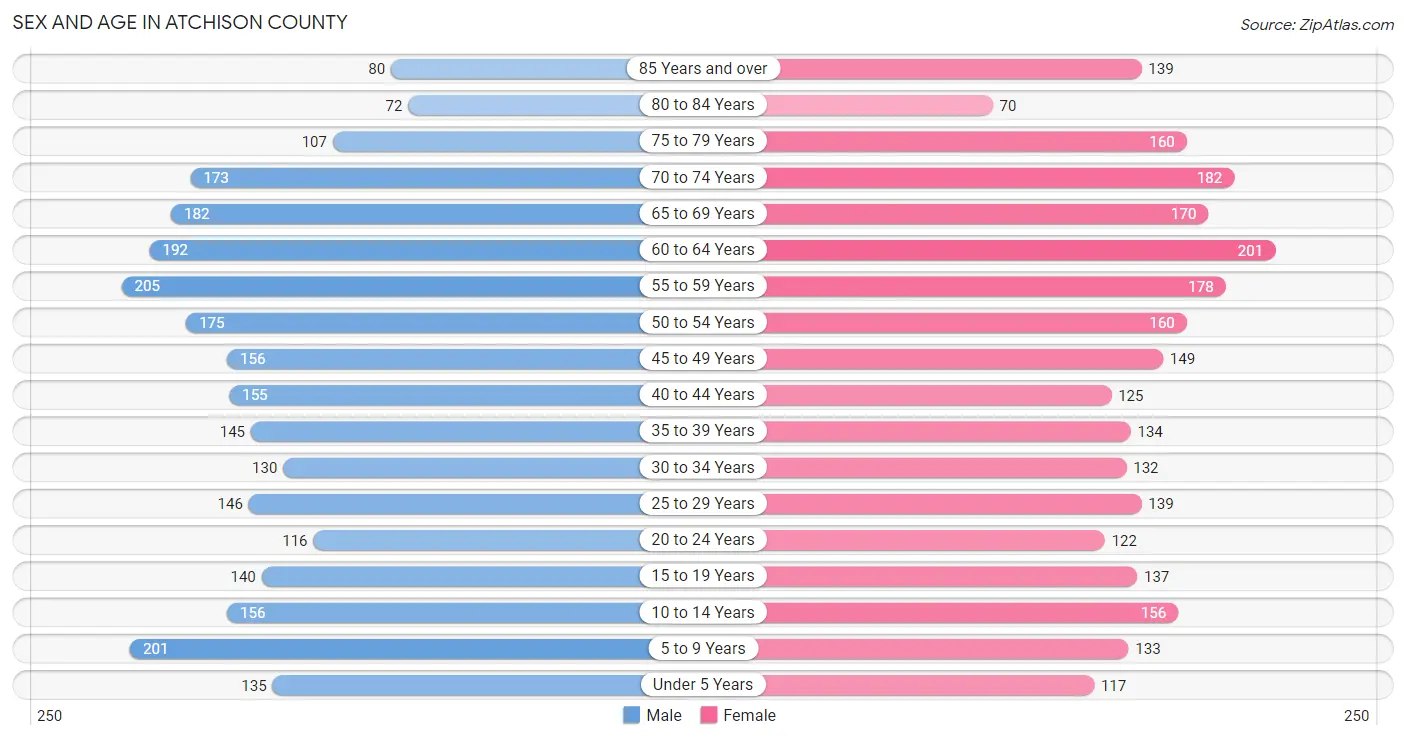
Sex and Age in Atchison County
Sex and Age in Atchison County
The most populous age groups in Atchison County are 55 to 59 Years (205 | 7.7%) for men and 60 to 64 Years (201 | 7.7%) for women.
| Age Bracket | Male | Female |
| Under 5 Years | 135 (5.1%) | 117 (4.5%) |
| 5 to 9 Years | 201 (7.5%) | 133 (5.1%) |
| 10 to 14 Years | 156 (5.9%) | 156 (6.0%) |
| 15 to 19 Years | 140 (5.2%) | 137 (5.3%) |
| 20 to 24 Years | 116 (4.3%) | 122 (4.7%) |
| 25 to 29 Years | 146 (5.5%) | 139 (5.3%) |
| 30 to 34 Years | 130 (4.9%) | 132 (5.1%) |
| 35 to 39 Years | 145 (5.4%) | 134 (5.1%) |
| 40 to 44 Years | 155 (5.8%) | 125 (4.8%) |
| 45 to 49 Years | 156 (5.9%) | 149 (5.7%) |
| 50 to 54 Years | 175 (6.6%) | 160 (6.1%) |
| 55 to 59 Years | 205 (7.7%) | 178 (6.8%) |
| 60 to 64 Years | 192 (7.2%) | 201 (7.7%) |
| 65 to 69 Years | 182 (6.8%) | 170 (6.5%) |
| 70 to 74 Years | 173 (6.5%) | 182 (7.0%) |
| 75 to 79 Years | 107 (4.0%) | 160 (6.1%) |
| 80 to 84 Years | 72 (2.7%) | 70 (2.7%) |
| 85 Years and over | 80 (3.0%) | 139 (5.3%) |
| Total | 2,666 (100.0%) | 2,604 (100.0%) |
Families and Households in Atchison County
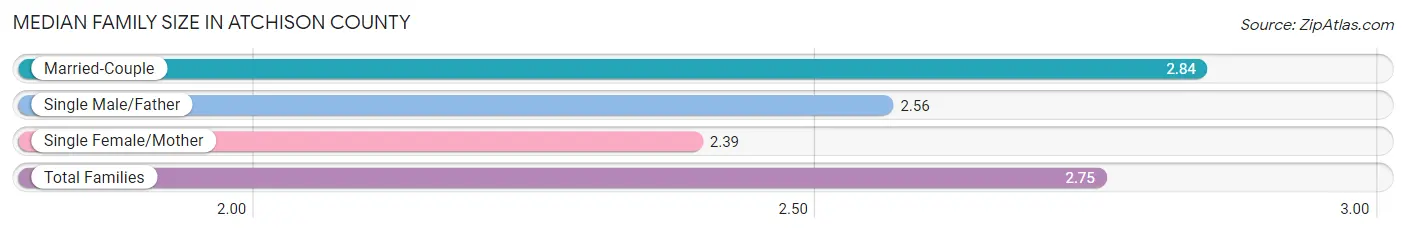
Median Family Size in Atchison County
The median family size in Atchison County is 2.75 persons per family, with married-couple families (1,138 | 76.7%) accounting for the largest median family size of 2.84 persons per family. On the other hand, single female/mother families (228 | 15.4%) represent the smallest median family size with 2.39 persons per family.
| Family Type | # Families | Family Size |
| Married-Couple | 1,138 (76.7%) | 2.84 |
| Single Male/Father | 117 (7.9%) | 2.56 |
| Single Female/Mother | 228 (15.4%) | 2.39 |
| Total Families | 1,483 (100.0%) | 2.75 |
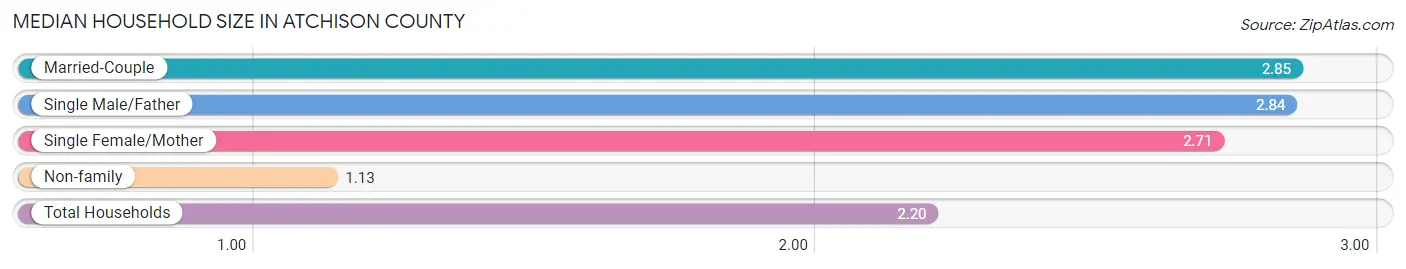
Median Household Size in Atchison County
The median household size in Atchison County is 2.20 persons per household, with married-couple households (1,138 | 48.4%) accounting for the largest median household size of 2.85 persons per household. non-family households (868 | 36.9%) represent the smallest median household size with 1.13 persons per household.
| Household Type | # Households | Household Size |
| Married-Couple | 1,138 (48.4%) | 2.85 |
| Single Male/Father | 117 (5.0%) | 2.84 |
| Single Female/Mother | 228 (9.7%) | 2.71 |
| Non-family | 868 (36.9%) | 1.13 |
| Total Households | 2,351 (100.0%) | 2.20 |
Household Size by Marriage Status in Atchison County
Out of a total of 2,351 households in Atchison County, 1,483 (63.1%) are family households, while 868 (36.9%) are nonfamily households. The most numerous type of family households are 2-person households, comprising 876, and the most common type of nonfamily households are 1-person households, comprising 769.
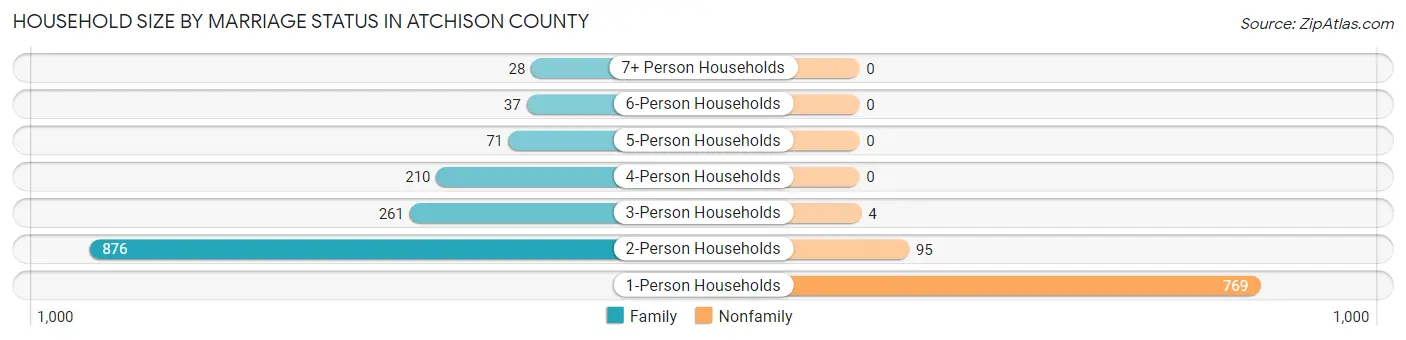
| Household Size | Family Households | Nonfamily Households |
| 1-Person Households | - | 769 (32.7%) |
| 2-Person Households | 876 (37.3%) | 95 (4.0%) |
| 3-Person Households | 261 (11.1%) | 4 (0.2%) |
| 4-Person Households | 210 (8.9%) | 0 (0.0%) |
| 5-Person Households | 71 (3.0%) | 0 (0.0%) |
| 6-Person Households | 37 (1.6%) | 0 (0.0%) |
| 7+ Person Households | 28 (1.2%) | 0 (0.0%) |
| Total | 1,483 (63.1%) | 868 (36.9%) |
Female Fertility in Atchison County
Fertility by Age in Atchison County
Average fertility rate in Atchison County is 41.0 births per 1,000 women. Women in the age bracket of 20 to 34 years have the highest fertility rate with 99.0 births per 1,000 women. Women in the age bracket of 20 to 34 years acount for 97.5% of all women with births.
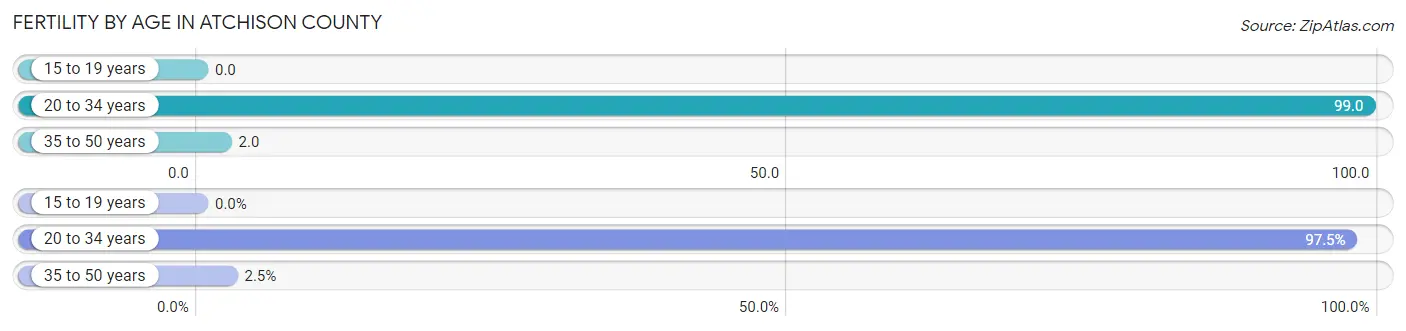
| Age Bracket | Women with Births | Births / 1,000 Women |
| 15 to 19 years | 0 (0.0%) | 0.0 |
| 20 to 34 years | 39 (97.5%) | 99.0 |
| 35 to 50 years | 1 (2.5%) | 2.0 |
| Total | 40 (100.0%) | 41.0 |
Fertility by Age by Marriage Status in Atchison County
55.0% of women with births (40) in Atchison County are married. The highest percentage of unmarried women with births falls into 35 to 50 years age bracket with 100.0% of them unmarried at the time of birth, while the lowest percentage of unmarried women with births belong to 20 to 34 years age bracket with 43.6% of them unmarried.
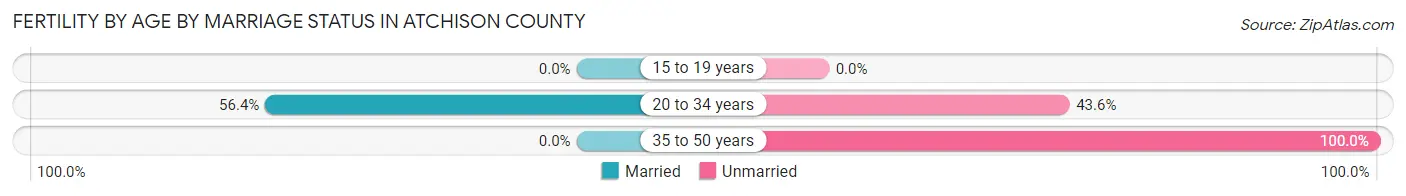
| Age Bracket | Married | Unmarried |
| 15 to 19 years | 0 (0.0%) | 0 (0.0%) |
| 20 to 34 years | 22 (56.4%) | 17 (43.6%) |
| 35 to 50 years | 0 (0.0%) | 1 (100.0%) |
| Total | 22 (55.0%) | 18 (45.0%) |
Fertility by Education in Atchison County
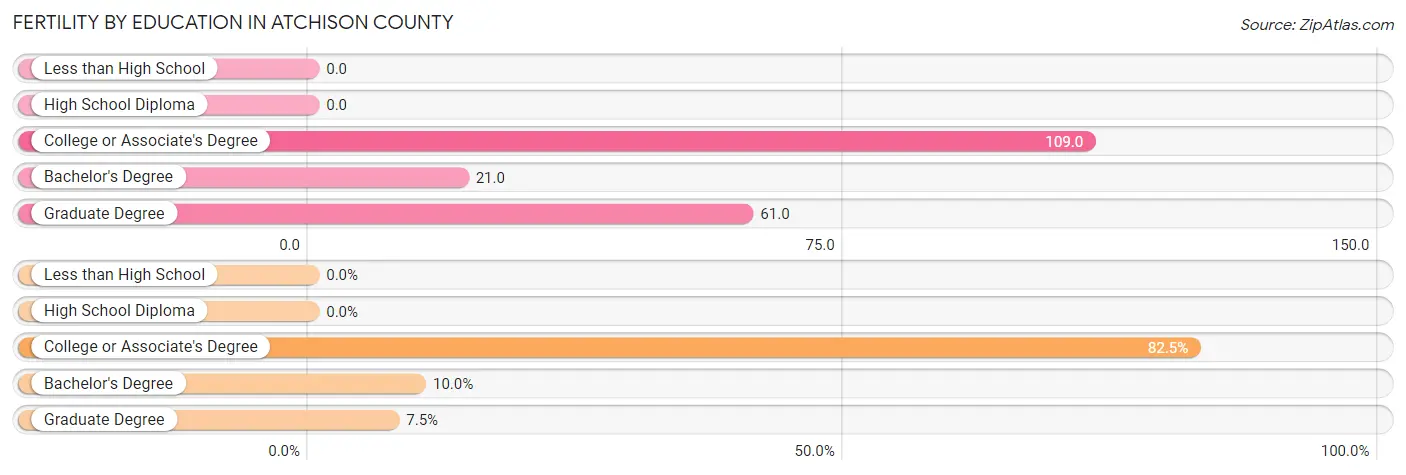
| Educational Attainment | Women with Births | Births / 1,000 Women |
| Less than High School | 0 (0.0%) | 0.0 |
| High School Diploma | 0 (0.0%) | 0.0 |
| College or Associate's Degree | 33 (82.5%) | 109.0 |
| Bachelor's Degree | 4 (10.0%) | 21.0 |
| Graduate Degree | 3 (7.5%) | 61.0 |
| Total | 40 (100.0%) | 41.0 |
Fertility by Education by Marriage Status in Atchison County
45.0% of women with births in Atchison County are unmarried. Women with the educational attainment of graduate degree are most likely to be married with 100.0% of them married at childbirth, while women with the educational attainment of college or associate's degree are least likely to be married with 51.5% of them unmarried at childbirth.
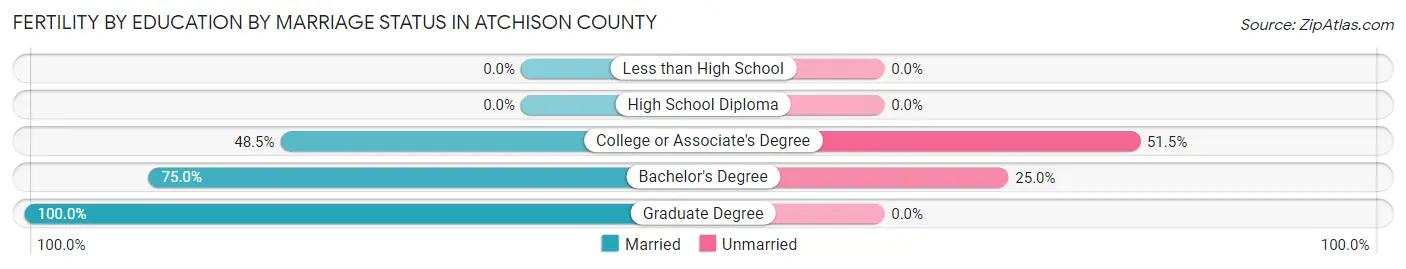
| Educational Attainment | Married | Unmarried |
| Less than High School | 0 (0.0%) | 0 (0.0%) |
| High School Diploma | 0 (0.0%) | 0 (0.0%) |
| College or Associate's Degree | 16 (48.5%) | 17 (51.5%) |
| Bachelor's Degree | 3 (75.0%) | 1 (25.0%) |
| Graduate Degree | 3 (100.0%) | 0 (0.0%) |
| Total | 22 (55.0%) | 18 (45.0%) |
Employment Characteristics in Atchison County
Employment by Class of Employer in Atchison County
Among the 2,521 employed individuals in Atchison County, private company employees (1,350 | 53.5%), self-employed (not incorporated) (341 | 13.5%), and not-for-profit organizations (250 | 9.9%) make up the most common classes of employment.
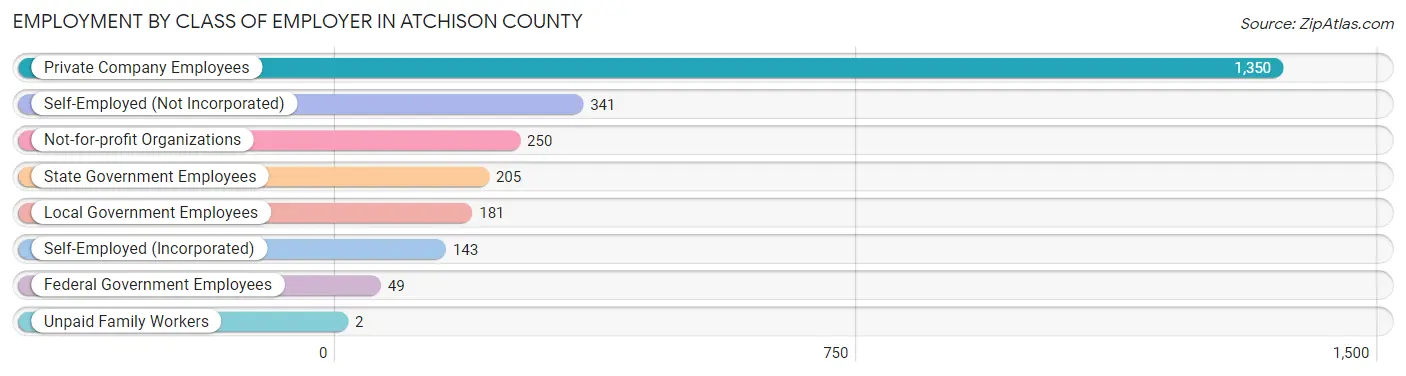
| Employer Class | # Employees | % Employees |
| Private Company Employees | 1,350 | 53.5% |
| Self-Employed (Incorporated) | 143 | 5.7% |
| Self-Employed (Not Incorporated) | 341 | 13.5% |
| Not-for-profit Organizations | 250 | 9.9% |
| Local Government Employees | 181 | 7.2% |
| State Government Employees | 205 | 8.1% |
| Federal Government Employees | 49 | 1.9% |
| Unpaid Family Workers | 2 | 0.1% |
| Total | 2,521 | 100.0% |
Employment Status by Age in Atchison County
According to the labor force statistics for Atchison County, out of the total population over 16 years of age (4,289), 60.9% or 2,612 individuals are in the labor force, with 2.6% or 68 of them unemployed. The age group with the highest labor force participation rate is 35 to 44 years, with 92.1% or 515 individuals in the labor force. Within the labor force, the 20 to 24 years age range has the highest percentage of unemployed individuals, with 5.9% or 12 of them being unemployed.
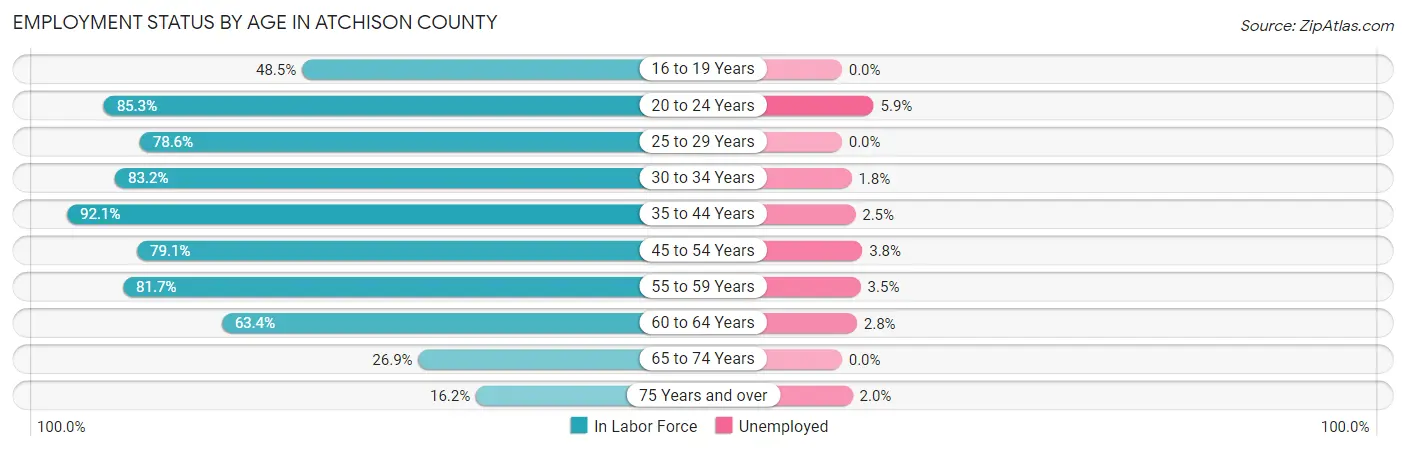
| Age Bracket | In Labor Force | Unemployed |
| 16 to 19 Years | 94 (48.5%) | 0 (0.0%) |
| 20 to 24 Years | 203 (85.3%) | 12 (5.9%) |
| 25 to 29 Years | 224 (78.6%) | 0 (0.0%) |
| 30 to 34 Years | 218 (83.2%) | 4 (1.8%) |
| 35 to 44 Years | 515 (92.1%) | 13 (2.5%) |
| 45 to 54 Years | 506 (79.1%) | 19 (3.8%) |
| 55 to 59 Years | 313 (81.7%) | 11 (3.5%) |
| 60 to 64 Years | 249 (63.4%) | 7 (2.8%) |
| 65 to 74 Years | 190 (26.9%) | 0 (0.0%) |
| 75 Years and over | 102 (16.2%) | 2 (2.0%) |
| Total | 2,612 (60.9%) | 68 (2.6%) |
Employment Status by Educational Attainment in Atchison County
According to labor force statistics for Atchison County, 80.3% of individuals (2,025) out of the total population between 25 and 64 years of age (2,522) are in the labor force, with 2.7% or 55 of them being unemployed. The group with the highest labor force participation rate are those with the educational attainment of bachelor's degree or higher, with 89.7% or 529 individuals in the labor force. Within the labor force, individuals with college / associate degree education have the highest percentage of unemployment, with 7.4% or 39 of them being unemployed.
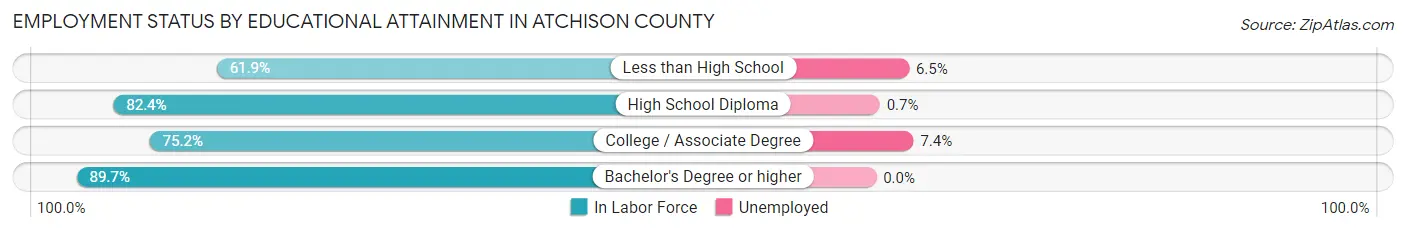
| Educational Attainment | In Labor Force | Unemployed |
| Less than High School | 138 (61.9%) | 14 (6.5%) |
| High School Diploma | 829 (82.4%) | 7 (0.7%) |
| College / Associate Degree | 529 (75.2%) | 52 (7.4%) |
| Bachelor's Degree or higher | 529 (89.7%) | 0 (0.0%) |
| Total | 2,025 (80.3%) | 68 (2.7%) |
Employment Occupations by Sex in Atchison County
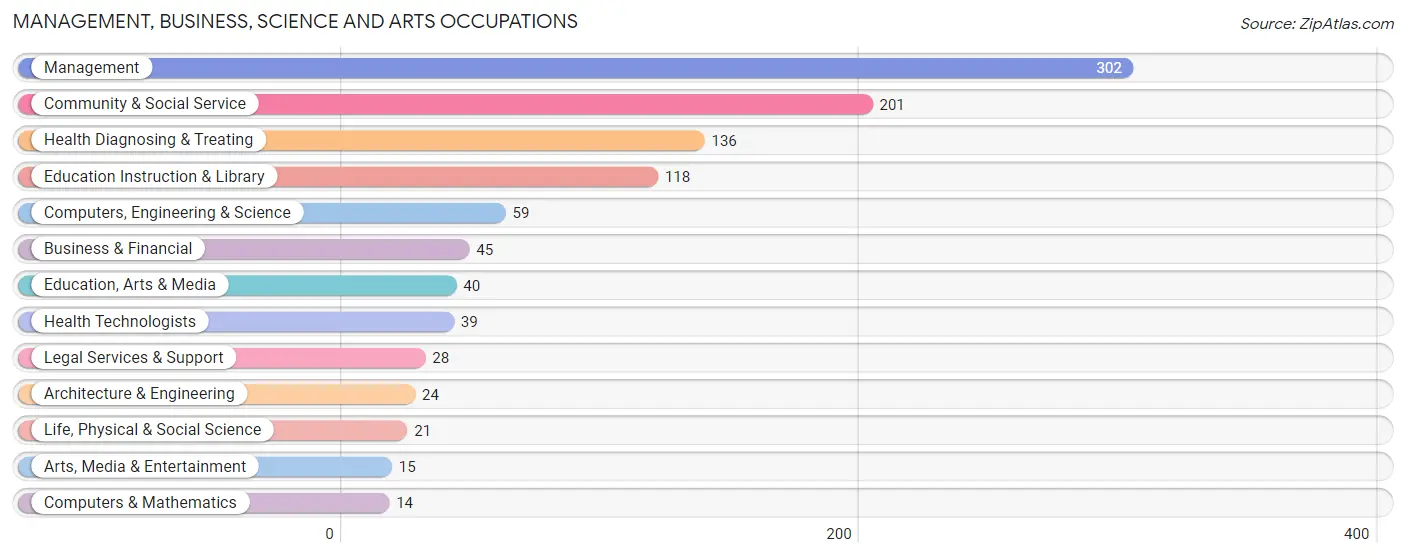
Management, Business, Science and Arts Occupations
The most common Management, Business, Science and Arts occupations in Atchison County are Management (302 | 11.9%), Community & Social Service (201 | 7.9%), Health Diagnosing & Treating (136 | 5.3%), Education Instruction & Library (118 | 4.6%), and Computers, Engineering & Science (59 | 2.3%).
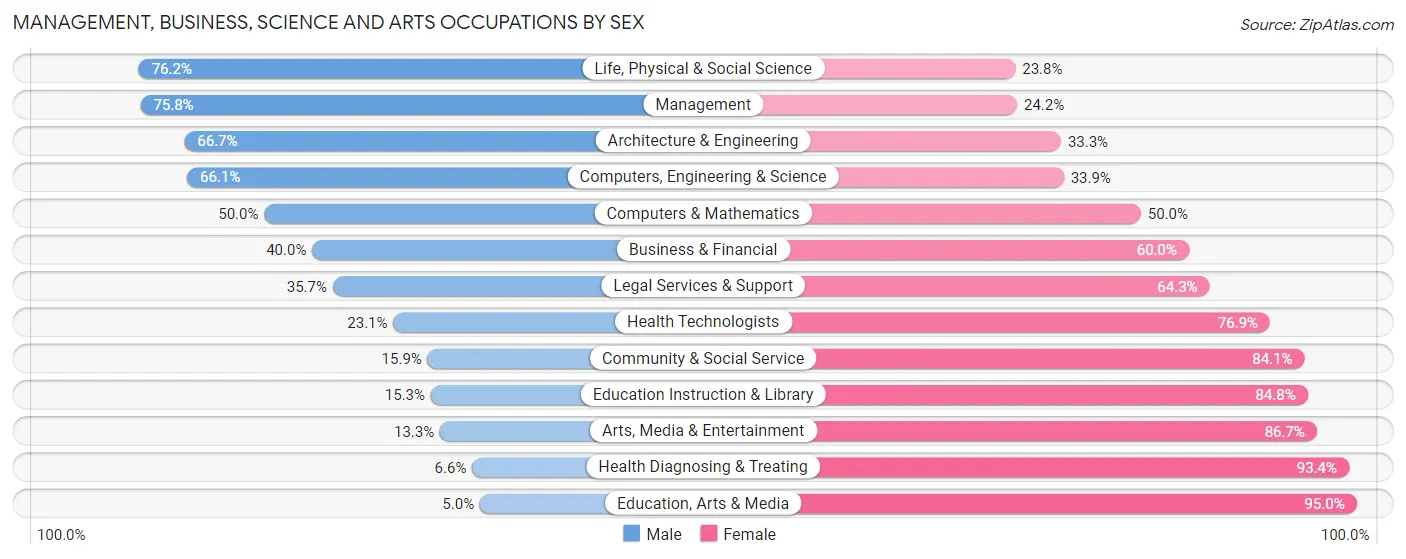
Management, Business, Science and Arts Occupations by Sex
Within the Management, Business, Science and Arts occupations in Atchison County, the most male-oriented occupations are Life, Physical & Social Science (76.2%), Management (75.8%), and Architecture & Engineering (66.7%), while the most female-oriented occupations are Education, Arts & Media (95.0%), Health Diagnosing & Treating (93.4%), and Arts, Media & Entertainment (86.7%).
| Occupation | Male | Female |
| Management | 229 (75.8%) | 73 (24.2%) |
| Business & Financial | 18 (40.0%) | 27 (60.0%) |
| Computers, Engineering & Science | 39 (66.1%) | 20 (33.9%) |
| Computers & Mathematics | 7 (50.0%) | 7 (50.0%) |
| Architecture & Engineering | 16 (66.7%) | 8 (33.3%) |
| Life, Physical & Social Science | 16 (76.2%) | 5 (23.8%) |
| Community & Social Service | 32 (15.9%) | 169 (84.1%) |
| Education, Arts & Media | 2 (5.0%) | 38 (95.0%) |
| Legal Services & Support | 10 (35.7%) | 18 (64.3%) |
| Education Instruction & Library | 18 (15.2%) | 100 (84.8%) |
| Arts, Media & Entertainment | 2 (13.3%) | 13 (86.7%) |
| Health Diagnosing & Treating | 9 (6.6%) | 127 (93.4%) |
| Health Technologists | 9 (23.1%) | 30 (76.9%) |
| Total (Category) | 327 (44.0%) | 416 (56.0%) |
| Total (Overall) | 1,432 (56.2%) | 1,114 (43.8%) |
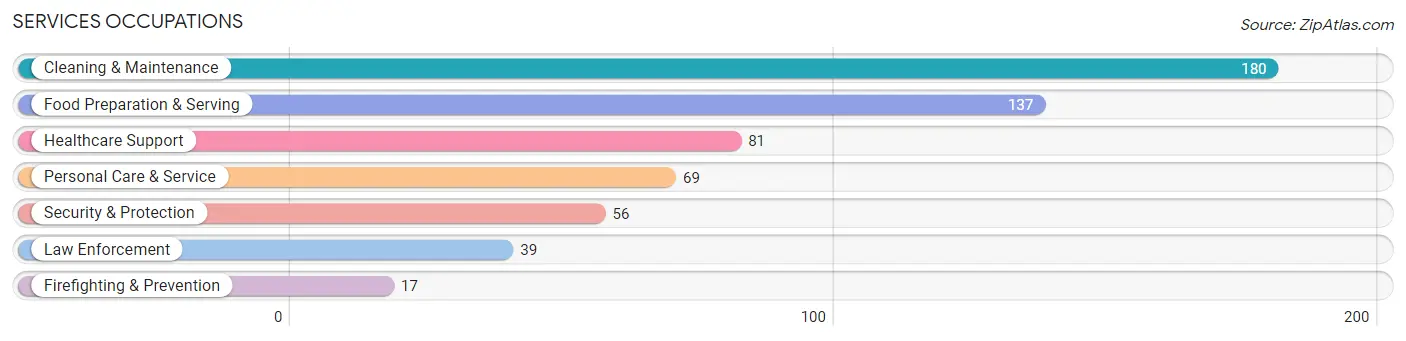
Services Occupations
The most common Services occupations in Atchison County are Cleaning & Maintenance (180 | 7.1%), Food Preparation & Serving (137 | 5.4%), Healthcare Support (81 | 3.2%), Personal Care & Service (69 | 2.7%), and Security & Protection (56 | 2.2%).
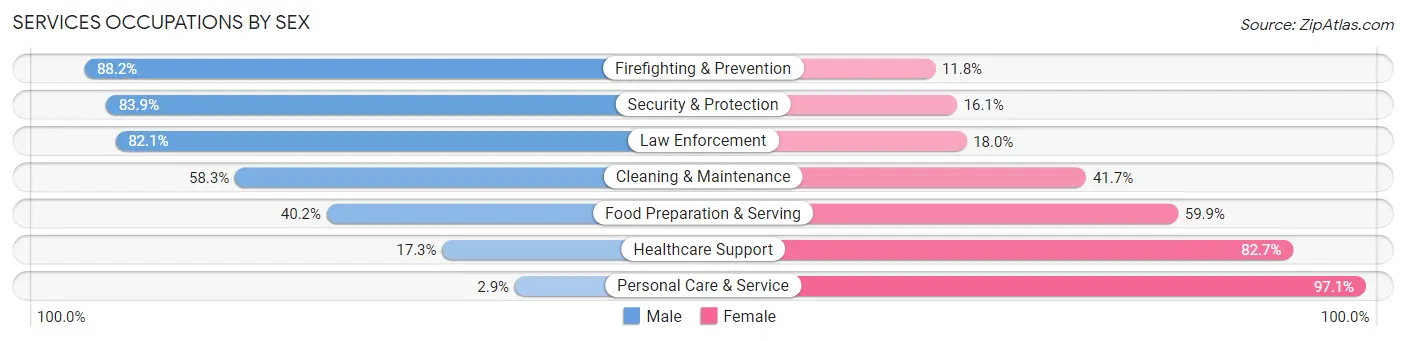
Services Occupations by Sex
Within the Services occupations in Atchison County, the most male-oriented occupations are Firefighting & Prevention (88.2%), Security & Protection (83.9%), and Law Enforcement (82.1%), while the most female-oriented occupations are Personal Care & Service (97.1%), Healthcare Support (82.7%), and Food Preparation & Serving (59.9%).
| Occupation | Male | Female |
| Healthcare Support | 14 (17.3%) | 67 (82.7%) |
| Security & Protection | 47 (83.9%) | 9 (16.1%) |
| Firefighting & Prevention | 15 (88.2%) | 2 (11.8%) |
| Law Enforcement | 32 (82.1%) | 7 (17.9%) |
| Food Preparation & Serving | 55 (40.2%) | 82 (59.9%) |
| Cleaning & Maintenance | 105 (58.3%) | 75 (41.7%) |
| Personal Care & Service | 2 (2.9%) | 67 (97.1%) |
| Total (Category) | 223 (42.6%) | 300 (57.4%) |
| Total (Overall) | 1,432 (56.2%) | 1,114 (43.8%) |
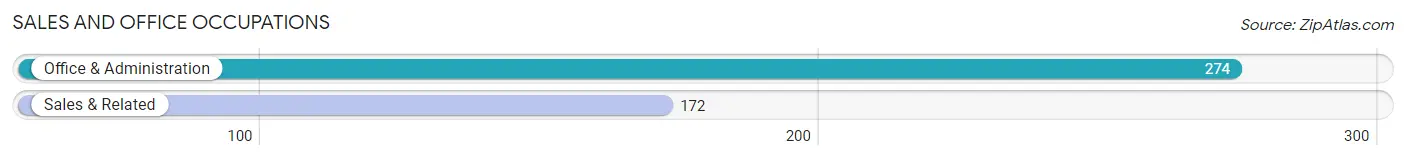
Sales and Office Occupations
The most common Sales and Office occupations in Atchison County are Office & Administration (274 | 10.8%), and Sales & Related (172 | 6.8%).
Sales and Office Occupations by Sex
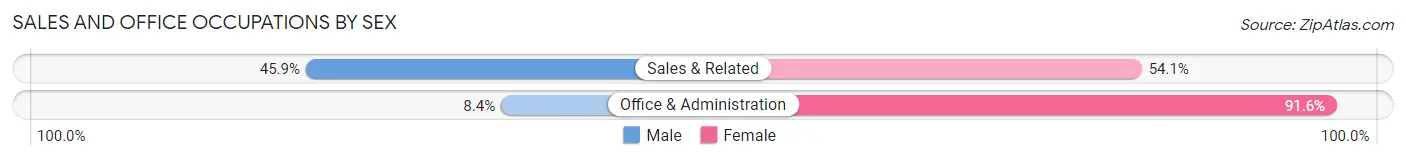
| Occupation | Male | Female |
| Sales & Related | 79 (45.9%) | 93 (54.1%) |
| Office & Administration | 23 (8.4%) | 251 (91.6%) |
| Total (Category) | 102 (22.9%) | 344 (77.1%) |
| Total (Overall) | 1,432 (56.2%) | 1,114 (43.8%) |
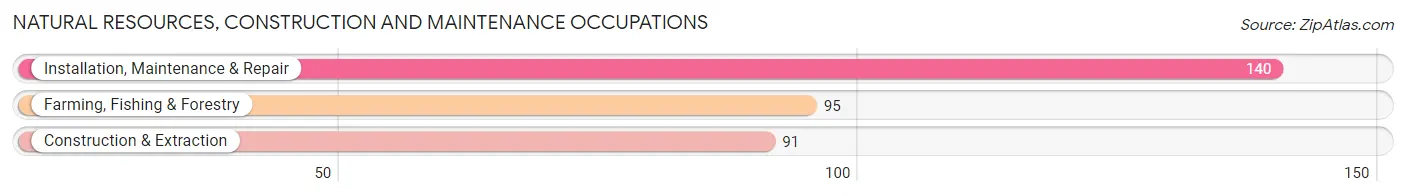
Natural Resources, Construction and Maintenance Occupations
The most common Natural Resources, Construction and Maintenance occupations in Atchison County are Installation, Maintenance & Repair (140 | 5.5%), Farming, Fishing & Forestry (95 | 3.7%), and Construction & Extraction (91 | 3.6%).
Natural Resources, Construction and Maintenance Occupations by Sex
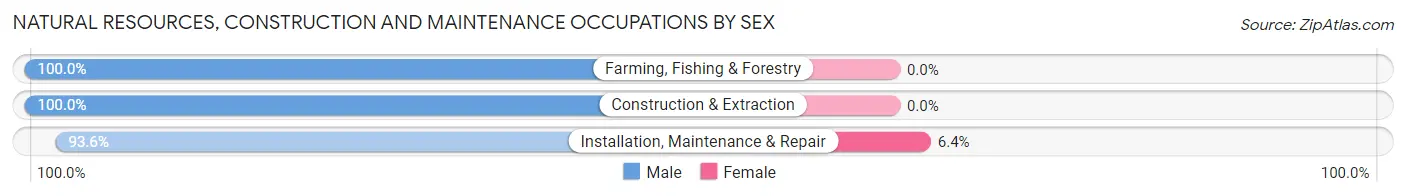
| Occupation | Male | Female |
| Farming, Fishing & Forestry | 95 (100.0%) | 0 (0.0%) |
| Construction & Extraction | 91 (100.0%) | 0 (0.0%) |
| Installation, Maintenance & Repair | 131 (93.6%) | 9 (6.4%) |
| Total (Category) | 317 (97.2%) | 9 (2.8%) |
| Total (Overall) | 1,432 (56.2%) | 1,114 (43.8%) |
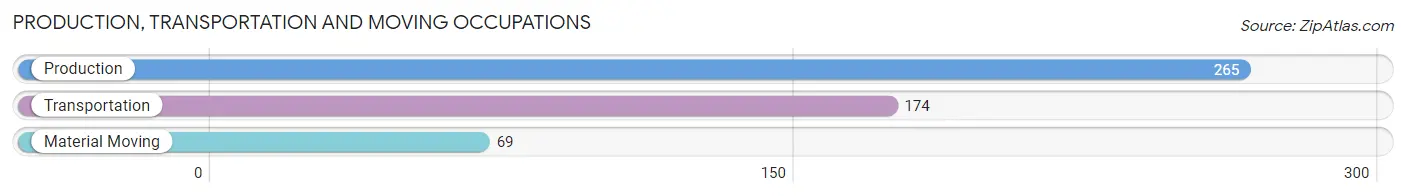
Production, Transportation and Moving Occupations
The most common Production, Transportation and Moving occupations in Atchison County are Production (265 | 10.4%), Transportation (174 | 6.8%), and Material Moving (69 | 2.7%).
Production, Transportation and Moving Occupations by Sex
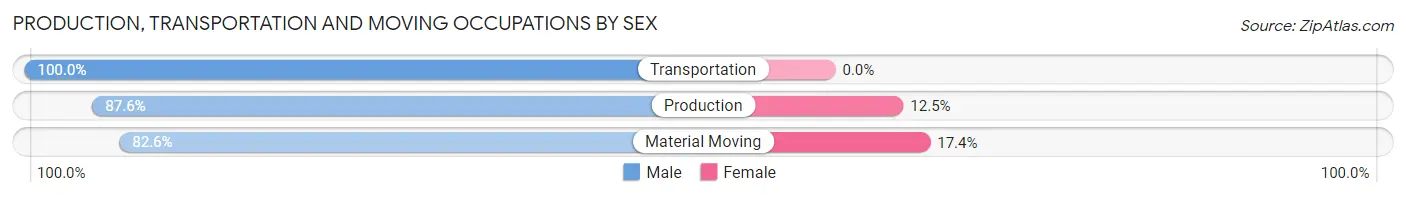
| Occupation | Male | Female |
| Production | 232 (87.5%) | 33 (12.4%) |
| Transportation | 174 (100.0%) | 0 (0.0%) |
| Material Moving | 57 (82.6%) | 12 (17.4%) |
| Total (Category) | 463 (91.1%) | 45 (8.9%) |
| Total (Overall) | 1,432 (56.2%) | 1,114 (43.8%) |
Employment Industries by Sex in Atchison County
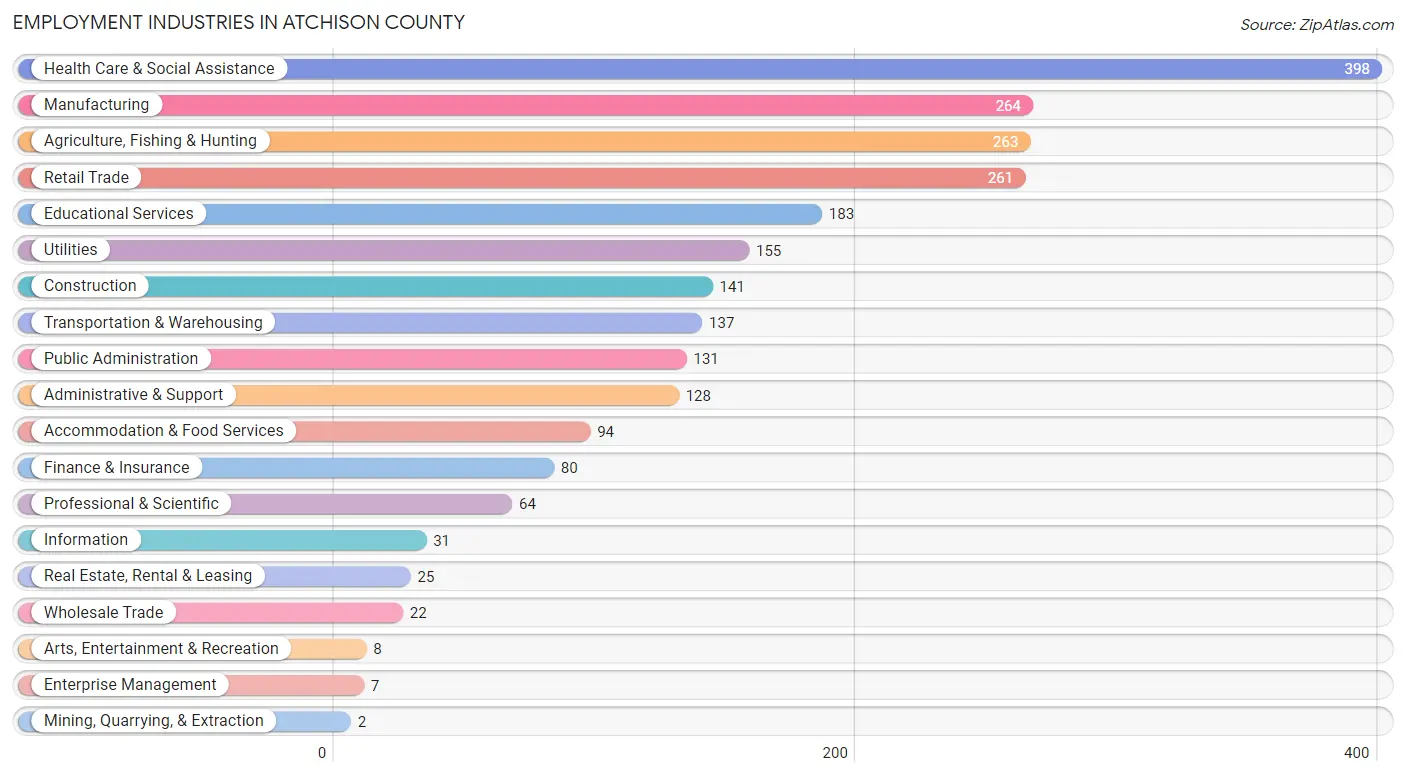
Employment Industries in Atchison County
The major employment industries in Atchison County include Health Care & Social Assistance (398 | 15.6%), Manufacturing (264 | 10.4%), Agriculture, Fishing & Hunting (263 | 10.3%), Retail Trade (261 | 10.2%), and Educational Services (183 | 7.2%).
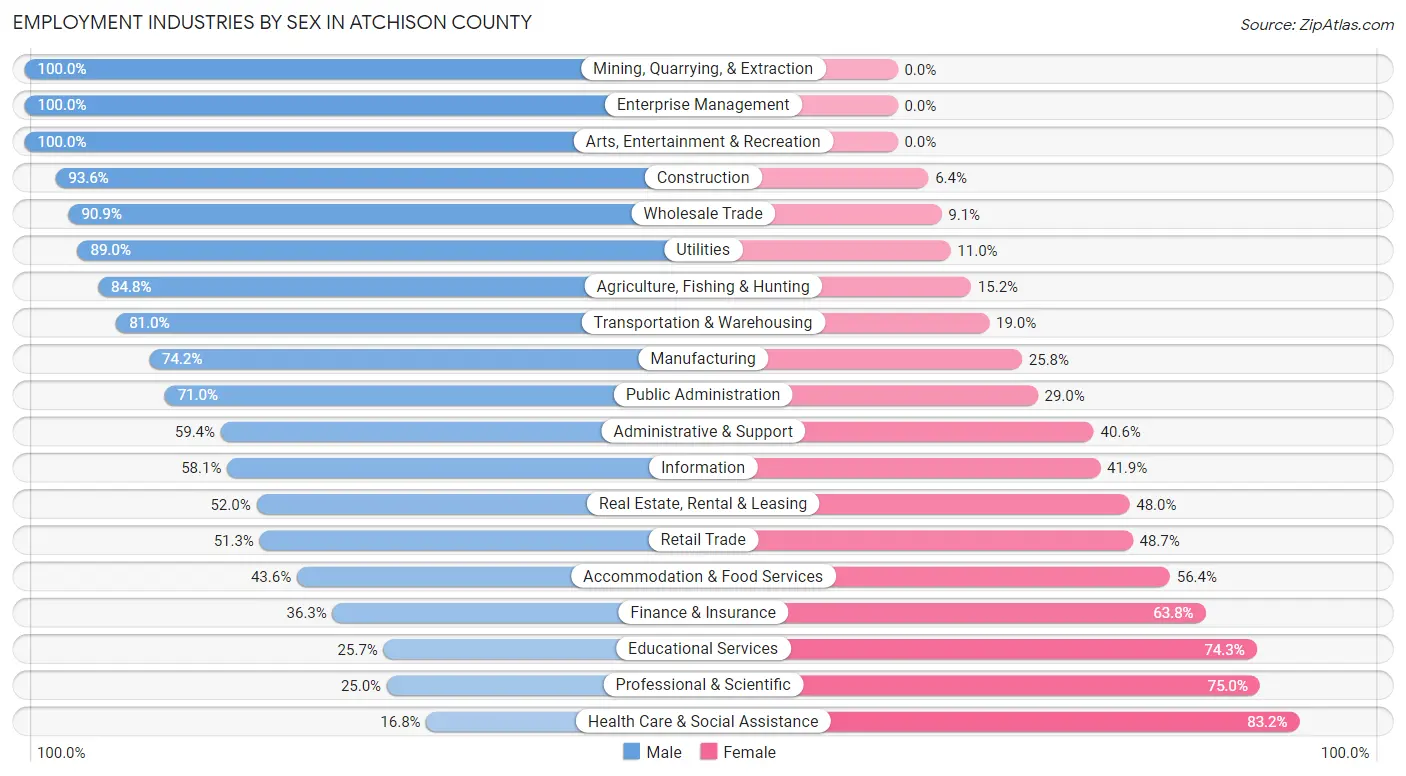
Employment Industries by Sex in Atchison County
The Atchison County industries that see more men than women are Mining, Quarrying, & Extraction (100.0%), Enterprise Management (100.0%), and Arts, Entertainment & Recreation (100.0%), whereas the industries that tend to have a higher number of women are Health Care & Social Assistance (83.2%), Professional & Scientific (75.0%), and Educational Services (74.3%).
| Industry | Male | Female |
| Agriculture, Fishing & Hunting | 223 (84.8%) | 40 (15.2%) |
| Mining, Quarrying, & Extraction | 2 (100.0%) | 0 (0.0%) |
| Construction | 132 (93.6%) | 9 (6.4%) |
| Manufacturing | 196 (74.2%) | 68 (25.8%) |
| Wholesale Trade | 20 (90.9%) | 2 (9.1%) |
| Retail Trade | 134 (51.3%) | 127 (48.7%) |
| Transportation & Warehousing | 111 (81.0%) | 26 (19.0%) |
| Utilities | 138 (89.0%) | 17 (11.0%) |
| Information | 18 (58.1%) | 13 (41.9%) |
| Finance & Insurance | 29 (36.2%) | 51 (63.7%) |
| Real Estate, Rental & Leasing | 13 (52.0%) | 12 (48.0%) |
| Professional & Scientific | 16 (25.0%) | 48 (75.0%) |
| Enterprise Management | 7 (100.0%) | 0 (0.0%) |
| Administrative & Support | 76 (59.4%) | 52 (40.6%) |
| Educational Services | 47 (25.7%) | 136 (74.3%) |
| Health Care & Social Assistance | 67 (16.8%) | 331 (83.2%) |
| Arts, Entertainment & Recreation | 8 (100.0%) | 0 (0.0%) |
| Accommodation & Food Services | 41 (43.6%) | 53 (56.4%) |
| Public Administration | 93 (71.0%) | 38 (29.0%) |
| Total | 1,432 (56.2%) | 1,114 (43.8%) |
Education in Atchison County
School Enrollment in Atchison County
The most common levels of schooling among the 1,027 students in Atchison County are high school (283 | 27.6%), elementary school (269 | 26.2%), and middle school (208 | 20.3%).
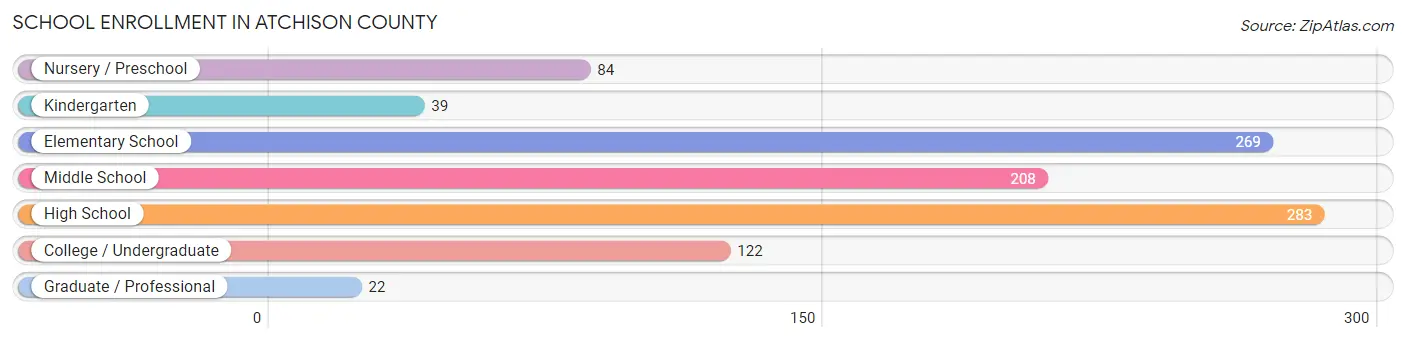
| School Level | # Students | % Students |
| Nursery / Preschool | 84 | 8.2% |
| Kindergarten | 39 | 3.8% |
| Elementary School | 269 | 26.2% |
| Middle School | 208 | 20.3% |
| High School | 283 | 27.6% |
| College / Undergraduate | 122 | 11.9% |
| Graduate / Professional | 22 | 2.1% |
| Total | 1,027 | 100.0% |
School Enrollment by Age by Funding Source in Atchison County
Out of a total of 1,027 students who are enrolled in schools in Atchison County, 30 (2.9%) attend a private institution, while the remaining 997 (97.1%) are enrolled in public schools. The age group of 20 to 24 year olds has the highest likelihood of being enrolled in private schools, with 10 (17.2% in the age bracket) enrolled. Conversely, the age group of 10 to 14 year olds has the lowest likelihood of being enrolled in a private school, with 312 (100.0% in the age bracket) attending a public institution.
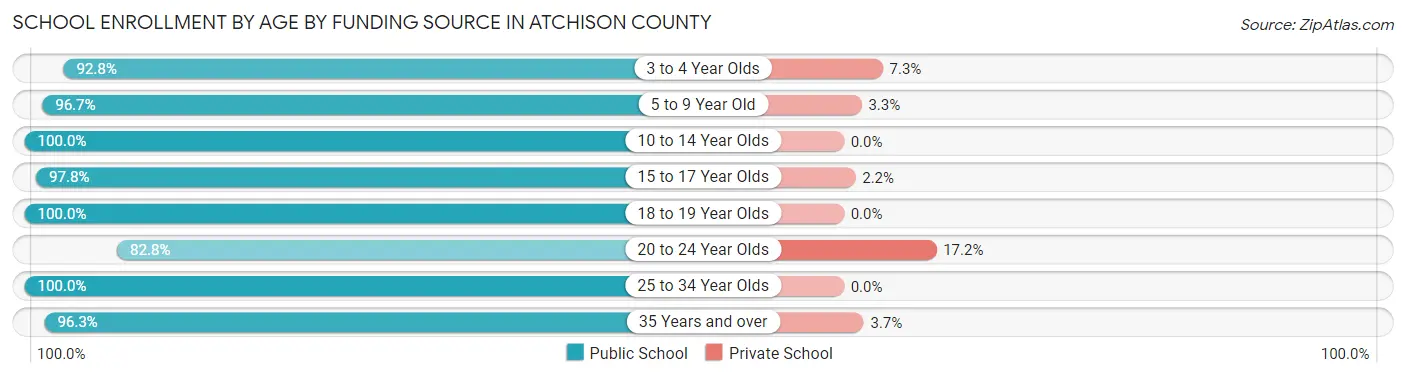
| Age Bracket | Public School | Private School |
| 3 to 4 Year Olds | 64 (92.7%) | 5 (7.2%) |
| 5 to 9 Year Old | 263 (96.7%) | 9 (3.3%) |
| 10 to 14 Year Olds | 312 (100.0%) | 0 (0.0%) |
| 15 to 17 Year Olds | 181 (97.8%) | 4 (2.2%) |
| 18 to 19 Year Olds | 58 (100.0%) | 0 (0.0%) |
| 20 to 24 Year Olds | 48 (82.8%) | 10 (17.2%) |
| 25 to 34 Year Olds | 19 (100.0%) | 0 (0.0%) |
| 35 Years and over | 52 (96.3%) | 2 (3.7%) |
| Total | 997 (97.1%) | 30 (2.9%) |
Educational Attainment by Field of Study in Atchison County
Education (275 | 31.2%), business (151 | 17.2%), bio, nature & agricultural (140 | 15.9%), science & technology (93 | 10.6%), and psychology (40 | 4.5%) are the most common fields of study among 880 individuals in Atchison County who have obtained a bachelor's degree or higher.
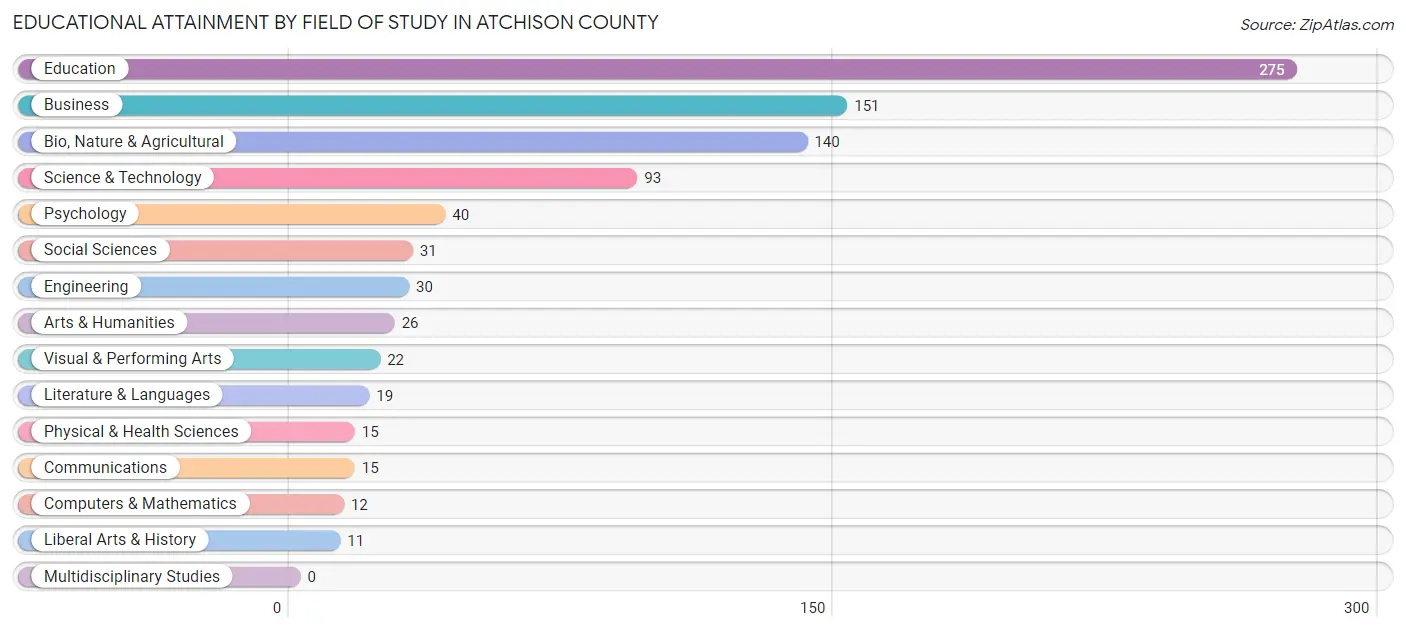
| Field of Study | # Graduates | % Graduates |
| Computers & Mathematics | 12 | 1.4% |
| Bio, Nature & Agricultural | 140 | 15.9% |
| Physical & Health Sciences | 15 | 1.7% |
| Psychology | 40 | 4.5% |
| Social Sciences | 31 | 3.5% |
| Engineering | 30 | 3.4% |
| Multidisciplinary Studies | 0 | 0.0% |
| Science & Technology | 93 | 10.6% |
| Business | 151 | 17.2% |
| Education | 275 | 31.2% |
| Literature & Languages | 19 | 2.2% |
| Liberal Arts & History | 11 | 1.3% |
| Visual & Performing Arts | 22 | 2.5% |
| Communications | 15 | 1.7% |
| Arts & Humanities | 26 | 2.9% |
| Total | 880 | 100.0% |
Transportation & Commute in Atchison County
Vehicle Availability by Sex in Atchison County
The most prevalent vehicle ownership categories in Atchison County are males with 2 vehicles (550, accounting for 38.6%) and females with 2 vehicles (436, making up 50.3%).
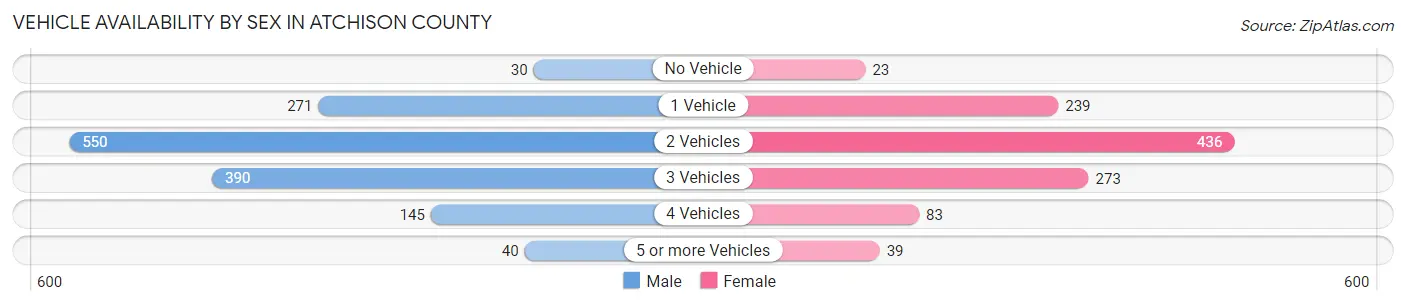
| Vehicles Available | Male | Female |
| No Vehicle | 30 (2.1%) | 23 (2.1%) |
| 1 Vehicle | 271 (19.0%) | 239 (21.9%) |
| 2 Vehicles | 550 (38.6%) | 436 (39.9%) |
| 3 Vehicles | 390 (27.4%) | 273 (25.0%) |
| 4 Vehicles | 145 (10.2%) | 83 (7.6%) |
| 5 or more Vehicles | 40 (2.8%) | 39 (3.6%) |
| Total | 1,426 (100.0%) | 1,093 (100.0%) |
Commute Time in Atchison County
The most frequently occuring commute durations in Atchison County are 5 to 9 minutes (470 commuters, 20.2%), 15 to 19 minutes (387 commuters, 16.6%), and 20 to 24 minutes (321 commuters, 13.8%).
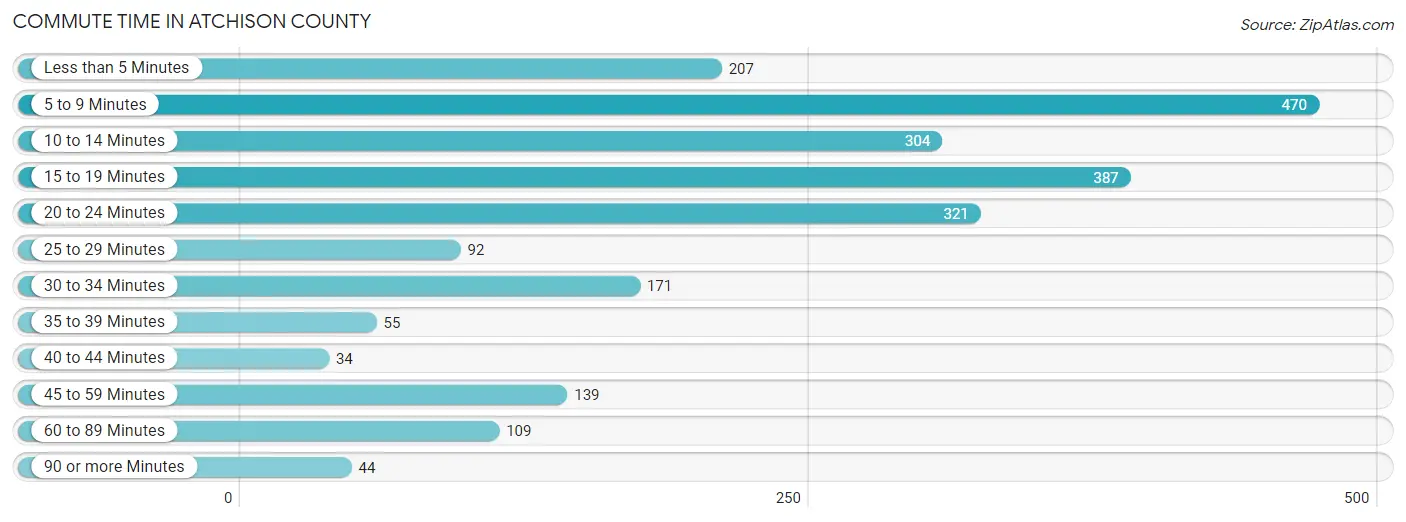
| Commute Time | # Commuters | % Commuters |
| Less than 5 Minutes | 207 | 8.9% |
| 5 to 9 Minutes | 470 | 20.2% |
| 10 to 14 Minutes | 304 | 13.0% |
| 15 to 19 Minutes | 387 | 16.6% |
| 20 to 24 Minutes | 321 | 13.8% |
| 25 to 29 Minutes | 92 | 3.9% |
| 30 to 34 Minutes | 171 | 7.3% |
| 35 to 39 Minutes | 55 | 2.4% |
| 40 to 44 Minutes | 34 | 1.5% |
| 45 to 59 Minutes | 139 | 6.0% |
| 60 to 89 Minutes | 109 | 4.7% |
| 90 or more Minutes | 44 | 1.9% |
Commute Time by Sex in Atchison County
The most common commute times in Atchison County are 15 to 19 minutes (257 commuters, 19.2%) for males and 5 to 9 minutes (233 commuters, 23.4%) for females.
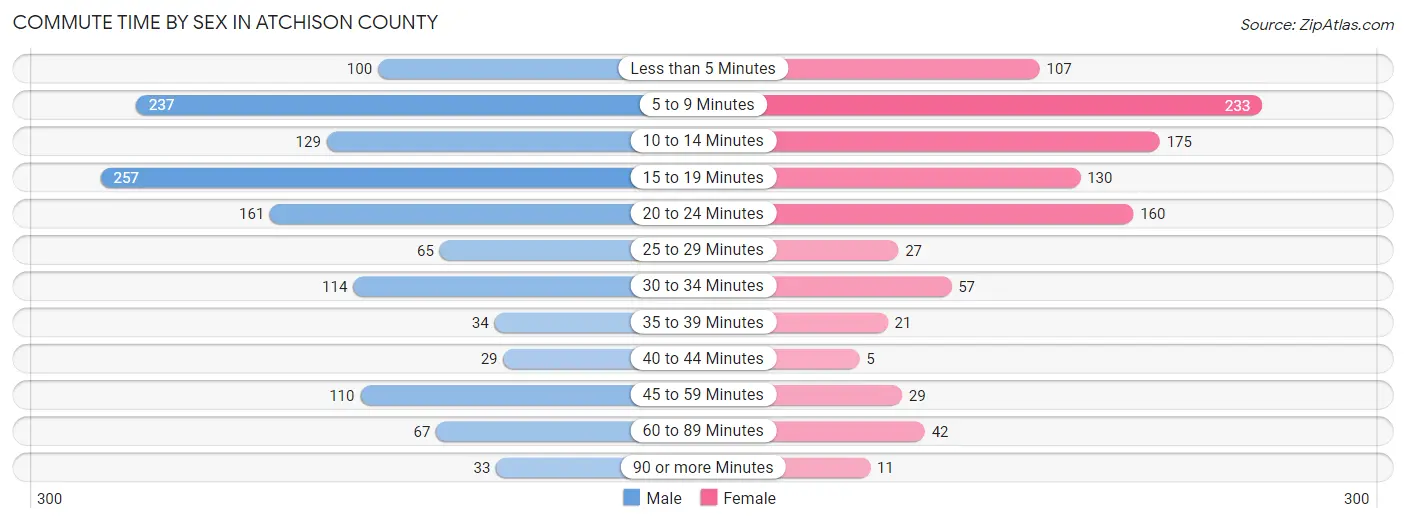
| Commute Time | Male | Female |
| Less than 5 Minutes | 100 (7.5%) | 107 (10.7%) |
| 5 to 9 Minutes | 237 (17.7%) | 233 (23.4%) |
| 10 to 14 Minutes | 129 (9.7%) | 175 (17.5%) |
| 15 to 19 Minutes | 257 (19.2%) | 130 (13.0%) |
| 20 to 24 Minutes | 161 (12.0%) | 160 (16.1%) |
| 25 to 29 Minutes | 65 (4.9%) | 27 (2.7%) |
| 30 to 34 Minutes | 114 (8.5%) | 57 (5.7%) |
| 35 to 39 Minutes | 34 (2.5%) | 21 (2.1%) |
| 40 to 44 Minutes | 29 (2.2%) | 5 (0.5%) |
| 45 to 59 Minutes | 110 (8.2%) | 29 (2.9%) |
| 60 to 89 Minutes | 67 (5.0%) | 42 (4.2%) |
| 90 or more Minutes | 33 (2.5%) | 11 (1.1%) |
Time of Departure to Work by Sex in Atchison County
The most frequent times of departure to work in Atchison County are 6:00 AM to 6:29 AM (180, 13.5%) for males and 7:30 AM to 7:59 AM (266, 26.7%) for females.
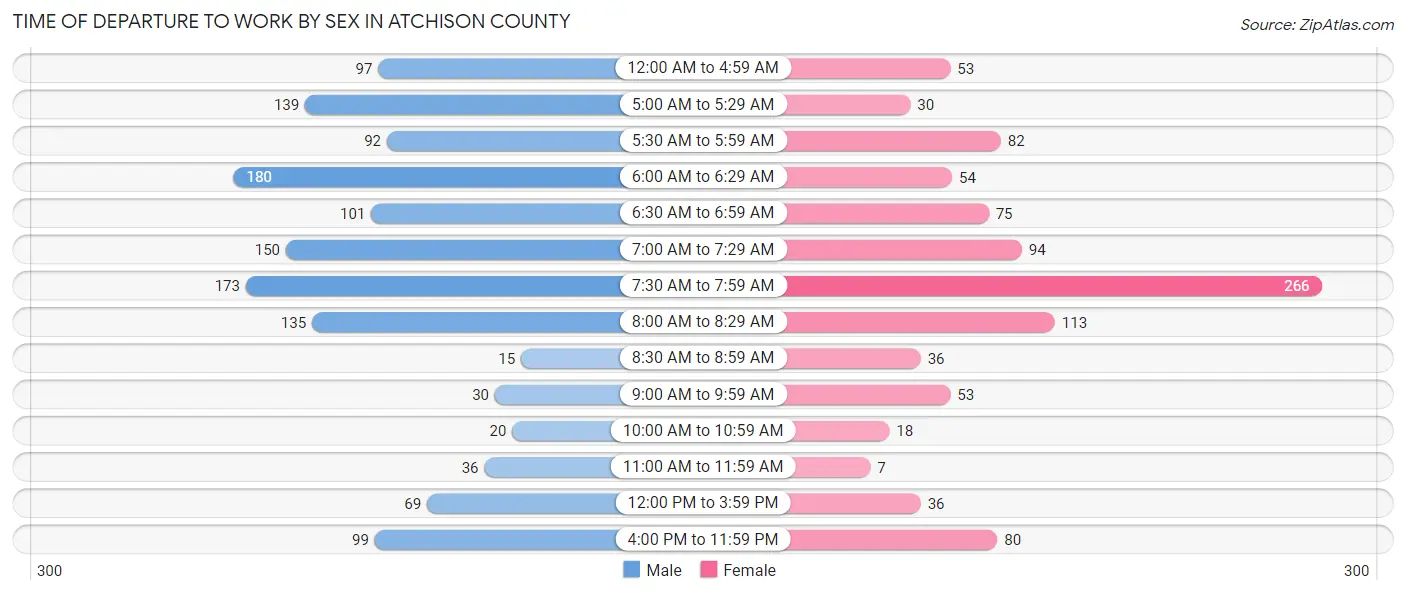
| Time of Departure | Male | Female |
| 12:00 AM to 4:59 AM | 97 (7.3%) | 53 (5.3%) |
| 5:00 AM to 5:29 AM | 139 (10.4%) | 30 (3.0%) |
| 5:30 AM to 5:59 AM | 92 (6.9%) | 82 (8.2%) |
| 6:00 AM to 6:29 AM | 180 (13.5%) | 54 (5.4%) |
| 6:30 AM to 6:59 AM | 101 (7.6%) | 75 (7.5%) |
| 7:00 AM to 7:29 AM | 150 (11.2%) | 94 (9.4%) |
| 7:30 AM to 7:59 AM | 173 (13.0%) | 266 (26.7%) |
| 8:00 AM to 8:29 AM | 135 (10.1%) | 113 (11.3%) |
| 8:30 AM to 8:59 AM | 15 (1.1%) | 36 (3.6%) |
| 9:00 AM to 9:59 AM | 30 (2.2%) | 53 (5.3%) |
| 10:00 AM to 10:59 AM | 20 (1.5%) | 18 (1.8%) |
| 11:00 AM to 11:59 AM | 36 (2.7%) | 7 (0.7%) |
| 12:00 PM to 3:59 PM | 69 (5.2%) | 36 (3.6%) |
| 4:00 PM to 11:59 PM | 99 (7.4%) | 80 (8.0%) |
| Total | 1,336 (100.0%) | 997 (100.0%) |
Housing Occupancy in Atchison County
Occupancy by Ownership in Atchison County
Of the total 2,351 dwellings in Atchison County, owner-occupied units account for 1,693 (72.0%), while renter-occupied units make up 658 (28.0%).
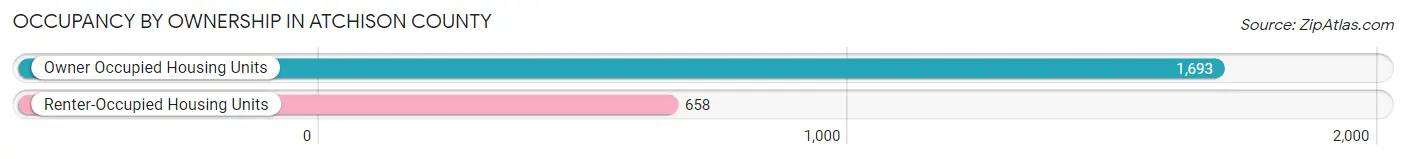
| Occupancy | # Housing Units | % Housing Units |
| Owner Occupied Housing Units | 1,693 | 72.0% |
| Renter-Occupied Housing Units | 658 | 28.0% |
| Total Occupied Housing Units | 2,351 | 100.0% |
Occupancy by Household Size in Atchison County
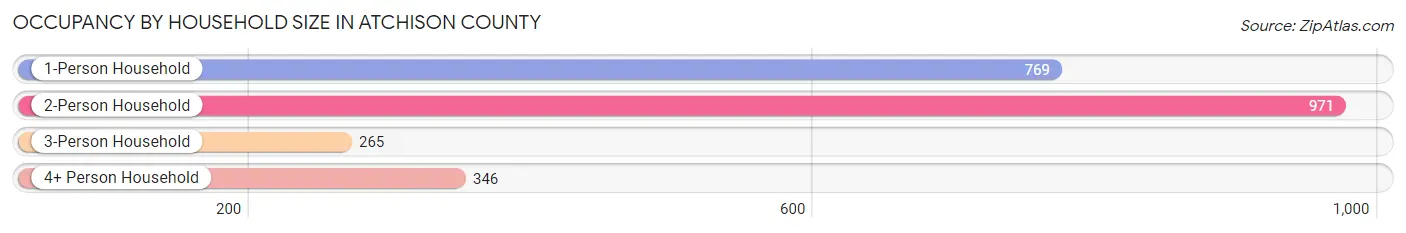
| Household Size | # Housing Units | % Housing Units |
| 1-Person Household | 769 | 32.7% |
| 2-Person Household | 971 | 41.3% |
| 3-Person Household | 265 | 11.3% |
| 4+ Person Household | 346 | 14.7% |
| Total Housing Units | 2,351 | 100.0% |
Occupancy by Ownership by Household Size in Atchison County
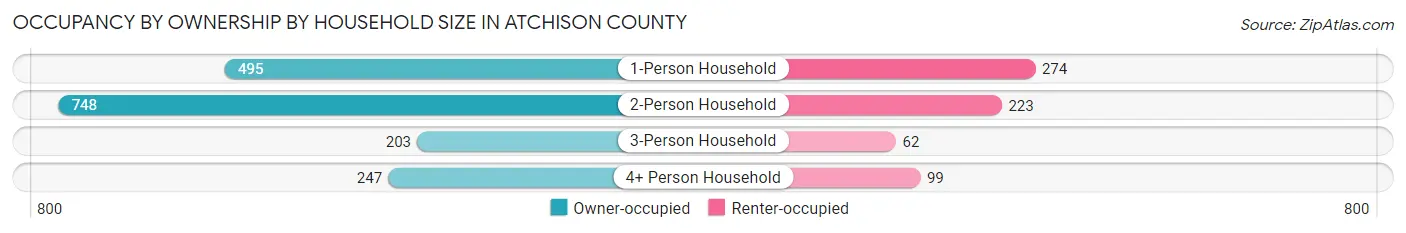
| Household Size | Owner-occupied | Renter-occupied |
| 1-Person Household | 495 (64.4%) | 274 (35.6%) |
| 2-Person Household | 748 (77.0%) | 223 (23.0%) |
| 3-Person Household | 203 (76.6%) | 62 (23.4%) |
| 4+ Person Household | 247 (71.4%) | 99 (28.6%) |
| Total Housing Units | 1,693 (72.0%) | 658 (28.0%) |
Occupancy by Educational Attainment in Atchison County
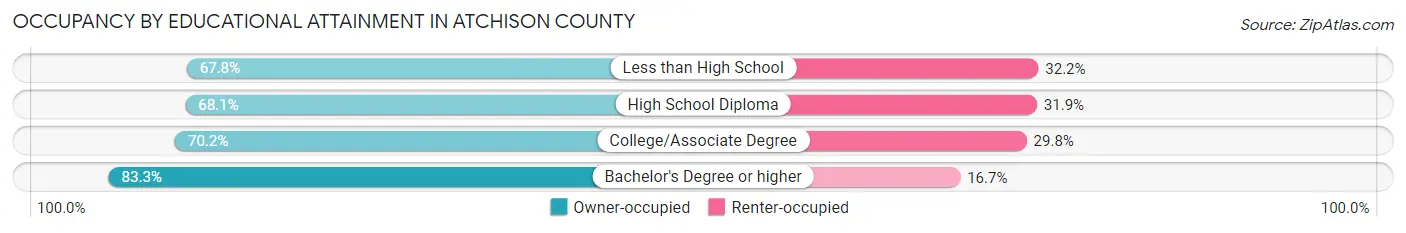
| Household Size | Owner-occupied | Renter-occupied |
| Less than High School | 135 (67.8%) | 64 (32.2%) |
| High School Diploma | 637 (68.1%) | 298 (31.9%) |
| College/Associate Degree | 496 (70.2%) | 211 (29.8%) |
| Bachelor's Degree or higher | 425 (83.3%) | 85 (16.7%) |
Occupancy by Age of Householder in Atchison County
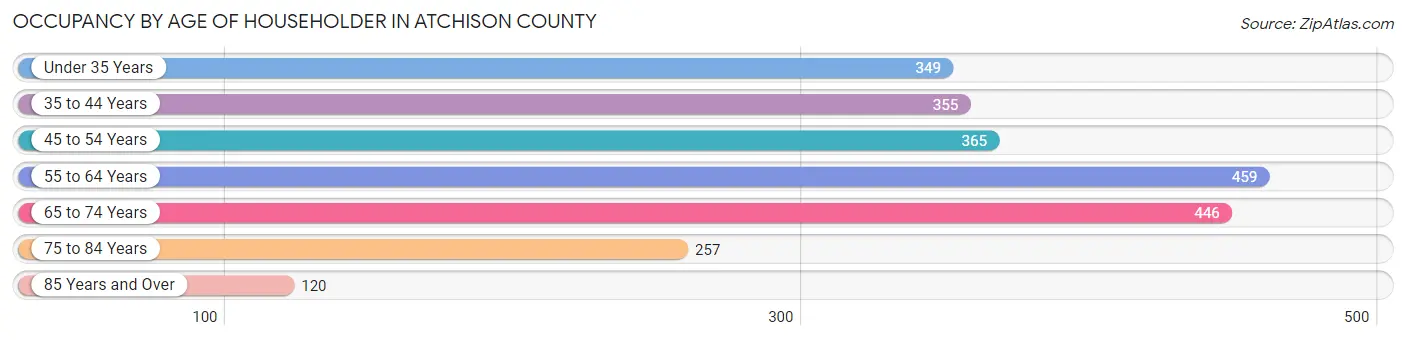
| Age Bracket | # Households | % Households |
| Under 35 Years | 349 | 14.8% |
| 35 to 44 Years | 355 | 15.1% |
| 45 to 54 Years | 365 | 15.5% |
| 55 to 64 Years | 459 | 19.5% |
| 65 to 74 Years | 446 | 19.0% |
| 75 to 84 Years | 257 | 10.9% |
| 85 Years and Over | 120 | 5.1% |
| Total | 2,351 | 100.0% |
Housing Finances in Atchison County
Median Income by Occupancy in Atchison County
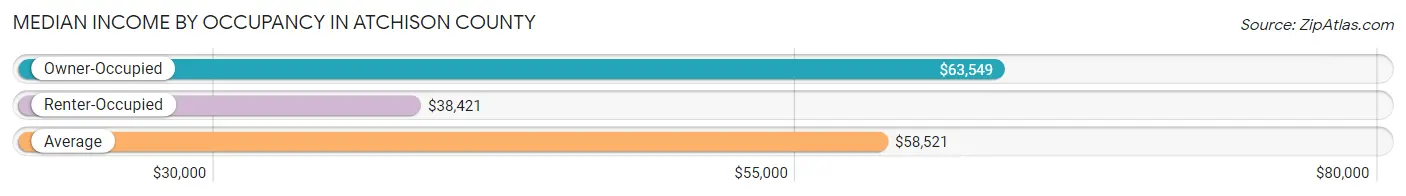
| Occupancy Type | # Households | Median Income |
| Owner-Occupied | 1,693 (72.0%) | $63,549 |
| Renter-Occupied | 658 (28.0%) | $38,421 |
| Average | 2,351 (100.0%) | $58,521 |
Occupancy by Householder Income Bracket in Atchison County
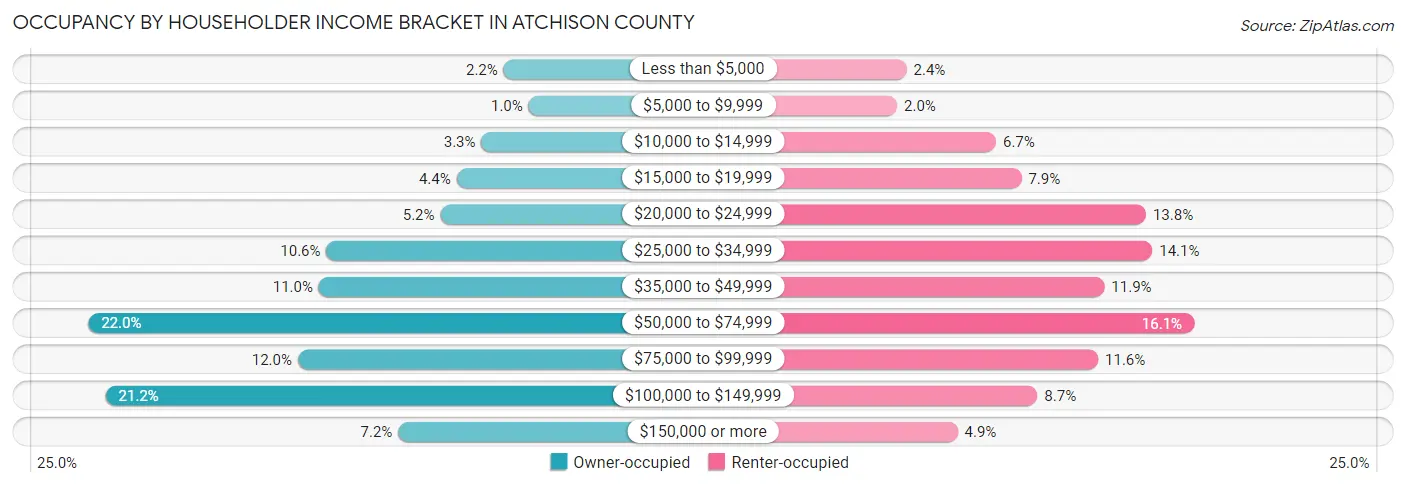
| Income Bracket | Owner-occupied | Renter-occupied |
| Less than $5,000 | 37 (2.2%) | 16 (2.4%) |
| $5,000 to $9,999 | 17 (1.0%) | 13 (2.0%) |
| $10,000 to $14,999 | 55 (3.3%) | 44 (6.7%) |
| $15,000 to $19,999 | 75 (4.4%) | 52 (7.9%) |
| $20,000 to $24,999 | 88 (5.2%) | 91 (13.8%) |
| $25,000 to $34,999 | 180 (10.6%) | 93 (14.1%) |
| $35,000 to $49,999 | 186 (11.0%) | 78 (11.8%) |
| $50,000 to $74,999 | 372 (22.0%) | 106 (16.1%) |
| $75,000 to $99,999 | 203 (12.0%) | 76 (11.6%) |
| $100,000 to $149,999 | 358 (21.1%) | 57 (8.7%) |
| $150,000 or more | 122 (7.2%) | 32 (4.9%) |
| Total | 1,693 (100.0%) | 658 (100.0%) |
Monthly Housing Cost Tiers in Atchison County
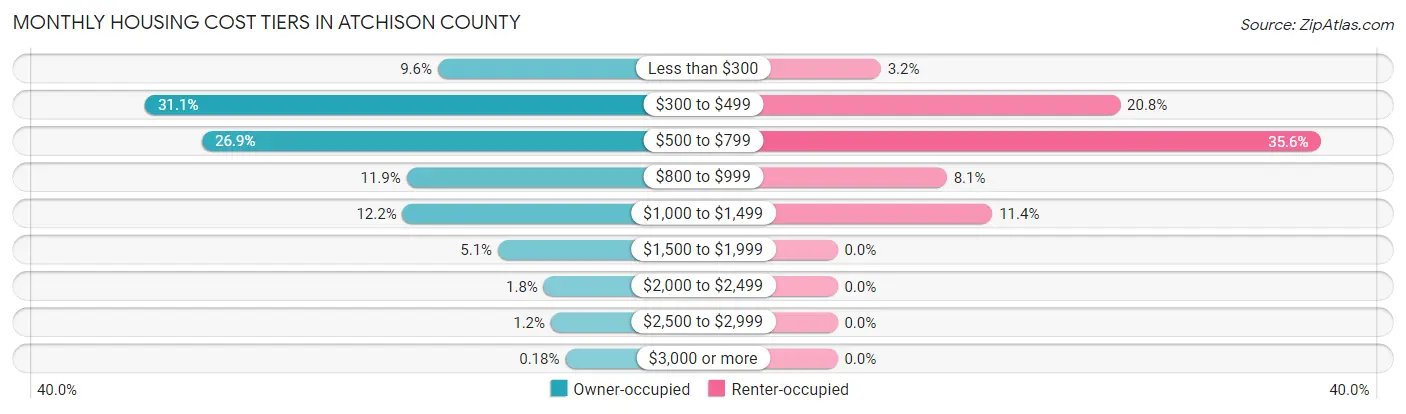
| Monthly Cost | Owner-occupied | Renter-occupied |
| Less than $300 | 162 (9.6%) | 21 (3.2%) |
| $300 to $499 | 527 (31.1%) | 137 (20.8%) |
| $500 to $799 | 456 (26.9%) | 234 (35.6%) |
| $800 to $999 | 201 (11.9%) | 53 (8.1%) |
| $1,000 to $1,499 | 206 (12.2%) | 75 (11.4%) |
| $1,500 to $1,999 | 87 (5.1%) | 0 (0.0%) |
| $2,000 to $2,499 | 30 (1.8%) | 0 (0.0%) |
| $2,500 to $2,999 | 21 (1.2%) | 0 (0.0%) |
| $3,000 or more | 3 (0.2%) | 0 (0.0%) |
| Total | 1,693 (100.0%) | 658 (100.0%) |
Physical Housing Characteristics in Atchison County
Housing Structures in Atchison County
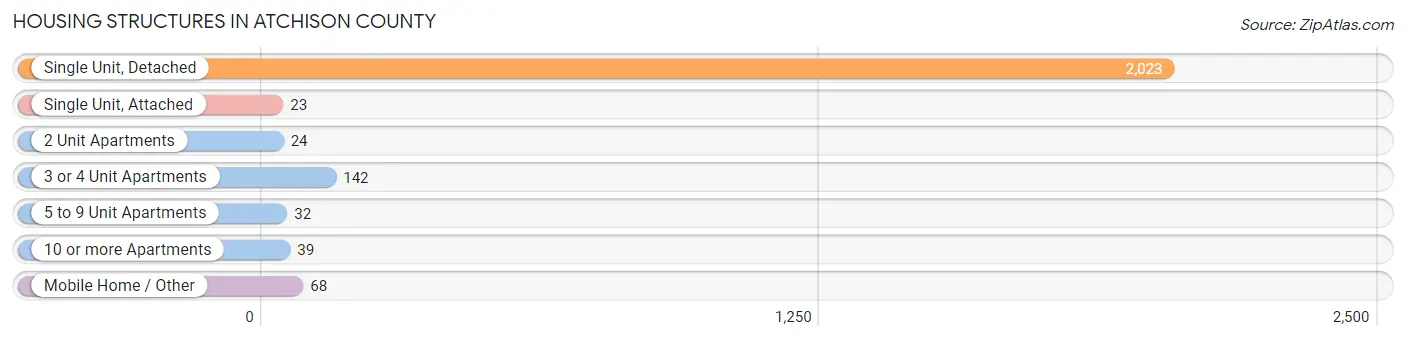
| Structure Type | # Housing Units | % Housing Units |
| Single Unit, Detached | 2,023 | 86.1% |
| Single Unit, Attached | 23 | 1.0% |
| 2 Unit Apartments | 24 | 1.0% |
| 3 or 4 Unit Apartments | 142 | 6.0% |
| 5 to 9 Unit Apartments | 32 | 1.4% |
| 10 or more Apartments | 39 | 1.7% |
| Mobile Home / Other | 68 | 2.9% |
| Total | 2,351 | 100.0% |
Housing Structures by Occupancy in Atchison County
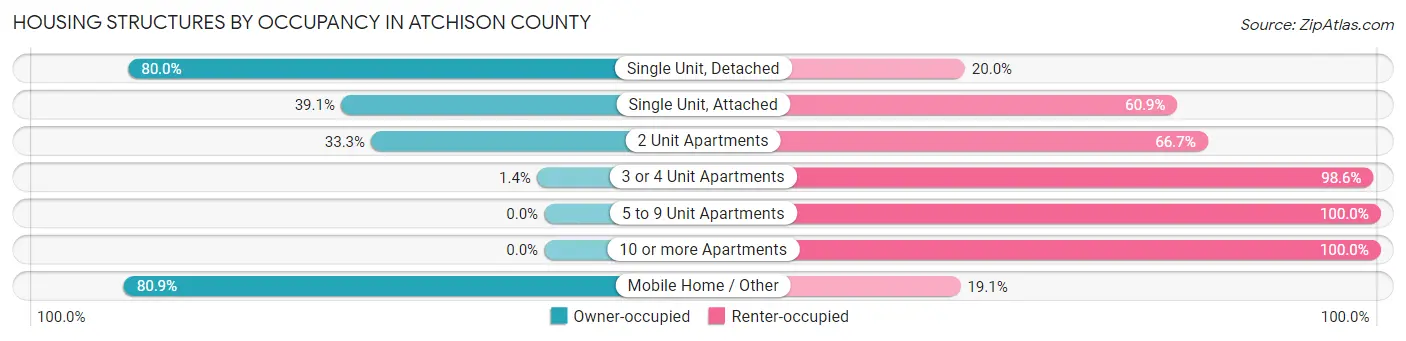
| Structure Type | Owner-occupied | Renter-occupied |
| Single Unit, Detached | 1,619 (80.0%) | 404 (20.0%) |
| Single Unit, Attached | 9 (39.1%) | 14 (60.9%) |
| 2 Unit Apartments | 8 (33.3%) | 16 (66.7%) |
| 3 or 4 Unit Apartments | 2 (1.4%) | 140 (98.6%) |
| 5 to 9 Unit Apartments | 0 (0.0%) | 32 (100.0%) |
| 10 or more Apartments | 0 (0.0%) | 39 (100.0%) |
| Mobile Home / Other | 55 (80.9%) | 13 (19.1%) |
| Total | 1,693 (72.0%) | 658 (28.0%) |
Housing Structures by Number of Rooms in Atchison County
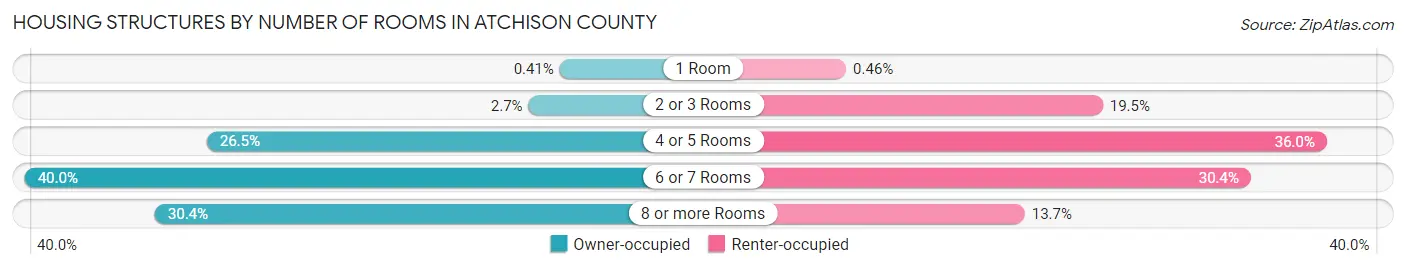
| Number of Rooms | Owner-occupied | Renter-occupied |
| 1 Room | 7 (0.4%) | 3 (0.5%) |
| 2 or 3 Rooms | 46 (2.7%) | 128 (19.5%) |
| 4 or 5 Rooms | 449 (26.5%) | 237 (36.0%) |
| 6 or 7 Rooms | 677 (40.0%) | 200 (30.4%) |
| 8 or more Rooms | 514 (30.4%) | 90 (13.7%) |
| Total | 1,693 (100.0%) | 658 (100.0%) |
Housing Structure by Heating Type in Atchison County
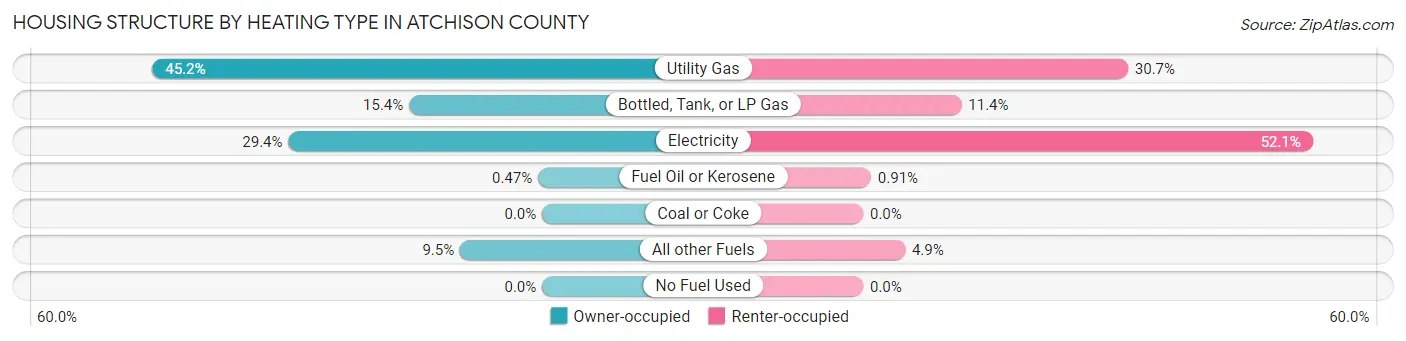
| Heating Type | Owner-occupied | Renter-occupied |
| Utility Gas | 765 (45.2%) | 202 (30.7%) |
| Bottled, Tank, or LP Gas | 261 (15.4%) | 75 (11.4%) |
| Electricity | 498 (29.4%) | 343 (52.1%) |
| Fuel Oil or Kerosene | 8 (0.5%) | 6 (0.9%) |
| Coal or Coke | 0 (0.0%) | 0 (0.0%) |
| All other Fuels | 161 (9.5%) | 32 (4.9%) |
| No Fuel Used | 0 (0.0%) | 0 (0.0%) |
| Total | 1,693 (100.0%) | 658 (100.0%) |
Household Vehicle Usage in Atchison County
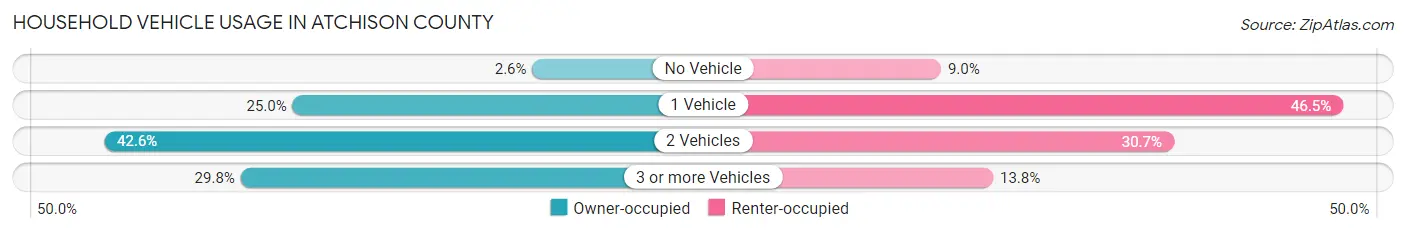
| Vehicles per Household | Owner-occupied | Renter-occupied |
| No Vehicle | 44 (2.6%) | 59 (9.0%) |
| 1 Vehicle | 423 (25.0%) | 306 (46.5%) |
| 2 Vehicles | 721 (42.6%) | 202 (30.7%) |
| 3 or more Vehicles | 505 (29.8%) | 91 (13.8%) |
| Total | 1,693 (100.0%) | 658 (100.0%) |
Real Estate & Mortgages in Atchison County
Real Estate and Mortgage Overview in Atchison County
| Characteristic | Without Mortgage | With Mortgage |
| Housing Units | 982 | 711 |
| Median Property Value | $88,300 | $101,900 |
| Median Household Income | $62,614 | $66 |
| Monthly Housing Costs | $441 | $3 |
| Real Estate Taxes | $924 | $15 |
Property Value by Mortgage Status in Atchison County
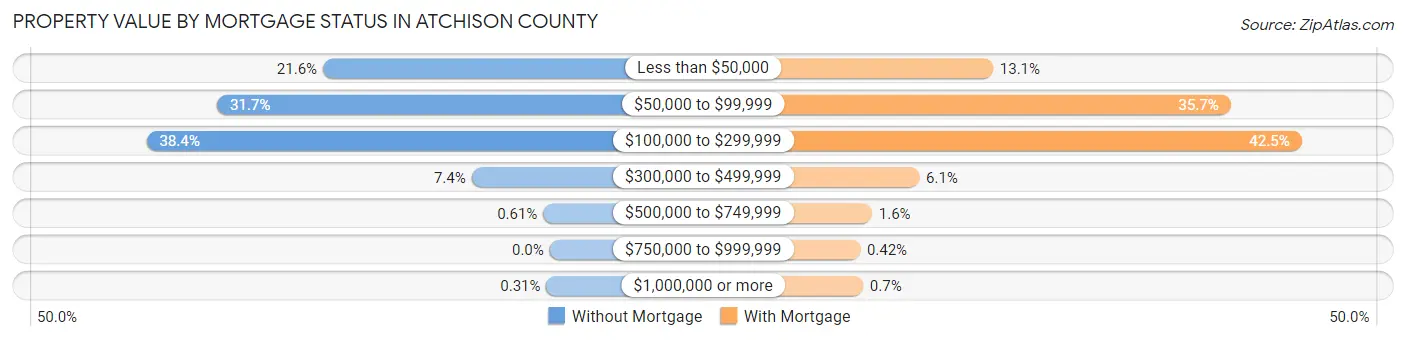
| Property Value | Without Mortgage | With Mortgage |
| Less than $50,000 | 212 (21.6%) | 93 (13.1%) |
| $50,000 to $99,999 | 311 (31.7%) | 254 (35.7%) |
| $100,000 to $299,999 | 377 (38.4%) | 302 (42.5%) |
| $300,000 to $499,999 | 73 (7.4%) | 43 (6.0%) |
| $500,000 to $749,999 | 6 (0.6%) | 11 (1.5%) |
| $750,000 to $999,999 | 0 (0.0%) | 3 (0.4%) |
| $1,000,000 or more | 3 (0.3%) | 5 (0.7%) |
| Total | 982 (100.0%) | 711 (100.0%) |
Household Income by Mortgage Status in Atchison County
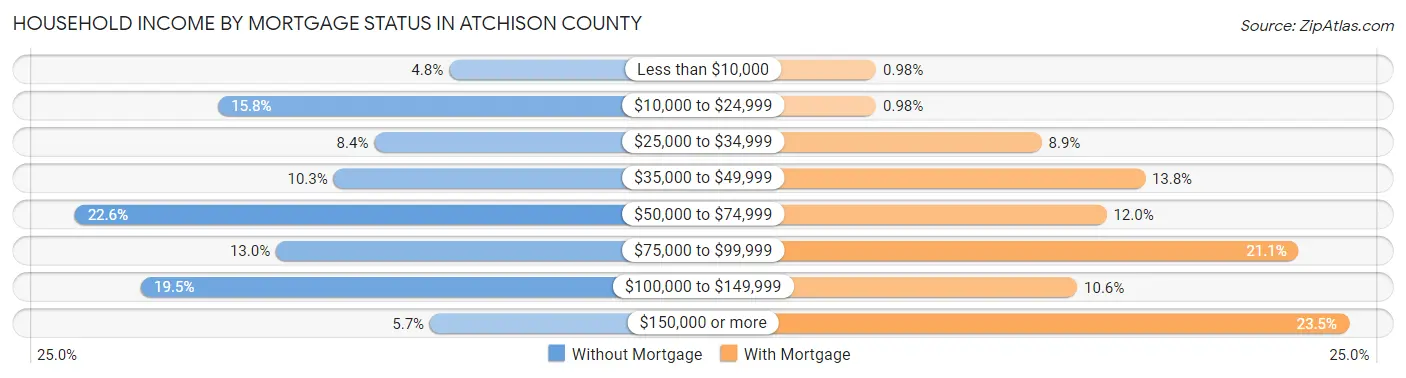
| Household Income | Without Mortgage | With Mortgage |
| Less than $10,000 | 47 (4.8%) | 7 (1.0%) |
| $10,000 to $24,999 | 155 (15.8%) | 7 (1.0%) |
| $25,000 to $34,999 | 82 (8.4%) | 63 (8.9%) |
| $35,000 to $49,999 | 101 (10.3%) | 98 (13.8%) |
| $50,000 to $74,999 | 222 (22.6%) | 85 (11.9%) |
| $75,000 to $99,999 | 128 (13.0%) | 150 (21.1%) |
| $100,000 to $149,999 | 191 (19.5%) | 75 (10.5%) |
| $150,000 or more | 56 (5.7%) | 167 (23.5%) |
| Total | 982 (100.0%) | 711 (100.0%) |
Property Value to Household Income Ratio in Atchison County
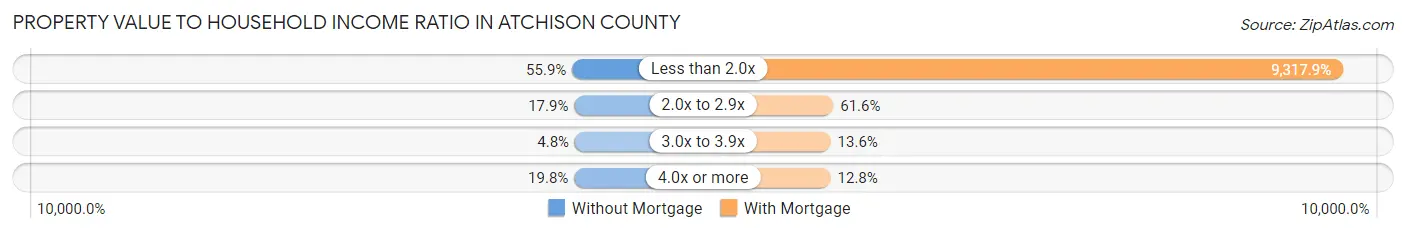
| Value-to-Income Ratio | Without Mortgage | With Mortgage |
| Less than 2.0x | 549 (55.9%) | 66,250 (9,317.9%) |
| 2.0x to 2.9x | 176 (17.9%) | 438 (61.6%) |
| 3.0x to 3.9x | 47 (4.8%) | 97 (13.6%) |
| 4.0x or more | 194 (19.8%) | 91 (12.8%) |
| Total | 982 (100.0%) | 711 (100.0%) |
Real Estate Taxes by Mortgage Status in Atchison County
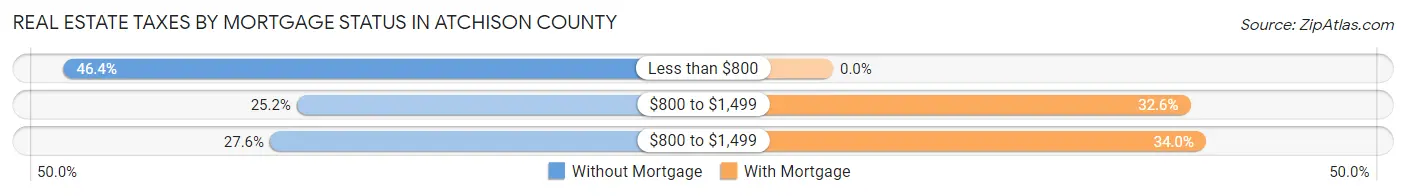
| Property Taxes | Without Mortgage | With Mortgage |
| Less than $800 | 456 (46.4%) | 0 (0.0%) |
| $800 to $1,499 | 247 (25.2%) | 232 (32.6%) |
| $800 to $1,499 | 271 (27.6%) | 242 (34.0%) |
| Total | 982 (100.0%) | 711 (100.0%) |
Health & Disability in Atchison County
Health Insurance Coverage by Age in Atchison County
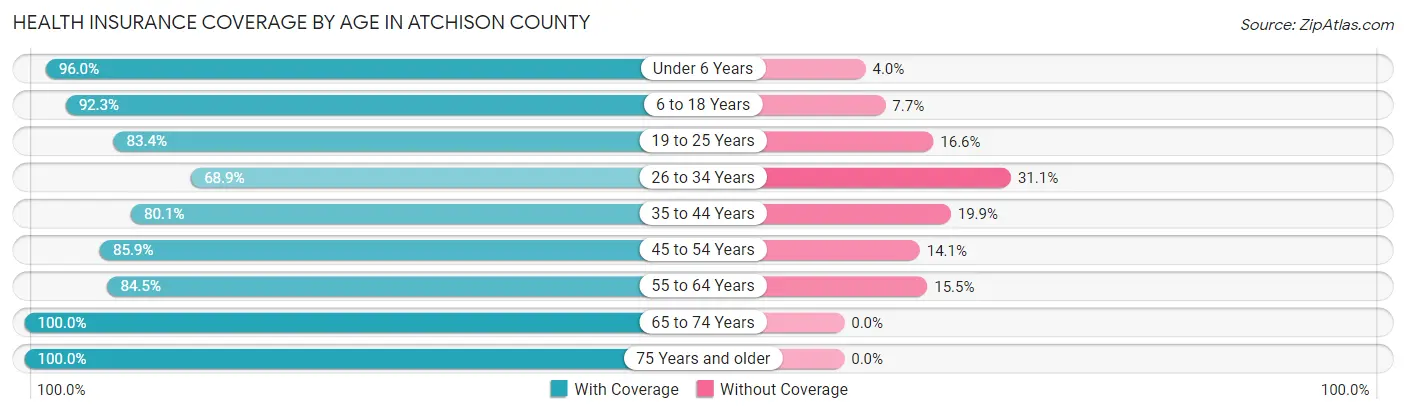
| Age Bracket | With Coverage | Without Coverage |
| Under 6 Years | 291 (96.0%) | 12 (4.0%) |
| 6 to 18 Years | 795 (92.3%) | 66 (7.7%) |
| 19 to 25 Years | 241 (83.4%) | 48 (16.6%) |
| 26 to 34 Years | 346 (68.9%) | 156 (31.1%) |
| 35 to 44 Years | 444 (80.1%) | 110 (19.9%) |
| 45 to 54 Years | 549 (85.9%) | 90 (14.1%) |
| 55 to 64 Years | 655 (84.5%) | 120 (15.5%) |
| 65 to 74 Years | 696 (100.0%) | 0 (0.0%) |
| 75 Years and older | 572 (100.0%) | 0 (0.0%) |
| Total | 4,589 (88.4%) | 602 (11.6%) |
Health Insurance Coverage by Citizenship Status in Atchison County
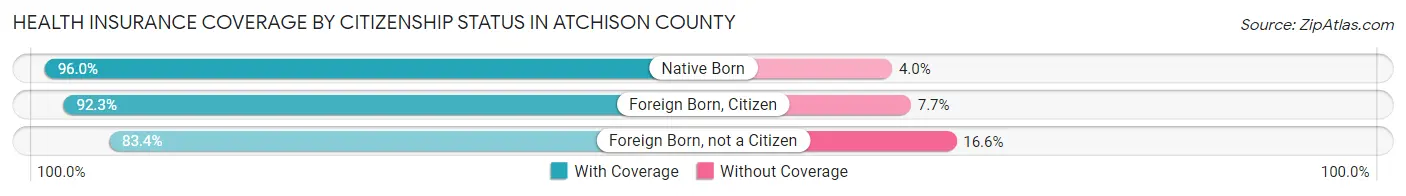
| Citizenship Status | With Coverage | Without Coverage |
| Native Born | 291 (96.0%) | 12 (4.0%) |
| Foreign Born, Citizen | 795 (92.3%) | 66 (7.7%) |
| Foreign Born, not a Citizen | 241 (83.4%) | 48 (16.6%) |
Health Insurance Coverage by Household Income in Atchison County
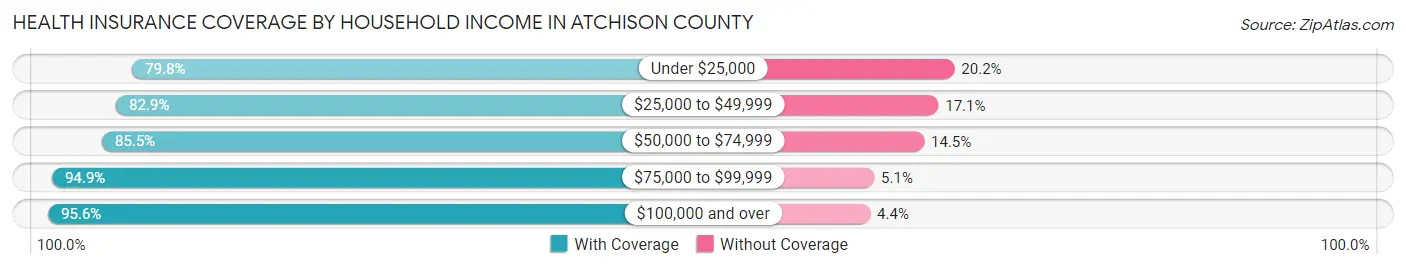
| Household Income | With Coverage | Without Coverage |
| Under $25,000 | 606 (79.8%) | 153 (20.2%) |
| $25,000 to $49,999 | 788 (82.9%) | 163 (17.1%) |
| $50,000 to $74,999 | 1,098 (85.5%) | 186 (14.5%) |
| $75,000 to $99,999 | 592 (94.9%) | 32 (5.1%) |
| $100,000 and over | 1,485 (95.6%) | 68 (4.4%) |
Public vs Private Health Insurance Coverage by Age in Atchison County
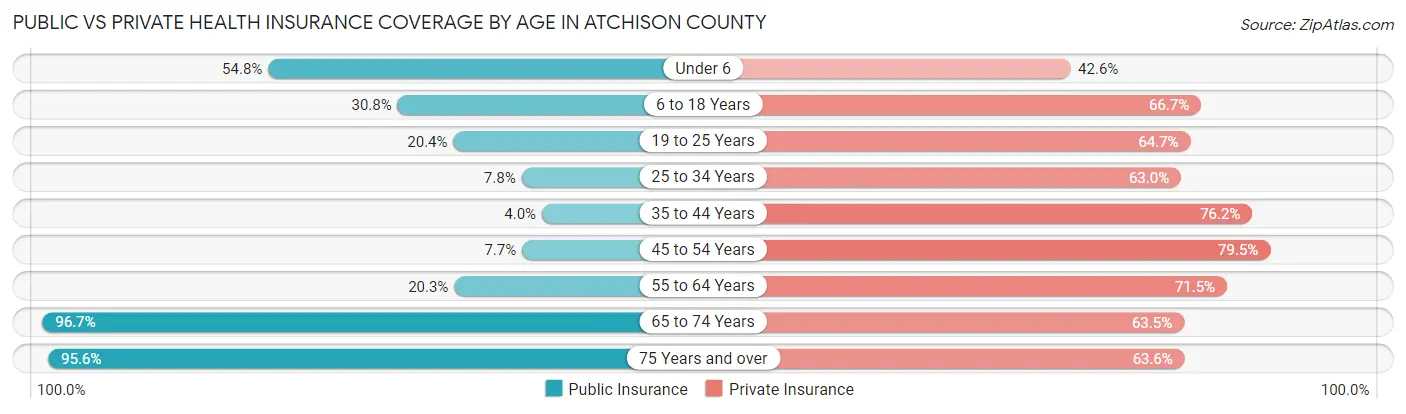
| Age Bracket | Public Insurance | Private Insurance |
| Under 6 | 166 (54.8%) | 129 (42.6%) |
| 6 to 18 Years | 265 (30.8%) | 574 (66.7%) |
| 19 to 25 Years | 59 (20.4%) | 187 (64.7%) |
| 25 to 34 Years | 39 (7.8%) | 316 (62.9%) |
| 35 to 44 Years | 22 (4.0%) | 422 (76.2%) |
| 45 to 54 Years | 49 (7.7%) | 508 (79.5%) |
| 55 to 64 Years | 157 (20.3%) | 554 (71.5%) |
| 65 to 74 Years | 673 (96.7%) | 442 (63.5%) |
| 75 Years and over | 547 (95.6%) | 364 (63.6%) |
| Total | 1,977 (38.1%) | 3,496 (67.3%) |
Disability Status by Sex by Age in Atchison County
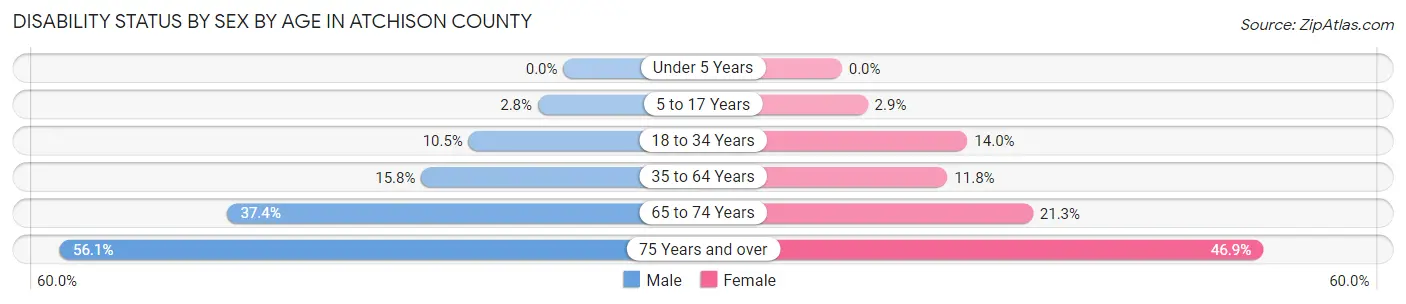
| Age Bracket | Male | Female |
| Under 5 Years | 0 (0.0%) | 0 (0.0%) |
| 5 to 17 Years | 13 (2.8%) | 11 (2.9%) |
| 18 to 34 Years | 45 (10.5%) | 61 (14.0%) |
| 35 to 64 Years | 162 (15.8%) | 111 (11.8%) |
| 65 to 74 Years | 132 (37.4%) | 73 (21.3%) |
| 75 Years and over | 139 (56.0%) | 152 (46.9%) |
Disability Class by Sex by Age in Atchison County
Disability Class: Hearing Difficulty
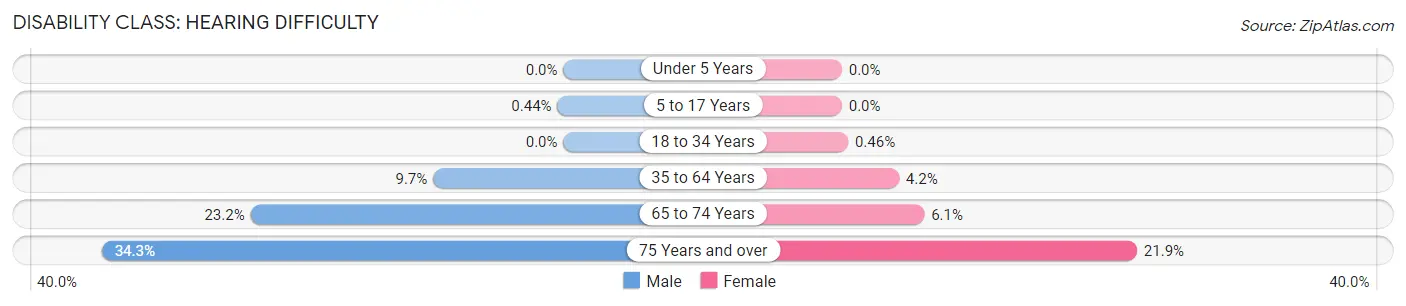
| Age Bracket | Male | Female |
| Under 5 Years | 0 (0.0%) | 0 (0.0%) |
| 5 to 17 Years | 2 (0.4%) | 0 (0.0%) |
| 18 to 34 Years | 0 (0.0%) | 2 (0.5%) |
| 35 to 64 Years | 99 (9.7%) | 40 (4.2%) |
| 65 to 74 Years | 82 (23.2%) | 21 (6.1%) |
| 75 Years and over | 85 (34.3%) | 71 (21.9%) |
Disability Class: Vision Difficulty
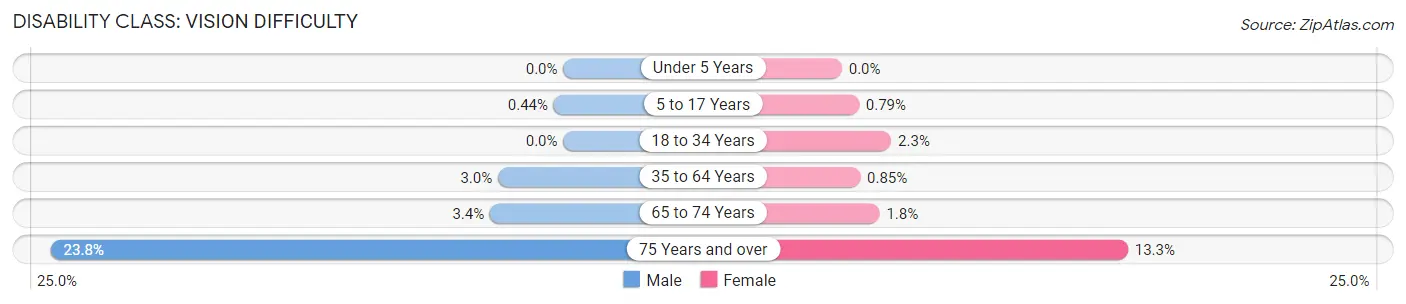
| Age Bracket | Male | Female |
| Under 5 Years | 0 (0.0%) | 0 (0.0%) |
| 5 to 17 Years | 2 (0.4%) | 3 (0.8%) |
| 18 to 34 Years | 0 (0.0%) | 10 (2.3%) |
| 35 to 64 Years | 31 (3.0%) | 8 (0.9%) |
| 65 to 74 Years | 12 (3.4%) | 6 (1.8%) |
| 75 Years and over | 59 (23.8%) | 43 (13.3%) |
Disability Class: Cognitive Difficulty
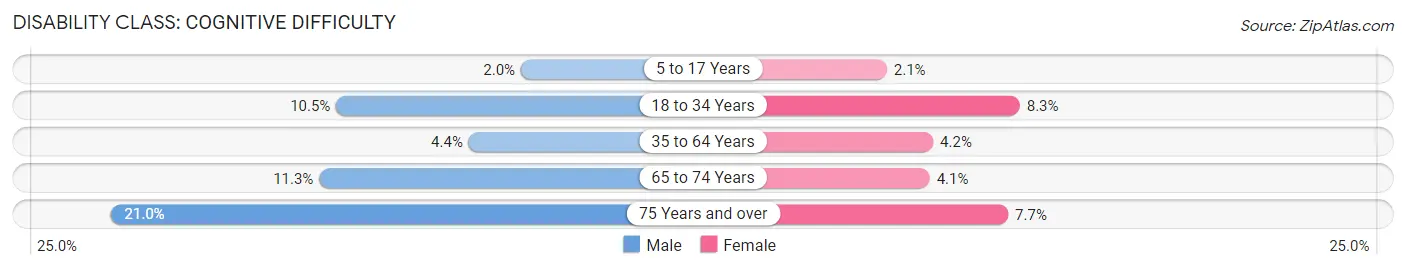
| Age Bracket | Male | Female |
| 5 to 17 Years | 9 (2.0%) | 8 (2.1%) |
| 18 to 34 Years | 45 (10.5%) | 36 (8.3%) |
| 35 to 64 Years | 45 (4.4%) | 40 (4.2%) |
| 65 to 74 Years | 40 (11.3%) | 14 (4.1%) |
| 75 Years and over | 52 (21.0%) | 25 (7.7%) |
Disability Class: Ambulatory Difficulty
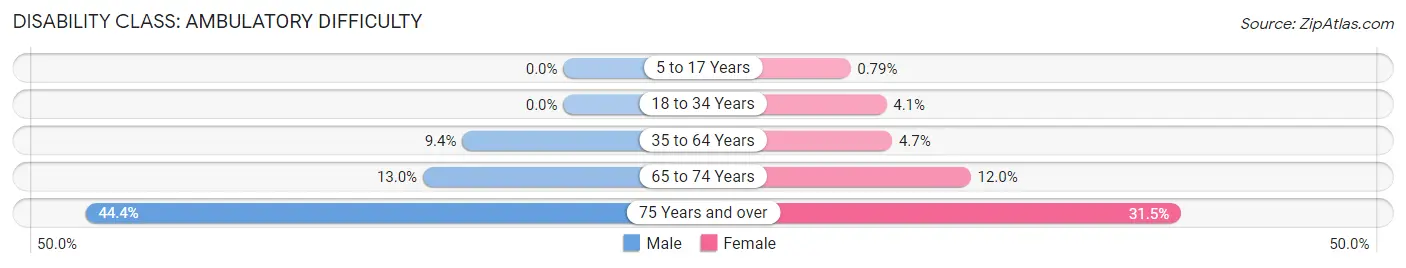
| Age Bracket | Male | Female |
| 5 to 17 Years | 0 (0.0%) | 3 (0.8%) |
| 18 to 34 Years | 0 (0.0%) | 18 (4.1%) |
| 35 to 64 Years | 96 (9.4%) | 44 (4.7%) |
| 65 to 74 Years | 46 (13.0%) | 41 (11.9%) |
| 75 Years and over | 110 (44.4%) | 102 (31.5%) |
Disability Class: Self-Care Difficulty
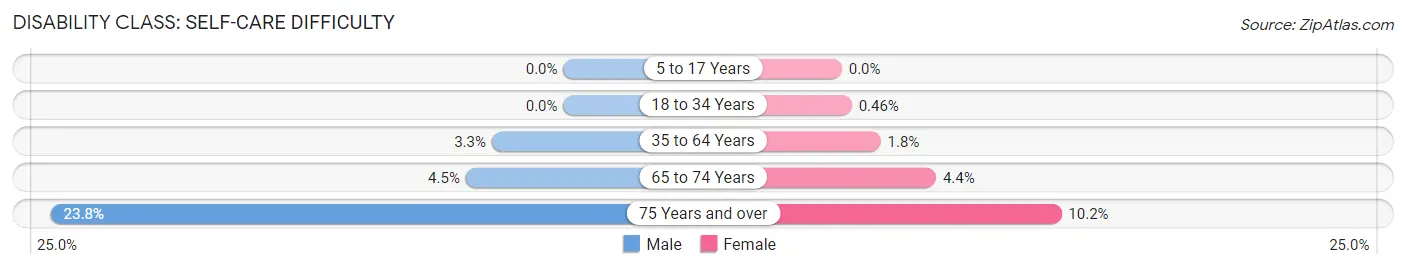
| Age Bracket | Male | Female |
| 5 to 17 Years | 0 (0.0%) | 0 (0.0%) |
| 18 to 34 Years | 0 (0.0%) | 2 (0.5%) |
| 35 to 64 Years | 34 (3.3%) | 17 (1.8%) |
| 65 to 74 Years | 16 (4.5%) | 15 (4.4%) |
| 75 Years and over | 59 (23.8%) | 33 (10.2%) |
Technology Access in Atchison County
Computing Device Access in Atchison County
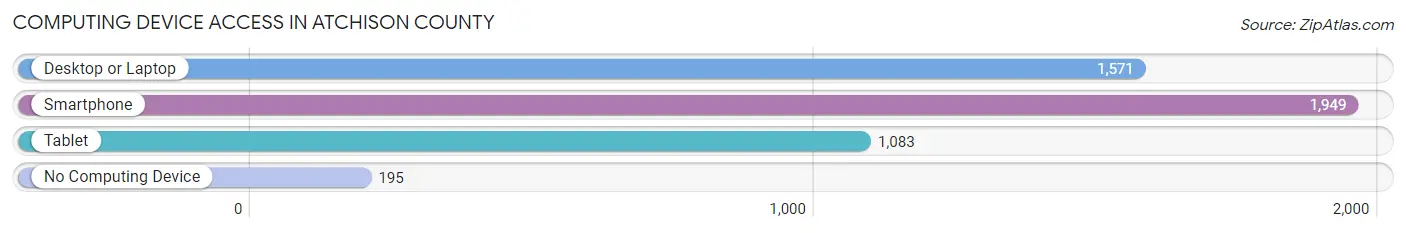
| Device Type | # Households | % Households |
| Desktop or Laptop | 1,571 | 66.8% |
| Smartphone | 1,949 | 82.9% |
| Tablet | 1,083 | 46.1% |
| No Computing Device | 195 | 8.3% |
| Total | 2,351 | 100.0% |
Internet Access in Atchison County
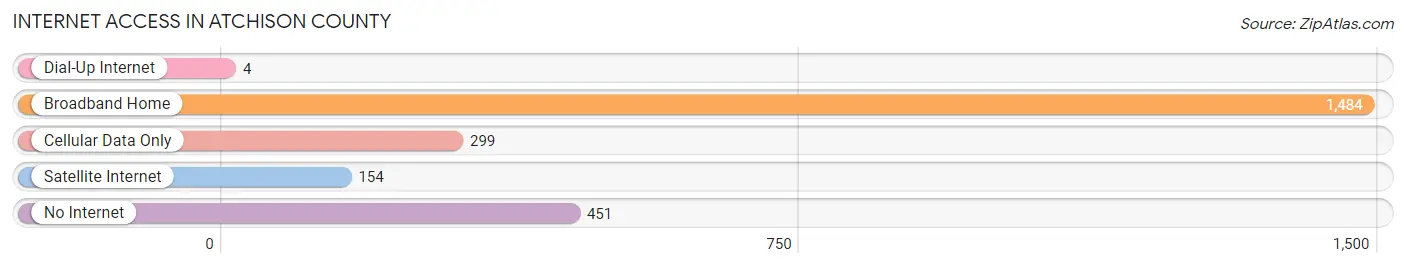
| Internet Type | # Households | % Households |
| Dial-Up Internet | 4 | 0.2% |
| Broadband Home | 1,484 | 63.1% |
| Cellular Data Only | 299 | 12.7% |
| Satellite Internet | 154 | 6.6% |
| No Internet | 451 | 19.2% |
| Total | 2,351 | 100.0% |
Atchison County Summary
Atchison County, Missouri is located in the northwest corner of the state, bordered by Iowa to the north and Nebraska to the west. It is part of the St. Joseph, MO-KS Metropolitan Statistical Area and is the second smallest county in the state. The county seat is Rock Port, and the largest city is Tarkio. The county was organized in 1845 and named after U.S. Senator David Rice Atchison.
Geography
Atchison County is located in the northwest corner of Missouri, bordered by Iowa to the north and Nebraska to the west. It is part of the St. Joseph, MO-KS Metropolitan Statistical Area and is the second smallest county in the state. The county has a total area of 441 square miles, of which 439 square miles is land and 2 square miles (0.5%) is water. The county is mostly flat, with some rolling hills in the east. The highest point in the county is located in the northwest corner, at an elevation of 1,068 feet.
The county is drained by the East Fork of the One Hundred and Two River, which flows through the center of the county. Other major waterways include the West Fork of the One Hundred and Two River, the Tarkio River, and the Nodaway River.
Demographics
As of the 2010 census, there were 5,685 people, 2,269 households, and 1,541 families residing in the county. The population density was 13 people per square mile. The racial makeup of the county was 97.3% White, 0.3% African American, 0.3% Native American, 0.2% Asian, 0.1% Pacific Islander, 0.7% from other races, and 1.1% from two or more races. Hispanic or Latino of any race were 1.7% of the population.
The median income for a household in the county was $37,917, and the median income for a family was $45,938. The per capita income for the county was $18,845. About 11.2% of families and 14.2% of the population were below the poverty line, including 17.2% of those under age 18 and 11.2% of those age 65 or over.
Economy
Atchison County is primarily an agricultural county, with the majority of the land being used for farming. The main crops grown in the county are corn, soybeans, and wheat. Livestock production is also important, with cattle, hogs, and poultry being the main animals raised.
The county also has a number of small businesses, including manufacturing, retail, and service industries. The largest employers in the county are the Atchison County Memorial Hospital, the Atchison County School District, and the Atchison County Courthouse.
History
Atchison County was organized in 1845 and named after U.S. Senator David Rice Atchison. The county seat is Rock Port, and the largest city is Tarkio.
The county was originally inhabited by the Omaha and Otoe tribes, who were later displaced by settlers from the east. The first settlers arrived in the area in the 1830s, and the county was officially organized in 1845.
Atchison County was an important stop on the Pony Express route, and the county seat of Rock Port was a major trading center. The county was also home to several Civil War battles, including the Battle of Tarkio Creek in 1862.
In the late 19th century, the county was home to several coal mines, which provided employment for many of the residents. The coal industry declined in the early 20th century, and the county's economy shifted to agriculture.
Today, Atchison County is a rural county with a population of just over 5,000. The county is still primarily agricultural, with corn, soybeans, and wheat being the main crops. The county also has a number of small businesses, including manufacturing, retail, and service industries.
Common Questions
What is Per Capita Income in Atchison County?
Per Capita income in Atchison County is $32,549.
What is the Median Family Income in Atchison County?
Median Family Income in Atchison County is $66,893.
What is the Median Household income in Atchison County?
Median Household Income in Atchison County is $58,521.
What is Income or Wage Gap in Atchison County?
Income or Wage Gap in Atchison County is 40.4%.
Women in Atchison County earn 59.6 cents for every dollar earned by a man.
What is Family Income Deficit in Atchison County?
Family Income Deficit in Atchison County is $9,553.
Families that are below poverty line in Atchison County earn $9,553 less on average than the poverty threshold level.
What is Inequality or Gini Index in Atchison County?
Inequality or Gini Index in Atchison County is 0.42.
What is the Total Population of Atchison County?
Total Population of Atchison County is 5,270.
What is the Total Male Population of Atchison County?
Total Male Population of Atchison County is 2,666.
What is the Total Female Population of Atchison County?
Total Female Population of Atchison County is 2,604.
What is the Ratio of Males per 100 Females in Atchison County?
There are 102.38 Males per 100 Females in Atchison County.
What is the Ratio of Females per 100 Males in Atchison County?
There are 97.67 Females per 100 Males in Atchison County.
What is the Median Population Age in Atchison County?
Median Population Age in Atchison County is 48.1 Years.
What is the Average Family Size in Atchison County
Average Family Size in Atchison County is 2.8 People.
What is the Average Household Size in Atchison County
Average Household Size in Atchison County is 2.2 People.
How Large is the Labor Force in Atchison County?
There are 2,612 People in the Labor Forcein in Atchison County.
What is the Percentage of People in the Labor Force in Atchison County?
60.9% of People are in the Labor Force in Atchison County.
What is the Unemployment Rate in Atchison County?
Unemployment Rate in Atchison County is 2.6%.