Andrew County, MO Map & Demographics
Andrew County Map
Andrew County Overview
$33,722
PER CAPITA INCOME
$89,200
AVG FAMILY INCOME
$68,774
AVG HOUSEHOLD INCOME
35.8%
WAGE / INCOME GAP [ % ]
64.2¢/ $1
WAGE / INCOME GAP [ $ ]
$7,011
FAMILY INCOME DEFICIT
0.40
INEQUALITY / GINI INDEX
18,069
TOTAL POPULATION
9,113
MALE POPULATION
8,956
FEMALE POPULATION
101.75
MALES / 100 FEMALES
98.28
FEMALES / 100 MALES
41.5
MEDIAN AGE
3.2
AVG FAMILY SIZE
2.6
AVG HOUSEHOLD SIZE
9,046
LABOR FORCE [ PEOPLE ]
63.1%
PERCENT IN LABOR FORCE
4.1%
UNEMPLOYMENT RATE
Andrew County Area Codes
Income in Andrew County
Income Overview in Andrew County
Per Capita Income in Andrew County is $33,722, while median incomes of families and households are $89,200 and $68,774 respectively.
| Characteristic | Number | Measure |
| Per Capita Income | 18,069 | $33,722 |
| Median Family Income | 4,732 | $89,200 |
| Mean Family Income | 4,732 | $98,131 |
| Median Household Income | 6,865 | $68,774 |
| Mean Household Income | 6,865 | $83,098 |
| Income Deficit | 4,732 | $7,011 |
| Wage / Income Gap (%) | 18,069 | 35.78% |
| Wage / Income Gap ($) | 18,069 | 64.22¢ per $1 |
| Gini / Inequality Index | 18,069 | 0.40 |
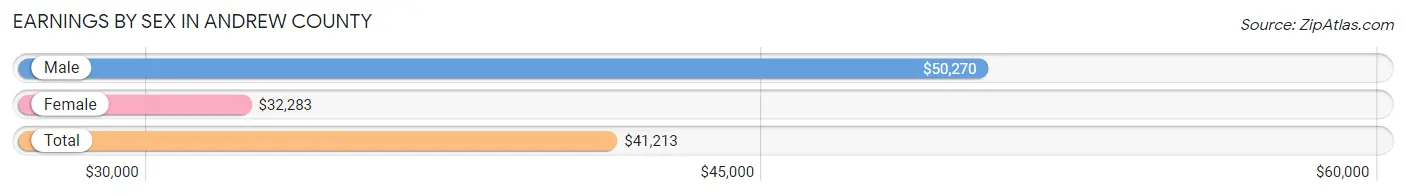
Earnings by Sex in Andrew County
Average Earnings in Andrew County are $41,213, $50,270 for men and $32,283 for women, a difference of 35.8%.
| Sex | Number | Average Earnings |
| Male | 4,886 (52.3%) | $50,270 |
| Female | 4,462 (47.7%) | $32,283 |
| Total | 9,348 (100.0%) | $41,213 |
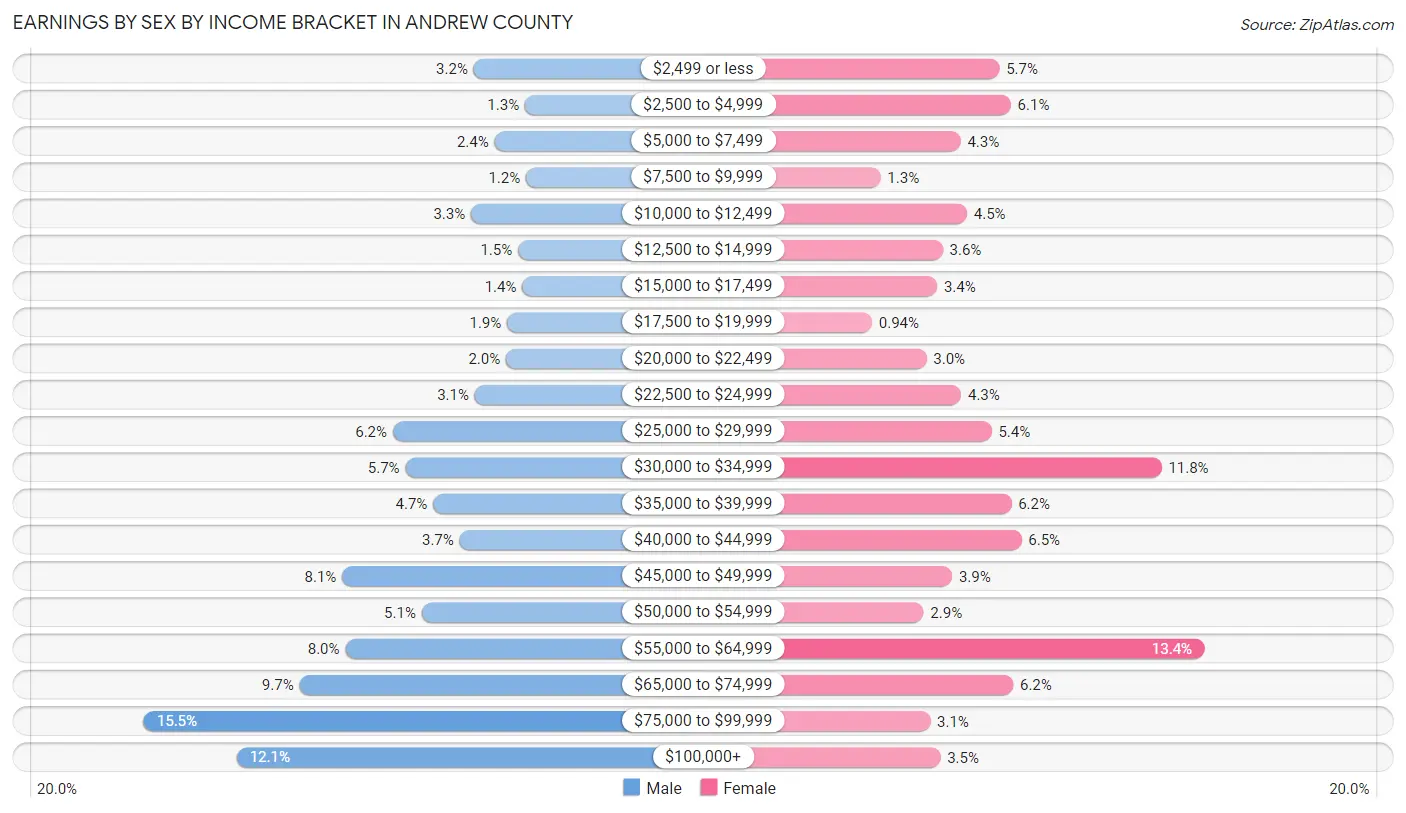
Earnings by Sex by Income Bracket in Andrew County
The most common earnings brackets in Andrew County are $75,000 to $99,999 for men (759 | 15.5%) and $55,000 to $64,999 for women (597 | 13.4%).
| Income | Male | Female |
| $2,499 or less | 155 (3.2%) | 255 (5.7%) |
| $2,500 to $4,999 | 61 (1.3%) | 274 (6.1%) |
| $5,000 to $7,499 | 117 (2.4%) | 190 (4.3%) |
| $7,500 to $9,999 | 59 (1.2%) | 56 (1.3%) |
| $10,000 to $12,499 | 160 (3.3%) | 201 (4.5%) |
| $12,500 to $14,999 | 74 (1.5%) | 160 (3.6%) |
| $15,000 to $17,499 | 66 (1.3%) | 151 (3.4%) |
| $17,500 to $19,999 | 94 (1.9%) | 42 (0.9%) |
| $20,000 to $22,499 | 96 (2.0%) | 133 (3.0%) |
| $22,500 to $24,999 | 153 (3.1%) | 191 (4.3%) |
| $25,000 to $29,999 | 303 (6.2%) | 242 (5.4%) |
| $30,000 to $34,999 | 280 (5.7%) | 526 (11.8%) |
| $35,000 to $39,999 | 229 (4.7%) | 275 (6.2%) |
| $40,000 to $44,999 | 181 (3.7%) | 292 (6.5%) |
| $45,000 to $49,999 | 396 (8.1%) | 176 (3.9%) |
| $50,000 to $54,999 | 250 (5.1%) | 128 (2.9%) |
| $55,000 to $64,999 | 390 (8.0%) | 597 (13.4%) |
| $65,000 to $74,999 | 474 (9.7%) | 278 (6.2%) |
| $75,000 to $99,999 | 759 (15.5%) | 139 (3.1%) |
| $100,000+ | 589 (12.0%) | 156 (3.5%) |
| Total | 4,886 (100.0%) | 4,462 (100.0%) |
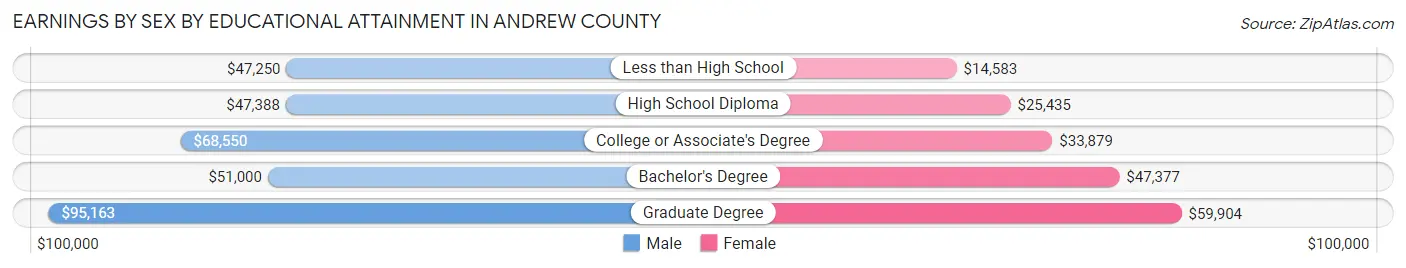
Earnings by Sex by Educational Attainment in Andrew County
Average earnings in Andrew County are $56,290 for men and $35,278 for women, a difference of 37.3%. Men with an educational attainment of graduate degree enjoy the highest average annual earnings of $95,163, while those with less than high school education earn the least with $47,250. Women with an educational attainment of graduate degree earn the most with the average annual earnings of $59,904, while those with less than high school education have the smallest earnings of $14,583.
| Educational Attainment | Male Income | Female Income |
| Less than High School | $47,250 | $14,583 |
| High School Diploma | $47,388 | $25,435 |
| College or Associate's Degree | $68,550 | $33,879 |
| Bachelor's Degree | $51,000 | $47,377 |
| Graduate Degree | $95,163 | $59,904 |
| Total | $56,290 | $35,278 |
Family Income in Andrew County
Family Income Brackets in Andrew County
According to the Andrew County family income data, there are 1,249 families falling into the $100,000 to $149,999 income range, which is the most common income bracket and makes up 26.4% of all families. Conversely, the less than $10,000 income bracket is the least frequent group with only 33 families (0.7%) belonging to this category.
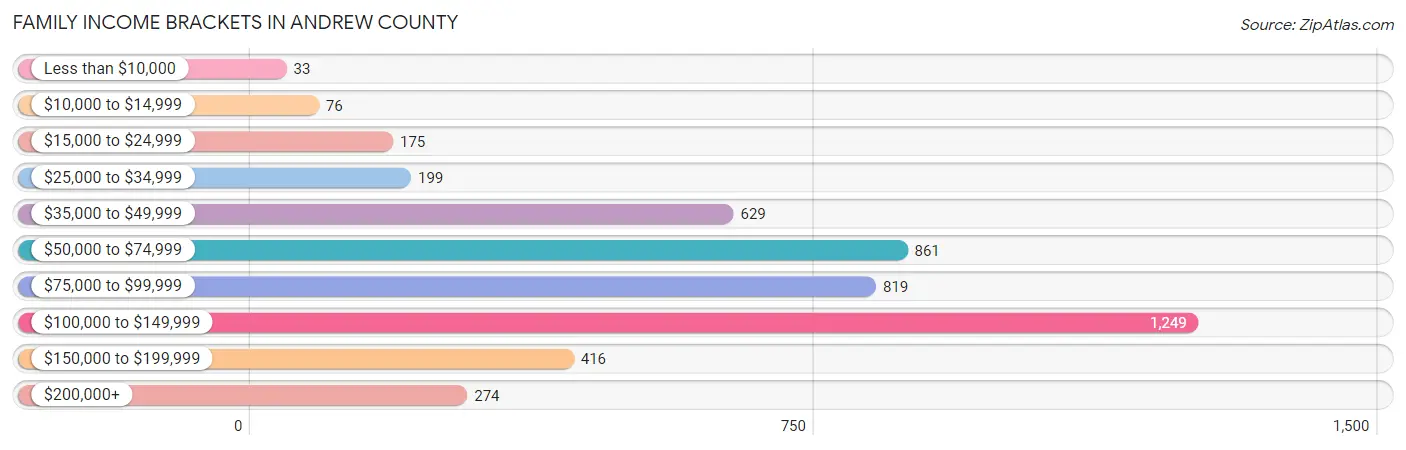
| Income Bracket | # Families | % Families |
| Less than $10,000 | 33 | 0.7% |
| $10,000 to $14,999 | 76 | 1.6% |
| $15,000 to $24,999 | 175 | 3.7% |
| $25,000 to $34,999 | 199 | 4.2% |
| $35,000 to $49,999 | 629 | 13.3% |
| $50,000 to $74,999 | 861 | 18.2% |
| $75,000 to $99,999 | 819 | 17.3% |
| $100,000 to $149,999 | 1,249 | 26.4% |
| $150,000 to $199,999 | 416 | 8.8% |
| $200,000+ | 274 | 5.8% |
Family Income by Famaliy Size in Andrew County
6-person families (96 | 2.0%) account for the highest median family income in Andrew County with $125,500 per family, while 2-person families (2,529 | 53.4%) have the highest median income of $37,003 per family member.
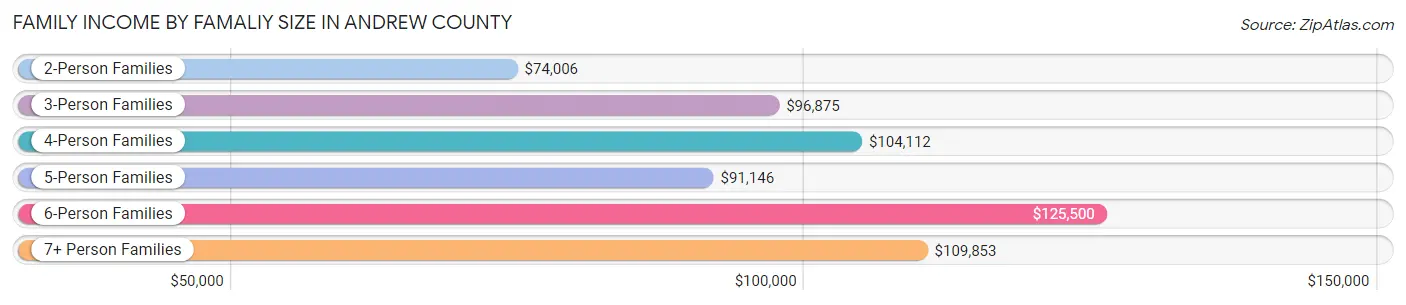
| Income Bracket | # Families | Median Income |
| 2-Person Families | 2,529 (53.4%) | $74,006 |
| 3-Person Families | 999 (21.1%) | $96,875 |
| 4-Person Families | 787 (16.6%) | $104,112 |
| 5-Person Families | 253 (5.3%) | $91,146 |
| 6-Person Families | 96 (2.0%) | $125,500 |
| 7+ Person Families | 68 (1.4%) | $109,853 |
| Total | 4,732 (100.0%) | $89,200 |
Family Income by Number of Earners in Andrew County
The median family income in Andrew County is $89,200, with families comprising 3+ earners (484) having the highest median family income of $126,167, while families with no earners (789) have the lowest median family income of $43,317, accounting for 10.2% and 16.7% of families, respectively.
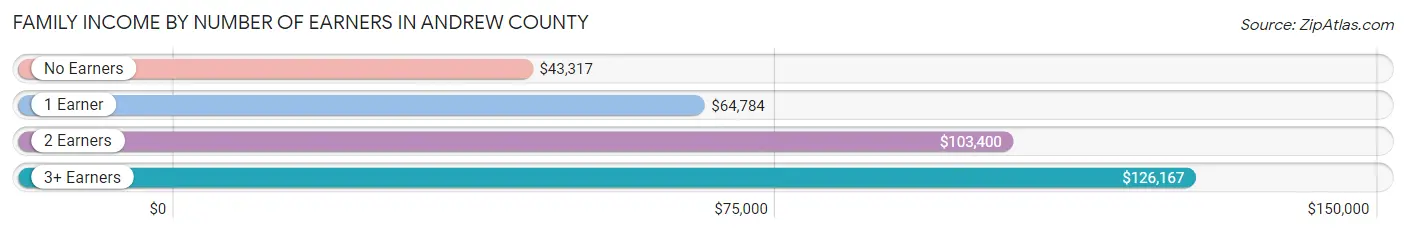
| Number of Earners | # Families | Median Income |
| No Earners | 789 (16.7%) | $43,317 |
| 1 Earner | 1,519 (32.1%) | $64,784 |
| 2 Earners | 1,940 (41.0%) | $103,400 |
| 3+ Earners | 484 (10.2%) | $126,167 |
| Total | 4,732 (100.0%) | $89,200 |
Household Income in Andrew County
Household Income Brackets in Andrew County
With 1,366 households falling in the category, the $100,000 to $149,999 income range is the most frequent in Andrew County, accounting for 19.9% of all households. In contrast, only 227 households (3.3%) fall into the less than $10,000 income bracket, making it the least populous group.
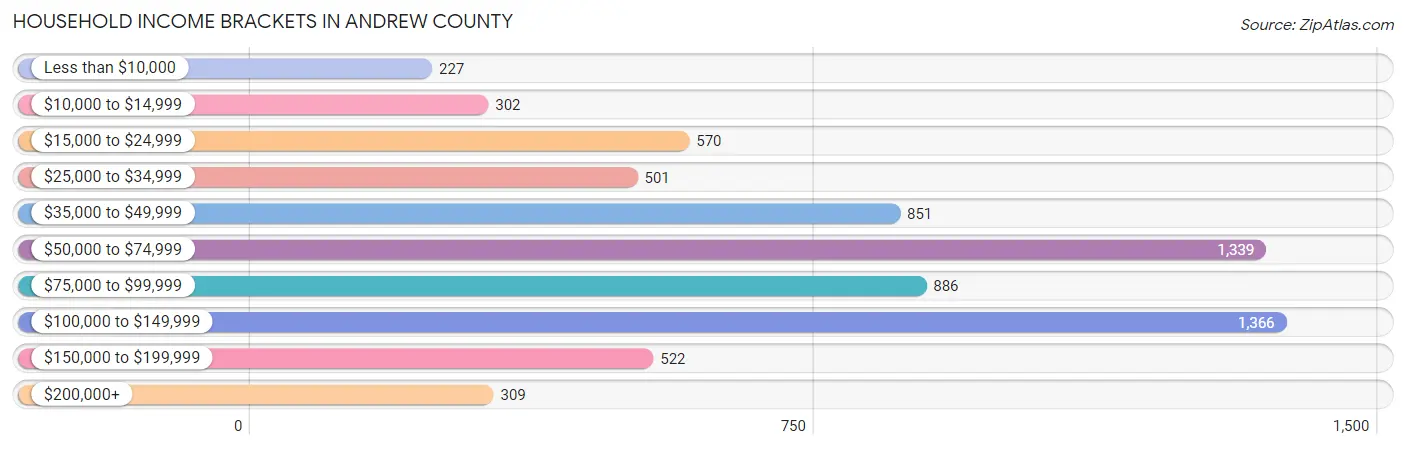
| Income Bracket | # Households | % Households |
| Less than $10,000 | 227 | 3.3% |
| $10,000 to $14,999 | 302 | 4.4% |
| $15,000 to $24,999 | 570 | 8.3% |
| $25,000 to $34,999 | 501 | 7.3% |
| $35,000 to $49,999 | 851 | 12.4% |
| $50,000 to $74,999 | 1,339 | 19.5% |
| $75,000 to $99,999 | 886 | 12.9% |
| $100,000 to $149,999 | 1,366 | 19.9% |
| $150,000 to $199,999 | 522 | 7.6% |
| $200,000+ | 309 | 4.5% |
Household Income by Householder Age in Andrew County
The median household income in Andrew County is $68,774, with the highest median household income of $86,993 found in the 45 to 64 years age bracket for the primary householder. A total of 2,462 households (35.9%) fall into this category. Meanwhile, the 65+ years age bracket for the primary householder has the lowest median household income of $41,156, with 2,256 households (32.9%) in this group.
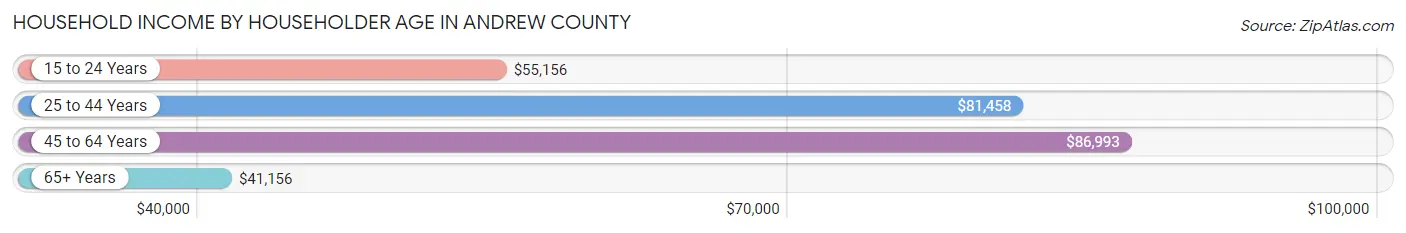
| Income Bracket | # Households | Median Income |
| 15 to 24 Years | 176 (2.6%) | $55,156 |
| 25 to 44 Years | 1,971 (28.7%) | $81,458 |
| 45 to 64 Years | 2,462 (35.9%) | $86,993 |
| 65+ Years | 2,256 (32.9%) | $41,156 |
| Total | 6,865 (100.0%) | $68,774 |
Poverty in Andrew County
Income Below Poverty by Sex and Age in Andrew County
With 5.4% poverty level for males and 9.8% for females among the residents of Andrew County, 6 to 11 year old males and 15 year old females are the most vulnerable to poverty, with 88 males (11.4%) and 28 females (27.5%) in their respective age groups living below the poverty level.
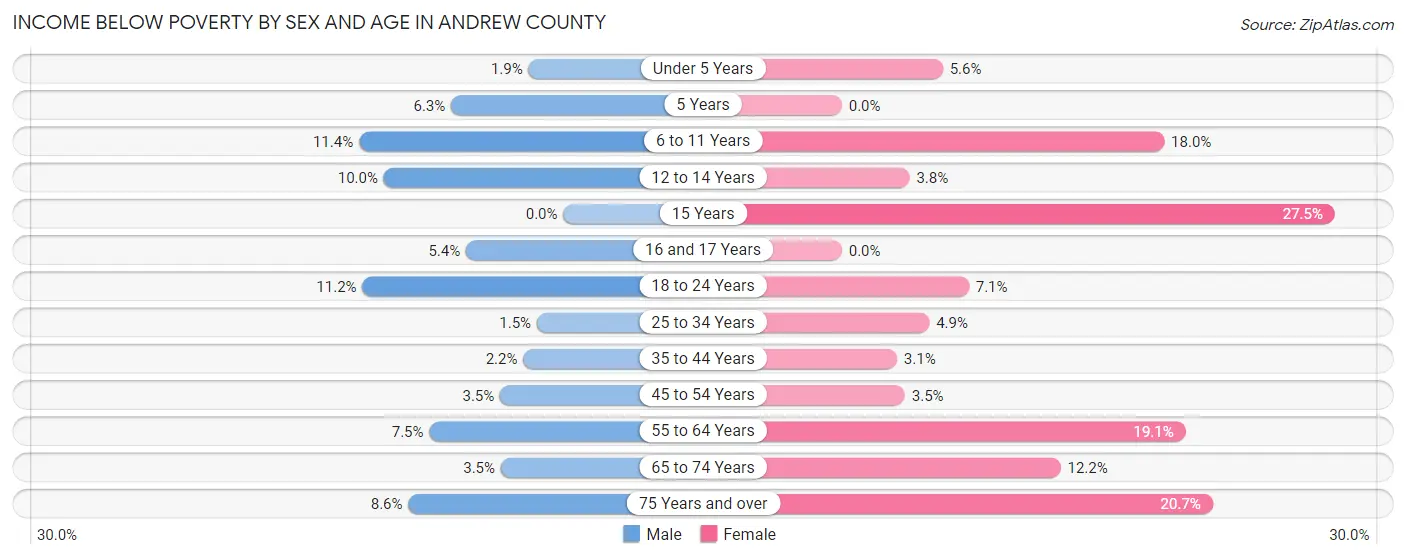
| Age Bracket | Male | Female |
| Under 5 Years | 11 (1.9%) | 25 (5.6%) |
| 5 Years | 8 (6.2%) | 0 (0.0%) |
| 6 to 11 Years | 88 (11.4%) | 93 (17.9%) |
| 12 to 14 Years | 29 (10.0%) | 18 (3.8%) |
| 15 Years | 0 (0.0%) | 28 (27.5%) |
| 16 and 17 Years | 9 (5.4%) | 0 (0.0%) |
| 18 to 24 Years | 77 (11.2%) | 41 (7.1%) |
| 25 to 34 Years | 15 (1.5%) | 50 (4.9%) |
| 35 to 44 Years | 25 (2.2%) | 33 (3.1%) |
| 45 to 54 Years | 39 (3.5%) | 38 (3.5%) |
| 55 to 64 Years | 96 (7.5%) | 244 (19.1%) |
| 65 to 74 Years | 37 (3.5%) | 127 (12.2%) |
| 75 Years and over | 51 (8.6%) | 164 (20.6%) |
| Total | 485 (5.4%) | 861 (9.8%) |
Income Above Poverty by Sex and Age in Andrew County
According to the poverty statistics in Andrew County, males aged 15 years and females aged 5 years are the age groups that are most secure financially, with 100.0% of males and 100.0% of females in these age groups living above the poverty line.
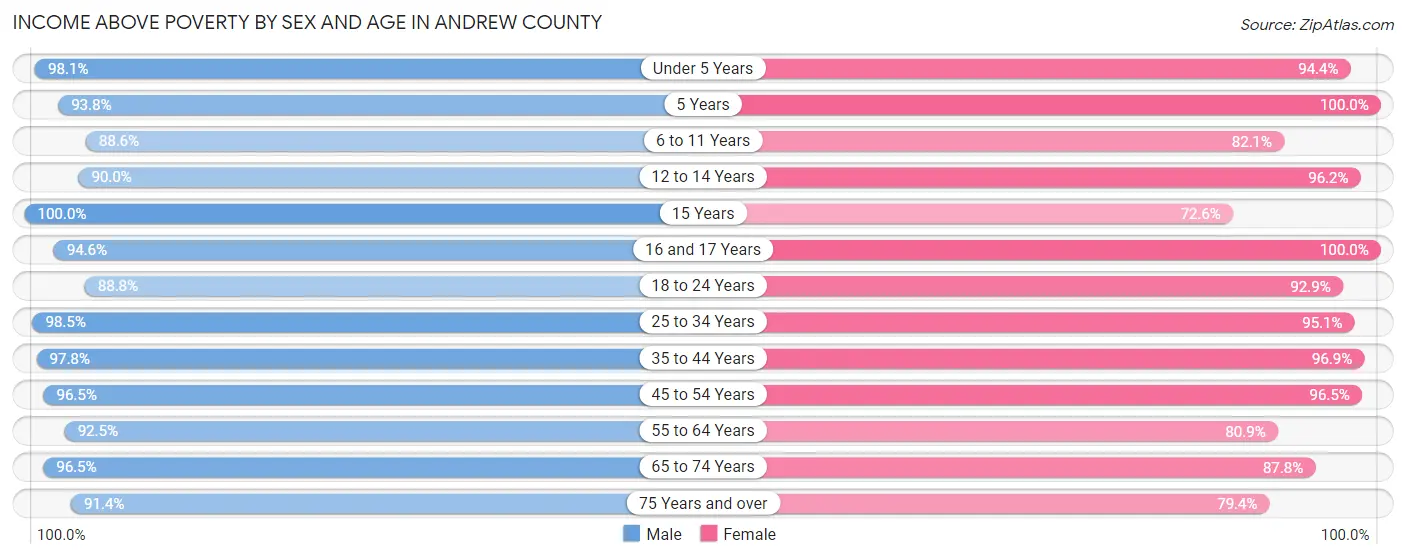
| Age Bracket | Male | Female |
| Under 5 Years | 555 (98.1%) | 420 (94.4%) |
| 5 Years | 120 (93.8%) | 129 (100.0%) |
| 6 to 11 Years | 685 (88.6%) | 425 (82.1%) |
| 12 to 14 Years | 261 (90.0%) | 459 (96.2%) |
| 15 Years | 178 (100.0%) | 74 (72.6%) |
| 16 and 17 Years | 157 (94.6%) | 243 (100.0%) |
| 18 to 24 Years | 611 (88.8%) | 539 (92.9%) |
| 25 to 34 Years | 1,004 (98.5%) | 976 (95.1%) |
| 35 to 44 Years | 1,094 (97.8%) | 1,041 (96.9%) |
| 45 to 54 Years | 1,070 (96.5%) | 1,045 (96.5%) |
| 55 to 64 Years | 1,191 (92.5%) | 1,031 (80.9%) |
| 65 to 74 Years | 1,027 (96.5%) | 916 (87.8%) |
| 75 Years and over | 540 (91.4%) | 630 (79.3%) |
| Total | 8,493 (94.6%) | 7,928 (90.2%) |
Income Below Poverty Among Married-Couple Families in Andrew County
The poverty statistics for married-couple families in Andrew County show that 3.3% or 129 of the total 3,872 families live below the poverty line. Families with 3 or 4 children have the highest poverty rate of 7.8%, comprising of 17 families. On the other hand, families with 5 or more children have the lowest poverty rate of 0.0%, which includes 0 families.
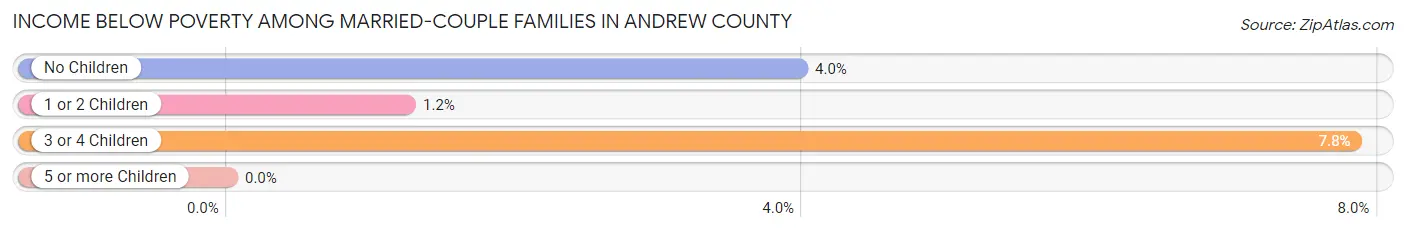
| Children | Above Poverty | Below Poverty |
| No Children | 2,348 (96.0%) | 97 (4.0%) |
| 1 or 2 Children | 1,193 (98.8%) | 15 (1.2%) |
| 3 or 4 Children | 200 (92.2%) | 17 (7.8%) |
| 5 or more Children | 2 (100.0%) | 0 (0.0%) |
| Total | 3,743 (96.7%) | 129 (3.3%) |
Income Below Poverty Among Single-Parent Households in Andrew County
According to the poverty data in Andrew County, 7.9% or 19 single-father households and 10.4% or 64 single-mother households are living below the poverty line. Among single-father households, those with no children have the highest poverty rate, with 17 households (15.7%) experiencing poverty. Likewise, among single-mother households, those with 1 or 2 children have the highest poverty rate, with 43 households (10.8%) falling below the poverty line.
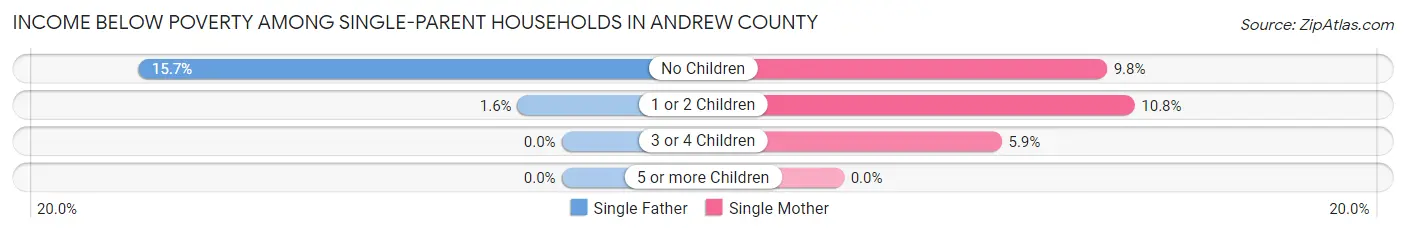
| Children | Single Father | Single Mother |
| No Children | 17 (15.7%) | 20 (9.8%) |
| 1 or 2 Children | 2 (1.6%) | 43 (10.8%) |
| 3 or 4 Children | 0 (0.0%) | 1 (5.9%) |
| 5 or more Children | 0 (0.0%) | 0 (0.0%) |
| Total | 19 (7.9%) | 64 (10.4%) |
Income Below Poverty Among Married-Couple vs Single-Parent Households in Andrew County
The poverty data for Andrew County shows that 129 of the married-couple family households (3.3%) and 83 of the single-parent households (9.7%) are living below the poverty level. Within the married-couple family households, those with 3 or 4 children have the highest poverty rate, with 17 households (7.8%) falling below the poverty line. Among the single-parent households, those with no children have the highest poverty rate, with 37 household (11.9%) living below poverty.
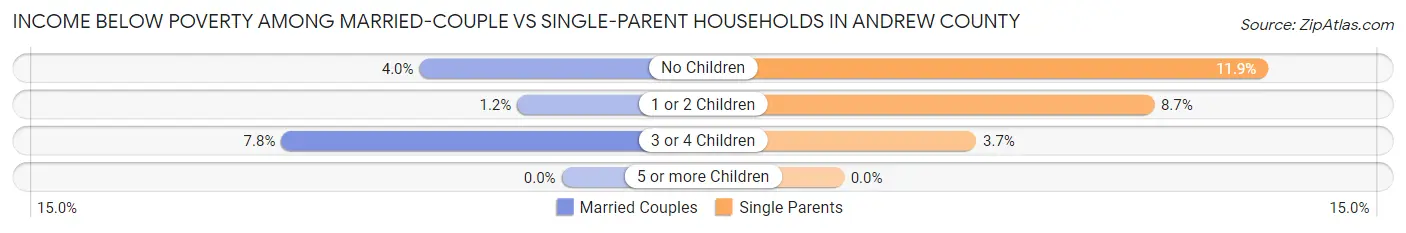
| Children | Married-Couple Families | Single-Parent Households |
| No Children | 97 (4.0%) | 37 (11.9%) |
| 1 or 2 Children | 15 (1.2%) | 45 (8.7%) |
| 3 or 4 Children | 17 (7.8%) | 1 (3.7%) |
| 5 or more Children | 0 (0.0%) | 0 (0.0%) |
| Total | 129 (3.3%) | 83 (9.7%) |
Race in Andrew County
The most populous races in Andrew County are White / Caucasian (16,917 | 93.6%), Two or more Races (792 | 4.4%), and Hispanic or Latino (485 | 2.7%).
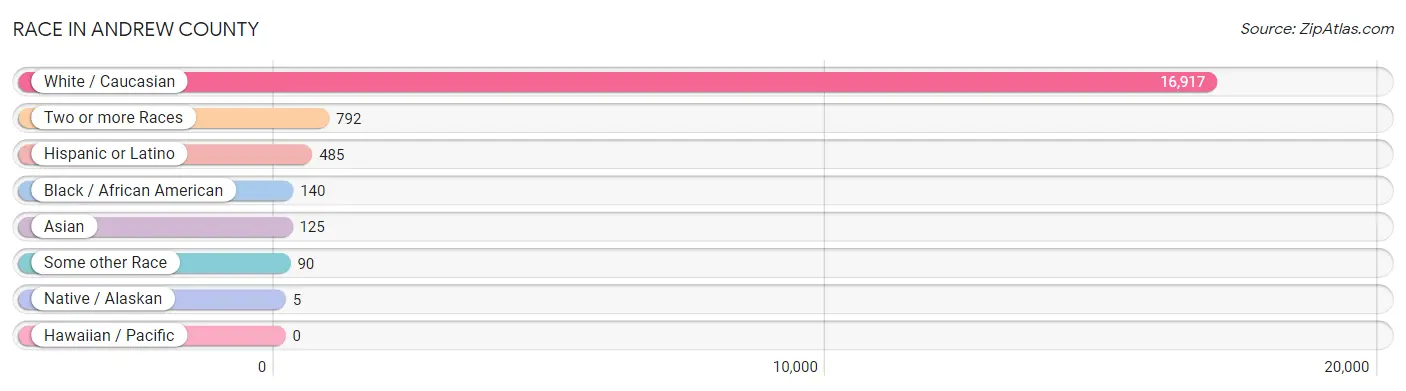
| Race | # Population | % Population |
| Asian | 125 | 0.7% |
| Black / African American | 140 | 0.8% |
| Hawaiian / Pacific | 0 | 0.0% |
| Hispanic or Latino | 485 | 2.7% |
| Native / Alaskan | 5 | 0.0% |
| White / Caucasian | 16,917 | 93.6% |
| Two or more Races | 792 | 4.4% |
| Some other Race | 90 | 0.5% |
| Total | 18,069 | 100.0% |
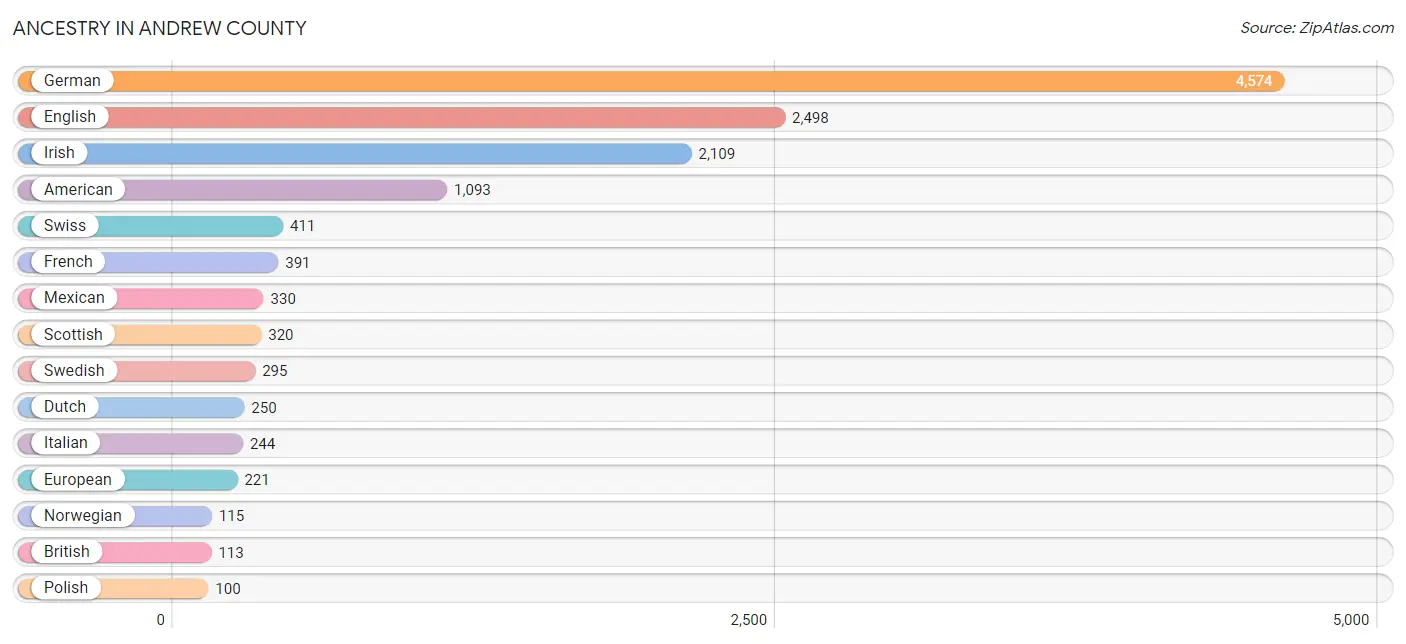
Ancestry in Andrew County
The most populous ancestries reported in Andrew County are German (4,574 | 25.3%), English (2,498 | 13.8%), Irish (2,109 | 11.7%), American (1,093 | 6.0%), and Swiss (411 | 2.3%), together accounting for 59.1% of all Andrew County residents.
| Ancestry | # Population | % Population |
| African | 12 | 0.1% |
| American | 1,093 | 6.0% |
| Arab | 54 | 0.3% |
| Austrian | 21 | 0.1% |
| Bangladeshi | 29 | 0.2% |
| Belgian | 4 | 0.0% |
| Bhutanese | 21 | 0.1% |
| British | 113 | 0.6% |
| Canadian | 17 | 0.1% |
| Central American | 41 | 0.2% |
| Cherokee | 23 | 0.1% |
| Colombian | 5 | 0.0% |
| Costa Rican | 10 | 0.1% |
| Cuban | 16 | 0.1% |
| Czech | 17 | 0.1% |
| Czechoslovakian | 15 | 0.1% |
| Danish | 51 | 0.3% |
| Dutch | 250 | 1.4% |
| Dutch West Indian | 15 | 0.1% |
| Eastern European | 10 | 0.1% |
| English | 2,498 | 13.8% |
| European | 221 | 1.2% |
| French | 391 | 2.2% |
| French Canadian | 4 | 0.0% |
| German | 4,574 | 25.3% |
| Greek | 9 | 0.1% |
| Hungarian | 13 | 0.1% |
| Indian (Asian) | 4 | 0.0% |
| Irish | 2,109 | 11.7% |
| Italian | 244 | 1.3% |
| Korean | 4 | 0.0% |
| Mexican | 330 | 1.8% |
| Norwegian | 115 | 0.6% |
| Pakistani | 10 | 0.1% |
| Polish | 100 | 0.5% |
| Portuguese | 6 | 0.0% |
| Puerto Rican | 2 | 0.0% |
| Russian | 22 | 0.1% |
| Salvadoran | 31 | 0.2% |
| Scandinavian | 8 | 0.0% |
| Scotch-Irish | 77 | 0.4% |
| Scottish | 320 | 1.8% |
| South American | 5 | 0.0% |
| Spaniard | 85 | 0.5% |
| Spanish | 6 | 0.0% |
| Subsaharan African | 12 | 0.1% |
| Swedish | 295 | 1.6% |
| Swiss | 411 | 2.3% |
| Syrian | 54 | 0.3% |
| Thai | 78 | 0.4% |
| Ukrainian | 19 | 0.1% |
| Welsh | 99 | 0.5% | View All 52 Rows |
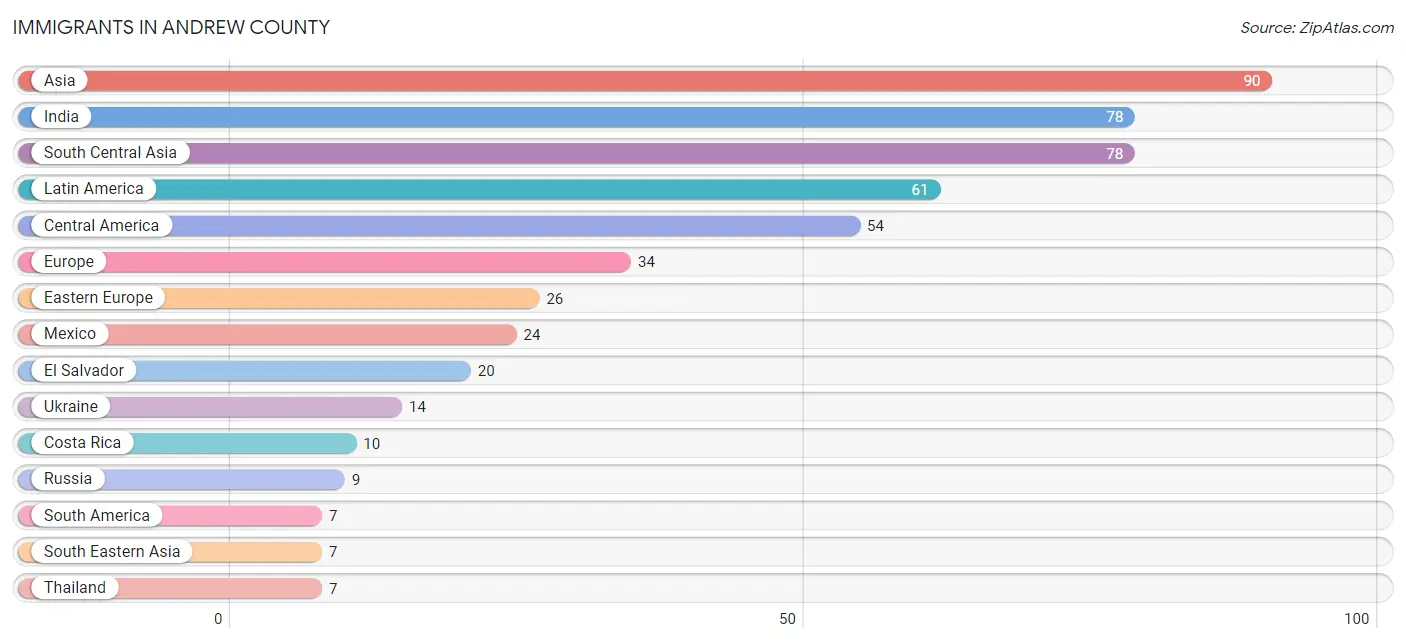
Immigrants in Andrew County
The most numerous immigrant groups reported in Andrew County came from Asia (90 | 0.5%), India (78 | 0.4%), South Central Asia (78 | 0.4%), Latin America (61 | 0.3%), and Central America (54 | 0.3%), together accounting for 2.0% of all Andrew County residents.
| Immigration Origin | # Population | % Population |
| Asia | 90 | 0.5% |
| Brazil | 2 | 0.0% |
| Canada | 1 | 0.0% |
| Central America | 54 | 0.3% |
| China | 4 | 0.0% |
| Colombia | 5 | 0.0% |
| Costa Rica | 10 | 0.1% |
| Eastern Asia | 5 | 0.0% |
| Eastern Europe | 26 | 0.1% |
| El Salvador | 20 | 0.1% |
| England | 6 | 0.0% |
| Europe | 34 | 0.2% |
| Germany | 2 | 0.0% |
| India | 78 | 0.4% |
| Japan | 1 | 0.0% |
| Latin America | 61 | 0.3% |
| Mexico | 24 | 0.1% |
| Northern Europe | 6 | 0.0% |
| Poland | 3 | 0.0% |
| Russia | 9 | 0.1% |
| South America | 7 | 0.0% |
| South Central Asia | 78 | 0.4% |
| South Eastern Asia | 7 | 0.0% |
| Thailand | 7 | 0.0% |
| Ukraine | 14 | 0.1% |
| Western Europe | 2 | 0.0% | View All 26 Rows |
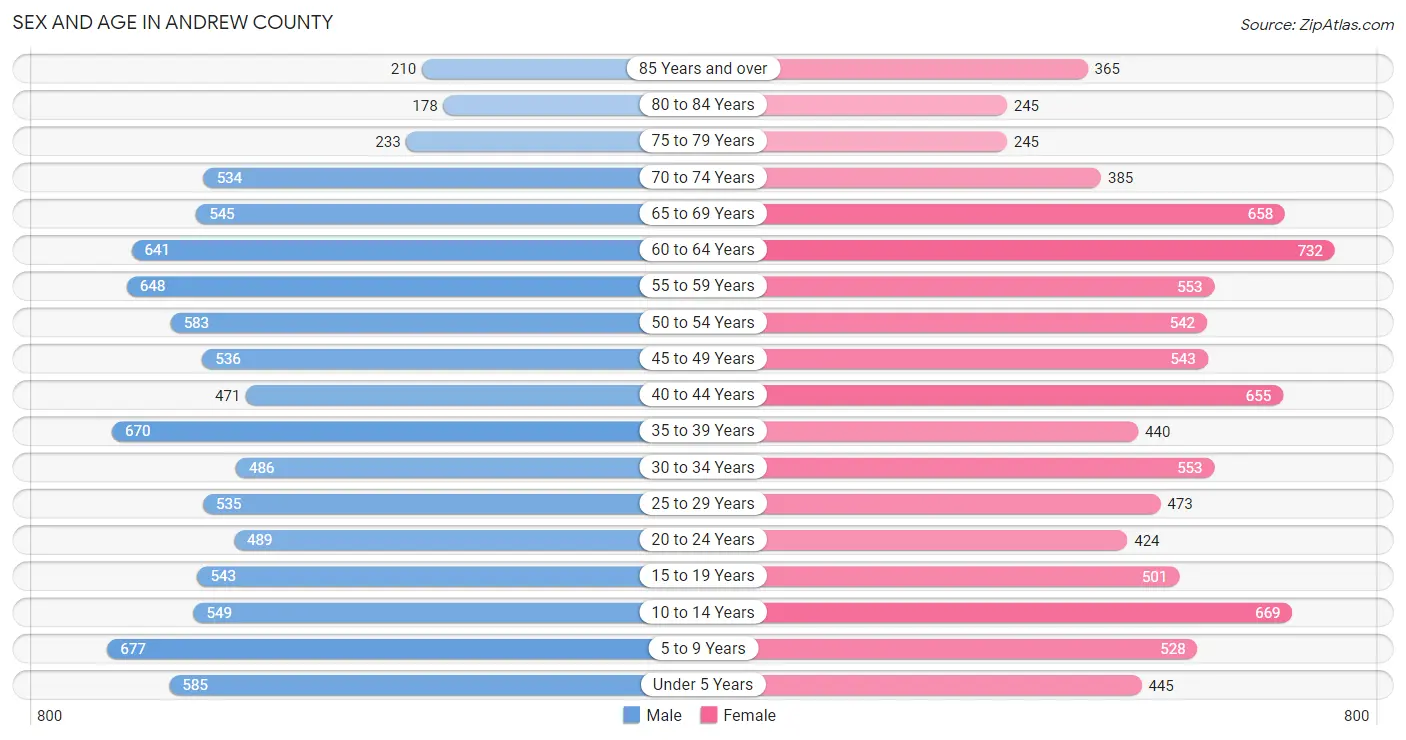
Sex and Age in Andrew County
Sex and Age in Andrew County
The most populous age groups in Andrew County are 5 to 9 Years (677 | 7.4%) for men and 60 to 64 Years (732 | 8.2%) for women.
| Age Bracket | Male | Female |
| Under 5 Years | 585 (6.4%) | 445 (5.0%) |
| 5 to 9 Years | 677 (7.4%) | 528 (5.9%) |
| 10 to 14 Years | 549 (6.0%) | 669 (7.5%) |
| 15 to 19 Years | 543 (6.0%) | 501 (5.6%) |
| 20 to 24 Years | 489 (5.4%) | 424 (4.7%) |
| 25 to 29 Years | 535 (5.9%) | 473 (5.3%) |
| 30 to 34 Years | 486 (5.3%) | 553 (6.2%) |
| 35 to 39 Years | 670 (7.3%) | 440 (4.9%) |
| 40 to 44 Years | 471 (5.2%) | 655 (7.3%) |
| 45 to 49 Years | 536 (5.9%) | 543 (6.1%) |
| 50 to 54 Years | 583 (6.4%) | 542 (6.0%) |
| 55 to 59 Years | 648 (7.1%) | 553 (6.2%) |
| 60 to 64 Years | 641 (7.0%) | 732 (8.2%) |
| 65 to 69 Years | 545 (6.0%) | 658 (7.3%) |
| 70 to 74 Years | 534 (5.9%) | 385 (4.3%) |
| 75 to 79 Years | 233 (2.6%) | 245 (2.7%) |
| 80 to 84 Years | 178 (1.9%) | 245 (2.7%) |
| 85 Years and over | 210 (2.3%) | 365 (4.1%) |
| Total | 9,113 (100.0%) | 8,956 (100.0%) |
Families and Households in Andrew County
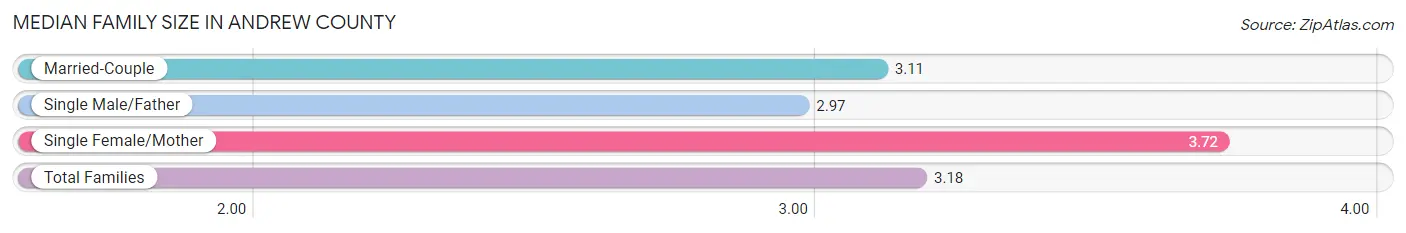
Median Family Size in Andrew County
The median family size in Andrew County is 3.18 persons per family, with single female/mother families (618 | 13.1%) accounting for the largest median family size of 3.72 persons per family. On the other hand, single male/father families (242 | 5.1%) represent the smallest median family size with 2.97 persons per family.
| Family Type | # Families | Family Size |
| Married-Couple | 3,872 (81.8%) | 3.11 |
| Single Male/Father | 242 (5.1%) | 2.97 |
| Single Female/Mother | 618 (13.1%) | 3.72 |
| Total Families | 4,732 (100.0%) | 3.18 |
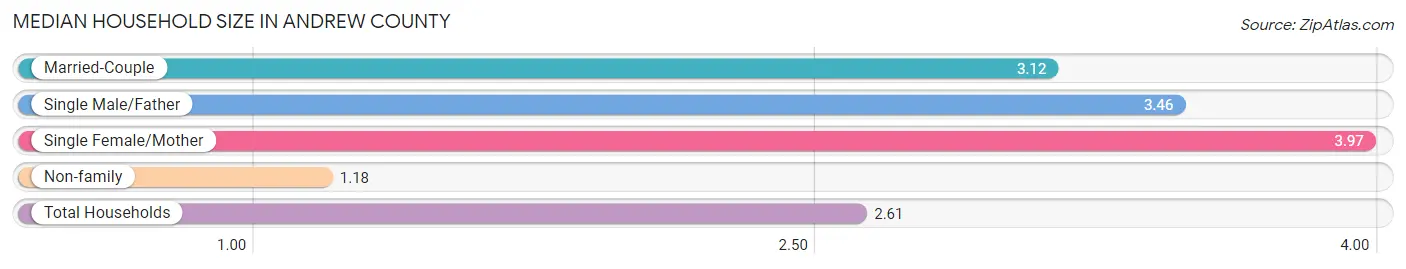
Median Household Size in Andrew County
The median household size in Andrew County is 2.61 persons per household, with single female/mother households (618 | 9.0%) accounting for the largest median household size of 3.97 persons per household. non-family households (2,133 | 31.1%) represent the smallest median household size with 1.18 persons per household.
| Household Type | # Households | Household Size |
| Married-Couple | 3,872 (56.4%) | 3.12 |
| Single Male/Father | 242 (3.5%) | 3.46 |
| Single Female/Mother | 618 (9.0%) | 3.97 |
| Non-family | 2,133 (31.1%) | 1.18 |
| Total Households | 6,865 (100.0%) | 2.61 |
Household Size by Marriage Status in Andrew County
Out of a total of 6,865 households in Andrew County, 4,732 (68.9%) are family households, while 2,133 (31.1%) are nonfamily households. The most numerous type of family households are 2-person households, comprising 2,399, and the most common type of nonfamily households are 1-person households, comprising 1,895.
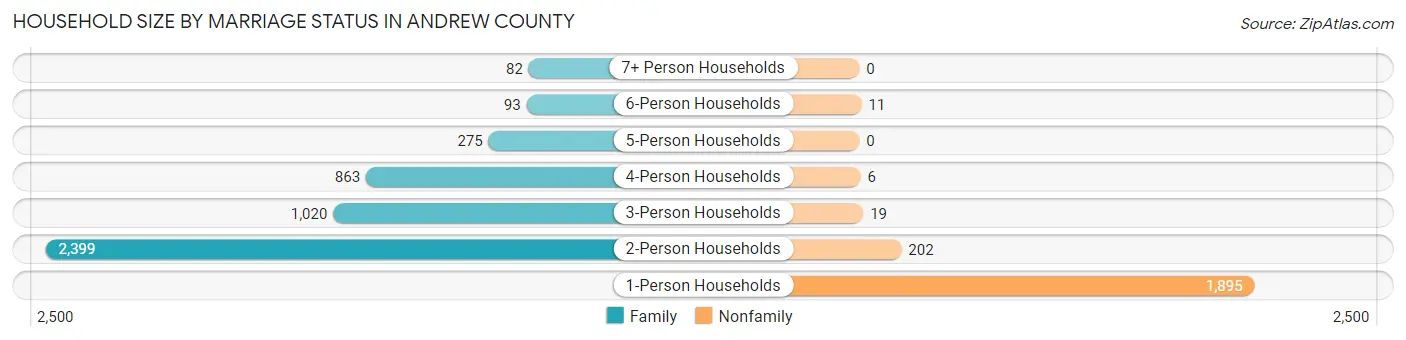
| Household Size | Family Households | Nonfamily Households |
| 1-Person Households | - | 1,895 (27.6%) |
| 2-Person Households | 2,399 (34.9%) | 202 (2.9%) |
| 3-Person Households | 1,020 (14.9%) | 19 (0.3%) |
| 4-Person Households | 863 (12.6%) | 6 (0.1%) |
| 5-Person Households | 275 (4.0%) | 0 (0.0%) |
| 6-Person Households | 93 (1.3%) | 11 (0.2%) |
| 7+ Person Households | 82 (1.2%) | 0 (0.0%) |
| Total | 4,732 (68.9%) | 2,133 (31.1%) |
Female Fertility in Andrew County
Fertility by Age in Andrew County
Average fertility rate in Andrew County is 45.0 births per 1,000 women. Women in the age bracket of 20 to 34 years have the highest fertility rate with 95.0 births per 1,000 women. Women in the age bracket of 20 to 34 years acount for 83.1% of all women with births.
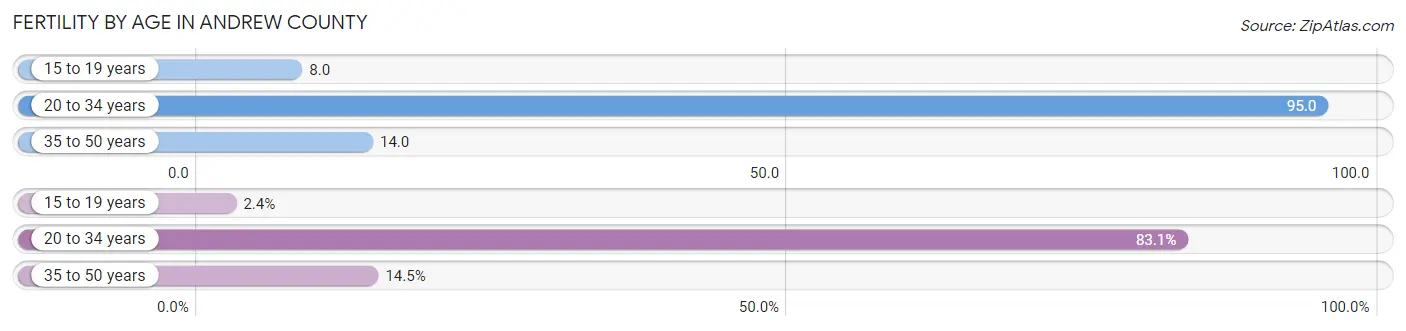
| Age Bracket | Women with Births | Births / 1,000 Women |
| 15 to 19 years | 4 (2.4%) | 8.0 |
| 20 to 34 years | 138 (83.1%) | 95.0 |
| 35 to 50 years | 24 (14.5%) | 14.0 |
| Total | 166 (100.0%) | 45.0 |
Fertility by Age by Marriage Status in Andrew County
74.1% of women with births (166) in Andrew County are married. The highest percentage of unmarried women with births falls into 35 to 50 years age bracket with 75.0% of them unmarried at the time of birth, while the lowest percentage of unmarried women with births belong to 20 to 34 years age bracket with 17.4% of them unmarried.
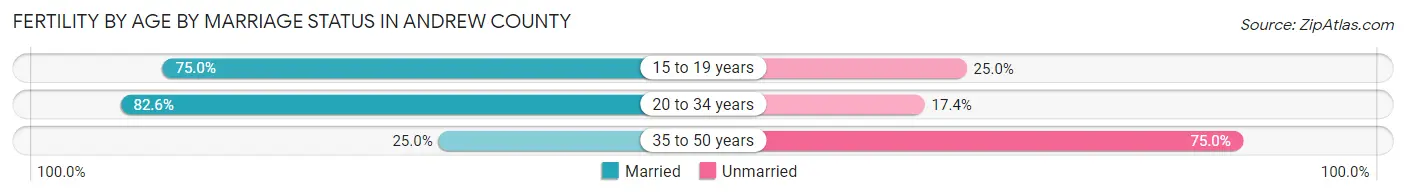
| Age Bracket | Married | Unmarried |
| 15 to 19 years | 3 (75.0%) | 1 (25.0%) |
| 20 to 34 years | 114 (82.6%) | 24 (17.4%) |
| 35 to 50 years | 6 (25.0%) | 18 (75.0%) |
| Total | 123 (74.1%) | 43 (25.9%) |
Fertility by Education in Andrew County
Average fertility rate in Andrew County is 45.0 births per 1,000 women. Women with the education attainment of college or associate's degree have the highest fertility rate of 75.0 births per 1,000 women, while women with the education attainment of less than high school have the lowest fertility at 2.0 births per 1,000 women. Women with the education attainment of college or associate's degree represent 57.2% of all women with births.
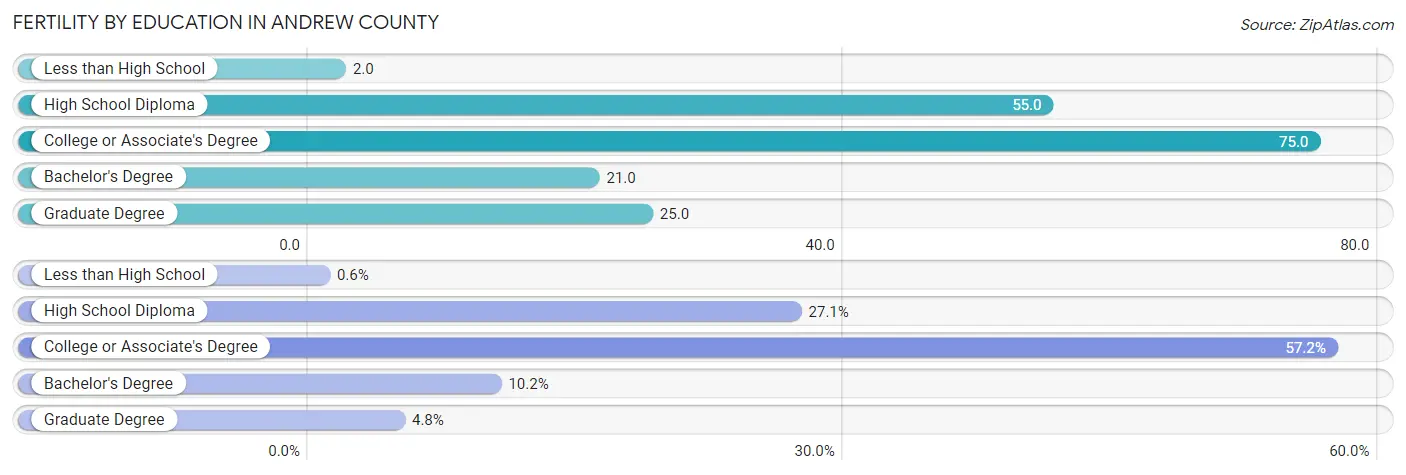
| Educational Attainment | Women with Births | Births / 1,000 Women |
| Less than High School | 1 (0.6%) | 2.0 |
| High School Diploma | 45 (27.1%) | 55.0 |
| College or Associate's Degree | 95 (57.2%) | 75.0 |
| Bachelor's Degree | 17 (10.2%) | 21.0 |
| Graduate Degree | 8 (4.8%) | 25.0 |
| Total | 166 (100.0%) | 45.0 |
Fertility by Education by Marriage Status in Andrew County
25.9% of women with births in Andrew County are unmarried. Women with the educational attainment of graduate degree are most likely to be married with 100.0% of them married at childbirth, while women with the educational attainment of less than high school are least likely to be married with 100.0% of them unmarried at childbirth.
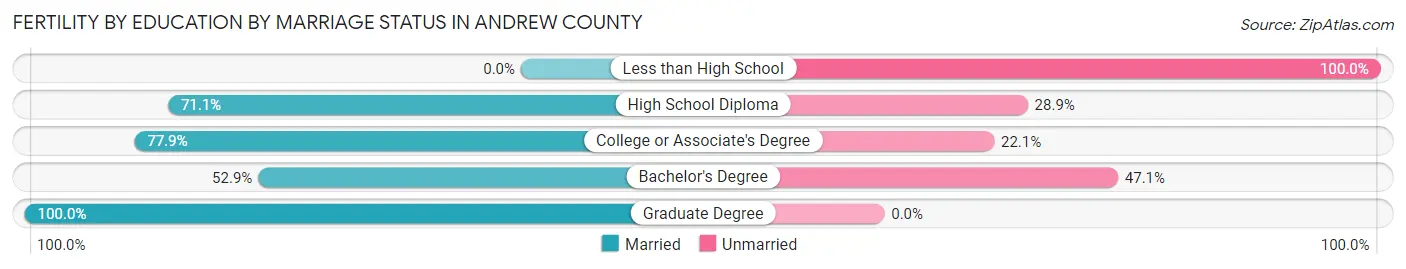
| Educational Attainment | Married | Unmarried |
| Less than High School | 0 (0.0%) | 1 (100.0%) |
| High School Diploma | 32 (71.1%) | 13 (28.9%) |
| College or Associate's Degree | 74 (77.9%) | 21 (22.1%) |
| Bachelor's Degree | 9 (52.9%) | 8 (47.1%) |
| Graduate Degree | 8 (100.0%) | 0 (0.0%) |
| Total | 123 (74.1%) | 43 (25.9%) |
Employment Characteristics in Andrew County
Employment by Class of Employer in Andrew County
Among the 8,499 employed individuals in Andrew County, private company employees (5,312 | 62.5%), not-for-profit organizations (1,040 | 12.2%), and local government employees (776 | 9.1%) make up the most common classes of employment.
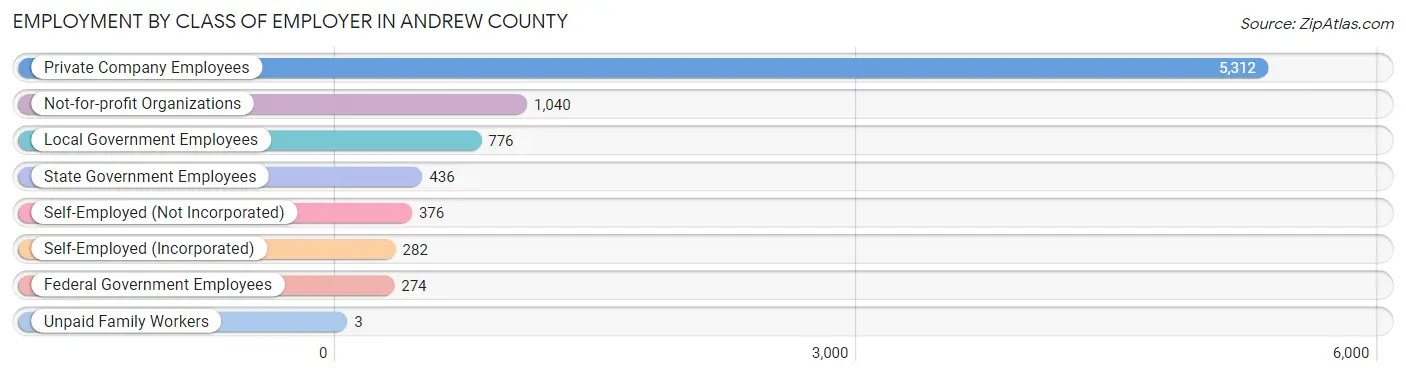
| Employer Class | # Employees | % Employees |
| Private Company Employees | 5,312 | 62.5% |
| Self-Employed (Incorporated) | 282 | 3.3% |
| Self-Employed (Not Incorporated) | 376 | 4.4% |
| Not-for-profit Organizations | 1,040 | 12.2% |
| Local Government Employees | 776 | 9.1% |
| State Government Employees | 436 | 5.1% |
| Federal Government Employees | 274 | 3.2% |
| Unpaid Family Workers | 3 | 0.0% |
| Total | 8,499 | 100.0% |
Employment Status by Age in Andrew County
According to the labor force statistics for Andrew County, out of the total population over 16 years of age (14,336), 63.1% or 9,046 individuals are in the labor force, with 4.1% or 371 of them unemployed. The age group with the highest labor force participation rate is 35 to 44 years, with 90.9% or 2,033 individuals in the labor force. Within the labor force, the 20 to 24 years age range has the highest percentage of unemployed individuals, with 13.7% or 106 of them being unemployed.
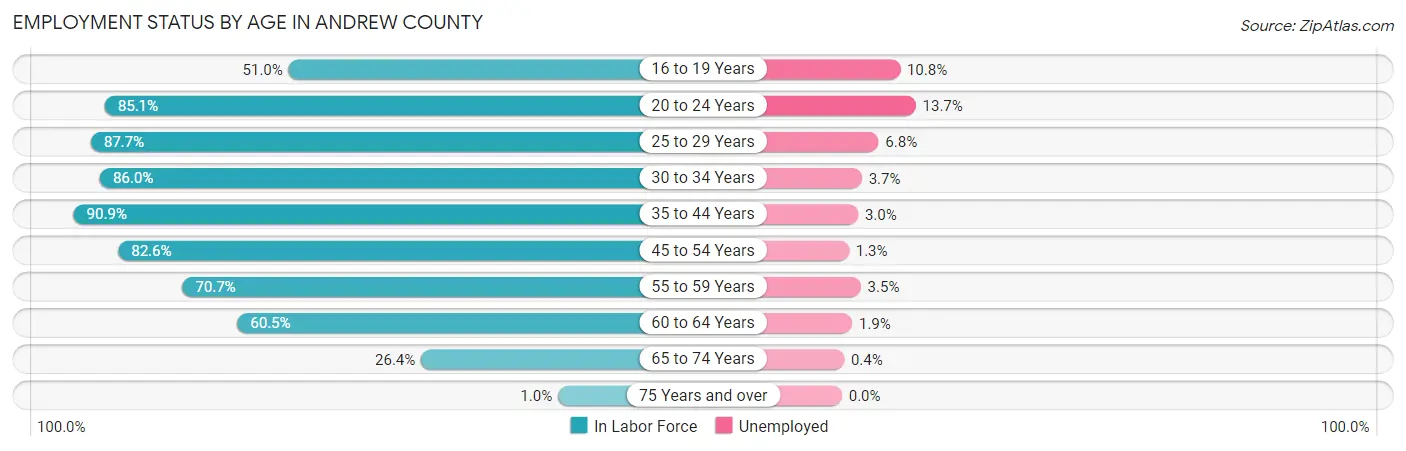
| Age Bracket | In Labor Force | Unemployed |
| 16 to 19 Years | 390 (51.0%) | 42 (10.8%) |
| 20 to 24 Years | 777 (85.1%) | 106 (13.7%) |
| 25 to 29 Years | 884 (87.7%) | 60 (6.8%) |
| 30 to 34 Years | 894 (86.0%) | 33 (3.7%) |
| 35 to 44 Years | 2,033 (90.9%) | 61 (3.0%) |
| 45 to 54 Years | 1,821 (82.6%) | 24 (1.3%) |
| 55 to 59 Years | 849 (70.7%) | 30 (3.5%) |
| 60 to 64 Years | 831 (60.5%) | 16 (1.9%) |
| 65 to 74 Years | 560 (26.4%) | 2 (0.4%) |
| 75 Years and over | 15 (1.0%) | 0 (0.0%) |
| Total | 9,046 (63.1%) | 371 (4.1%) |
Employment Status by Educational Attainment in Andrew County
According to labor force statistics for Andrew County, 80.7% of individuals (7,312) out of the total population between 25 and 64 years of age (9,061) are in the labor force, with 3.1% or 227 of them being unemployed. The group with the highest labor force participation rate are those with the educational attainment of bachelor's degree or higher, with 87.2% or 2,133 individuals in the labor force. Within the labor force, individuals with high school diploma education have the highest percentage of unemployment, with 4.9% or 129 of them being unemployed.
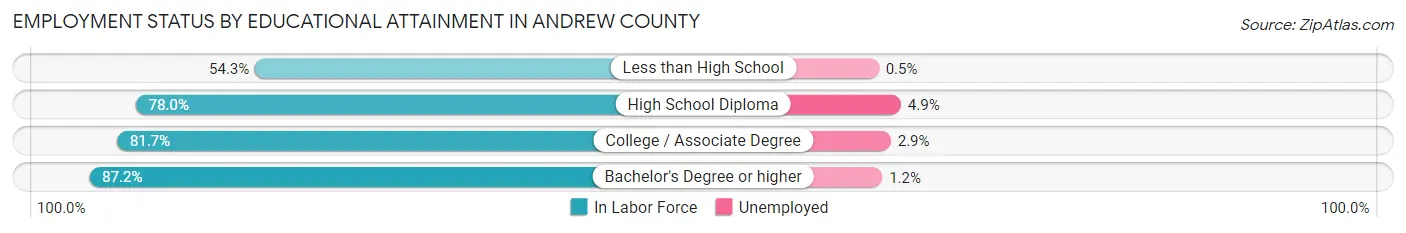
| Educational Attainment | In Labor Force | Unemployed |
| Less than High School | 208 (54.3%) | 2 (0.5%) |
| High School Diploma | 2,634 (78.0%) | 165 (4.9%) |
| College / Associate Degree | 2,333 (81.7%) | 83 (2.9%) |
| Bachelor's Degree or higher | 2,133 (87.2%) | 29 (1.2%) |
| Total | 7,312 (80.7%) | 281 (3.1%) |
Employment Occupations by Sex in Andrew County
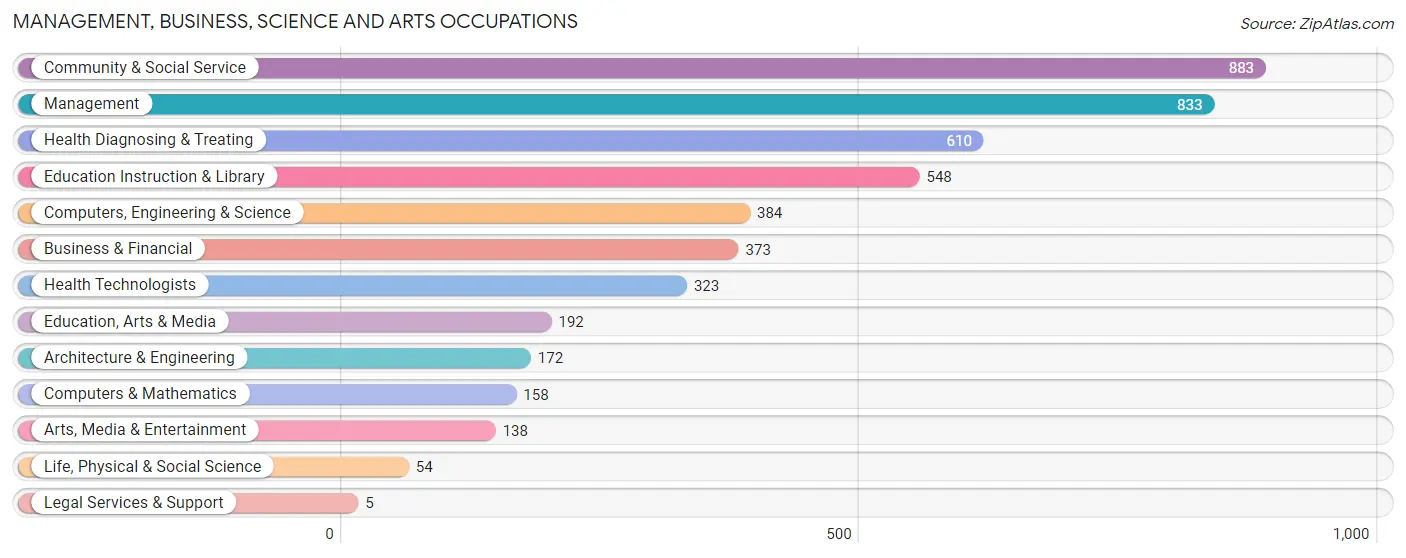
Management, Business, Science and Arts Occupations
The most common Management, Business, Science and Arts occupations in Andrew County are Community & Social Service (883 | 10.3%), Management (833 | 9.7%), Health Diagnosing & Treating (610 | 7.1%), Education Instruction & Library (548 | 6.4%), and Computers, Engineering & Science (384 | 4.5%).
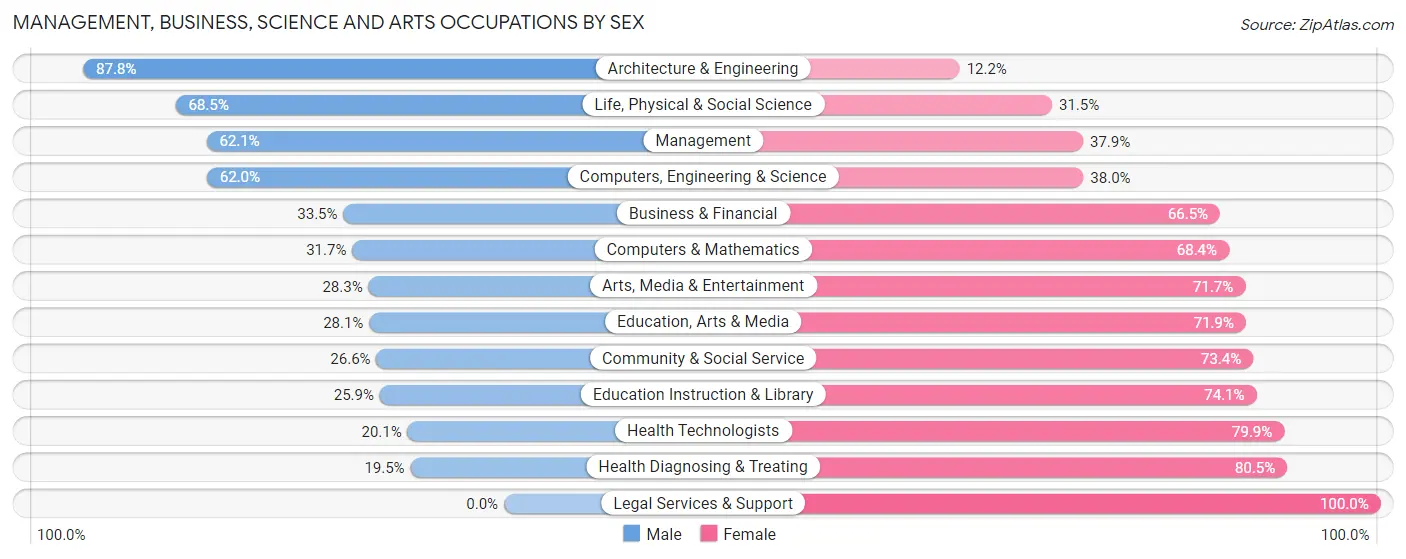
Management, Business, Science and Arts Occupations by Sex
Within the Management, Business, Science and Arts occupations in Andrew County, the most male-oriented occupations are Architecture & Engineering (87.8%), Life, Physical & Social Science (68.5%), and Management (62.1%), while the most female-oriented occupations are Legal Services & Support (100.0%), Health Diagnosing & Treating (80.5%), and Health Technologists (79.9%).
| Occupation | Male | Female |
| Management | 517 (62.1%) | 316 (37.9%) |
| Business & Financial | 125 (33.5%) | 248 (66.5%) |
| Computers, Engineering & Science | 238 (62.0%) | 146 (38.0%) |
| Computers & Mathematics | 50 (31.7%) | 108 (68.3%) |
| Architecture & Engineering | 151 (87.8%) | 21 (12.2%) |
| Life, Physical & Social Science | 37 (68.5%) | 17 (31.5%) |
| Community & Social Service | 235 (26.6%) | 648 (73.4%) |
| Education, Arts & Media | 54 (28.1%) | 138 (71.9%) |
| Legal Services & Support | 0 (0.0%) | 5 (100.0%) |
| Education Instruction & Library | 142 (25.9%) | 406 (74.1%) |
| Arts, Media & Entertainment | 39 (28.3%) | 99 (71.7%) |
| Health Diagnosing & Treating | 119 (19.5%) | 491 (80.5%) |
| Health Technologists | 65 (20.1%) | 258 (79.9%) |
| Total (Category) | 1,234 (40.0%) | 1,849 (60.0%) |
| Total (Overall) | 4,540 (53.0%) | 4,032 (47.0%) |
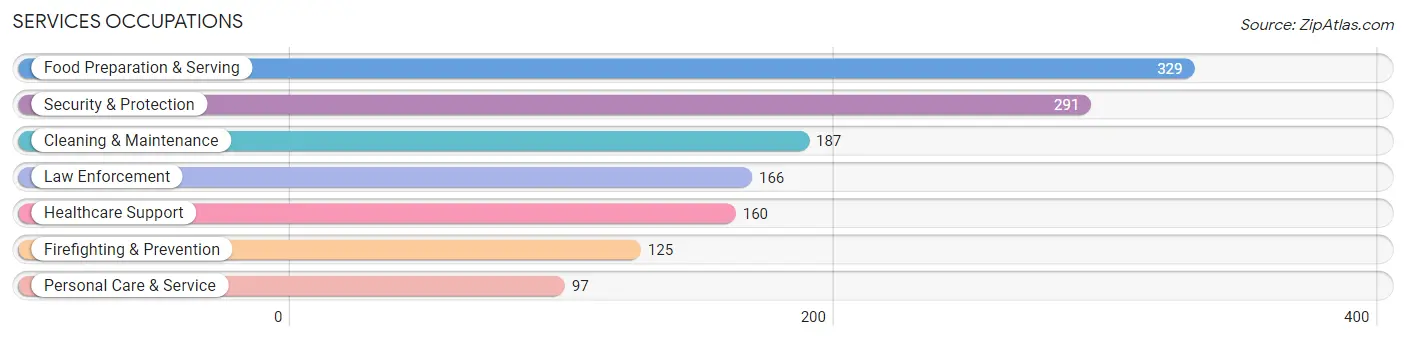
Services Occupations
The most common Services occupations in Andrew County are Food Preparation & Serving (329 | 3.8%), Security & Protection (291 | 3.4%), Cleaning & Maintenance (187 | 2.2%), Law Enforcement (166 | 1.9%), and Healthcare Support (160 | 1.9%).
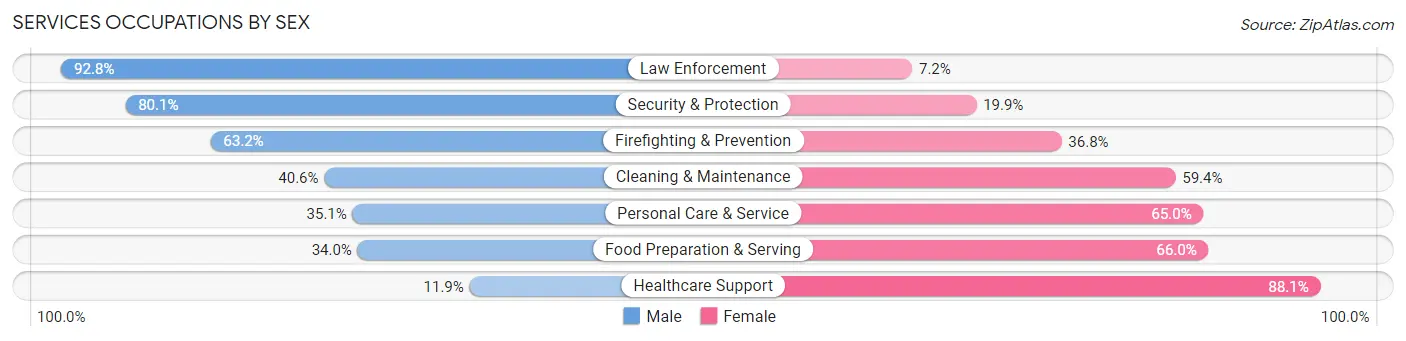
Services Occupations by Sex
Within the Services occupations in Andrew County, the most male-oriented occupations are Law Enforcement (92.8%), Security & Protection (80.1%), and Firefighting & Prevention (63.2%), while the most female-oriented occupations are Healthcare Support (88.1%), Food Preparation & Serving (66.0%), and Personal Care & Service (64.9%).
| Occupation | Male | Female |
| Healthcare Support | 19 (11.9%) | 141 (88.1%) |
| Security & Protection | 233 (80.1%) | 58 (19.9%) |
| Firefighting & Prevention | 79 (63.2%) | 46 (36.8%) |
| Law Enforcement | 154 (92.8%) | 12 (7.2%) |
| Food Preparation & Serving | 112 (34.0%) | 217 (66.0%) |
| Cleaning & Maintenance | 76 (40.6%) | 111 (59.4%) |
| Personal Care & Service | 34 (35.0%) | 63 (64.9%) |
| Total (Category) | 474 (44.6%) | 590 (55.4%) |
| Total (Overall) | 4,540 (53.0%) | 4,032 (47.0%) |
Sales and Office Occupations
The most common Sales and Office occupations in Andrew County are Office & Administration (1,099 | 12.8%), and Sales & Related (674 | 7.9%).
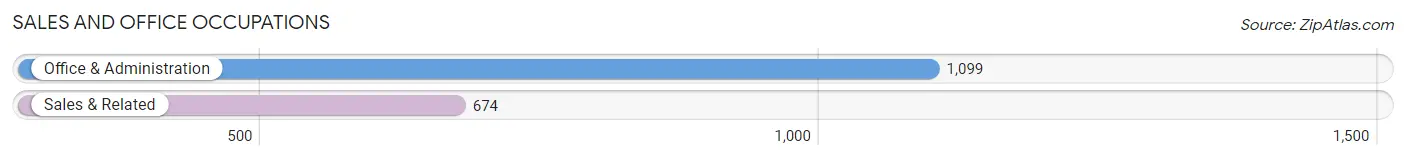
Sales and Office Occupations by Sex
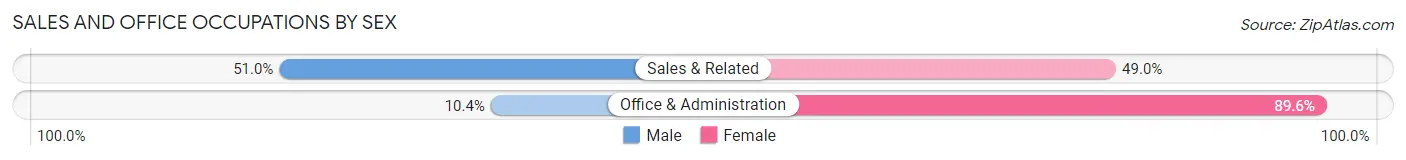
| Occupation | Male | Female |
| Sales & Related | 344 (51.0%) | 330 (49.0%) |
| Office & Administration | 114 (10.4%) | 985 (89.6%) |
| Total (Category) | 458 (25.8%) | 1,315 (74.2%) |
| Total (Overall) | 4,540 (53.0%) | 4,032 (47.0%) |
Natural Resources, Construction and Maintenance Occupations
The most common Natural Resources, Construction and Maintenance occupations in Andrew County are Construction & Extraction (737 | 8.6%), Installation, Maintenance & Repair (229 | 2.7%), and Farming, Fishing & Forestry (66 | 0.8%).
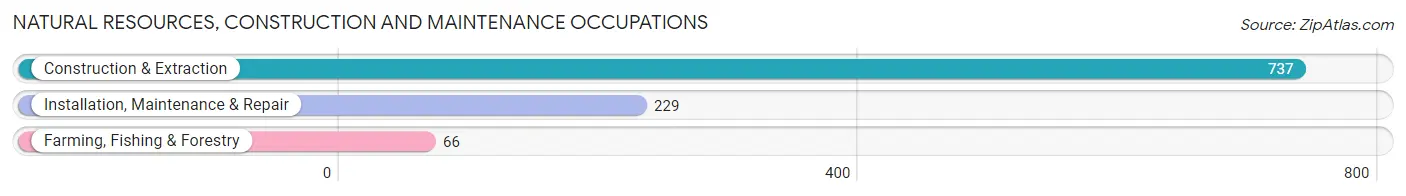
Natural Resources, Construction and Maintenance Occupations by Sex
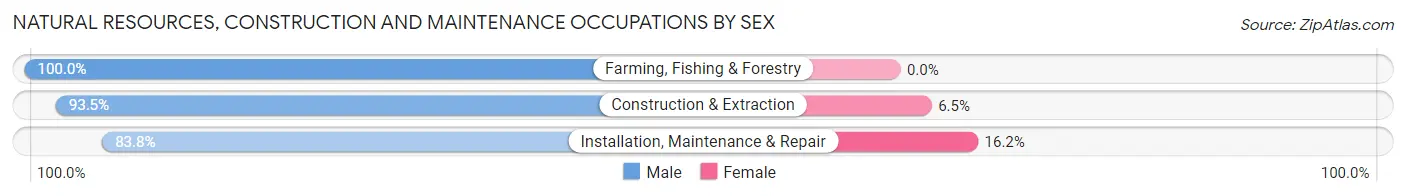
| Occupation | Male | Female |
| Farming, Fishing & Forestry | 66 (100.0%) | 0 (0.0%) |
| Construction & Extraction | 689 (93.5%) | 48 (6.5%) |
| Installation, Maintenance & Repair | 192 (83.8%) | 37 (16.2%) |
| Total (Category) | 947 (91.8%) | 85 (8.2%) |
| Total (Overall) | 4,540 (53.0%) | 4,032 (47.0%) |
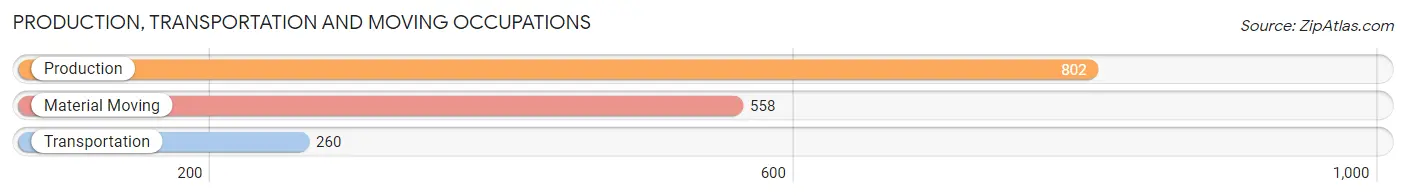
Production, Transportation and Moving Occupations
The most common Production, Transportation and Moving occupations in Andrew County are Production (802 | 9.4%), Material Moving (558 | 6.5%), and Transportation (260 | 3.0%).
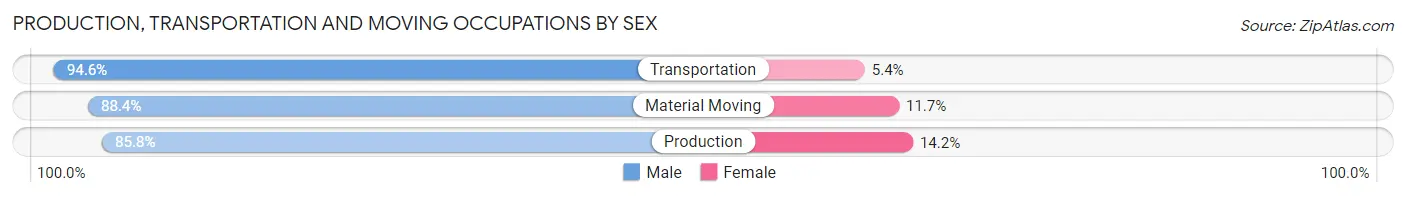
Production, Transportation and Moving Occupations by Sex
| Occupation | Male | Female |
| Production | 688 (85.8%) | 114 (14.2%) |
| Transportation | 246 (94.6%) | 14 (5.4%) |
| Material Moving | 493 (88.3%) | 65 (11.7%) |
| Total (Category) | 1,427 (88.1%) | 193 (11.9%) |
| Total (Overall) | 4,540 (53.0%) | 4,032 (47.0%) |
Employment Industries by Sex in Andrew County
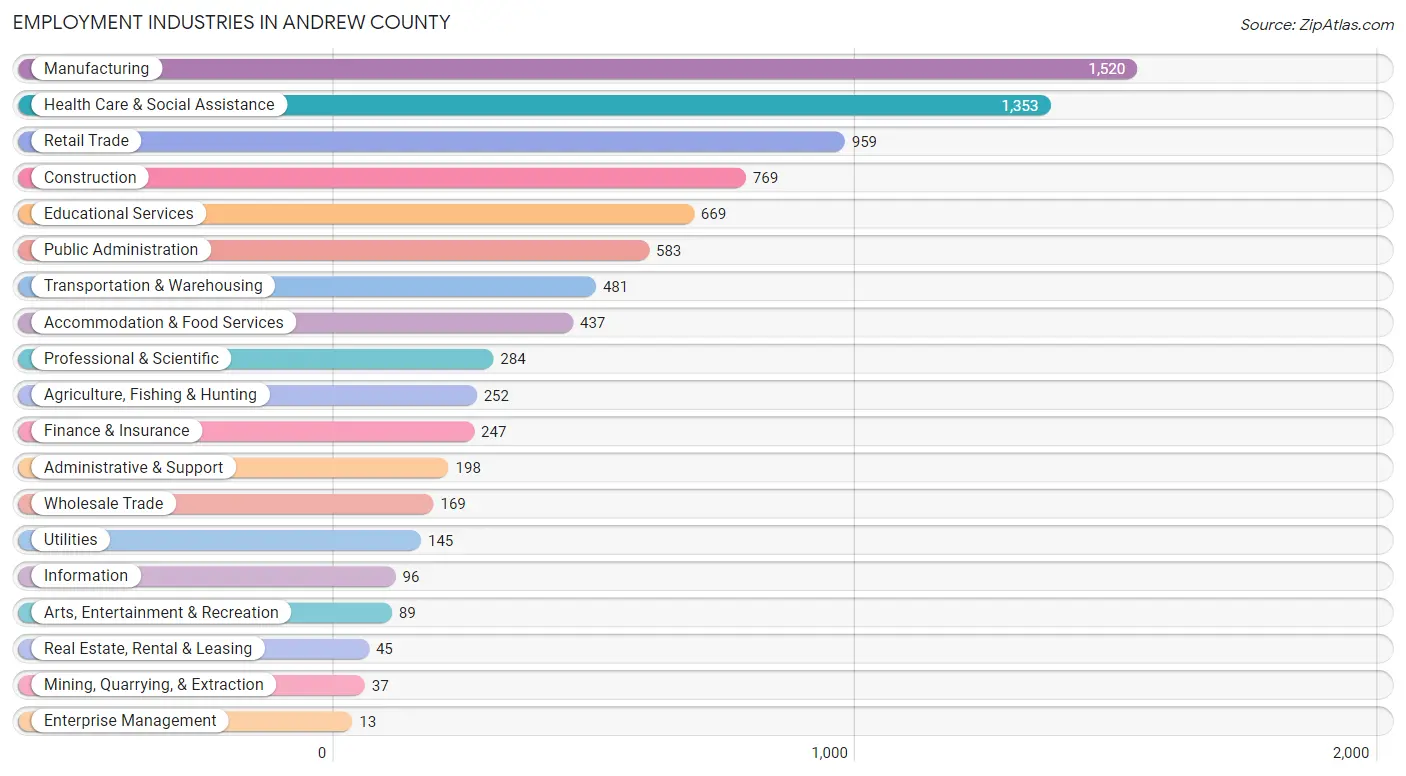
Employment Industries in Andrew County
The major employment industries in Andrew County include Manufacturing (1,520 | 17.7%), Health Care & Social Assistance (1,353 | 15.8%), Retail Trade (959 | 11.2%), Construction (769 | 9.0%), and Educational Services (669 | 7.8%).
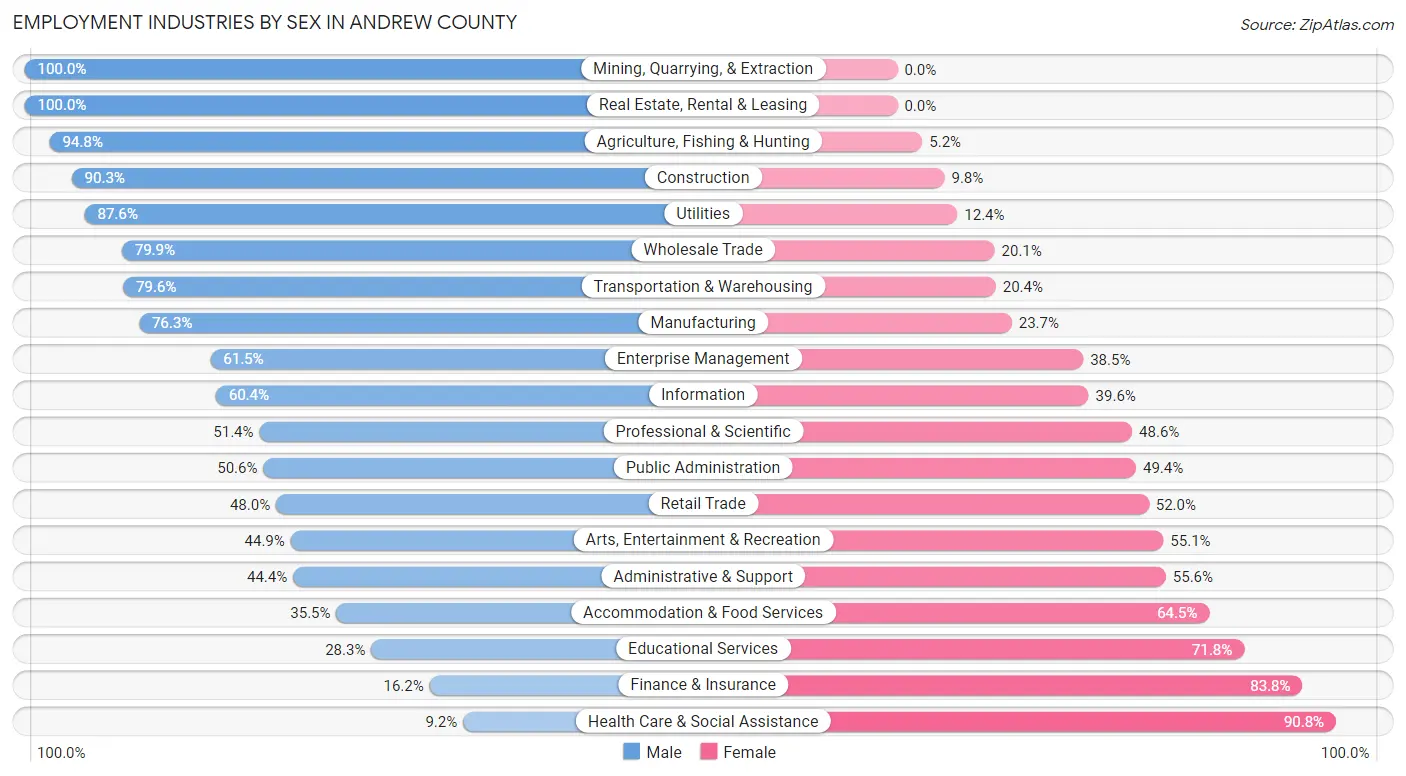
Employment Industries by Sex in Andrew County
The Andrew County industries that see more men than women are Mining, Quarrying, & Extraction (100.0%), Real Estate, Rental & Leasing (100.0%), and Agriculture, Fishing & Hunting (94.8%), whereas the industries that tend to have a higher number of women are Health Care & Social Assistance (90.8%), Finance & Insurance (83.8%), and Educational Services (71.8%).
| Industry | Male | Female |
| Agriculture, Fishing & Hunting | 239 (94.8%) | 13 (5.2%) |
| Mining, Quarrying, & Extraction | 37 (100.0%) | 0 (0.0%) |
| Construction | 694 (90.2%) | 75 (9.8%) |
| Manufacturing | 1,160 (76.3%) | 360 (23.7%) |
| Wholesale Trade | 135 (79.9%) | 34 (20.1%) |
| Retail Trade | 460 (48.0%) | 499 (52.0%) |
| Transportation & Warehousing | 383 (79.6%) | 98 (20.4%) |
| Utilities | 127 (87.6%) | 18 (12.4%) |
| Information | 58 (60.4%) | 38 (39.6%) |
| Finance & Insurance | 40 (16.2%) | 207 (83.8%) |
| Real Estate, Rental & Leasing | 45 (100.0%) | 0 (0.0%) |
| Professional & Scientific | 146 (51.4%) | 138 (48.6%) |
| Enterprise Management | 8 (61.5%) | 5 (38.5%) |
| Administrative & Support | 88 (44.4%) | 110 (55.6%) |
| Educational Services | 189 (28.2%) | 480 (71.8%) |
| Health Care & Social Assistance | 125 (9.2%) | 1,228 (90.8%) |
| Arts, Entertainment & Recreation | 40 (44.9%) | 49 (55.1%) |
| Accommodation & Food Services | 155 (35.5%) | 282 (64.5%) |
| Public Administration | 295 (50.6%) | 288 (49.4%) |
| Total | 4,540 (53.0%) | 4,032 (47.0%) |
Education in Andrew County
School Enrollment in Andrew County
The most common levels of schooling among the 3,997 students in Andrew County are elementary school (965 | 24.1%), high school (963 | 24.1%), and middle school (876 | 21.9%).
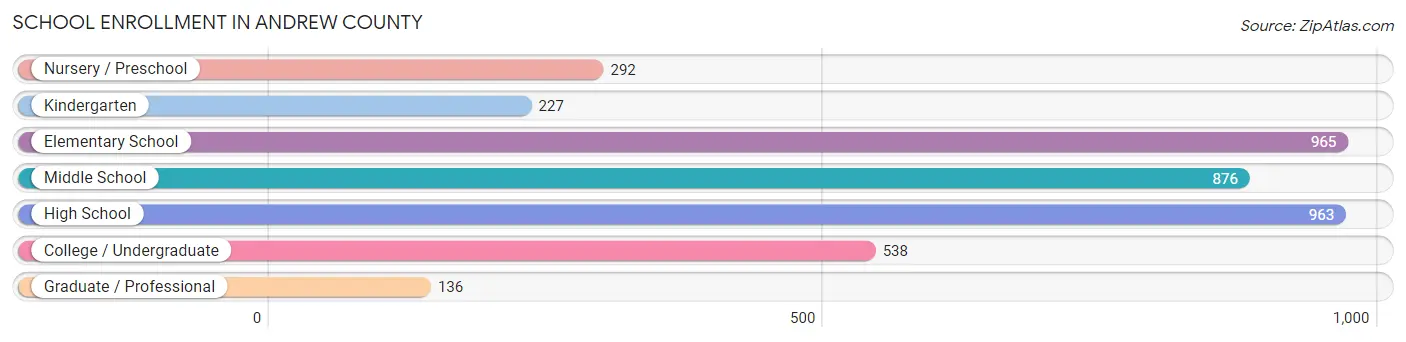
| School Level | # Students | % Students |
| Nursery / Preschool | 292 | 7.3% |
| Kindergarten | 227 | 5.7% |
| Elementary School | 965 | 24.1% |
| Middle School | 876 | 21.9% |
| High School | 963 | 24.1% |
| College / Undergraduate | 538 | 13.5% |
| Graduate / Professional | 136 | 3.4% |
| Total | 3,997 | 100.0% |
School Enrollment by Age by Funding Source in Andrew County
Out of a total of 3,997 students who are enrolled in schools in Andrew County, 400 (10.0%) attend a private institution, while the remaining 3,597 (90.0%) are enrolled in public schools. The age group of 3 to 4 year olds has the highest likelihood of being enrolled in private schools, with 58 (28.7% in the age bracket) enrolled. Conversely, the age group of 18 to 19 year olds has the lowest likelihood of being enrolled in a private school, with 296 (97.1% in the age bracket) attending a public institution.
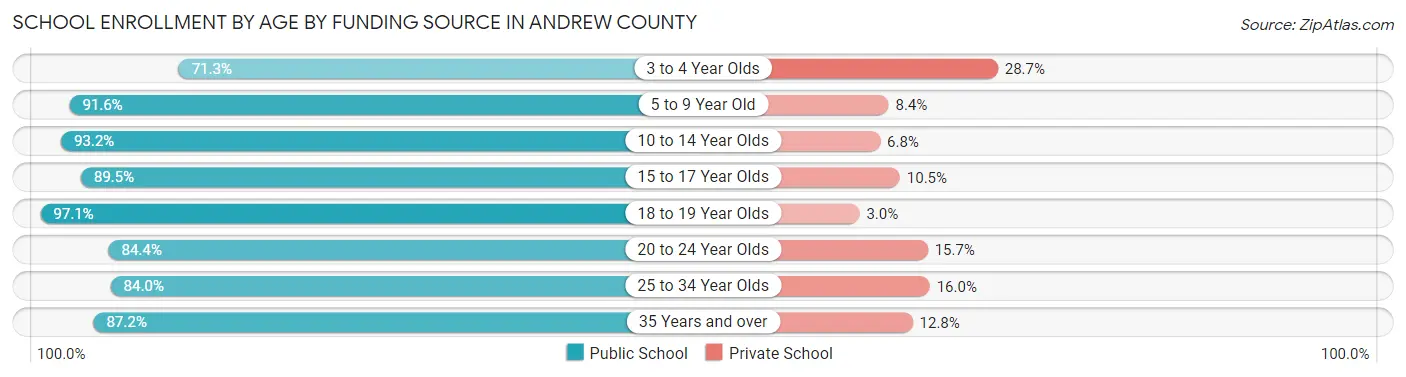
| Age Bracket | Public School | Private School |
| 3 to 4 Year Olds | 144 (71.3%) | 58 (28.7%) |
| 5 to 9 Year Old | 1,020 (91.6%) | 93 (8.4%) |
| 10 to 14 Year Olds | 1,017 (93.2%) | 74 (6.8%) |
| 15 to 17 Year Olds | 607 (89.5%) | 71 (10.5%) |
| 18 to 19 Year Olds | 296 (97.1%) | 9 (2.9%) |
| 20 to 24 Year Olds | 221 (84.4%) | 41 (15.7%) |
| 25 to 34 Year Olds | 199 (84.0%) | 38 (16.0%) |
| 35 Years and over | 95 (87.2%) | 14 (12.8%) |
| Total | 3,597 (90.0%) | 400 (10.0%) |
Educational Attainment by Field of Study in Andrew County
Education (785 | 22.2%), bio, nature & agricultural (455 | 12.8%), science & technology (426 | 12.0%), business (420 | 11.8%), and arts & humanities (322 | 9.1%) are the most common fields of study among 3,543 individuals in Andrew County who have obtained a bachelor's degree or higher.
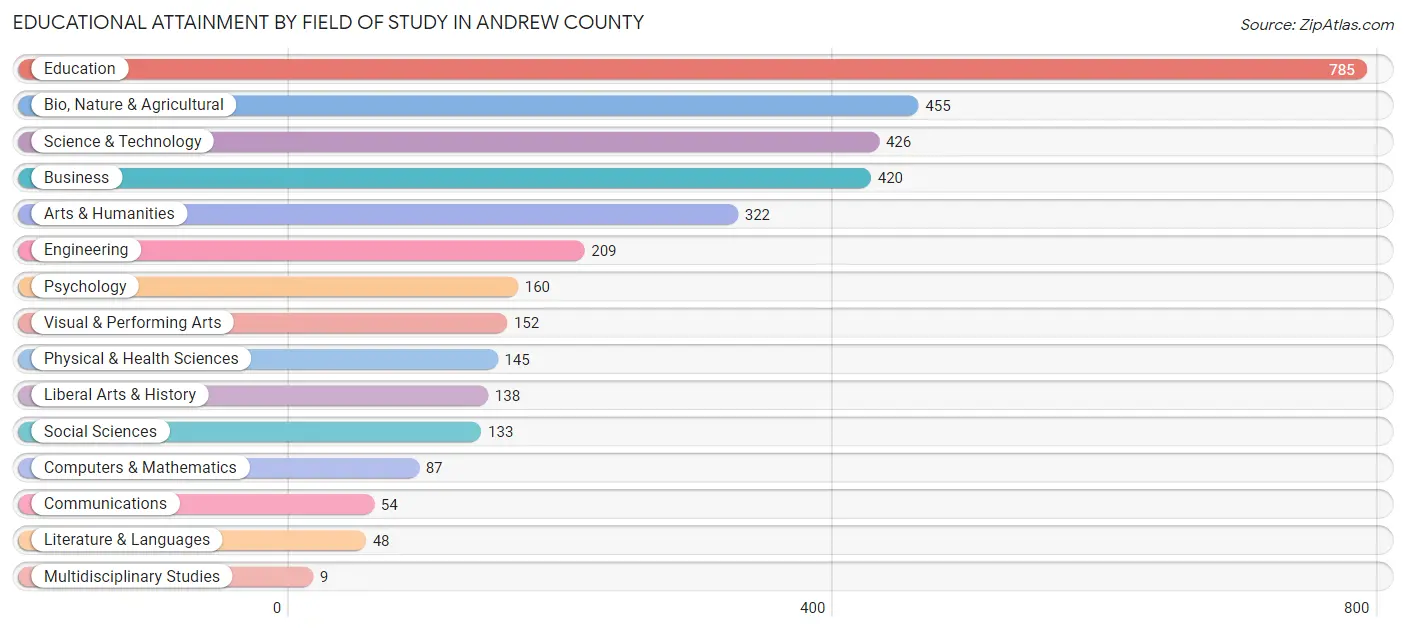
| Field of Study | # Graduates | % Graduates |
| Computers & Mathematics | 87 | 2.5% |
| Bio, Nature & Agricultural | 455 | 12.8% |
| Physical & Health Sciences | 145 | 4.1% |
| Psychology | 160 | 4.5% |
| Social Sciences | 133 | 3.7% |
| Engineering | 209 | 5.9% |
| Multidisciplinary Studies | 9 | 0.3% |
| Science & Technology | 426 | 12.0% |
| Business | 420 | 11.8% |
| Education | 785 | 22.2% |
| Literature & Languages | 48 | 1.3% |
| Liberal Arts & History | 138 | 3.9% |
| Visual & Performing Arts | 152 | 4.3% |
| Communications | 54 | 1.5% |
| Arts & Humanities | 322 | 9.1% |
| Total | 3,543 | 100.0% |
Transportation & Commute in Andrew County
Vehicle Availability by Sex in Andrew County
The most prevalent vehicle ownership categories in Andrew County are males with 2 vehicles (1,606, accounting for 36.0%) and females with 2 vehicles (1,492, making up 39.8%).
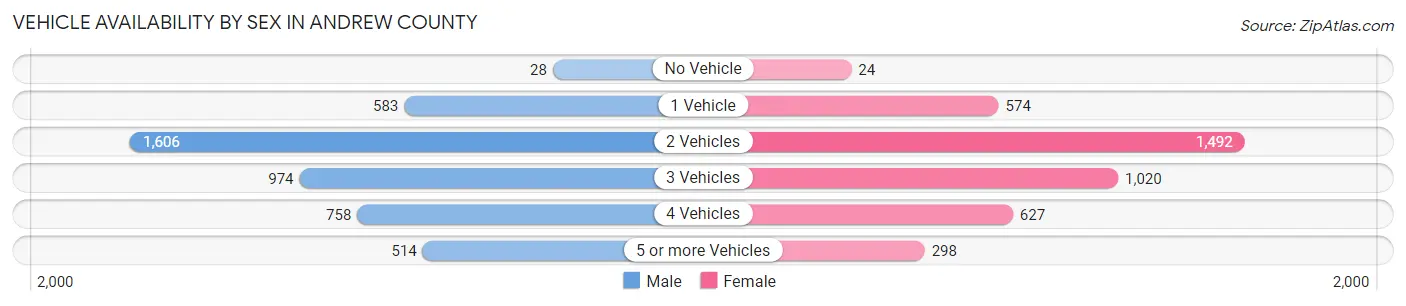
| Vehicles Available | Male | Female |
| No Vehicle | 28 (0.6%) | 24 (0.6%) |
| 1 Vehicle | 583 (13.1%) | 574 (14.2%) |
| 2 Vehicles | 1,606 (36.0%) | 1,492 (37.0%) |
| 3 Vehicles | 974 (21.8%) | 1,020 (25.3%) |
| 4 Vehicles | 758 (17.0%) | 627 (15.5%) |
| 5 or more Vehicles | 514 (11.5%) | 298 (7.4%) |
| Total | 4,463 (100.0%) | 4,035 (100.0%) |
Commute Time in Andrew County
The most frequently occuring commute durations in Andrew County are 15 to 19 minutes (1,935 commuters, 23.9%), 20 to 24 minutes (1,538 commuters, 19.0%), and 30 to 34 minutes (1,246 commuters, 15.4%).
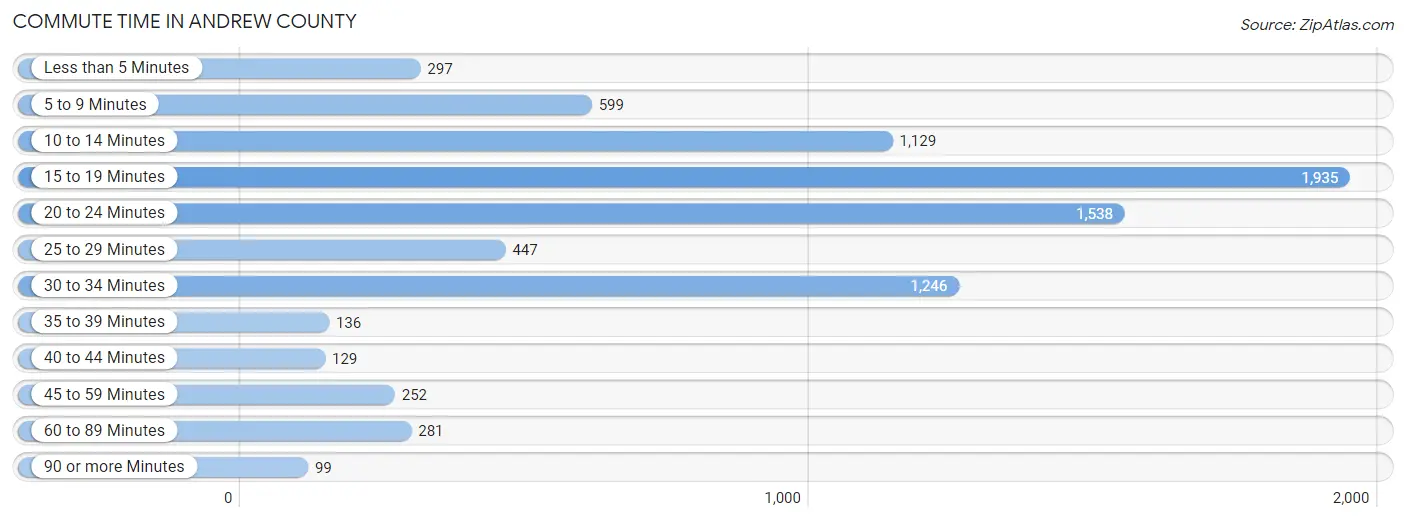
| Commute Time | # Commuters | % Commuters |
| Less than 5 Minutes | 297 | 3.7% |
| 5 to 9 Minutes | 599 | 7.4% |
| 10 to 14 Minutes | 1,129 | 14.0% |
| 15 to 19 Minutes | 1,935 | 23.9% |
| 20 to 24 Minutes | 1,538 | 19.0% |
| 25 to 29 Minutes | 447 | 5.5% |
| 30 to 34 Minutes | 1,246 | 15.4% |
| 35 to 39 Minutes | 136 | 1.7% |
| 40 to 44 Minutes | 129 | 1.6% |
| 45 to 59 Minutes | 252 | 3.1% |
| 60 to 89 Minutes | 281 | 3.5% |
| 90 or more Minutes | 99 | 1.2% |
Commute Time by Sex in Andrew County
The most common commute times in Andrew County are 15 to 19 minutes (847 commuters, 19.9%) for males and 15 to 19 minutes (1,088 commuters, 28.4%) for females.
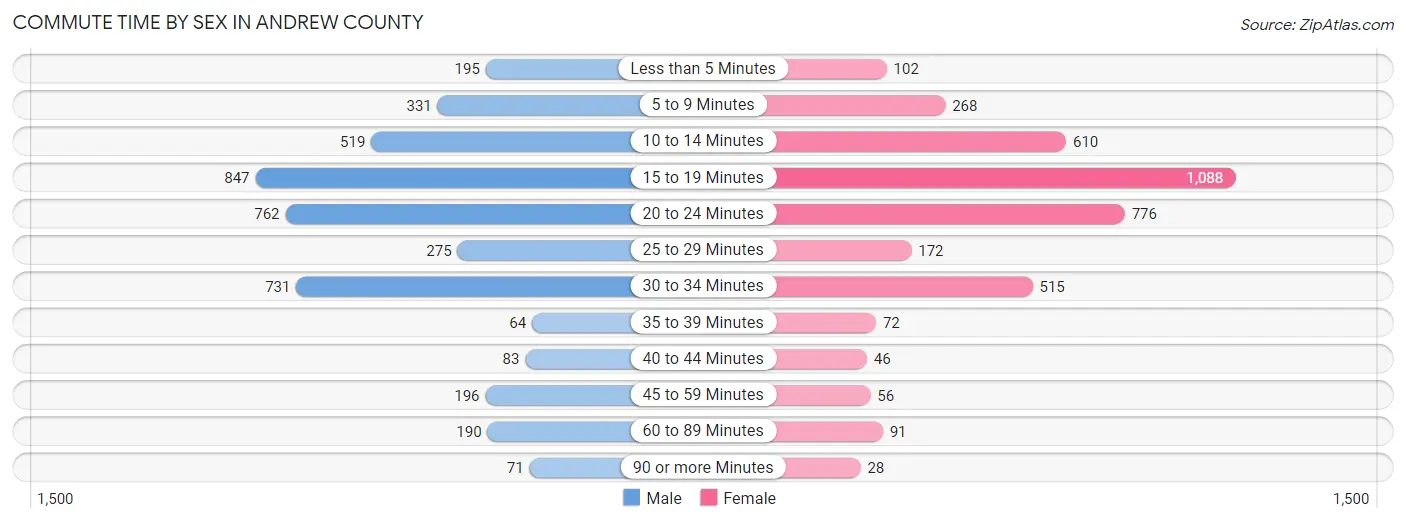
| Commute Time | Male | Female |
| Less than 5 Minutes | 195 (4.6%) | 102 (2.7%) |
| 5 to 9 Minutes | 331 (7.8%) | 268 (7.0%) |
| 10 to 14 Minutes | 519 (12.2%) | 610 (16.0%) |
| 15 to 19 Minutes | 847 (19.9%) | 1,088 (28.4%) |
| 20 to 24 Minutes | 762 (17.9%) | 776 (20.3%) |
| 25 to 29 Minutes | 275 (6.5%) | 172 (4.5%) |
| 30 to 34 Minutes | 731 (17.1%) | 515 (13.5%) |
| 35 to 39 Minutes | 64 (1.5%) | 72 (1.9%) |
| 40 to 44 Minutes | 83 (1.9%) | 46 (1.2%) |
| 45 to 59 Minutes | 196 (4.6%) | 56 (1.5%) |
| 60 to 89 Minutes | 190 (4.5%) | 91 (2.4%) |
| 90 or more Minutes | 71 (1.7%) | 28 (0.7%) |
Time of Departure to Work by Sex in Andrew County
The most frequent times of departure to work in Andrew County are 7:00 AM to 7:29 AM (710, 16.7%) for males and 7:00 AM to 7:29 AM (802, 21.0%) for females.
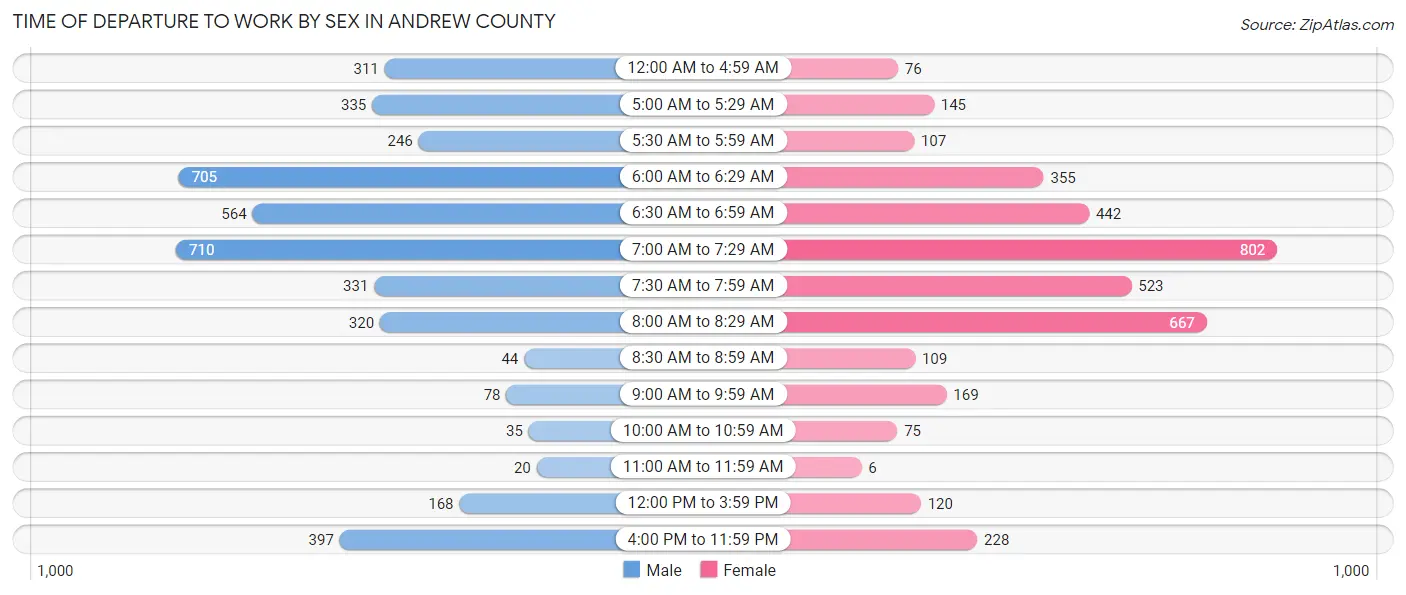
| Time of Departure | Male | Female |
| 12:00 AM to 4:59 AM | 311 (7.3%) | 76 (2.0%) |
| 5:00 AM to 5:29 AM | 335 (7.9%) | 145 (3.8%) |
| 5:30 AM to 5:59 AM | 246 (5.8%) | 107 (2.8%) |
| 6:00 AM to 6:29 AM | 705 (16.5%) | 355 (9.3%) |
| 6:30 AM to 6:59 AM | 564 (13.2%) | 442 (11.6%) |
| 7:00 AM to 7:29 AM | 710 (16.7%) | 802 (21.0%) |
| 7:30 AM to 7:59 AM | 331 (7.8%) | 523 (13.7%) |
| 8:00 AM to 8:29 AM | 320 (7.5%) | 667 (17.4%) |
| 8:30 AM to 8:59 AM | 44 (1.0%) | 109 (2.9%) |
| 9:00 AM to 9:59 AM | 78 (1.8%) | 169 (4.4%) |
| 10:00 AM to 10:59 AM | 35 (0.8%) | 75 (2.0%) |
| 11:00 AM to 11:59 AM | 20 (0.5%) | 6 (0.2%) |
| 12:00 PM to 3:59 PM | 168 (3.9%) | 120 (3.1%) |
| 4:00 PM to 11:59 PM | 397 (9.3%) | 228 (6.0%) |
| Total | 4,264 (100.0%) | 3,824 (100.0%) |
Housing Occupancy in Andrew County
Occupancy by Ownership in Andrew County
Of the total 6,865 dwellings in Andrew County, owner-occupied units account for 5,383 (78.4%), while renter-occupied units make up 1,482 (21.6%).
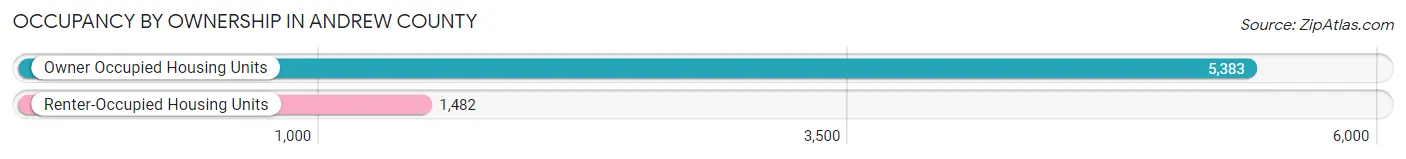
| Occupancy | # Housing Units | % Housing Units |
| Owner Occupied Housing Units | 5,383 | 78.4% |
| Renter-Occupied Housing Units | 1,482 | 21.6% |
| Total Occupied Housing Units | 6,865 | 100.0% |
Occupancy by Household Size in Andrew County
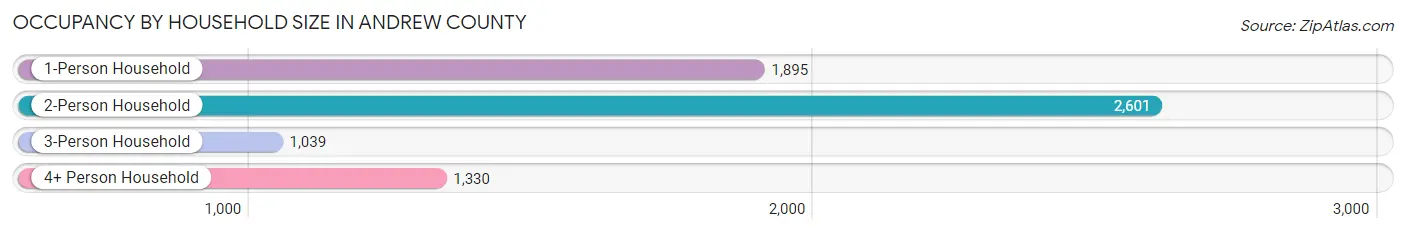
| Household Size | # Housing Units | % Housing Units |
| 1-Person Household | 1,895 | 27.6% |
| 2-Person Household | 2,601 | 37.9% |
| 3-Person Household | 1,039 | 15.1% |
| 4+ Person Household | 1,330 | 19.4% |
| Total Housing Units | 6,865 | 100.0% |
Occupancy by Ownership by Household Size in Andrew County
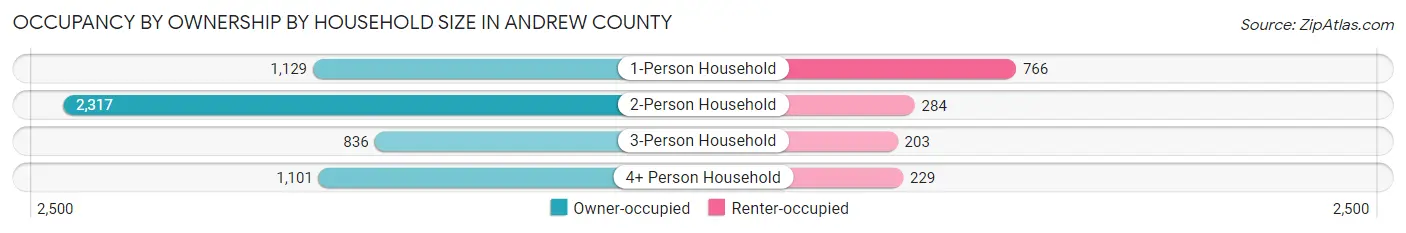
| Household Size | Owner-occupied | Renter-occupied |
| 1-Person Household | 1,129 (59.6%) | 766 (40.4%) |
| 2-Person Household | 2,317 (89.1%) | 284 (10.9%) |
| 3-Person Household | 836 (80.5%) | 203 (19.5%) |
| 4+ Person Household | 1,101 (82.8%) | 229 (17.2%) |
| Total Housing Units | 5,383 (78.4%) | 1,482 (21.6%) |
Occupancy by Educational Attainment in Andrew County
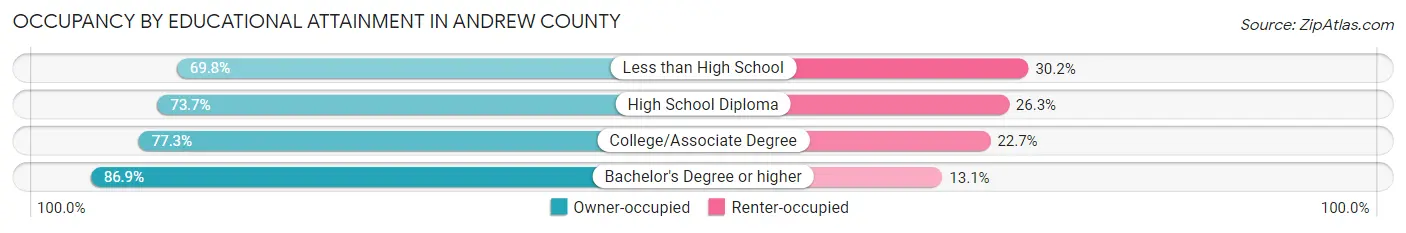
| Household Size | Owner-occupied | Renter-occupied |
| Less than High School | 245 (69.8%) | 106 (30.2%) |
| High School Diploma | 1,769 (73.7%) | 632 (26.3%) |
| College/Associate Degree | 1,655 (77.3%) | 485 (22.7%) |
| Bachelor's Degree or higher | 1,714 (86.9%) | 259 (13.1%) |
Occupancy by Age of Householder in Andrew County
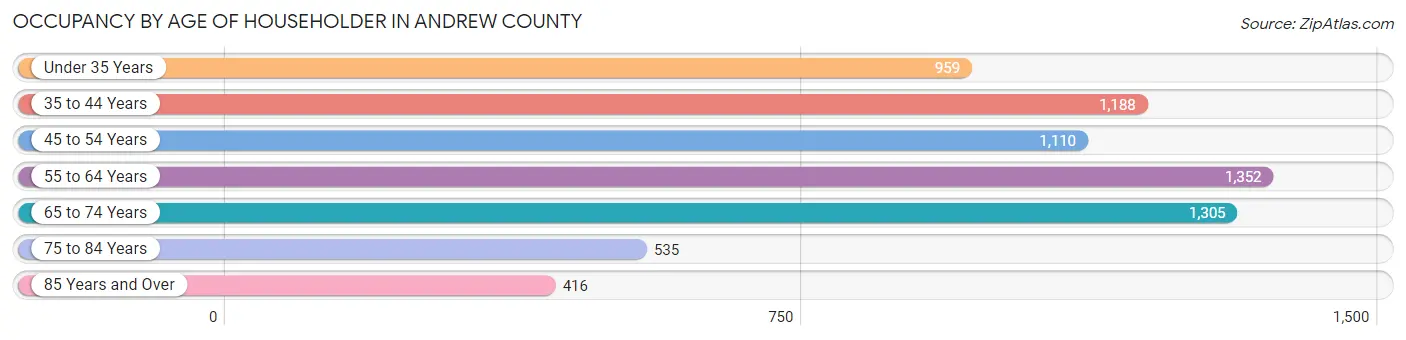
| Age Bracket | # Households | % Households |
| Under 35 Years | 959 | 14.0% |
| 35 to 44 Years | 1,188 | 17.3% |
| 45 to 54 Years | 1,110 | 16.2% |
| 55 to 64 Years | 1,352 | 19.7% |
| 65 to 74 Years | 1,305 | 19.0% |
| 75 to 84 Years | 535 | 7.8% |
| 85 Years and Over | 416 | 6.1% |
| Total | 6,865 | 100.0% |
Housing Finances in Andrew County
Median Income by Occupancy in Andrew County
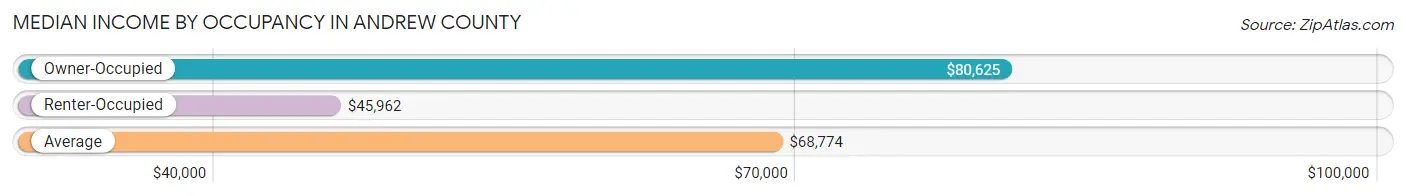
| Occupancy Type | # Households | Median Income |
| Owner-Occupied | 5,383 (78.4%) | $80,625 |
| Renter-Occupied | 1,482 (21.6%) | $45,962 |
| Average | 6,865 (100.0%) | $68,774 |
Occupancy by Householder Income Bracket in Andrew County
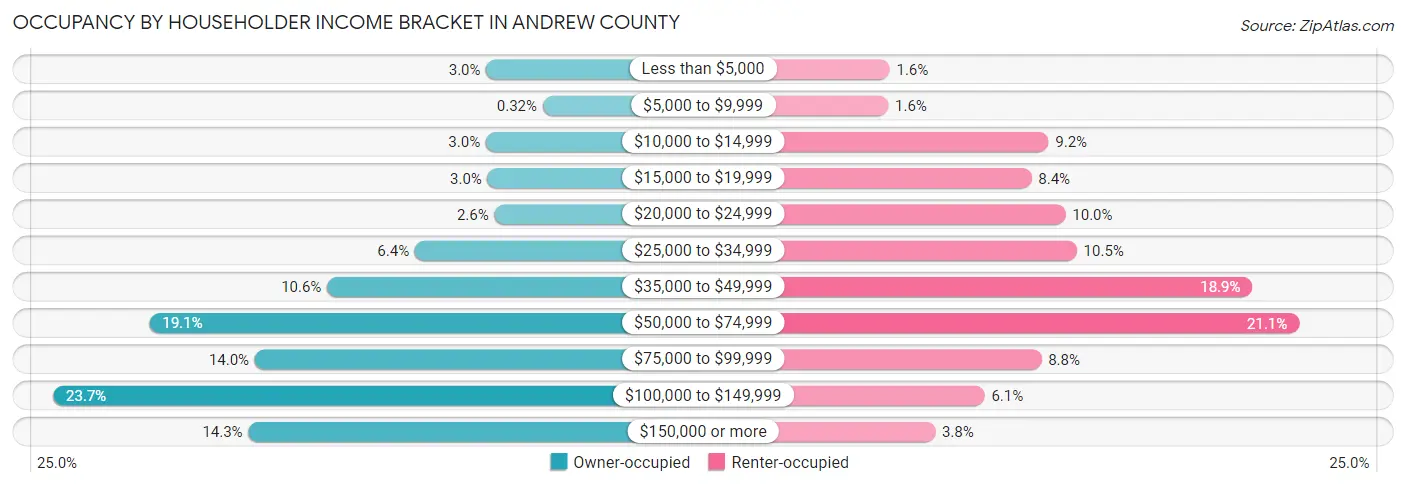
| Income Bracket | Owner-occupied | Renter-occupied |
| Less than $5,000 | 162 (3.0%) | 24 (1.6%) |
| $5,000 to $9,999 | 17 (0.3%) | 23 (1.5%) |
| $10,000 to $14,999 | 163 (3.0%) | 136 (9.2%) |
| $15,000 to $19,999 | 159 (2.9%) | 124 (8.4%) |
| $20,000 to $24,999 | 141 (2.6%) | 148 (10.0%) |
| $25,000 to $34,999 | 345 (6.4%) | 156 (10.5%) |
| $35,000 to $49,999 | 570 (10.6%) | 280 (18.9%) |
| $50,000 to $74,999 | 1,026 (19.1%) | 313 (21.1%) |
| $75,000 to $99,999 | 755 (14.0%) | 131 (8.8%) |
| $100,000 to $149,999 | 1,273 (23.6%) | 91 (6.1%) |
| $150,000 or more | 772 (14.3%) | 56 (3.8%) |
| Total | 5,383 (100.0%) | 1,482 (100.0%) |
Monthly Housing Cost Tiers in Andrew County
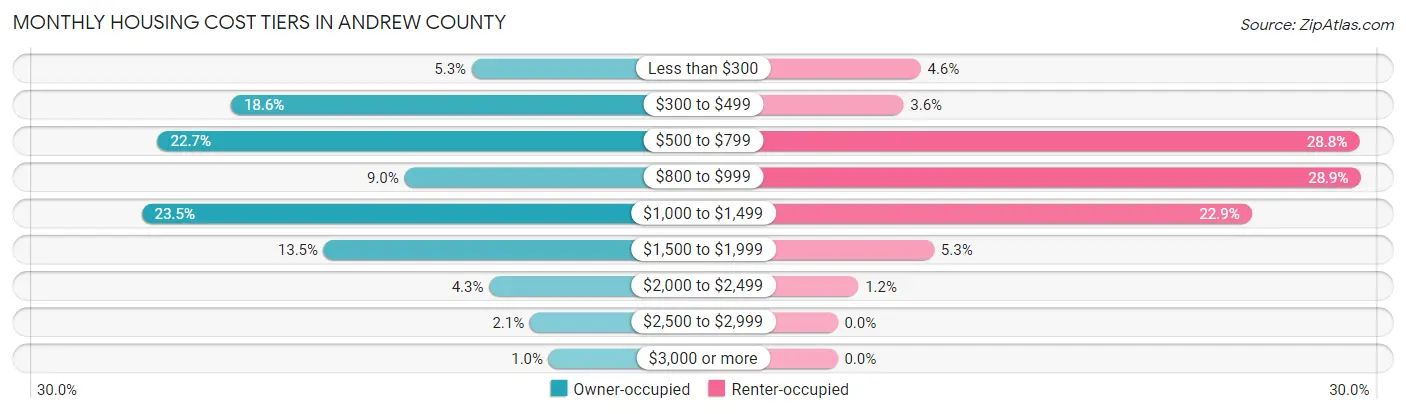
| Monthly Cost | Owner-occupied | Renter-occupied |
| Less than $300 | 285 (5.3%) | 68 (4.6%) |
| $300 to $499 | 1,001 (18.6%) | 54 (3.6%) |
| $500 to $799 | 1,219 (22.7%) | 427 (28.8%) |
| $800 to $999 | 485 (9.0%) | 428 (28.9%) |
| $1,000 to $1,499 | 1,267 (23.5%) | 339 (22.9%) |
| $1,500 to $1,999 | 725 (13.5%) | 79 (5.3%) |
| $2,000 to $2,499 | 233 (4.3%) | 17 (1.1%) |
| $2,500 to $2,999 | 112 (2.1%) | 0 (0.0%) |
| $3,000 or more | 56 (1.0%) | 0 (0.0%) |
| Total | 5,383 (100.0%) | 1,482 (100.0%) |
Physical Housing Characteristics in Andrew County
Housing Structures in Andrew County
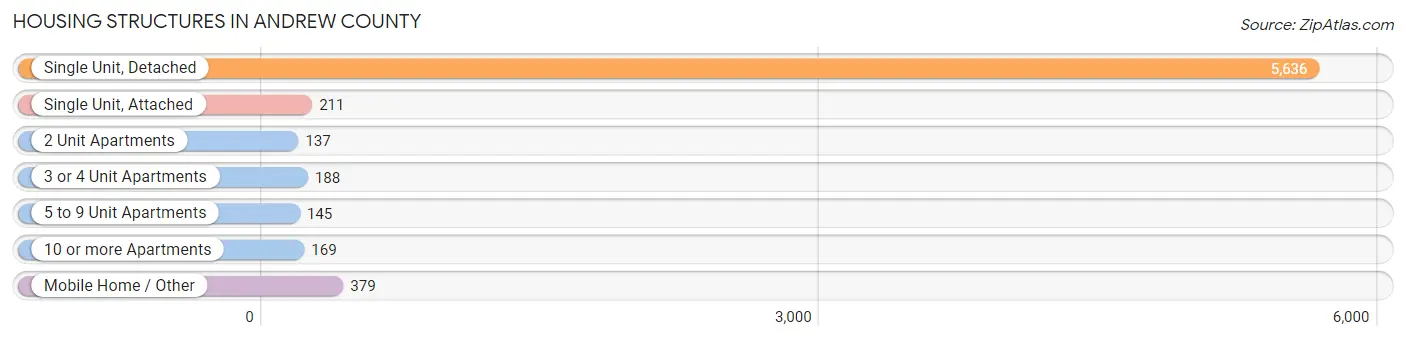
| Structure Type | # Housing Units | % Housing Units |
| Single Unit, Detached | 5,636 | 82.1% |
| Single Unit, Attached | 211 | 3.1% |
| 2 Unit Apartments | 137 | 2.0% |
| 3 or 4 Unit Apartments | 188 | 2.7% |
| 5 to 9 Unit Apartments | 145 | 2.1% |
| 10 or more Apartments | 169 | 2.5% |
| Mobile Home / Other | 379 | 5.5% |
| Total | 6,865 | 100.0% |
Housing Structures by Occupancy in Andrew County
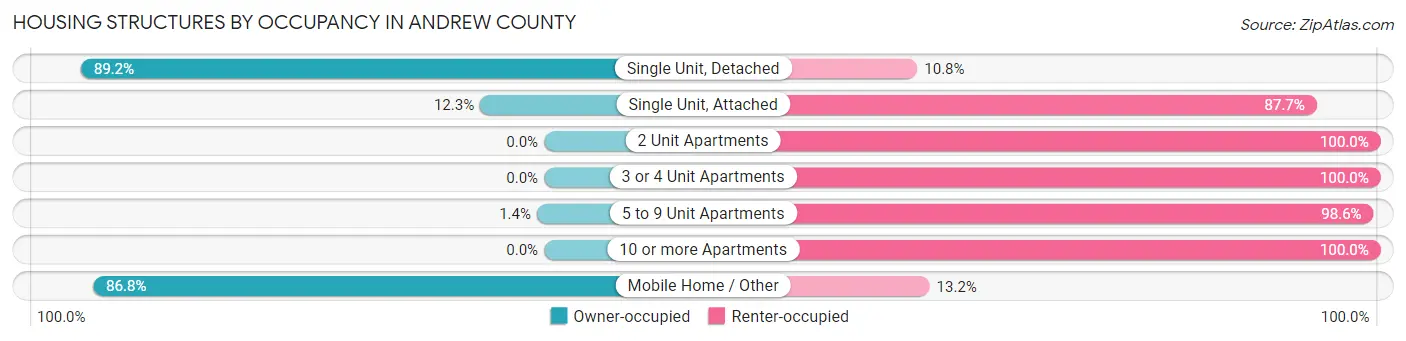
| Structure Type | Owner-occupied | Renter-occupied |
| Single Unit, Detached | 5,026 (89.2%) | 610 (10.8%) |
| Single Unit, Attached | 26 (12.3%) | 185 (87.7%) |
| 2 Unit Apartments | 0 (0.0%) | 137 (100.0%) |
| 3 or 4 Unit Apartments | 0 (0.0%) | 188 (100.0%) |
| 5 to 9 Unit Apartments | 2 (1.4%) | 143 (98.6%) |
| 10 or more Apartments | 0 (0.0%) | 169 (100.0%) |
| Mobile Home / Other | 329 (86.8%) | 50 (13.2%) |
| Total | 5,383 (78.4%) | 1,482 (21.6%) |
Housing Structures by Number of Rooms in Andrew County
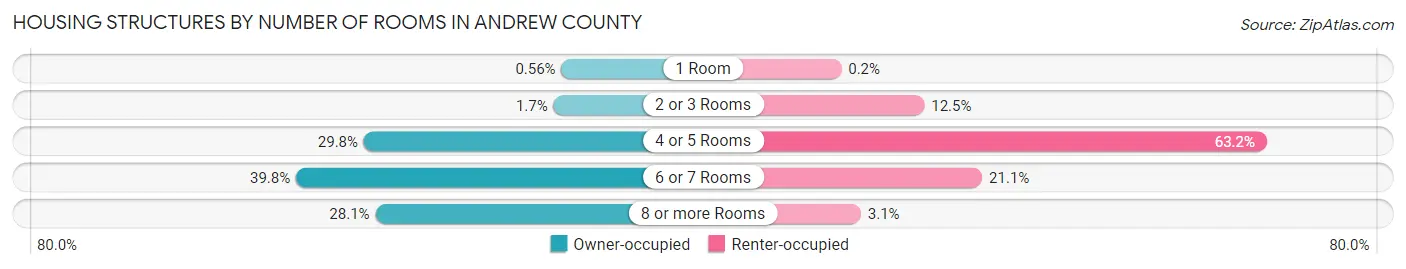
| Number of Rooms | Owner-occupied | Renter-occupied |
| 1 Room | 30 (0.6%) | 3 (0.2%) |
| 2 or 3 Rooms | 93 (1.7%) | 185 (12.5%) |
| 4 or 5 Rooms | 1,604 (29.8%) | 936 (63.2%) |
| 6 or 7 Rooms | 2,144 (39.8%) | 312 (21.0%) |
| 8 or more Rooms | 1,512 (28.1%) | 46 (3.1%) |
| Total | 5,383 (100.0%) | 1,482 (100.0%) |
Housing Structure by Heating Type in Andrew County
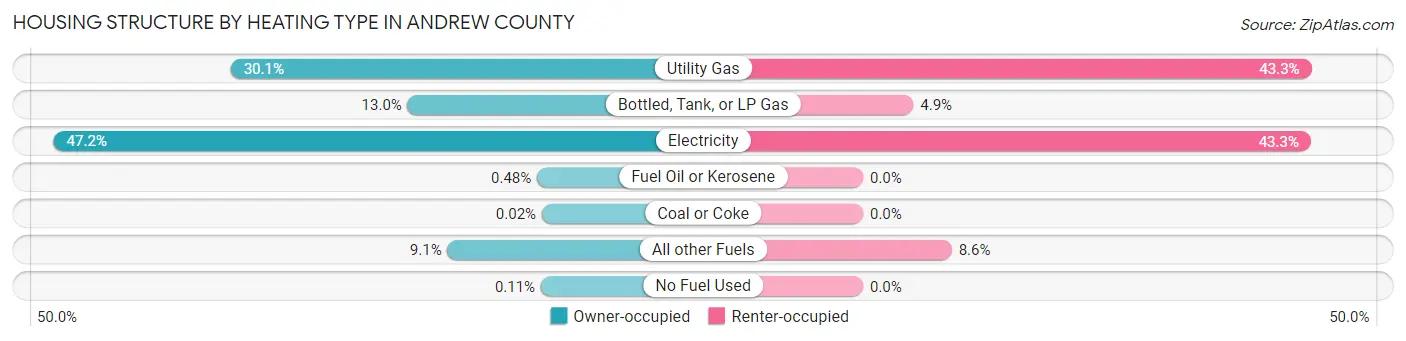
| Heating Type | Owner-occupied | Renter-occupied |
| Utility Gas | 1,619 (30.1%) | 642 (43.3%) |
| Bottled, Tank, or LP Gas | 699 (13.0%) | 72 (4.9%) |
| Electricity | 2,540 (47.2%) | 641 (43.2%) |
| Fuel Oil or Kerosene | 26 (0.5%) | 0 (0.0%) |
| Coal or Coke | 1 (0.0%) | 0 (0.0%) |
| All other Fuels | 492 (9.1%) | 127 (8.6%) |
| No Fuel Used | 6 (0.1%) | 0 (0.0%) |
| Total | 5,383 (100.0%) | 1,482 (100.0%) |
Household Vehicle Usage in Andrew County
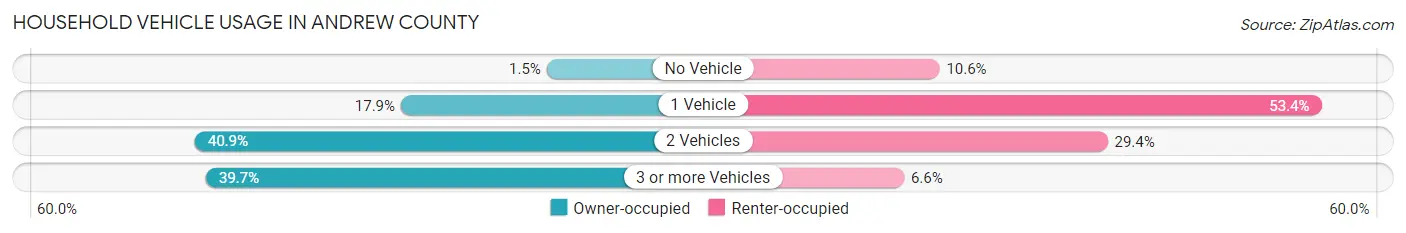
| Vehicles per Household | Owner-occupied | Renter-occupied |
| No Vehicle | 82 (1.5%) | 157 (10.6%) |
| 1 Vehicle | 961 (17.8%) | 791 (53.4%) |
| 2 Vehicles | 2,203 (40.9%) | 436 (29.4%) |
| 3 or more Vehicles | 2,137 (39.7%) | 98 (6.6%) |
| Total | 5,383 (100.0%) | 1,482 (100.0%) |
Real Estate & Mortgages in Andrew County
Real Estate and Mortgage Overview in Andrew County
| Characteristic | Without Mortgage | With Mortgage |
| Housing Units | 2,537 | 2,846 |
| Median Property Value | $173,000 | $179,100 |
| Median Household Income | $55,977 | $498 |
| Monthly Housing Costs | $502 | $56 |
| Real Estate Taxes | $1,362 | $33 |
Property Value by Mortgage Status in Andrew County
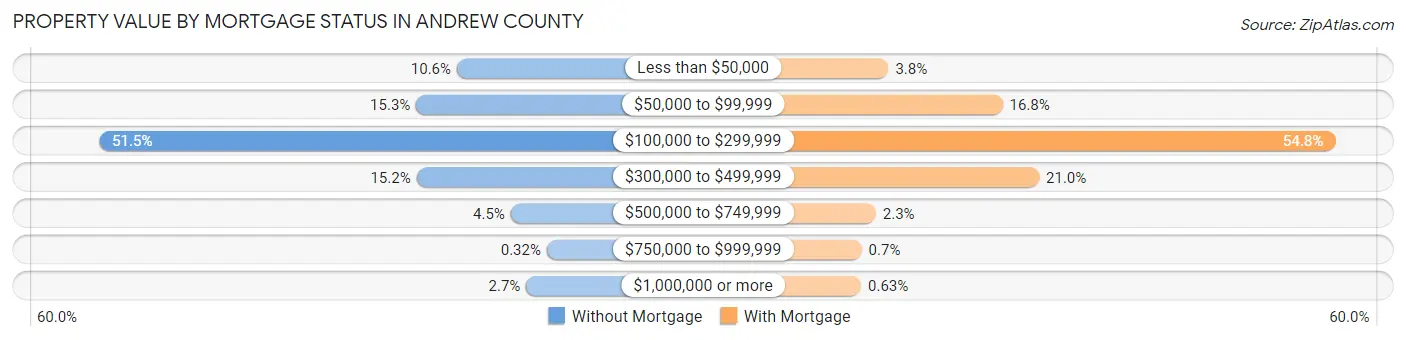
| Property Value | Without Mortgage | With Mortgage |
| Less than $50,000 | 269 (10.6%) | 107 (3.8%) |
| $50,000 to $99,999 | 387 (15.2%) | 478 (16.8%) |
| $100,000 to $299,999 | 1,306 (51.5%) | 1,560 (54.8%) |
| $300,000 to $499,999 | 386 (15.2%) | 597 (21.0%) |
| $500,000 to $749,999 | 113 (4.4%) | 66 (2.3%) |
| $750,000 to $999,999 | 8 (0.3%) | 20 (0.7%) |
| $1,000,000 or more | 68 (2.7%) | 18 (0.6%) |
| Total | 2,537 (100.0%) | 2,846 (100.0%) |
Household Income by Mortgage Status in Andrew County
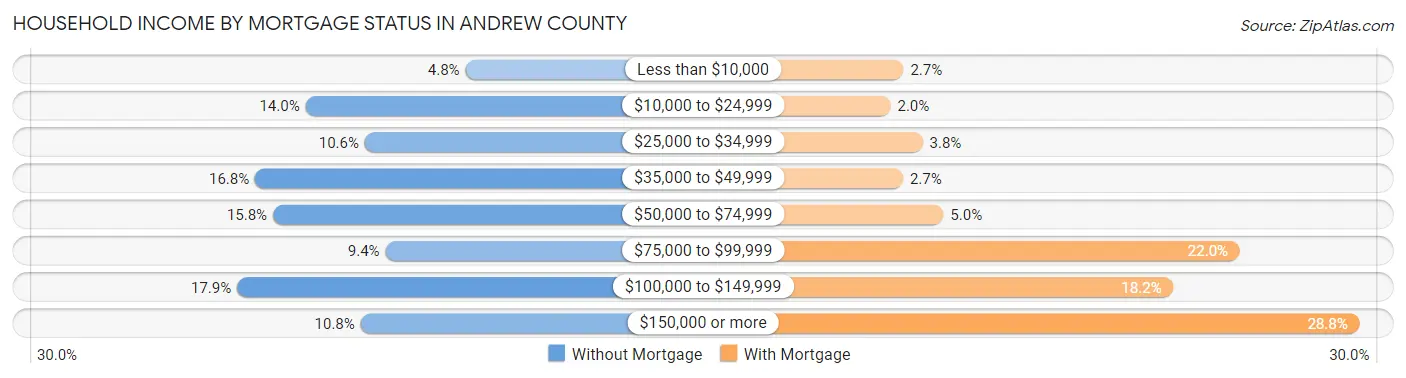
| Household Income | Without Mortgage | With Mortgage |
| Less than $10,000 | 122 (4.8%) | 78 (2.7%) |
| $10,000 to $24,999 | 354 (14.0%) | 57 (2.0%) |
| $25,000 to $34,999 | 268 (10.6%) | 109 (3.8%) |
| $35,000 to $49,999 | 427 (16.8%) | 77 (2.7%) |
| $50,000 to $74,999 | 401 (15.8%) | 143 (5.0%) |
| $75,000 to $99,999 | 238 (9.4%) | 625 (22.0%) |
| $100,000 to $149,999 | 453 (17.9%) | 517 (18.2%) |
| $150,000 or more | 274 (10.8%) | 820 (28.8%) |
| Total | 2,537 (100.0%) | 2,846 (100.0%) |
Property Value to Household Income Ratio in Andrew County
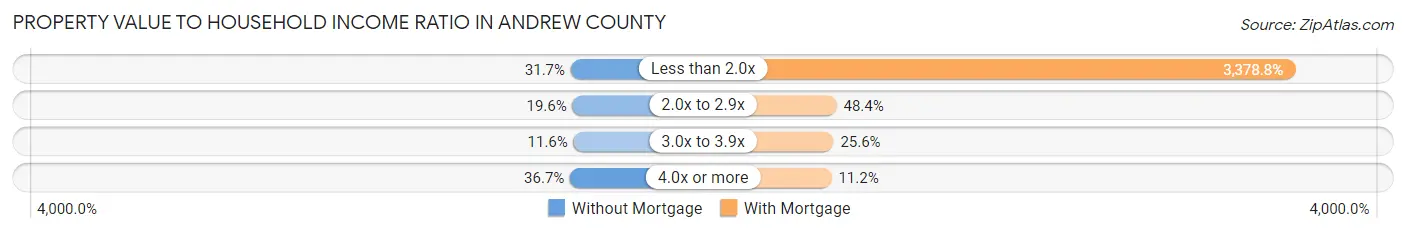
| Value-to-Income Ratio | Without Mortgage | With Mortgage |
| Less than 2.0x | 803 (31.7%) | 96,161 (3,378.8%) |
| 2.0x to 2.9x | 496 (19.6%) | 1,377 (48.4%) |
| 3.0x to 3.9x | 295 (11.6%) | 729 (25.6%) |
| 4.0x or more | 931 (36.7%) | 319 (11.2%) |
| Total | 2,537 (100.0%) | 2,846 (100.0%) |
Real Estate Taxes by Mortgage Status in Andrew County
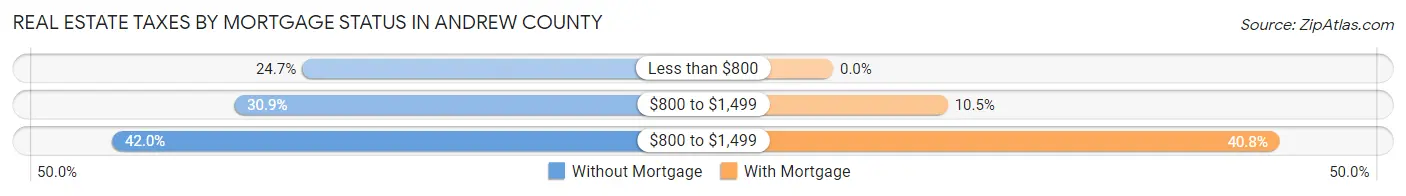
| Property Taxes | Without Mortgage | With Mortgage |
| Less than $800 | 626 (24.7%) | 0 (0.0%) |
| $800 to $1,499 | 783 (30.9%) | 298 (10.5%) |
| $800 to $1,499 | 1,066 (42.0%) | 1,161 (40.8%) |
| Total | 2,537 (100.0%) | 2,846 (100.0%) |
Health & Disability in Andrew County
Health Insurance Coverage by Age in Andrew County
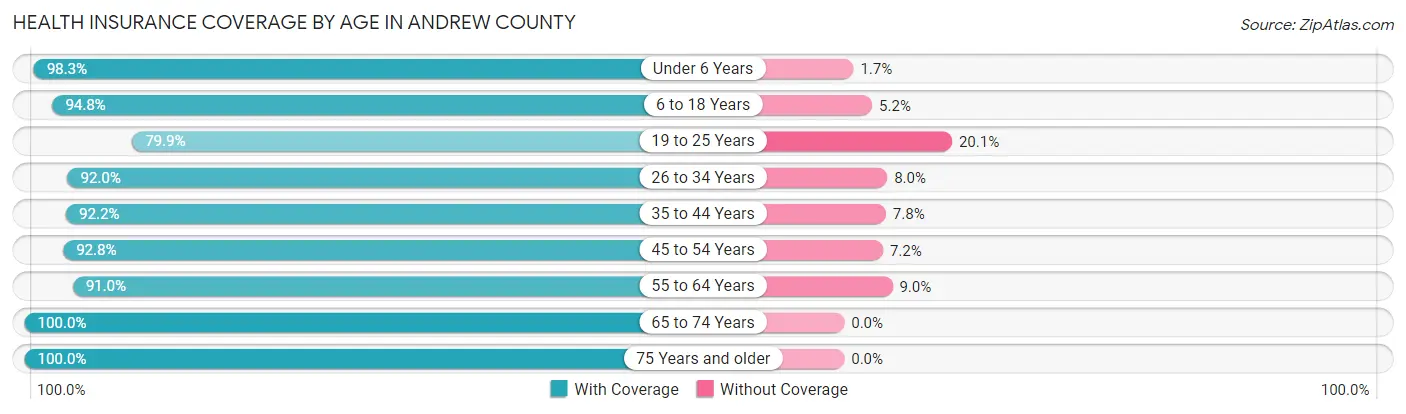
| Age Bracket | With Coverage | Without Coverage |
| Under 6 Years | 1,265 (98.3%) | 22 (1.7%) |
| 6 to 18 Years | 2,919 (94.8%) | 160 (5.2%) |
| 19 to 25 Years | 947 (79.9%) | 238 (20.1%) |
| 26 to 34 Years | 1,737 (92.0%) | 151 (8.0%) |
| 35 to 44 Years | 1,937 (92.2%) | 163 (7.8%) |
| 45 to 54 Years | 2,034 (92.8%) | 158 (7.2%) |
| 55 to 64 Years | 2,332 (91.0%) | 230 (9.0%) |
| 65 to 74 Years | 2,107 (100.0%) | 0 (0.0%) |
| 75 Years and older | 1,385 (100.0%) | 0 (0.0%) |
| Total | 16,663 (93.7%) | 1,122 (6.3%) |
Health Insurance Coverage by Citizenship Status in Andrew County
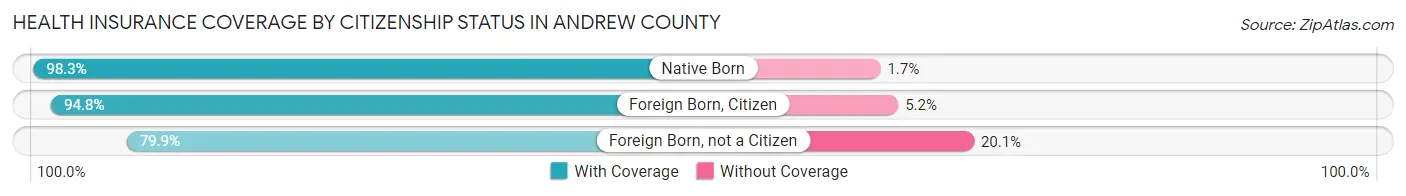
| Citizenship Status | With Coverage | Without Coverage |
| Native Born | 1,265 (98.3%) | 22 (1.7%) |
| Foreign Born, Citizen | 2,919 (94.8%) | 160 (5.2%) |
| Foreign Born, not a Citizen | 947 (79.9%) | 238 (20.1%) |
Health Insurance Coverage by Household Income in Andrew County
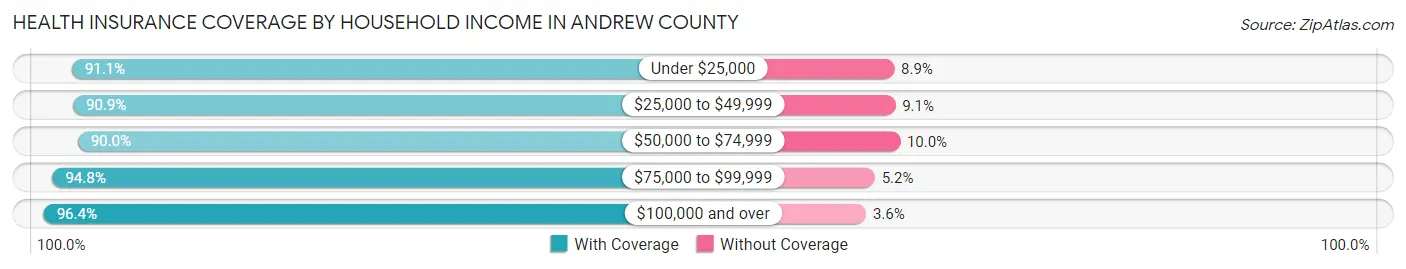
| Household Income | With Coverage | Without Coverage |
| Under $25,000 | 1,451 (91.1%) | 141 (8.9%) |
| $25,000 to $49,999 | 2,617 (90.9%) | 261 (9.1%) |
| $50,000 to $74,999 | 2,776 (90.0%) | 307 (10.0%) |
| $75,000 to $99,999 | 2,589 (94.8%) | 143 (5.2%) |
| $100,000 and over | 7,223 (96.4%) | 269 (3.6%) |
Public vs Private Health Insurance Coverage by Age in Andrew County
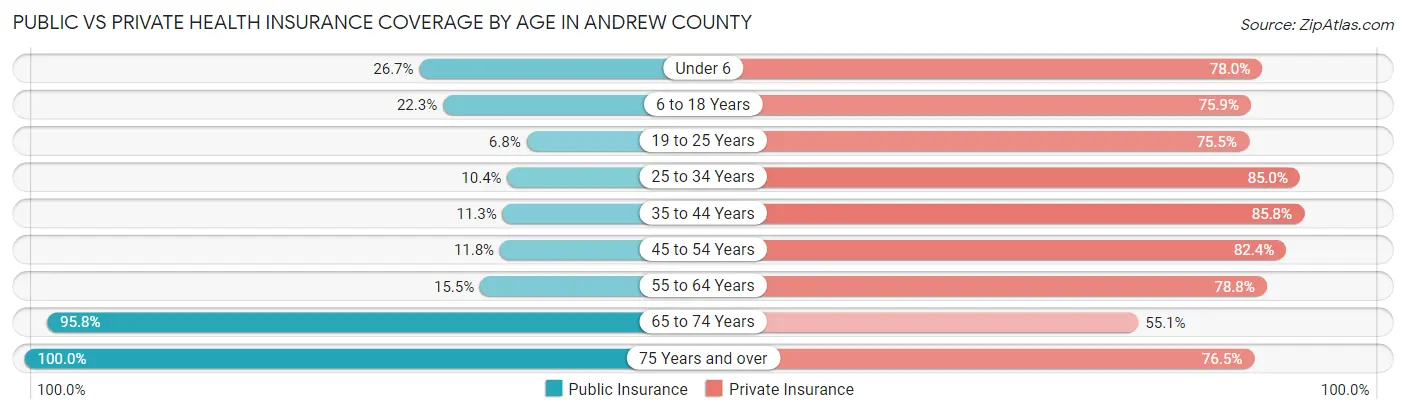
| Age Bracket | Public Insurance | Private Insurance |
| Under 6 | 344 (26.7%) | 1,004 (78.0%) |
| 6 to 18 Years | 688 (22.3%) | 2,337 (75.9%) |
| 19 to 25 Years | 81 (6.8%) | 895 (75.5%) |
| 25 to 34 Years | 196 (10.4%) | 1,605 (85.0%) |
| 35 to 44 Years | 237 (11.3%) | 1,801 (85.8%) |
| 45 to 54 Years | 258 (11.8%) | 1,807 (82.4%) |
| 55 to 64 Years | 396 (15.5%) | 2,020 (78.8%) |
| 65 to 74 Years | 2,019 (95.8%) | 1,160 (55.0%) |
| 75 Years and over | 1,385 (100.0%) | 1,060 (76.5%) |
| Total | 5,604 (31.5%) | 13,689 (77.0%) |
Disability Status by Sex by Age in Andrew County
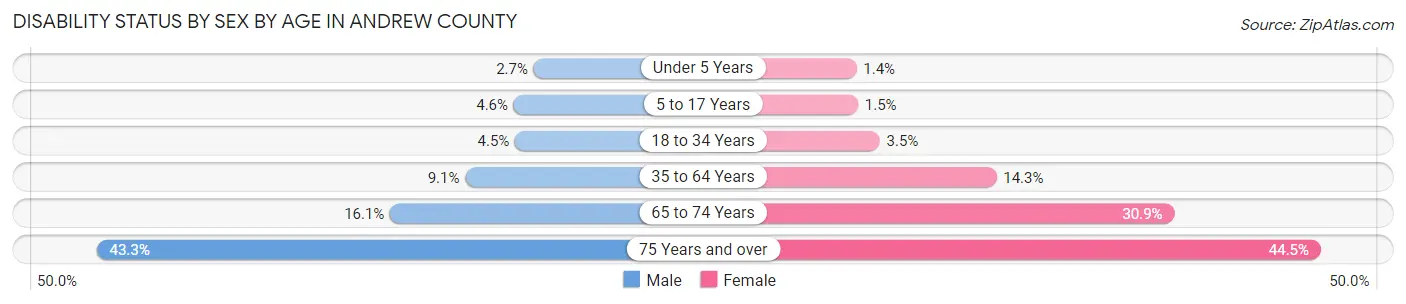
| Age Bracket | Male | Female |
| Under 5 Years | 16 (2.7%) | 6 (1.3%) |
| 5 to 17 Years | 72 (4.6%) | 23 (1.5%) |
| 18 to 34 Years | 76 (4.5%) | 56 (3.5%) |
| 35 to 64 Years | 319 (9.1%) | 480 (14.3%) |
| 65 to 74 Years | 171 (16.1%) | 322 (30.9%) |
| 75 Years and over | 256 (43.3%) | 353 (44.5%) |
Disability Class by Sex by Age in Andrew County
Disability Class: Hearing Difficulty
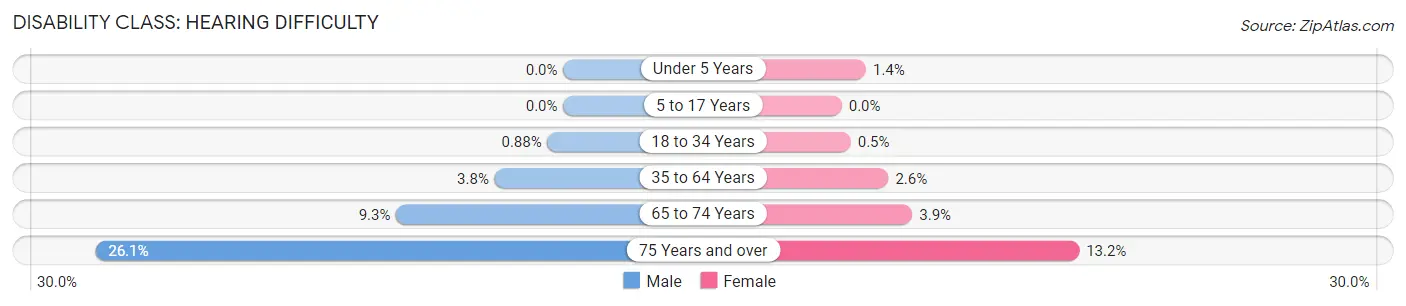
| Age Bracket | Male | Female |
| Under 5 Years | 0 (0.0%) | 6 (1.3%) |
| 5 to 17 Years | 0 (0.0%) | 0 (0.0%) |
| 18 to 34 Years | 15 (0.9%) | 8 (0.5%) |
| 35 to 64 Years | 134 (3.8%) | 87 (2.6%) |
| 65 to 74 Years | 99 (9.3%) | 41 (3.9%) |
| 75 Years and over | 154 (26.1%) | 105 (13.2%) |
Disability Class: Vision Difficulty
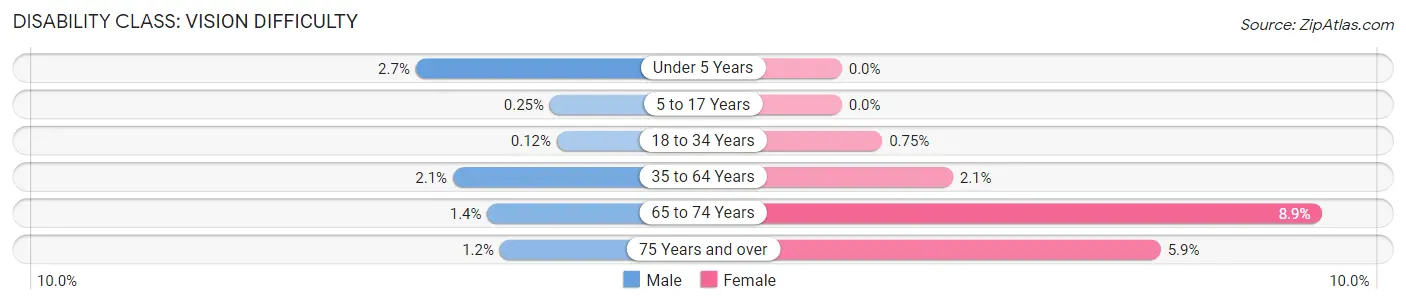
| Age Bracket | Male | Female |
| Under 5 Years | 16 (2.7%) | 0 (0.0%) |
| 5 to 17 Years | 4 (0.3%) | 0 (0.0%) |
| 18 to 34 Years | 2 (0.1%) | 12 (0.7%) |
| 35 to 64 Years | 72 (2.1%) | 69 (2.1%) |
| 65 to 74 Years | 15 (1.4%) | 93 (8.9%) |
| 75 Years and over | 7 (1.2%) | 47 (5.9%) |
Disability Class: Cognitive Difficulty
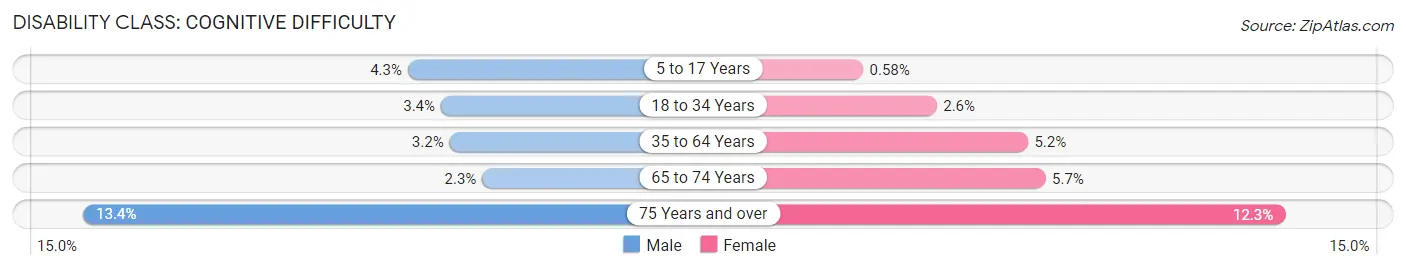
| Age Bracket | Male | Female |
| 5 to 17 Years | 68 (4.3%) | 9 (0.6%) |
| 18 to 34 Years | 58 (3.4%) | 42 (2.6%) |
| 35 to 64 Years | 111 (3.2%) | 173 (5.2%) |
| 65 to 74 Years | 24 (2.3%) | 59 (5.7%) |
| 75 Years and over | 79 (13.4%) | 98 (12.3%) |
Disability Class: Ambulatory Difficulty
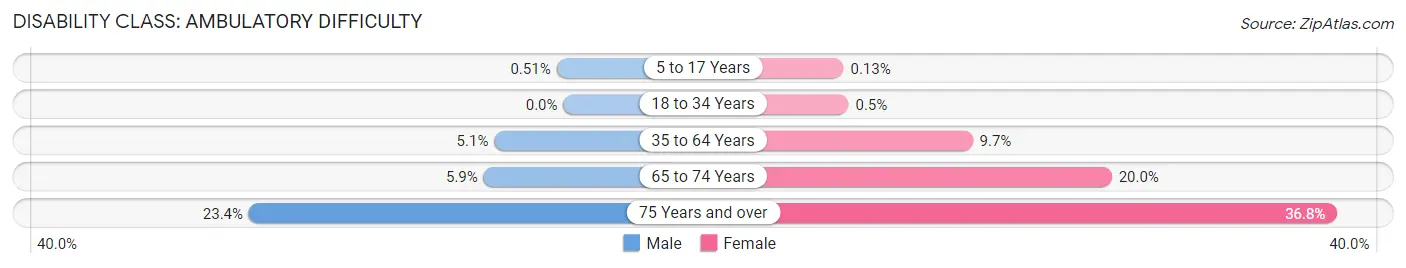
| Age Bracket | Male | Female |
| 5 to 17 Years | 8 (0.5%) | 2 (0.1%) |
| 18 to 34 Years | 0 (0.0%) | 8 (0.5%) |
| 35 to 64 Years | 180 (5.1%) | 325 (9.7%) |
| 65 to 74 Years | 63 (5.9%) | 209 (20.0%) |
| 75 Years and over | 138 (23.4%) | 292 (36.8%) |
Disability Class: Self-Care Difficulty
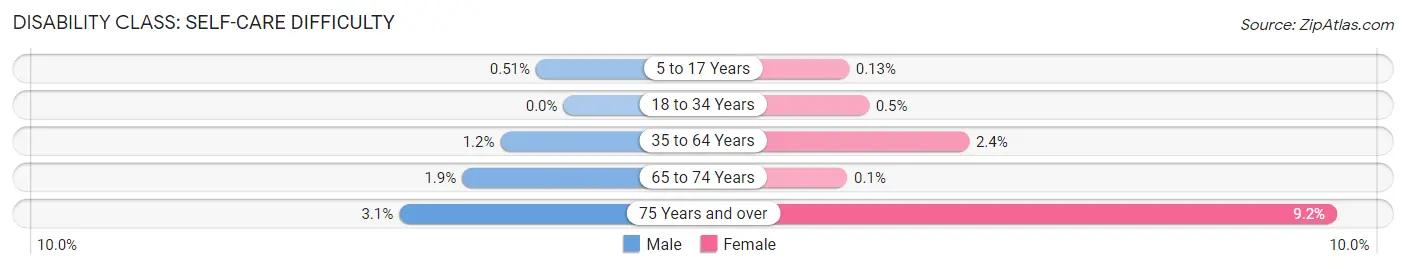
| Age Bracket | Male | Female |
| 5 to 17 Years | 8 (0.5%) | 2 (0.1%) |
| 18 to 34 Years | 0 (0.0%) | 8 (0.5%) |
| 35 to 64 Years | 41 (1.2%) | 79 (2.4%) |
| 65 to 74 Years | 20 (1.9%) | 1 (0.1%) |
| 75 Years and over | 18 (3.0%) | 73 (9.2%) |
Technology Access in Andrew County
Computing Device Access in Andrew County
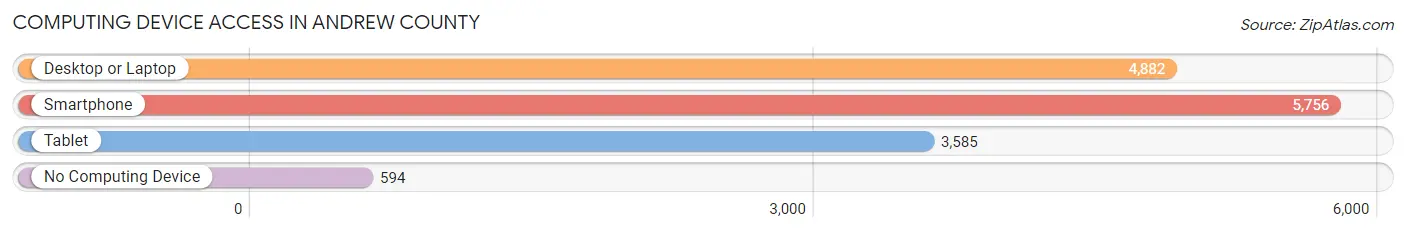
| Device Type | # Households | % Households |
| Desktop or Laptop | 4,882 | 71.1% |
| Smartphone | 5,756 | 83.9% |
| Tablet | 3,585 | 52.2% |
| No Computing Device | 594 | 8.6% |
| Total | 6,865 | 100.0% |
Internet Access in Andrew County
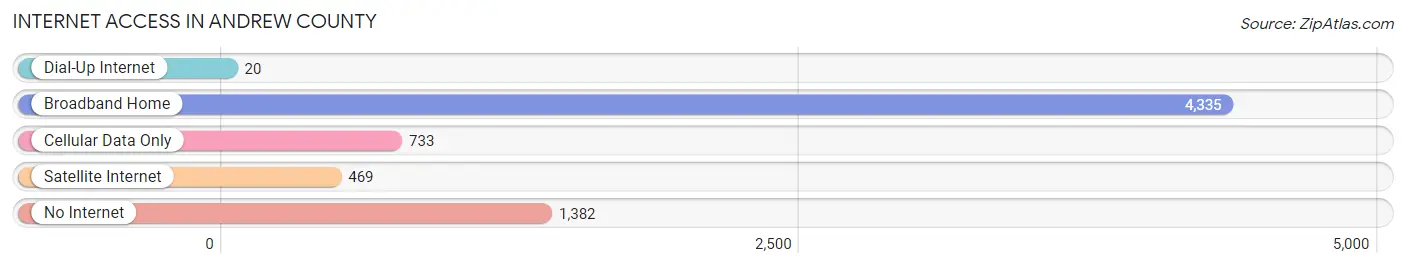
| Internet Type | # Households | % Households |
| Dial-Up Internet | 20 | 0.3% |
| Broadband Home | 4,335 | 63.1% |
| Cellular Data Only | 733 | 10.7% |
| Satellite Internet | 469 | 6.8% |
| No Internet | 1,382 | 20.1% |
| Total | 6,865 | 100.0% |
Andrew County Summary
Andrew County is located in the northwestern corner of Missouri, and is part of the St. Joseph Metropolitan Statistical Area. The county was established in 1841 and named after Andrew Jackson, the seventh president of the United States. The county seat is Savannah, and the largest city is St. Joseph. As of the 2010 census, the population was 17,291.
Geography
Andrew County is located in the northwestern corner of Missouri, and is bordered by Holt County to the north, Nodaway County to the east, Buchanan County to the south, and Doniphan County, Kansas to the west. The county has a total area of 545 square miles, of which 544 square miles is land and 1.2 square miles (0.2%) is water. The county is drained by the Nodaway River, which flows through the center of the county.
The terrain of Andrew County is generally flat, with some rolling hills in the northern part of the county. The highest point in the county is located in the northwest corner, at an elevation of 1,068 feet. The county is mostly covered in grassland, with some areas of woodland.
Demographics
As of the 2010 census, there were 17,291 people, 6,845 households, and 4,817 families residing in the county. The population density was 32 people per square mile. There were 7,521 housing units at an average density of 14 per square mile. The racial makeup of the county was 95.2% White, 1.3% Black or African American, 0.4% Native American, 0.4% Asian, 0.1% Pacific Islander, 1.2% from other races, and 1.4% from two or more races. Hispanic or Latino of any race were 3.2% of the population.
There were 6,845 households, out of which 30.2% had children under the age of 18 living with them, 54.2% were married couples living together, 9.7% had a female householder with no husband present, and 31.7% were non-families. 27.2% of all households were made up of individuals, and 12.7% had someone living alone who was 65 years of age or older. The average household size was 2.48 and the average family size was 3.01.
The median age in the county was 39.3 years. 24.7% of residents were under the age of 18; 8.2% were between the ages of 18 and 24; 23.7% were from 25 to 44; 27.2% were from 45 to 64; and 16.2% were 65 years of age or older. The gender makeup of the county was 48.7% male and 51.3% female.
Economy
Agriculture is the main economic activity in Andrew County. The county is home to a variety of crops, including corn, soybeans, wheat, hay, and oats. Livestock production is also important, with beef cattle, dairy cattle, and hogs being the main types of livestock raised in the county.
The county also has a strong manufacturing sector, with several large employers located in the county. The largest employer is the St. Joseph Regional Medical Center, which employs over 2,000 people. Other major employers include the Tyson Foods plant, the St. Joseph School District, and the Andrew County Courthouse.
In addition, Andrew County is home to several tourist attractions, including the Pony Express Museum, the Jesse James Home Museum, and the Pony Express National Historic Trail. These attractions draw thousands of visitors to the county each year, providing a boost to the local economy.
Conclusion
Andrew County is a rural county located in the northwestern corner of Missouri. The county is home to a variety of agricultural activities, as well as a strong manufacturing sector. The county also has several tourist attractions, which draw thousands of visitors to the area each year. With its diverse economy and rich history, Andrew County is a great place to live and work.
Common Questions
What is Per Capita Income in Andrew County?
Per Capita income in Andrew County is $33,722.
What is the Median Family Income in Andrew County?
Median Family Income in Andrew County is $89,200.
What is the Median Household income in Andrew County?
Median Household Income in Andrew County is $68,774.
What is Income or Wage Gap in Andrew County?
Income or Wage Gap in Andrew County is 35.8%.
Women in Andrew County earn 64.2 cents for every dollar earned by a man.
What is Family Income Deficit in Andrew County?
Family Income Deficit in Andrew County is $7,011.
Families that are below poverty line in Andrew County earn $7,011 less on average than the poverty threshold level.
What is Inequality or Gini Index in Andrew County?
Inequality or Gini Index in Andrew County is 0.40.
What is the Total Population of Andrew County?
Total Population of Andrew County is 18,069.
What is the Total Male Population of Andrew County?
Total Male Population of Andrew County is 9,113.
What is the Total Female Population of Andrew County?
Total Female Population of Andrew County is 8,956.
What is the Ratio of Males per 100 Females in Andrew County?
There are 101.75 Males per 100 Females in Andrew County.
What is the Ratio of Females per 100 Males in Andrew County?
There are 98.28 Females per 100 Males in Andrew County.
What is the Median Population Age in Andrew County?
Median Population Age in Andrew County is 41.5 Years.
What is the Average Family Size in Andrew County
Average Family Size in Andrew County is 3.2 People.
What is the Average Household Size in Andrew County
Average Household Size in Andrew County is 2.6 People.
How Large is the Labor Force in Andrew County?
There are 9,046 People in the Labor Forcein in Andrew County.
What is the Percentage of People in the Labor Force in Andrew County?
63.1% of People are in the Labor Force in Andrew County.
What is the Unemployment Rate in Andrew County?
Unemployment Rate in Andrew County is 4.1%.