Zip Codes with the Highest Percentage of Population with a Degree in Business in Illinois
RELATED REPORTS & OPTIONS
Business
Illinois
Compare Zip Codes
Map of Zip Codes with the Highest Percentage of Population with a Degree in Business in Illinois
30.0%
100.0%
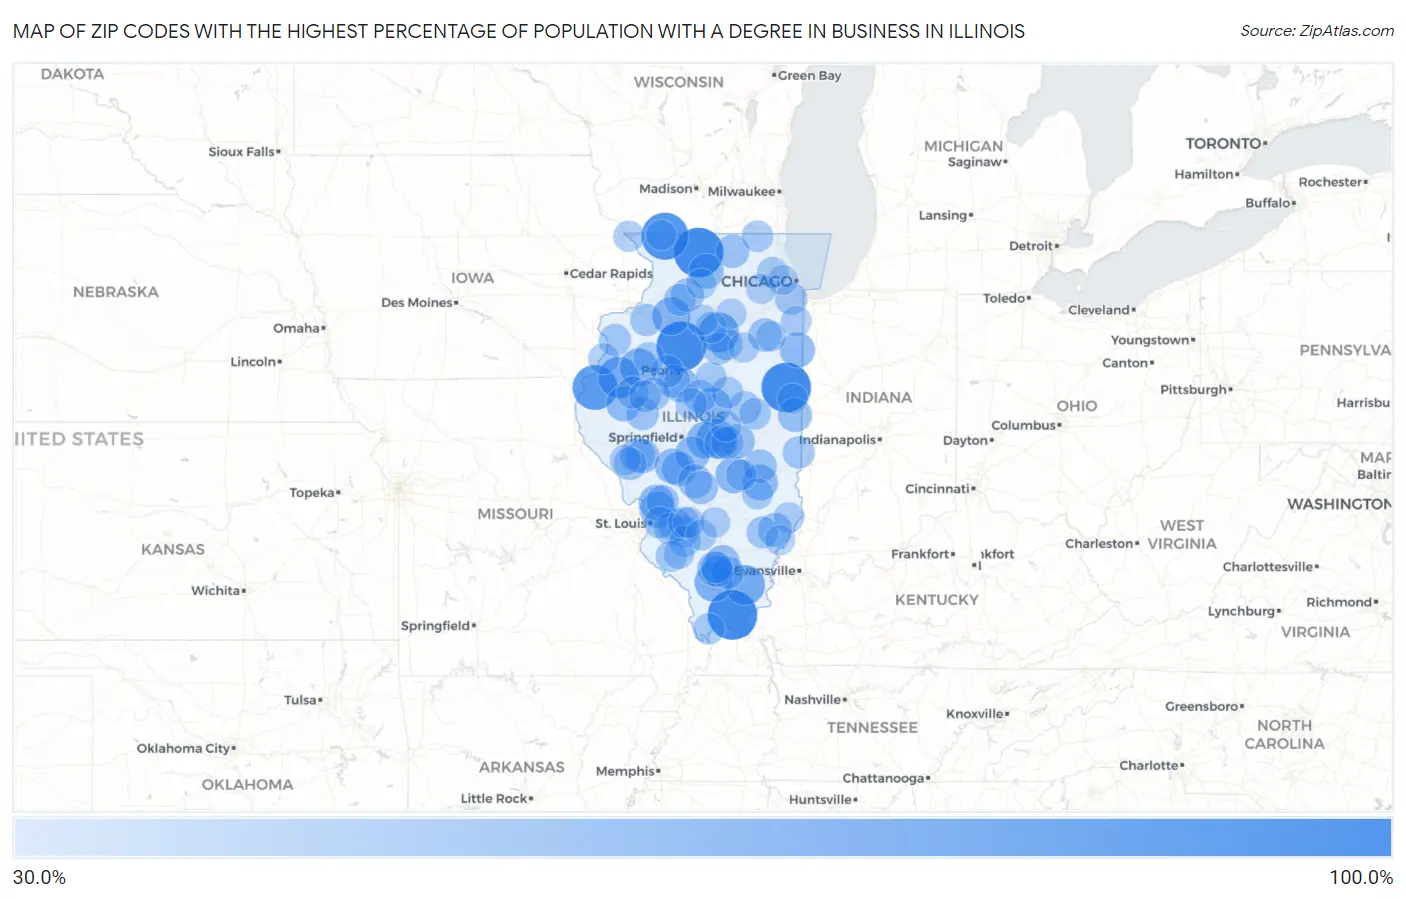
Zip Codes with the Highest Percentage of Population with a Degree in Business in Illinois
| Zip Code | % Graduates | vs State | vs National | |
| 1. | 60932 | 100.0% | 20.4% (+79.6)#1 | 19.5% (+80.5)#37 |
| 2. | 62943 | 100.0% | 20.4% (+79.6)#2 | 19.5% (+80.5)#51 |
| 3. | 61077 | 100.0% | 20.4% (+79.6)#3 | 19.5% (+80.5)#109 |
| 4. | 61479 | 100.0% | 20.4% (+79.6)#4 | 19.5% (+80.5)#172 |
| 5. | 61059 | 91.7% | 20.4% (+71.3)#5 | 19.5% (+72.2)#196 |
| 6. | 62336 | 83.3% | 20.4% (+63.0)#6 | 19.5% (+63.8)#216 |
| 7. | 61475 | 71.1% | 20.4% (+50.7)#7 | 19.5% (+51.6)#289 |
| 8. | 61332 | 66.7% | 20.4% (+46.3)#8 | 19.5% (+47.2)#342 |
| 9. | 62965 | 66.7% | 20.4% (+46.3)#9 | 19.5% (+47.2)#351 |
| 10. | 62514 | 64.0% | 20.4% (+43.6)#10 | 19.5% (+44.5)#371 |
| 11. | 62921 | 60.9% | 20.4% (+40.5)#11 | 19.5% (+41.4)#412 |
| 12. | 61474 | 60.0% | 20.4% (+39.6)#12 | 19.5% (+40.5)#424 |
| 13. | 61344 | 59.3% | 20.4% (+38.9)#13 | 19.5% (+39.8)#440 |
| 14. | 61778 | 57.1% | 20.4% (+36.8)#14 | 19.5% (+37.6)#475 |
| 15. | 62547 | 54.5% | 20.4% (+34.2)#15 | 19.5% (+35.0)#526 |
| 16. | 62444 | 54.2% | 20.4% (+33.8)#16 | 19.5% (+34.7)#538 |
| 17. | 62087 | 52.4% | 20.4% (+32.0)#17 | 19.5% (+32.9)#579 |
| 18. | 62436 | 52.0% | 20.4% (+31.6)#18 | 19.5% (+32.5)#592 |
| 19. | 62018 | 50.5% | 20.4% (+30.1)#19 | 19.5% (+31.0)#634 |
| 20. | 60912 | 50.0% | 20.4% (+29.6)#20 | 19.5% (+30.5)#649 |
| 21. | 62825 | 50.0% | 20.4% (+29.6)#21 | 19.5% (+30.5)#670 |
| 22. | 62672 | 50.0% | 20.4% (+29.6)#22 | 19.5% (+30.5)#691 |
| 23. | 61452 | 50.0% | 20.4% (+29.6)#23 | 19.5% (+30.5)#694 |
| 24. | 61015 | 49.2% | 20.4% (+28.8)#24 | 19.5% (+29.7)#729 |
| 25. | 61564 | 48.6% | 20.4% (+28.3)#25 | 19.5% (+29.1)#740 |
| 26. | 62897 | 48.4% | 20.4% (+28.0)#26 | 19.5% (+28.9)#747 |
| 27. | 62570 | 47.9% | 20.4% (+27.5)#27 | 19.5% (+28.4)#761 |
| 28. | 61937 | 47.4% | 20.4% (+27.1)#28 | 19.5% (+27.9)#777 |
| 29. | 62572 | 47.2% | 20.4% (+26.8)#29 | 19.5% (+27.7)#791 |
| 30. | 62610 | 47.1% | 20.4% (+26.7)#30 | 19.5% (+27.6)#798 |
| 31. | 62663 | 46.4% | 20.4% (+26.0)#31 | 19.5% (+26.9)#826 |
| 32. | 61833 | 45.9% | 20.4% (+25.5)#32 | 19.5% (+26.4)#851 |
| 33. | 62051 | 45.7% | 20.4% (+25.3)#33 | 19.5% (+26.2)#859 |
| 34. | 62476 | 45.4% | 20.4% (+25.0)#34 | 19.5% (+25.9)#873 |
| 35. | 62544 | 44.8% | 20.4% (+24.4)#35 | 19.5% (+25.3)#896 |
| 36. | 61038 | 44.2% | 20.4% (+23.8)#36 | 19.5% (+24.7)#935 |
| 37. | 62440 | 44.1% | 20.4% (+23.8)#37 | 19.5% (+24.6)#937 |
| 38. | 60935 | 44.0% | 20.4% (+23.6)#38 | 19.5% (+24.5)#947 |
| 39. | 61042 | 43.2% | 20.4% (+22.8)#39 | 19.5% (+23.7)#982 |
| 40. | 62032 | 42.9% | 20.4% (+22.5)#40 | 19.5% (+23.4)#1,003 |
| 41. | 61539 | 42.9% | 20.4% (+22.5)#41 | 19.5% (+23.4)#1,016 |
| 42. | 62289 | 42.6% | 20.4% (+22.2)#42 | 19.5% (+23.1)#1,034 |
| 43. | 61721 | 41.8% | 20.4% (+21.5)#43 | 19.5% (+22.3)#1,079 |
| 44. | 62856 | 41.7% | 20.4% (+21.3)#44 | 19.5% (+22.2)#1,092 |
| 45. | 62050 | 41.7% | 20.4% (+21.3)#45 | 19.5% (+22.2)#1,096 |
| 46. | 62624 | 41.7% | 20.4% (+21.3)#46 | 19.5% (+22.2)#1,097 |
| 47. | 61569 | 41.5% | 20.4% (+21.1)#47 | 19.5% (+22.0)#1,110 |
| 48. | 62067 | 40.8% | 20.4% (+20.4)#48 | 19.5% (+21.3)#1,158 |
| 49. | 61542 | 40.8% | 20.4% (+20.4)#49 | 19.5% (+21.3)#1,162 |
| 50. | 61311 | 40.7% | 20.4% (+20.4)#50 | 19.5% (+21.2)#1,168 |
| 51. | 61854 | 40.4% | 20.4% (+20.0)#51 | 19.5% (+20.9)#1,189 |
| 52. | 60472 | 40.1% | 20.4% (+19.7)#52 | 19.5% (+20.6)#1,204 |
| 53. | 61925 | 40.0% | 20.4% (+19.6)#53 | 19.5% (+20.5)#1,211 |
| 54. | 61411 | 40.0% | 20.4% (+19.6)#54 | 19.5% (+20.5)#1,220 |
| 55. | 61274 | 40.0% | 20.4% (+19.6)#55 | 19.5% (+20.5)#1,225 |
| 56. | 61955 | 40.0% | 20.4% (+19.6)#56 | 19.5% (+20.5)#1,231 |
| 57. | 61243 | 39.4% | 20.4% (+19.1)#57 | 19.5% (+19.9)#1,270 |
| 58. | 61476 | 39.4% | 20.4% (+19.0)#58 | 19.5% (+19.9)#1,272 |
| 59. | 62215 | 39.1% | 20.4% (+18.7)#59 | 19.5% (+19.6)#1,295 |
| 60. | 61441 | 38.6% | 20.4% (+18.2)#60 | 19.5% (+19.1)#1,330 |
| 61. | 61321 | 38.5% | 20.4% (+18.1)#61 | 19.5% (+19.0)#1,338 |
| 62. | 62446 | 38.2% | 20.4% (+17.9)#62 | 19.5% (+18.7)#1,359 |
| 63. | 62225 | 38.1% | 20.4% (+17.8)#63 | 19.5% (+18.6)#1,368 |
| 64. | 62232 | 38.1% | 20.4% (+17.7)#64 | 19.5% (+18.6)#1,370 |
| 65. | 62819 | 38.1% | 20.4% (+17.7)#65 | 19.5% (+18.6)#1,376 |
| 66. | 61815 | 37.5% | 20.4% (+17.1)#66 | 19.5% (+18.0)#1,429 |
| 67. | 62643 | 37.3% | 20.4% (+17.0)#67 | 19.5% (+17.8)#1,458 |
| 68. | 60071 | 37.2% | 20.4% (+16.8)#68 | 19.5% (+17.7)#1,472 |
| 69. | 62891 | 37.1% | 20.4% (+16.8)#69 | 19.5% (+17.6)#1,473 |
| 70. | 62216 | 37.1% | 20.4% (+16.7)#70 | 19.5% (+17.6)#1,477 |
| 71. | 62214 | 37.1% | 20.4% (+16.7)#71 | 19.5% (+17.6)#1,478 |
| 72. | 61736 | 37.0% | 20.4% (+16.6)#72 | 19.5% (+17.5)#1,495 |
| 73. | 62996 | 36.6% | 20.4% (+16.2)#73 | 19.5% (+17.1)#1,533 |
| 74. | 62217 | 36.6% | 20.4% (+16.2)#74 | 19.5% (+17.1)#1,536 |
| 75. | 61316 | 36.4% | 20.4% (+16.0)#75 | 19.5% (+16.9)#1,554 |
| 76. | 61437 | 36.2% | 20.4% (+15.8)#76 | 19.5% (+16.7)#1,576 |
| 77. | 60157 | 36.1% | 20.4% (+15.7)#77 | 19.5% (+16.6)#1,590 |
| 78. | 62230 | 36.0% | 20.4% (+15.6)#78 | 19.5% (+16.5)#1,601 |
| 79. | 62479 | 35.9% | 20.4% (+15.5)#79 | 19.5% (+16.4)#1,614 |
| 80. | 61025 | 35.8% | 20.4% (+15.4)#80 | 19.5% (+16.3)#1,630 |
| 81. | 61436 | 35.8% | 20.4% (+15.4)#81 | 19.5% (+16.3)#1,634 |
| 82. | 62803 | 35.5% | 20.4% (+15.1)#82 | 19.5% (+16.0)#1,671 |
| 83. | 61725 | 35.4% | 20.4% (+15.0)#83 | 19.5% (+15.9)#1,688 |
| 84. | 62361 | 35.0% | 20.4% (+14.6)#84 | 19.5% (+15.5)#1,734 |
| 85. | 62463 | 35.0% | 20.4% (+14.6)#85 | 19.5% (+15.5)#1,738 |
| 86. | 62292 | 34.8% | 20.4% (+14.4)#86 | 19.5% (+15.3)#1,759 |
| 87. | 61359 | 34.8% | 20.4% (+14.4)#87 | 19.5% (+15.3)#1,761 |
| 88. | 62554 | 34.6% | 20.4% (+14.2)#88 | 19.5% (+15.1)#1,801 |
| 89. | 60401 | 34.4% | 20.4% (+14.0)#89 | 19.5% (+14.9)#1,818 |
| 90. | 62417 | 33.9% | 20.4% (+13.6)#90 | 19.5% (+14.4)#1,893 |
| 91. | 61087 | 33.6% | 20.4% (+13.3)#91 | 19.5% (+14.1)#1,935 |
| 92. | 60913 | 33.6% | 20.4% (+13.2)#92 | 19.5% (+14.1)#1,939 |
| 93. | 61031 | 33.6% | 20.4% (+13.2)#93 | 19.5% (+14.1)#1,944 |
| 94. | 60104 | 33.3% | 20.4% (+13.0)#94 | 19.5% (+13.8)#1,964 |
| 95. | 61848 | 33.3% | 20.4% (+13.0)#95 | 19.5% (+13.8)#2,008 |
| 96. | 62811 | 33.3% | 20.4% (+13.0)#96 | 19.5% (+13.8)#2,010 |
| 97. | 60557 | 33.3% | 20.4% (+13.0)#97 | 19.5% (+13.8)#2,015 |
| 98. | 60519 | 33.3% | 20.4% (+13.0)#98 | 19.5% (+13.8)#2,035 |
| 99. | 62870 | 33.2% | 20.4% (+12.8)#99 | 19.5% (+13.7)#2,058 |
| 100. | 60460 | 33.1% | 20.4% (+12.7)#100 | 19.5% (+13.6)#2,064 |
Common Questions
What are the Top 10 Zip Codes with the Highest Percentage of Population with a Degree in Business in Illinois?
Top 10 Zip Codes with the Highest Percentage of Population with a Degree in Business in Illinois are:
What zip code has the Highest Percentage of Population with a Degree in Business in Illinois?
60932 has the Highest Percentage of Population with a Degree in Business in Illinois with 100.0%.
What is the Percentage of Population with a Degree in Business in the State of Illinois?
Percentage of Population with a Degree in Business in Illinois is 20.4%.
What is the Percentage of Population with a Degree in Business in the United States?
Percentage of Population with a Degree in Business in the United States is 19.5%.