Zip Codes with the Highest Percentage of Population with a Degree in Visual and Performing Arts in Illinois
RELATED REPORTS & OPTIONS
Visual and Performing Arts
Illinois
Compare Zip Codes
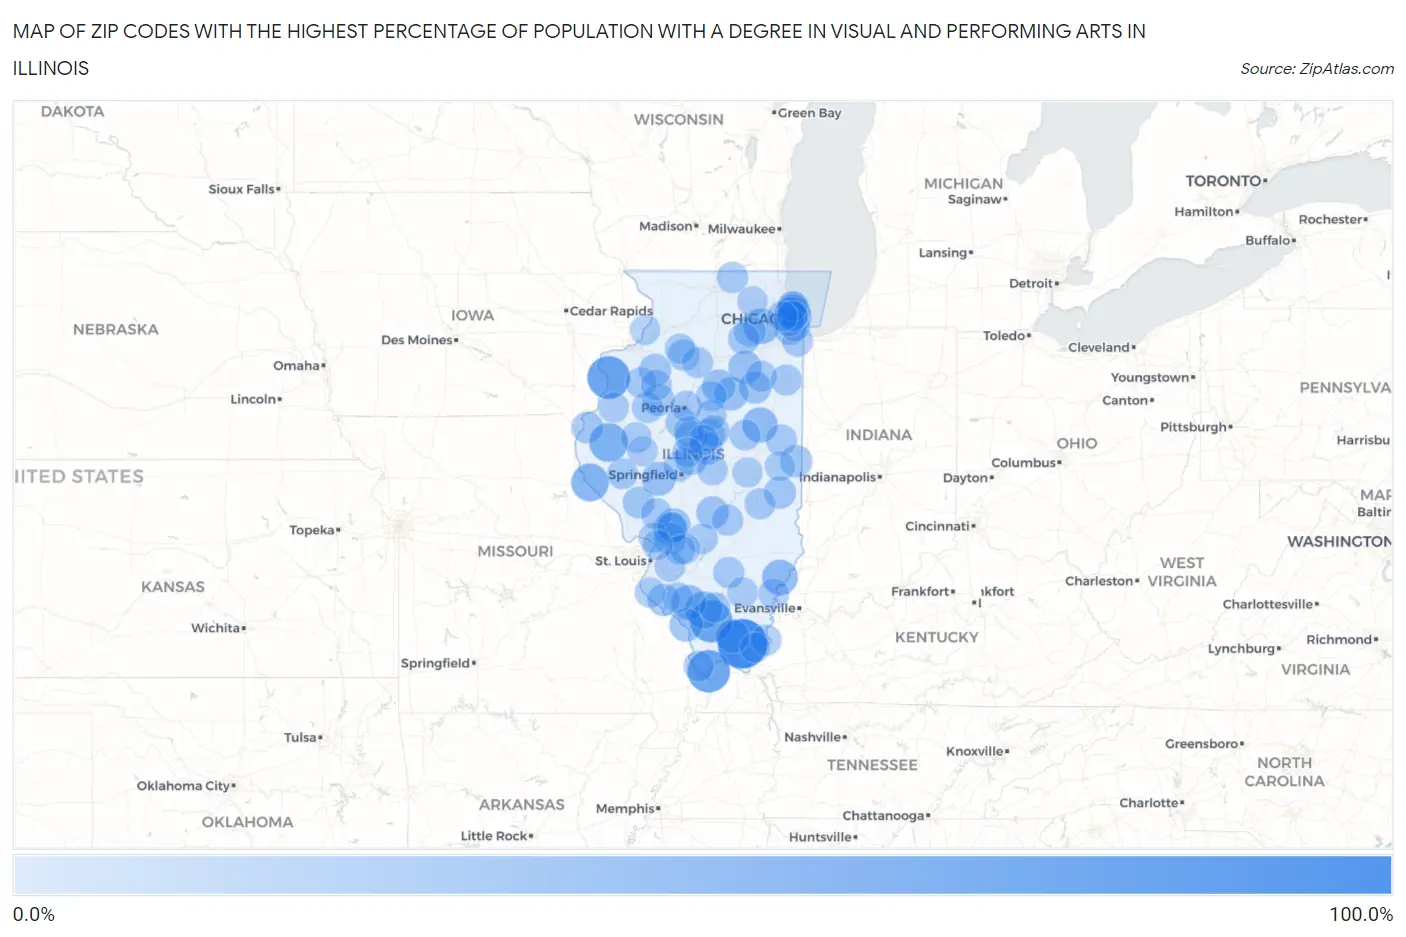
Map of Zip Codes with the Highest Percentage of Population with a Degree in Visual and Performing Arts in Illinois
0.0%
100.0%
Zip Codes with the Highest Percentage of Population with a Degree in Visual and Performing Arts in Illinois
| Zip Code | % Graduates | vs State | vs National | |
| 1. | 62928 | 100.0% | 4.4%(+95.6)#1 | 4.3%(+95.7)#17 |
| 2. | 61442 | 67.5% | 4.4%(+63.1)#2 | 4.3%(+63.2)#39 |
| 3. | 62963 | 65.8% | 4.4%(+61.3)#3 | 4.3%(+61.5)#42 |
| 4. | 62915 | 65.2% | 4.4%(+60.8)#4 | 4.3%(+61.0)#43 |
| 5. | 62311 | 47.6% | 4.4%(+43.2)#5 | 4.3%(+43.4)#86 |
| 6. | 62343 | 43.0% | 4.4%(+38.5)#6 | 4.3%(+38.7)#113 |
| 7. | 62927 | 40.0% | 4.4%(+35.6)#7 | 4.3%(+35.7)#119 |
| 8. | 62811 | 33.3% | 4.4%(+28.9)#8 | 4.3%(+29.1)#174 |
| 9. | 60519 | 33.3% | 4.4%(+28.9)#9 | 4.3%(+29.1)#181 |
| 10. | 60933 | 31.6% | 4.4%(+27.1)#10 | 4.3%(+27.3)#204 |
| 11. | 62238 | 29.4% | 4.4%(+25.0)#11 | 4.3%(+25.2)#228 |
| 12. | 62967 | 25.0% | 4.4%(+20.6)#12 | 4.3%(+20.7)#314 |
| 13. | 62601 | 25.0% | 4.4%(+20.6)#13 | 4.3%(+20.7)#316 |
| 14. | 62023 | 23.5% | 4.4%(+19.1)#14 | 4.3%(+19.3)#345 |
| 15. | 61743 | 23.4% | 4.4%(+19.0)#15 | 4.3%(+19.2)#348 |
| 16. | 61321 | 23.1% | 4.4%(+18.6)#16 | 4.3%(+18.8)#356 |
| 17. | 62950 | 22.9% | 4.4%(+18.5)#17 | 4.3%(+18.7)#361 |
| 18. | 60479 | 22.7% | 4.4%(+18.2)#18 | 4.3%(+18.4)#372 |
| 19. | 62093 | 22.2% | 4.4%(+17.8)#19 | 4.3%(+18.0)#390 |
| 20. | 62553 | 19.0% | 4.4%(+14.5)#20 | 4.3%(+14.7)#517 |
| 21. | 62634 | 18.8% | 4.4%(+14.4)#21 | 4.3%(+14.6)#527 |
| 22. | 62512 | 18.8% | 4.4%(+14.4)#22 | 4.3%(+14.6)#528 |
| 23. | 60934 | 18.5% | 4.4%(+14.1)#23 | 4.3%(+14.3)#545 |
| 24. | 61846 | 17.9% | 4.4%(+13.4)#24 | 4.3%(+13.6)#582 |
| 25. | 61754 | 17.9% | 4.4%(+13.4)#25 | 4.3%(+13.6)#584 |
| 26. | 62242 | 17.4% | 4.4%(+12.9)#26 | 4.3%(+13.1)#610 |
| 27. | 61419 | 17.4% | 4.4%(+12.9)#27 | 4.3%(+13.1)#614 |
| 28. | 60456 | 17.4% | 4.4%(+12.9)#28 | 4.3%(+13.1)#618 |
| 29. | 62635 | 16.9% | 4.4%(+12.5)#29 | 4.3%(+12.7)#643 |
| 30. | 61933 | 16.9% | 4.4%(+12.4)#30 | 4.3%(+12.6)#650 |
| 31. | 61572 | 15.8% | 4.4%(+11.4)#31 | 4.3%(+11.6)#732 |
| 32. | 62097 | 15.2% | 4.4%(+10.8)#32 | 4.3%(+10.9)#790 |
| 33. | 62341 | 15.2% | 4.4%(+10.7)#33 | 4.3%(+10.9)#792 |
| 34. | 62092 | 15.2% | 4.4%(+10.7)#34 | 4.3%(+10.9)#793 |
| 35. | 61772 | 14.7% | 4.4%(+10.3)#35 | 4.3%(+10.5)#849 |
| 36. | 61379 | 14.6% | 4.4%(+10.2)#36 | 4.3%(+10.4)#859 |
| 37. | 60512 | 14.6% | 4.4%(+10.1)#37 | 4.3%(+10.3)#876 |
| 38. | 60536 | 14.3% | 4.4%(+9.84)#38 | 4.3%(+10.0)#921 |
| 39. | 60640 | 13.9% | 4.4%(+9.44)#39 | 4.3%(+9.64)#969 |
| 40. | 61564 | 13.5% | 4.4%(+9.06)#40 | 4.3%(+9.26)#1,016 |
| 41. | 60626 | 13.3% | 4.4%(+8.89)#41 | 4.3%(+9.09)#1,038 |
| 42. | 62414 | 13.0% | 4.4%(+8.57)#42 | 4.3%(+8.77)#1,101 |
| 43. | 61812 | 12.8% | 4.4%(+8.32)#43 | 4.3%(+8.51)#1,138 |
| 44. | 61012 | 12.7% | 4.4%(+8.28)#44 | 4.3%(+8.48)#1,144 |
| 45. | 62889 | 12.6% | 4.4%(+8.13)#45 | 4.3%(+8.33)#1,177 |
| 46. | 61544 | 12.5% | 4.4%(+8.05)#46 | 4.3%(+8.25)#1,188 |
| 47. | 60660 | 12.4% | 4.4%(+7.94)#47 | 4.3%(+8.14)#1,211 |
| 48. | 62630 | 12.4% | 4.4%(+7.93)#48 | 4.3%(+8.13)#1,215 |
| 49. | 61439 | 12.0% | 4.4%(+7.55)#49 | 4.3%(+7.75)#1,290 |
| 50. | 60961 | 11.9% | 4.4%(+7.41)#50 | 4.3%(+7.61)#1,312 |
| 51. | 60910 | 11.8% | 4.4%(+7.38)#51 | 4.3%(+7.58)#1,323 |
| 52. | 62440 | 11.7% | 4.4%(+7.25)#52 | 4.3%(+7.45)#1,353 |
| 53. | 60625 | 11.7% | 4.4%(+7.24)#53 | 4.3%(+7.44)#1,354 |
| 54. | 61724 | 11.4% | 4.4%(+6.98)#54 | 4.3%(+7.18)#1,409 |
| 55. | 60603 | 11.4% | 4.4%(+6.94)#55 | 4.3%(+7.14)#1,417 |
| 56. | 61315 | 11.1% | 4.4%(+6.66)#56 | 4.3%(+6.86)#1,505 |
| 57. | 62323 | 11.1% | 4.4%(+6.66)#57 | 4.3%(+6.86)#1,506 |
| 58. | 62919 | 10.9% | 4.4%(+6.47)#58 | 4.3%(+6.67)#1,553 |
| 59. | 60651 | 10.8% | 4.4%(+6.35)#59 | 4.3%(+6.55)#1,589 |
| 60. | 61485 | 10.8% | 4.4%(+6.32)#60 | 4.3%(+6.52)#1,604 |
| 61. | 60476 | 10.7% | 4.4%(+6.29)#61 | 4.3%(+6.49)#1,610 |
| 62. | 61484 | 10.5% | 4.4%(+6.08)#62 | 4.3%(+6.27)#1,666 |
| 63. | 62828 | 10.5% | 4.4%(+6.01)#63 | 4.3%(+6.21)#1,692 |
| 64. | 62827 | 10.4% | 4.4%(+5.94)#64 | 4.3%(+6.14)#1,708 |
| 65. | 62286 | 10.4% | 4.4%(+5.92)#65 | 4.3%(+6.12)#1,716 |
| 66. | 62537 | 10.0% | 4.4%(+5.55)#66 | 4.3%(+5.75)#1,838 |
| 67. | 61603 | 9.9% | 4.4%(+5.49)#67 | 4.3%(+5.69)#1,861 |
| 68. | 60613 | 9.9% | 4.4%(+5.47)#68 | 4.3%(+5.67)#1,864 |
| 69. | 60618 | 9.8% | 4.4%(+5.39)#69 | 4.3%(+5.58)#1,896 |
| 70. | 62262 | 9.8% | 4.4%(+5.37)#70 | 4.3%(+5.56)#1,901 |
| 71. | 62225 | 9.7% | 4.4%(+5.23)#71 | 4.3%(+5.43)#1,947 |
| 72. | 60647 | 9.7% | 4.4%(+5.21)#72 | 4.3%(+5.41)#1,960 |
| 73. | 62273 | 9.5% | 4.4%(+5.07)#73 | 4.3%(+5.27)#2,015 |
| 74. | 62002 | 9.5% | 4.4%(+5.01)#74 | 4.3%(+5.21)#2,040 |
| 75. | 60641 | 9.4% | 4.4%(+4.93)#75 | 4.3%(+5.13)#2,069 |
| 76. | 60621 | 9.3% | 4.4%(+4.89)#76 | 4.3%(+5.09)#2,086 |
| 77. | 62625 | 9.3% | 4.4%(+4.85)#77 | 4.3%(+5.05)#2,107 |
| 78. | 61516 | 9.3% | 4.4%(+4.85)#78 | 4.3%(+5.05)#2,109 |
| 79. | 61725 | 9.1% | 4.4%(+4.66)#79 | 4.3%(+4.86)#2,201 |
| 80. | 62969 | 9.1% | 4.4%(+4.64)#80 | 4.3%(+4.84)#2,226 |
| 81. | 61338 | 9.1% | 4.4%(+4.64)#81 | 4.3%(+4.84)#2,231 |
| 82. | 62085 | 9.1% | 4.4%(+4.64)#82 | 4.3%(+4.84)#2,232 |
| 83. | 61471 | 9.1% | 4.4%(+4.64)#83 | 4.3%(+4.84)#2,236 |
| 84. | 60804 | 9.0% | 4.4%(+4.52)#84 | 4.3%(+4.72)#2,276 |
| 85. | 62244 | 8.8% | 4.4%(+4.40)#85 | 4.3%(+4.60)#2,330 |
| 86. | 61913 | 8.8% | 4.4%(+4.32)#86 | 4.3%(+4.52)#2,374 |
| 87. | 61734 | 8.7% | 4.4%(+4.28)#87 | 4.3%(+4.48)#2,399 |
| 88. | 62822 | 8.7% | 4.4%(+4.25)#88 | 4.3%(+4.44)#2,417 |
| 89. | 61723 | 8.7% | 4.4%(+4.25)#89 | 4.3%(+4.44)#2,418 |
| 90. | 62666 | 8.7% | 4.4%(+4.25)#90 | 4.3%(+4.44)#2,421 |
| 91. | 61810 | 8.7% | 4.4%(+4.25)#91 | 4.3%(+4.44)#2,423 |
| 92. | 60136 | 8.7% | 4.4%(+4.24)#92 | 4.3%(+4.44)#2,429 |
| 93. | 60202 | 8.5% | 4.4%(+4.09)#93 | 4.3%(+4.29)#2,501 |
| 94. | 62249 | 8.5% | 4.4%(+4.06)#94 | 4.3%(+4.26)#2,515 |
| 95. | 62982 | 8.5% | 4.4%(+4.02)#95 | 4.3%(+4.22)#2,543 |
| 96. | 61242 | 8.5% | 4.4%(+4.01)#96 | 4.3%(+4.20)#2,555 |
| 97. | 60622 | 8.4% | 4.4%(+3.93)#97 | 4.3%(+4.12)#2,609 |
| 98. | 62624 | 8.3% | 4.4%(+3.88)#98 | 4.3%(+4.08)#2,641 |
| 99. | 62084 | 8.3% | 4.4%(+3.81)#99 | 4.3%(+4.01)#2,680 |
| 100. | 60165 | 8.2% | 4.4%(+3.80)#100 | 4.3%(+4.00)#2,688 |
Common Questions
What are the Top 10 Zip Codes with the Highest Percentage of Population with a Degree in Visual and Performing Arts in Illinois?
Top 10 Zip Codes with the Highest Percentage of Population with a Degree in Visual and Performing Arts in Illinois are:
What zip code has the Highest Percentage of Population with a Degree in Visual and Performing Arts in Illinois?
62928 has the Highest Percentage of Population with a Degree in Visual and Performing Arts in Illinois with 100.0%.
What is the Percentage of Population with a Degree in Visual and Performing Arts in the State of Illinois?
Percentage of Population with a Degree in Visual and Performing Arts in Illinois is 4.4%.
What is the Percentage of Population with a Degree in Visual and Performing Arts in the United States?
Percentage of Population with a Degree in Visual and Performing Arts in the United States is 4.3%.