Zip Codes with the Highest Percentage of Households Heated by Fuel Oil / Kerosene in Illinois
RELATED REPORTS & OPTIONS
Fuel Oil Heating
Illinois
Compare Zip Codes
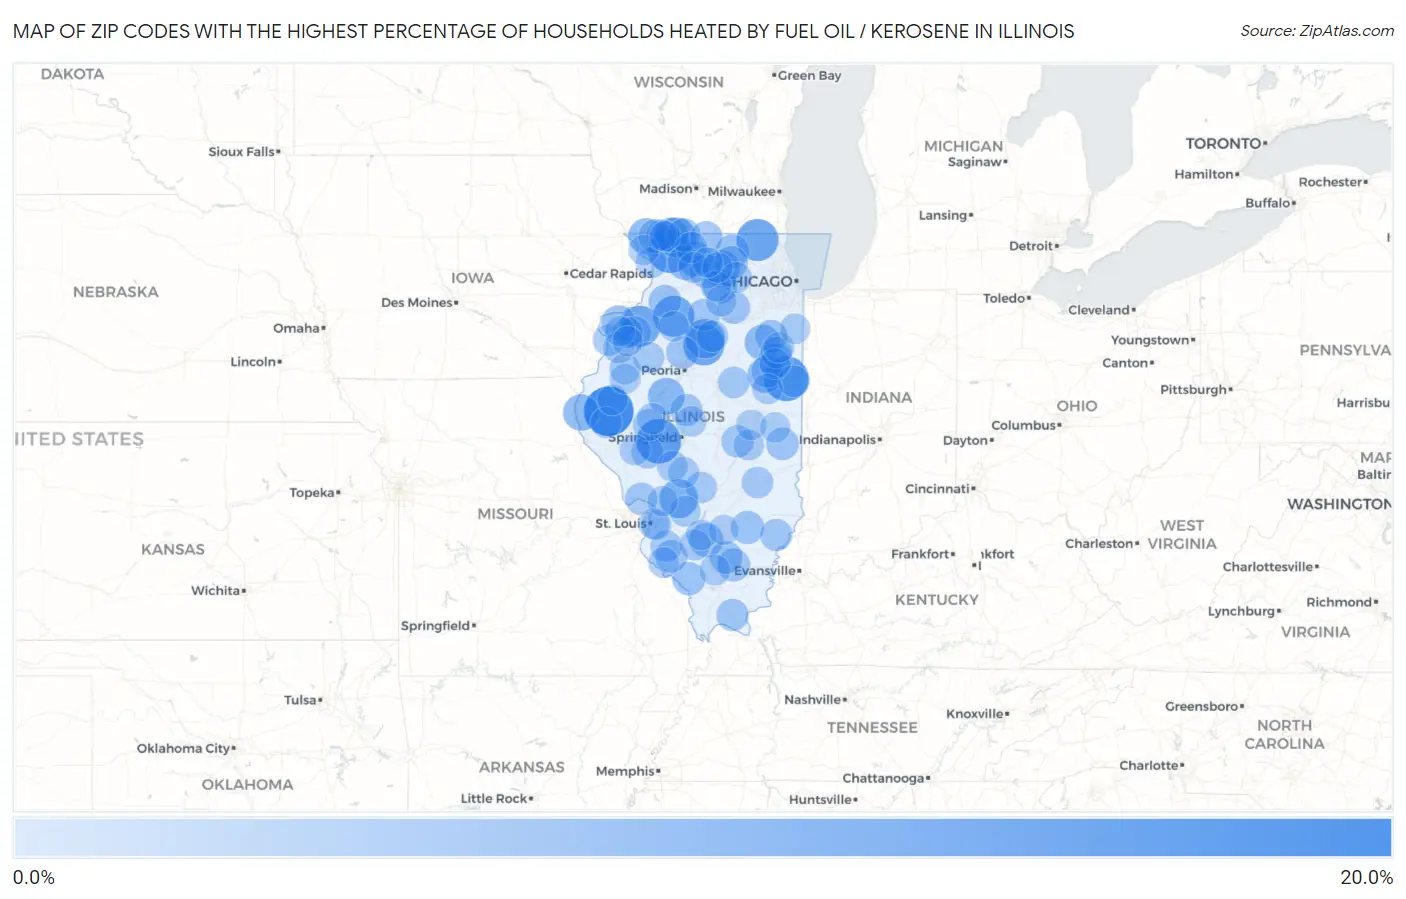
Map of Zip Codes with the Highest Percentage of Households Heated by Fuel Oil / Kerosene in Illinois
0.0%
20.0%
Zip Codes with the Highest Percentage of Households Heated by Fuel Oil / Kerosene in Illinois
| Zip Code | Fuel Oil Heating | vs State | vs National | |
| 1. | 62346 | 16.7% | 0.10%(+16.6)#1 | 4.2%(+12.5)#4,728 |
| 2. | 60926 | 12.8% | 0.10%(+12.7)#2 | 4.2%(+8.60)#5,404 |
| 3. | 62601 | 12.7% | 0.10%(+12.6)#3 | 4.2%(+8.50)#5,424 |
| 4. | 61062 | 11.7% | 0.10%(+11.6)#4 | 4.2%(+7.50)#5,646 |
| 5. | 60072 | 10.6% | 0.10%(+10.5)#5 | 4.2%(+6.40)#5,932 |
| 6. | 61361 | 9.9% | 0.10%(+9.80)#6 | 4.2%(+5.70)#6,100 |
| 7. | 61375 | 9.8% | 0.10%(+9.70)#7 | 4.2%(+5.60)#6,131 |
| 8. | 61262 | 9.6% | 0.10%(+9.50)#8 | 4.2%(+5.40)#6,185 |
| 9. | 61050 | 8.9% | 0.10%(+8.80)#9 | 4.2%(+4.70)#6,398 |
| 10. | 61336 | 8.6% | 0.10%(+8.50)#10 | 4.2%(+4.40)#6,504 |
| 11. | 62074 | 7.9% | 0.10%(+7.80)#11 | 4.2%(+3.70)#6,760 |
| 12. | 60129 | 6.7% | 0.10%(+6.60)#12 | 4.2%(+2.50)#7,275 |
| 13. | 61567 | 6.3% | 0.10%(+6.20)#13 | 4.2%(+2.10)#7,458 |
| 14. | 62376 | 6.0% | 0.10%(+5.90)#14 | 4.2%(+1.80)#7,588 |
| 15. | 61075 | 5.8% | 0.10%(+5.70)#15 | 4.2%(+1.60)#7,697 |
| 16. | 60917 | 5.4% | 0.10%(+5.30)#16 | 4.2%(+1.20)#7,928 |
| 17. | 60962 | 5.3% | 0.10%(+5.20)#17 | 4.2%(+1.10)#7,980 |
| 18. | 61047 | 5.1% | 0.10%(+5.00)#18 | 4.2%(+0.900)#8,091 |
| 19. | 61089 | 4.9% | 0.10%(+4.80)#19 | 4.2%(+0.700)#8,208 |
| 20. | 61030 | 4.8% | 0.10%(+4.70)#20 | 4.2%(+0.600)#8,253 |
| 21. | 60530 | 4.5% | 0.10%(+4.40)#21 | 4.2%(+0.300)#8,471 |
| 22. | 61279 | 4.4% | 0.10%(+4.30)#22 | 4.2%(+0.200)#8,539 |
| 23. | 62877 | 4.4% | 0.10%(+4.30)#23 | 4.2%(+0.200)#8,546 |
| 24. | 60930 | 4.3% | 0.10%(+4.20)#24 | 4.2%(+0.100)#8,609 |
| 25. | 61015 | 4.2% | 0.10%(+4.10)#25 | 4.2%(=0.000)#8,686 |
| 26. | 61001 | 3.9% | 0.10%(+3.80)#26 | 4.2%(-0.300)#8,894 |
| 27. | 61038 | 3.8% | 0.10%(+3.70)#27 | 4.2%(-0.400)#8,995 |
| 28. | 62907 | 3.6% | 0.10%(+3.50)#28 | 4.2%(-0.600)#9,158 |
| 29. | 60145 | 3.5% | 0.10%(+3.40)#29 | 4.2%(-0.700)#9,245 |
| 30. | 61060 | 3.5% | 0.10%(+3.40)#30 | 4.2%(-0.700)#9,262 |
| 31. | 62878 | 3.5% | 0.10%(+3.40)#31 | 4.2%(-0.700)#9,285 |
| 32. | 62860 | 3.3% | 0.10%(+3.20)#32 | 4.2%(-0.900)#9,467 |
| 33. | 62846 | 3.2% | 0.10%(+3.10)#33 | 4.2%(-1.00)#9,532 |
| 34. | 60551 | 3.1% | 0.10%(+3.00)#34 | 4.2%(-1.10)#9,596 |
| 35. | 61277 | 3.1% | 0.10%(+3.00)#35 | 4.2%(-1.10)#9,609 |
| 36. | 60913 | 3.1% | 0.10%(+3.00)#36 | 4.2%(-1.10)#9,633 |
| 37. | 61465 | 3.1% | 0.10%(+3.00)#37 | 4.2%(-1.10)#9,638 |
| 38. | 61917 | 3.1% | 0.10%(+3.00)#38 | 4.2%(-1.10)#9,650 |
| 39. | 61079 | 3.1% | 0.10%(+3.00)#39 | 4.2%(-1.10)#9,659 |
| 40. | 61526 | 3.0% | 0.10%(+2.90)#40 | 4.2%(-1.20)#9,734 |
| 41. | 61937 | 2.9% | 0.10%(+2.80)#41 | 4.2%(-1.30)#9,832 |
| 42. | 62217 | 2.9% | 0.10%(+2.80)#42 | 4.2%(-1.30)#9,853 |
| 43. | 60968 | 2.9% | 0.10%(+2.80)#43 | 4.2%(-1.30)#9,860 |
| 44. | 62668 | 2.8% | 0.10%(+2.70)#44 | 4.2%(-1.40)#9,937 |
| 45. | 62028 | 2.8% | 0.10%(+2.70)#45 | 4.2%(-1.40)#9,940 |
| 46. | 62943 | 2.8% | 0.10%(+2.70)#46 | 4.2%(-1.40)#9,965 |
| 47. | 62671 | 2.7% | 0.10%(+2.60)#47 | 4.2%(-1.50)#10,072 |
| 48. | 61312 | 2.7% | 0.10%(+2.60)#48 | 4.2%(-1.50)#10,078 |
| 49. | 62815 | 2.7% | 0.10%(+2.60)#49 | 4.2%(-1.50)#10,081 |
| 50. | 62691 | 2.5% | 0.10%(+2.40)#50 | 4.2%(-1.70)#10,264 |
| 51. | 62264 | 2.3% | 0.10%(+2.20)#51 | 4.2%(-1.90)#10,510 |
| 52. | 61442 | 2.3% | 0.10%(+2.20)#52 | 4.2%(-1.90)#10,557 |
| 53. | 61334 | 2.3% | 0.10%(+2.20)#53 | 4.2%(-1.90)#10,563 |
| 54. | 60973 | 2.3% | 0.10%(+2.20)#54 | 4.2%(-1.90)#10,570 |
| 55. | 60927 | 2.2% | 0.10%(+2.10)#55 | 4.2%(-2.00)#10,665 |
| 56. | 62445 | 2.2% | 0.10%(+2.10)#56 | 4.2%(-2.00)#10,690 |
| 57. | 61453 | 2.2% | 0.10%(+2.10)#57 | 4.2%(-2.00)#10,704 |
| 58. | 61730 | 2.2% | 0.10%(+2.10)#58 | 4.2%(-2.00)#10,718 |
| 59. | 62032 | 2.1% | 0.10%(+2.00)#59 | 4.2%(-2.10)#10,850 |
| 60. | 61067 | 2.1% | 0.10%(+2.00)#60 | 4.2%(-2.10)#10,855 |
| 61. | 62627 | 2.0% | 0.10%(+1.90)#61 | 4.2%(-2.20)#10,976 |
| 62. | 61074 | 1.9% | 0.10%(+1.80)#62 | 4.2%(-2.30)#11,094 |
| 63. | 61054 | 1.9% | 0.10%(+1.80)#63 | 4.2%(-2.30)#11,095 |
| 64. | 62324 | 1.9% | 0.10%(+1.80)#64 | 4.2%(-2.30)#11,143 |
| 65. | 61436 | 1.9% | 0.10%(+1.80)#65 | 4.2%(-2.30)#11,162 |
| 66. | 60112 | 1.8% | 0.10%(+1.70)#66 | 4.2%(-2.40)#11,263 |
| 67. | 60938 | 1.8% | 0.10%(+1.70)#67 | 4.2%(-2.40)#11,295 |
| 68. | 62560 | 1.8% | 0.10%(+1.70)#68 | 4.2%(-2.40)#11,309 |
| 69. | 61473 | 1.8% | 0.10%(+1.70)#69 | 4.2%(-2.40)#11,311 |
| 70. | 62273 | 1.8% | 0.10%(+1.70)#70 | 4.2%(-2.40)#11,332 |
| 71. | 62263 | 1.7% | 0.10%(+1.60)#71 | 4.2%(-2.50)#11,409 |
| 72. | 62822 | 1.7% | 0.10%(+1.60)#72 | 4.2%(-2.50)#11,435 |
| 73. | 61486 | 1.7% | 0.10%(+1.60)#73 | 4.2%(-2.50)#11,456 |
| 74. | 62201 | 1.6% | 0.10%(+1.50)#74 | 4.2%(-2.60)#11,566 |
| 75. | 61911 | 1.6% | 0.10%(+1.50)#75 | 4.2%(-2.60)#11,572 |
| 76. | 60518 | 1.6% | 0.10%(+1.50)#76 | 4.2%(-2.60)#11,584 |
| 77. | 60922 | 1.6% | 0.10%(+1.50)#77 | 4.2%(-2.60)#11,597 |
| 78. | 61087 | 1.6% | 0.10%(+1.50)#78 | 4.2%(-2.60)#11,623 |
| 79. | 60553 | 1.6% | 0.10%(+1.50)#79 | 4.2%(-2.60)#11,659 |
| 80. | 62672 | 1.6% | 0.10%(+1.50)#80 | 4.2%(-2.60)#11,681 |
| 81. | 60957 | 1.5% | 0.10%(+1.40)#81 | 4.2%(-2.70)#11,762 |
| 82. | 62694 | 1.5% | 0.10%(+1.40)#82 | 4.2%(-2.70)#11,783 |
| 83. | 62242 | 1.5% | 0.10%(+1.40)#83 | 4.2%(-2.70)#11,809 |
| 84. | 61041 | 1.5% | 0.10%(+1.40)#84 | 4.2%(-2.70)#11,812 |
| 85. | 62367 | 1.5% | 0.10%(+1.40)#85 | 4.2%(-2.70)#11,815 |
| 86. | 62803 | 1.5% | 0.10%(+1.40)#86 | 4.2%(-2.70)#11,821 |
| 87. | 62634 | 1.5% | 0.10%(+1.40)#87 | 4.2%(-2.70)#11,828 |
| 88. | 61059 | 1.5% | 0.10%(+1.40)#88 | 4.2%(-2.70)#11,841 |
| 89. | 60940 | 1.4% | 0.10%(+1.30)#89 | 4.2%(-2.80)#11,969 |
| 90. | 61438 | 1.4% | 0.10%(+1.30)#90 | 4.2%(-2.80)#12,024 |
| 91. | 61049 | 1.4% | 0.10%(+1.30)#91 | 4.2%(-2.80)#12,027 |
| 92. | 61851 | 1.4% | 0.10%(+1.30)#92 | 4.2%(-2.80)#12,041 |
| 93. | 62203 | 1.3% | 0.10%(+1.20)#93 | 4.2%(-2.90)#12,127 |
| 94. | 61231 | 1.3% | 0.10%(+1.20)#94 | 4.2%(-2.90)#12,138 |
| 95. | 61084 | 1.3% | 0.10%(+1.20)#95 | 4.2%(-2.90)#12,159 |
| 96. | 62067 | 1.3% | 0.10%(+1.20)#96 | 4.2%(-2.90)#12,191 |
| 97. | 61412 | 1.3% | 0.10%(+1.20)#97 | 4.2%(-2.90)#12,219 |
| 98. | 62853 | 1.3% | 0.10%(+1.20)#98 | 4.2%(-2.90)#12,222 |
| 99. | 61345 | 1.3% | 0.10%(+1.20)#99 | 4.2%(-2.90)#12,233 |
| 100. | 61816 | 1.3% | 0.10%(+1.20)#100 | 4.2%(-2.90)#12,238 |
Common Questions
What are the Top 10 Zip Codes with the Highest Percentage of Households Heated by Fuel Oil / Kerosene in Illinois?
Top 10 Zip Codes with the Highest Percentage of Households Heated by Fuel Oil / Kerosene in Illinois are:
What zip code has the Highest Percentage of Households Heated by Fuel Oil / Kerosene in Illinois?
62346 has the Highest Percentage of Households Heated by Fuel Oil / Kerosene in Illinois with 16.7%.
What is the Percentage of Households Heated by Fuel Oil / Kerosene in the State of Illinois?
Percentage of Households Heated by Fuel Oil / Kerosene in Illinois is 0.10%.
What is the Percentage of Households Heated by Fuel Oil / Kerosene in the United States?
Percentage of Households Heated by Fuel Oil / Kerosene in the United States is 4.2%.