Zip Codes with the Highest Percentage of Population Employed in Health Care & Social Assistance in Plainfield, IL
RELATED REPORTS & OPTIONS
Health Care & Social Assistance
Plainfield
Compare Zip Codes
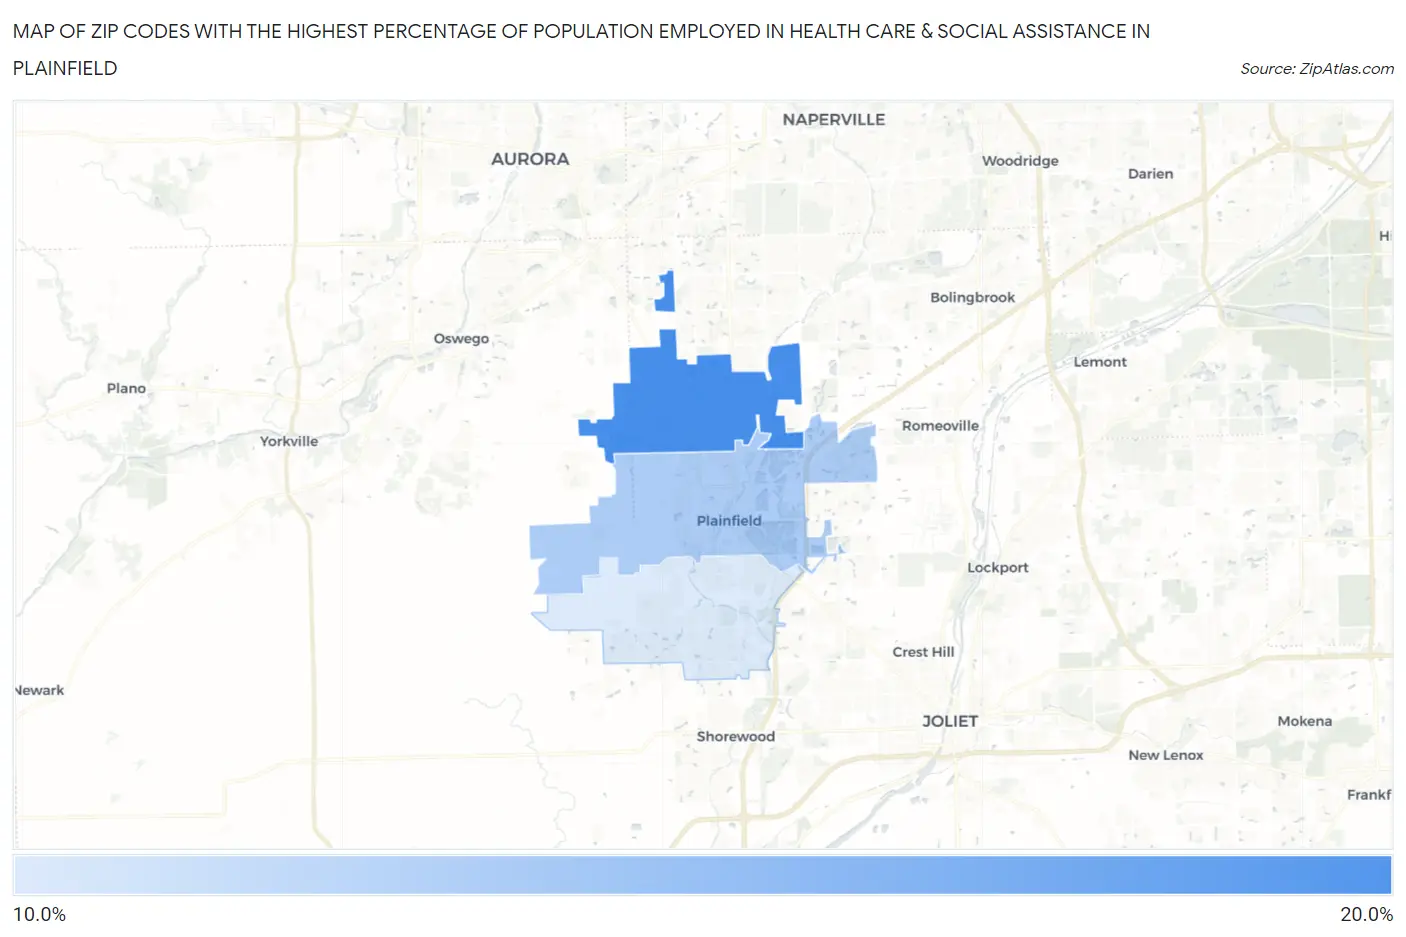
Map of Zip Codes with the Highest Percentage of Population Employed in Health Care & Social Assistance in Plainfield
13.8%
15.2%
Zip Codes with the Highest Percentage of Population Employed in Health Care & Social Assistance in Plainfield, IL
| Zip Code | % Employed | vs State | vs National | |
| 1. | 60585 | 15.2% | 13.8%(+1.39)#523 | 13.9%(+1.22)#11,287 |
| 2. | 60544 | 14.2% | 13.8%(+0.446)#619 | 13.9%(+0.276)#13,546 |
| 3. | 60586 | 13.8% | 13.8%(-0.001)#670 | 13.9%(-0.171)#14,651 |
1
Common Questions
What are the Top Zip Codes with the Highest Percentage of Population Employed in Health Care & Social Assistance in Plainfield, IL?
Top Zip Codes with the Highest Percentage of Population Employed in Health Care & Social Assistance in Plainfield, IL are:
What zip code has the Highest Percentage of Population Employed in Health Care & Social Assistance in Plainfield, IL?
60585 has the Highest Percentage of Population Employed in Health Care & Social Assistance in Plainfield, IL with 15.2%.
What is the Percentage of Population Employed in Health Care & Social Assistance in Plainfield, IL?
Percentage of Population Employed in Health Care & Social Assistance in Plainfield is 14.5%.
What is the Percentage of Population Employed in Health Care & Social Assistance in Illinois?
Percentage of Population Employed in Health Care & Social Assistance in Illinois is 13.8%.
What is the Percentage of Population Employed in Health Care & Social Assistance in the United States?
Percentage of Population Employed in Health Care & Social Assistance in the United States is 13.9%.