Zip Codes with the Highest Percentage of Population with a Degree in Visual and Performing Arts in Plainfield, IL
RELATED REPORTS & OPTIONS
Visual and Performing Arts
Plainfield
Compare Zip Codes
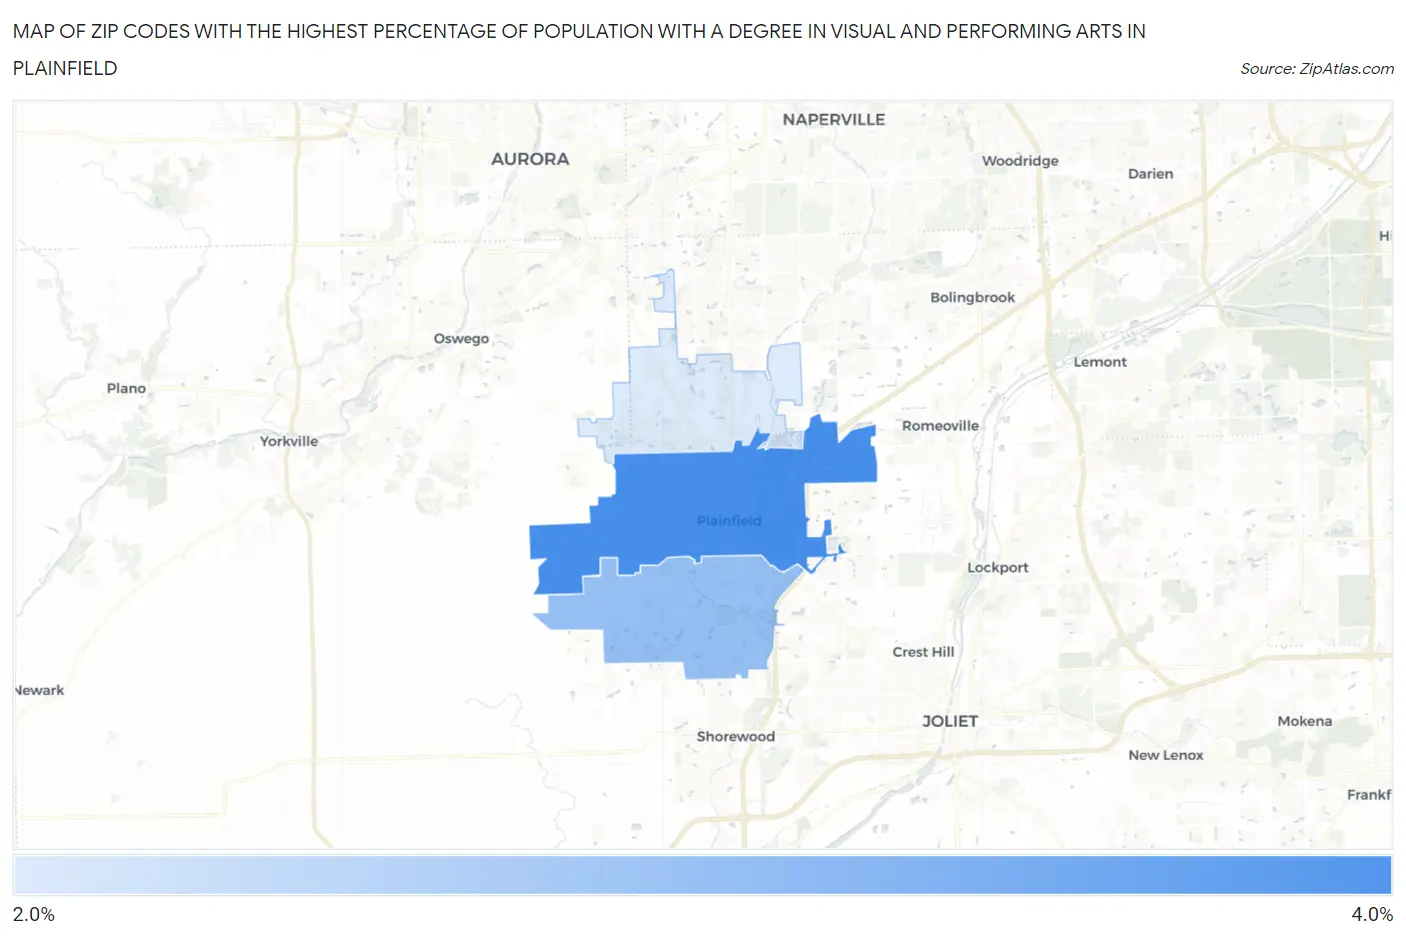
Map of Zip Codes with the Highest Percentage of Population with a Degree in Visual and Performing Arts in Plainfield
2.1%
3.2%
Zip Codes with the Highest Percentage of Population with a Degree in Visual and Performing Arts in Plainfield, IL
| Zip Code | % Graduates | vs State | vs National | |
| 1. | 60544 | 3.2% | 4.4%(-1.25)#483 | 4.3%(-1.05)#11,974 |
| 2. | 60586 | 2.6% | 4.4%(-1.84)#579 | 4.3%(-1.64)#14,221 |
| 3. | 60585 | 2.1% | 4.4%(-2.37)#658 | 4.3%(-2.18)#16,156 |
1
Common Questions
What are the Top Zip Codes with the Highest Percentage of Population with a Degree in Visual and Performing Arts in Plainfield, IL?
Top Zip Codes with the Highest Percentage of Population with a Degree in Visual and Performing Arts in Plainfield, IL are:
What zip code has the Highest Percentage of Population with a Degree in Visual and Performing Arts in Plainfield, IL?
60544 has the Highest Percentage of Population with a Degree in Visual and Performing Arts in Plainfield, IL with 3.2%.
What is the Percentage of Population with a Degree in Visual and Performing Arts in Plainfield, IL?
Percentage of Population with a Degree in Visual and Performing Arts in Plainfield is 2.5%.
What is the Percentage of Population with a Degree in Visual and Performing Arts in Illinois?
Percentage of Population with a Degree in Visual and Performing Arts in Illinois is 4.4%.
What is the Percentage of Population with a Degree in Visual and Performing Arts in the United States?
Percentage of Population with a Degree in Visual and Performing Arts in the United States is 4.3%.