Zip Codes with the Highest Percentage of Population Employed in Architecture & Engineering in Plainfield, IL
RELATED REPORTS & OPTIONS
Architecture & Engineering
Plainfield
Compare Zip Codes
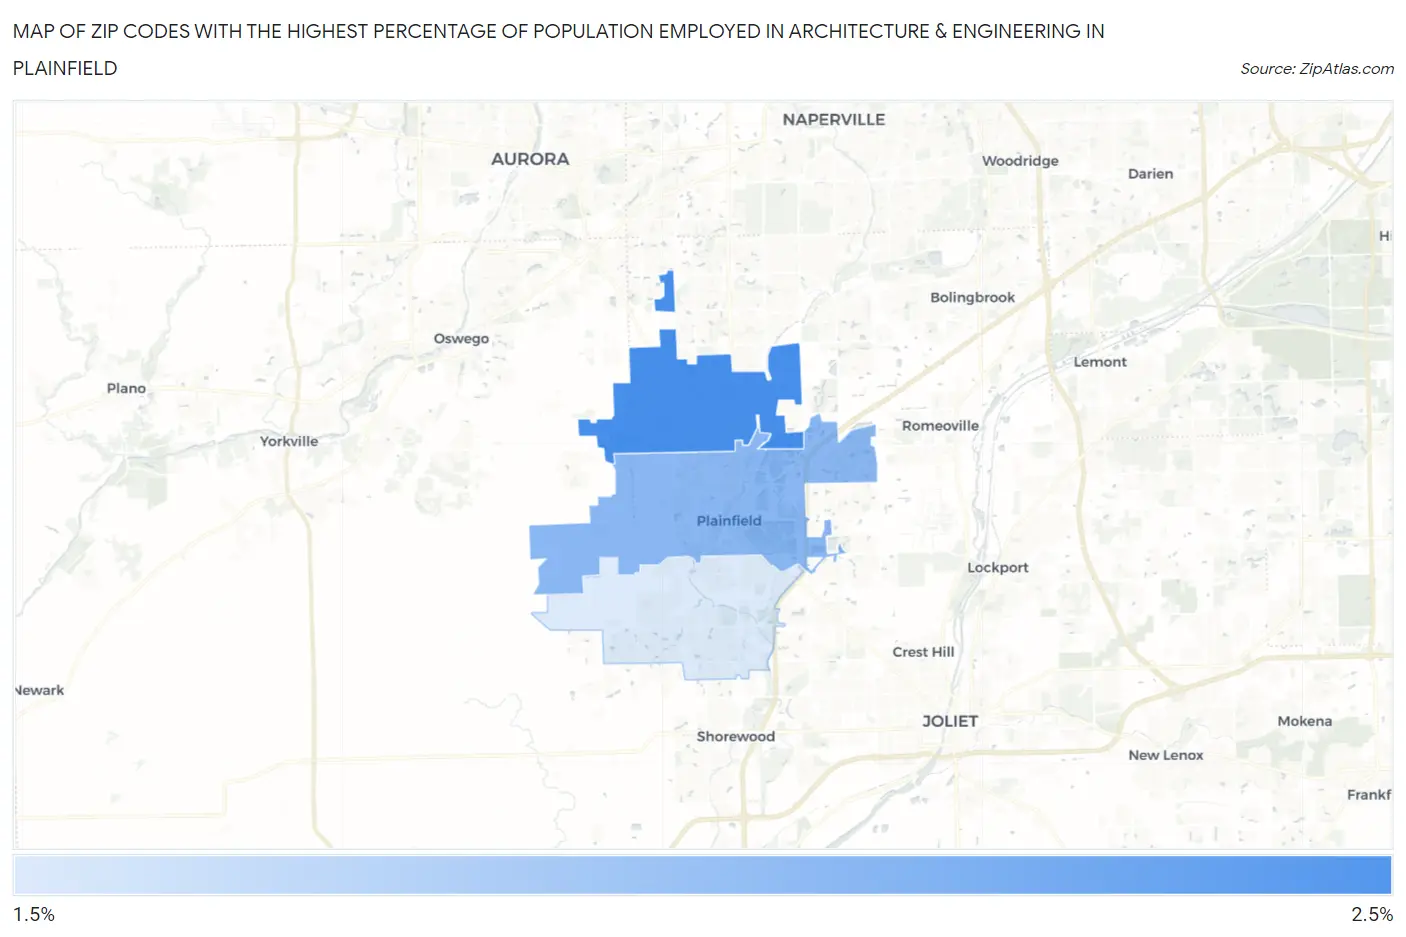
Map of Zip Codes with the Highest Percentage of Population Employed in Architecture & Engineering in Plainfield
2.1%
2.2%
Zip Codes with the Highest Percentage of Population Employed in Architecture & Engineering in Plainfield, IL
| Zip Code | % Employed | vs State | vs National | |
| 1. | 60585 | 2.2% | 1.9%(+0.331)#323 | 2.1%(+0.077)#8,338 |
| 2. | 60544 | 2.2% | 1.9%(+0.286)#336 | 2.1%(+0.031)#8,602 |
| 3. | 60586 | 2.1% | 1.9%(+0.230)#355 | 2.1%(-0.025)#8,895 |
1
Common Questions
What are the Top Zip Codes with the Highest Percentage of Population Employed in Architecture & Engineering in Plainfield, IL?
Top Zip Codes with the Highest Percentage of Population Employed in Architecture & Engineering in Plainfield, IL are:
What zip code has the Highest Percentage of Population Employed in Architecture & Engineering in Plainfield, IL?
60585 has the Highest Percentage of Population Employed in Architecture & Engineering in Plainfield, IL with 2.2%.
What is the Percentage of Population Employed in Architecture & Engineering in Plainfield, IL?
Percentage of Population Employed in Architecture & Engineering in Plainfield is 2.4%.
What is the Percentage of Population Employed in Architecture & Engineering in Illinois?
Percentage of Population Employed in Architecture & Engineering in Illinois is 1.9%.
What is the Percentage of Population Employed in Architecture & Engineering in the United States?
Percentage of Population Employed in Architecture & Engineering in the United States is 2.1%.