Zip Codes with the Highest Percentage of Population with a Degree in Science and Engineering in Plainfield, IL
RELATED REPORTS & OPTIONS
Science and Engineering
Plainfield
Compare Zip Codes
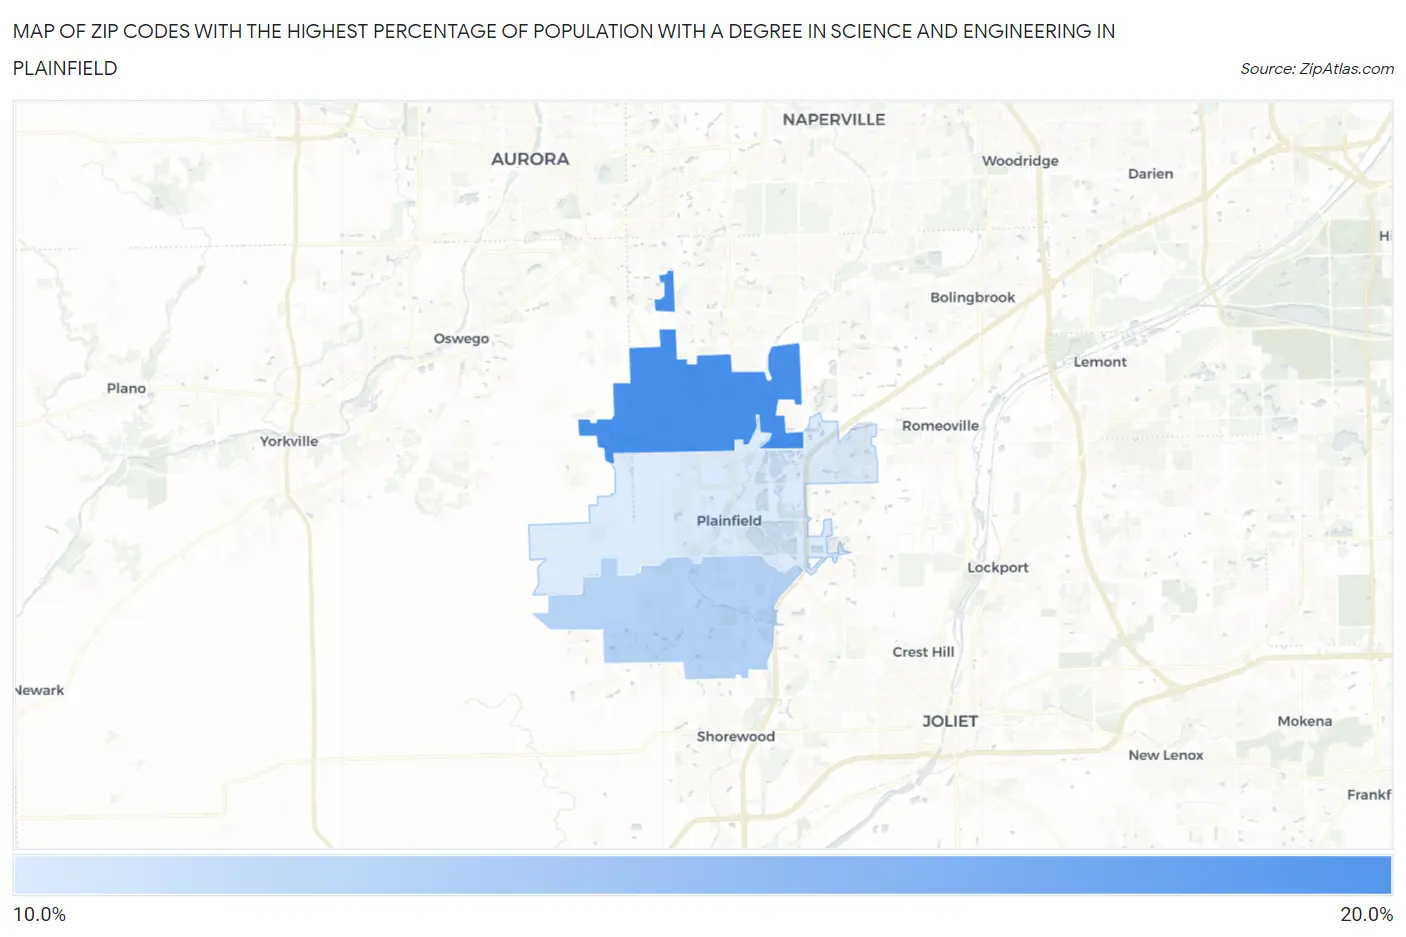
Map of Zip Codes with the Highest Percentage of Population with a Degree in Science and Engineering in Plainfield
11.1%
16.7%
Zip Codes with the Highest Percentage of Population with a Degree in Science and Engineering in Plainfield, IL
| Zip Code | % Graduates | vs State | vs National | |
| 1. | 60585 | 16.7% | 9.8%(+6.88)#279 | 9.8%(+6.94)#5,182 |
| 2. | 60586 | 12.6% | 9.8%(+2.71)#533 | 9.8%(+2.77)#9,933 |
| 3. | 60544 | 11.1% | 9.8%(+1.22)#655 | 9.8%(+1.28)#12,750 |
1
Common Questions
What are the Top Zip Codes with the Highest Percentage of Population with a Degree in Science and Engineering in Plainfield, IL?
Top Zip Codes with the Highest Percentage of Population with a Degree in Science and Engineering in Plainfield, IL are:
What zip code has the Highest Percentage of Population with a Degree in Science and Engineering in Plainfield, IL?
60585 has the Highest Percentage of Population with a Degree in Science and Engineering in Plainfield, IL with 16.7%.
What is the Percentage of Population with a Degree in Science and Engineering in Plainfield, IL?
Percentage of Population with a Degree in Science and Engineering in Plainfield is 13.6%.
What is the Percentage of Population with a Degree in Science and Engineering in Illinois?
Percentage of Population with a Degree in Science and Engineering in Illinois is 9.8%.
What is the Percentage of Population with a Degree in Science and Engineering in the United States?
Percentage of Population with a Degree in Science and Engineering in the United States is 9.8%.