Zip Codes with the Highest Percentage of Population Employed in Farming, Fishing & Forestry in Plainfield, IL
RELATED REPORTS & OPTIONS
Farming, Fishing & Forestry
Plainfield
Compare Zip Codes
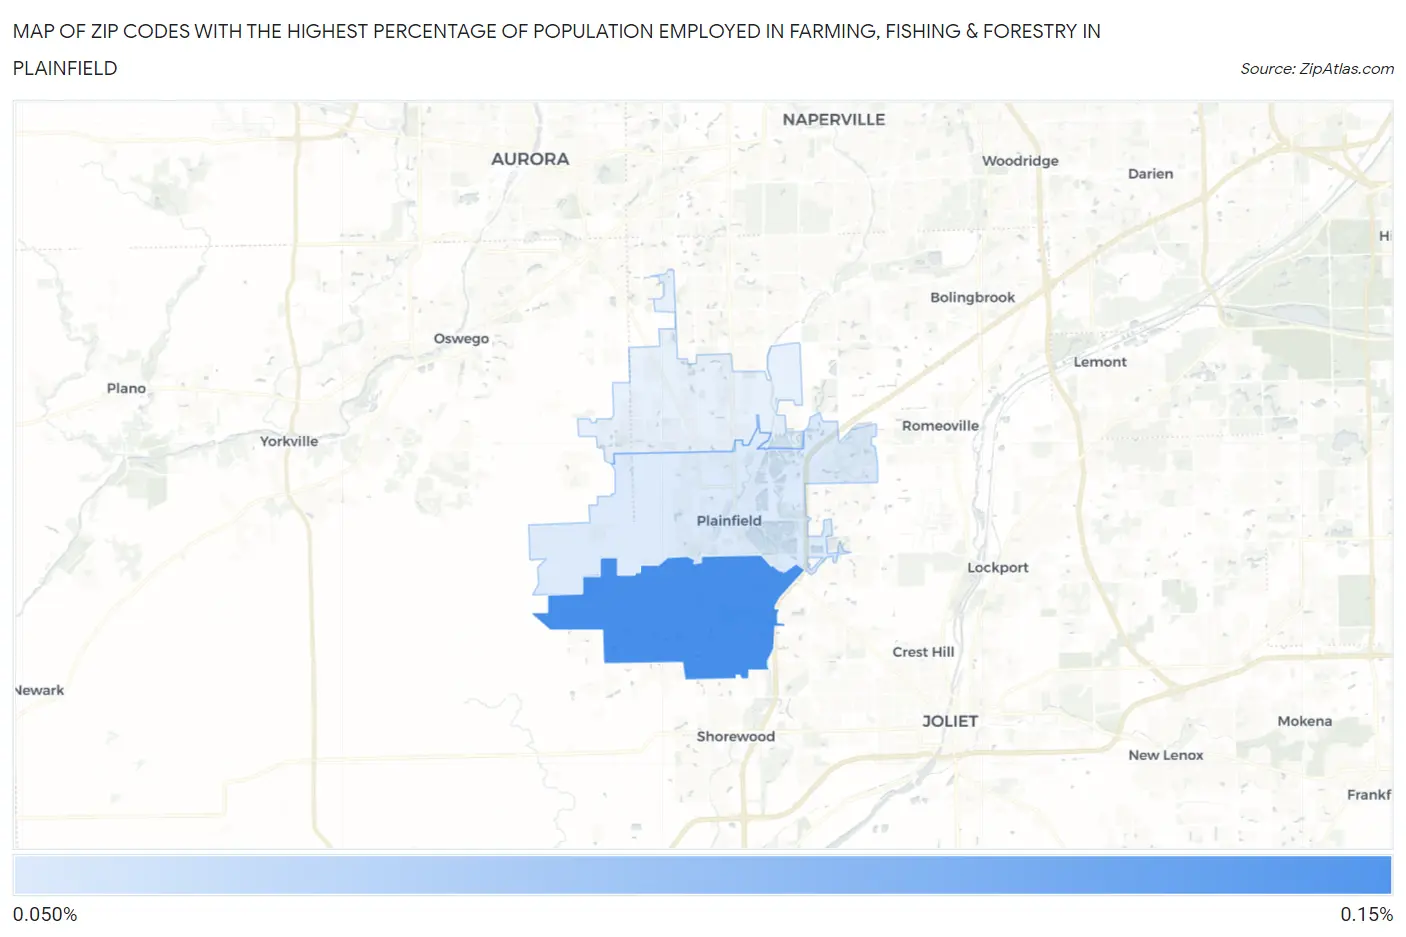
Map of Zip Codes with the Highest Percentage of Population Employed in Farming, Fishing & Forestry in Plainfield
0.088%
0.14%
Zip Codes with the Highest Percentage of Population Employed in Farming, Fishing & Forestry in Plainfield, IL
| Zip Code | % Employed | vs State | vs National | |
| 1. | 60586 | 0.14% | 0.31%(-0.173)#750 | 0.61%(-0.468)#17,152 |
| 2. | 60544 | 0.088% | 0.31%(-0.222)#782 | 0.61%(-0.517)#17,969 |
1
Common Questions
What are the Top Zip Codes with the Highest Percentage of Population Employed in Farming, Fishing & Forestry in Plainfield, IL?
Top Zip Codes with the Highest Percentage of Population Employed in Farming, Fishing & Forestry in Plainfield, IL are:
What zip code has the Highest Percentage of Population Employed in Farming, Fishing & Forestry in Plainfield, IL?
60586 has the Highest Percentage of Population Employed in Farming, Fishing & Forestry in Plainfield, IL with 0.14%.
What is the Percentage of Population Employed in Farming, Fishing & Forestry in Plainfield, IL?
Percentage of Population Employed in Farming, Fishing & Forestry in Plainfield is 0.051%.
What is the Percentage of Population Employed in Farming, Fishing & Forestry in Illinois?
Percentage of Population Employed in Farming, Fishing & Forestry in Illinois is 0.31%.
What is the Percentage of Population Employed in Farming, Fishing & Forestry in the United States?
Percentage of Population Employed in Farming, Fishing & Forestry in the United States is 0.61%.