Zip Codes with the Highest Percentage of Population Employed in Computer & Mathematics in Plainfield, IL
RELATED REPORTS & OPTIONS
Computer & Mathematics
Plainfield
Compare Zip Codes
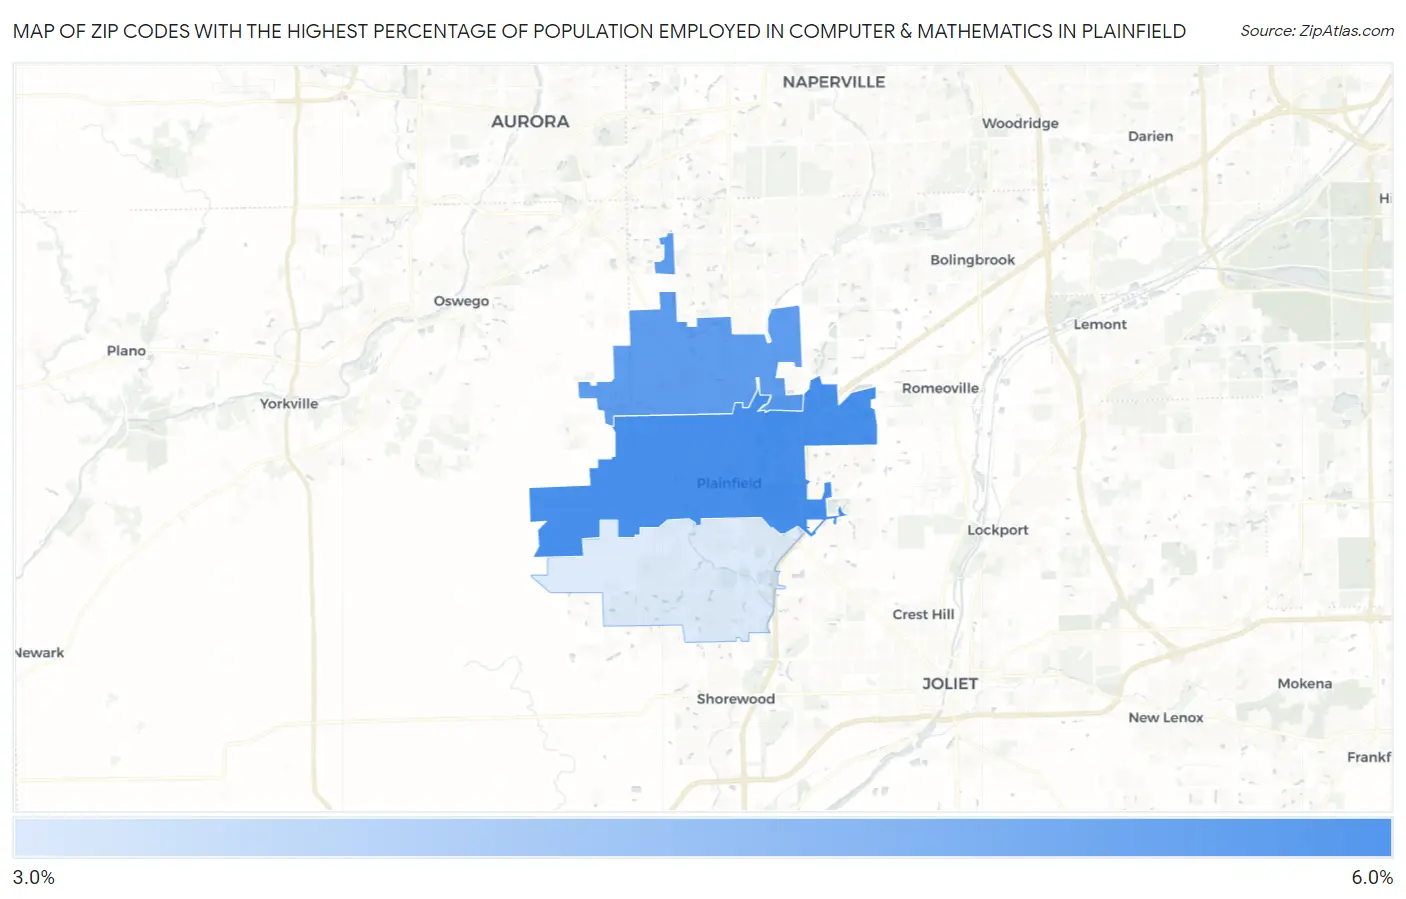
Map of Zip Codes with the Highest Percentage of Population Employed in Computer & Mathematics in Plainfield
3.1%
5.7%
Zip Codes with the Highest Percentage of Population Employed in Computer & Mathematics in Plainfield, IL
| Zip Code | % Employed | vs State | vs National | |
| 1. | 60544 | 5.7% | 3.6%(+2.17)#104 | 3.5%(+2.21)#2,551 |
| 2. | 60585 | 5.3% | 3.6%(+1.74)#125 | 3.5%(+1.78)#3,004 |
| 3. | 60586 | 3.1% | 3.6%(-0.500)#309 | 3.5%(-0.461)#7,517 |
1
Common Questions
What are the Top Zip Codes with the Highest Percentage of Population Employed in Computer & Mathematics in Plainfield, IL?
Top Zip Codes with the Highest Percentage of Population Employed in Computer & Mathematics in Plainfield, IL are:
What zip code has the Highest Percentage of Population Employed in Computer & Mathematics in Plainfield, IL?
60544 has the Highest Percentage of Population Employed in Computer & Mathematics in Plainfield, IL with 5.7%.
What is the Percentage of Population Employed in Computer & Mathematics in Plainfield, IL?
Percentage of Population Employed in Computer & Mathematics in Plainfield is 5.5%.
What is the Percentage of Population Employed in Computer & Mathematics in Illinois?
Percentage of Population Employed in Computer & Mathematics in Illinois is 3.6%.
What is the Percentage of Population Employed in Computer & Mathematics in the United States?
Percentage of Population Employed in Computer & Mathematics in the United States is 3.5%.