Zip Codes with the Highest Percentage of Population Employed in Security & Protection in Plainfield, IL
RELATED REPORTS & OPTIONS
Security & Protection
Plainfield
Compare Zip Codes
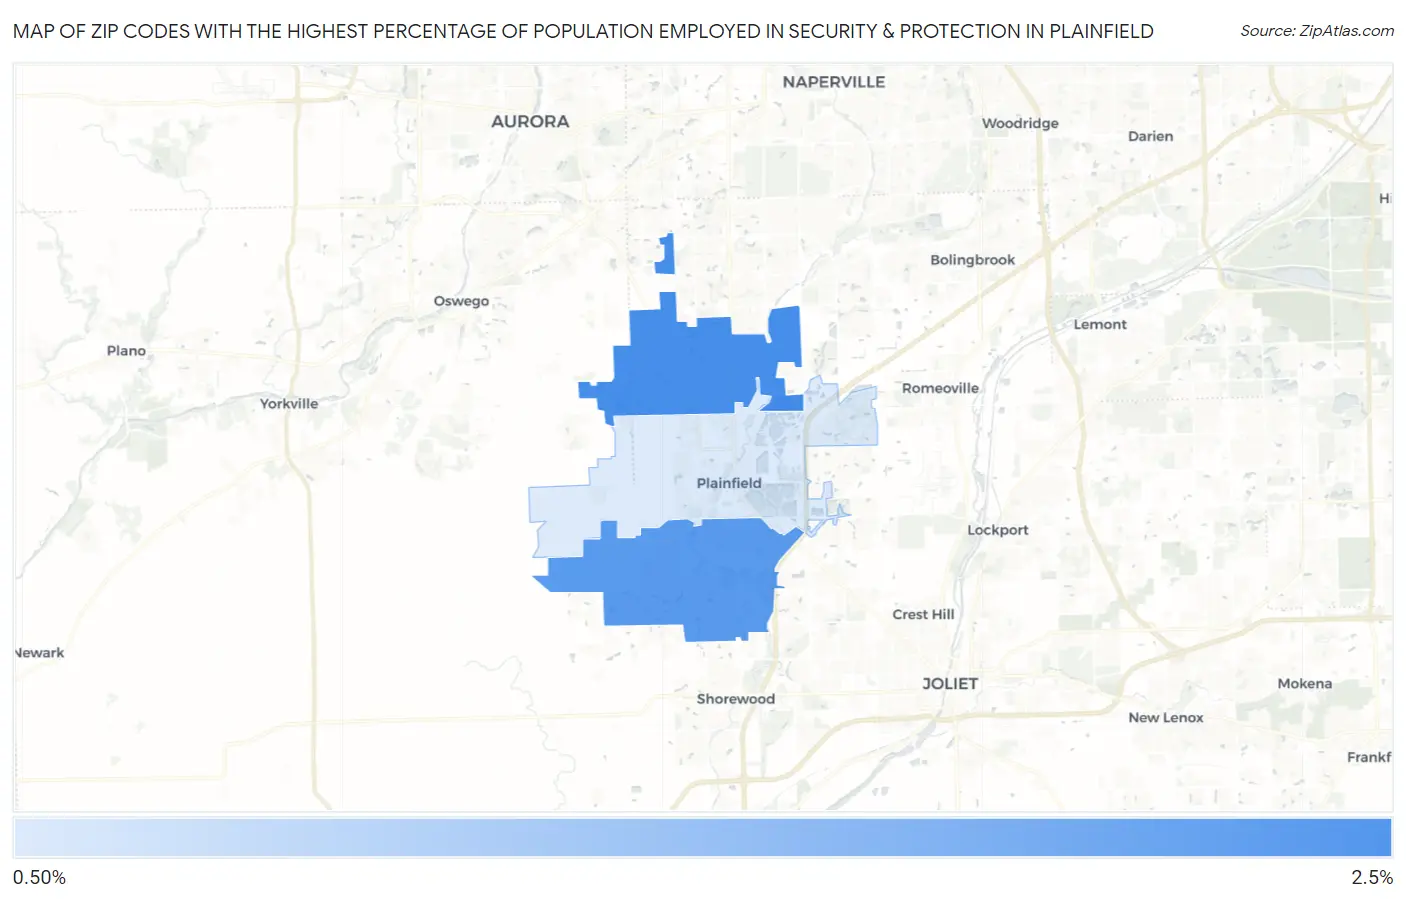
Map of Zip Codes with the Highest Percentage of Population Employed in Security & Protection in Plainfield
1.3%
2.4%
Zip Codes with the Highest Percentage of Population Employed in Security & Protection in Plainfield, IL
| Zip Code | % Employed | vs State | vs National | |
| 1. | 60585 | 2.4% | 2.2%(+0.184)#425 | 2.1%(+0.228)#10,188 |
| 2. | 60586 | 2.3% | 2.2%(+0.066)#467 | 2.1%(+0.110)#10,893 |
| 3. | 60544 | 1.3% | 2.2%(-0.914)#787 | 2.1%(-0.871)#17,924 |
1
Common Questions
What are the Top Zip Codes with the Highest Percentage of Population Employed in Security & Protection in Plainfield, IL?
Top Zip Codes with the Highest Percentage of Population Employed in Security & Protection in Plainfield, IL are:
What zip code has the Highest Percentage of Population Employed in Security & Protection in Plainfield, IL?
60585 has the Highest Percentage of Population Employed in Security & Protection in Plainfield, IL with 2.4%.
What is the Percentage of Population Employed in Security & Protection in Plainfield, IL?
Percentage of Population Employed in Security & Protection in Plainfield is 2.3%.
What is the Percentage of Population Employed in Security & Protection in Illinois?
Percentage of Population Employed in Security & Protection in Illinois is 2.2%.
What is the Percentage of Population Employed in Security & Protection in the United States?
Percentage of Population Employed in Security & Protection in the United States is 2.1%.