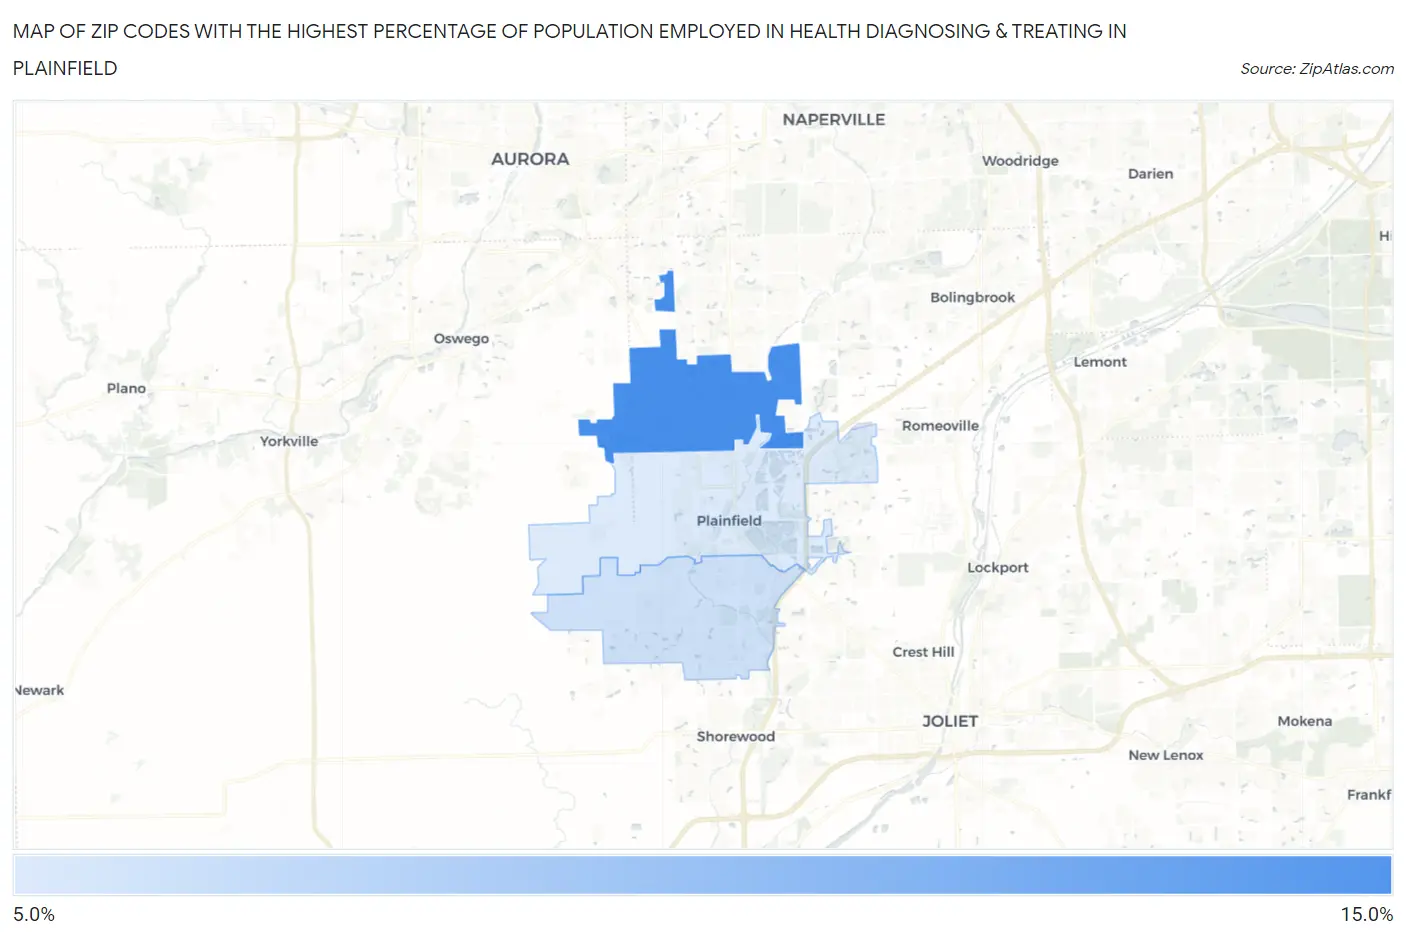
Zip Codes with the Highest Percentage of Population Employed in Health Diagnosing & Treating in Plainfield, IL
RELATED REPORTS & OPTIONS
Health Diagnosing & Treating
Plainfield
Compare Zip Codes
Map of Zip Codes with the Highest Percentage of Population Employed in Health Diagnosing & Treating in Plainfield
5.7%
10.3%
Zip Codes with the Highest Percentage of Population Employed in Health Diagnosing & Treating in Plainfield, IL
| Zip Code | % Employed | vs State | vs National | |
| 1. | 60585 | 10.3% | 6.2%(+4.11)#167 | 6.2%(+4.10)#3,467 |
| 2. | 60586 | 6.1% | 6.2%(-0.130)#629 | 6.2%(-0.138)#13,506 |
| 3. | 60544 | 5.7% | 6.2%(-0.570)#704 | 6.2%(-0.578)#15,114 |
1
Common Questions
What are the Top Zip Codes with the Highest Percentage of Population Employed in Health Diagnosing & Treating in Plainfield, IL?
Top Zip Codes with the Highest Percentage of Population Employed in Health Diagnosing & Treating in Plainfield, IL are:
What zip code has the Highest Percentage of Population Employed in Health Diagnosing & Treating in Plainfield, IL?
60585 has the Highest Percentage of Population Employed in Health Diagnosing & Treating in Plainfield, IL with 10.3%.
What is the Percentage of Population Employed in Health Diagnosing & Treating in Plainfield, IL?
Percentage of Population Employed in Health Diagnosing & Treating in Plainfield is 8.7%.
What is the Percentage of Population Employed in Health Diagnosing & Treating in Illinois?
Percentage of Population Employed in Health Diagnosing & Treating in Illinois is 6.2%.
What is the Percentage of Population Employed in Health Diagnosing & Treating in the United States?
Percentage of Population Employed in Health Diagnosing & Treating in the United States is 6.2%.