Zip Codes with the Highest Percentage of Population Employed in Transportation & Warehousing in Florida
RELATED REPORTS & OPTIONS
Transportation & Warehousing
Florida
Compare Zip Codes
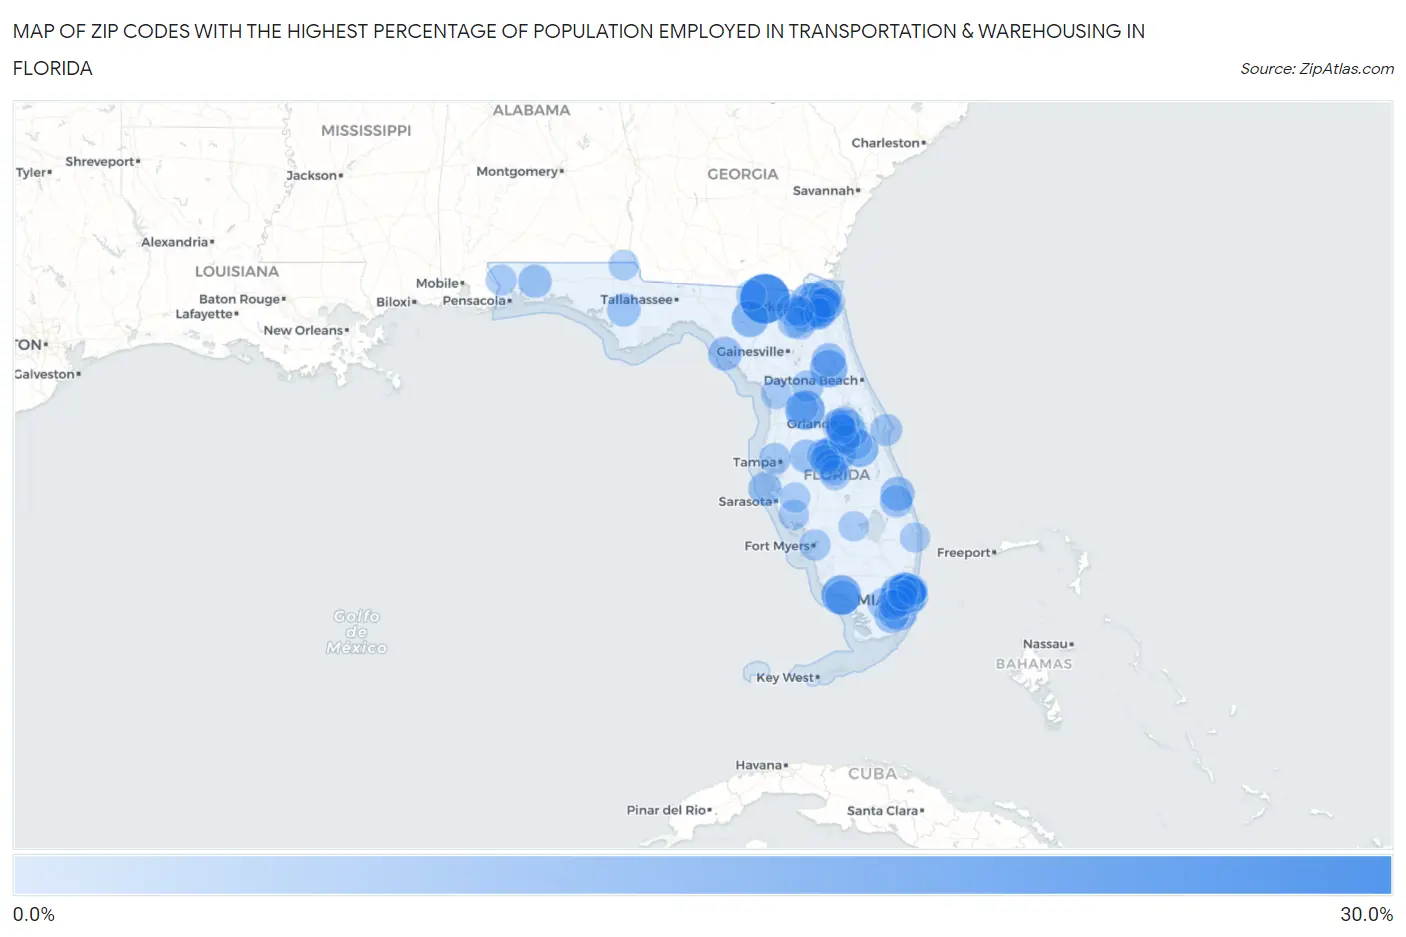
Map of Zip Codes with the Highest Percentage of Population Employed in Transportation & Warehousing in Florida
0.0%
30.0%
Zip Codes with the Highest Percentage of Population Employed in Transportation & Warehousing in Florida
| Zip Code | % Employed | vs State | vs National | |
| 1. | 32096 | 26.4% | 5.4%(+21.0)#1 | 4.9%(+21.4)#301 |
| 2. | 34139 | 17.1% | 5.4%(+11.7)#2 | 4.9%(+12.2)#765 |
| 3. | 33585 | 16.9% | 5.4%(+11.5)#3 | 4.9%(+12.0)#779 |
| 4. | 32139 | 14.9% | 5.4%(+9.51)#4 | 4.9%(+9.95)#1,087 |
| 5. | 32009 | 14.6% | 5.4%(+9.20)#5 | 4.9%(+9.64)#1,147 |
| 6. | 32062 | 14.4% | 5.4%(+8.98)#6 | 4.9%(+9.41)#1,190 |
| 7. | 34759 | 14.3% | 5.4%(+8.89)#7 | 4.9%(+9.32)#1,224 |
| 8. | 32234 | 14.2% | 5.4%(+8.86)#8 | 4.9%(+9.30)#1,229 |
| 9. | 34773 | 14.2% | 5.4%(+8.84)#9 | 4.9%(+9.28)#1,234 |
| 10. | 32219 | 13.7% | 5.4%(+8.35)#10 | 4.9%(+8.79)#1,338 |
| 11. | 33147 | 13.4% | 5.4%(+8.02)#11 | 4.9%(+8.45)#1,423 |
| 12. | 33150 | 12.8% | 5.4%(+7.45)#12 | 4.9%(+7.89)#1,581 |
| 13. | 33182 | 12.8% | 5.4%(+7.42)#13 | 4.9%(+7.86)#1,591 |
| 14. | 32209 | 12.6% | 5.4%(+7.27)#14 | 4.9%(+7.70)#1,636 |
| 15. | 34138 | 12.6% | 5.4%(+7.18)#15 | 4.9%(+7.62)#1,659 |
| 16. | 33172 | 12.4% | 5.4%(+7.06)#16 | 4.9%(+7.50)#1,703 |
| 17. | 34947 | 12.1% | 5.4%(+6.68)#17 | 4.9%(+7.11)#1,834 |
| 18. | 32220 | 11.9% | 5.4%(+6.53)#18 | 4.9%(+6.97)#1,900 |
| 19. | 32181 | 11.9% | 5.4%(+6.47)#19 | 4.9%(+6.91)#1,918 |
| 20. | 33010 | 11.8% | 5.4%(+6.46)#20 | 4.9%(+6.89)#1,925 |
| 21. | 33190 | 11.8% | 5.4%(+6.44)#21 | 4.9%(+6.88)#1,936 |
| 22. | 32206 | 11.8% | 5.4%(+6.40)#22 | 4.9%(+6.83)#1,958 |
| 23. | 32359 | 11.7% | 5.4%(+6.37)#23 | 4.9%(+6.80)#1,978 |
| 24. | 33184 | 11.7% | 5.4%(+6.35)#24 | 4.9%(+6.79)#1,982 |
| 25. | 33167 | 11.7% | 5.4%(+6.30)#25 | 4.9%(+6.73)#1,997 |
| 26. | 33122 | 11.6% | 5.4%(+6.22)#26 | 4.9%(+6.66)#2,021 |
| 27. | 32254 | 11.6% | 5.4%(+6.18)#27 | 4.9%(+6.62)#2,046 |
| 28. | 34216 | 11.5% | 5.4%(+6.14)#28 | 4.9%(+6.58)#2,067 |
| 29. | 32822 | 11.5% | 5.4%(+6.12)#29 | 4.9%(+6.56)#2,074 |
| 30. | 33031 | 11.4% | 5.4%(+6.05)#30 | 4.9%(+6.49)#2,102 |
| 31. | 32564 | 11.4% | 5.4%(+6.05)#31 | 4.9%(+6.48)#2,105 |
| 32. | 32218 | 11.4% | 5.4%(+6.04)#32 | 4.9%(+6.48)#2,110 |
| 33. | 33815 | 11.3% | 5.4%(+5.95)#33 | 4.9%(+6.39)#2,157 |
| 34. | 33016 | 11.3% | 5.4%(+5.94)#34 | 4.9%(+6.37)#2,169 |
| 35. | 33169 | 11.3% | 5.4%(+5.91)#35 | 4.9%(+6.35)#2,180 |
| 36. | 32449 | 11.2% | 5.4%(+5.80)#36 | 4.9%(+6.23)#2,243 |
| 37. | 33166 | 11.1% | 5.4%(+5.74)#37 | 4.9%(+6.18)#2,260 |
| 38. | 33054 | 10.9% | 5.4%(+5.49)#38 | 4.9%(+5.92)#2,379 |
| 39. | 33126 | 10.7% | 5.4%(+5.34)#39 | 4.9%(+5.78)#2,465 |
| 40. | 33178 | 10.7% | 5.4%(+5.28)#40 | 4.9%(+5.72)#2,489 |
| 41. | 33014 | 10.6% | 5.4%(+5.23)#41 | 4.9%(+5.66)#2,524 |
| 42. | 34986 | 10.6% | 5.4%(+5.19)#42 | 4.9%(+5.62)#2,544 |
| 43. | 32222 | 10.4% | 5.4%(+5.03)#43 | 4.9%(+5.47)#2,633 |
| 44. | 33851 | 10.2% | 5.4%(+4.86)#44 | 4.9%(+5.30)#2,734 |
| 45. | 33018 | 10.2% | 5.4%(+4.79)#45 | 4.9%(+5.23)#2,776 |
| 46. | 33056 | 10.1% | 5.4%(+4.75)#46 | 4.9%(+5.18)#2,798 |
| 47. | 33194 | 10.1% | 5.4%(+4.73)#47 | 4.9%(+5.17)#2,812 |
| 48. | 32920 | 10.1% | 5.4%(+4.71)#48 | 4.9%(+5.14)#2,835 |
| 49. | 32210 | 10.1% | 5.4%(+4.70)#49 | 4.9%(+5.13)#2,839 |
| 50. | 34472 | 10.0% | 5.4%(+4.65)#50 | 4.9%(+5.08)#2,862 |
| 51. | 33168 | 10.0% | 5.4%(+4.64)#51 | 4.9%(+5.08)#2,869 |
| 52. | 32221 | 10.0% | 5.4%(+4.63)#52 | 4.9%(+5.07)#2,872 |
| 53. | 32040 | 10.0% | 5.4%(+4.61)#53 | 4.9%(+5.05)#2,899 |
| 54. | 33136 | 10.0% | 5.4%(+4.61)#54 | 4.9%(+5.05)#2,900 |
| 55. | 32058 | 9.8% | 5.4%(+4.46)#55 | 4.9%(+4.90)#2,990 |
| 56. | 33844 | 9.8% | 5.4%(+4.39)#56 | 4.9%(+4.82)#3,030 |
| 57. | 33144 | 9.7% | 5.4%(+4.36)#57 | 4.9%(+4.80)#3,047 |
| 58. | 34771 | 9.7% | 5.4%(+4.35)#58 | 4.9%(+4.79)#3,054 |
| 59. | 32083 | 9.7% | 5.4%(+4.29)#59 | 4.9%(+4.72)#3,100 |
| 60. | 33141 | 9.7% | 5.4%(+4.28)#60 | 4.9%(+4.72)#3,104 |
| 61. | 33634 | 9.6% | 5.4%(+4.27)#61 | 4.9%(+4.70)#3,120 |
| 62. | 33881 | 9.6% | 5.4%(+4.26)#62 | 4.9%(+4.69)#3,131 |
| 63. | 33161 | 9.5% | 5.4%(+4.13)#63 | 4.9%(+4.56)#3,227 |
| 64. | 33853 | 9.5% | 5.4%(+4.08)#64 | 4.9%(+4.52)#3,265 |
| 65. | 33015 | 9.4% | 5.4%(+4.03)#65 | 4.9%(+4.47)#3,308 |
| 66. | 34743 | 9.4% | 5.4%(+4.01)#66 | 4.9%(+4.44)#3,324 |
| 67. | 33175 | 9.4% | 5.4%(+4.01)#67 | 4.9%(+4.44)#3,325 |
| 68. | 33916 | 9.3% | 5.4%(+3.97)#68 | 4.9%(+4.40)#3,361 |
| 69. | 32811 | 9.3% | 5.4%(+3.96)#69 | 4.9%(+4.40)#3,363 |
| 70. | 33170 | 9.3% | 5.4%(+3.95)#70 | 4.9%(+4.39)#3,371 |
| 71. | 33521 | 9.3% | 5.4%(+3.91)#71 | 4.9%(+4.34)#3,409 |
| 72. | 33142 | 9.3% | 5.4%(+3.90)#72 | 4.9%(+4.33)#3,421 |
| 73. | 33181 | 9.2% | 5.4%(+3.86)#73 | 4.9%(+4.29)#3,446 |
| 74. | 32577 | 9.1% | 5.4%(+3.75)#74 | 4.9%(+4.19)#3,553 |
| 75. | 32244 | 9.1% | 5.4%(+3.74)#75 | 4.9%(+4.17)#3,571 |
| 76. | 33055 | 9.1% | 5.4%(+3.68)#76 | 4.9%(+4.11)#3,638 |
| 77. | 32208 | 9.0% | 5.4%(+3.61)#77 | 4.9%(+4.05)#3,713 |
| 78. | 33013 | 8.9% | 5.4%(+3.56)#78 | 4.9%(+3.99)#3,763 |
| 79. | 32063 | 8.9% | 5.4%(+3.52)#79 | 4.9%(+3.95)#3,804 |
| 80. | 34433 | 8.9% | 5.4%(+3.49)#80 | 4.9%(+3.93)#3,846 |
| 81. | 33025 | 8.9% | 5.4%(+3.49)#81 | 4.9%(+3.93)#3,850 |
| 82. | 32832 | 8.9% | 5.4%(+3.48)#82 | 4.9%(+3.91)#3,864 |
| 83. | 32805 | 8.9% | 5.4%(+3.47)#83 | 4.9%(+3.91)#3,870 |
| 84. | 33827 | 8.8% | 5.4%(+3.46)#84 | 4.9%(+3.90)#3,875 |
| 85. | 33843 | 8.8% | 5.4%(+3.42)#85 | 4.9%(+3.86)#3,924 |
| 86. | 33174 | 8.8% | 5.4%(+3.42)#86 | 4.9%(+3.85)#3,929 |
| 87. | 32839 | 8.8% | 5.4%(+3.40)#87 | 4.9%(+3.83)#3,953 |
| 88. | 33193 | 8.8% | 5.4%(+3.39)#88 | 4.9%(+3.83)#3,966 |
| 89. | 34291 | 8.7% | 5.4%(+3.34)#89 | 4.9%(+3.78)#4,016 |
| 90. | 34744 | 8.7% | 5.4%(+3.34)#90 | 4.9%(+3.77)#4,024 |
| 91. | 33884 | 8.7% | 5.4%(+3.33)#91 | 4.9%(+3.76)#4,037 |
| 92. | 32814 | 8.7% | 5.4%(+3.32)#92 | 4.9%(+3.75)#4,039 |
| 93. | 32052 | 8.7% | 5.4%(+3.31)#93 | 4.9%(+3.75)#4,056 |
| 94. | 32445 | 8.7% | 5.4%(+3.28)#94 | 4.9%(+3.72)#4,081 |
| 95. | 33471 | 8.7% | 5.4%(+3.28)#95 | 4.9%(+3.71)#4,091 |
| 96. | 34251 | 8.6% | 5.4%(+3.24)#96 | 4.9%(+3.67)#4,126 |
| 97. | 33160 | 8.6% | 5.4%(+3.20)#97 | 4.9%(+3.63)#4,181 |
| 98. | 33407 | 8.5% | 5.4%(+3.16)#98 | 4.9%(+3.60)#4,225 |
| 99. | 33012 | 8.5% | 5.4%(+3.16)#99 | 4.9%(+3.59)#4,231 |
| 100. | 32809 | 8.5% | 5.4%(+3.15)#100 | 4.9%(+3.59)#4,236 |
Common Questions
What are the Top 10 Zip Codes with the Highest Percentage of Population Employed in Transportation & Warehousing in Florida?
Top 10 Zip Codes with the Highest Percentage of Population Employed in Transportation & Warehousing in Florida are:
What zip code has the Highest Percentage of Population Employed in Transportation & Warehousing in Florida?
32096 has the Highest Percentage of Population Employed in Transportation & Warehousing in Florida with 26.4%.
What is the Percentage of Population Employed in Transportation & Warehousing in the State of Florida?
Percentage of Population Employed in Transportation & Warehousing in Florida is 5.4%.
What is the Percentage of Population Employed in Transportation & Warehousing in the United States?
Percentage of Population Employed in Transportation & Warehousing in the United States is 4.9%.