Zip Codes with the Highest Percentage of Families with Income Above $100,000 in Florida
RELATED REPORTS & OPTIONS
Family Income | $100k+
Florida
Compare Zip Codes
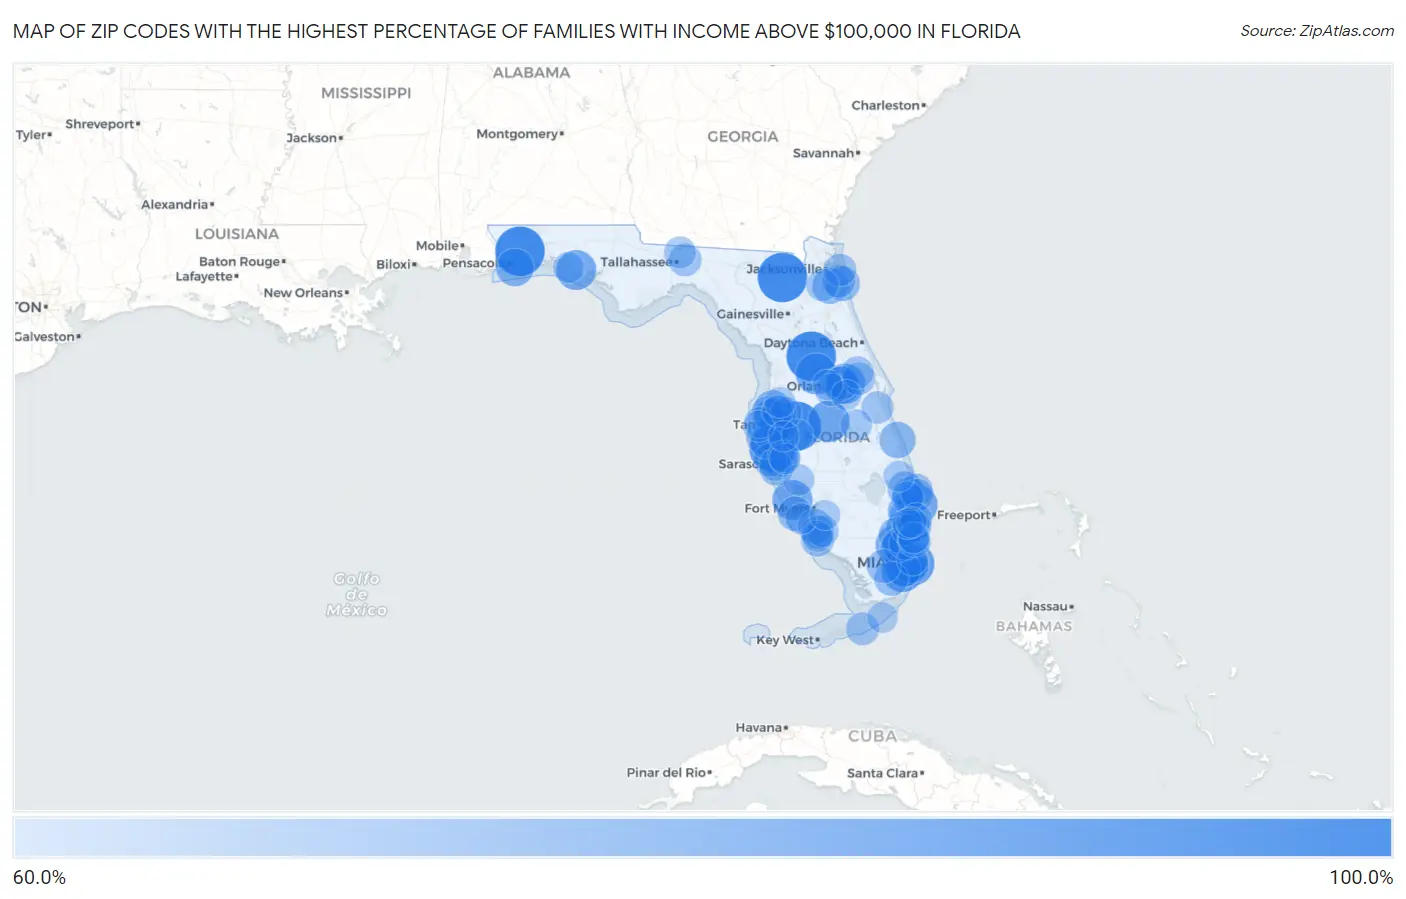
Map of Zip Codes with the Highest Percentage of Families with Income Above $100,000 in Florida
60.0%
100.0%
Zip Codes with the Highest Percentage of Families with Income Above $100,000 in Florida
| Zip Code | Families with Income > $100k | vs State | vs National | |
| 1. | 32133 | 100.0% | 39.6%(+60.4)#1 | 46.1%(+53.9)#22 |
| 2. | 32530 | 100.0% | 39.6%(+60.4)#2 | 46.1%(+53.9)#212 |
| 3. | 32072 | 100.0% | 39.6%(+60.4)#3 | 46.1%(+53.9)#215 |
| 4. | 33530 | 100.0% | 39.6%(+60.4)#4 | 46.1%(+53.9)#250 |
| 5. | 34250 | 93.3% | 39.6%(+53.7)#5 | 46.1%(+47.2)#309 |
| 6. | 33109 | 88.2% | 39.6%(+48.6)#6 | 46.1%(+42.1)#418 |
| 7. | 33158 | 84.2% | 39.6%(+44.6)#7 | 46.1%(+38.1)#651 |
| 8. | 33877 | 83.6% | 39.6%(+44.0)#8 | 46.1%(+37.5)#700 |
| 9. | 34797 | 82.7% | 39.6%(+43.1)#9 | 46.1%(+36.6)#759 |
| 10. | 33146 | 81.7% | 39.6%(+42.1)#10 | 46.1%(+35.6)#839 |
| 11. | 32814 | 81.5% | 39.6%(+41.9)#11 | 46.1%(+35.4)#863 |
| 12. | 33480 | 81.3% | 39.6%(+41.7)#12 | 46.1%(+35.2)#886 |
| 13. | 33921 | 81.1% | 39.6%(+41.5)#13 | 46.1%(+35.0)#910 |
| 14. | 32461 | 80.9% | 39.6%(+41.3)#14 | 46.1%(+34.8)#925 |
| 15. | 33332 | 78.8% | 39.6%(+39.2)#15 | 46.1%(+32.7)#1,163 |
| 16. | 32561 | 76.3% | 39.6%(+36.7)#16 | 46.1%(+30.2)#1,508 |
| 17. | 33473 | 76.2% | 39.6%(+36.6)#17 | 46.1%(+30.1)#1,531 |
| 18. | 33076 | 76.1% | 39.6%(+36.5)#18 | 46.1%(+30.0)#1,541 |
| 19. | 33131 | 75.5% | 39.6%(+35.9)#19 | 46.1%(+29.4)#1,619 |
| 20. | 33556 | 74.8% | 39.6%(+35.2)#20 | 46.1%(+28.7)#1,736 |
| 21. | 33449 | 74.3% | 39.6%(+34.7)#21 | 46.1%(+28.2)#1,824 |
| 22. | 33629 | 74.2% | 39.6%(+34.6)#22 | 46.1%(+28.1)#1,840 |
| 23. | 33301 | 74.0% | 39.6%(+34.4)#23 | 46.1%(+27.9)#1,881 |
| 24. | 32963 | 73.6% | 39.6%(+34.0)#24 | 46.1%(+27.5)#1,935 |
| 25. | 33606 | 73.3% | 39.6%(+33.7)#25 | 46.1%(+27.2)#1,981 |
| 26. | 34201 | 72.3% | 39.6%(+32.7)#26 | 46.1%(+26.2)#2,178 |
| 27. | 32259 | 71.8% | 39.6%(+32.2)#27 | 46.1%(+25.7)#2,251 |
| 28. | 33706 | 71.1% | 39.6%(+31.5)#28 | 46.1%(+25.0)#2,383 |
| 29. | 33330 | 71.1% | 39.6%(+31.5)#29 | 46.1%(+25.0)#2,386 |
| 30. | 33327 | 71.0% | 39.6%(+31.4)#30 | 46.1%(+24.9)#2,406 |
| 31. | 32082 | 70.8% | 39.6%(+31.2)#31 | 46.1%(+24.7)#2,438 |
| 32. | 33626 | 70.7% | 39.6%(+31.1)#32 | 46.1%(+24.6)#2,458 |
| 33. | 33029 | 70.6% | 39.6%(+31.0)#33 | 46.1%(+24.5)#2,476 |
| 34. | 33478 | 70.6% | 39.6%(+31.0)#34 | 46.1%(+24.5)#2,483 |
| 35. | 33149 | 70.5% | 39.6%(+30.9)#35 | 46.1%(+24.4)#2,512 |
| 36. | 32801 | 70.4% | 39.6%(+30.8)#36 | 46.1%(+24.3)#2,524 |
| 37. | 33548 | 70.4% | 39.6%(+30.8)#37 | 46.1%(+24.3)#2,526 |
| 38. | 32804 | 70.3% | 39.6%(+30.7)#38 | 46.1%(+24.2)#2,540 |
| 39. | 33924 | 70.0% | 39.6%(+30.4)#39 | 46.1%(+23.9)#2,605 |
| 40. | 33704 | 69.8% | 39.6%(+30.2)#40 | 46.1%(+23.7)#2,646 |
| 41. | 34134 | 69.8% | 39.6%(+30.2)#41 | 46.1%(+23.7)#2,647 |
| 42. | 33156 | 69.6% | 39.6%(+30.0)#42 | 46.1%(+23.5)#2,685 |
| 43. | 33331 | 69.2% | 39.6%(+29.6)#43 | 46.1%(+23.1)#2,773 |
| 44. | 33031 | 69.2% | 39.6%(+29.6)#44 | 46.1%(+23.1)#2,782 |
| 45. | 33194 | 68.9% | 39.6%(+29.3)#45 | 46.1%(+22.8)#2,843 |
| 46. | 33609 | 68.7% | 39.6%(+29.1)#46 | 46.1%(+22.6)#2,883 |
| 47. | 34242 | 68.1% | 39.6%(+28.5)#47 | 46.1%(+22.0)#2,998 |
| 48. | 33418 | 67.8% | 39.6%(+28.2)#48 | 46.1%(+21.7)#3,050 |
| 49. | 34228 | 67.6% | 39.6%(+28.0)#49 | 46.1%(+21.5)#3,125 |
| 50. | 32789 | 67.5% | 39.6%(+27.9)#50 | 46.1%(+21.4)#3,138 |
| 51. | 32081 | 67.1% | 39.6%(+27.5)#51 | 46.1%(+21.0)#3,223 |
| 52. | 34102 | 67.1% | 39.6%(+27.5)#52 | 46.1%(+21.0)#3,227 |
| 53. | 33051 | 66.9% | 39.6%(+27.3)#53 | 46.1%(+20.8)#3,275 |
| 54. | 34108 | 66.8% | 39.6%(+27.2)#54 | 46.1%(+20.7)#3,284 |
| 55. | 33477 | 66.8% | 39.6%(+27.2)#55 | 46.1%(+20.7)#3,287 |
| 56. | 33431 | 66.6% | 39.6%(+27.0)#56 | 46.1%(+20.5)#3,342 |
| 57. | 33715 | 66.6% | 39.6%(+27.0)#57 | 46.1%(+20.5)#3,347 |
| 58. | 32317 | 66.5% | 39.6%(+26.9)#58 | 46.1%(+20.4)#3,367 |
| 59. | 32266 | 66.3% | 39.6%(+26.7)#59 | 46.1%(+20.2)#3,422 |
| 60. | 34786 | 66.0% | 39.6%(+26.4)#60 | 46.1%(+19.9)#3,489 |
| 61. | 32766 | 66.0% | 39.6%(+26.4)#61 | 46.1%(+19.9)#3,498 |
| 62. | 34688 | 66.0% | 39.6%(+26.4)#62 | 46.1%(+19.9)#3,501 |
| 63. | 32940 | 65.9% | 39.6%(+26.3)#63 | 46.1%(+19.8)#3,512 |
| 64. | 32732 | 65.9% | 39.6%(+26.3)#64 | 46.1%(+19.8)#3,522 |
| 65. | 33408 | 65.8% | 39.6%(+26.2)#65 | 46.1%(+19.7)#3,538 |
| 66. | 32003 | 65.6% | 39.6%(+26.0)#66 | 46.1%(+19.5)#3,575 |
| 67. | 33412 | 65.4% | 39.6%(+25.8)#67 | 46.1%(+19.3)#3,634 |
| 68. | 34236 | 65.2% | 39.6%(+25.6)#68 | 46.1%(+19.1)#3,699 |
| 69. | 32312 | 65.1% | 39.6%(+25.5)#69 | 46.1%(+19.0)#3,718 |
| 70. | 33328 | 64.9% | 39.6%(+25.3)#70 | 46.1%(+18.8)#3,763 |
| 71. | 33432 | 64.9% | 39.6%(+25.3)#71 | 46.1%(+18.8)#3,767 |
| 72. | 34119 | 64.7% | 39.6%(+25.1)#72 | 46.1%(+18.6)#3,819 |
| 73. | 33486 | 64.6% | 39.6%(+25.0)#73 | 46.1%(+18.5)#3,851 |
| 74. | 34211 | 64.5% | 39.6%(+24.9)#74 | 46.1%(+18.4)#3,878 |
| 75. | 34739 | 64.0% | 39.6%(+24.4)#75 | 46.1%(+17.9)#4,016 |
| 76. | 33067 | 63.9% | 39.6%(+24.3)#76 | 46.1%(+17.8)#4,031 |
| 77. | 33547 | 63.8% | 39.6%(+24.2)#77 | 46.1%(+17.7)#4,063 |
| 78. | 33140 | 63.8% | 39.6%(+24.2)#78 | 46.1%(+17.7)#4,067 |
| 79. | 33483 | 63.8% | 39.6%(+24.2)#79 | 46.1%(+17.7)#4,071 |
| 80. | 33305 | 63.7% | 39.6%(+24.1)#80 | 46.1%(+17.6)#4,098 |
| 81. | 33316 | 63.7% | 39.6%(+24.1)#81 | 46.1%(+17.6)#4,099 |
| 82. | 33767 | 63.6% | 39.6%(+24.0)#82 | 46.1%(+17.5)#4,120 |
| 83. | 34289 | 63.5% | 39.6%(+23.9)#83 | 46.1%(+17.4)#4,148 |
| 84. | 33306 | 63.5% | 39.6%(+23.9)#84 | 46.1%(+17.4)#4,150 |
| 85. | 32459 | 63.3% | 39.6%(+23.7)#85 | 46.1%(+17.2)#4,191 |
| 86. | 34103 | 63.3% | 39.6%(+23.7)#86 | 46.1%(+17.2)#4,194 |
| 87. | 33786 | 63.3% | 39.6%(+23.7)#87 | 46.1%(+17.2)#4,207 |
| 88. | 34990 | 63.2% | 39.6%(+23.6)#88 | 46.1%(+17.1)#4,218 |
| 89. | 33647 | 62.9% | 39.6%(+23.3)#89 | 46.1%(+16.8)#4,296 |
| 90. | 33558 | 62.9% | 39.6%(+23.3)#90 | 46.1%(+16.8)#4,301 |
| 91. | 34202 | 62.9% | 39.6%(+23.3)#91 | 46.1%(+16.8)#4,302 |
| 92. | 34637 | 62.9% | 39.6%(+23.3)#92 | 46.1%(+16.8)#4,307 |
| 93. | 33957 | 62.9% | 39.6%(+23.3)#93 | 46.1%(+16.8)#4,311 |
| 94. | 33036 | 62.6% | 39.6%(+23.0)#94 | 46.1%(+16.5)#4,394 |
| 95. | 33572 | 62.2% | 39.6%(+22.6)#95 | 46.1%(+16.1)#4,492 |
| 96. | 34760 | 62.2% | 39.6%(+22.6)#96 | 46.1%(+16.1)#4,508 |
| 97. | 32827 | 62.0% | 39.6%(+22.4)#97 | 46.1%(+15.9)#4,553 |
| 98. | 33498 | 62.0% | 39.6%(+22.4)#98 | 46.1%(+15.9)#4,554 |
| 99. | 33496 | 61.9% | 39.6%(+22.3)#99 | 46.1%(+15.8)#4,577 |
| 100. | 33913 | 61.8% | 39.6%(+22.2)#100 | 46.1%(+15.7)#4,598 |
Common Questions
What are the Top 10 Zip Codes with the Highest Percentage of Families with Income Above $100,000 in Florida?
Top 10 Zip Codes with the Highest Percentage of Families with Income Above $100,000 in Florida are:
What zip code has the Highest Percentage of Families with Income Above $100,000 in Florida?
32133 has the Highest Percentage of Families with Income Above $100,000 in Florida with 100.0%.
What is the Percentage of Families with Income Above $100,000 in the State of Florida?
Percentage of Families with Income Above $100,000 in Florida is 39.6%.
What is the Percentage of Families with Income Above $100,000 in the United States?
Percentage of Families with Income Above $100,000 in the United States is 46.1%.